Review

Towards a Common Methodology and Modelling Tool for 100% Renewable Energy Analysis: A Review

Industrial Engineering Department, Durban University of Technology, Durban 4001, South Africa
*
Author to whom correspondence should be addressed.
Energies 2023, 16(18), 6598; https://doi.org/10.3390/en16186598
Submission received: 15 August 2023 / Revised: 4 September 2023 / Accepted: 11 September 2023 / Published: 13 September 2023
(This article belongs to the Section B: Energy and Environment)

Abstract

:
Some advanced countries’ rapid population, economic growth, and energy consumption expansion contribute significantly to global CO2 emissions. And while developed countries have achieved 100% universal access to electricity, mainly from non-renewable sources, many developing countries still lack it. This presents challenges and opportunities for achieving the United Nations’ Sustainable Development Goals (SDGs) 7 and 13 of generating all energy from cleaner or low-carbon sources to reduce CO2 emissions in all countries and combating climate change consequences. Renewable energies have been widely acknowledged to greatly advance this endeavour, resulting in many studies and about 30 countries already with over 70% of their national electricity mix from RE. It has birthed a new paradigm and an emerging field of 100% RE for all purposes, recently receiving much attention from academia and in public discourse. The major challenge with this idea is that achieving such a feat requires a more diverse approach. This study emphasises the need to meet technical and non-technical requirements for working towards a 100% RE for all purposes. Therefore, our work introduces six methodological or evaluation mechanisms (herein, identified as 100% RE evaluation metrics) suitable for existing and future 100% renewable energy analysis. It then reviews energy modelling tools to identify their applicability to 100% RE analysis. The review and perspectives presented in this study will be valuable in developing a common integrated methodology and modelling tool for analysing full renewable energy adoption in countries or regions with best trade-offs, using performance indices that have not been previously used. It will also help with proper national and regional energy resources and system planning for new energy projects and installations, contributing to sustainable development.

1. Introduction

In achieving sustainable development goals (SDGs), the rapid adoption of RE is imperative, having recently gained traction and having an increasingly significant impact on the global energy sector. Governments develop energy policies to regulate and direct energy production, transportation, and consumption inside their borders. By promoting sustainable and affordable energy sources, these regulations are intended to increase energy security and guarantee a consistent electricity supply. Energy resources, environmental issues, political objectives to promote high RE investments, and economic realities can significantly impact a nation’s or region’s energy strategy. The percentage of global electricity generated from renewable sources was projected to increase to 28% in 2022, from a 19% increase from 1990, which largely contributed to increased investment by at least a factor of three during the decade between 2000 and 2009 [1,2]. Continuous recurrent updates over time of energy policy need to account for societal and technological developments and the appearance of new threats and possibilities to meet regulatory practices and drive for achieving 100% clean and affordable energy at urban, national, regional, and global levels. Increases in energy efficiency and new energy policies have led to a rapid expansion of the renewable energy (RE) business, and because of the urgent need to address the issue of global warming and the sustainable development target [3], as most countries are expected to switch to renewable energy exclusively between 2030 and 2050 [4,5], with countries expected to contribute to climate change fight by supporting in the RE target through high involvement in energy transition to full renewables. A recent literature study by N. Heidari and J. M. Pearce in [6] concluded that a high value for liability mitigation would provide considerable incentives for the adoption of renewable energy technology when greenhouse gas (GHG) emitters began to be held liable for damages resulting from GHG emissions that caused climate change and to commit to financial obligations that could be set on them. Notably, the investments in renewable energy capacity worldwide (excluding large-scale hydropower) reached USD 2.7 trillion between 2010 and 2019, with the largest contributions coming from China (USD 818 billion), the United States (USD 392.3 billion), Japan (USD 210.9 billion), Germany (USD 183.4 billion), and the United Kingdom (USD 126.5 billion), but in juxtaposition to the expenditure of USD 143 billion allocated towards the construction of new nuclear, coal, gas, and fuel-oil power plants during the year 2016, an approximate sum of USD 297 billion was dedicated to the financing of renewable energy sources [1].
With the increasing commitment to replacing fossil fuels with renewable sources, there is a potential to replace conventional energy systems fully. Effective energy distribution across regions requires robust energy storage systems, flexible demand–response mechanisms, and resilience infrastructure. The transition necessitates significant upfront investments and can potentially disrupt industries and provide notable social, environmental, and economic benefits.
This article discusses the methods and evaluation approaches needed to reach 100% renewable energy (RE) systems. This study aims to create comprehensive literature on methods, metrics, and indices for research on 100% renewable energy (RE) systems that will be particularly valuable for researchers seeking to explore specific aspects of the literature and analysis methods in this emerging field. Currently, the literature on 100% RE systems is widely scattered and lacks a thorough collection of methods and evaluation approaches. This article aims to provide insights into the 100% renewable energy systems research field. It covers a comprehensive range of articles to gain further direction and develop open-ended questions into various aspects of the research field, enhancing the overall understanding of the best methods useful in this subject matter.
The research methodology adopted for the study discusses five methodological or evaluation mechanisms (herein, identified as 100% RE performance metrics) suitable for 100% renewable energy analysis based on an earlier explanation of the concept of 100% RE. It is followed by a review of existing energy modelling tools (EMT) under two criteria. The first criteria were to combine the existing modelling tools and place them under seven categories of the tool’s usage at local or individual, island, national, global, all-purpose, 100% RE studies, and transition analysis. The second criterion selects the tools identified in the first criteria to be useful in 100% RE analysis, then benchmarks them with their capability to carry out the 100% RE evaluation metrics proposed in this study.
The article is structured into seven sections: Section 1 introduces the work with the 100% RE background and history presented in Section 2. Section 3 presents the general rule for renewable energy integration, providing the basis for introducing and discussing different performance metrics and indices useful for 100% RE analysis. Section 4 leverages the identified performance measures highlighted in Section 3 to suggest modelling considerations in 100% RE analysis, while Section 5 reviews the tools used in RE studies and their suitability for 100% RE studies. Section 6 uses the limitations of the existing tools identified in Section 5 and proposes key elements that an ideal energy modelling tool for 100% RE should exhibit, with Section 7 offering the concluding remarks.

2. 100% RE Concepts

2.1. Concept Background

Alongside the main renewable energy sources generally in use, fuel cells, solid waste, and hydrogen energy technologies help meet rising worldwide electricity demand [7]. They increase the promising opinion that all energy usage can come from renewables. Energy storage integration, size, energy flow management, and optimisation can now be examined in wind turbines, solar panels, biomass gasifiers, and fuel cell power plants to add to the present discussion of the possibilities. The process of assessment can be done using a series of approaches and evaluation mechanisms, as well as concepts that suit the needs of the case selected for the studies, but with the overall goal of determining the best options that are available towards the transition into a complete net-zero-carbon-free environment, in this case, a society that completely uses renewables for all it purposes. As a result, interest in developing 100% clean energy systems has increased in recent years [8]. Many leading scholarly journals have published studies on the topic, with a bibliometric review done by S. Khalili and C. Breyer in [9] showing most of the studies that have been carried out.
The term “100% renewable energy” entails that all energy used comes from renewable sources that replenish continuously and have no or minimal environmental impact [9,10,11]. One of the foremost 100% RE global studies by Jacobson M. in [12] proposed the possibilities of using only hydro, wind, and solar for all purposes in 139 countries due to the abundance of natural resources already identified. By gradually replacing non-renewable energy sources such as coal, oil, and natural gas with renewable energy, societies can reduce global carbon footprints and other pollutants in the drive to mitigate the health and climate change consequences. The transition to 100% renewable energy represents a substantial transition in the global energy sector, seeking to substitute all fossil fuels and other non-renewables with sustainable alternatives, as depicted in Figure 1.
The transition is increasingly noticeable as societies tackle climate change [13,14,15,16] and reduce reliance on finite resources. Renewable technologies, such as solar photovoltaics, wind turbines, hydroelectric systems, and geothermal power plants, have undergone notable advancements such as green energy storage solutions [17] and smart grid technologies [18] for the management of energy resources and systems [19,20,21,22,23], resulting in the integration of renewable sources into existing energy infrastructure and enhanced balancing of energy efficiency, demand flexibility, and RE intermittency availability issues necessary for a sustained 100% RE to occur.
Nevertheless, it is imperative to overcome obstacles and barriers to attain the full feasibility of 100% renewable energy.

2.2. History of 100% RE Studies

Supplementary Materials S1, Table S1, presents an overview of the growth in 100% RE research by tracing it with the historical progress of sustainable energy development. It gives a clearer picture of how these studies have influenced policies directed at global energy transition.
As seen in Table S1, there has been a noticeable growth in 100% RE research and acknowledgement. It can be inferred from the changes in the global energy transition policies that have constantly seen energy as a major driver for sustainable development. The progress and growth in 100% RE also seem to provide guiding assurances to develop policies that drive this endeavour. The number of research papers describing 100% renewable energy (RE) systems is presented in Figure 2, according to a bibliometric study by S. Khalili and C. Breyer [9].
For the categories, S. Khalili and C. Breyer in [9] explain that a particular geographic area is considered in the first category. At the same time, a generic analysis without a specific region’s citation falls under category two. The third category is devoted to reviews, which may or may not involve a particular geographic analysis. Since its inception in 1975, Category One has published at least one article annually, on average, according to statistics. Category two was first used in 1996 and has had regular articles since 2008 [9]. Figure 3 shows the spread of 100% RE studies per country. In contrast, Figure 4 shows the region distribution, inferring that some countries and regions have had more studies by more publications. In contrast, others have none, or only a few have carried.
Regions such as Africa, Eurasia, SAARC, and North Asia have had very little attention to 100% RE research. Yet, they constitute some of the major CO2 emitters globally [25], and with the envisaged highest population rate now and in the coming year, even beyond 2070, the population of several countries will either peak or already be on a decline [26,27]. It might infer that there will be an increasing energy demand in these regions/countries and increased CO2 should energy resources in use not be made from renewables.
It is important to note that these 100% RE studies are very useful in providing pragmatic assurances to national/regional policymakers, even though it can be inferred from Table 1 that the perception of the 100% RE possibilities at low cost across the globe has not yet been fully acknowledged. For instance, despite the publication of an initial national pathway in 2012 [28], outlining a goal of achieving 100% renewable energy (RE) by 2060, subsequent scenarios proposing similar objectives or near-complete reliance on RE in several countries [11,29,30,31,32,33,34,35,36,37,38,39,40,41,42,43,44,45,46,47,48,49,50,51] have had limited influence on the political discourse [52]. Achieving 100% renewable energy is only gaining traction; however, challenges persist in its integration into global energy transition policies. The complexity of the transition requires significant infrastructure modifications and may incur significant expenses. Additionally, some nations heavily rely on non-renewable energy sources, making a comprehensive and expeditious transition challenging. At the same time, many countries are deliberating on the strategies to achieve the nation’s newly established objective of attaining 100% renewable energy for power generation, prompted by the recent acts of the Russian–Ukraine war. It can be seen that a few countries have already or are close to achieving that, as can be seen in Figure 5 for 30 countries with nearly or 100% RE production from their national mix for RE % in national electricity mix and electricity access by % population and population data (2022), respectively. The latter is represented in Figure 6.
Countries such as Iceland have already reached their goal of 100% energy production, with about 87% of its primary energy from renewables. Conversely, countries such as Costa Rica (setting most consecutive days for 99% electricity from RE) and Uruguay (about 100% electricity from RE, mainly hydropower) are close to reaching the 100% RE target [5].
Despite the progress by several countries, as mentioned in Figure 5, challenges persist from key observations, some of which are that they are either nations with very little population or that the population do not have 100% access to electricity (highlighted in Figure 6) or there is an intermittent electricity supply. The countries that emit the highest amount of greenhouse gases through their energy processes are not in any way represented in either Figure 5 or Figure 6, except for Ethiopia, which is among the top 10 CO2 emitters in Africa. However, numerous nations and institutions have continuously driven to promote renewable energy adoption through policies, research and development, and advocacy.
With the EU RE target highlighted by the IEA report in [54], the Portuguese government has set a four-year goal of increasing renewable energy consumption from 60% in 2021 to 80% in 2026. Natural gas imports have switched from Russia to Nigeria and the United States. EDP, the largest power provider on the Iberian Peninsula, plans to switch to renewable energy by the decade’s end. Due to these developments, Portugal will no longer depend on fossil fuels. Offshore wind power generation in the Netherlands is predicted to increase by a factor of two by the end of this decade, making it a leader in Europe’s energy revolution. By 2050, the North Sea area hopes to have the capability to generate 150 gigawatts (GW) of power. The United States is still far from its goal of using only clean energy, but it may reap benefits from renewable energy such as wind and solar. By increasing its clean energy production, Denmark hopes to become a top exporter of renewable power. The EAG in Austria plans to invest EUR 1 billion annually and set aside special money for clean technology to achieve its goal of producing 100% electricity from renewable resources by 2030.
Research and policy implementation have led to technological advancements resulting in improved efficiency and cost-effectiveness of renewable energy solutions, making them increasingly appealing. At a critical juncture in the transition, ongoing scholarly inquiry, innovative thinking, and cooperative efforts can make significant strides towards a complete reliance on renewable energy. The discourse among the general populace is particularly intense regarding the non-homogenous global population growth changes in countries, increasing energy developments in developing countries, economic ramifications, and advantages associated with the transition process. The public and political discourse regarding the implications of the ratified Paris Agreement remained relatively limited until additional political pressure was exerted, notably through initiatives such as the Fridays for Future movement (FFF), supported by Scientists for Future [55]. In line with the FFF, additional scholarly investigations have been disseminated, which expand upon preceding research endeavours such as the regional collaborative studies as in [11,12,35,47,56] and studies in the major global emitters of CO2 such as China [36,57,58], the USA [42,46], India [44], Japan [33,43], Iran [48], Germany [41,47,59], Indonesia [39], Canada [60,61], South Korea [62], and Saudi Arabia [50,51]. Similarly, the same studies have also been investigated in Africa’s major emitters of CO2 as in South Africa [37], Egypt [63], Algeria [64], and Nigeria [31,34,65].

2.3. Notable Approaches Facilitating near or 100% RE Successes in Countries

Several countries have made substantial progress towards near or 100% renewable energy (RE) through diverse measures. Table 1 highlights how countries have used different approaches to reach near or 100% renewable energy. It involves a combination of policy frameworks and supportive regulations, technologies, market processes, renewable energy investment, energy storage integration, geographical advantages, investments in research and technology development, and strong political commitment and innovative solutions.
As renewable energy evolves, new approaches and successes may arise. It is also vital to highlight that countries’ natural resources, technological capability, political context, and socio-economic aspects determine the optimal options. Reaching close or 100% renewable energy success requires a holistic approach that includes several of these tactics, and each country’s strategy is unique, so what works for one may not work for another.
Other countries aiming towards 100% RE have used comparable and separate significant measures in addition to the support mechanisms described in Table 1 above. These countries include Sweden, Portugal, Finland, Germany, Denmark, and New Zealand.
Sweden has worked hard to combine renewable energy and cutting-edge energy storage devices. This strategy helps ensure a stable supply of goods and services, especially when renewable energy sources are intermittent. With renewable energy growth, demand-side management and energy efficiency have been introduced in Portugal. The government has successfully used renewable energy with this comprehensive policy. Better grid integration of intermittent renewable sources is achievable with smart grids and demand response systems. After enhancing grid functioning, Portugal ran on renewable energy for 6 days in 2016.
Sweden’s politicians have set ambitious renewable energy goals and funded research and development. Biofuels and wave energy converters have received significant R&D funding from Finland. Technological advances such as solar panels and wind turbine efficiency have reduced the cost of renewable energy generation. Energy-efficient technology and practises can help countries satisfy their energy needs with renewables by cutting demand.
Due to the legislative and regulatory structure that guarantees renewable energy producers’ regular compensation for their power, usually through a long-term contract, RE’s proportion of national electricity supplies has increased. Germany’s “Energiewende” (energy transition) strategy pioneered feed-in tariffs (FiTs) and rapid deployment of renewable energy sources such as solar and wind, resulting in a high share of renewables in the energy mix and a decentralised energy system. A policy such as the Renewable Portfolio Standard/Renewable Energy Standard requires utilities to obtain a certain share of their power from renewables. These standards have helped Denmark and Sweden increase renewable energy utilisation. If the public is educated on the benefits of renewable technology, policy adjustments and widespread adoption may receive more support.
Carbon pricing and strict emission reduction objectives help renewable energy transition. New Zealand and Iceland are already doing this. Island states have used international aid and investment for solar and wind power to switch to renewable energy. Community and municipal initiatives have improved renewable energy consumption in certain places. Danish community-owned wind farms and German solar co-ops are examples.
Figure 7 presents the RE mix of the 30 countries with near or 100% RE in their national mix. It can be observed that a high share of hydropower appears to be dominant across countries, except for Scotland, followed by a higher share of wind in about 10 countries. The margin of contribution from solar is less than wind but higher than geothermal, which is mainly used in 4 out of the 30 countries. For the same Figure 7, we included the RE mix of four top global CO2 (China, the USA, India, and the EU). Much difference that can be seen is the seeming proportionate share of solar, wind, and hydro in these locations, except for geothermal energy.
Table 2 highlights the categories of the renewable energy systems used in 100% RE studies of different countries (herein, we considered mainly the top global CO2 emitters). Table 3 also summarises the studies with the employed support mechanisms and evaluation approaches.
In addition to the discussion in Section 1 and Section 2, this work brings together different procedures and evaluation approaches towards a common, comprehensive methodology for 100% RE analysis.

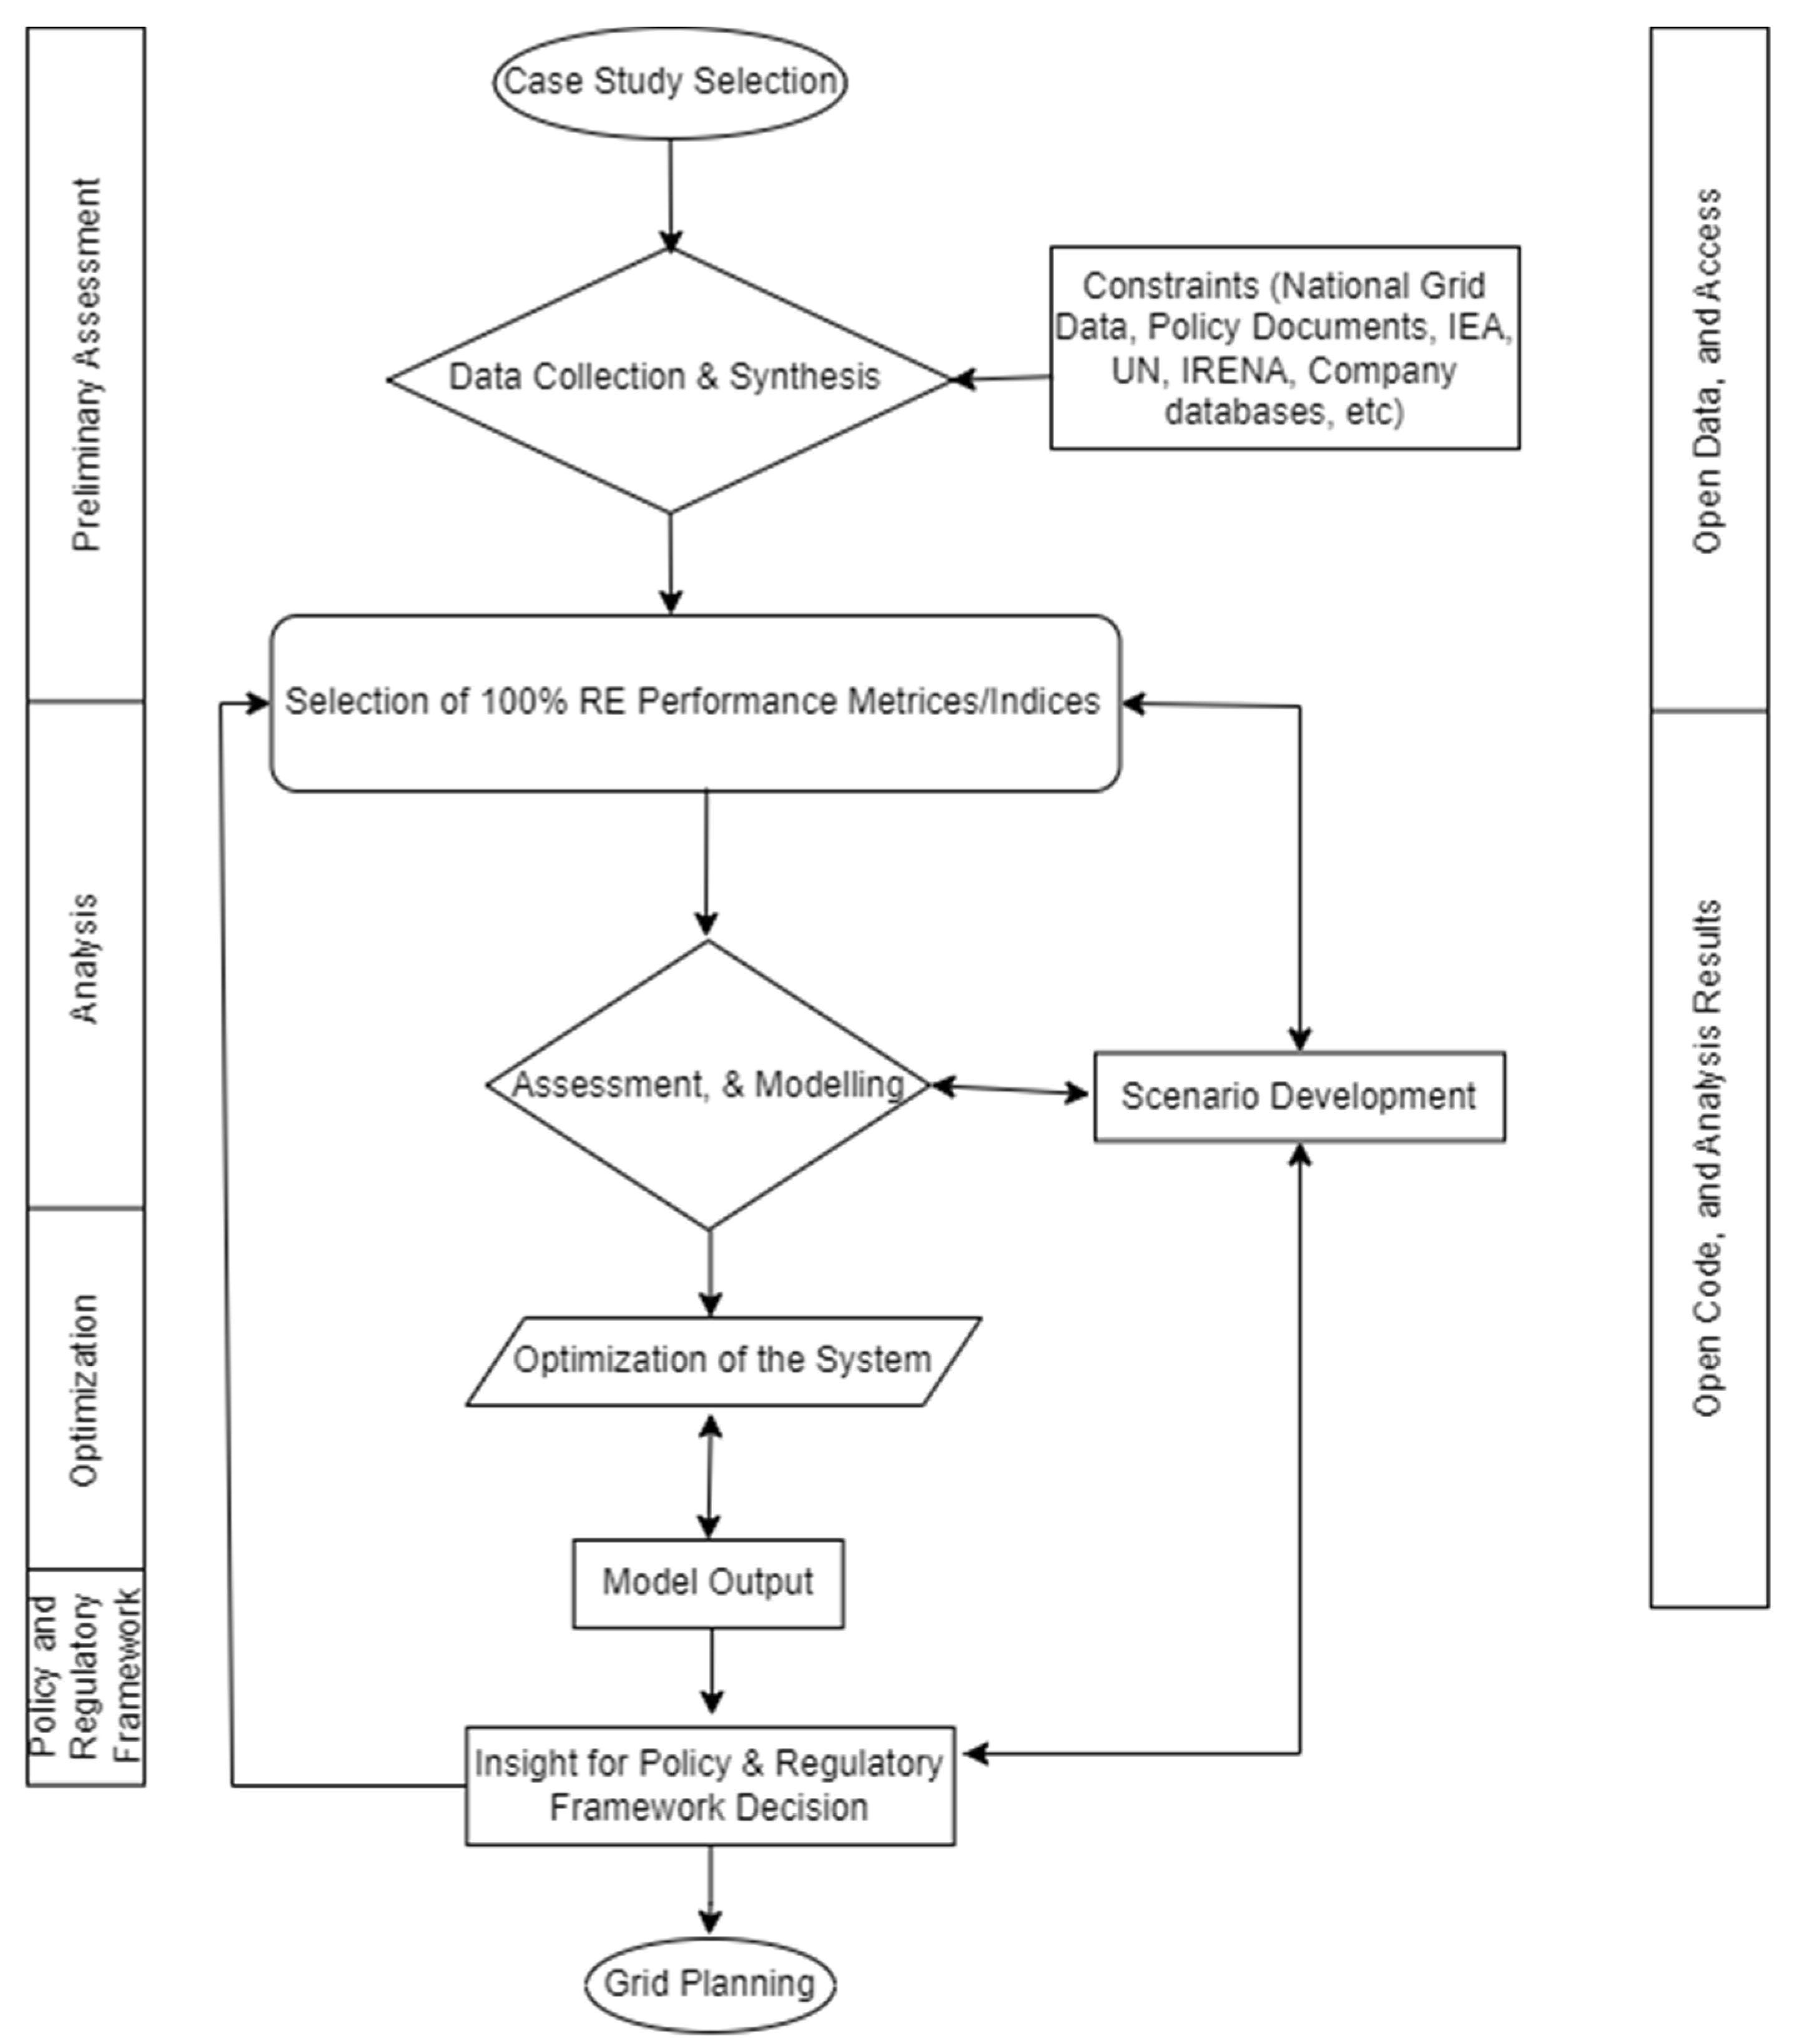
3. General Procedures and Methodological Approaches for Use in 100% Renewable Energies Research

The procedures of 100% renewable energy studies currently in the literature, as shown in Figure 8, are often determined by general rules for RE modelling and integration into the existing national energy grid to determine what best time and energy resource mix a country needs to attain a complete transition into clean energy. More recently, achieving 100% RE at low cost is now some of the ongoing research. However, from Table 1 and the discussion made earlier, the existing 100% RE studies tend not to have absolute consideration in energy policy and discussions, even with the most updated ones from national policies in [1] and guiding international energy plan and roadmap documents such as in [71,72,73,74,75].
Therefore, if the 100% RE concept gains complete trust in political discourse and national energy policy bills, more encompassing methods and typical approaches should be used to present results that reflect the current realities of countries and the Earth’s natural resources. Possibly engaging in this endeavour will address the myths about the unrealistic assertion of achieving 100% RE globally. To evaluate such possibilities, different indices, methods, and determination procedures that consider all the aspects of sustainability are presented in this study that can be useful for further investigating the feasibility of 100% RE integration within the 2030–2050 timeframe. By presenting these approaches already used in existing studies of 100% RE and including other considerations that further 100% RE should include in its analysis, we envisage that the discussion presented herein can serve as the generally accepted methodology for use in comprehensive 100% RE analysis.

3.1. Preliminary Stage

The primary goal of 100% renewable energy studies should be to develop comprehensive and accurate models that simulate and analyse the feasibility, potential, and impacts of transitioning to a fully renewable energy system by presenting an optimal mix of factors and indices in the deployment of renewable energy sources, such as solar, wind, hydro, geothermal, and biomass, to meet the energy demands of a given region/country or system while eliminating reliance on non-renewable sources.
The preliminary stage will include three steps: identifying a case location for the study, extracting data from relevant resources and databases, and defining the sub-objectives for the study based on the following six evaluation metrics:
  • Energy system analysis;
  • Renewable resource assessment (RRA);
  • New technology integration with energy storage requirement (TIESR);
  • Economic, environmental, and social impacts (EEI) for sustainability;
  • Reliability, optimisation, and resilience (ROR);
  • Policy and regulatory analysis (PRA).
Therefore, these metrics are discussed in the next Section 3.2, Section 3.3, Section 3.4, Section 3.5 and Section 3.6.

3.2. Analysis Stage

The analysis stage involves ESA, RRA, TIESR, and EEI.

3.2.1. Energy System Analysis (ESA)

It involves modelling the current energy system, including electricity generation and other sectors within the energy supply chain, such as transportation, construction/building sectors, to understand the existing infrastructure, energy demand, and associated greenhouse gas emissions; forecasting energy demand patterns and trends, considering factors such as population growth, economic development, energy efficiency measures, and electrification of various sectors; and determining the optimal mix of renewable energy sources and their spatial distribution to ensure reliable and cost-effective electricity generation while considering resource availability, land use, and environmental impacts.
According to the findings in [76,77,78], there are a variety of strategies that are employed by ESA for use in strategic, tactical, and operational decision making at every time scale, from short, to mid, to long term [22,31,79,80,81,82,83,84,85,86,87,87]. Since good decision making must encompass the different concerns within the dimensions of sustainability (i.e., social, economic, and environmental difficulties), such as depleting fossil fuels reserves, greenhouse gas emission reduction, resource supply and price changes, and global warming, energy systems require adaptation and evolution. In addressing these concerns, energy systems are subjected to different forms of analysis using the modelling tools discussed in Section 5. Generally, these forms of analysis are expected to cover the following: general or specific functions, applicable methodologies and mathematical approaches, time horizons, sectoral or geographical coverages, data requirements, and logical assumptions of external/internal dependencies.
In Table 4, the description, and the highlights of these forms of energy system analysis are presented.
For 100% RE studies, the purpose of the analysis should ensure that the predictions are within the global target year to go net-zero on GHG emissions. The methodologies must consider the multi-criterion nature for a sustainable transition [31].

3.2.2. Renewable Resource Assessment (RRA)

It involves an analysis of the region’s availability and variability of renewable energy sources such as solar, wind, hydro, geothermal, and biomass. This involves assessing the potential for energy generation, considering factors such as resource availability, intermittency, and spatial distribution, the requirements for upgrading and expanding the electricity grid infrastructure to accommodate increased energy demand renewable energy generation, including analysing transmission and distribution capacities, grid stability, and grid-balancing mechanisms.
Morteza Z. and Behnam M. in [130] state that the following RRA levels exist: preliminary, validation, and observation. These three levels of RRA are presented as shown in Figure 9 below.

3.3. New Technology Integration with Energy Storage Requirement (TIESR)

This approach involves evaluating various renewable energy technologies, as well as their efficiency, costs, and scalability, followed by modelling the integration of these technologies into the existing energy system and interdependence, transmission, and energy storage requirements, such as batteries, pumped hydro storage, or thermal storage, in order to address the intermittent nature of renewable energy sources and ensure a reliable electricity supply. The rising penetration of various REs has created numerous technological issues for power grids, which continue as system components switch from a consumption mode to a supply one. Dispatched resources also impact power systems, such as intermittent renewable energy. Electricity companies have been forced to quickly change grid design and operating techniques due to the rising rates of renewable energy source penetration in various places [131].
Some nations have established strict regulatory frameworks that consider the technological resources at the disposal of power system operators to control the escalating installation rates effectively. The technical integration of RES into electricity networks has been the topic of numerous regional and national studies. Power system designers must consider every aspect of integrating variable renewable energy sources, as how these plans are carried out is greatly influenced by the state of the energy markets and the expected amount of RES penetration [130]. To include RES into current electricity grid networks, the following five technical requirements are crucial [132,133,134]:
(a)
Regulating reactive power and voltage: The allowed deviation from the nominal voltage after using renewable energy sources ranges between ±5 and ±10% at the point of common coupling (PCC).
(b)
Frequency and dynamic power control: When used with power grids, intermittent renewable energy sources (RES) can increase or decrease active power generation, affecting the power system’s frequency. Regulations now permit frequency deviations from the nominal frequency of −5% to +3% when RES is installed.
(c)
Power quality problems: Analysing harmonic orders that cause waveform distortion and transient oscillations is the fundamental challenge with power quality. The use of international standards for power quality analysis when integrating renewable energy sources (RES) is important. In addition, time index plays a crucial role in power system planning and operation, with voltage and frequency stability crucial for power quality issues [135].
(d)
Flow control in traffic: There might be limitations on the power supply channel from the RES connection point to subscriber areas, or additional RES capacity at the PCC might not be feasible.
(e)
Grid congestion may result from installing increased renewable energy capacity in various locations. Potential weak spots in the electric power system should be considered during planning to manage overloads.
Operators of power systems are responsible for preserving supply and demand equilibrium in short- to medium-term time frames [135]. Generation and transmission capacity are the two main measures for determining whether the entire power system can satisfy its annual electrical demand. Stability in the electricity system depends on how these measurements are interpreted when dynamic resources such as renewable energy sources (RES) are used [136]. The TIESR objective is paramount for a sustainable 100% RE, as the inability to manage any possible power or system interruption results in not meeting the goal.

3.4. Economical, Environmental, and Social Impacts (EEI) for Sustainability

This approach involves assessing the economic feasibility and cost-effectiveness of transitioning to 100% renewable energy, including evaluating the environmental benefits of transitioning to renewable energy, such as reduced greenhouse gas emissions, improved air quality, and climate change mitigation. Also, the social implications, including job creation, energy access, and community engagement, are considered.
Given the importance of sustainability in every project, the general concept of the objective of EEI should be expected to incorporate the indices presented in Table 5 below.

3.4.1. Economic Aspects

As can be seen from Table 5, the primary estimation metrics for economic assessment of systems towards 100% RE can be measured through energy return on investment and levelized cost of energy. The general equation form of these two approaches is listed and explained in Supplementary Materials S2, Table S2. Finance strategies and possible market settings are key components of 100% RES capital investment, and the data used in such economic impact estimation are particular to each country. The pricing system in the energy supply chain, the availability of auxiliary services, and the market factors contribute to the return on these investments, forming the first economic assessment criteria in EIA for 100% RE. The energy return on investment (EROI) calculates the energy gained from an investment. Poor energy return on investment (EROI) means more energy input is needed to produce the same energy output, adversely affecting the economy [139]. EROI is a metric that assesses how effectively a system can produce useful energy [60,62]. It does this by comparing various energy technologies, which helps to reveal which energy sources are the most financially viable. Energy return on investment (EROI) involves the quantification of energy delivered (E delivered) concerning energy requirement for delivery (Ereq, which represents the total demand by the infrastructure and energy required to process the fuel). The amount of money and energy needed for an energy infrastructure and process can be estimated using EROI [59], as it provides the skeletal perspective of the best energy options to adopt. The setback with using EROI is its inability to cover the basic criteria in economic analysis of electrical energy-producing systems, such as the initial investment price, annual deterioration rate, extended warranty, and annual operation and maintenance cost. These variables are contained in an index called levelized energy cost (LCOE) with an intermittent factor. In the case of 100% RE, IF is expected to be a constant, most likely 1, because no intermittency is expected. If that happens, energy storage is activated for utilisation always to ensure that all generation, transmission, distribution, and consumption are all from RE. By dividing the total cost of power generation over the plant’s lifetime by its net present value, the levelized cost of energy is calculated [3].
When comparing different energy generation systems, one common metric is the levelized cost of energy (LCOE), as described above, which is an estimate of the average net current cost of generating electricity during the lifetime of a power plant [140,141]. However, LCOE ignores system costs, which comprise a considerable portion of the entire cost of electricity. To make cost analyses more reflective of the system cost, the LCOE is modified to incorporate other costs not accounted for in the LCOE, hence having the system-levelized cost (sLCOE).
To account for variations in peak demand, the International Energy Agency (IEA) developed the value-adjusted levelized cost of electricity (vaLCOE) [142]. Without adding a new power plant or storage facility, the levelized avoided cost of energy (LaCE) can show how well the system can function. Costs associated with supplying the full energy market with a single power source and storage are analysed in the levelized full system costs of electricity (LfsCOE) indices. In addition to the equations of LCOE, sLCOE, LaCE, and LfsCOE can be estimated.
A new project’s LaCE is estimated as an annual cost change (ΔSp) based on the power plants’ yearly per-unit energy (Ep). The net benefit (NB), computed by subtracting investment, operating, and administrative costs from avoided cost reductions, is another important metric for power plant evaluation. If levelized cost savings exceed the levelized cost of investment (LaCEp > LCOEp), the project is feasible or attractive for investment [139]. When energy storage systems are introduced, the levelized cost can be represented as LCOES being the levelized cost for energy storage. Therefore, the overall investment cost of the electricity storage system during its lifetime, divided by its cumulative delivered electricity, is the levelized cost of storage (LCOES). In low-carbon electricity networks, this expense is an element used to balance supply and demand [40]. Since energy storage can still have higher CO2 emissions if the primary energy source is not 110% carbon free, investing more in green energy storage technology is necessary for a 100% RE goal.
These levelized costs can be redefined in the context of 100% RE to mean the needed cost to transition, successfully install, and operate the RE while achieving 100% clean energy in the entire energy chain. Therefore, to calculate the LCOE index for 100% RE, the lifetime of the energy-producing technology should be often assumed to be the total time it will take the energy technology to fully transition into 100% clean supply for total demand and maintain that steady state until there is a new system replacement that achieves similar needs. With the commonality of energy storage integration, LfsCOE becomes more reflective of LCOE for 100% RE, and herein, n = 1, 2, 3,…, depending on the number of energy systems used to achieve the 100% RE target, while LCOES for 100% RE is expected to be the cost of energy storages towards net-zero CO2 emissions.
The annualised life cycle cost of energy storage can be calculated using the levelized cost of energy storage (LCOES) and net levelized cost of energy storage (nLCOES).
According to M. D. Sklar-Chik et al. [138], I. F. Roth and L. L. Ambs [143], and A. Rentizelas and D. Georgakellos [144], a wide range of data is required for LCOE estimation or modelling. Information such as rate of heat and price of fuel; tax (federal, state, credits, sales, etc.); tax information; characteristics of the power plant such as gross capacity, transmission losses, forced and planned outages, heat rate degradation, capacity degradation, and emissions factors; and general assumptions such as insurance and labour escalated issues are all included. Incorporating all these externalities to holistically ascertain the levelised costs is more useful to understanding the generation technology’s life cycle cost [143], which will be useful to understanding the true economic cost of 100% RE transition. Given the typical operational lifespan of RE systems (say solar and wind panels), which ranges from 15 to 20 years, it is crucial to consider the annual costs associated with their eventual replacement, which comes with carbon footprints, as discussed next.

3.4.2. Environmental Aspects

A renewable energy system may not be entirely clean in its full life cycle, even though it is clean at the point of consumption. While the transition to renewable energy contributes to the mitigation of greenhouse gas emissions and the deceleration of global warming, accurate measurement of carbon footprints for renewable energy sources is increasingly important for informed environmental decision making during the transition to their utilisation, more particularly with the interest of rapid transition to 100% RE. Managing decommissioned RE systems (such as wind and solar panels) is crucial within the 100% RE transition. The effective management of end-of-life products plays a crucial role in developing and maintaining sustainable energy systems. Hence, it is imperative to establish appropriate protocols and facilities to dispose of these technologies. In light of the possible necessity to replace RE power infrastructure after its useful life or if a newer technology with higher energy efficiency emerges, it is imperative to evaluate the sufficiency of the worldwide reserve of rare earth minerals to ascertain the sustainability of these technological progressions, as well as what potential environmental impacts may arise as a result of the establishment of the required new processing industries to facilitate the production of the RE system.
The rationale behind this assessment is presenting methods that can help assess the right timing and the implications of rapid, instead of gradual, utilisation of resources to achieve 100% RE within a short time frame in the quest to achieving the UN 2030 target, which expects the current RE power to be tripled. Given this, how many materials are sufficient to construct systems capable of delivering 100% RE sustainably without overshooting the Earth’s natural resources allocation per time can be determined, thereby reducing the current increasing global ecological debt and the resulting damage.
While there are evolving integrated methods for evaluating the environmental impacts of RE, as can be found in work by M. Pehl et al. [145], along with applicable tools and evaluation criteria by J. Akpan et al. in [146], these methods are primarily built on carbon footprint measurement by two approaches, the emissions factor assessment, and the damage impact factor assessments highlighted in Table 5, and with both strategies having received the validations of IPCC [147,148,149] and ISO applicable standards [150,151], respectively. The significance of assessing emissions and damage impact factors for accurately quantifying greenhouse gas emissions associated with renewable energy generation and rapid exploitation of materials for constructing these RE systems cannot be over-emphasised. A thorough understanding of these implications associated with power generation from renewable energy within a short interval could help understand the right RE options to invest in per country, knowing that the availability of resource technology for RE differs in location.
How can the damage consequences of the rapid transition into 100% RE pose a challenging environment for continuous access to the resources and materials needed for continuous RE production with the rising energy demand for many purposes? It is one of the questions the use of the indices presented here can help to address in 100% RE studies.

3.4.3. Social Impact Assessment

The successful implementation of this 100% transition requires, beyond economic and environmental compromise, addressing potential social problems such as public trust and threatened war.
(i)
Public Trust and Benefits
The active support and trust of the public can be achieved when relevant issues are addressed obstacles such as scepticism; fear of change; and concerns about economic repercussions such as the affordability of the cost of the transition to the end-users and the trade-offs for sustaining this initiative, such as job creation, environmental protection, and health benefits. The dissemination of such information in an accurate way regarding the reliability and cost-effectiveness of renewable technology transition through open-source modelling of this 100% RE plan can effectively debunk prevalent myths and misconceptions surrounding them. Accountability mechanisms such as independent audits and oversight serve as illustrative instances that can enhance public confidence in the dependability of forecasts and models for 100% RE. The efficacy and reliability of renewable energy solutions can be exemplified through regular data exchange, project updates, and performance measurements, as can be found by some of the works in [10,11,12,32,152,153,154,155] that have constantly emphasised the feasibility of 100% RE.
(ii)
War and Conflict Threats
The impact of threatened war across countries should be examined, as this will impede and decelerate any existing development for 100% RE. For instance, the Ukrainian war has caused high energy uncertainty in the mid-term for many European countries. Additionally, in the Nile water war between Ethiopia and Egypt, Ethiopia, as against the historical preference of Egypt, diverted the water to construct dams to increase its population’s electricity access and view it as its national sovereignty. Similarly, Niger and Nigeria have a bilateral agreement on the Niger River’s hydroelectric potential, with Nigeria’s Kainji and Jebba Hydro Power Plants (HPP) transmitting electricity to Niger. However, political unrest in Niger due to the most recent coup d’état in Niger, as well as the envisaged potential intervention by ECOWAS, led by Nigeria, could undermine trust between the two nations. It could lead Niger to reconsider its current agreement and venture into hydroelectric resources upstream of Nigerian HPPs, and this will affect the electricity access of the population in Nigeria and other neighbouring countries with energy dependency on Nigeria. A potential Kainji and Jebba HPPs shutdown could exacerbate Nigeria’s power crisis and strain its relationship with neighbouring countries such as Benin and Cameroun. A diplomatic approach emphasising negotiation and compromise is crucial to resolve such political deadlocks in these countries to promote actions towards a sustained 100% RE. For a realistic 100% RE, assessing such impacts while using them as insights for developing alternative energy-independent pathways is essential for the pragmatic and sustainable implementation of the 100% RE vision.

3.5. Optimisation Stage

The reliability, optimisation, and resilience (ROR) stage of the 100% RE studies involves analysing the potential challenges and risks associated with a renewable energy system, including the impact of extreme weather events, cybersecurity, and developing contingency plans to maintain system reliability and resilience. Expanding the current energy system to achieve 100% renewable energy penetration while ensuring system reliability, grid stability, and cost-effectiveness becomes a key issue in grid planning. It may involve exploring different scenarios, identifying optimal technology portfolios, and designing energy storage solutions. Some ways to ascertain the ROR of the 100% RE pathway can be evaluated using grid planning approaches not limited to general adequacy analysis and hosting capacity enhancement considering the technical requirements of RES integration into the grid, as discussed in Section 3.3. The general equation form for assessment with these two approaches is listed and explained in Supplementary Materials S2, Table S3.

3.5.1. General Adequacy Analysis

Intermittency in renewable energy production, caused by weather conditions, time of day, and season, poses a significant challenge in transitioning to a sustainable and 100% RE system. This variability affects the reliability and stability of the grid, leading to disruptions and blackouts. While energy storage technologies, such as hydrogen and batteries, have presented a great breakthrough for mitigating this issue [17,138], their cost and technological limitations impact and hinder full adoption as the guaranteed singular solution [50,96].
Fossil fuel power plants function as supplementary energy sources when renewable generation is insufficient and no longer becomes an option in 100% RE. Therefore, grid flexibility through planning strategies such as demand response programs, smart grid technologies, and advanced forecasting methods is crucial for managing supply availability to meet demand, manage fluctuations, and maintain stability. Reference [156] identified integration, coordination, and regulatory resources as emerging needs in the power sector. So, enhancing integration and coordination among various sectors, such as supply and demand, gas and electric operators, and electricity programs with non-electric social programs, are instrumental for ensuring 100% RE resilience.
The capability of the RE system to transition into 100% and to sustainably deliver the energy system demand under various conditions and scenarios can be determined with the use of generation adequacy analysis [156,157,158,159,160,161], employing different deterministic and probabilistic techniques such as probability density function; convolution functions; correlation/regression; Markov process; frequency and duration; radial, parallel, and meshed network; point estimate; Monte Carlo; and artificial neural network techniques [162,163,164], which support the reliability evaluation of RE generation technology integrated into the national grid.

3.5.2. Hosting Capacity Enhancement

Hosting capacity (HC) limits and enhancement strategies of resources on grid distribution networks have been discussed by El-Ela et al. and Suchithra et al. in [165,166], respectively. This assessment is important as it must be considered when planning a long-term grid for 100% RE. It will be particularly important in countries where the integration of RE capacity is targeted. RE e   : At every stage of the distribution system, it is expected to contribute significantly to the country’s total energy mix, and yet there are limited resource availability and capacity constraints. An integrated strategy supports the interchangeability and complementarity of storage and line investment. It quantitatively assesses the constraints in distribution networks and their correlation with investments at the transmission and distribution levels. It will help determine the right investment options while optimising the different costs.

3.6. Policy and Regulatory Analysis (PRA)

Evaluating policy mechanisms, market structures, and regulatory frameworks that can facilitate the transition to 100% renewable energy and modelling the impact of different policies, incentives, and subsidies on investment decisions, market dynamics, consumer behaviour, etc., are important [62,76,167,168,169,170,171,172,173]. This will help inform policymakers and stakeholders about the necessary policy, regulatory, and market mechanisms to support the transition to 100% renewable energy, including incentives, targets, and regulations promoting renewable energy deployment and investment. The 100% RE studies can benefit by applying the expertise and further development of these legislative acts by governments to support sustainable energy technology. These mechanisms include the green certificate system, feed-in-tariff, pure tendering process, energy subsidy, energy financing, carbon budgeting and taxing, and energy–environment–economy development nexus.

3.6.1. Green Certificate System

Long-term, cost-effective, sustainable energy technologies are difficult to create in this system, but with the vision scenario of 100% RE access, more revenues that could serve as investments can be allotted to increase the probability of reaching net-zero through clean energy targets. A green certificate system can compensate for the gap between green electricity pricing and market prices. Certificates issued at the national level show how much renewable contribution comes from independent electricity generators and are placed as a measure by the government to encourage RE. Fines can then be charged through certificates with a less value RE contribution and put as budgetary allocation towards increasing the availability of renewable technologies. In their analysis, 100% of RE studies can also consider this mechanism by exploring the reasonable green certificate charges for a selected case study and the consequences on the clean energy target.

3.6.2. Feed-In-Tariff

The feed-in tariff is a mechanism set for a specific period, where suppliers are paid as profit for the full retail price per kilowatt-hour by electricity businesses by selling their output at market rates and receiving a set subsidy per kilowatt-hour [174]. This allows for intermediate and long-term technologies while encouraging high investments into 100% RE projects. However, harmonising them within the context of a country may be challenging. Overcompensation may occur if the tariff remains even if the cost of producing power decreases due to learning effects. Renewable energy storages targeted at supporting 100% RE actualisation can also receive a premium through a fixed-premium mechanism, a feed-in-tariff scheme.

3.6.3. Pure Tendering Processes

The government submits numerous bids for green electricity supply, with the price set by contract. Compensation is paid based on the going market rate for electricity. Tendering systems, while theoretically utilising market dynamics, can be unpredictable and challenging to plan for, and accepting low bids increases the risk of project completion. In these cases, the contract price set for projects aimed at 100% RE should consider the supply chain risks towards meeting the targets while considering the market dynamics and ensuring that uncertainties are managed properly.

3.6.4. Energy Subsidy (Renewables over Fossils)

Subsidies can largely shape the energy environment and affect the competitiveness of renewable fuel options. These subsidies help worldwide efforts to meet international climate goals, improve energy security, reduce fossil fuel imports, and progress technology. Renewable energy subsidies boost investment and innovation in the sector, creating jobs, public health benefits, and energy cost parity. They also equalise economic conditions, making renewables cost-competitive with fossil fuels. Renewable energy technology advances aid regional growth, power accessibility, and economic advancement. However, budgetary effects, political will, market distortions, and long-term viability are issues with renewable energy subsidies. Political will determines subsidy program fate and financial resource allocation. Subsidies can distort markets and consumer behaviour. The 100% RE analysis can also prove the appropriate route for policymakers to create well-targeted subsidy programs to maximise renewable energy subsidies’ benefits and minimise their downsides.

3.6.5. Clean Energy Financing and Carbon Budgeting

Under the UN Kyoto protocol in [175], the Clean Energy Mechanism (CDM) was the major criterion for financing clean energy projects in the form of assigned Certified Emission Reduction (CER) units, as entities whose strategies and visions contribute more to sustainable energy development projects tend to receive more supports [176]. The CER units are bought by industrialised nations (who are eventually signatories to the Kyoto Protocol) from the CDM emissions reduction projects in developing countries, posing a challenge to those who were not signatory but with very high GHG emissions, for instance, the USA and China. It resulted in the value of CER crashing significantly, thereby reducing the financial contribution to clean energy projects as many countries tried to recover from the devaluation of their non-remitted finances from old CERs, which is believed to be one of the major reasons for the failure of the COP25 [177,178]. Most importantly, this strategy has not been able to significantly reduce global GHG emissions as setting a cap on emissions and allocating that cap among countries, industries, or other entities are important and have been the most recent strategies of global carbon budgeting managed by the UNFCC under the National Determined Contribution initiative.
Because of other pertinent factors clean energy finance should consider, given the present push for climate justice, an all-inclusive system with the potential to consider relative benefit, compatibility, complexity, observability, trialability, and risk in energy financing and technology transfer protocols is important. A study by T. Ehlers in [179] used an index known as the S&P 500 Carbon Efficient Index, a quantitative method for evaluating the effectiveness of an organisation’s carbon footprint and compared the enterprise’s annual revenue with its emissions (i.e., the ratio of CO2 emissions to annual revenue). Applying such an index in energy financing decisions alongside other development metrics towards countries with less economic and social power can be very useful, as this index’s distinguishing feature is not just its encouragement of businesses to adopt more environmentally friendly practices but a climate justice system that seeks to place everyone in an advantaged position to attain the objective of low-carbon economic transition and the 100% RE.

3.6.6. Energy–Economy–Environment and Development (EEED) Nexus

Transitioning to 100% renewable energy sources is a key component of the present-day energy–economy–environment and development nexus, which describes the intricate relationship between energy production, economic growth, environmental sustainability, and development. This idea acknowledges the interdependence of these factors and stresses the importance of a holistic approach to ensuring a sustainable and successful clean energy future. Part of the nexus is finding solutions to problems and balancing competing priorities. To be able to do the EEED evaluation towards 100% RE, an integrated assessment method that incorporates the previously discussed methods is essential to comprehensively assess both their technical, technological, and societal implications of pathways. The EEED nexus, which requires an integrated assessment approach, has been identified in succeeding sections, Section 5 of this study, as one of the challenging incapability of existing energy modelling tools.

4. Energy Modelling Process and Considerations for Optimisation

Several of the most beneficial design and modelling considerations in 100% RE evaluation will mainly include those stated in Table 5, as discussed in Section 4. By pursuing these metrics and incorporating the insights shared into 100% RE analysis, decision-makers, stakeholders, and policymakers can be properly informed about the technical, economic, social, and environmental aspects of achieving a 100% renewable energy future, thereby supporting the formulation of effective strategies and policies for a sustainable energy transition.
As a summary, Table 6 presents the key evaluation metrics that should be contained in a comprehensive 100% RE study, as previously discussed in detail.
The modelling process involves assessing the current energy infrastructure, including generation, transmission, and distribution systems, as well as simulating various scenarios based on the presented indices of Table 5 to determine the most effective strategies and technologies for achieving the transition to 100% renewable energy, as depicted in Figure 10 below.
Moreover, different modelling processes for achieving the objectives of 100% RE analysis by decision-makers involve a variety of approaches, considerations, and tools/software to reduce both the amount of computation necessary and the accompanying costs of non-pragmatic assumptions. Some of these tools used in analysing systems towards 100% RE are compared in Table 6, being highlighted, and discussed in subsequent sections.

5. Energy Modelling Tools (EMT) and Suitability in 100% Renewable Energy Studies

Several energy modelling tools exist and have been studied in previous works, such as comparative studies and review works in [57,80,121,122,123,126,127]. In line with the listing in [180], with a detailed description of most of the energy modelling tools, and the work by [9] that identified the energy modelling tools often used for 100% RE studies, a summary of the general modelling tools is presented in Table 7. A further addition is made to the list to include other software not identified by the other works and placed within the seven categories of the tool’s usage at local or individual, island, national, global, all-purpose, 100% RE studies, and transition. Here, transition [128,181] refers to the tool’s capability to incorporate pathway modification or adjustment in the methods, such as the metrics presented in this work needed by a country or selected case study to reach 100% RE. Table 8 matches the evaluation metrics in this study with which existing 100% RE modelling tools have been used.

6. Toward a Common Methodology for 100% RE Analysis

Generally, and from Section 5, the two most used models for assessing 100% RE systems are EnergyPLAN and LUT-ESTM [9] because of their overall benefits when it has to do with their application to different industrial sectors, transition modelling (although EnergyPLAN is unable to perform this), optimisation, full hourly simulation, off-grid integration, and carbon capture strategies (CCS). The later benefits of CCS inclusion have been newly introduced in LUT-ESTM. For the description of the advantages and limitations of all the tools, several studies have been made already, such as those included in [57,80,80,88,118,119,119,121,122,123,180,182,183]. However, not all tools are comprehensive enough to address all the limitations of each one, and most importantly, the challenges and needs of some countries such as energy security through regional integration [184], varying technical capacities [185], energy trade [186], and study objectives such as holistic integration of the different aspects of sustainability into the 100% RE analysis have been discussed in this study.
Further challenges raised by S. Khalili and C. Breyer in [9] and T. Remy et al. in [187] observed that not a single EST supports off-grid integration, which is of utmost significance for research on energy transitions in sub-Saharan Africa [188]. The energy transition into full renewables in developing countries such as those in Africa may have to take a different paradigm, as discussed by I. Aniebo et al. [189], in addition to the fact that not all of the population is yet to have 100% electricity access, already highlighted in Section 2 of this work. Following the earlier mentioned limitations, it is worth noting that there is currently no energy system modelling tool of the functionalities of integrated assessment models (IAMs) in undertaking detailed analyses of 100% energy systems within the framework of long-term climate change constraints. This specific goal has been identified as a key area that needs concentration [190,191], as IAMs tend to ignore studies on 100% RE systems [9].
There has been some recent progress, such as alternative integrated tools for long-range energy planning [100], modelling frameworks to integrate global socioeconomic and biophysical constraints [192], and integrated tools for spatial representation of high-quality data of renewable energy technologies for expansion planning models [117]. A more representative example is the VENSIM/C-ROAD/EN-ROAD, which is a climate simulator created collaboratively by MIT Sloan Sustainability Initiative, Climate Interactive, and Ventana Systems (owners of VENSIM) that employs the principles of system dynamic and thinking [193]. This tool facilitates the analysis of the effects of policies such as electrification, carbon pricing, and agricultural practices on different factors, including energy prices, temperature, air quality, and sea level rise [193]. The C-ROADS Simulator aids in comprehending the effects of countries’ emission reduction commitments in the United Nations and evaluating the long-term consequences of various climate strategies in different regions. C-ROADS allows for the efficient evaluation of policy effectiveness in achieving temperature stabilisation below 2 °C and examining the various types of plans, encompassing differences in reduction rates and target years. However, the setback with the VENSIM/C-ROAD/EN-ROAD tool has been highlighted and presented in Table 8 and Table 9, where they are mainly used for global policy and regulatory analysis (PRA) and energy system analysis (ESA), based on embedded data from international agencies. In contrast, the rest of the metrics can only be partially done by drawing insights into decisions from the results obtained from the other functionalities of the simulator.
Frameworks that require several forms of integrated system modelling can be best supported with the use of a dynamic approach and the evaluation metrics/indices proposed in this study, and this can be attempted given a thorough understanding of the problem statement and a clearer picture of what solution is desired, as well as developing a hypothesis and pathways that suit the problem statement and scenario definition. This method is dynamic and will require interdisciplinary discussion to ensure that proposed solutions or pathways are technically sound, pragmatic, and feasible. For this to happen, the use of an IAM requires not just an in-depth understanding of the problem or means to reach 100% RE, as in this case, but that the solutions are pre-determined with the right scenarios, and hypotheses backed up with the right data and or applicable modelling key elements and capabilities. Therefore, in Table 9, additional key elements are summarised and presented that should be included in a comprehensive EST in addition to existing capabilities for holistic 100% RE studies.

7. Conclusions and Recommendation

The use of renewable energy technologies not only helps the economy, society, and the environment but also advances the cause of sustainable development, as discussed in preceding sections of this work, which has necessitated the need for a net-zero carbon society through the transition into full deployment of renewable energy for all use. The ongoing shift towards 100% RE raises inquiries regarding the possibility and sustainability of such an endeavour on the global stage, even though some countries, as mentioned in Table 2, have already attained or near this goal. Numerous research topics and discussions underscore the current deficiencies in knowledge that necessitate attention to foster the emergence of viable prospects for development within the realm of the green economy. Considering the multi-faceted obstacles linked to engagement in the transition towards complete clean energy, it is crucial to formulate novel frameworks that can adequately investigate the expansion and advancement of clean energy endeavours. When formulating strategies to promote growth, it is imperative to consider various factors such as technical, socio-economic, environmental, and developmental constraints.
This study lays the foundation for future research on technical and non-technical approaches to promote a sustainable transition to a 100% RE by providing key elements, particularly the proposed 100% RE evaluation metrics, which include energy system analysis (ESA); renewable resource assessment (RRA); new technology integration with energy storage requirement (TIESR); economic, environmental, and social impacts (EEI) for sustainability; and policy and regulatory analysis (PRA). While these metrics with indices have been proposed and discussed in this study, future work should focus on demonstrating how these indices can aid in developing more holistic pathways for transition into 100% RE in countries, regions, and the world.
It is imperative to undertake additional research to comprehensively examine how these evaluation metrics have been employed in various countries. For instance, with the record from Table 3 showing that the studies carried out in several countries, particularly with high CO2 global contributions, have only considered a few of the strategies and evaluation mechanisms shared in this study, an opportunity can be explored to investigate into ways that they can transition into complete RE using several other indices presented in this work.
Additionally, there is hardly any single 100% RE study or integrated tool that performs a comprehensive evaluation of transitioning into 100% RE; this study has only been able to propose evaluation metrics without a case study modelling demonstration of the use of many or all metrics in methodologies for 100% RE analysis. Hence, there is a need for a robust yet transparent 100% RE analysis capable of using most or all the six evaluation mechanisms in presenting pragmatic results that wins the trust of the public and government/private investment in full clean energy projects.
It necessitates using an inclusive method during such 100% RE analysis to demonstrate how important national and regional development issues and constraints should not be left out in the quest for full 100% RE utilisation for all purposes. This work also proposes the need for the establishment and refinement of existing integrated energy models reviewed in Section 5 and Section 6 in order to specifically be designed to accommodate developmental versus decarbonisation transitional processes such as the ones mentioned by Tambari I. and Dioha M. in [194], which we believe will be instrumental towards a complete 100% RE and energy equity for all. These models would aid end users, utilities, and prosumers in the efficient planning and execution of sustainable energy and electricity generation, distribution, and usage across countries and cities, as these will significantly impact the development and implementation of national and international energy policies.

Supplementary Materials

The following supporting information can be downloaded at: https://www.mdpi.com/article/10.3390/en16186598/s1, Table S1. Historical Path of Sustainable Energy Development and Selected 100% RE Research Progresses; Table S2. Forms and Indices of EEI; Table S3. Forms and Indices of ROR. References [195,196,197,198,199,200,201,202,203,204,205,206,207,208,209,210,211,212,213,214,215,216,217,218,219,220,221,222,223,224,225,226,227,228,229,230,231,232,233,234,235,236,237,238] are cited in the supplementary materials.

Author Contributions

Conceptualisation, J.A.; methodology, J.A.; visualisation, J.A.; validation, J.A. and O.O.; formal analysis, J.A.; resources, O.O.; writing—original draft preparation, J.A.; writing—review and editing, J.A. and O.O.; supervision, O.O.; funding acquisition, O.O. All authors have read and agreed to the published version of the manuscript.

Funding

This research received no external funding.

Data Availability Statement

All data used in this study are openly available and have been referenced properly.

Acknowledgments

The support of the Durban University of Technology grant and scholarship under the Postgraduate RFA-Energy research theme is gratefully acknowledged.

Conflicts of Interest

The authors declare no conflict of interest.

References

  1. IEA. World Energy Investment 2023. 2023. Available online: https://www.iea.org/reports/world-energy-investment-2023. (accessed on 31 May 2023).
  2. IRENA. Renewable Power Generation Costs in 2019. 2020. Available online: www.irena.org (accessed on 2 June 2023).
  3. Asha, P.; Mannepalli, K.; Khilar, R.; Subbulakshmi, N.; Dhanalakshmi, R.; Tripathi, V.; Mohanavel, V.; Sathyamurthy, R.; Sudhakar, M. Role of machine learning in attaining environmental sustainability. Energy Rep. 2022, 8, 863–871. [Google Scholar] [CrossRef]
  4. Lafortune, G.; Fuller, G.; Moreno, J.; Schmidt-Traub, G.; Kroll, C. SDG Index and Dashboards Detailed Methodological Paper; LSMP: Riga, Latvia, 2018. [Google Scholar]
  5. Ritchie, R.; Mispy, O.-O. SDG Tracker-Measuring Progress towards the Sustainable Development Goals. 2021. Available online: https://sdg-tracker.org/energy (accessed on 15 June 2023).
  6. Heidari, N.; Pearce, J.M. A review of greenhouse gas emission liabilities as the value of renewable energy for mitigating lawsuits for climate change related damages. Renew. Sustain. Energy Rev. 2016, 55, 899–908. [Google Scholar] [CrossRef]
  7. Güven, A.F.; Samy, M.M. Performance analysis of autonomous green energy system based on multi and hybrid metaheuristic optimization approaches. Energy Convers. Manag. 2022, 269, 116058. [Google Scholar] [CrossRef]
  8. Hansen, K.; Breyer, C.; Lund, H. Status and perspectives on 100% renewable energy systems. Energy 2019, 175, 471–480. [Google Scholar] [CrossRef]
  9. Khalili, S.; Breyer, C. Review on 100% Renewable Energy System Analyses—A Bibliometric Perspective. IEEE Access 2022, 10, 125792–125834. [Google Scholar] [CrossRef]
  10. Breyer, C.; Khalili, S.; Bogdanov, D.; Ram, M.; Oyewo, A.S.; Aghahosseini, A.; Gulagi, A.; Solomon, A.A.; Keiner, D.; Lopez, G.; et al. On the History and Future of 100% Renewable Energy Systems Research. IEEE Access 2022, 10, 78176–78218. [Google Scholar] [CrossRef]
  11. Jacobson, M.Z.; Delucchi, M.A.; Bauer, Z.A.F.; Goodman, S.C.; Chapman, W.E.; Cameron, M.A.; Bozonnat, C.; Chobadi, L.; Clonts, H.A.; Enevoldsen, P.; et al. 100% Clean and Renewable Wind, Water, and Sunlight All-Sector Energy Roadmaps for 139 Countries of the World. Joule 2017, 1, 108–121. [Google Scholar] [CrossRef]
  12. Jacobson, M.Z.; Delucchi, M.A.; Cameron, M.A.; Mathiesen, B.V. Matching demand with supply at low cost in 139 countries among 20 world regions with 100% intermittent wind, water, and sunlight (WWS) for all purposes. Renew. Energy 2018, 123, 236–248. [Google Scholar] [CrossRef]
  13. Olabi, A.; Abdelkareem, M.A. Renewable energy and climate change. Renew. Sustain. Energy Rev. 2022, 158, 112111. [Google Scholar] [CrossRef]
  14. Kung, C.-C.; McCarl, B. Sustainable Energy Development under Climate Change. Sustainability 2018, 10, 3269. [Google Scholar] [CrossRef]
  15. IPCC. The Intergovernmental Panel on Climate Change (IPCC). Available online: https://www.ipcc.ch/ (accessed on 11 July 2023).
  16. Fu, B.; Li, J.; Gasser, T.; Ciais, P.; Piao, S.; Tao, S.; Shen, G.; Lai, Y.; Han, L.; Li, B. Climate Warming Mitigation from Nationally Determined Contributions. Adv. Atmos. Sci. 2022, 39, 1217–1228. [Google Scholar] [CrossRef]
  17. Mahlia, T.; Saktisahdan, T.; Jannifar, A.; Hasan, M.; Matseelar, H. A review of available methods and development on energy storage; technology update. Renew. Sustain. Energy Rev. 2014, 33, 532–545. [Google Scholar] [CrossRef]
  18. Lund, H.; Andersen, A.N.; Østergaard, P.A.; Mathiesen, B.V.; Connolly, D. From electricity smart grids to smart energy systems—A market operation based approach and understanding. Energy 2012, 42, 96–102. [Google Scholar] [CrossRef]
  19. Schirone, L.; Pellitteri, F. Energy Policies and Sustainable Management of Energy Sources. Sustainability 2017, 9, 2321. [Google Scholar] [CrossRef]
  20. Ahmad, S.; Shafiullah; Ahmed, C.B.; Alowaifeer, M. A Review of Microgrid Energy Management and Control Strategies. IEEE Access 2023, 11, 21729–21757. [Google Scholar] [CrossRef]
  21. Olatomiwa, L.; Mekhilef, S.; Ismail, M.; Moghavvemi, M. Energy management strategies in hybrid renewable energy systems: A review. Renew. Sustain. Energy Rev. 2016, 62, 821–835. [Google Scholar] [CrossRef]
  22. Liu, Y.; Yu, S.; Zhu, Y.; Wang, D.; Liu, J. Modeling, planning, application and management of energy systems for isolated areas: A review. Renew. Sustain. Energy Rev. 2018, 82, 460–470. [Google Scholar] [CrossRef]
  23. Schulze, M.; Nehler, H.; Ottosson, M.; Thollander, P. Energy management in industry—A systematic review of previous findings and an integrative conceptual framework. J. Clean. Prod. 2016, 112, 3692–3708. [Google Scholar] [CrossRef]
  24. Oyewo, A.S.; Sterl, S.; Khalili, S.; Breyer, C. Highly renewable energy systems in Africa: Rationale, research, and recommendations. Joule 2023, 7, 1437–1470. [Google Scholar] [CrossRef]
  25. Ritchie, H. Who Has Contributed Most to Global CO2 Emissions? Available online: https://www.ourworldindata.org/contributed-mostt-co2 (accessed on 12 July 2023).
  26. World Bank. Population. Available online: https://data.worldbank.org/indicator/SP.POP.TOTL?end=2022&locations=DZ&start=2002 (accessed on 16 July 2023).
  27. United Nations-Department of Economic and Social Affairs Population Division. World Population Prospects. Available online: https://population.un.org/wpp (accessed on 25 July 2023).
  28. Hagedorn, G.; Loew, T.; Seneviratne, S.I.; Lucht, W.; Beck, M.-L.; Hesse, J.; Knutti, R.; Quaschning, V.; Schleimer, J.-H.; Mattauch, L.; et al. The concerns of the young protesters are justified: A statement by Scientists for Future concerning the protests for more climate protection. GAIA—Ecol. Perspect. Sci. Soc. 2019, 28, 79–87. [Google Scholar] [CrossRef]
  29. Palzer, A.; Henning, H.-M. A comprehensive model for the German electricity and heat sector in a future energy system with a dominant contribution from renewable energy technologies—Part II: Results. Renew. Sustain. Energy Rev. 2014, 30, 1019–1034. [Google Scholar] [CrossRef]
  30. Henning, H.-M.; Palzer, A. A comprehensive model for the German electricity and heat sector in a future energy system with a dominant contribution from renewable energy technologies—Part I: Methodology. Renew. Sustain. Energy Rev. 2014, 30, 1003–1018. [Google Scholar] [CrossRef]
  31. Bamisile, O.; Huang, Q.; Xu, X.; Hu, W.; Liu, W.; Liu, Z.; Chen, Z. An approach for sustainable energy planning towards 100 % electrification of Nigeria by 2030. Energy 2020, 197, 117172. [Google Scholar] [CrossRef]
  32. Jacobson, M.Z. The cost of grid stability with 100 % clean, renewable energy for all purposes when countries are isolated versus interconnected. Renew. Energy 2021, 179, 1065–1075. [Google Scholar] [CrossRef]
  33. Cheng, C.; Blakers, A.; Stocks, M.; Lu, B. 100% renewable energy in Japan. Energy Convers. Manag. 2022, 255, 115299. [Google Scholar] [CrossRef]
  34. Akuru, U.B.; Onukwube, I.E.; Okoro, O.I.; Obe, E.S. Towards 100% renewable energy in Nigeria. Renew. Sustain. Energy Rev. 2017, 71, 943–953. [Google Scholar] [CrossRef]
  35. Johannsen, R.M.; Mathiesen, B.V.; Kermeli, K.; Crijns-Graus, W.; Østergaard, P.A. Exploring pathways to 100% renewable energy in European industry. Energy 2023, 268, 126687. [Google Scholar] [CrossRef]
  36. DGB Group. China’s Journey to 100% Renewable Energy: Opportunities and Challenges; DGB Group: Hoofddorp, The Netherlands, 2022. [Google Scholar]
  37. Oyewo, A.S.; Aghahosseini, A.; Ram, M.; Lohrmann, A.; Breyer, C. Pathway towards achieving 100% renewable electricity by 2050 for South Africa. Sol. Energy 2019, 191, 549–565. [Google Scholar] [CrossRef]
  38. Marocco, P.; Novo, R.; Lanzini, A.; Mattiazzo, G.; Santarelli, M. Towards 100% renewable energy systems: The role of hydrogen and batteries. J. Energy Storage 2023, 57, 106306. [Google Scholar] [CrossRef]
  39. Reyseliani, N.; Purwanto, W.W. Pathway towards 100% renewable energy in Indonesia power system by 2050. Renew. Energy 2021, 176, 305–321. [Google Scholar] [CrossRef]
  40. Ram, M.; Gulagi, A.; Aghahosseini, A.; Bogdanov, D.; Breyer, C. Energy transition in megacities towards 100% renewable energy: A case for Delhi. Renew. Energy 2022, 195, 578–589. [Google Scholar] [CrossRef]
  41. Hansen, K.; Mathiesen, B.V.; Skov, I.R. Full energy system transition towards 100% renewable energy in Germany in 2050. Renew. Sustain. Energy Rev. 2019, 102, 1–13. [Google Scholar] [CrossRef]
  42. Copp, D.A.; Nguyen, T.A.; Byrne, R.H.; Chalamala, B.R. Optimal sizing of distributed energy resources for planning 100% renewable electric power systems. Energy 2021, 239, 122436. [Google Scholar] [CrossRef]
  43. Furubayashi, T. Design and analysis of a 100% renewable energy system for Akita prefecture, Japan. Smart Energy 2021, 2, 100012. [Google Scholar] [CrossRef]
  44. Gulagi, A.; Bogdanov, D.; Breyer, C. The Demand for Storage Technologies in Energy Transition Pathways towards 100% Renewable Energy for India. Energy Procedia 2017, 135, 37–50. [Google Scholar] [CrossRef]
  45. Furubayashi, T. The role of biomass energy in a 100% renewable energy system for Akita prefecture, Japan. Energy Storage Sav. 2022, 1, 148–152. [Google Scholar] [CrossRef]
  46. Cole, W.J.; Greer, D.; Denholm, P.; Frazier, A.W.; Machen, S.; Mai, T.; Vincent, N.; Baldwin, S.F. Quantifying the challenge of reaching a 100% renewable energy power system for the United States. Joule 2021, 5, 1732–1748. [Google Scholar] [CrossRef]
  47. Hohmeyer, O.H.; Bohm, S. Trends toward 100% renewable electricity supply in Germany and Europe: A paradigm shift in energy policies. WIREs Energy Environ. 2014, 4, 74–97. [Google Scholar] [CrossRef]
  48. Ghorbani, N.; Aghahosseini, A.; Breyer, C. Transition towards a 100% Renewable Energy System and the Role of Storage Technologies: A Case Study of Iran. Energy Procedia 2017, 135, 23–36. [Google Scholar] [CrossRef]
  49. Bamisile, O.; Dongsheng, C.; Li, J.; Adun, H.; Olukoya, R.; Bamisile, O.; Huang, Q. Renewable energy and electricity incapacitation in sub-Sahara Africa: Analysis of a 100% renewable electrification in Chad. Energy Rep. 2023, 9, 1–12. [Google Scholar] [CrossRef]
  50. Caldera, U.; Breyer, C. Impact of Battery and Water Storage on the Transition to an Integrated 100% Renewable Energy Power System for Saudi Arabia. Energy Procedia 2017, 135, 126–142. [Google Scholar] [CrossRef]
  51. Caldera, U.; Bogdanov, D.; Afanasyeva, S.; Breyer, C. Role of Seawater Desalination in the Management of an Integrated Water and 100% Renewable Energy Based Power Sector in Saudi Arabia. Water 2017, 10, 3. [Google Scholar] [CrossRef]
  52. Procter, R.J. 100% renewables study has limited relevance for carbon policy. Electr. J. 2018, 31, 67–77. [Google Scholar] [CrossRef]
  53. Ritchie, H.; Roser, M. Energy. 2022. Available online: https://www.ourworldindata.org/energy-access (accessed on 14 August 2023).
  54. International Renewable Energy Agency; European Commission. Renewable Energy Prospects for the European Union; International Renewable Energy Agency (IRENA): Masdar City, Abu Dhabi, 2018. [Google Scholar]
  55. Fritz, L.; Hansmann, R.; Dalimier, B.; Binder, C.R. Perceived impacts of the Fridays for Future climate movement on environmental concern and behaviour in Switzerland. Sustain. Sci. 2023, 18, 2219–2244. [Google Scholar] [CrossRef]
  56. Aghahosseini, A.; Bogdanov, D.; Breyer, C. Towards sustainable development in the MENA region: Analysing the feasibility of a 100% renewable electricity system in 2030. Energy Strategy Rev. 2020, 28, 100466. [Google Scholar] [CrossRef]
  57. Mischke, P.; Karlsson, K.B. Modelling tools to evaluate China’s future energy system—A review of the Chinese perspective. Energy 2014, 69, 132–143. [Google Scholar] [CrossRef]
  58. Ameyaw, B.; Li, Y.; Ma, Y.; Agyeman, J.K.; Appiah-Kubi, J.; Annan, A. Renewable electricity generation proposed pathways for the US and China. Renew. Energy 2021, 170, 212–223. [Google Scholar] [CrossRef]
  59. Maruf, N.I. Open model-based analysis of a 100% renewable and sector-coupled energy system–The case of Germany in 2050. Appl. Energy 2021, 288, 116618. [Google Scholar] [CrossRef]
  60. Stringer, T.; Joanis, M. Assessing energy transition costs: Sub-national challenges in Canada. Energy Policy 2022, 164, 112879. [Google Scholar] [CrossRef]
  61. Vaillancourt, K.; Bahn, O.; Frenette, E.; Sigvaldason, O. Exploring deep decarbonization pathways to 2050 for Canada using an optimization energy model framework. Appl. Energy 2017, 195, 774–785. [Google Scholar] [CrossRef]
  62. Nam, K.; Hwangbo, S.; Yoo, C. A deep learning-based forecasting model for renewable energy scenarios to guide sustainable energy policy: A case study of Korea. Renew. Sustain. Energy Rev. 2020, 122, 109725. [Google Scholar] [CrossRef]
  63. Kharrich, M.; Selim, A.; Kamel, S.; Kim, J. An effective design of hybrid renewable energy system using an improved Archimedes Optimization Algorithm: A case study of Farafra, Egypt. Energy Convers. Manag. 2023, 283. [Google Scholar] [CrossRef]
  64. Saiah, S.B.D.; Stambouli, A.B. Prospective analysis for a long-term optimal energy mix planning in Algeria: Towards high electricity generation security in 2062. Renew. Sustain. Energy Rev. 2017, 73, 26–43. [Google Scholar] [CrossRef]
  65. Oyewo, A.S.; Aghahosseini, A.; Bogdanov, D.; Breyer, C. Pathways to a fully sustainable electricity supply for Nigeria in the mid-term future. Energy Convers. Manag. 2018, 178, 44–64. [Google Scholar] [CrossRef]
  66. Liu, W.; Lund, H.; Mathiesen, B.V.; Zhang, X. Potential of renewable energy systems in China. Appl. Energy 2011, 88, 518–525. [Google Scholar] [CrossRef]
  67. Chen, X.; Xiao, J.; Yuan, J.; Xiao, Z.; Gang, W. Application and performance analysis of 100% renewable energy systems serving low-density communities. Renew. Energy 2021, 176, 433–446. [Google Scholar] [CrossRef]
  68. Zhao, G.; Guerrero, J.M.; Jiang, K.; Chen, S. Energy modelling towards low carbon development of Beijing in 2030. Energy 2017, 121, 107–113. [Google Scholar] [CrossRef]
  69. Bogdanov, D.; Koskinen, O.; Aghahosseini, A.; Breyer, C. Integrated renewable energy based power system for Europe, Eurasia and MENA regions. In Proceedings of the 2016 International Energy and Sustainability Conference (IESC), Cologne, Germany, 30 June–1 July 2016. [Google Scholar]
  70. Ahmed, A.S. Analysis the economics of sustainable electricity by wind and its future perspective. J. Clean. Prod. 2019, 224, 729–738. [Google Scholar] [CrossRef]
  71. Daniel, R.; Yuqi, Z.; Richard, G.N.; Brian, C.P.; Aaron, B. Global Energy Outlook 2023: Sowing the Seeds of an Energy Transition; Resources for the Future: Washington, DC, USA, 2023. [Google Scholar]
  72. IEA. Energy Technology Perspectives 2023. 2023. Available online: https://www.iea.org/reports/energy-technology-perspectives-2023 (accessed on 27 May 2023).
  73. Government of the Republic of South Africa. South Africa’s Just Energy Transition Investment Plan (JET IP). 2023. Available online: https://www.thepresidency.gov.za/content/south-africa%27s-just-energy-transition-investment-plan-jet-ip-2023-2027 (accessed on 29 May 2023).
  74. Green Hydrogen in China: A Roadmap for Progress. 2023. Available online: https://www.weforum.org/whitepapers/green-hydrogen-in-china-a-roadmap-for-progress (accessed on 22 July 2023).
  75. Government of India. National Green Hydrogen Mission. 2023. Available online: https://www.iea.org/reports/india-energy-outlook-2021 (accessed on 30 May 2023).
  76. Montenegro, R.C.; Fragkos, P.; Dobbins, A.H.; Schmid, D.; Pye, S.; Fahl, U. Beyond the Energy System: Modeling Frameworks Depicting Distributional Impacts for Interdisciplinary Policy Analysis. Energy Technol. 2020, 9. [Google Scholar] [CrossRef]
  77. Scheller, F.; Bruckner, T. Energy system optimization at the municipal level: An analysis of modeling approaches and challenges. Renew. Sustain. Energy Rev. 2019, 105, 444–461. [Google Scholar] [CrossRef]
  78. Li, H.; Ren, Z.; Fan, M.; Li, W.; Xu, Y.; Jiang, Y.; Xia, W. A review of scenario analysis methods in planning and operation of modern power systems: Methodologies, applications, and challenges. Electr. Power Syst. Res. 2022, 205. [Google Scholar] [CrossRef]
  79. Hiremath, R.; Shikha, S.; Ravindranath, N. Decentralized energy planning; modeling and application—A review. Renew. Sustain. Energy Rev. 2007, 11, 729–752. [Google Scholar] [CrossRef]
  80. Huang, Z.; Yu, H.; Peng, Z.; Zhao, M. Methods and tools for community energy planning: A review. Renew. Sustain. Energy Rev. 2014, 42, 1335–1348. [Google Scholar] [CrossRef]
  81. Gamarra, C.; Guerrero, J.M.; Montero, E. A knowledge discovery in databases approach for industrial microgrid planning. Renew. Sustain. Energy Rev. 2016, 60, 615–630. [Google Scholar] [CrossRef]
  82. Jung, J.; Villaran, M. Optimal planning and design of hybrid renewable energy systems for microgrids. Renew. Sustain. Energy Rev. 2017, 75, 180–191. [Google Scholar] [CrossRef]
  83. McGookin, C.; Gallachóir, B.; Byrne, E. Participatory methods in energy system modelling and planning—A review. Renew. Sustain. Energy Rev. 2021, 151, 111504. [Google Scholar] [CrossRef]
  84. Deng, X.; Lv, T. Power system planning with increasing variable renewable energy: A review of optimization models. J. Clean. Prod. 2020, 246, 118962. [Google Scholar] [CrossRef]
  85. Biel, K.; Glock, C.H. Systematic literature review of decision support models for energy-efficient production planning. Comput. Ind. Eng. 2016, 101, 243–259. [Google Scholar] [CrossRef]
  86. Suryani, E.; Hendrawan, R.A.; Faster, E.A.P.; Dewi, L.P. A Simulation Model for Strategic Planning in Asset Management of Electricity Distribution Network. In ICSIIT 2015: Intelligence in the Era of Big Data; Springer: Berlin/Heidelberg, Germany, 2015; Volume 516. [Google Scholar] [CrossRef]
  87. Pohekar, S.; Ramachandran, M. Application of multi-criteria decision making to sustainable energy planning—A review. Renew. Sustain. Energy Rev. 2004, 8, 365–381. [Google Scholar] [CrossRef]
  88. Lund, H.; Thellufsen, J.Z.; Østergaard, P.A.; Sorknæs, P.; Skov, I.R.; Mathiesen, B.V. EnergyPLAN—Advanced analysis of smart energy systems. Smart Energy 2021, 1, 100007. [Google Scholar] [CrossRef]
  89. Zhang, K.Q.; Chen, H.H.; Tang, L.Z.; Qiao, S. Green Finance, Innovation and the Energy-Environment-Climate Nexus. Front. Environ. Sci. 2022, 10, 879681. [Google Scholar] [CrossRef]
  90. Dincer, I. Energy and GDP analysis of OECD countries. Energy Convers. Manag. 1997, 38, 685–696. [Google Scholar] [CrossRef]
  91. IRENA. World Energy Transitions Outlook 2023: 1.5 °C Pathway; Preview. 2023. Available online: www.irena.org (accessed on 22 July 2023).
  92. Rosen, M.A. Energy Sustainability with a Focus on Environmental Perspectives. Earth Syst. Environ. 2021, 5, 217–230. [Google Scholar] [CrossRef] [PubMed]
  93. Keirstead, J.; Jennings, M.; Sivakumar, A. A review of urban energy system models: Approaches, challenges and opportunities. Renew. Sustain. Energy Rev. 2012, 16, 3847–3866. [Google Scholar] [CrossRef]
  94. Mohammadi, M.; Noorollahi, Y.; Mohammadi-Ivatloo, B.; Yousefi, H. Energy hub: From a model to a concept—A review. Renew. Sustain. Energy Rev. 2017, 80, 1512–1527. [Google Scholar] [CrossRef]
  95. Lee, C.W.; Zhong, J. Construction of a responsible investment composite index for renewable energy industry. Renew. Sustain. Energy Rev. 2015, 51, 288–303. [Google Scholar] [CrossRef]
  96. Hannan, M.; Wali, S.; Ker, P.; Rahman, M.A.; Mansor, M.; Ramachandaramurthy, V.; Muttaqi, K.; Mahlia, T.; Dong, Z. Battery energy-storage system: A review of technologies, optimization objectives, constraints, approaches, and outstanding issues. J. Energy Storage 2021, 42, 103023. [Google Scholar] [CrossRef]
  97. Baños, R.; Manzano-Agugliaro, F.; Montoya, F.; Gil, C.; Alcayde, A.; Gómez, J. Optimization methods applied to renewable and sustainable energy: A review. Renew. Sustain. Energy Rev. 2011, 15, 1753–1766. [Google Scholar] [CrossRef]
  98. Bataille, C.G.F. Design and Application of a Technologically Explicit Hybrid Energy-Economy Policy Model with Micro and Macroeconomic Dynamic. Simon Fraser University: Burnaby, British Columbia, 2005. Available online: http://summit.sfu.ca/item/4519 (accessed on 22 May 2023).
  99. Woo, C.; Chung, Y.; Chun, D.; Seo, H.; Hong, S. The static and dynamic environmental efficiency of renewable energy: A Malmquist index analysis of OECD countries. Renew. Sustain. Energy Rev. 2015, 47, 367–376. [Google Scholar] [CrossRef]
  100. Perissi, I.; Martelloni, G.; Bardi, U.; Natalini, D.; Jones, A.; Nikolaev, A.; Eggler, L.; Baumann, M.; Samsó, R.; Solé, J. Cross-validation of the MEDEAS energy-economy- environment model with the integrated MARKAL-EFOM system (TIMES) and the long-range energy alternatives planning system (LEAP). Sustainability 2021, 13, 1967. [Google Scholar] [CrossRef]
  101. Diemuodeke, E.O.; Hamilton, S.; Addo, A. Multi-criteria assessment of hybrid renewable energy systems for Nigeria’s coastline communities. Energy Sustain. Soc. 2016, 6, 26. [Google Scholar] [CrossRef]
  102. Schinko, T.; Bohm, S.; Komendantova, N.; Jamea, E.M.; Blohm, M. Morocco’s sustainable energy transition and the role of financing costs: A participatory electricity system modeling approach. Energy Sustain. Soc. 2019, 9, 1. [Google Scholar] [CrossRef]
  103. Nyandwi, A.; Gupta, A.; Kumar, D.; Ved, A. Design Optimization Analysis Based on Demand Side Management of a Stand-alone Hybrid Power System Using Genetic Algorithm for Remote Rural Electrification. In Proceedings of the 3rd International Conference on Energy, Power and Environment: Towards Clean Energy Technologies, ICEPE 2020, Shillong, India, 5–7 March 2021. [Google Scholar] [CrossRef]
  104. Kriechbaum, L.; Scheiber, G.; Kienberger, T. Grid-based multi-energy systems—Modelling, assessment, open source modelling frameworks and challenges. Energy Sustain. Soc. 2018, 8, 35. [Google Scholar] [CrossRef]
  105. Bolwig, S.; Bazbauers, G.; Klitkou, A.; Lund, P.D.; Blumberga, A.; Gravelsins, A.; Blumberga, D. Review of modelling energy transitions pathways with application to energy system flexibility. Renew. Sustain. Energy Rev. 2019, 101, 440–452. [Google Scholar] [CrossRef]
  106. Fleiter, T.; Worrell, E.; Eichhammer, W. Barriers to energy efficiency in industrial bottom-up energy demand models—A review. Renew. Sustain. Energy Rev. 2011, 15, 3099–3111. [Google Scholar] [CrossRef]
  107. Cao, M.; Shao, C.; Hu, B.; Xie, K.; Li, W.; Peng, L.; Zhang, W. Reliability Assessment of Integrated Energy Systems Considering Emergency Dispatch Based on Dynamic Optimal Energy Flow. IEEE Trans. Sustain. Energy 2021, 13, 290–301. [Google Scholar] [CrossRef]
  108. Slišāne, D.; Gaumigs, G.; Lauka, D.; Blumberga, D. Assessment of Energy Sustainability in Statistical Regions of Latvia using Energy Sustainability Index. Environ. Clim. Technol. 2020, 24, 160–169. [Google Scholar] [CrossRef]
  109. Müller, B.; Gardumi, F.; Hülk, L. Comprehensive representation of models for energy system analyses: Insights from the Energy Modelling Platform for Europe (EMP-E) 2017. Energy Strat. Rev. 2018, 21, 82–87. [Google Scholar] [CrossRef]
  110. Pezzini, P.; Gomis-Bellmunt, O.; Sudrià-Andreu, A. Optimization techniques to improve energy efficiency in power systems. Renew. Sustain. Energy Rev. 2011, 15, 2028–2041. [Google Scholar] [CrossRef]
  111. Lai, C.S.; Locatelli, G.; Pimm, A.; Wu, X.; Lai, L.L. A review on long-term electrical power system modeling with energy storage. J. Clean. Prod. 2020, 280, 124298. [Google Scholar] [CrossRef]
  112. Koltsaklis, N.E.; Dagoumas, A.S.; Kopanos, G.M.; Pistikopoulos, E.N.; Georgiadis, M.C. A spatial multi-period long-term energy planning model: A case study of the Greek power system. Appl. Energy 2013, 115, 456–482. [Google Scholar] [CrossRef]
  113. United Department of States and Executive Office of the President. The Long-Term Strategy of the United States, Pathways to Net-Zero Greenhouse Gas Emissions by 2050. 2021. Available online: http://whitehouse.gov/wp-content/uploads/2021/10/US-Long-Term-Strategy.pdf (accessed on 3 August 2023).
  114. Zelt, O.; Krüger, C.; Blohm, M.; Bohm, S.; Far, S. Long-Term Electricity Scenarios for the MENA Region: Assessing the Preferences of Local Stakeholders Using Multi-Criteria Analyses. Energies 2019, 12, 3046. [Google Scholar] [CrossRef]
  115. Radpour, S.; Gemechu, E.; Ahiduzzaman; Kumar, A. Developing a framework to assess the long-term adoption of renewable energy technologies in the electric power sector: The effects of carbon price and economic incentives. Renew. Sustain. Energy Rev. 2021, 152, 111663. [Google Scholar] [CrossRef]
  116. Bistline, J.; Cole, W.; Damato, G.; DeCarolis, J.; Frazier, W.; Linga, V.; Marcy, C.; Namovicz, C.; Podkaminer, K.; Sims, R.; et al. Energy storage in long-term system models: A review of considerations, best practices, and research needs. Prog. Energy 2020, 2, 032001, Erratum in Prog. Energy 2020, 2, 039601. [Google Scholar] [CrossRef]
  117. Phillips, K.; Moncada, J.; Ergun, H.; Delarue, E. Spatial representation of renewable technologies in generation expansion planning models. Appl. Energy 2023, 342, 121092. [Google Scholar] [CrossRef]
  118. Fattahi, A.; Sijm, J.; Faaij, A. A systemic approach to analyze integrated energy system modeling tools: A review of national models. Renew. Sustain. Energy Rev. 2020, 133, 110195. [Google Scholar] [CrossRef] [PubMed]
  119. Sinha, S.; Chandel, S. Review of software tools for hybrid renewable energy systems. Renew. Sustain. Energy Rev. 2014, 32, 192–205. [Google Scholar] [CrossRef]
  120. Ferrando, M.; Causone, F.; Hong, T.; Chen, Y. Urban building energy modeling (UBEM) tools: A state-of-the-art review of bottom-up physics-based approaches. Sustain. Cities Soc. 2020, 62, 102408. [Google Scholar] [CrossRef]
  121. Ringkjøb, H.-K.; Haugan, P.M.; Solbrekke, I.M. A review of modelling tools for energy and electricity systems with large shares of variable renewables. Renew. Sustain. Energy Rev. 2018, 96, 440–459. [Google Scholar] [CrossRef]
  122. Allegrini, J.; Orehounig, K.; Mavromatidis, G.; Ruesch, F.; Dorer, V.; Evins, R. A review of modelling approaches and tools for the simulation of district-scale energy systems. Renew. Sustain. Energy Rev. 2015, 52, 1391–1404. [Google Scholar] [CrossRef]
  123. Connolly, D.; Lund, H.; Mathiesen, B.; Leahy, M. A review of computer tools for analysing the integration of renewable energy into various energy systems. Appl. Energy 2010, 87, 1059–1082. [Google Scholar] [CrossRef]
  124. Zhu, J.; Dong, H.; Zheng, W.; Li, S.; Huang, Y.; Xi, L. Review and prospect of data-driven techniques for load forecasting in integrated energy systems. Appl. Energy 2022, 321. [Google Scholar] [CrossRef]
  125. Fong, W.-K.; Matsumoto, H.; Lun, Y.-F. Establishment of city level carbon dioxide emission baseline database and carbon budgets for developing countries with data constraints. J. Asian Archit. Build. Eng. 2008, 7, 403–410. [Google Scholar] [CrossRef]
  126. Doukas, H.; Papadopoulou, A.G.; Nychtis, C.; Psarras, J.; van Beeck, N. Energy research and technology development data collection strategies: The case of Greece. Renew. Sustain. Energy Rev. 2009, 13, 682–688. [Google Scholar] [CrossRef]
  127. Zhang, X.; Patino-Echeverri, D.; Li, M.; Wu, L. A review of publicly available data sources for models to study renewables integration in China’s power system. Renew. Sustain. Energy Rev. 2022, 159, 112215. [Google Scholar] [CrossRef]
  128. Chang, M.; Thellufsen, J.Z.; Zakeri, B.; Pickering, B.; Pfenninger, S.; Lund, H.; Østergaard, P.A. Trends in tools and approaches for modelling the energy transition. Appl. Energy 2021, 290, 116731. [Google Scholar] [CrossRef]
  129. Ajmi, A.N.; El Montasser, G.; Nguyen, D.K. Testing the relationships between energy consumption and income in G7 countries with nonlinear causality tests. Econ. Model. 2013, 35, 126–133. [Google Scholar] [CrossRef]
  130. Oskouei, M.Z.; Mohammadi-Ivatloo, B. Integration of Renewable Energy Sources into the Power Grid through PowerFactory; Springer: Cham, Switzerland, 2020. [Google Scholar] [CrossRef]
  131. Simoglou, C.K.; Bakirtzis, E.A.; Biskas, P.N.; Bakirtzis, A.G. Optimal operation of insular electricity grids under high RES penetration. Renew. Energy 2016, 86, 1308–1316. [Google Scholar] [CrossRef]
  132. Kondziella, H.; Bruckner, T. Flexibility requirements of renewable energy based electricity systems—A review of research results and methodologies. Renew. Sustain. Energy Rev. 2016, 53, 10–22. [Google Scholar] [CrossRef]
  133. Weitemeyer, S.; Kleinhans, D.; Vogt, T.; Agert, C. Integration of Renewable Energy Sources in future power systems: The role of storage. Renew. Energy 2015, 75, 14–20. [Google Scholar] [CrossRef]
  134. Anees, A.S. Grid Integration of Renewable Energy Sources-Challenges, Issues and Possible Solutions. In Proceedings of the IEEE 5th India International Conference on Power Electronics (IICPE), Delhi, India, 6–8 December 2012. [Google Scholar] [CrossRef]
  135. Behboodi, S.; Chassin, D.P.; Djilali, N.; Crawford, C. Interconnection-wide hour-ahead scheduling in the presence of intermittent renewables and demand response: A surplus maximizing approach. Appl. Energy 2017, 189, 336–351. [Google Scholar] [CrossRef]
  136. Liang, X. Emerging Power Quality Challenges Due to Integration of Renewable Energy Sources. IEEE Trans. Ind. Appl. 2017, 53, 855–866. [Google Scholar] [CrossRef]
  137. American Council for Energy Efficient Economy (ACEEE). Understanding Energy Affordability. 2016. Available online: https://www.aceee.org/sites/default/files/energy-affordability.pdf (accessed on 10 September 2023).
  138. Mitra, S.; Buluswar, S. Universal Access to Electricity: Closing the Affordability Gap. Annu. Rev. Environ. Resour. 2015, 40, 261–283. [Google Scholar] [CrossRef]
  139. Kabeyi, M.J.B.; Olanrewaju, O.A. The levelized cost of energy and modifications for use in electricity generation planning. Energy Rep. 2023, 9, 495–534. [Google Scholar] [CrossRef]
  140. Chik, S.; Brent, A.; De Kock, I.H. Critical review of the levelised cost of energy metric. S. Afr. J. Ind. Eng. 2016, 27, 124–133. [Google Scholar] [CrossRef]
  141. Kost, C.; Shammugam, S.; Jülch, V.; Nguyen, H.-T.; Schlegl, T. Levelized Cost of Electricity Renewable Energy Technologies. 2018. Available online: www.ise.fraunhofer.de (accessed on 22 June 2023).
  142. IEA. Global Energy and Climate Model-Techno-Economic Inputs. 2022. Available online: https://www.iea.org/reports/global-energy-and-climate-model (accessed on 4 July 2023).
  143. Roth, I.F.; Ambs, L.L. Incorporating externalities into a full cost approach to electric power generation life-cycle costing. Energy 2004, 29, 2125–2144. [Google Scholar] [CrossRef]
  144. Rentizelas, A.; Georgakellos, D. Incorporating life cycle external cost in optimization of the electricity generation mix. Energy Policy 2014, 65, 134–149. [Google Scholar] [CrossRef]
  145. Pehl, M.; Arvesen, A.; Humpenöder, F.; Popp, A.; Hertwich, E.G.; Luderer, G. Understanding future emissions from low-carbon power systems by integration of life-cycle assessment and integrated energy modelling. Nat. Energy 2017, 2, 939–945. [Google Scholar] [CrossRef]
  146. Akpan, J.; Olanrewaju, O.; Irusta, R. A State-of-the-Art Approach for Assessing the Environmental Sustainability of Multi-Renewable Energy Systems in the Built Environment; Green Energy Technology Book Series; Springer Nature: Berlin/Heidelberg, Germany, 2023. [Google Scholar]
  147. UNFCCC. Clean Development Mechanism-Methodological Tool to Calculate the Emission Factor for an Electricity System. 2018. Available online: https://cdm.unfccc.int/methodologies/PAmethodologies/tools/am-tool-07-v1.1.pdf/history_view (accessed on 22 May 2023).
  148. IPCC. Energy—IPCC Good Practice Guidance and Uncertainty Management in National Greenhouse Gas Inventories. IPCC. 2006. Available online: https://www.ipcc.ch/publication/good-practice-guidance-and-uncertainty-management-in-national-greenhouse-gas-inventories (accessed on 22 May 2023).
  149. IPCC. Refinement to the 2006 IPCC Guidelines for National Greenhouse Gas Inventories-Overview. 2019. Available online: https://www.ipcc.ch/report/2019-refinement-to-the-2006-ipcc-guidelines-for-national-greenhouse-gas-inventories (accessed on 24 May 2023).
  150. AS ISO 14040:2019; Environmental Management—Life Cycle Assessment—Principles and Framework. Standards Australia: Sydney, Australia, 2019.
  151. ISO 14044; Environmental Management-Life Cycle Assessment-Requirements and Guidelines Management Environmental. 2nd ed. European Committee for Standardization (CEN): Brussel, Belgium, 2006.
  152. Jacobson, M.Z.; Delucchi, M.A. A Path to Sustainable Energy by 2030. Sci. Am. 2009, 301, 58–65. [Google Scholar] [CrossRef]
  153. Jacobson, M.Z.; Delucchi, M.A. Providing all global energy with wind, water, and solar power, Part I: Technologies, energy resources, quantities and areas of infrastructure, and materials. Energy Policy 2011, 39, 1154–1169. [Google Scholar] [CrossRef]
  154. Delucchi, M.A.; Jacobson, M.Z. Providing all global energy with wind, water, and solar power, Part II: Reliability, system and transmission costs, and policies. Energy Policy 2011, 39, 1170–1190. [Google Scholar] [CrossRef]
  155. Jacobson, M.Z.; von Krauland, A.-K.; Coughlin, S.J.; Dukas, E.; Nelson, A.J.H.; Palmer, F.C.; Rasmussen, K.R. Low-cost solutions to global warming, air pollution, and energy insecurity for 145 countries. Energy Environ. Sci. 2022, 15, 3343–3359. [Google Scholar] [CrossRef]
  156. Rai, V. Integration, coordination, and regulatory resources: Keys to electricity system resilience. Electr. J. 2023, 36, 107256. [Google Scholar] [CrossRef]
  157. Zhang, Y.; Zhao, H.; Li, B. Research on the design and influence of unit generation capacity adequacy guarantee mechanism in the power market. Energy 2022, 248, 123658. [Google Scholar] [CrossRef]
  158. Krupenev, D.S.; Boyarkin, D.A.; Iakubovskii, D.V. Development of a methodology for assessing the adequacy of electric power systems. Glob. Energy Interconnect. 2022, 5, 543–550. [Google Scholar] [CrossRef]
  159. Larsen, E.; van Ackere, A. Importing from? Capacity adequacy in a European context. Electr. J. 2023, 36, 107236. [Google Scholar] [CrossRef]
  160. Almutairi, A.; Ahmed, M.H.; Salama, M. Probabilistic generating capacity adequacy evaluation: Research roadmap. Electr. Power Syst. Res. 2015, 129, 83–93. [Google Scholar] [CrossRef]
  161. Castro, P.F.; Rodriguez, Y.P.M.; Carvalho, F.B.S. Application of Generation Adequacy Analysis for Reliability Evaluation of a Floating Production Storage and Offloading Platform Power System. Energies 2022, 15, 5336. [Google Scholar] [CrossRef]
  162. Renuga, P.; Ramaraj, N.; Primrose, A. Frequency and Duration Method for Reliability Evaluation of Large Scale Power Generation System by Fast Fourier Transform Technique. J. Energy Environ. 2006, 5, 94–100. [Google Scholar]
  163. Billinton, R.; Allan, R.N. Reliability Evaluation of Power Systems, 1st ed.; Springer: New York, NY, USA, 1996. [Google Scholar]
  164. Mehrtash, A.; Wang, P.; Goel, L. Reliability Evaluation of Generation System Incorporating Renewable Generators in a Spot Power Market. In Proceedings of the IEEE Power and Energy Society General Meeting, Detroit, MI, USA, 24–28 July 2011; pp. 1–6. [Google Scholar]
  165. El-Ela, A.A.A.; El-Sehiemy, R.A.; Abbas, A.S.; Fetyan, K.K. Hosting Capacity Assessment of Renewable Energy Resources in Distribution Systems. In Proceedings of the 22nd International Middle East Power Systems Conference, MEPCON 2021–Proceedings, Assiut, Egypt, 14–16 December 2021; pp. 294–299. [Google Scholar] [CrossRef]
  166. Suchithra, J.; Robinson, D.; Rajabi, A. Hosting Capacity Assessment Strategies and Reinforcement Learning Methods for Coordinated Voltage Control in Electricity Distribution Networks: A Review. Energies 2023, 16, 2371. [Google Scholar] [CrossRef]
  167. IPCC. Summary for Policymakers in Climate Change 2023: Synthesis Report; IPCC: Geneva, Switzerland, 2023. Available online: https://www.ipcc.ch/report/ar6/syr/downloads/report/IPCC_AR6_SYR_SPM.pdf (accessed on 22 July 2023).
  168. Felder, F.; Kumar, P. A review of existing deep decarbonization models and their potential in policymaking. Renew. Sustain. Energy Rev. 2021, 152, 111655. [Google Scholar] [CrossRef]
  169. Epule, T.E.; Chehbouni, A.; Dhiba, D.; Moto, M.W.; Peng, C. African climate change policy performance index. Environ. Sustain. Indic. 2021, 12, 100163. [Google Scholar] [CrossRef]
  170. Streimikiene, D.; Šivickas, G. The EU sustainable energy policy indicators framework. Environ. Int. 2008, 34, 1227–1240. [Google Scholar] [CrossRef] [PubMed]
  171. Meyar-Naimi, H.; Vaez-Zadeh, S. Sustainable development based energy policy making frameworks, a critical review. Energy Policy 2012, 43, 351–361. [Google Scholar] [CrossRef]
  172. Ciegis, R.; Mikalauskiene, A.; Pusinaite, R. Application of Environmental Policy Instruments in the Implementation of Sustainable Energy Development: Climate Change Mitigation. Transform. Bus. Econ. 2012, 11, 111–123. [Google Scholar]
  173. Dickau, M.; Matthews, H.D.; Tokarska, K.B. The Role of Remaining Carbon Budgets and Net-Zero CO2 Targets in Climate Mitigation Policy. Curr. Clim. Chang. Rep. 2022, 8, 91–103. [Google Scholar] [CrossRef]
  174. Karakosta, C.; Doukas, H.; Psarras, J. Technology transfer through climate change: Setting a sustainable energy pattern. Renew. Sustain. Energy Rev. 2010, 14, 1546–1557. [Google Scholar] [CrossRef]
  175. UN. Kyoto Protocol to the United Nations Framework Convention on Climate Change. 1998. Available online: https://unfccc.int/resource/docs/convkp/kpeng.pdf (accessed on 22 May 2023).
  176. Samal, R.K.; Kansal, M.L. Sustainable Development Contribution Assessment of Renewable Energy Projects using AHP and Compromise Programming Techniques. In Proceeding of the International Conference on Energy, Power and Environment: Towards Sustainable Growth (ICEPE), Shillong, India, 12–13 June 2015; pp. 1–6. [Google Scholar] [CrossRef]
  177. UNFCCC. Conference of the Parties (COP). Available online: https://unfccc.int/process/bodies/supreme-bodies/conference-of-the-parties-cop (accessed on 11 July 2023).
  178. Lahn, B. A history of the global carbon budget. WIREs Clim. Chang. 2020, 11, e636. [Google Scholar] [CrossRef]
  179. Ehlers, T.; Mojon, B.; Packer, F. Green bonds and carbon emissions: Exploring the case for a rating system at the firm-level. BIS Q. Rev. 2020. [Google Scholar]
  180. EnergyPLAN. EnergyPLAN—Advanced Analysis of Smart Energy Systems. Available online: https://www.energyplan.eu (accessed on 9 August 2023).
  181. Tovar-Facio, J.; Martín, M.; Ponce-Ortega, J.M. Sustainable energy transition: Modeling and optimization. Curr. Opin. Chem. Eng. 2021, 31, 100661. [Google Scholar] [CrossRef]
  182. Laha, P.; Chakraborty, B. Energy model—A tool for preventing energy dysfunction. Renew. Sustain. Energy Rev. 2017, 73, 95–114. [Google Scholar] [CrossRef]
  183. Guerra, G.; Martinez-Velasco, J.A. A review of tools, models and techniques for long-term assessment of distribution systems using OpenDSS and parallel computing. AIMS Energy 2018, 6, 764–800. [Google Scholar] [CrossRef]
  184. Nangia, R. Securing Asia’s energy future with regional integration. Energy Policy 2019, 132, 1262–1273. [Google Scholar] [CrossRef]
  185. Dioha, M.O.; Abraham-Dukuma, M.C.; Bogado, N.; Okpaleke, F.N. Supporting climate policy with effective energy modelling: A perspective on the varying technical capacity of South Africa, China, Germany and the United States. Energy Res. Soc. Sci. 2020, 69, 101759. [Google Scholar] [CrossRef]
  186. Remy, T.; Chattopadhyay, D. Promoting better economics, renewables and CO2 reduction through trade: A case study for the Eastern Africa Power Pool. Energy Sustain. Dev. 2020, 57, 81–97. [Google Scholar] [CrossRef]
  187. Luderer, G.; Madeddu, S.; Merfort, L.; Ueckerdt, F.; Pehl, M.; Pietzcker, R.; Rottoli, M.; Schreyer, F.; Bauer, N.; Baumstark, L.; et al. Impact of declining renewable energy costs on electrification in low-emission scenarios. Nat. Energy 2022, 7, 32–42. [Google Scholar] [CrossRef]
  188. Musonye, X.S.; Davíðsdóttir, B.; Kristjánsson, R.; Ásgeirsson, E.I.; Stefánsson, H. Integrated energy systems’ modeling studies for sub-Saharan Africa: A scoping review. Renew. Sustain. Energy Rev. 2020, 128, 109915. [Google Scholar] [CrossRef]
  189. Aniebo, I.N.; Akpan, J.S. Energy Transition: Implications, Considerations, and Roadmap Development for Sub-Saharan Africa. In Proceedings of the SPE Nigeria Annual International Conference and Exhibition, Lagos, Nigeria, 1–3 August 2022. [Google Scholar] [CrossRef]
  190. Elzen, M.G.J.D.; Dafnomilis, I.; Forsell, N.; Fragkos, P.; Fragkiadakis, K.; Höhne, N.; Kuramochi, T.; Nascimento, L.; Roelfsema, M.; van Soest, H.; et al. Updated nationally determined contributions collectively raise ambition levels but need strengthening further to keep Paris goals within reach. Mitig. Adapt. Strat. Glob. Chang. 2022, 27, 1–29. [Google Scholar] [CrossRef]
  191. Capellán-Pérez, I.; de Blas, I.; Nieto, J.; de Castro, C.; Miguel, L.J.; Carpintero, O.; Mediavilla, M.; Lobejón, L.F.; Ferreras-Alonso, N.; Rodrigo, P.; et al. MEDEAS: A new modeling framework integrating global biophysical and socioeconomic constraints. Energy Environ. Sci. 2020, 13, 986–1017. [Google Scholar] [CrossRef]
  192. Climate Interactive. Tools for a Thriving Future. Available online: https://www.climateinteractive.org/ (accessed on 12 August 2023).
  193. Morrison, R. Energy system modeling: Public transparency, scientific reproducibility, and open development. Energy Strat. Rev. 2018, 20, 49–63. [Google Scholar] [CrossRef]
  194. Dioha, M.; Mutiso, R. Generating Meaningful Energy Systems Models for Africa. Issues Sci. Technol. 2023, 29, 54–57. [Google Scholar] [CrossRef]
  195. UNEP. Environmental Law Guidelines and Principles 1-Stockholm Declaration. 1972. Available online: https://wedocs.unep.org/bitstream/handle/20.500.11822/29567/ELGP1StockD.pdf (accessed on 21 May 2023).
  196. Sørensen, B. Energy and Resources. Science 1979, 189, 4199. [Google Scholar]
  197. RMI. Energy Strategy: The Road Not Taken? 1977. Available online: https://rmi.org/insight/energy-strategy-the-road-not-taken/ (accessed on 21 May 2023).
  198. Lovins, A.B. Long-term Constraints on Human Activity. 1976. Available online: https://about.jstor.org/terms (accessed on 24 May 2023).
  199. IEA. Greenhouse Gas Emissions from Energy Highlights. 2022. Available online: https://www.iea.org/data-and-statistics/data-product/greenhouse-gas-emissions-from-energy-highlights (accessed on 20 May 2023).
  200. IEA. International Energy Agency (IEA). 2023. Available online: https://www.iea.org/ (accessed on 20 May 2023).
  201. World Commission on Environment and Development. Our Common Future: Towards Sustainable Development. 1987. Available online: https://sustainabledevelopment.un.org/content/documents/5987our-common-future.pdf (accessed on 21 May 2023).
  202. IPCC. IPCC. Berlin. 2023. Available online: https://www.ipcc.ch/ (accessed on 21 May 2023).
  203. Goldemberg, J.; United Nations Development Programme, United Nations. Department of Economic and Social Affairs, World Energy Council, World Energy Assessment: Energy and the Challenge of Sustainability. United Nations Development Programme. 2000. Available online: https://www.undp.org/sites/g/files/zskgke326/files/publications/World%20Energy%20Assessment-2000.pdf (accessed on 20 May 2023).
  204. UNFCCC. United Nations Framework Convention on Climate Change. 2023. Available online: https://unfccc.int/resource/docs/convkp/conveng.pdf (accessed on 20 May 2023).
  205. Lazarus, M.; Greber, L.; Bartels, C.; Bernow, S.; Hansen, E.; Raskin, P.; Hippel, D. Towards a Fossil Free Energy Future—A Technical Analysis for GreenPeace International; Stockholm Environment Institute: Boston, MA, USA, 1993. [Google Scholar]
  206. Sorensen, B. Scenarios for Greenhouse Warming Mitigation. Energy Convers. Manag. 1996, 37, 693–698. [Google Scholar] [CrossRef]
  207. UN. Resolution and Discussions adopted by the General Assembly during it 51st session. 1997. Available online: https://documents-dds-ny.un.org/doc/UNDOC/GEN/N97/776/11/IMG/N9777611.pdf?OpenElement (accessed on 20 May 2023).
  208. United Nations. A/RES/55/2: United Nations Millennium Declaration. 2000. Available online: https://www.un.org/en/development/desa/population/migration/generalassembly/docs/globalcompact/A_RES_55_2.pdf (accessed on 20 May 2023).
  209. Guidelines for Major Groups on CSD 9. 2000. Available online: http://www.un.org/esa/sustdev/ (accessed on 15 June 2023).
  210. United Nations. Report of the World Summit on Sustainable Development: Johannesburg; United Nations: New York, NY, USA, 2002. [Google Scholar]
  211. Lund, H. Renewable energy strategies for sustainable development. Energy 2007, 32, 912–919. [Google Scholar] [CrossRef]
  212. Brown, T.W.; Bischof-Niemz, T.; Blok, K.; Breyer, C.; Lund, H.; Mathiesen, B.V. Response to ‘Burden of proof: A comprehensive review of the feasibility of 100% renewable-electricity systems. Renew. Sustain. Energy Rev. 2018, 92, 834–847. [Google Scholar] [CrossRef]
  213. IAEA; UNDESA; IEA; Eurostat; EEA. United Nations Environment Programme. 2005. Available online: http://www.iaea.org/Publications/index.html (accessed on 22 May 2023).
  214. Cembalest, M. Renewable Rap Battle: A Scathing Critique of Mark Jacobson’s 100% Renewable Grid Proposal. Annual Energy Paper. 2018, pp. 1–5. Available online: https://privatebank.jpmorgan.com/content/dam/jpm-wm-aem/global/pb/en/insights/eye-on-the-market/renewable-rap-battle-a-scathing-critique-of-mark-jacobsons-100-renewable-grid-proposal.pdf (accessed on 20 May 2023).
  215. Jacobson, M.Z. On the correlation between building heat demand and wind energy supply and how it helps to avoid blackouts. Smart Energy 2021, 1, 100009. [Google Scholar] [CrossRef]
  216. IRENA. IRENA—International Renewable Energy Agency. 2023. Available online: https://www.irena.org/ (accessed on 14 August 2023).
  217. Sterner, M.; Specht, M. Power-to-gas and power-to-x—the history and results of developing a new storage concept. Energies 2021, 14, 6594. [Google Scholar] [CrossRef]
  218. The Secretary-General’s Advisory Group on Energy and Climate Change (AGECC). Energy for a Sustainable Future (Reports and Recommendations). 2010. Available online: https://www.un.org/millenniumgoals/pdf/AGECCsummaryreport%5B1%5D.pdf (accessed on 2 June 2023).
  219. SE4All. Sustainable Energy for All (SE4All). 2023. Available online: https://www.seforall.org (accessed on 22 June 2023).
  220. UN. Transforming Our World: The 2030 Agenda for Sustainable Development (A/RES/70/1). 2015. Available online: https://sdgs.un.org/documents/ares701-transforming-our-world-2030-agen-22298 (accessed on 2 June 2023).
  221. Greenpeace. Energy Revolution—A Sustainable World Energy Outlook 2015 (100% renewable energy for all). 2015. Available online: www.petiteplanete.org (accessed on 21 May 2023).
  222. UNFCCC. Nationally Determined Contributions (NDCs). 2023. Available online: https://unfccc.int/process-and-meetings/the-paris-agreement/nationally-determined-contributions-ndcs (accessed on 30 May 2023).
  223. LUT. Open Energy Platform. Available online: https://openenergy-platform.org/ (accessed on 3 August 2023).
  224. Aghahosseini, A.; Solomon, A.A.; Breyer, C.; Pregger, T.; Simon, S.; Strachan, P.; Jäger-Waldau, A. Energy system transition pathways to meet the global electricity demand for ambitious climate targets and cost competitiveness. Appl. Energy 2023, 331. [Google Scholar] [CrossRef]
  225. Brown, T. PyPSA-Energy System Modelling Framework. Available online: https://pypsa.org/ (accessed on 3 August 2023).
  226. UNFCCC. Global Stocktake. 2023. Available online: https://unfccc.int/topics/global-stocktake (accessed on 30 May 2023).
  227. Harmsen, M.; Kriegler, E.; Van Vuuren, D.P.; van Der Wijst, K.I.; Luderer, G.; Cui, R.; Dessens, O.; Drouet, L.; Emmerling, J.; Morris, J.F.; et al. Integrated assessment model diagnostics: Key indicators and model evolution. Environ. Res. Lett. 2021, 16. [Google Scholar] [CrossRef]
  228. Alcaraz, O.; Balfegó, M.; Cruanyes, C.; Retamal, C.; Sureda, B.; Turon, A. Equity in the Paris Agreement Regime Are Current NDCs Built on Equity? How to Operationalize Equity in GST? In STH Sustainability, Technology, and Humanitarian UPC Singular Research Group. 2022, p. 1. Available online: https://www.climatewatchdata.org (accessed on 3 July 2023).
  229. Nissen, U.; Harfst, N. Shortcomings of the traditional ‘levelized cost of energy’ [LCOE] for the determination of grid parity. Energy 2019, 171, 1009–1016. [Google Scholar] [CrossRef]
  230. Zakeri, B.; Syri, S. Electrical energy storage systems: A comparative life cycle cost analysis. Renew. Sustain. Energy Rev. 2015, 42, 569–596. [Google Scholar] [CrossRef]
  231. Weldu, Y.W.; Assefa, G. The search for most cost-effective way of achieving environmental sustainability status in electricity generation: Environmental life cycle cost analysis of energy scenarios. J. Clean. Prod. 2017, 142, 2296–2304. [Google Scholar] [CrossRef]
  232. Gillenwater, M. Calculation Tool for Direct Emissions from Stationary Combustion-A WRI/ WBCSD (GHG Protocol) Tool. 2005. Available online: https://ghgprotocol.org/sites/default/files/Stationary_Combustion_Guidance_final_1.pdf (accessed on 15 June 2023).
  233. E. Center for Corporate Climate Leadership. Greenhouse Gas Inventory Guidance: Direct Emissions from Stationary Combustion Sources. 2020. Available online: www.epa.gov/climateleadership (accessed on 26 May 2023).
  234. (CEEEZ) EECG Consultants Pty Ltd. The Calculation of Country Specific Emission Factors for the Stationary Combustion of Fuels in the Electricity Generation Sector. 2016. Available online: https://www.dffe.gov.za/sites/default/files/docs/publications/calculationofcountryspecificemissionfactors.pdf (accessed on 15 June 2023).
  235. Abideen, M.Z.U.; Ellabban, O.; Al-Fagih, L. A review of the tools and methods for distribution networks’ hosting capacity calculation. Energies 2020, 13, 2758. [Google Scholar] [CrossRef]
  236. Saad, S.N.M.; van der Weijde, A.H. Evaluating the Potential of Hosting Capacity Enhancement Using Integrated Grid Planning modeling Methods. Energies 2019, 12, 3610. [Google Scholar] [CrossRef]
  237. EU. Generation and System Adequacy Analysis. METIS Studies Study S04. 2016. Available online: https://op.europa.eu/en/publication-detail/-/publication/59a1b96c-713f-11e9-9f05-01aa75ed71a1/language-en/format-PDF/source-96287997 (accessed on 14 August 2023).
  238. Astier, N.; Ovaere, M. Reliability standards and generation adequacy assessments for interconnected electricity systems. Energy Policy 2022, 168, 113131. [Google Scholar] [CrossRef]
Figure 1. The 100% RE concept. Source: authors’ elaboration.
Energies 16 06598 g001aEnergies 16 06598 g001b
Figure 2. Trend of 100% RE studies according to S. Khalili and C. Breyer [9].
Energies 16 06598 g002
Figure 3. Distribution of 100% RE studies per country as carried out by S. Khalili and C. Breyer in [9].
Energies 16 06598 g003
Figure 4. Distribution of 100% RE studies per region (about 750 studies considered) as carried out by A. S. Oyewo et al. in [24].
Energies 16 06598 g004
Figure 5. Countries with near or 100% RE in national electricity mix (70% and above) (data only for RE composition are only from solar, hydro, geothermal, and wind) [5,53].
Energies 16 06598 g005
Figure 6. Population access to electricity in countries with near or 100% RE (70% and above) [5,53].
Energies 16 06598 g006
Figure 7. RE electricity mix in countries with high RE (70% and above), updated from [5,53].
Energies 16 06598 g007
Figure 8. Simplified general rule for RE integration study and analysis. Source: authors’ elaboration.
Energies 16 06598 g008
Figure 9. RRA levels [130].
Energies 16 06598 g009
Figure 10. Ideal energy system modelling process for 100% RE. Source: authors’ elaboration.
Energies 16 06598 g010
Table 1. Significant approaches helping some of the countries achieve near-or-complete RE successes. Source: authors’ elaboration.
CountryHighlights
IcelandGeothermal utilisation
With abundant geothermal resources from volcanic activities, Iceland has harnessed geothermal energy for heating and electricity. It has enabled the country to achieve high levels of renewable energy utilisation.
New energy technologies integration
With ample renewable energy sources such as geothermal and hydroelectric, Iceland focuses on energy storage technologies such as pumped-hydro storage to store extra energy during high-generation and release during low-generation times with high demands.
NorwayHydropower dominance
An abundance of hydropower resources generates a significant portion of its electricity.
Excess electricity for hydrogen production
They also utilise their excess renewable energy to produce hydrogen for other sectors such as transportation.
Taking the global frontier in electric vehicle (EV) utilisation
It is a global leader in EV adoption, reducing its dependency on fossil fuels for transportation.
Iceland/NorwayRegional collaboration and grid interconnections
Nordic countries such as Norway and Iceland, including Sweden, Denmark, and Finland, have collaborated on energy interconnections, enabling them to share excess renewable energy and balance out variations in generation.
Costa RicaLocal community initiatives
They have made significant strides toward renewable energy by involving local communities and focusing on decentralised energy production through solar, wind, and hydropower energy.
Hydropower and geothermal utilisation
They capitalised on their unique geography to harness hydropower and geothermal energy.
UruguaySupporting policy regulatory environment
Uruguay’s success in renewable energy can be attributed to its stable regulatory environment, enabling the growth of wind and solar energy projects.
Ethiopia, Zambia, DR. Congo, Uganda, Kyrgyzstan, Tajikistan, Venezuela, Korea DPR, Angola, Mozambique, Ecuador, Columbia, Lao PR Hydropower dominance
Hydropower resources are abundant, helping to generate a significant portion of its electricity from this source.
ScotlandWind power dominance and supporting policy regulatory environment
Scotland has made progress in using wind power in its grid. Offshore wind farms are a major cause for its renewable energy success. It has invested much in wind power and passed advantageous legislation to promote renewable energy.
Table 2. Summary of RE considered in the top global emitters of CO2 100% RE studies.
Country RE Technology Covered in the 100% RE Studies Target YearActual RE % in National Mix (2021)Ref.
SolarWindHydropowerBioenergyGeothermalOthersStorage
China (1)-----G-N/D28.91[66]
China (2)----N/D28.91[67]
China (3)-----G-203028.91[68]
USA (1)-----S-205020.74[46]
USA (2)-----2040–204520.74[42]
India (1)----P2X205019.38[44]
India (2)-------N/D19.38[40]
Europe, Eurasia, and MENA regionsG-2030-[69]
✔ refers to the inclusion of the particular RE technology in the study referenced G—grid, P2X—power to X, N/D—not defined. RE% data extracted from [53].
Table 3. Summary of key 100% renewable energy studies in top global CO2 emitters.
CountrySummary of StudiesSupport Mechanisms and Evaluation Approaches UsedTarget Year for 100% RE Ref.
China (1)One of the earliest experimental projects into 100% RE. This study found China’s large domestic RE sources promising, suggesting a 100% RE system analysis for China.
  • Renewable resource assessment
N/D[66]
China (2)Design optimisation is suggested for improving 100% renewable energy systems in low-density areas. Integration and performance of 100% RES were investigated in 30 Chinese cities with payback times under six years, showing that future breakthroughs could shorten the payback period.
  • Energy system analysis
  • Design optimisation
  • Economic assessment
  • New technology integration
N/D[67]
China (3)This Beijing study used two-phase energy system models to study Beijing’s 2030 energy market reaching 100% RE. The reference scenario uses 72% more primary fuel than the RES scenario 2030.
  • Reliability and optimisation
  • Environmental assessment
2030[68]
USA (1)100% renewable energy (RE) in US electric power networks were simulated. The least-cost buildout reaches 57% RE penetration in 2050 under base conditions. According to this base scenario, CO2 abatement costs of 80%, 90%, 95%, and 100% RE are USD 25, USD 33, USD 40, and USD 61/ton, with system costs rising from USD 30 to USD 36/MWh at 95% (achieved in 2040) and USD 39/MWh at 100%.
  • Energy system analysis
  • New technology integration
  • Economic assessment
  • Environmental assessment
2050[46]
USA (2)New Mexico, a US state with great solar and wind potential, is used in this study. An optimisation problem is proposed to determine the amount of renewable generation and energy storage needed to balance 100% of a utility’s hourly electricity demand over several years at a desired cost.
  • Energy system analysis
  • Renewable resource assessment
  • Design optimisation
2040–2045[42]
India (1)The model optimises the least cost combination of RE power plants and storage technologies to create a completely RE-based power system by 2050 based on 2015 installed power plant capacities, lives, and total energy demand. The levelised cost of electricity falls from EUR 58/MWhe to EUR 52/MWhe in 2050, enabling a 100% renewable energy system.
  • Energy system analysis
  • Economic assessment
2050[44]
India (2)Delhi’s 100% renewable energy system’s technological and economic potential is examined in this study. Delhi may promote a regional energy transition by reducing primary energy by 40%, energy costs by 25%, greenhouse gas emissions, air pollution, and health costs.
  • Energy system analysis
  • Renewable resource assessment
  • Economic assessment
  • Environmental assessment
  • Energy–environment–economy development
N/D[40]
Europe, Eurasia, and MENA regionsThis study explored the feasibility of a regional integrated renewable energy-based carbon-neutral power system using existing energy generation, storage, and transmission technologies throughout Europe, Eurasia, the Middle East, and North Africa. With a total LCOE of about EUR 42/MWh, the result showed that the integration could produce an economically viable and sustainable energy system less expensive than coal-CCS or brand-new nuclear options, helping improve stability flexibility and lessen the need for energy storage.
  • Economic assessment
  • Energy system analysis
  • Renewable resource assessment
2030[69]
Japan (1)The research designed and evaluated a renewable energy system for Akita, Japan. Wind power potential is estimated at 35.2 TWh/year, greatly above the 11.3 TWh/year electricity need. Batteries must have 48.4 GWh to meet yearly demand for over 1000 h. Batteries produce hydrogen, cutting electricity costs by 57% and overall costs by 32%.
  • Renewable resource assessment
  • Economic assessment
  • New technology integration
N/D[43]
Japan (2)Akita prefecture’s 100% renewable energy system’s biomass power cost and availability are examined in a second study [43]. Batteries met demand when other energy sources failed. The “no biomass”, “supply shortage”, and “baseload” situations were explored. Compared to “no biomass” electricity prices, “baseload” lowered them all.
  • New technology integration
  • Economic assessment
[45]
Japan (3)Japan’s renewable energy future using a 40-year hourly energy balance model was examined. Under restrictions, differential evolution finds the lowest-cost solution. Japan has 14 times more solar and offshore wind resources than needed for 100% renewable electricity, and solar costs USD 86/megawatt-hour and wind USD 110. Japan can be power self-sufficient at competitive prices despite solar photovoltaic and offshore wind deployment constraints.
  • Renewable resource assessment
2050[33]
Germany (1)The study tried to clarify the possibility of Germany’s 100% renewable energy transition in 2050. Consumption changes to Germany’s heating, industrial, transport, and power sectors’ energy systems were made using renewable resource potential, energy system costs, and primary energy supply. This change is feasible technically and economically, but it requires action to implement it efficiently and affordably.
  • Energy system analysis
  • Renewable resource assessment
2050[41]
Germany (2)This research examines Germany’s 100% renewable and sector-coupled energy system’s viability. OSeEM-DE, an hourly optimisation tool, uses open energy modelling to study the German energy system. Volatile generators cost EUR 17.6–26.6 billion annually, and heat generators cost EUR 23.7–28.8 billion annually. Parametric scenarios affect investment capacities and component costs. The model recommends EUR 2.7–3.9 bn/yr for power and heat storage. According to sensitivity analysis, storage and grid expansion maximise system flexibility and lower investment costs.
  • Energy system analysis
  • Economic assessment
  • New technology integration
  • Energy financing
  • Reliability and optimisation
N/D[59]
IranThe report forecasts the possibility of 100% renewable in Iran by 2050. Iranian electricity capacity demands from 2015 to 2050 were simulated hourly. It estimates that renewable energy (RE) will supply 100% of the world’s power at EUR 41–47/MWhe by 2050, while EUR 32–40/MWhe is unfeasible unless the target time is extended.
  • Energy system analysis
  • Economic assessment
  • New technology integration
2050[48]
CanadaThis article evaluates the infrastructure costs for transitioning to carbon neutrality for Canada’s 10 provinces until 2060. It finds that most of Canada’s provinces stand to benefit from a pan-Canadian energy transition by capturing fossil fuel savings.
  • Energy system analysis
  • Economic assessment
  • New technology integration
  • Environmental assessment
2060[60]
South KoreaThe research develops a renewable energy forecasting model using Korean energy policy as a case study. It analyses four renewable energy scenarios using deep-learning-based models to anticipate power demand and generation. The lowest economic–environmental costs, steady electricity for demand, and 100% renewable energy come from an integrated gasification combined cycle, onshore and offshore wind farms, solar power plants, and fuel cell facilities.
  • Energy system analysis
  • Economic assessment
  • New technology integration
  • Environmental assessment
  • Policy and regulatory assessment
Annual[62]
IndonesiaThis study investigates Indonesia’s 2050 100% renewable energy power system transition. TIMES’ least-cost optimisation analysed 27 power plants and 3 energy storage systems utilising 24 h time slices and hourly demand and supply operational data. It found that nuclear and solar PV utility scale will supply 16% and 70% of electricity output and requires USD 95 billion and 215 million tons of CO2-eq. Nuclear-free power increases solar PV utility scale and battery capacity, land requirement, supply variability, and energy production cost by 9.7%.
  • Energy system analysis
  • Economic assessment
  • New technology integration
  • Environmental assessment
  • Energy–environment–economy development
  • Reliability and optimisation
2050[39]
Saudi Arabia (1)This research indicates that by combining the electricity and growing desalination sectors, Saudi Arabia can achieve a 100% renewable energy power grid by 2050. By 2040, solar photovoltaics will account for 79% of power output, bringing the system’s LCOE down to EUR 41/MWh. Since the integrated scenario uses less battery storage and power-to-gas plants, it lowers annual levelized costs by 1% to 3%.
  • Energy system analysis
  • Economic assessment
  • New technology integration
2050[51]
Saudi Arabia (2)As a follow-up to the first Saudi Arabia 100% RE study in [51], the new study presents that a full transition to renewable energy can be possible if single-axis tracking PV and battery storage are the system’s primary LCOE drivers. By 2050, if about 79% of all electricity will be produced by PV systems using only single-axis tracking, 441 of power could come from battery storage. Decreasing capital expenditures allows desalination facilities to adapt to changing conditions more quickly.
  • Energy system analysis
  • Economic assessment
  • New technology integration
2040–2050[50]
South AfricaSouth Africa’s energy transition is simulated hourly until 2050. The findings imply solar PV and wind energy can replace coal in electricity. The Best Policy Scenario raises electricity-levelized costs somewhat, while the Current Policy Scenario raises them dramatically. The Best Policy Scenario has 25% lower electricity bills than the Current Policy Scenario without GHG emissions. The cheapest renewable energy system eliminates new coal and nuclear power plants and steadily reduces fossil fuel capacity.
  • Policy and regulatory assessment
  • Economic assessment
  • Environmental assessment
2050[37]
Egypt (2)Egypt’s wind energy potential is understudied, so the author examined two 300 MW wind farms for roughness factor and wind power density. Kharga and Dakhla South wind farms can generate 1130 GWh annually with good capacity factors and low electricity costs, lower than the country’s needs. Further investment in these wind farms can help Egypt and Southern Europe completely reduce fossil fuel dependence by exporting.
  • Renewable resource assessment
Annual[70]
N/D—not defined.
Table 4. Forms of ESA. Source: authors’ elaboration.
Form of ESAHighlightsRefs.
Function General (general future prediction and exploration)
Specific (prediction of energy demand, supply, consumption, pricing, GHG emissions, impact, appraisals)
[71,88,89,90,91,92,93,94,95]
Methodologies and mathematical approachesTop-down (input–output model such as decomposition analysis, computable generic equilibrium model, system dynamics, econometric models)
Bottom-up techniques (optimisation models, partial equilibrium model, simulation, and multi-agent models)
Mixed techniques
Degree of complexity
Model flexibility
Mathematical approaches (linear programming, dynamic programming, metaheuristic, and combination techniques)
Level of indices aggregation
[68,80,84,85,88,96,97,98,99,100,101,102,103,104,105,106,107,108,109,110]
Time horizonShort, mid, and long term[64,65,111,112,113,114,115,116]
Coverage National/regional
Global
Local
Island
General purpose
Energy trade route
[80,112,117,118,119,120,121,122,123]
Data requirementsLevel of data intensiveness[124,125,126,127]
Logical assumptionsScenario (business as usual—BAU, RES)
Back casting (considering the viability of both BAU and RES options over time)
Internal (degree of endogenisation, non-energy but related sector, energy technologies and end use)
External (economic and population growth, energy demand and supply, price and income, tax, and financing system)
[105,128,129]
Table 5. Forms and indices of EEI. Source: authors’ elaboration.
Form of EEIHighlightsRefs.
Economic Impact
  • Energy Return on Investment (kWh)
  • Life Cycle Cost of Energy (USD/kW)
    (a)
    LCOE with Intermittency Factor
    (b)
    Levelised Cost of Energy (LCOE) (USD/kW)
    (c)
    Value-adjusted Levelised Cost of Electricity (vLCOE) (USD/kW)
    (d)
    System Levelised Cost of Electricity (sLCOE) (USD/kW)
    (e)
    Levelised Avoided Cost of Energy (LaCE) (USD/kW)
    (f)
    Net Benefit (NBP) (USD/kW)
    (g)
    Levelised Cost of Energy Storage (LCOES) (USD/kW)
    (h)
    Net Levelised Cost of Energy Storage (nLCOES) (USD/kW)
    (i)
    Levelised Full System Costs of Electricity (fsLCOE) (USD/kW)
Table S2
Environmental Impact
  • Emissions Factor Assessment based on Carbon Footprints of RE
    (a)
    Emissions from material combustion needed for RE system construction (by calculation method) (tons CO2)
    (b)
    Emissions from material combustion during RE system construction (by direct measurement) (tons CO2)
2.
Damage Impact Assessment
(a)
Natural Resource Impacts
i.
Water Resource Depletion
ii.
Land Use (LU)
iii.
Energy Use (ENU)
iv.
Mineral, Fossil and Renewables Resource Depletion (MFRD)
(b)
Abiotic Ecosystem Impacts
i.
Climate Change (CC)
ii.
Ozone depletion (ODP)
iii.
Freshwater Eutrophication (FEP)
iv.
Marine Eutrophication (MEP)
v.
Photochemical Ozone Formation (POF)
(c)
Human Health and Ecotoxicity
i.
Human Toxicity, Cancer Effects (HTc)
ii.
Human Toxicity, Non-cancer Effects (HTnc)
iii.
Particulate Matter (PM)
iv.
Freshwater Ecotoxicity (FEC)
v.
Ionising Radiation Human Health Effect (IRHH)
Table S2
Social Impact
  • Public Acceptance/Trust and welfare of stakeholders
  • Managing energy wars and dependencies
[137,138]
Table 6. Key evaluation metrics in a comprehensive 100% RE studies. Source: authors’ elaboration.
100% RE Evaluation MetricsIndices
ESA
  • Function
  • Methodologies and mathematical approaches
  • Time horizon
  • Coverage
  • Data requirements
  • Logical assumptions
RRA
  • Preliminary assessment
  • Validation
  • Observation
TIESR
  • Regulating reactive power and voltage
  • Frequency and dynamic power control
  • Power quality problems
  • Flow control in traffic
  • Grid congestion
ROR
  • General adequacy analysis
  • Hosting capacity enhancement
EEI
  • Energy return on investment (EROI)
  • Levelized costs of energy (LCOE)
  • Levelized costs of energy storage (LCOES)
  • Life cycle assessment (emissions factors and damage impacts)
  • Social life cycle assessment
PRA
  • Green certificate system
  • Feed-in-tariff
  • Pure tendering process
  • Energy subsidy
  • Energy financing, carbon budgeting, and taxing
  • Energy–environment–economy and development nexus
Table 7. General modelling tools and classifications with ones identified as mostly used for 100% RE studies. Source: authors’ elaboration.
ToolsAll PurposeLocal or IndividualIslandNationalGlobal100% RE(Transition)
MEDEAS---
MESSAGE------
MiniCAM------
RAMSES------
WILMAR Planning------
PowerFactory DigiSILENT------
PERSEUS------
EMPS------
BALMOREL-----
LUT ESTM
WASP------
UniSyD3.0------
4see------
SIVAEL------
SimREN------
ORCED------
INFORSE------
ProdRisk------
STREAM------
AEOLIUS------
E4Cast------
IKARUS------
EnergyPLAN----
PRIMES------
LEAP-----
GTMax------
MODEST------
Mesap PlaNet----
ENPEP-BALANCE------
EMCAS--- --
NEMS--- --
MARKAL/TIMES--- --
Invert--- --
EMINENT--- --
H2RES------
HOMER-----
COMPOSE------
ETEM------
HYDROGEMS------
energyPRO------
BCHP Screening------
TRNSYS------
MODEST------
PVSys------
LOADMATCH-----
TIMES-----
REMix------
ISA Model------
PyPSA------
NEMO------
GENeSYS-MOD-----
VENSIM/C-ROAD/EN-ROAD----
AU Model-----
The use of ✔ shows that the tool can be used for that purpose under the category.
Table 8. Key evaluation metrics with the identified tools for 100% RE studies. Source: authors’ elaboration.
ToolsESARRATIESRROREESIPRA
MEDEAS----
LUT ESTMpartially-partially-
EnergyPLAN--partially-
Mesap PlaNet----
HOMER----
LOADMATCH----
TIMES----
REMix----
ISA Model----
PyPSA--partially-
NEMO----
GENeSYS-MOD----
VENSIM/C-ROAD/EN-ROADpartiallypartiallypartiallypartially
AU Model----
The use of ✔ shows that the tool can be used for that purpose under the category.
Table 9. Proposed key elements and modelling capabilities for energy modelling tools and integrated assessment for 100% RE studies. Source: authors’ elaboration.
S/NKey ElementsCapabilitiesRef
1Data qualityHigh-quality data for geographical/spatial consideration
Representation of both low and high emissions countries
Data fairness
[117]
2PlanningLong-term planning
Investment planning tool
Generation of policy and regulatory frameworks for the case study
Transition modelling with representative scenario assumptions
[100]
3IntegrationCarbon capture and storage modelling
Off-grid integration
Optimisation
Inclusion of both energy for electricity and non-electricity purposes
[191]
4Tools Coupling and TransparencyInteroperability with existing EST
Public transparency of datasets and source codes
Compliance with standards
[128,193]
5100% RE Evaluation Metrics Energy system analysis (ESA)
Renewable resource assessment (RRA)
New technology integration with energy storage requirement (TIESR) economic, environmental, and social impacts (EEI) for sustainability
Policy and regulatory analysis (PRA)
Current study
Disclaimer/Publisher’s Note: The statements, opinions and data contained in all publications are solely those of the individual author(s) and contributor(s) and not of MDPI and/or the editor(s). MDPI and/or the editor(s) disclaim responsibility for any injury to people or property resulting from any ideas, methods, instructions or products referred to in the content.

