Abstract
Since their inception with Bitcoin in the late 2000s, cryptocurrencies have grown exponentially, reshaping traditional financial paradigms. This transformative journey, while innovative, brings forth pressing concerns about their energy consumption and carbon footprint. While many studies tend to zoom in on Bitcoin, this paper broadens the perspective by evaluating energy consumption across various cryptocurrencies. We analyze nine cryptocurrency projects, chosen for their market value, technology, and data availability. These span a spectrum from pioneering to emerging digital coins, offering a holistic view of the crypto realm. To contextualize, we juxtapose the energy usage of these digital currencies with traditional payment means like Visa and Mastercard. Our analysis shows vast differences in energy use among cryptocurrencies, largely tied to their consensus algorithms. Notably, while Bitcoin stands out as highly energy-intensive, several newer digital currencies have energy footprints mirroring those of conventional payment methods. Additionally, CO2 emissions estimation presents challenges due to variances in miner locations and regional energy sources, with potential higher emissions if concentrated in carbon-intensive regions like China. Nonetheless, the silver lining emerges as many cryptocurrencies, especially those beyond Bitcoin, register considerably lower CO2 emissions. By moving the lens beyond Bitcoin, this paper paints a more nuanced picture of the environmental ramifications of the crypto world.
1. Introduction
Digital assets that combine cash and cryptography are known as cryptocurrencies. Peer-to-peer networks and public blockchains are frequently the foundations of cryptocurrencies, allowing network participants to validate financial transactions [1]. The majority of cryptocurrencies are decentralized, which has several benefits over conventional centralized financial systems, including quick transactions and minimal transaction fees [2]. Since Bitcoin was the first cryptocurrency to be established back in 2008, the terms, cryptocurrency (decentralized digital assets that use cryptographic functions) and digital coin (centralized digital assets), are frequently used interchangeably [3]. The cryptocurrency market has grown since the introduction of Bitcoin, and as of now, there are over 17,000 distinct cryptocurrency projects, of which, over 9000 are active [4]. There were more than 1800 full-time workers and a market value of over $1.7 trillion for cryptocurrencies in February 2022 [4]. Controversy remains regarding whether cryptocurrencies should be considered a method of payment or a high-risk investment. The interest in cryptocurrencies has largely risen in recent years, despite some criticism of their volatility [5]. Cryptocurrencies are both lauded as decentralized transaction mediums and debated due to barriers like limited everyday use and regulatory challenges. While they promise a decentralized payment alternative, their role as a primary payment method remains contested. Additionally, cryptocurrencies, especially Bitcoin, have gained attention as speculative investments, promising high rewards. However, their marked price volatility raises concerns about their stability and value, leading some to question their reliability as a store of wealth. Despite skepticism, the increasing appeal of cryptocurrencies is fueled by factors like institutional acceptance, blockchain advancements, distrust in traditional banking, and global digitization. This positions them prominently in financial discourse [6].
Concerns about cryptocurrencies’ excessive power usage have been raised by their expanding marketplaces [7]. Because of the notoriously energy-intensive roof of Work consensus method used by Bitcoin, some studies have calculated that the network’s electricity consumption is comparable to that of whole countries like Ireland and Austria [8]. Since Bitcoin dominates the crypto markets and accounts for 41.9% of market value, several research have concentrated on it (20 February 2022) [4]. To place the energy use and CO2 emissions of cryptocurrencies in the present and the future, however, a correct perspective on the crypto markets beyond Bitcoin and Proof of Work is required as the market share for new projects increases [9].
Recent decades have seen an increase in both worldwide energy consumption and CO2 emissions [10], and according to the International Energy Agency (IEA), CO2 emissions from the generation of electricity in 2021 grew globally by 7% [11]. The energy use and carbon impact of the Bitcoin marketplace are also expanding. However, new projects using novel consensus algorithms, such as Ethereum 2.0, Cardano, Algorand, Chia Network, may be employed to grow markets without endangering the environment [12].
In recent years, alongside the meteoric rise and adoption of cryptocurrencies, there has been growing discourse concerning their ecological implications. The decentralized nature of these digital assets, while groundbreaking in many respects, has also been a source of concern from an environmental standpoint [13]. Cryptocurrency operations, especially those utilizing energy-intensive consensus algorithms like Proof of Work, have been linked to significant energy consumption, often sourced from non-renewable power plants, resulting in substantial carbon footprints. As digital assets become more integrated into our global financial systems, it is crucial to holistically understand and address their environmental impacts. This study seeks to shed light on this pertinent issue by exploring various cryptocurrency projects and their ecological ramifications.
Because various cryptocurrencies have varying consensus procedures and technology requirements, it has proven challenging to quantify the energy usage of cryptocurrencies. While it is true that the decentralized nature of blockchain networks makes it inherently difficult to determine the precise location and energy sources of all nodes and miners, advancements in surveillance and regulations have allowed certain states to identify and monitor major mining operations. Nevertheless, given the global and dispersed nature of the network, obtaining a comprehensive and exact calculation of the resource and energy mix powering every node remains a challenge. Localized data may be available in regions with concentrated mining activities, but a complete global overview remains elusive.
1.1. Research Question
The following research question is used to study and analyze the current cryptocurrency marketplaces outside of Bitcoin as well as the energy use and carbon footprint of cryptocurrency projects: how do the energy consumption and CO2 emissions of diverse cryptocurrency projects, driven by their underlying consensus algorithms, compare to traditional payment methods, and what influence do financial determinants, especially in the context of Bitcoin, have on these environmental metrics?
More in-depth analysis of the technology used in various projects would have been outside the purview of this study. This study explores cryptocurrency from an ecological standpoint. Nine distinct projects were chosen due to the vast number of cryptocurrencies, on the basis of their market size, consensus method, and data accessibility. The secondary energy used in producing and cooling hardware is not considered because of a lack of information.
There are six sections in this paper. Section 2 introduces blockchain technology and cryptocurrencies, while Section 3 does the same for consensus algorithms and a few specific crypto projects. The energy consumption of the projects is reviewed in the fourth section, and in the fifth section, energy consumption and CO2 emissions of cryptocurrency projects are discussed. The results of this investigation are summarized in Section 6.
1.2. Methodology
Our study employed a mixed-methods approach, combining quantitative analysis of data gathered from blockchain networks and qualitative analysis of academic literature, industry reports, and expert opinions on the environmental impact of cryptocurrencies. Data were collected from prominent blockchain explorers, while peer-reviewed articles and industry publications provided insights into consensus algorithms, energy consumption patterns, and CO2 emissions ratings.
1.3. Disclaimer
This review paper delves into specific environmental implications of blockchain technology, particularly focusing on energy consumption and carbon emissions associated with cryptocurrency projects. While there are various environmental facets to consider with blockchain and cryptocurrencies, our primary lens for this research is on their energy consumption patterns and resultant carbon footprints. It is essential to clarify that this study neither provides financial nor investment advice. Consequently, while our research emphasizes environmental impacts, it does not delve into the economic performance, volatility, security, or reliability of cryptocurrencies. Readers should not interpret the information presented herein as guidance for financial or investment decisions.
2. Blockchain Technology
Despite the fact that the technology may be applied in various contexts, the majority of cryptocurrencies are based on blockchain technology, and blockchains are frequently linked to cryptocurrencies. A ledger or chain of blocks used to store data might be referred to as a blockchain [14]. Transactions, data records, and executables may all be included in the data kept on the blockchain. A blockchain is made up of transactions that are combined into blocks using encryption in the case of conventional cryptocurrencies like bitcoin. The chain is created by cryptographically connecting each block to the one before it. A so-called ‘peer-to-peer’ (P2P) network is then created, with the chain being maintained by nodes and distributed to all network users. If the block’s data are changed later, the chain will ‘break’, since the block’s encryption has changed. Figure 1 depicts the operation of a blockchain [15].
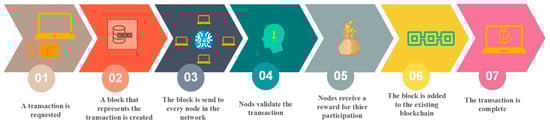
Figure 1.
Blockchain structure, how does it work?
Blockchain technology is used by cryptocurrencies to keep track of network transactions and to establish consensus among users. Blockchains may be grouped according to their many characteristics. Blockchains can be public, private, or somewhere in between, with or without permissions. Anyone can publish blocks without a third party’s approval in a permissionless blockchain network [16]. The majority of these blockchains are constructed on top of them and are open-source and freely accessible to everyone. The permissionless blockchain network allows all users to read from and write to the ledger, and the blockchain is open to all network participants. Permissionless blockchain networks frequently utilize a multiparty agreement or consensus method with certain restrictions for users who seek to publish blocks in order to avoid abuse and efforts to publish fraudulent blocks [17]. Later in this work, several of these consensus algorithms are covered.
On the other hand, before releasing blocks, centralized or decentralized authors must provide their approval in permissioned blockchain networks [17]. Given that the creator controls who has access to and control over the network, read access and submitting transactions may or may not be prohibited in a network like this. The majority of these networks employ consensus techniques for publishing blocks; thus, permissioned networks can nonetheless have the same openness and traceability as permissionless networks. Due to the administrators’ preexisting degree of confidence inside the network, consensus techniques utilized in permissioned networks frequently have less requirements than in permissionless networks. Due to the lack of complex consensus mechanisms, permissioned blockchain networks are frequently quicker and less computationally costly.
The majority of cryptocurrencies, including the two biggest, Bitcoin and Ethereum, are public blockchain instances. Everyone on the blockchain network may read transaction information on a public blockchain, making it accessible to all users. Public blockchains are intended to be completely transparent and decentralized, which means that no one and nothing is in charge of them. The system is maintained via the peer-to-peer network, which also verifies new blocks added to the chain. Due to the widespread distribution of users and the blockchain, public blockchain networks are resilient to single points of failure. The blockchain network can continue to function even if one of its servers is offline since the others are still running [18]. Without a single point of authority, the network must use consensus techniques to reach agreement on verifying transactions and new blocks [14]. Permissioned and permissionless public blockchain are both possible.
Private blockchains are more centralized than public blockchains since they are used to transfer data between corporations, for instance. Private blockchains are permissioned networks because the data they store are not publicly accessible. The blockchain economy is only accessible to authorized parties. Not all private blockchains have a token [18]. Although some cryptocurrencies have features a the public blockchain and some, of a private blockchain, they are not entirely decentralized.
2.1. Smart Contract and Decentralized Apps
Within the expanding realm of blockchain technology, the introduction of ‘smart contracts’ and ‘decentralized apps (dApps)’ stands out as a transformative innovation. At its core, a smart contract is a self-executing contract embedded with the terms of the agreement between buyer and seller. These terms are written into lines of code, which reside on the blockchain network. What sets smart contracts apart is their ability to automatically execute or enforce themselves when specific, pre-defined conditions or criteria are met, without the need for intermediaries [19]. Decentralized apps, commonly known as dApps, leverage the principles of smart contracts and are applications that run on a blockchain or P2P network of computers [20]. Unlike traditional applications that run on centralized servers, dApps are inherently resistant to tampering and censorship due to their decentralized nature. These applications function without a central authority, thus enhancing their security and potentially reducing risks of censorship or control by a single entity. In the contemporary digital landscape, dApps have found diverse applications ranging from decentralized social media platforms to gaming ecosystems, and their operation is underpinned by the automatic execution feature of smart contracts.
2.2. Hash Functions
The underlying idea behind hash functions, which have been around for a while in computer science, is to compress any type of string into an output string with a fixed length [21]. To protect and compress data, a block uses hash algorithms. Given only the output value and a cryptographic hash function, it is computationally impossible to determine the input value [17]. Additionally, finding two distinct inputs that would result in the same output is either impossible or extremely rare. There is an infinite number of inputs, but a finite number of outputs; hence, there is a probability of collision. When anything is processed through a hash function, the same input value always results in the same output, yet even a minor change in the input value causes the entire output to change (one example of SHA-256 hashing function, input: Hello, Output: 185f8db32271fe25f561a6fc938b2e264306ec304eda518007d1764826381969). Figure 2 presents an example of how the hashing process works.
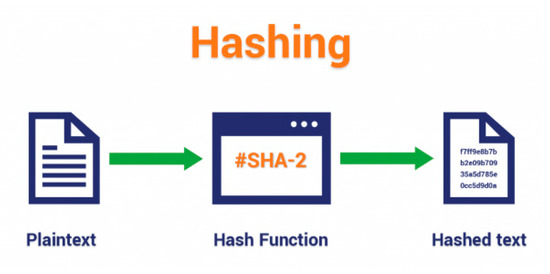
Figure 2.
A basic illustration of how the hashing process works [22].
Several hash functions are employed by different blockchain implementations and cryptocurrency projects. The Secure Hash Algorithm (SHA), particularly the SHA-256 variant, is widely used in many applications due to its speed and compatibility with most computers. Bitcoin, the pioneer cryptocurrency, is a well-known project that employs the SHA-256 hash function. Solana, on the other hand, is a more recent and innovative blockchain platform designed for high throughput and scalability. While it also uses SHA-256 as its hash mechanism, what differentiates Solana is its unique ‘Proof of History’ consensus mechanism. This allows the Solana network to achieve higher transaction speeds without compromising security. Another standout feature is Solana’s capability to process 65,000 transactions per second, significantly higher than many existing blockchains, making it an attractive platform for various decentralized applications and projects [23]. The function name’s inclusion of the number 256 denotes that the output will always be 256 bits, or 32 bytes. Usually, 64-character strings are shown like these outputs [17].
Cryptocurrencies often rely on cryptographic hash functions to maintain security and data integrity within their networks. While many cryptocurrencies use popular hash functions like SHA-256, some projects, in their pursuit of unique features or enhanced security, create their own hashing algorithms. IOTA was one such project that initially used its proprietary hash function, Curl-P-27. However, in 2017, a team of researchers identified vulnerabilities within the Curl-P-27 hash function, making it susceptible to potential attacks. The primary defect was that it did not guarantee ‘collision resistance’, a fundamental property where two different inputs should not produce the same output. Recognizing the security implications, IOTA transitioned from Curl-P-27 to Kerl, a variant of the widely acknowledged Keccak-384 algorithm [24]. Yet, this transition was not without its own set of controversies. An online user later reported discovering a collision in Kerl, which sparked significant criticism and concerns over the security and reliability of the hashing method chosen by IOTA. It underlines the complexities and challenges projects face in either opting for proprietary algorithms or modifying established ones [25].
Ethereum, the second-largest cryptocurrency project, also employs the original Keccak-384 hash mechanism [26]. Hashing is the process of entering input values into a hash function and retrieving output values. A hash value, or just a hash, is the name given to the hash function’s result [27]. The phrase, ‘hash rate’, refers to how much hashing occurs in the Bitcoin network per second. It varies greatly depending on the hardware and methods employed. Figure 3 shows network hashrates and coin exchange prices in USD for Bitcoin Figure 3A and Ethereum Figure 3B (BTC hashrate: [28]; ETH hashrate: [29], Ref. for price: [4]). While this paper delves into the intricacies of cryptocurrencies, blockchain technology, and their consequential environmental impacts, it is crucial to recognize the vastness of this domain. The subsequent section provides a focused overview of roles and methods that influence the energy consumption of cryptocurrency. However, it is worth noting that the environmental implications of cryptocurrencies and blockchain technology extend beyond just energy consumption. There are multiple layers of complexity and myriad factors that could further affect the environment. Due to the scope of this review, not all of these factors are exhaustively discussed. It is always recommended for readers and researchers to explore further, taking a holistic view of the potential environmental ramifications.
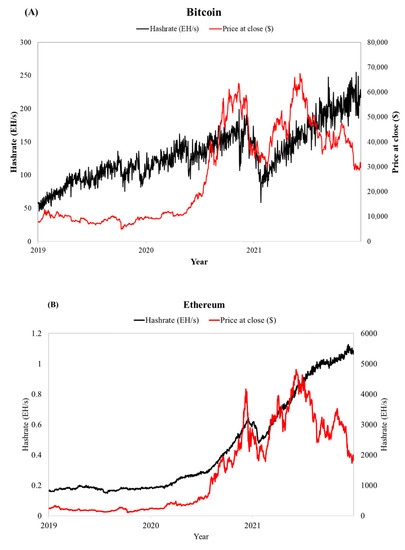
Figure 3.
Network hashrates and coin exchange price at close (USD) for Bitcoin (A) and Ethereum (B).
2.3. Problems and Limitations
There are several issues and restrictions when analyzing cryptocurrencies and their effects on the environment. One is that it is impossible to determine the precise number of Bitcoin users [27]. User numbers are challenging to estimate since a single user may have many wallets for various tokens. According to the Global Cryptocurrency Benchmarking Study, there were between 2.9 million and 5.8 million unique wallet users in 2017, yet there were up to 35 million active wallets [27]. Furthermore, as nodes might be single devices or groups of devices, it is challenging to monitor their energy usage [8].
The location of Bitcoin miners and consumers is another issue. Users and miners can be located anywhere in the world, since cryptocurrencies are decentralized. Additionally, the geographical location and actual number of miners are anonymous because of the encryption [30]. Even while some mining pools make their location known, mining is not necessarily required to take place in the pool that is nearby. A miner from China or Europe may join a pool there. The carbon footprint varies by location due to the consumption of power from various sources. Several mining pools in China were found in 2017 by the Global Cryptocurrency Benchmarking Study, despite the fact that the bulk of miners’ whereabouts remain undisclosed [27].
The third issue is the market dramatically shifting. While some projects are terminated, others are being replaced. Additionally, market capitalization is subject to rapid change. It is challenging to analyze important currencies in rapidly shifting markets since both market share and market capitalization are subject to change at any time.
The overall consumption is the fourth issue. Although several studies have estimated the amount of power consumed for transactions and mining, it is impossible to ascertain the total network usage due to various hardware regulations. Due to a lack of knowledge, many estimates do not take into account the efficiency of the power usage by the mining equipment or the energy consumption by the cooling systems [8]. The Global Cryptocurrency Benchmarking Study was able to identify certain pools that were in climates where cooling would not be necessary; however, as was noted before, owing to the anonymity of miner locations, it is nearly difficult to track the energy use of the cooling systems [27].
Given that the carbon intensity of the relevant grid varies globally, proper assessment of carbon footprint would require location information [27]. From a few grams to over 800 g per kWh, the carbon intensity might vary [31]. ElectricityMap’s figures from more than 50 countries show that because coal accounts for the vast majority of power generation, using 1 kWh there would emit 725 g of CO2 [31]. On the other hand, because Norway’s power is generated from renewable sources, 1 kWh spent there would only result in 25 g of CO2 (25 April 2022). Based on the figures the IEA supplied in 2018, calculations by the Crypto Carbon Ratings Institute (CCRI) utilized a carbon intensity of 475 g/kWh CO2.
3. Consensus Algorithm
Peers from across the world can validate or verify transactions on a decentralized public blockchain. The status of the ledger must be agreed upon by all participants in a peer-to-peer network, and transactions must be processed securely. Different consensus methods are used by cryptocurrencies to guarantee peer agreement and protect the network from fraudulent users.
Environmental Relevance: The choice of consensus algorithm plays a pivotal role in the environmental footprint of a cryptocurrency. Some algorithms, like Proof of Work, demand significant computational power and, consequently, substantial energy. Others, like Proof of Stake or Delegated Proof of Stake, aim to reduce this energy burden. As we delve into specific consensus methods in the subsequent sections, we will explore their respective environmental implications.
3.1. Proof of Work
Bitcoin was first released in 2008 by a person or group going by the alias, Satoshi Nakamoto [32]. Nakamoto was the first to use the Proof of Work consensus mechanism to resolve the double spending issue with cryptocurrencies. Miners have to invest their time and computing power in order to mine blocks and obtain new Bitcoins in order to maintain security and prevent double spending [33].
Network users known as miners verify transactions by constructing blocks in the Proof of Work mechanism. Miners must hash and compress network transactions in order to verify a block. The block hash is then created by hashing the transaction’s root hash, the block’s timestamp, the preceding block header, and the random value, ‘nonce’. Prior to the blockchain adding a new block, the block hash must satisfy some specifications established by the network. Since the supplied piece of data will always produce the same hash, miners must attempt to guess numerous nonce values in order to obtain this value. Miners receive new coins as soon as the block is mined and put to the chain. Figure 4 shows a schematic diagram of the Proof of Work mechanism [34].

Figure 4.
A schematic diagram of Proof of work mechanism.
The Bitcoin network controls how long it takes to mine a block. Finding the desired hash becomes more difficult as there are more miners and competitors. We refer to this as network difficulty. Finding a target hash and mining a block in Bitcoin takes a miner roughly 10 min. In more technical terms, the difficulty is a measurement of how challenging it is to discover a hash below a certain goal when mining a Bitcoin block. A high level of difficulty will require more processing power to mine the same amount of blocks, strengthening the network’s defenses against intrusions. The overall estimated mining power estimated in the Total Hash Rate (TH/s) chart is closely correlated with the difficulty adjustment [28]. Today, specialized mining devices called ASIC miners are used to mine Bitcoins because of their high computer power and quick hash generation. Mining pools, which are collections of miners that pool their computer power and divide the rewards when a block is made, are currently used to mine a significant number of Bitcoins.
Since miners compete with one another for the reward, the Proof of Work technique uses a lot of energy. The fact that only the quickest miner receives a reward causes other miners who attempted to mine the same block to squander a lot of computer power. The PoW method is also used by other cryptocurrencies, although their hardware requirements and levels of difficulty differ from those of Bitcoin.
Ethereum is a different cryptocurrency that uses the Proof of Work consensus process. In 2015, Vitalik Buterin unveiled the Ethereum framework for decentralized applications [35]. Ether is the name of Ethereum’s token (ETH) [27]. Ethereum, in contrast to Bitcoin, is much more than merely a platform for blockchain transactions. Ethereum’s built-in smart contracts and Turing-complete programming language make it possible for anybody to construct decentralized applications (dApps). Because of worries about excessive power use, Ethereum switched to the Proof of Stake consensus mechanism, or ‘The Merge’, in 2022 [27]. Equipment specifically made for mining Ethereum is required. Currently, Ethereum holds the second-place position in terms of market value and makes up 19.4% of the total market capitalization of all cryptocurrencies [4].
Monero is the third Proof of Work currency our study has looked at. The XMR project is an open-source cryptocurrency that offers private and anonymous transactions by utilizing the ring signature method [36]. In 2014, CryptoNote released Monero [37] and according to market value, it is now the 33rd-biggest cryptocurrency [4]. Because Monero features an ASIC-resistant RandomX algorithm and employs Proof of Work as its consensus mechanism, it is impossible to create specialized hardware to mine the cryptocurrency [38]. Monero block mining typically takes two minutes [39].
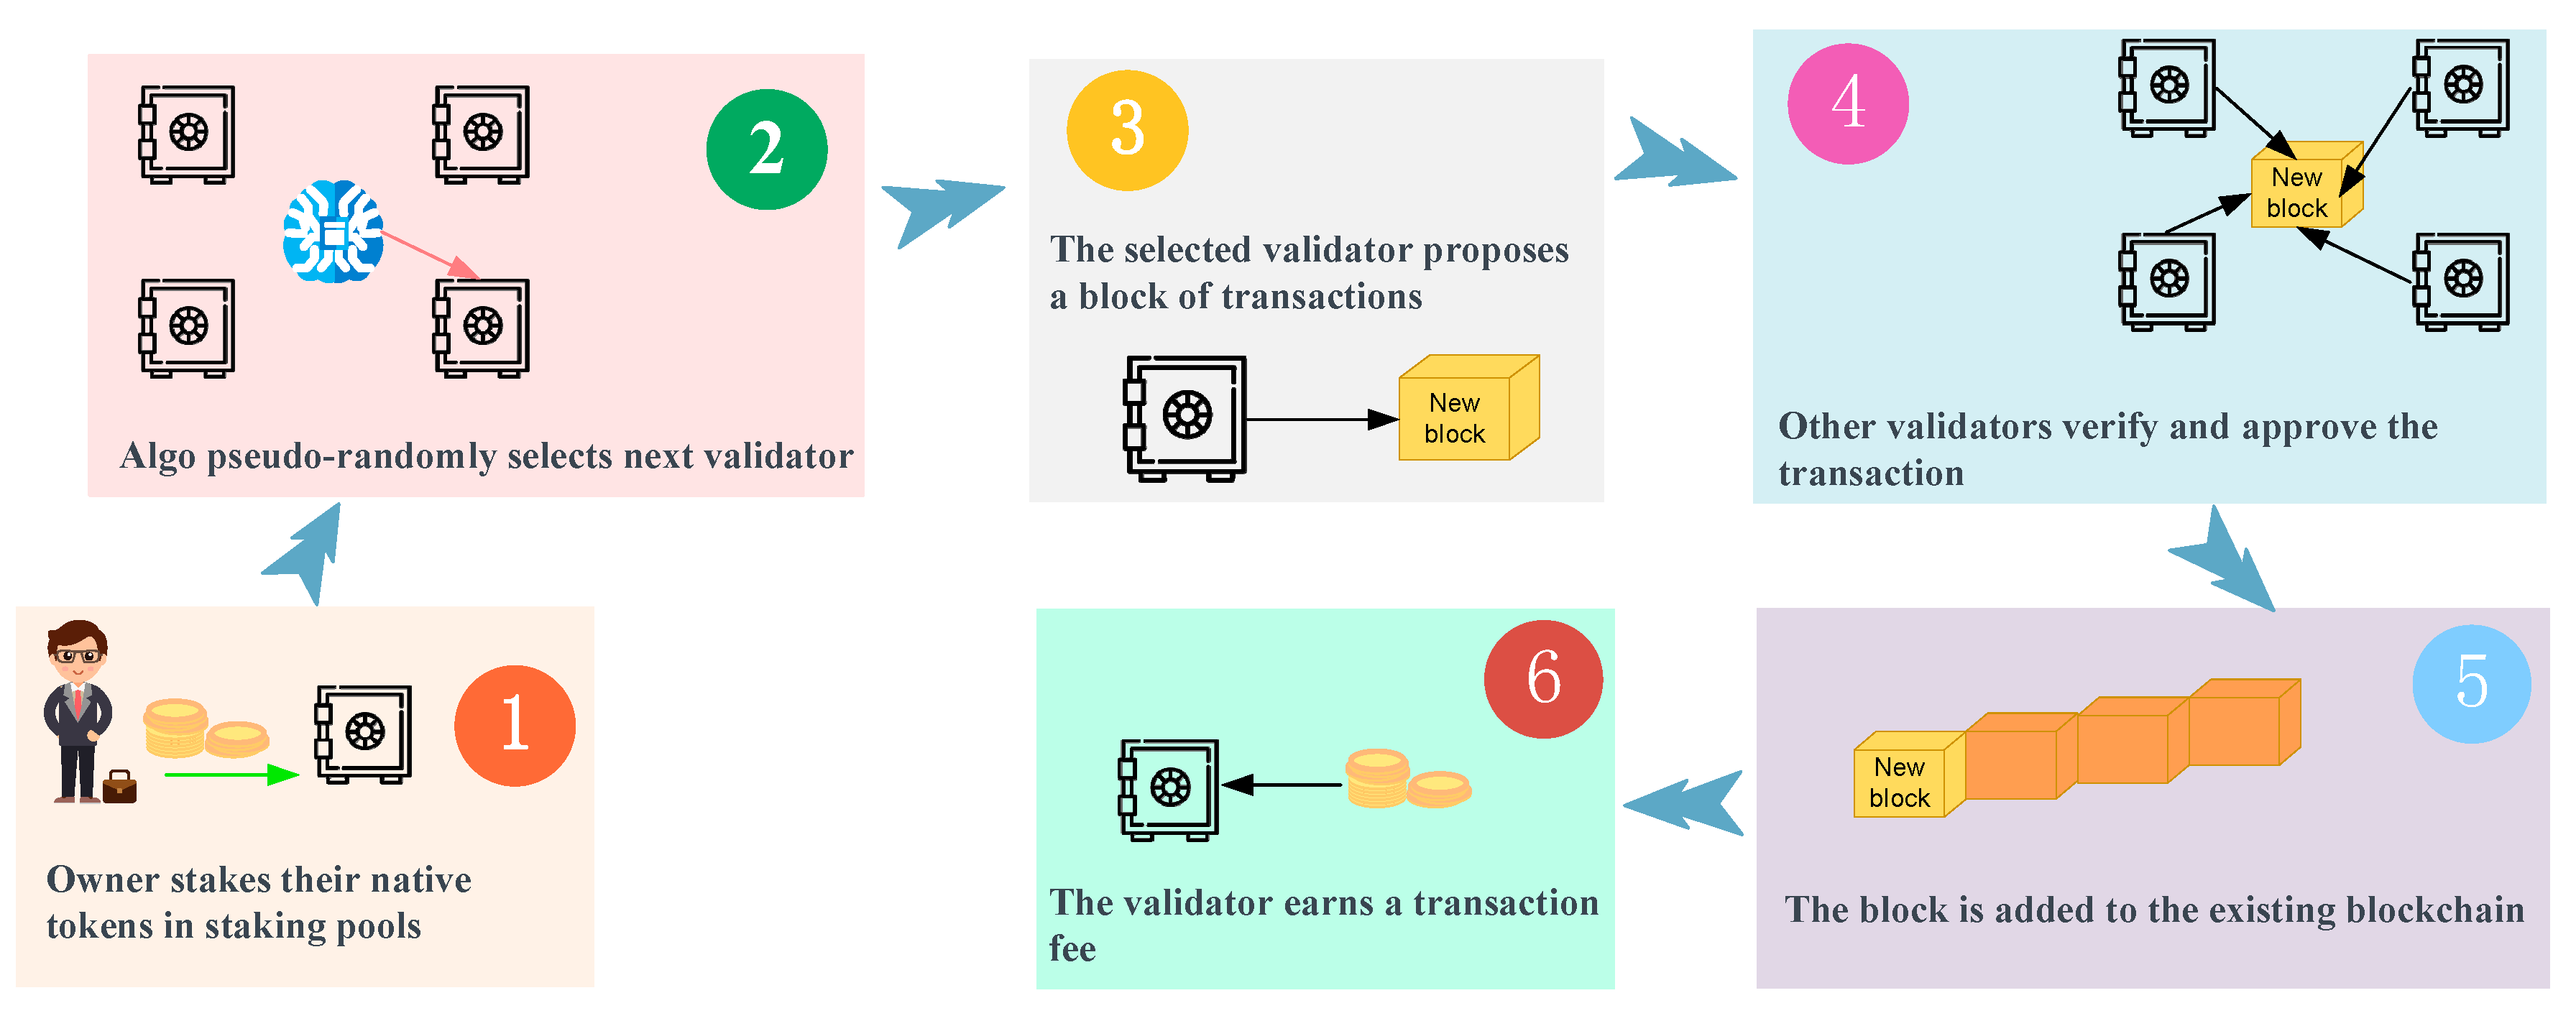
3.2. Proof-of-Stake
The Proof of Stake (PoS) consensus approach uses a small amount of computing power to validate transactions and create blocks without any mining competition. The user must stake part of their cash in order to validate transactions and suggest new blocks. Then, validators are randomly selected for the validation of new blocks. Because there is no rivalry between validators and less computational power is utilized, the PoS approach uses less energy than the PoW consensus technique. However, there are some issues with its decentralization, because affluent validators are more likely to be elected, because they have more money at stake [40]. The PoS currencies, Cardano, Avalanche, and Polkadot, as well as their consensus mechanisms, were thoroughly explored in this study. Figure 5 demonstrates a schematic design of the PoS mechanism [41].
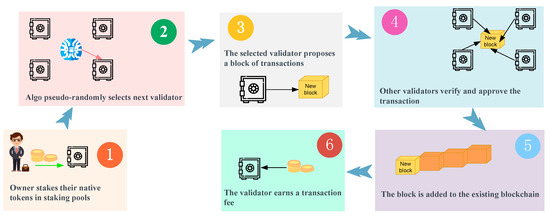
Figure 5.
How staking works in the PoS consensus mechanism.
A third-generation cryptocurrency called Cardano has its own token called ADA [42]. Charles Hokinson, the Co-founder of Ethereum, began working on Cardano’s development in 2015, and it was released in 2017 [43]. Cardano secures the networks using the Proof of Stake mechanism called Ouroboros [44]. This protocol breaks chains into epochs, which are subsequently split into time slots, to process transaction blocks. There is a leader in each slot who is in charge of validating transactions, building transaction blocks, and linking blocks to the chain [44]. A ‘lottery’ is used to select the slot leaders, and the leader with the greatest stake has a stronger chance of winning [43]. Cardano has ambiguous hardware requirements, but according to research by the CCRI, users should feel comfortable operating the program on any PC [45].
Several blockchain applications employing smart contracts are supported by the Avalanche blockchain platform. The native currency of Avalanche is known as AVAX [46]. Avalanche is an open-source project that was released in 2020 [46]. The network intends to be quick, secure, scalable, versatile, and sustainable. It can handle up to 4500 transactions per second [47]. AVAX users decide how rapidly new currencies are produced, and Proof of Stake consensus is often used to run the network. AVAX has a 720 million token supply limit [47]. According to the CCRI analysis, Avalanche requires similar hardware to Cardano [9].
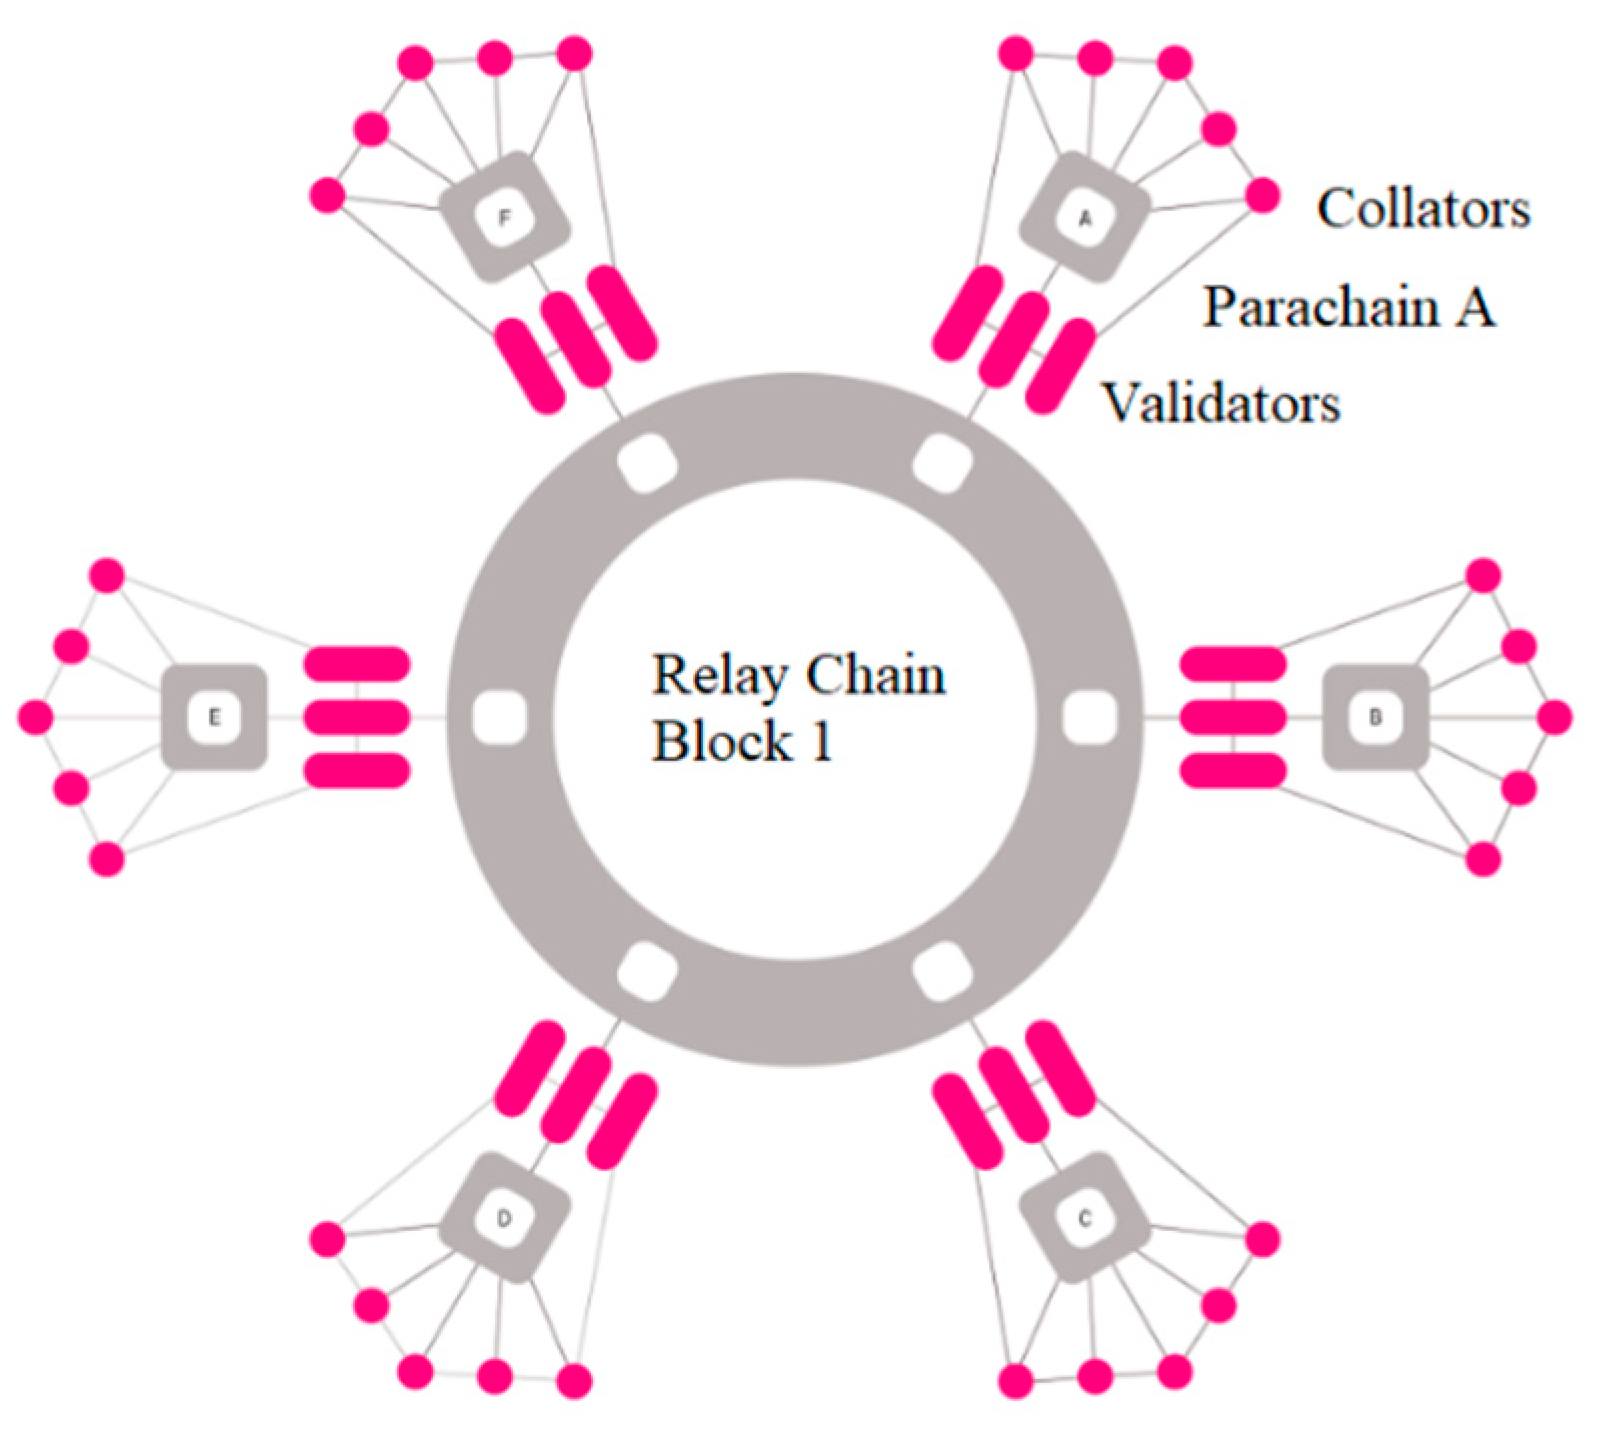
Another Proof of Stake blockchain project is Polkadot, which uses DOT as its native currency on its Polkadot network [48]. The Polkadot network employs the sharder paradigm, in which transactions are handled concurrently in ‘parachains’ rather than in sequences [48]. With the use of this sharded topology, the Polkadot network may be expanded to include several chains and even various blockchain projects, as shown in Figure 6. Various chains and initiatives can process transactions and share data in the network. The Polkadot network is able to execute numerous transactions more quickly than typical blockchains by connecting many chains together in a parallel paradigm. Polkadot’s ‘Relay Chain’ main chain serves as the network’s consensus mechanism and security core. Polkadot’s hardware specifications were categorized by CCRI as ‘special’, as the network requires a certain kind of CPU, RAM, and storage [9]. However, CCRI discovered through their investigation that they could also use other devices to run the network.
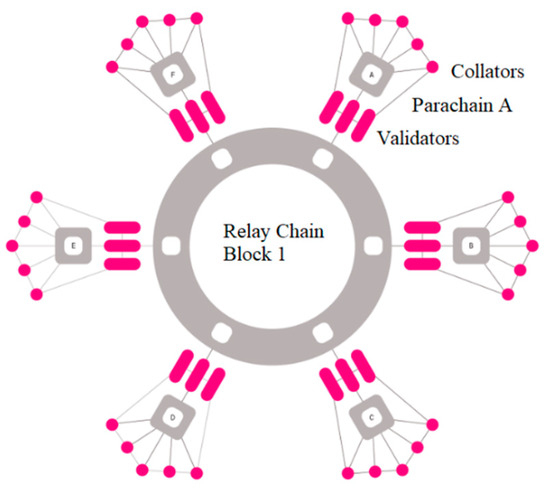
Figure 6.
Polkadot chain structure [49].
3.3. Other Consensus Algorithms
Numerous cryptocurrencies either use their own proprietary consensus algorithms or variants of existing consensus algorithms. (Refer to Figure 7 for a detailed breakdown of the market share of consensus mechanisms among the top 100 crypto projects, and also the category labeled ‘Other’). We covered the Solana, XRPL, and IOTA consensus algorithms in this subsection. An open-source, high-performance blockchain serves as the foundation for the cryptocurrency project, Solana [50]. The network employs Proof of History as its consensus algorithm to surpass more mature blockchain ecosystems, and SOL is the token that Solana uses [51]. The Solana network theoretically has a capacity of over 710,000 transactions per second [50]. PoH and horizontal scalability enable Solana to execute transactions quickly. The Proof of History mechanism, according to Solana’s creator Anatoly Yakovenko, is ‘a series of calculations that can give a technique to cryptographically validate the passage of time between two users’ [23]. Solana employs a series of hashing operations so that the output from one is used as the input for the next. The sequence index indicates the number of calls made to the function. This data format makes it clear that actual time has passed between the first and last hash. Predicting the input of hash functions is fundamentally unfeasible due to their one-way nature. The only method to derive the desired hash is to execute the hash function the requisite number of times.
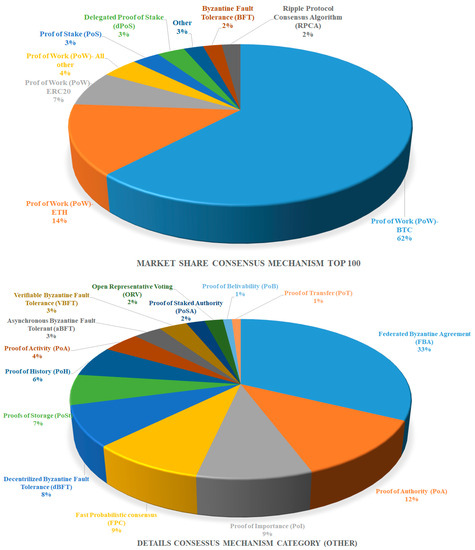
Figure 7.
Market share of consensus mechanism for top 100 crypto projects and details of consensus mechanism for category ‘Other’.
Transaction processing on the Solana network is quicker than in conventional blockchain setups. Leaders and validators are the two categories of nodes in the Solana network. The system’s leaders are its generators, and they rotate at set intervals [51]. Validators verify the transactions uploaded to the ledger as full network members [50]. With a series of computations, the leader prearranges the transactions and creates a digital record of each event that takes place on the network. This might also be referred to as the transaction’s timestamp (PoH). The transactions can potentially be split up into smaller batches by the leader, who will then distribute each batch to other nodes. Nodes exchange the transactions with other peers after verifying them and recreate the original batch collection [51]. Since none of the validators must go over every transaction, the network is made more effective and functional. Solana has stringent specifications for the hardware needed to power the network; a certain CPU type is advised, and it is also noted that nodes may benefit from employing a graphics-processing unit (GPU) [9].
Another project with a unique consensus process is XRP Ledger. Three former Bitcoin engineers, Jed McCaleb, Arthur Britto, and David Schwartz, created XRP Ledger, or XRPL, in 2011 [52]. Making a cryptocurrency that is effective, scalable, and sustainable was the concept behind XRPL. Jed McCaleb, Arthur Britto, and Chris Larsen, two XRPL developers, formed the technology company, Ripple, in 2012. XRP Ledger Consensus Protocol, or simply XRP LCP, is the name of the consensus algorithm employed by XRP Ledger [53]. The three stages of the consensus algorithm are collection, deliberation, and validation. Validators gather new transactions during the collection phase, adding properly formatted transactions to their open ledger. The decision to shut the ledger rests with each validator. The open ledger period frequently ends when specific criteria are satisfied. Validators trade suggestions with other validators they see as trustworthy throughout the discussion process. Each participant in the XRP LCP independently chooses which validators will hear about the decisions of the next ledger. Each trusted validator locally maintains a list of these trusted validators known as the Unique Node List (UNL). Validators add or remove transactions from the proposal throughout the discussion in order to iteratively update their transaction set. The proportion of concurring trustworthy validators is examined following each update. The validator applies the most recently closed ledger to the most recently verified ledger once there is agreement and consensus over transactions. Participants check the validity of the most recent closed ledger in the validation phase by comparing the hashes they obtained from reliable peers [54].
Due to the Byzantine Fault Tolerant foundation of the XRP LCP, the XRP Ledger will continue to operate even in the event of a malicious actor or incomplete participant agreement [55]. With no mining and no need for many confirmations to establish immutability, XRPL processes transactions quickly and effectively. Although there are certain special requirements and recommended CPU types for XRPL, it may be run on common hardware for testing or occasional use [56]. XRPL discloses the approximate locations of its nodes, and it is seen as a more ‘green’ cryptocurrency because the majority of its users are in Europe and the USA, where power has a lower carbon footprint than in China [57].
The final cryptocurrency under consideration is IOTA, which differs from the prior proposals evaluated because it lacks a blockchain and instead relies on a network of transactions that are processed in parallel [58]. This network is called Tangle. A new transaction may be added to the Tangle by any user or network node. The message of a transaction is connected to two to eight preceding ones in the directed acyclic graph (DAG) that makes up the Tangle’s data structure. Numerous locations at the Tangle’s front allow for the attachment of messages [58]. Tangle can process several transactions more quickly than a normal blockchain in which a new block is added to the previous one. No miners or transaction fees exist since anybody may contribute messages. All users of the network validate new messages without the need of validators or miners. Messages that make reference to a milestone are regarded as legitimate. The Coordinator, a unique node, defines the milestones. The Coordinator is a node that sends signed messages, or ‘milestones’, which other nodes rely on and employ as proof that the messages are genuine. When IOTA launches its IOTA 2.0 network, this Coordinator mechanism will be discontinued [58].
On 24 February 2021, the Top 100 stocks held 96% of the overall market capitalization, which is calculated by multiplying the price by the circulating supply. A total of 93% of the market share of the top 100 cryptocurrencies is made up of cryptocurrencies based on Proof of Work, Proof of Stake, and Delegated Proof of Stake. We divided the 87 percent of rated cryptos by Proof of Work into three smaller categories in order to account for Bitcoin’s market dominance: exclusively Bitcoin is rated first, followed by Ethereum only in second place, all ERC20 Ethereum-based tokens in third place, and all other PoW-based cryptocurrencies in fourth place [59]. The market’s cyclical nature frequently causes the ranking of procedures in the ‘Others’category to vary.
4. Energy Consumption and CO2 Emission
The daily network hashrate for each cryptocurrency was multiplied by the power efficiency (PE) of the mining rig, or computer, as shown in Equation (1), to determine how much power the entire network needed [60].
where P is the cryptocurrency network’s power demand, HR is the network hashrate, and PE is the mining equipment’s power efficiency.
The number of blocks generated every hour, the coin reward for completing a block, and the conversion of coins to US dollars were then multiplied, as stated in Equation (2), to obtain a ‘network velocity’ (USD created per hour):
where v denotes network speed, tB is the daily average block completion time (in minutes), R denotes the coin reward for completing a block, and EX denotes the exchange rate from cryptocurrency to US dollars.
In order to calculate the amount of energy required to produce one US dollar, the network power (P) was divided by the velocity and multiplied by the unit conversion factor from megawatt hours to megajoules, as shown in Equation (3).
where P and v are previously known, and EC is the energy cost, which is the amount of energy needed each day to earn one US dollar.
The daily computed energy required to create one coin was divided by peer-reviewed data on country-specific emission factors (kg CO2 per kWh−1), as shown in Equation (4), to give a final assessment of each network’s potential environmental impact.
The total daily energy required to produce a coin on a given day is NC, and the other parameters have previously been established. On the other hand, ECs fluctuate in terms of energy, and the only time NC values change is when the network’s energy needs change. In order to calculate the CO2 emissions per coin, country-specific emission factors (Y) were employed, as specified in Equation (5):
where Y is the mass of CO2 emitted per kilowatt-hour of energy generated for a country or region, TC is the carbon cost, which is defined as the mass of CO2 emitted per coin mined, and median (NC) is the median NC value.
5. Results and Discussion
5.1. Proof of Work Projects
5.1.1. Bitcoin
The energy utilization of Bitcoin is the subject of the most research. Back in 2018, Alexander Vries predicted that Bitcoin would eventually require up to 7.67 GW of power annually [8]. The average amount of energy needed for each transaction, according to Vries’ estimations from the same study, is at least 300 kWh and had the potential to reach 900 kWh by the end of 2018. The varying hardware and power utilization is one factor contributing to the estimations’ variance. According to Vries’ study, the power consumption of the mining equipment might range from 1372 W to 6400 W, depending on the machine employed.
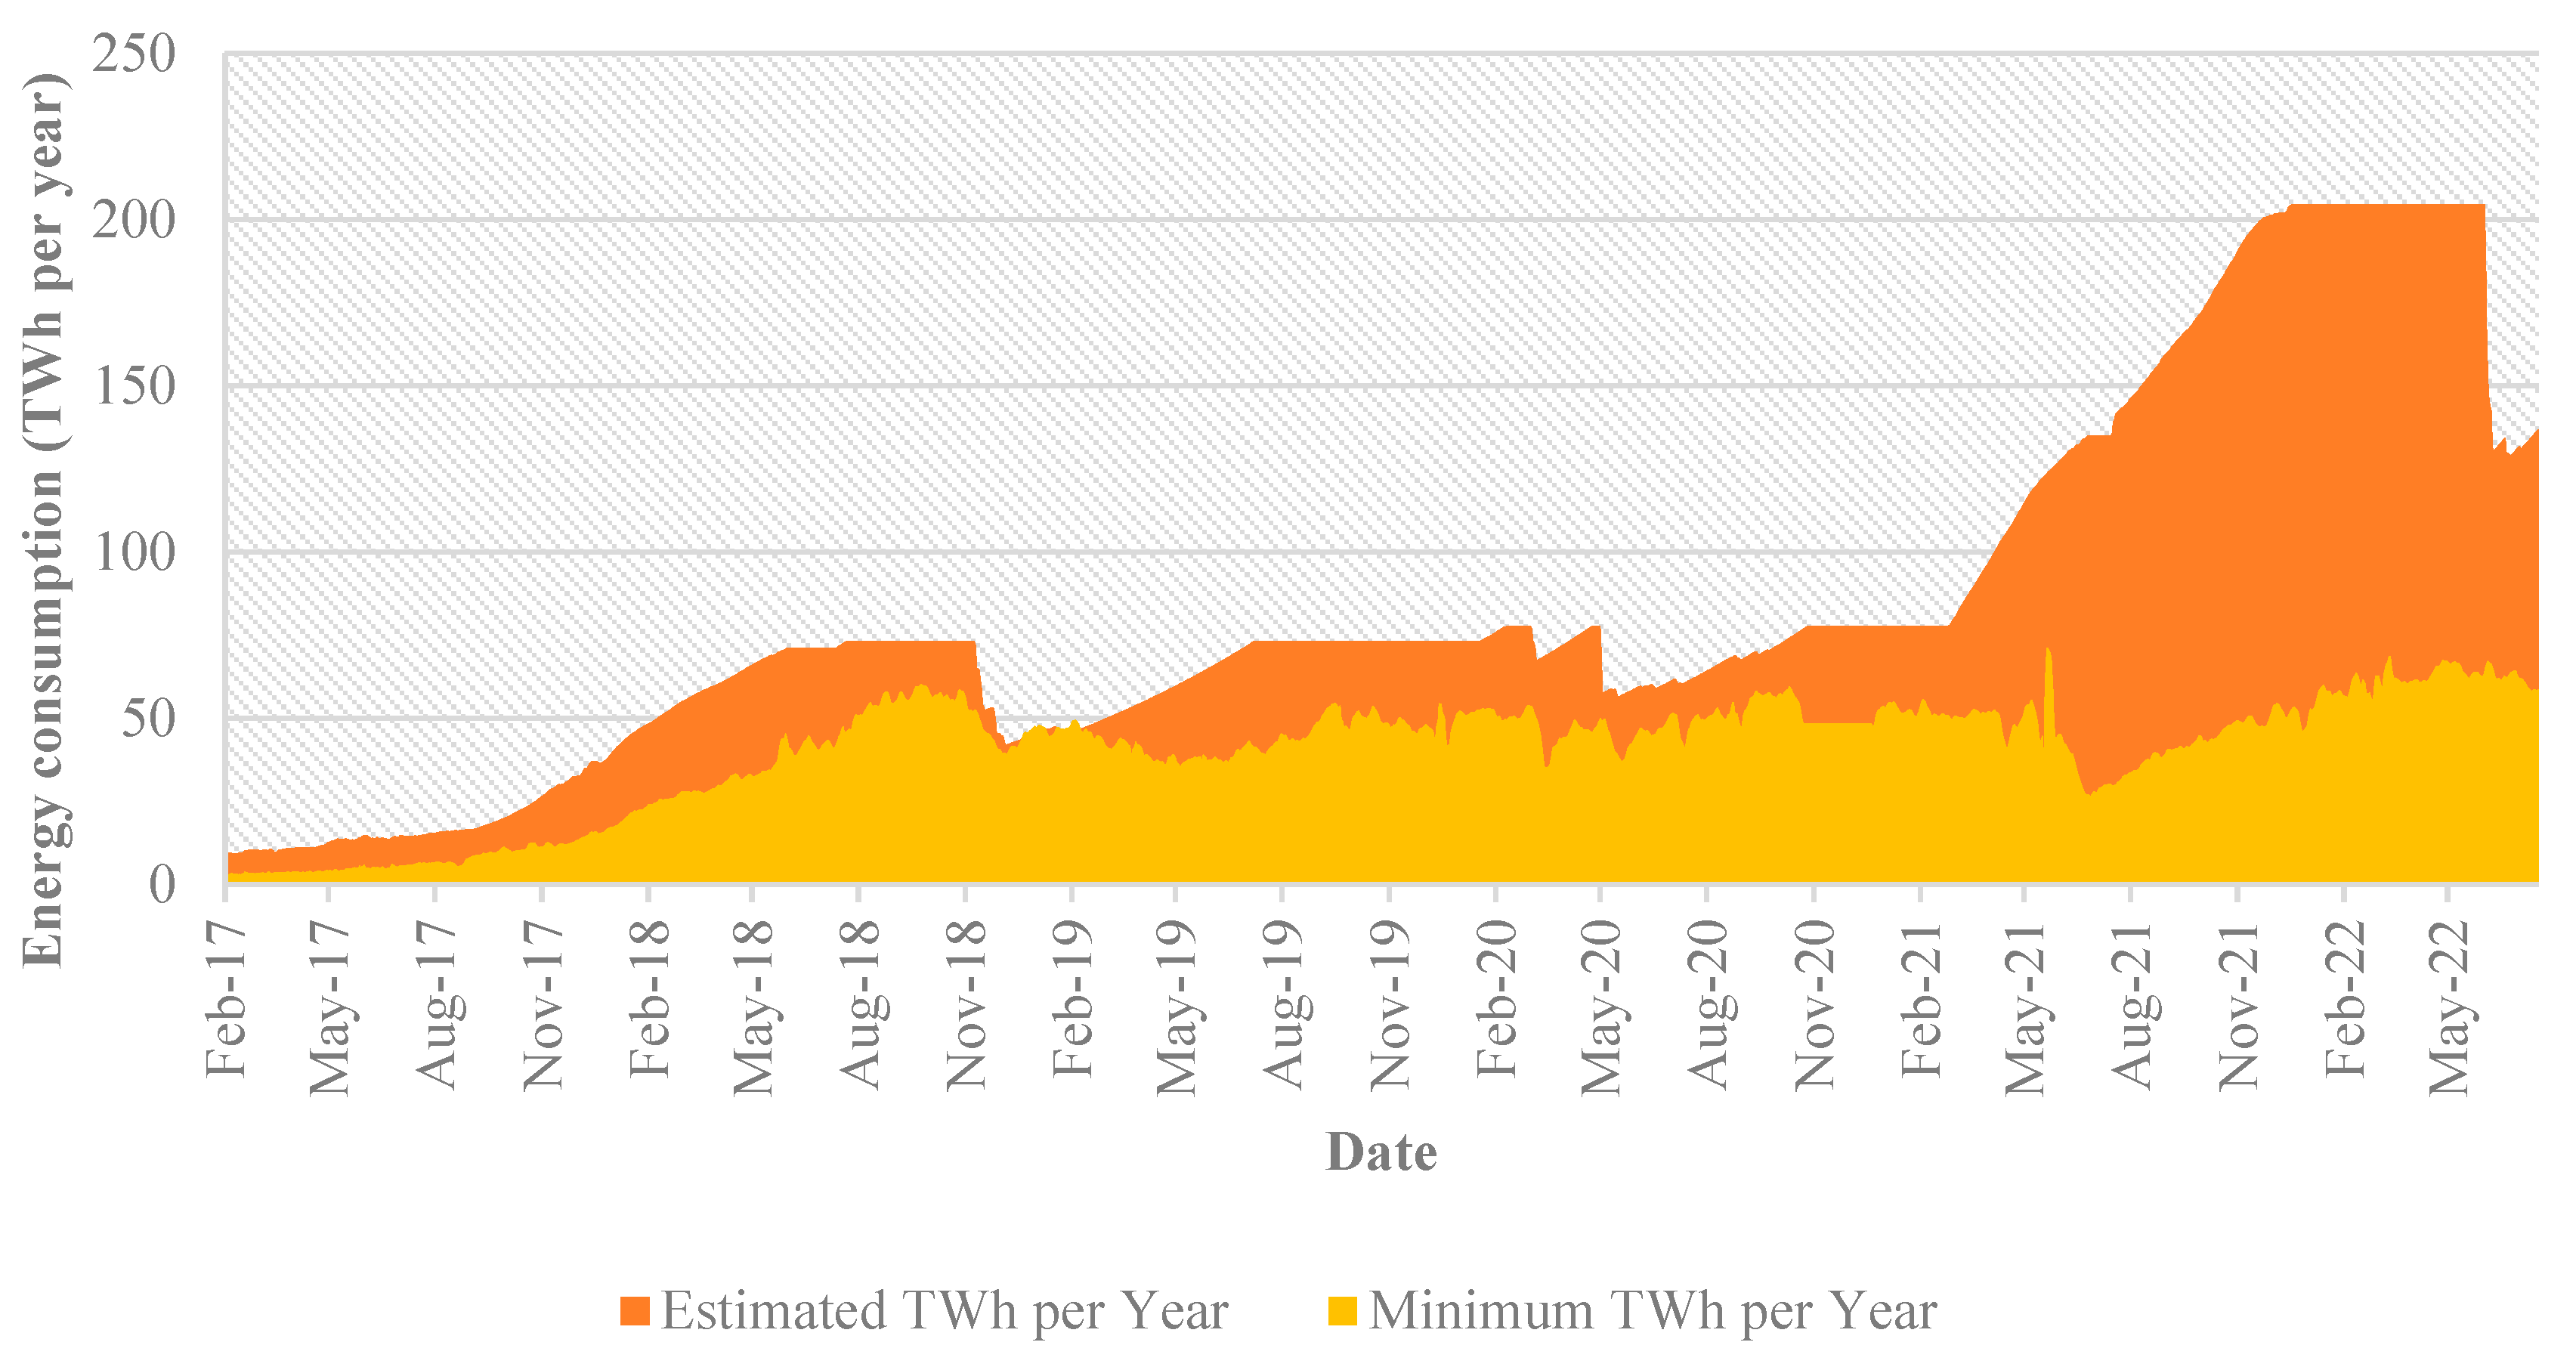
According to Digiconomist, a platform Vries developed, the Bitcoin network might use up to 204.50 TWh of electricity in 2022 [61]. This quantity of energy is similar to Thailand’s electricity use. Additionally, Digiconomist calculated the minimum amount of power needed to maintain the Bitcoin network. The estimated minimum consumption in 2022 was slightly more than 60 TWh. This estimate is derived from the network’s overall hash rate and is predicated on all miners using Bitmain’s Antminer S19 Pro, which consumes 3250 Watts of electricity. Even the most conservative estimate of Bitcoin mining is now higher than the predictions provided in 2018. Figure 8 displays the minimum and predicted power usage for the years, 2017–2022 [61].
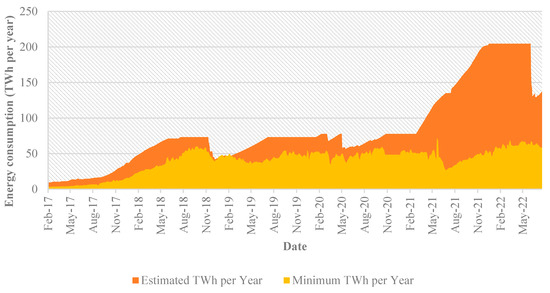
Figure 8.
Consumption of the Bitcoin network at a minimum and an estimate from February 2017 to May 2022.
Additionally, according to Digieconomist, the Bitcoin network will emit 114.06 MT of CO2 in 2022, which is comparable to the Czech Republic’s carbon footprint. A Bitcoin transaction uses 2188.59 kWh of electricity and emits 1220.71 kg of CO2. The theoretical capacity of the Bitcoin network is 220 million transactions per year [61].
5.1.2. Ethereum
Despite being the second-largest cryptocurrency, very little analysis of Ethereum’s environmental effects has been carried out. Despite Ethereum’s prominence, its environmental footprint has been overshadowed by Bitcoin’s larger energy consumption and media focus. Ethereum’s anticipated transition to the more energy-efficient Proof of Stake mechanism and the complexity introduced by its smart contracts further complicate its environmental analysis. Additionally, Ethereum’s younger age compared to Bitcoin has resulted in fewer dedicated studies on its environmental impact. According to a prediction made by the CCRI in August 2021, the yearly electrical energy consumption of the Ethereum network will be 17.3 TWh [9]. The Digiconomist prediction, however, states that the Ethereum network might consume up to 70 TWh in 2021 and 105.3 TWh in 2022 [62]. Ethereum calculated its yearly usage to be 73.2 TWh on their own websites [63]. Additionally, 144.22 kg of CO2 and 258.57 kWh of energy are consumed and expended during Ethereum transactions, according to Digiconomist. The carbon footprint of the Ethereum network is 58.77 Mt annually, almost the same as Libya’s. In the Ethereum network, one transaction uses 259.7 kWh [62].
5.1.3. Monero
According to estimates, Monero, another Proof of Work currency, used 645.62 GWh of power in 2018 [30]. Additionally, it was calculated that there were 19.42 kt CO2 in potential carbon emissions from the Monero network. The network has fewer transactions and users, which might be the cause of the lower usage compared to Ethereum and Bitcoin. Additionally, Monero has less hashing because its block period is only 2 min as opposed to Bitcoin’s 10 min [64]. According to estimates from Statista, the Monero network handled roughly 1.6 million transactions in 2018. Energy usage per transaction is close to 400 kWh/tx when dividing the yearly consumption by the number of network transactions performed. In the world of cryptocurrency, four years is a long time; therefore, new data would be required to provide an accurate picture of the consumption of Monero mining.
5.2. Proof of Stake Projects
The CCRI conducted research on the use of Proof of Stake currencies in 2021 [9]. This research looked at how much power was used by transactions, nodes, and whole networks. The experiments were designed using nodes functioning on diverse hardware configurations to gather insights into the energy consumption patterns of these cryptocurrencies. Table 1 provides an overview of the annual energy consumption and carbon emissions of selected PoS-based projects.

Table 1.
Projects using PoS need energy and emit carbon.
5.3. Other Consensus Mechanisms
5.3.1. Ripple
A 2019 study by Ripple compared the emissions from cryptocurrency transactions to those from Visa and MasterCard transactions. An XRPL transaction was estimated to use 7.9 Watts per hour in this investigation. The research did not provide any data on the whole network’s power consumption, but you can obtain an approximation of the yearly consumption by multiplying the number of transactions by their combined consumption. On the basis of the information supplied by Statista, the number of transactions per year was computed (pp. 2013–2021, [65]). The information supplied the total number of transactions completed on the final day of each month, and this figure served as a benchmark for that month. A more precise figure would require data from every single day, and the number of transactions each year is only an estimate because the transactions might fluctuate greatly from day to day. Using this approach, it was determined that XRPL transactions totaled a little under 426 million in 2019. The total consumption would have been close to 3,364,800 kWh per year when the quantity of transactions was multiplied by the amount of energy used in each transaction. Researchers predicted in 2017 that XRPL would use 336, 112 kWh yearly [66]. In addition, the study predicted that a transaction would consume just 0.01133 Wh, which is far less than the prediction made by Ripple in their study. Another analysis conducted in 2020 predicted that a validator in XRPL will use between 411.01 and 426.83 kWh of power yearly [55]. The current number of validators of XRPL is 144 [66].
5.3.2. IOTA
There is not much information available on IOTA’s energy use; however, a 2020 study contrasted IOTA transactions with Visa and Mastercard transactions [67]. One IOTA transaction, according to this study, would only use 0.000164 kWh. The IOTA Ecosystem Development Fund supported the study.
5.4. Comparison of Different Cryptocurrencies
To better understand the energy consumption and carbon emissions of various cryptocurrencies, data are compared in this section to those of previous studies as well as to transactions made using more widely used payment methods like Visa and MasterCard.
The company utilized 741, 306 GJ of energy in 2019, which is equal to 205,918,275.67 kWh, according to Visa’s 2020 Corporate Responsibility & Sustainability Report [68]. According to the study, data centers accounted for nearly half of the company’s use, with the remainder coming from offices and travel. The study also indicated that the Visa network handled 138.3 billion transactions in 2019 and that CO2 emissions were 586,366 MT. The quantity of data center consumption is divided by the number of transactions in this study to determine the fees brought on by Visa transactions, which result in a consumption of 0.00075 kWh/tx.
According to MasterCard’s 2020 Corporate Sustainability Report, the company as a whole utilized 107,320 MWh and 61,862 MWh, respectively in its data centers. 32,455 MT of carbon dioxide were emitted as a result of data centers. Mastercard processed just over 90 billion transactions in 2020 [69]. When the energy usage of the data centers is divided by the volume of transactions, the result is 0.00069 kWh/tx. Since most research on cryptocurrencies does not take into account consumption caused by buildings and cooling systems, the energy consumption per transaction is estimated using data centers’ energy consumption rather than the entire company’s usage.
5.4.1. Energy Consumption of a Transaction
Table 2 shows that PoW projects use the most transaction energy when compared to all other projects when using Visa and Mastercard transactions. Proof of Work (PoW) requires miners to solve complex puzzles, consuming vast amounts of energy, with much of the computational effort wasted in competitive mining. This high energy use, especially when sourced from non-renewable resources, leads to significant carbon emissions. Additionally, the need for frequent hardware upgrades results in electronic waste, and the method’s unsustainable growth implies escalating environmental consequences as adoption increases. Alternatives like Proof of Stake offer potential environmental benefits, balancing security and efficiency [70]. The disparities in the power consumption of other projects can be more clearly described if PoW projects are not included in the comparison. Cardano uses the most energy, 51.59 Wh/tx, while Solana uses the least, 0.166 Wh/tx. A single Bitcoin transaction uses more energy than ten million Solana or three million Master transactions.
Table 2.
A comparison of cryptocurrency projects that use PoW, PoS with Visa and MasterCard.
5.4.2. Energy Consumption of the Network
When comparing PoW projects’ yearly energy consumption, Bitcoin, Ethereum, and Monero consume the most energy. In contrast, Visa and Mastercard handle the most transactions—more than the combined volume of the Bitcoin, Ethereum, and Monero networks—and Solana processes the most transactions—more than 11.8 billion yearly. Polkadot, Avalanche, and Cardano used the least energy.
5.5. Financial Determinants of Bitcoin
Sarkodie et al. [71] examined the financial determinants of Bitcoin energy consumption and carbon footprint using dynamic ARDL simulations and general-to-specific VAR. They found that over the long term, a rise in Bitcoin transaction volume increases Bitcoin’s energy and carbon footprint by 24%, whereas a sudden spike in trade volume increases both by 46.54%.
Bitcoin’s financial determinants, such as its price, mining profitability, and overall market demand, can indeed impact the network’s energy use and CO2 emissions. High prices and increased market demand typically result in increased mining activities, as the potential for profit rises. This surge in mining activity leads to a greater demand for computational power, which inevitably escalates energy consumption and associated CO2 emissions. Moreover, as the price of Bitcoin appreciates, it becomes financially viable for miners to invest in more powerful, energy-intensive hardware to compete in the network and earn rewards. This phenomenon further fuels the energy consumption and resultant carbon emissions. However, it is also important to acknowledge that advancements in technology, such as more energy-efficient mining hardware and the potential adoption of more sustainable energy sources for mining operations, can potentially mitigate these environmental impacts. Additionally, changes in the Bitcoin protocol itself, such as a shift from the energy-intensive Proof of Work consensus mechanism to a more energy-efficient model like Proof of Stake, could also play a significant role in shaping Bitcoin’s future environmental footprint. In conclusion, while Bitcoin’s financial determinants do indeed have a noticeable impact on its energy consumption and CO2 emissions, the complex interplay of technological advancements, changes in consensus mechanisms, and the energy sources used for mining operations also contribute to this environmental narrative.
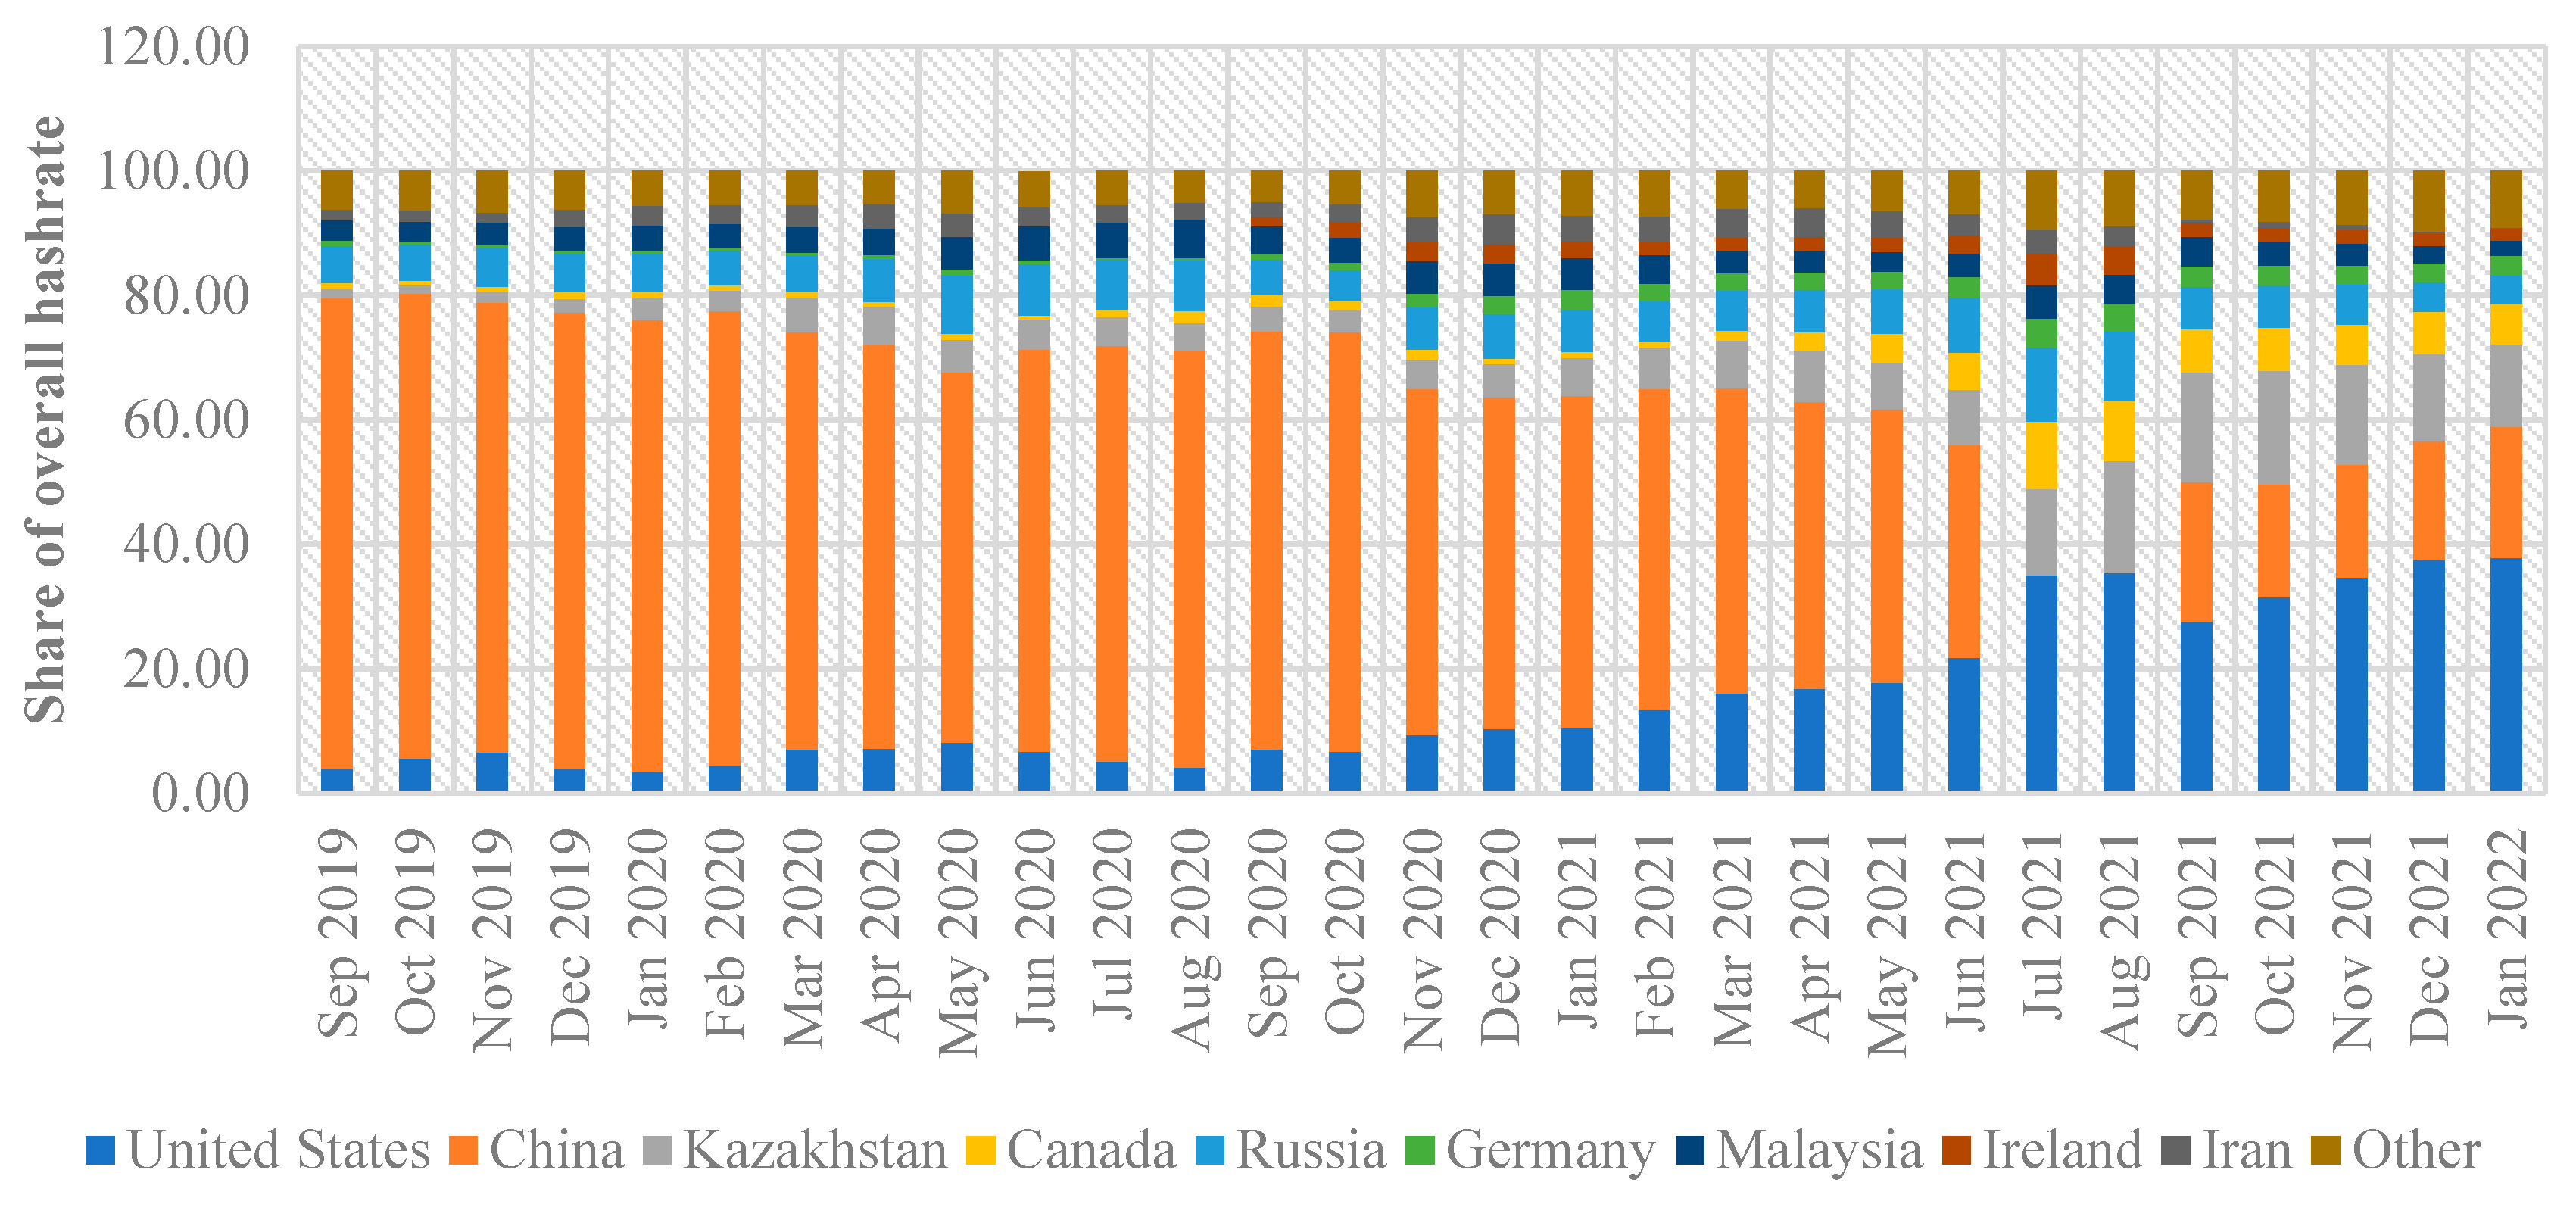
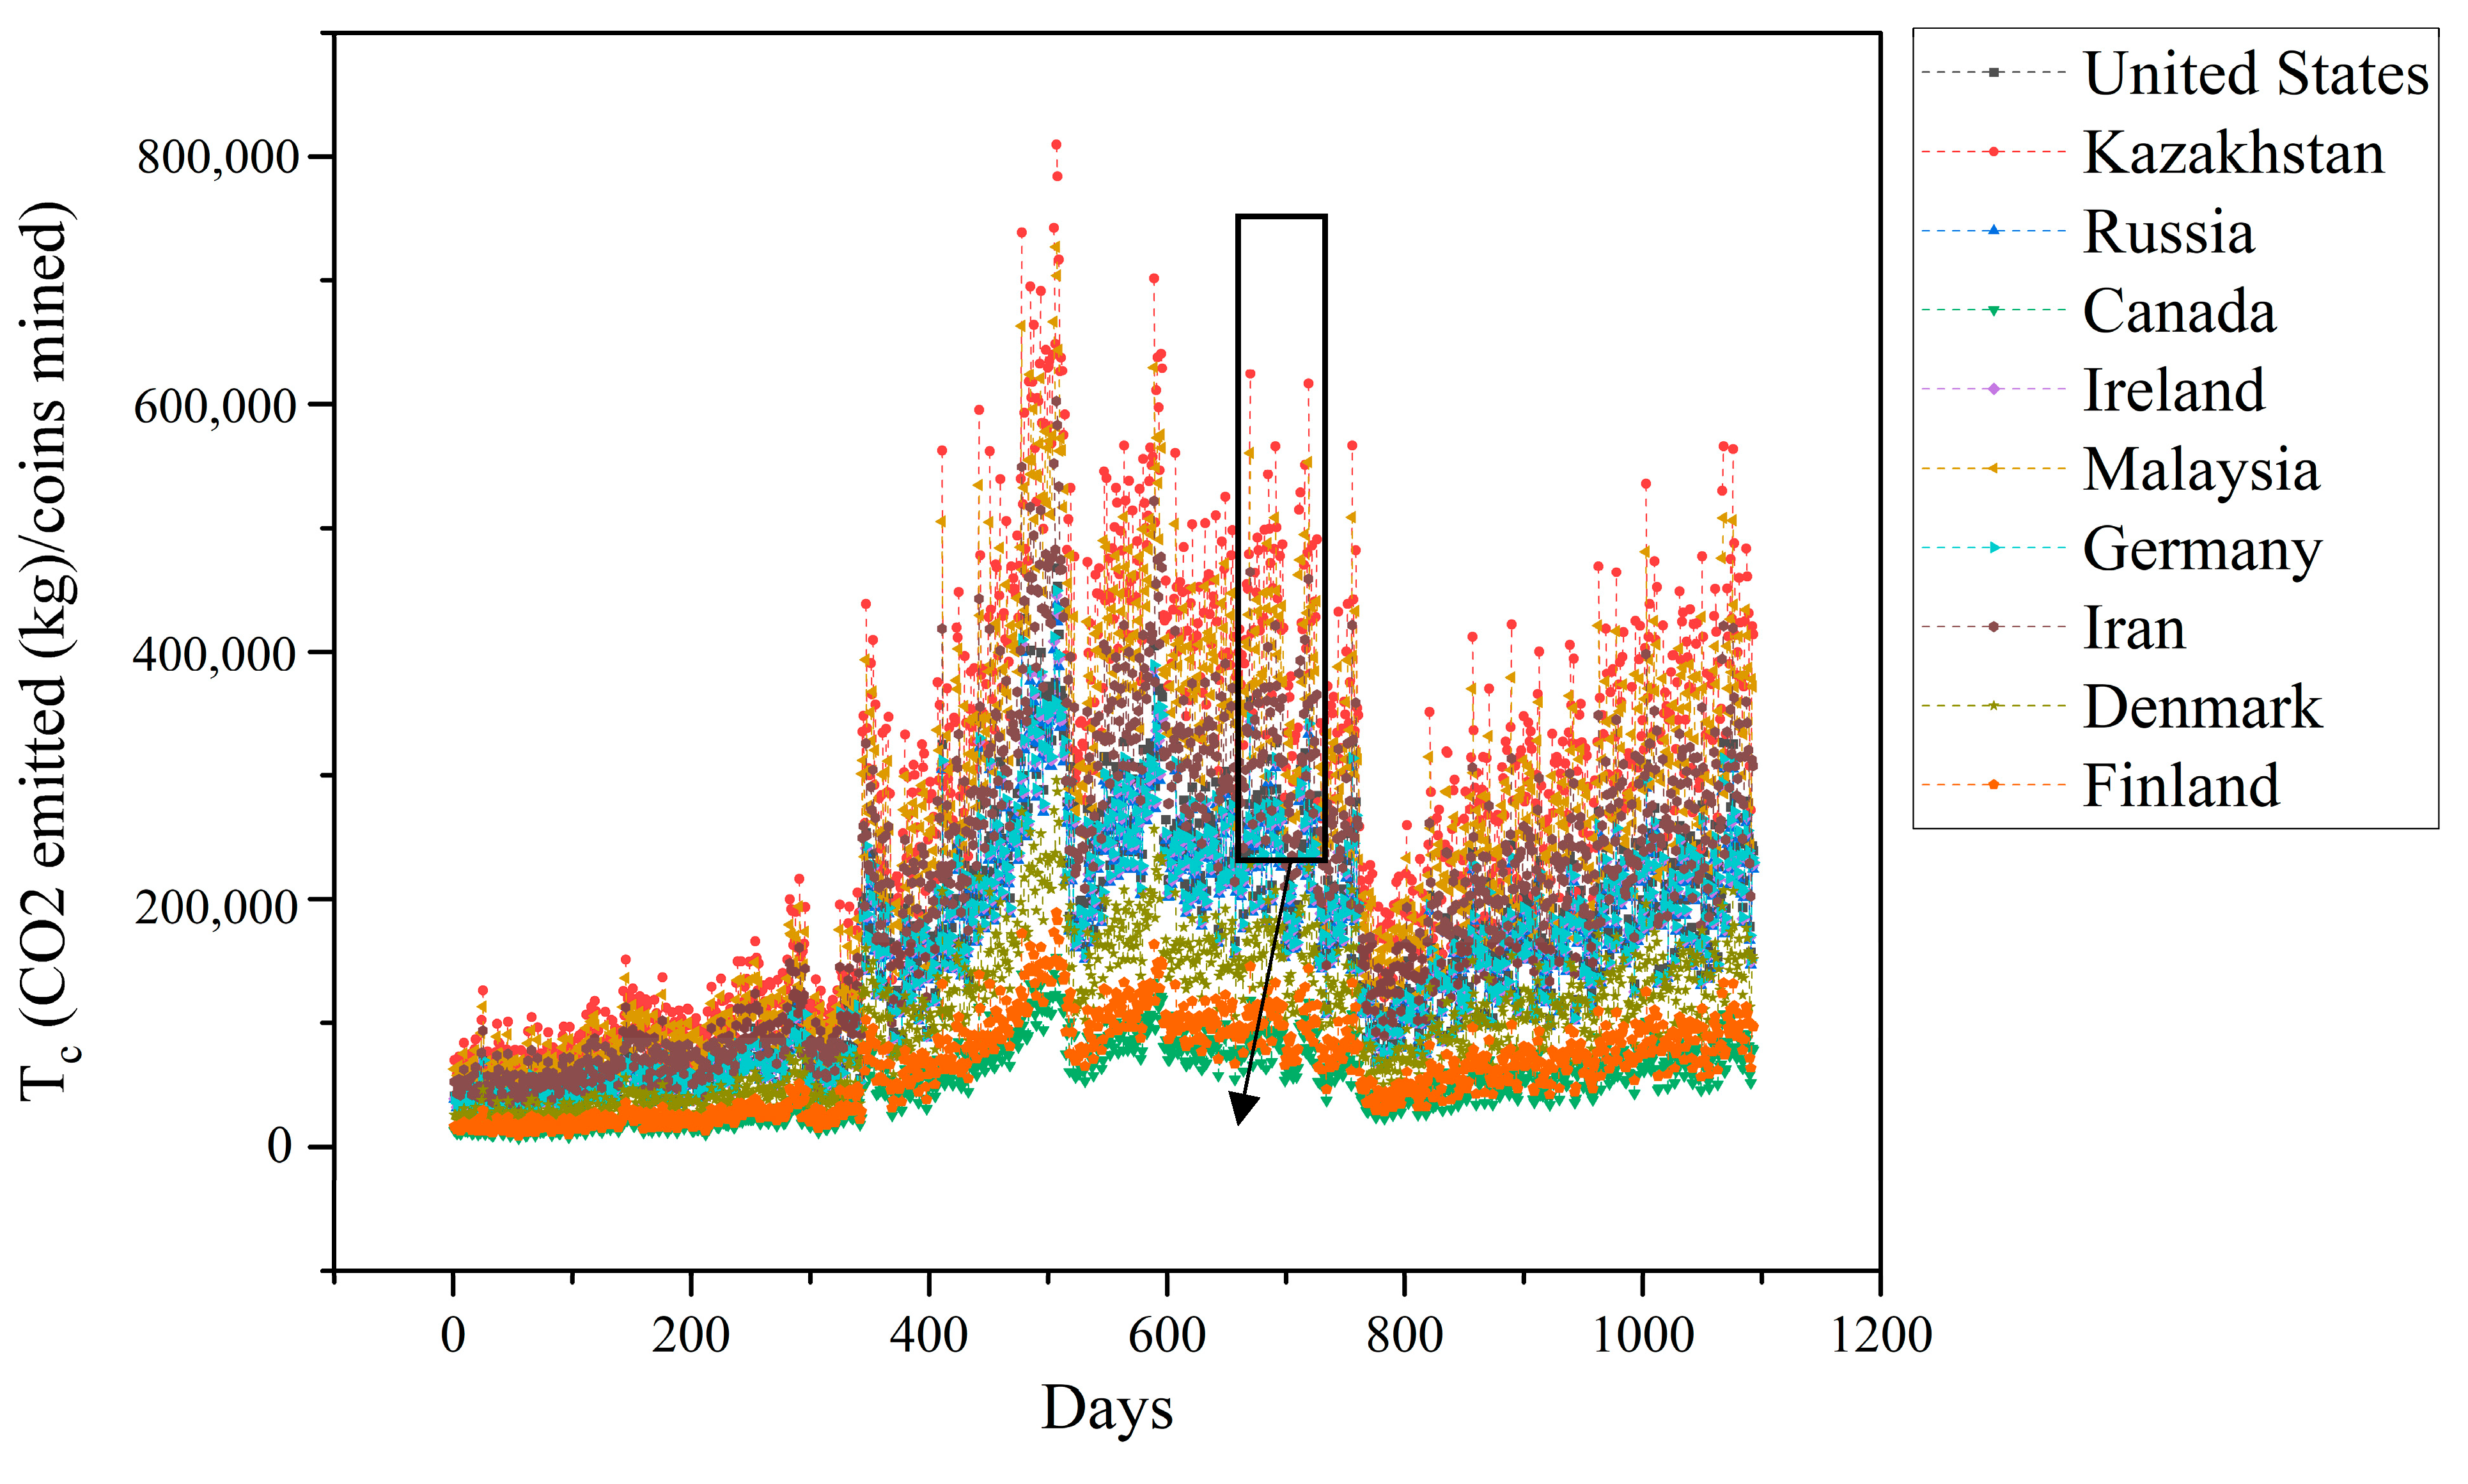
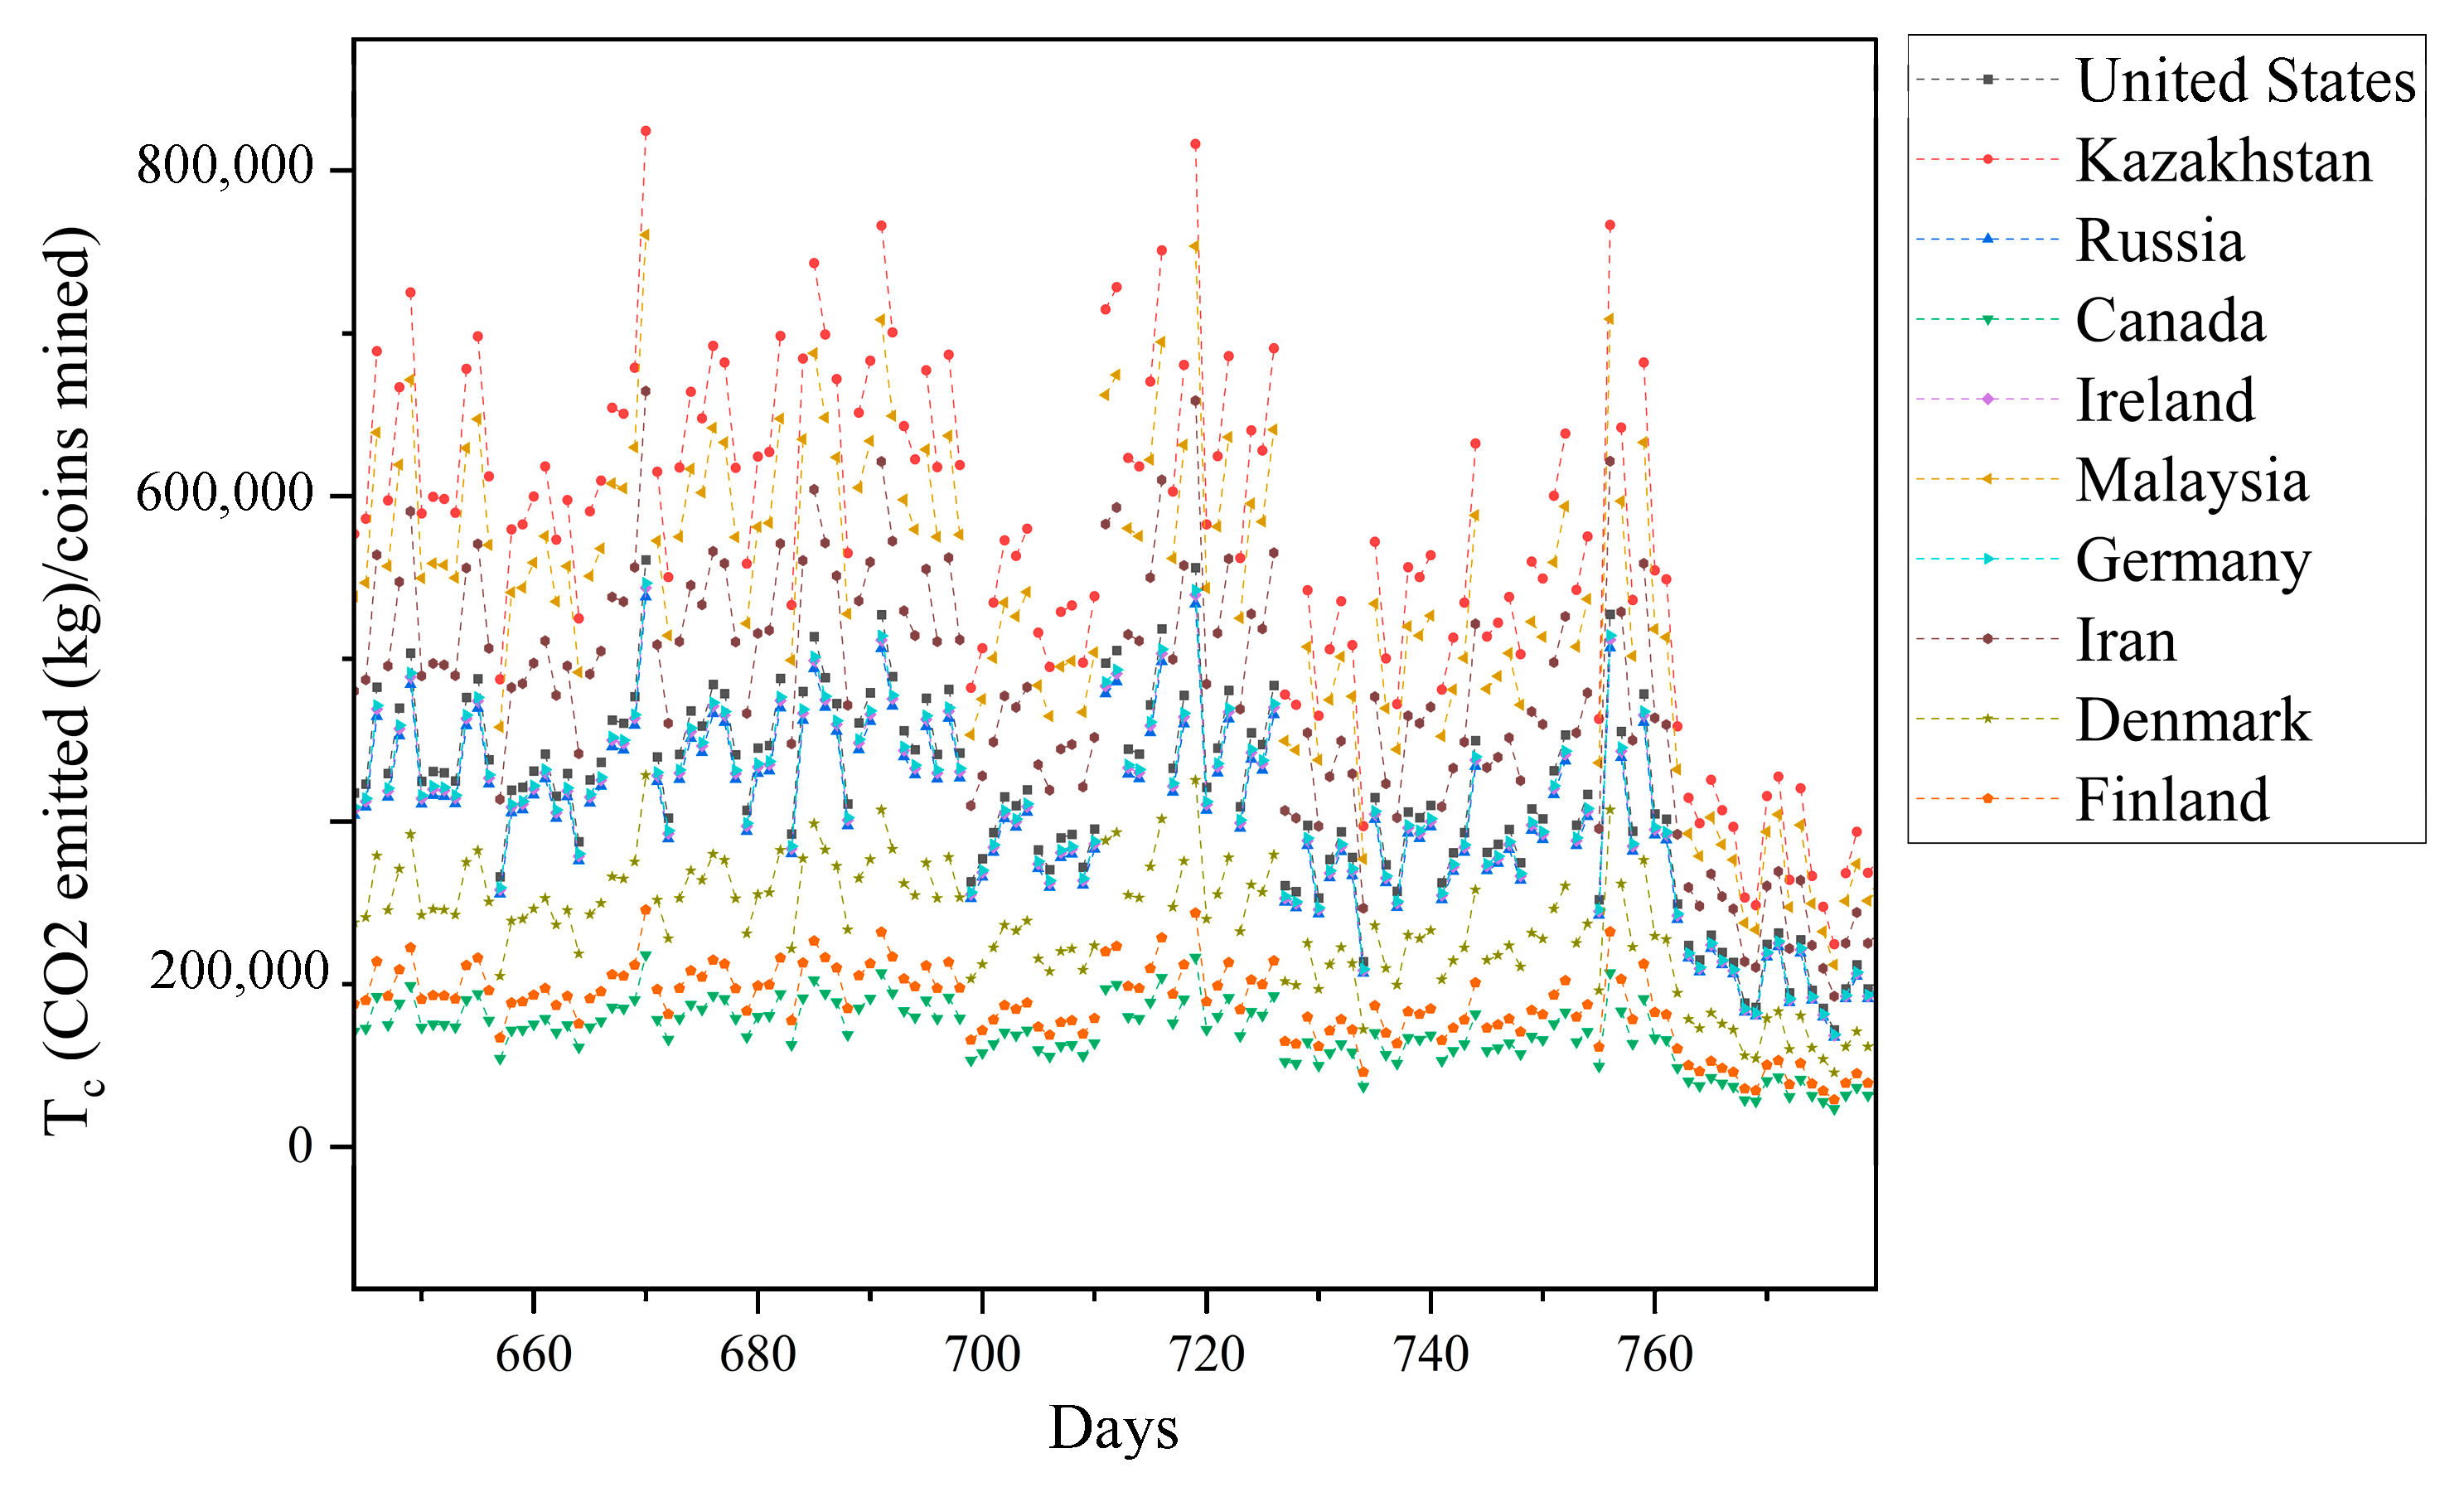
Figure 9 displays the breakdown of the hashrate used to mine Bitcoins by country from September 2019 to January 2022. We determined the Tc for several countries, as shown in Figure 10. This demonstrates the significant variation in Bitcoin carbon costs among countries. The two countries with the lowest Tc are Canada and Finland. The promising sites for Bitcoin miners are these countries.

Figure 9.
Distribution of Bitcoin mining hashrate by country.
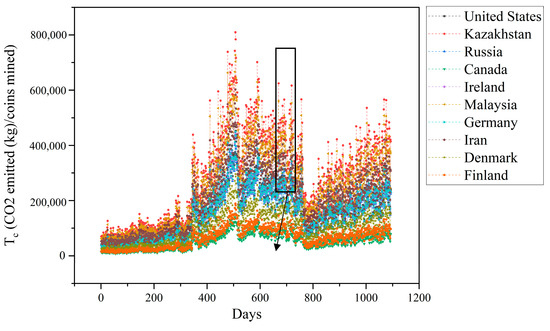
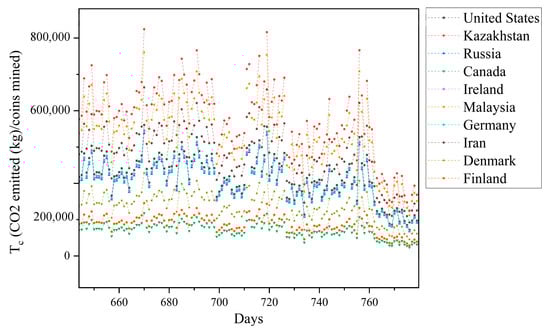
Figure 10.
Tc for different countries.
5.6. Comparison with Different Industries
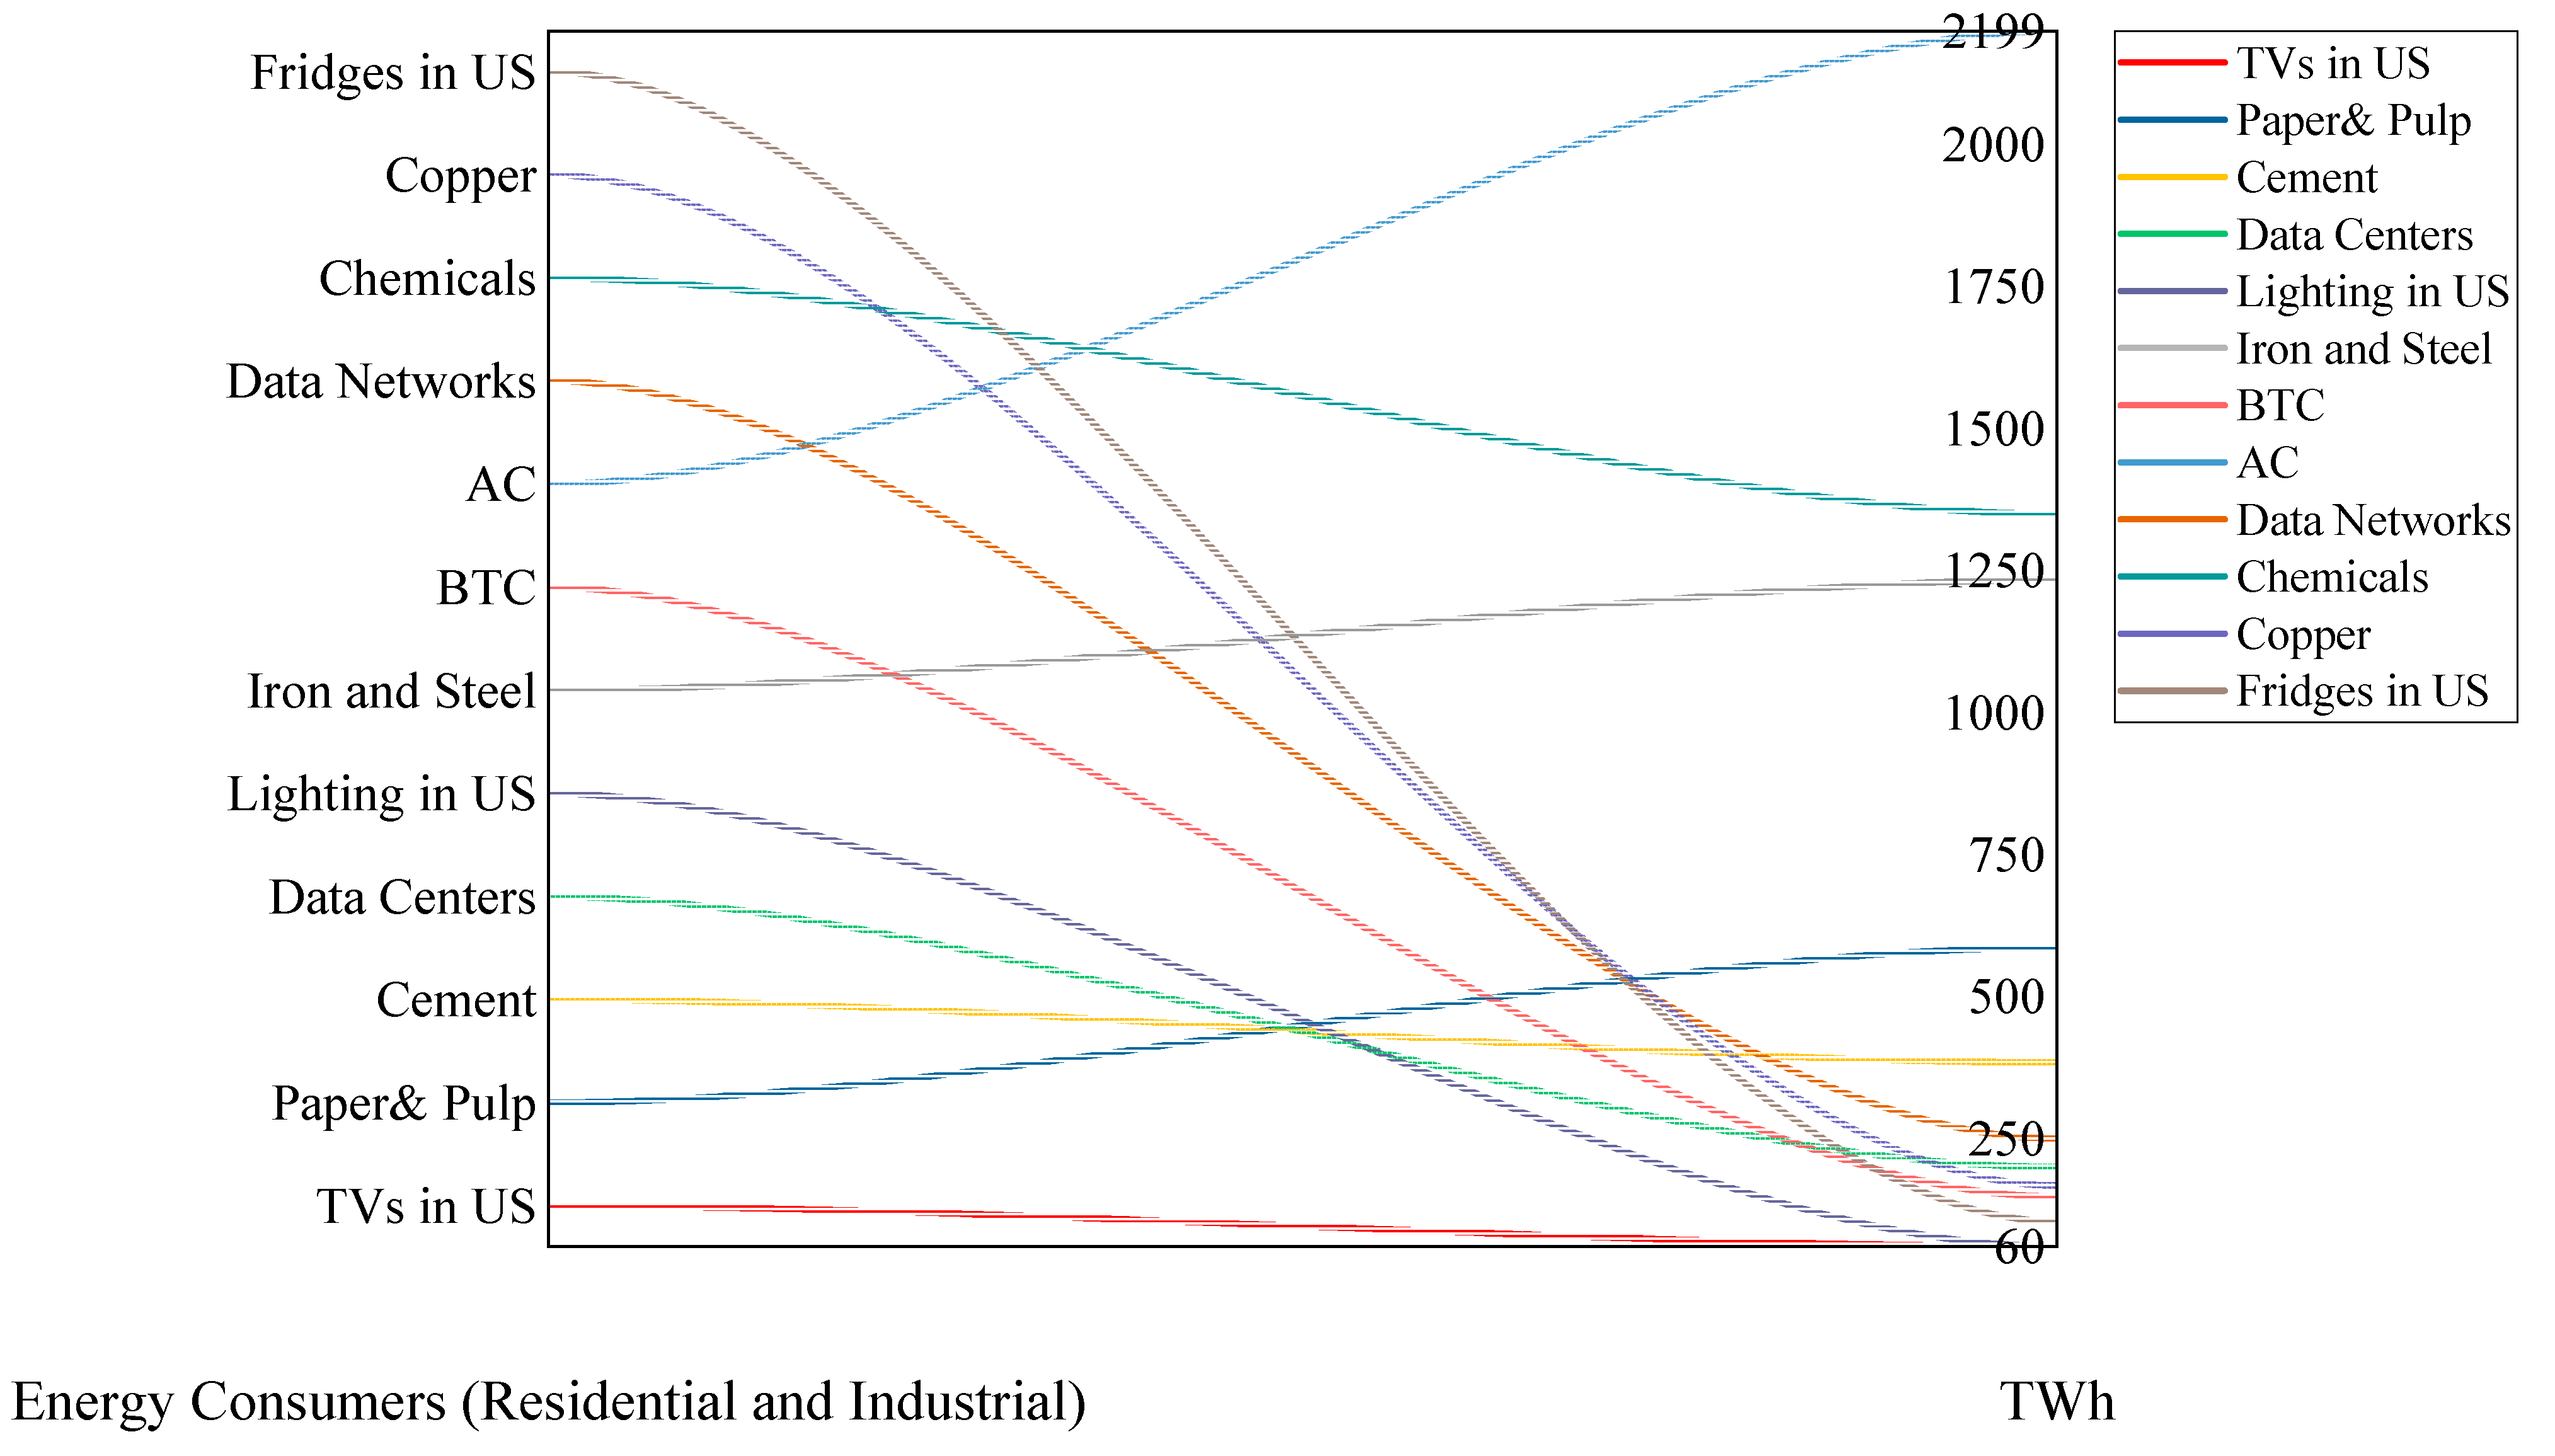
As the number of relevant comparisons with qualitatively similar activities is very small, we now move on to alternative applications that have little in common—or even very little in common—with Bitcoin other than the fact that they are energy-intensive in and of themselves. Therefore, we have analyzed these differences from a quantitative perspective rather than from a qualitative one. We differentiate between industrial (producing raw materials) and residential usage (appliance or equipment utilization), as shown in Figure 11 [72]. Although the figure clearly shows that BTC uses less energy than many other sectors, like chemicals, iron and steel, paper and pulp, cement, and data centers, should we consider BTC to be a new industry?
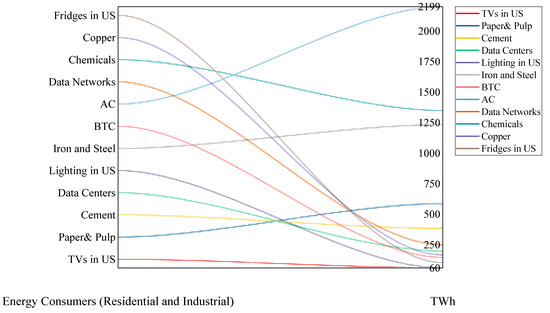
Figure 11.
Energy consumption of Bitcoin compared with different industry.
6. Recommendations
The evolving landscape of cryptocurrency, with its profound implications for environmental sustainability, necessitates immediate action. To harness the potential of these digital currencies without compromising our ecological balance, we propose the following recommendations based on the findings of this paper:
- General Recommendations:
- Awareness and Education: Raise awareness about the environmental consequences of blockchain technology, especially in the domain of cryptocurrencies. Engage with stakeholders, including miners, investors, and the general public, to ensure informed decision-making.
- Transparent Reporting: Cryptocurrency projects should provide transparent and consistent reporting of their energy consumption. This will allow investors, researchers, and policymakers to evaluate their environmental impact accurately.
- Regulatory Oversight: Governments and regulatory bodies should consider implementing guidelines to ensure that blockchain projects adhere to environmental standards, akin to other industries.
- Incentives for Green Practices: Provide tax incentives or rebates for blockchain projects that implement energy-efficient practices or use renewable energy sources.
- Collaboration: Encourage collaboration between blockchain projects, environmentalists, and technologists. Collective knowledge can lead to the inception of innovative solutions to address the environmental concerns of blockchain technology.
- Addressing the Environmental Impacts of Proof of Work (PoW):
- Transition to Renewable Energy: Push for miners to transition towards renewable energy sources, such as wind, solar, or hydroelectric power, to drastically reduce the carbon footprint associated with PoW mining.
- Adoption of More Efficient Hardware: Promote the use of the latest energy-efficient mining hardware, which can significantly cut down energy consumption per computational task.
- Hybrid Consensus Models: Encourage the fusion of PoW with other consensus mechanisms, like Proof of Stake, to achieve a balanced energy consumption profile for the network.
- Algorithmic Improvements: Advocate for the continuous refinement of PoW algorithms to make them more energy efficient.
- Adjustable Mining Difficulty: Implement systems where mining difficulty is dynamically adjusted based on the network’s load, ensuring energy is used judiciously.
- Limiting Mining Rewards: Gradually phase out mining rewards, making older, less efficient hardware nonviable, leading to their eventual phasing out.
- Off-chain Transactions: Adopt systems where trivial transactions are processed outside the main blockchain, alleviating the strain on the PoW mechanism.
- Research and Innovation: Allocate resources to persistent research, development, and innovation, fostering the evolution of greener blockchain technologies.
7. Conclusions
In this review paper, we undertook a comprehensive exploration of several cryptocurrencies, focusing on their environmental impact. Our findings reveal substantial discrepancies in the energy consumption across various cryptocurrency projects. These discrepancies largely stem from the type of consensus algorithm used, with the Proof of Work algorithm exhibiting a considerably high energy footprint. Comparisons with traditional payment systems, such as Visa and Mastercard transactions, reveal that cryptocurrencies utilizing more energy-efficient consensus mechanisms can attain comparable levels of energy usage.
Further complicating the assessment is the challenge in accurately calculating CO2 emissions attributable to cryptocurrencies. The environmental footprint significantly varies based on the geographical distribution of miners and users, due to the differing carbon intensity of energy sources across regions. Though our calculations employed global averages, it is crucial to note that if the majority of users are concentrated in regions with a high carbon output like China, the actual emissions could potentially be higher.
However, our study recognizes that cryptocurrencies represent a pioneering technology with immense potential. Instead of dismissing this technology due to its environmental challenges, we believe it is crucial to address these issues and guide it towards a more sustainable future. Our research highlights that many cryptocurrency projects already demonstrate significantly lower CO2 emissions than the Bitcoin network. Therefore, continuous improvements in consensus algorithms and increasing utilization of renewable energy sources for mining operations can substantially reduce the environmental impact of cryptocurrencies.
In conclusion, as we navigate the digital era, this paper underscores the need for a nuanced understanding and sustainable approach to the evolution of cryptocurrencies, so we can harness their potential while minimizing their environmental impact.
Author Contributions
Conceptualization, methodology, software, writing—original draft preparation, supervision: A.K.; investigation, data gathering, writing—original draft preparation, analysis: F.S. All authors have read and agreed to the published version of the manuscript.
Funding
This research received no external funding.
Data Availability Statement
The data that support the findings of this study are available from the corresponding author upon reasonable request. No publicly archived datasets were generated or analyzed during the current study.
Acknowledgments
The first author acknowledges the Center for Industrial Mechanics (CIM), Department of Mechanical and Electrical Engineering, University of Southern Denmark. We also acknowledge Aalto University’s Department of Mechanical Engineering.
Conflicts of Interest
The authors declare no conflict of interest.
References
- What is Cryptocurrency? A Beginner’s Guide to Digital Currency. Available online: https://cointelegraph.com/blockchain-for-beginners/what-is-a-cryptocurrency-a-beginners-guide-to-digital-money (accessed on 18 August 2023).
- Dierksmeier, C.; Seele, P. Cryptocurrencies and Business Ethics. J. Bus. Ethics 2018, 152, 1–14. [Google Scholar] [CrossRef]
- Schinckus, C. Proof-of-work based blockchain technology and Anthropocene: An undermined situation? Renew. Sustain. Energy Rev. 2021, 152, 111682. [Google Scholar] [CrossRef]
- Cryptocurrency Prices, Charts And Market Capitalizations | CoinMarketCap. Available online: https://coinmarketcap.com/ (accessed on 18 August 2023).
- Khan, R.; Hakami, T.A. Cryptocurrency: Usability perspective versus volatility threat. J. Money Bus. 2021, 2, 16–28. [Google Scholar] [CrossRef]
- Cross, J.L.; Hou, C.; Trinh, K. Returns, volatility and the cryptocurrency bubble of 2017–18. Econ. Model. 2021, 104, 105643. [Google Scholar] [CrossRef]
- Bastian-Pinto, C.L.; Araujo, F.V.S.; Brandão, L.E.; Gomes, L.L. Hedging renewable energy investments with Bitcoin mining. Renew. Sustain. Energy Rev. 2021, 138, 110520. [Google Scholar] [CrossRef]
- Vries, A. Bitcoin’s Growing Energy Problem. Joule 2018, 2, 801–805. [Google Scholar] [CrossRef]
- Gallersdörfer, U.; Klaaßen, L.; Stoll, C. Energy Consumption of Cryptocurrencies Beyond Bitcoin. Joule 2020, 4, 1843–1846. [Google Scholar] [CrossRef] [PubMed]
- Khosravi, A.; Laukkanen, T.; Vuorinen, V.; Syri, S. Waste heat recovery from a data centre and 5G smart poles for low-temperature district heating network. Energy 2021, 218, 119468. [Google Scholar] [CrossRef]
- Global Energy Review: CO2 Emissions in 2021—Analysis—IEA. Available online: https://www.iea.org/reports/global-energy-review-co2-emissions-in-2021-2 (accessed on 18 August 2023).
- Mason, J. How to Achieve Scalability in Cryptocurrencies without Compromising the Environment? Bachelor’s Thesis, Aalto University, Espoo, Finland, 2019. Available online: https://aaltodoc.aalto.fi:443/handle/123456789/40522 (accessed on 18 August 2023).
- Howson, P.; de Vries, A. Preying on the poor? Opportunities and challenges for tackling the social and environmental threats of cryptocurrencies for vulnerable and low-income communities. Energy Res. Soc. Sci. 2022, 84, 102394. [Google Scholar] [CrossRef]
- Andoni, M. Blockchain technology in the energy sector: A systematic review of challenges and opportunities. Renew. Sustain. Energy Rev. 2019, 100, 143–174. [Google Scholar] [CrossRef]
- How does Ethereum Work, Anyway? Introduction | by Preethi Kasireddy | Medium. Available online: https://preethikasireddy.medium.com/how-does-ethereum-work-anyway-22d1df506369 (accessed on 18 August 2023).
- Permissioned Blockchain Definition. 2022. Available online: https://www.investopedia.com/terms/p/permissioned-blockchains.asp#:~:text=Enterprise%20vs.-,Public%20Use,node%20or%20a%20contributing%20miner (accessed on 18 August 2023).
- Yaga, D.; Mell, P.; Roby, N.; Scarfone, K. Blockchain Technology Overview; National Institute of Standards and Technology: Gaithersburg, MD, USA, 2018. [Google Scholar] [CrossRef]
- Sudeep, J.; Girish, S.C.; Ganapathi, K.; Raghavendra, K.; Lin, H.; Subramanya, P. Blockchain: A New Era of Technology. In Convergence of Internet of Things and Blockchain Technologies; Springer: Cham, Switzerland, 2022. [Google Scholar] [CrossRef]
- Introduction to Dapps | Ethereum.org. 2022. Available online: https://ethereum.org/en/developers/docs/dapps/ (accessed on 18 August 2023).
- Wu, K.; Ma, Y.; Huang, G.; Liu, X. A first look at blockchain-based decentralized applications. Softw. Pract. Exp. 2021, 51, 2033–2050. [Google Scholar] [CrossRef]
- What is Hash Function?—Definition from Techopedia. Available online: https://www.techopedia.com/definition/19744/hash-function (accessed on 18 August 2023).
- Crane, C. What Is a Hash Function in Cryptography? A Beginner’s Guide. Hashed Out by The SSL StoreTM. 2021. Available online: https://www.thesslstore.com/blog/what-is-a-hash-function-in-cryptography-a-beginners-guide/ (accessed on 18 August 2023).
- Yakovenko, A. Solana: A New Architecture for a High Performance Blockchain v0.8.13. 2018. Available online: https://solana.com/solana-whitepaper.pdf (accessed on 18 August 2023).
- Heilman, E. Cryptanalysis of Curl-P and Other Attacks on the IOTA Cryptocurrency. Available online: https://github.com/mit-dci/tangled-curl (accessed on 18 August 2023).
- Potential Vulnerability Found in IOTA’s Kerl Hash Function—Altcoin Buzz. Available online: https://www.altcoinbuzz.io/cryptocurrency-news/blockchain-technology/potential-vulnerability-found-in-iota-kerl-hash-function/ (accessed on 18 August 2023).
- Ethash | Ethereum Wiki. Available online: https://eth.wiki/en/concepts/ethash/ethash (accessed on 18 August 2023).
- Hileman, G.; Rauchs, M. Global Cryptocurrancy Benchmarking Study. 2017. Available online: https://papers.ssrn.com/sol3/papers.cfm?abstract_id=2965436 (accessed on 18 August 2023).
- Blockchain Explorer—Search the Blockchain | BTC | ETH | BCH. Available online: https://www.blockchain.com/charts/hash-rate (accessed on 18 August 2023).
- Ethereum Network Hash Rate Chart | Etherscan. 2022. Available online: https://etherscan.io/chart/hashrate (accessed on 18 August 2023).
- Li, J.; Li, N.; Peng, J.; Cui, H.; Wu, Z. Energy consumption of cryptocurrency mining: A study of electricity con-sumption in mining cryptocurrencies. Energy 2019, 168, 160–168. [Google Scholar] [CrossRef]
- Electricitymap | Sähkönkulutuksen Reaaliaikiaset Hiilidioksidipäästöt. Available online: https://app.electricitymap.org/zone/IN-UP (accessed on 18 August 2023).
- Nakamoto, S. Bitcoin: A Peer-to-Peer Electronic Cash System. Available online: www.bitcoin.org (accessed on 18 August 2023).
- Kang, K.Y. Cryptocurrency and double spending history: Transactions with zero confirmation. Econ. Theory 2023, 75, 453–491. [Google Scholar] [CrossRef]
- Ledger. What is Proof-of-Work. Available online: https://www.ledger.com/academy/blockchain/what-is-proof-of-work (accessed on 18 August 2023).
- Ethereum Whitepaper | Ethereum.org. 2022. Available online: https://ethereum.org/en/whitepaper/ (accessed on 18 August 2023).
- Ring CT | Moneropedia | Monero—Secure, Private, Untraceable. Available online: https://web.getmonero.org/resources/moneropedia/ringCT.html (accessed on 18 August 2023).
- Fungibility | Moneropedia | Monero—Secure, Private, Untraceable. Available online: https://web.getmonero.org/resources/moneropedia/fungibility.html (accessed on 18 August 2023).
- Mining Monero | Monero—Secure, Private, Untraceable. Available online: https://www.getmonero.org/get-started/mining/ (accessed on 18 August 2023).
- Blockchain | Moneropedia | Monero—Secure, Private, Untraceable. Available online: https://web.getmonero.org/resources/moneropedia/blockchain.html (accessed on 18 August 2023).
- Hazari, S.S.; Mahmoud, Q.H. Comparative evaluation of consensus mechanisms in cryptocurrencies. Internet Technol. Lett. 2019, 2, 100. [Google Scholar] [CrossRef]
- What Is Proof of Stake (PoS) | Definition and Meaning | Capital.com. Available online: https://capital.com/proof-of-stake-definition (accessed on 18 August 2023).
- Cardano Foundation | About us. Available online: https://cardanofoundation.org/en/about-us/ (accessed on 18 August 2023).
- Charles Hoskinson. Available online: https://iohk.io/en/team/charles-hoskinson (accessed on 18 August 2023).
- Cardano | Home. Available online: https://cardano.org/ (accessed on 18 August 2023).
- Cardano | Ouroboros. Available online: https://cardano.org/ouroboros/ (accessed on 18 August 2023).
- What is Avalanche? | Avalanche Docs. Available online: https://docs.avax.network/ (accessed on 18 August 2023).
- Buttolph, S.; Moin, A.; Sekniqi, K.; Sirer, E. Avalanche Native Token ($AVAX) Dynamics 2020/06/25. 2020. Available online: https://assets.website-files.com/5d80307810123f5ffbb34d6e/6008d7bc56430d6b8792b8d1_Avalanche%20Native%20Token%20Dynamics.pdf (accessed on 18 August 2023).
- Getting Started·Polkadot Wiki. Available online: https://wiki.polkadot.network/docs/getting-started (accessed on 18 August 2023).
- Polkadot—W3F Research. 2022. Available online: https://research-test.readthedocs.io/en/latest/polkadot/ (accessed on 18 August 2023).
- Introduction | Solana Docs. Available online: https://docs.solana.com/introduction (accessed on 18 August 2023).
- Li, X.; Wang, X.; Kong, T.; Zheng, J.; Luo, M. From Bitcoin to Solana—Innovating Blockchain Towards Enterprise Applications; Springer International Publishing: Cham, Switzerland, 2021. [Google Scholar] [CrossRef]
- XRP - XRPL.org. Available online: https://xrpl.org/xrp.html (accessed on 18 August 2023).
- Chase, B.; MacBrough, E. Analysis of the XRP Ledger Consensus Protocol. 2018. Available online: http://arxiv.org/abs/1802.07242 (accessed on 18 August 2023).
- Mauri, L.; Cimato, S.; Damiani, E. A formal approach for the analysis of the XRP ledger consensus protocol. In Proceedings of the 6th International Conference on Information Systems Security and Privacy—ICISSP 2020, Valletta, Malta, 25–27 February 2020; pp. 52–63. [Google Scholar] [CrossRef]
- Roma, C.A.; Hasan, M.A. Energy Consumption Analysis of XRP Validator. 2020. Available online: https://ieeexplore-ieee-org.libproxy.aalto.fi/document/9169427/ (accessed on 18 August 2023).
- System Requirements—XRPL.org. 2022. Available online: https://xrpl.org/system-requirements.html (accessed on 18 August 2023).
- XRPL Explorer | Network. Available online: https://livenet.xrpl.org/network (accessed on 18 August 2023).
- An Introduction to IOTA | IOTA Wiki. 2022. Available online: https://wiki.iota.org/learn/about-iota/an-introduction-to-iota (accessed on 18 August 2023).
- Global ranking of consensus mechanisms | Unblocktalent. 2022. Available online: https://www.unblocktalent.com/topics/building-blocks/consensus/consensus-ranking/ (accessed on 18 August 2023).
- Krause, M.J.; Tolaymat, T. Quantification of energy and carbon costs for mining cryptocurrencies. Nat. Sustain. 2018, 1, 711–718. [Google Scholar] [CrossRef]
- Bitcoin Energy Consumption Index—Digiconomist. Available online: https://digiconomist.net/bitcoin-energy-consumption (accessed on 18 August 2023).
- Ethereum Energy Consumption Index—Digiconomist. Available online: https://digiconomist.net/ethereum-energy-consumption (accessed on 18 August 2023).
- Proof-of-Work (PoW) | Ethereum.org. Available online: https://ethereum.org/en/developers/docs/consensus-mechanisms/pow/ (accessed on 18 August 2023).
- This Year in Monero—2022 | Monero—Secure, Private, Untraceable. Available online: https://www.getmonero.org/2022/04/18/this-year-in-monero.html (accessed on 18 August 2023).
- Ripple transactions per day 2013–2021 | Statista. Available online: https://www.statista.com/statistics/1201732/average-number-xpr-transactions/ (accessed on 18 August 2023).
- Leopold, S.J.; Englesson, N. How Eco Friendly Is Our Money and Is There an Alternative? 2022. Available online: https://goo.gl/ge5cUu (accessed on 18 August 2023).
- Sori, A.A.; Golsorkhtabaramiri, M.; Rahmani, A.M. Cryptocurrency Grade of Green; IOTA Energy Consumption Modeling and Measurement. In Proceedings of the IEEE Green Technologies Conference, Oklahoma City, OK, USA, 1–3 April 2020; pp. 80–82. [Google Scholar] [CrossRef]
- Visa. Corporate Responsibility & Sustainability Report. Available online: https://usa.visa.com/dam/VCOM/download/corporate-responsibility/visa-2019-corporate-responsibility-report.pdf (accessed on 18 August 2023).
- Supplemental Operational Performance 2019Q1-2021Q1. Available online: https://www.marketscreener.com/quote/stock/MASTERCARD-INC-17163/news/MasterCard-2021-Q1-Supplemental-Materials-33108039/ (accessed on 18 August 2023).
- Qu, Q.; Xu, R.; Chen, Y.; Blasch, E.; Aved, A. Enable Fair Proof-of-Work (PoW) Consensus for Blockchains in IoT by Miner Twins (MinT). Future Internet 2021, 13, 291. [Google Scholar] [CrossRef]
- Sarkodie, S.A.; Ahmed, M.Y.; Leirvik, T. Trade volume affects bitcoin energy consumption and carbon foot-print. Finance Res. Lett. 2022, 48, 102977. [Google Scholar] [CrossRef]
- Cambridge Bitcoin Electricity Consumption Index (CBECI). Available online: https://ccaf.io/cbeci/index/comparisons (accessed on 18 August 2023).


Disclaimer/Publisher’s Note: The statements, opinions and data contained in all publications are solely those of the individual author(s) and contributor(s) and not of MDPI and/or the editor(s). MDPI and/or the editor(s) disclaim responsibility for any injury to people or property resulting from any ideas, methods, instructions or products referred to in the content. |
© 2023 by the authors. Licensee MDPI, Basel, Switzerland. This article is an open access article distributed under the terms and conditions of the Creative Commons Attribution (CC BY) license (https://creativecommons.org/licenses/by/4.0/).