Abstract
Small-scale hydropower plants (SHP) have been losing competitiveness compared to other renewable sources in the global electricity matrix due to technical, environmental, regulatory, and economic issues. In this context, and to contribute to the development and strengthening of SHP’s integration into the country’s electricity matrix, this study proposes the Balanced Scorecard (BSC) as a strategic evaluation tool for SHP projects from the prospecting phase to the pre-implementation phase, taking into account financial and non-financial performance indicators. This study aims to structure a strategic map of the SHP source composed of economic, socio-environmental, institutional, and technical perspectives, adapted to the four perspectives of the BSC, with the required performance indicators for the strategic evaluation of SHP. The development of a computer program allowed data visualization from eight case studies focusing on indicators or perspectives that jeopardize the project’s strategic viability. The results showed that (i) the adaptation of the BSC methodology for the strategic evaluation of SHP feasibility proved effective and (ii) the developed computer program demonstrated robustness and effectiveness in analyzing SHP, even in different stages of development and with different technical and environmental characteristics. Finally, the strategic evaluation of SHP feasibility is an effective tool in assisting decision makers, indicating the positive aspects and weaknesses of the project under evaluation and providing a better understanding of the asset and the areas of development that deserve greater attention to improve its performance.
1. Introduction
The decarbonization goals of the global electricity matrix have increased the prominence of renewable sources for energy generation in reducing dependence on fossil-fuel-based generation [1,2]. Several countries have announced their plans to achieve a net-zero carbon dioxide (CO2) emissions target, known as “Net Zero”. To reach this goal, progressive changes in the global energy matrix will be necessary to decrease energy-related emissions by 60% by 2050 [3].
The main renewable energy sources include established technologies such as wind, solar, hydropower, and geothermal energy, as well as newer sources such as ocean energy and hydrogen solutions [4], with hydropower being the largest contributor to the global matrix. Brazil’s electric system has one of the highest shares of renewable resources in the world, accounting for approximately 83%, compared to the global average of around 22%. The country relies heavily on hydropower generation, representing approximately 56.8% of the Brazilian interconnected system in 2021 [5]. Thus, hydropower has been playing a crucial role in this context, and its potential is being analyzed on a global scale [6,7,8,9].
Small-scale hydropower (SHP) plants in Brazil have an installed capacity of up to 30 MW. This energy source has been widely explored due to the excellent economic performance and capacity factor, providing an attractive return on investment with low risk. While the high-cost and low-cost potential has already been explored, there is still significant untapped potential in low-cost solutions [10]. Investors are seeking technological options to increase the economic viability potential of new hydropower projects [11,12,13,14].
The Balanced Scorecard (BSC) has been employed since the 1990s [15] and widely applied [16] in areas such as manufacturing, hospitality and tourism, education, healthcare, retail banks, insurance, and retail [17]. BSC proves valuable in gauging the performance of objectives [16,18], encompassing both financial and non-financial indicators stemming from strategic goals. These indicators are interlinked within a coherent cause-and-effect framework [19], facilitating the identification, analysis, and measurement of process stages that deviate from their anticipated functionality; subsequently, the BSC initiates a process of improvement [20]. However, knowledge about updates and the use of the BSC is scarce and not easily accessible to the Latin American public [18].
Some studies have used the BSC in the electricity sector. One important issue is determining which aspects energy companies should prioritize to increase quality to meet customer expectations, in this case, represented by the entrepreneur interested in the investment analysis of the plant, considering perspectives that analyze factors directly related to financial resources as well as non-financial factors [21]. Another application of the BSC was to identify the competitive factors of photovoltaic energy installation companies and model them for strategic monitoring that the installation company should achieve to increase its competitiveness [22]. The BSC has been used to evaluate investment decisions in renewable energy sources (biomass, hydropower, geothermal, wind, and solar) [23], as well as to analyze the performance of European investment policies in energy using an integrated multidimensional quality measurement approach [24] and to capture and visualize non-financial benefits of the market potential for renewable energy in the Western Australian electricity market region [25]. The tool was also used to evaluate regulated companies in the Spanish electricity market [26] and to build a project network for the process of developing new renewable energy investment services [24]. Therefore, a gap in the literature was identified regarding using the BSC in energy generation projects in the Brazilian renewable energy market, particularly for small-scale hydropower plants.
Thus, this article proposes a methodology for structuring a strategic map of small-scale hydropower projects composed of economic, socio-environmental, institutional, and technical perspectives, adapted to the original four perspectives of the BSC, with all the necessary performance indicators for the strategic evaluation of projects in this renewable source.
It is worth emphasizing that the development of this research has led to the creation of a tool that can effectively assist in the strategic evaluation of SHP project feasibility, as well as in verifying the essential prerequisites for enhancing these projects, thereby aiding decision-making processes. Furthermore, this research establishes a foundation for further studies, delineating the complexities inherent in SHP projects and formulating more effective strategies to address potential challenges. This, in turn, underscores the significance and justification of this study.
Moreover, the primary and noteworthy contribution of this study to the existing literature lies in its original proposition—an adaptation of the BSC—for the strategic evaluation of the feasibility of SHP projects. The assessment of performance indicators and the comprehensive comprehension of an SHP project’s strengths and weaknesses, as gauged through these indicators, initiate actions directed at continual enhancement and potential compensatory measures. These endeavors aim to optimize the role of SHP projects in the most effective manner possible.
The examination of performance indicators and the thorough comprehension of the strengths and weaknesses of an SHP project, assessed through its performance indicators, serve as catalysts for actions intended to enhance it or even initiate compensatory measures continually. These efforts are directed towards optimizing the role of SHP projects in the most effective manner possible.
This article is divided into six sections, including this introduction. Section 2 discusses the classic concepts of the BSC. Section 3 presents the theory used in developing the methodology for constructing the strategic map adapted to small-scale hydropower plants. Section 4 shows the description of the case studies. Section 5 applies the proposed methodology to eight case studies comprising SHP projects under development in the Brazilian electricity market. The conclusions and limitations are described in the Section 6.
2. Balanced Scorecard
The Balanced Scorecard (BSC) is utilized to implement and manage planned strategies defining and measuring goals and achievements of the strategic initiative. The BSC was first introduced by Kaplan and Norton in 1992 through an article in the Harvard Business Review, based on the premise that performance improvement can be achieved when a company plans, measures, monitors, and evaluates both the financial and non-financial aspects of the company continuously to support the realization of the company’s vision [15]. Widely adopted, the BSC is a methodology in various organizations worldwide, which considers concepts and best practices from various theories and disciplines into a single performance measure [16]. The methodology takes into account financial and non-financial indicators derived from the organization’s strategy.
The unique aspect developed with the BSC framework is its ability to convey the vision and strategy through performance indicators derived from strategic objectives and goals that interact within a logical cause-and-effect structure [19]. The tool adeptly captures the complexity of our times while maintaining the fundamental elements of its approach, such as articulating the vision with a strategy based on measurable goals [18], and performance evaluation is an essential process in asset management. BSC is useful to identify, analyze, and measure stages of the process that are not functioning as expected and initiate an improvement process [20].
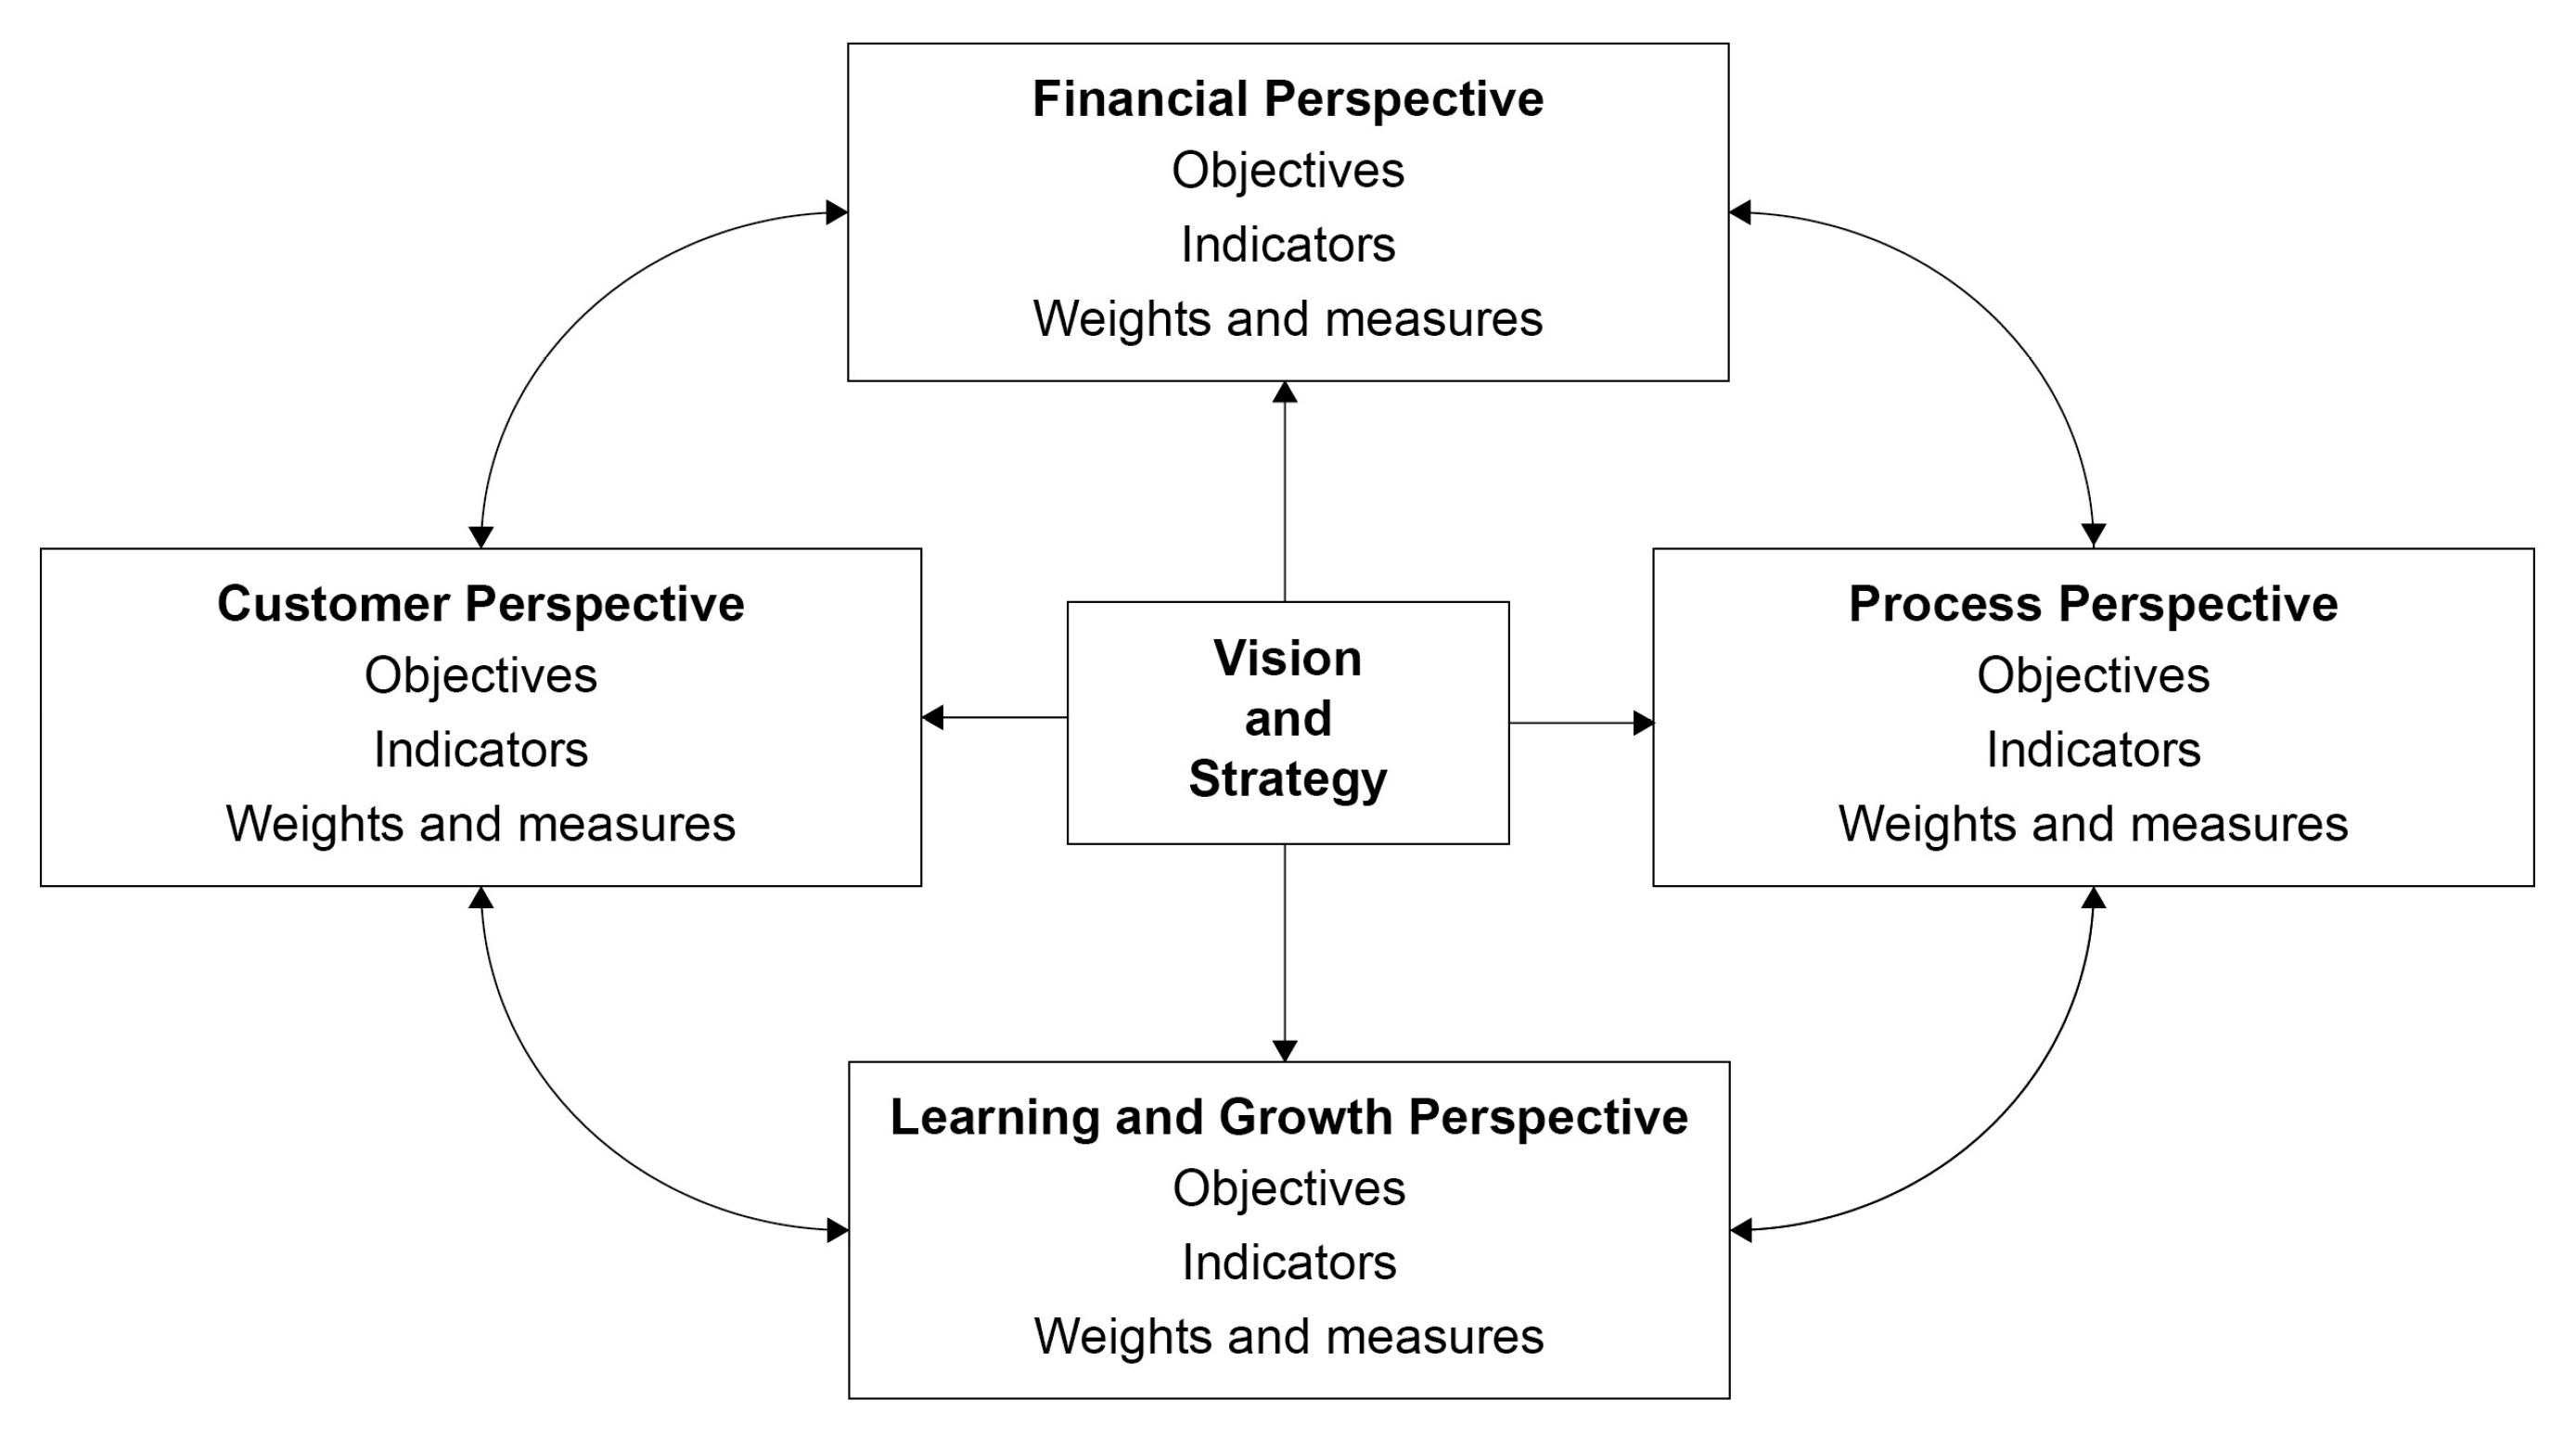
The BSC retains financial metrics as measures of ultimate outcomes for company success, while BSC compares comparing them with metrics from three additional perspectives—customer, internal processes, and learning and growth—which were proposed as the drivers for creating long-term value for shareholders. The structure of the Balanced Scorecard [21] is depicted in Figure 1.
Hence, a strategic map has a key role in developing a Balanced Scorecard (BSC) in the electrical sector. By studying all the information in the strategic maps of electricity companies, it is necessary to identify and understand the common objectives and strategies for each perspective of the BSC and thus determine the interrelation between objectives and indicators [26].
Building upon this comprehension, all the perspectives embraced in this research, accompanied by their corresponding indicators and weights, were implemented, analyzed, and, when necessary, revised with the support of experts in order to achieve good results and create a robust tool that allows decision makers to align their strategies for the development of SHP projects.
The goal of creating a robust tool is made possible by adopting the BSC, considering its comprehensive nature. The overall relationship between adopting the BSC and company performance is positive. Drawing from available statistical data in published research, the analysis undertaken by these researchers indicates that the implementation of the BSC fosters favorable organizational outcomes [27].
The BSC must tackle the question of how to attain the set objectives. However, it delineates the strategy to be adopted regarding objectives and indicators [20]. In this sense, with the correct structuring of a strategic map composed of the four perspectives adequately adapted for the development of SHP projects, with indicators exhibiting good causality correlation and appropriate weights, the developed tool can effectively evaluate SHP feasibility.
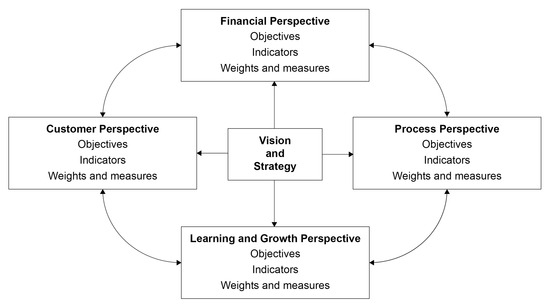
Figure 1.
Vision and strategy—four perspectives—adapted from [28].
Figure 1.
Vision and strategy—four perspectives—adapted from [28].
3. Methodology
The initial stage was defining the four perspectives upon which the BSC methodology is structured for measuring the performance of SHP. To adequately represent the distinctive nature of companies in the electricity sector, where SHP are integrated, the perspectives of the legal framework and environmental context should be incorporated [26]. In this sense, the perspectives for the strategic viability analysis of SHP were built based on the BSC perspectives, as shown in Table 1.

Table 1.
Adaptation of the BSC for SPH evaluation. Adapted from [28].
The subsequent step for developing the strategic map was to define the four perspectives that will be the guideline for the SHP feasibility analysis. While this methodology can be applicable to any energy market, the perspectives chosen in this study for SHP are presented as follows.
3.1. Economic Perspective
The economic perspective encompasses factors related to the business growth strategy, cost reduction, increased revenue, and assets profitability. It also takes into account the economic and financial risks inherent in the development of SHP projects:
- Civil Works: analyzes the costs of civil works for the SHP, considering direct and indirect costs, taxes, fees, insurance, and direct invoicing of inputs, including taxes, concerning the SHP’s guaranteed physical output.
- Electromechanical Costs: evaluates the costs of acquiring and assembling the electromechanical equipment for the SHP, including turbines, generators, electromechanical components, lifting equipment, electrical systems, auxiliary mechanical systems, power plant substations, connection bays, and insurance (including taxes), concerning the SHP.
- Transmission Line Costs: analyzes the costs of equipment and implementation of the transmission line for the SHP (including taxes), excluding land costs, about the SHP’s guaranteed physical output.
- Land Acquisition Costs: examines the costs of land evaluation, expropriation, negotiation, acquisition, establishment of administrative easements, transfer, and regularization of the lands required for the SHP’s implementation (reservoir, permanent preservation area (PPA), transmission line, and structures), with the total implementation cost of the SHP (CAPEX).
- Affected Property Costs: analyzes the costs involved in the evaluation, negotiation, and compensation of affected improvements and buildings due to the SHP’s implementation (e.g., houses, sheds, silos, corrals, and fences, among others) concerning the SHP’s CAPEX.
- Infrastructure Road Costs: analyzes the expenses linked to constructing or relocating infrastructure affected by the SHP (e.g., roads, railways, bridges, and others) concerning the SHP’s CAPEX.
- Environmental Licensing Costs: analyzes the environmental costs involved in the SHP’s implementation, such as study development, compliance with all environmental plans and programs required by the preliminary environmental license and installation environmental license, and costs related to reservoir deforestation and APP planting during the SHP’s implementation. Land costs are not considered in this item. The analysis is conducted concerning the SHP’s CAPEX.
- Grid Connection Costs: encompasses the value of the distribution system usage tariff (TUSD) or transmission system usage tariff (TUST) for the defined connection point of the SHP.
- Energy Selling Price: analyzes the weighted average selling price of 100% of the SHP’s energy in the market.
- PPA Duration: involves calculating the weighted average duration of the power purchase and sale contracts (PPA) for the SHP.
By considering these economic factors, the SHP project can assess its financial feasibility, identify potential risks, and develop strategies to ensure its economic viability and success.
3.2. Socio-Environmental Perspective
The socio-environmental perspective refers to factors that meet the needs of customers and end consumers by generating energy with the lowest impact on the surroundings, providing overall benefits to the population at regional and national levels that outweigh the negative impacts.
- Reservoir Area: analyzes the area of the SHP reservoir, excluding the riverbed area.
- Deforested Area: analyzes the area to be deforested to create the reservoir and implement the SHP structures.
- Protected Biomes Area: examines whether the SHP affects protected biomes and the affected area that will require financial compensation.
- Permanent Preservation Area: analyzes the permanent preservation area around the reservoir.
- Relocated Families: analyzes the number of families that will need to be relocated due to the implementation of the SHP.
- Affected Properties: analyzes the number of properties affected by the SHP.
- Infeasible Affected Properties: evaluates the number of properties that will become infeasible due to the SHP, considering the size of the remaining area according to state or federal legislation.
- Consumptive Uses (Multiple Uses): analyzes the average flow of consumptive uses to be deducted from the SHP’s flow series relative to the long-term average flow (Qmlt).
- Reduced Flow Reach (RFR): analyzes the extent of the reduced flow reach of the SHP, if applicable.
- Spawning Migration Reach: analyzes whether the SHP affects the migratory route of long-distance migratory fish, considering the status of the environmental licensing process.
- Indigenous Land: analyzes whether the SHP affects indigenous land (TI) and, in this case, whether it obtained authorization from the National Congress for indigenous licensing or presents elements that could cause a direct socio-environmental impact on TI.
- Integral Protection Units: analyzes whether the SHP affects integral protection areas such as parks, forests, private reserves, or buffer zones.
- Area of Relevant Archaeological Potential: analyzes whether the SHP affects an area with relevant archaeological potential.
- Communities, Settlements, or Traditional Peoples: analyze whether the SHP affects communities, settlements, or traditional peoples.
- Downstream Population: analyzes whether there are population centers, communities, or municipalities downstream from the SHP’s dam and the time required for evacuation in case of dam failure.
- Population Acceptance of the SHP: analyzes the acceptance of the directly affected population and the municipality(ies) where the SHP will be implemented.
By considering these socio-environmental factors, the SHP project can assess its impact on ecosystems, local communities, and cultural heritage and develop strategies to minimize adverse effects and maximize benefits for the environment and the affected populations.
3.3. Institutional Perspective
The institutional perspective considers factors of internal processes to ensure compliance with municipal, state, and federal legislation, regulatory agencies, and environmental licensing authorities. This aims to minimize regulatory and legal risks inherent in the development of an SHP project.
- Regulatory Status: evaluates the status of the authorization process for the SHP project.
- Water Resources Usage Permit Status: analyzes the status of obtaining the water resources usage permit.
- Environmental Agency Status: analyzes the status of environmental licensing for the SHP project at the competent environmental agency from the beginning of the licensing process until obtaining the installation license.
- Environmental Compensation Status: evaluates the flora and fauna compensation process status for the SHP project at the environmental agency.
- Historical and Cultural Heritage Protection Status: analyzes the status of obtaining approvals from organizations responsible for protecting historical and cultural heritage.
- Protection of Black Culture Status: analyzes the status of obtaining approvals from organizations responsible for protecting Black culture for the environmental licensing of the SHP project.
- Agrarian Reform Agency Approval Status: analyzes the status of obtaining approvals from the agrarian reform agency for the environmental licensing of the SHP project.
- Forest Protection Status: analyzes whether the SHP project affects preserved forest areas and the status of the compensation process at the environmental agency.
- Indigenous Culture Protection Status: analyzes whether the SHP project affects indigenous lands or presents elements that could cause a direct socio-environmental impact on indigenous territories.
- Municipal Approval Status: evaluates the status of obtaining certificates of land use and occupancy from the municipality for the SHP project.
- Public Prosecution Status: analyzes whether there are legal processes involving the SHP project at the Public Prosecution Office and their status.
- Judicial Process Status: analyzes the existence of judicial processes against the SHP project and their status.
- Connection Contract Celebration Status: analyzes the status of the process of entering into contracts for the use of distribution and transmission systems.
By addressing these institutional factors, the SHP project can ensure compliance with regulatory requirements, mitigate legal risks, and establish a solid foundation for successful development and operation within the legal framework.
3.4. Technical Perspective
The technical perspective treats the learning and growth strategy of the company’s team under analysis, aiming to apply the knowledge of the engineering disciplines involved (e.g., electrical, mechanical, civil, environmental, and hydromechanical, among others) to meet the requirements of the other perspectives, applying state of the art of existing technologies, to optimize SHP projects. A list of performance indicators and their appropriate allocation is characterized as follows:
- Installed Capacity: analyzes the installed capacity of the SHP project, which, according to current legislation, is usually equal to or less than 30.0 MW.
- Gross Head: analyzes the gross head of the SHP project (Upper Normal Level minus Lower Normal Level).
- Dam Height: analyzes the total height of the main dam of the SHP project, from the base of the foundations at the deepest point to the dam’s crest.
- Aspect Ratio: analyzes the aspect ratio of the SHP project, a parameter with physical significance that relates the installed capacity of the SHP project to its gross head, developed by [28].
- Hydrological Information: analyzes the quality of the hydrological data used in generating the flow series of the SHP project and other hydrological studies, such as minimum, maximum, and reservoir filling flows.
- Nominal Spillway Discharge: analyzes the design discharge of the spillway of the SHP project (return period of 1000 years or 10,000 years) concerning Qmlt on the axis of the dam of the SHP project.
- Ecological Flow: analyzes the residual flow of the SHP project (flow to be allocated to the reduced flow reach, if it exists) concerning the long-term average flow on the axis of the dam of the SHP project.
- Penstock Length: analyzes the length of the penstock tunnel, if it exists, in the SHP project and the need to install a discharge device such as a surge tank.
- Intake Canal: analyzes the length of the intake canal, if it exists, in the SHP project and the requirement for the installation of a discharge device such as a loading chamber.
- Transmission Line: analyzes the length of the exclusive transmission line for the SHP project, which connects the SHP substation to the connection bay at the power delivery substation.
- Connection Voltage: analyzes the connection voltage at the power delivery substation based on the installed capacity of the SHP project.
- Electrical Losses—Connection: analyzes the electrical losses from the generator terminals to the energy delivery point. If the SHP project connects to the grid, the losses to the system’s center of gravity should be added.
- Capacity Factor: analyzes the capacity factor of the SHP project (physical guarantee of the SHP project divided by its installed capacity).
- Foundation Rock: analyzes the type of rock present in the foundations of the structures of the SHP project.
- Natural Construction Materials: analyze the distance for obtaining natural construction materials for the SHP project, such as sand, coarse aggregate, soil for the dam, and riprap.
By taking into account these technical factors, the SHP project can ensure the application of engineering knowledge, use advanced technologies, and optimize its design and implementation, contributing to its overall success and performance.
Causal relationships between strategic objectives are usual in this business. As an example of cause and effect within the selected performance indicators for the strategic evaluation of SHP projects, we can consider the case of the gross head indicator. Altering the gross head of the SHP project, changes can occur in indicators related to installed capacity, dam height, aspect ratio, the need for an intake canal or tunnel, residual flow, and changes in the SHP project’s capacity factor within the technical perspective. If this alteration in the gross head leads to changes in the reservoir area or the reduced flow reach of the SHP project, in that case, it may affect the ease or difficulty of environmental licensing processes, environmental compensation, and obtaining approvals from environmental, indigenous, and socio-cultural preservation agencies.
The concept of causal relationships between objectives and measures in the Balanced Scorecard framework led to the creation of a strategic map [24]. In this regard, the adaptation of the Balanced Scorecard for the strategic evaluation of SHP project feasibility was conducted by structuring a strategic map for the specific power source under analysis, with the establishment of measures causally linked to strategic objectives.
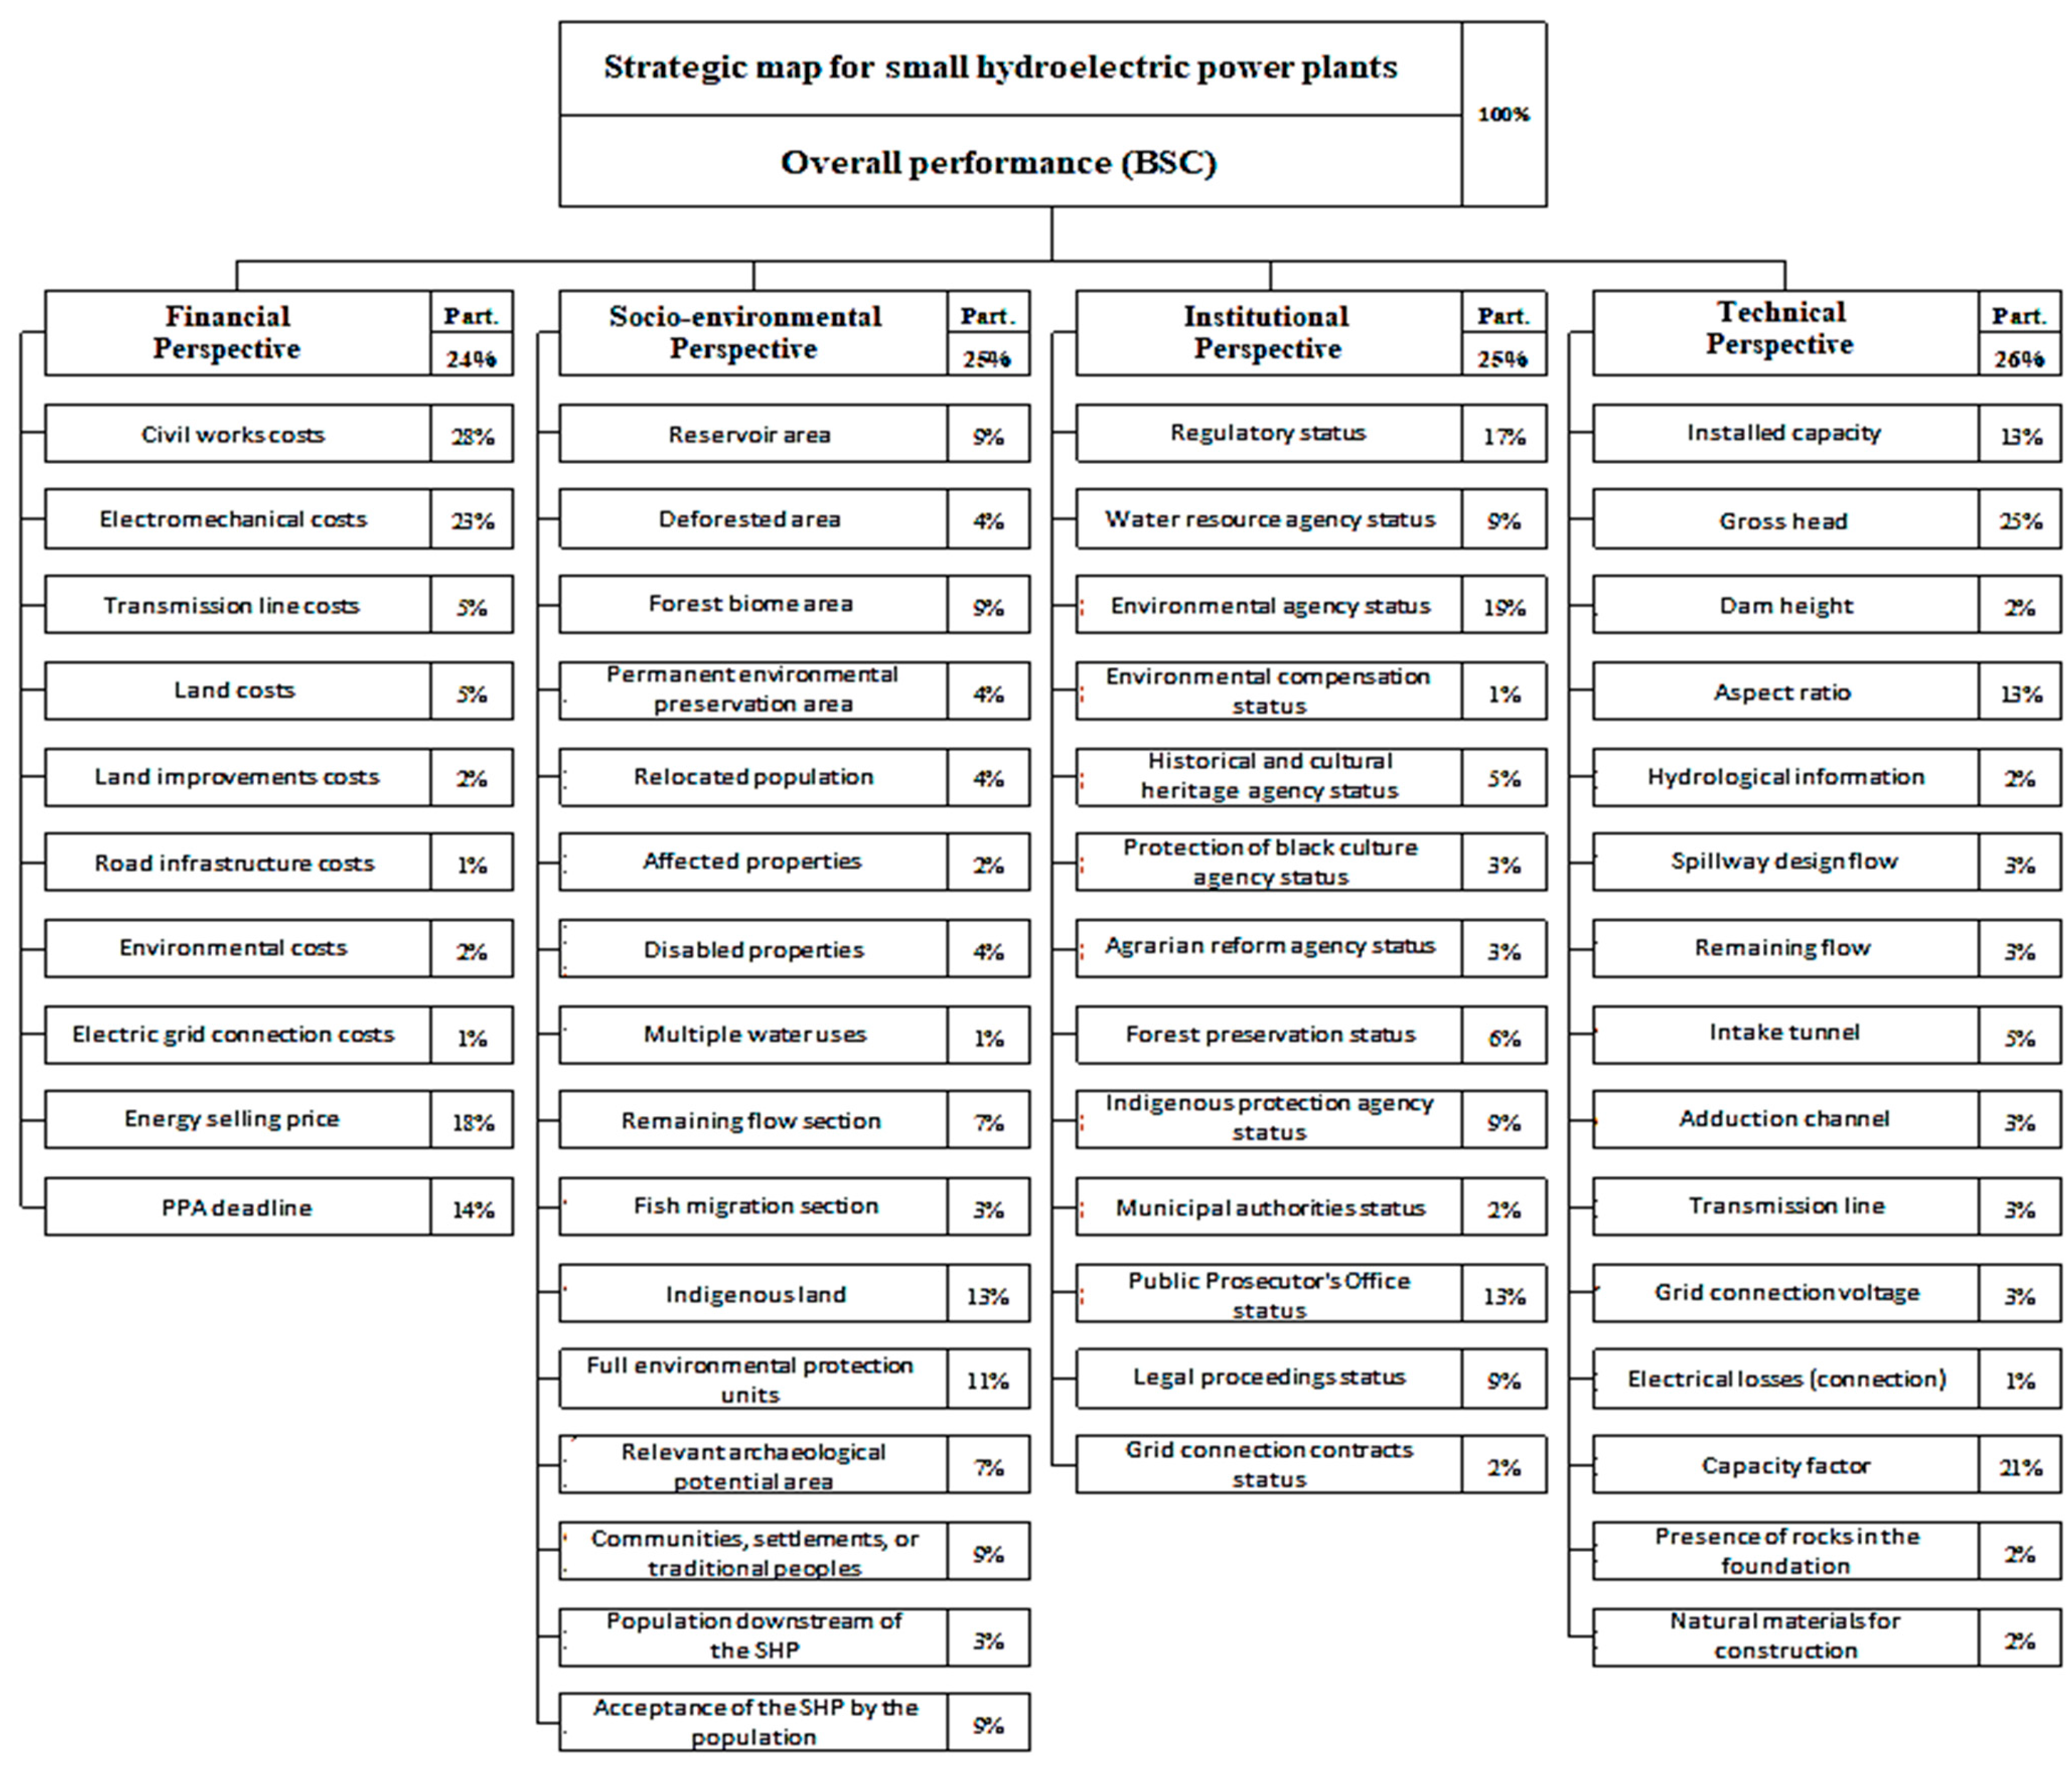
The strategic map visually represents an organization’s objectives and the cause-and-effect relationships [25]. Moreover, the SHP project’s strategic map requires assigning weights to the performance indicators. The strategic map of the SHP project is shown in Figure 2.
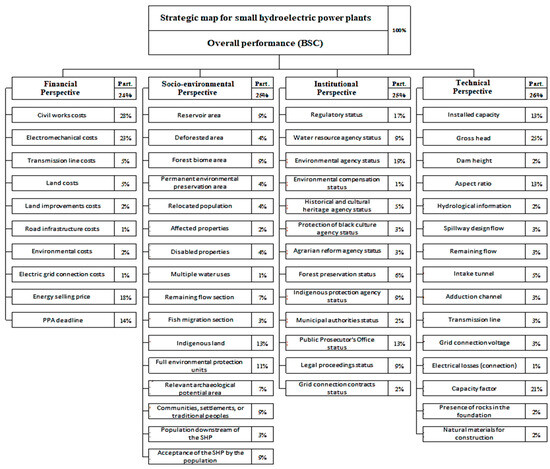
Figure 2.
SHP’s strategic map.
Primarily, concerning the establishment of performance indicators for SHP within the strategic map, Questionnaire #1 was devised and administered to a specialized technical/executive body engaged in SHP implementation, with professional experience ranging from 10 to 30 years in the SHP market, encompassing both public institutions and private enterprises. This facilitated the gathering of essential attributes and variables associated with the implementation of these small power plants, thereby enabling a thorough strategic analysis of the feasibility of this energy source.
Subsequently, Questionnaire #2 was formulated and presented to the group to assist in refining the selected performance indicators for each SHP perspective, tailored for strategic viability assessment. Concluding this phase of the research, case studies of the BSC application in real SHP projects were conducted to calibrate the developed model, thus enabling the structuring of a robust framework for strategic viability analysis of SHP.
Within the context of the formulas utilized in the performance calculation spreadsheet for every indicator, perspective, and overall performance of the SHP project, depicted below, which led to the development of the computer program, it is essential to underscore that the weights assigned to each indicator assist in identifying the most relevant ones. Through the application of Equation (1), which encompasses the weights of each indicator, the percentage contribution of each indicator within each perspective is calculated.
in which:
- PI(x)—percentage contribution of indicator “x” in the analyzed perspective.
- pI(x)—weight of indicator “x”.
- ∑pI(n)—sum of weights of all indicators in perspective “n”.
- X—indicator number.
- N—perspective number, ranging from 1 to 4.
The weights for all indicators within the four perspectives have been established. Alongside computing the percentage contribution of each indicator within its allocated perspective, the percentage contribution of each perspective in the overall performance is calculated using Equation (2):
in which:
- PP(n)—percentage contribution of perspective “n”.
- ∑pI(n)—sum of weights of all indicators in perspective “n”.
- ∑pI(1)—sum of weights of all indicators in perspective 1.
- ∑pI(2)—sum of weights of all indicators in perspective 2.
- ∑pI(3)—sum of weights of all indicators in perspective 3.
- ∑pI(4)—sum of weights of all indicators in perspective 4.
- n—perspective number, ranging from 1 to 4.
Once the weights are obtained, the calculation involves the percentage contribution of each indicator within its perspective, as well as calculating the percentage contribution of each perspective to overall performance. These calculations assist in evaluating the relative importance of each indicator and perspective in assessing the overall performance of the SHP project.
After receiving expert feedback on indicator details, the performance calculations for each indicator, perspective, and the overall performance of the case studies were initiated to evaluate the effectiveness and calibration of the developed model.
A computer program called “SAID-pch” was subsequently developed using Microsoft Office Excel 2021™ based on the calculation spreadsheets and tables created during this research. The program comprises a presentation screen, a data entry screen, hidden calculation tabs based on the strategic map and indicator details, and result presentation screens.
The performance of each perspective is calculated using Equation (3), which involves multiplying the performance of each indicator by its respective weight and divides the result by the sum of the weights of all indicators in the given perspective.
in which:
- DP(n)—performance of perspective “n”.
- DI(x)—performance of indicator “x”.
- pI(x)—weight of indicator “x”.
- ∑pI(n)—sum of weights of all indicators in perspective “n” under analysis.
Derived from the performance results of the four perspectives, the overall performance can be determined through Equation (4). This equation entails multiplying the performance outcomes of each perspective by their respective percentage contribution, calculated using Equation (2).
in which:
- DG—overall performance.
- DP(1)—performance of the economic perspective.
- DP(2)—performance of the technical perspective.
- DP(3)—performance of the legal perspective.
- DP(4)—performance of the socioenvironmental perspective.
- PP(1)—percentage contribution of the economic perspective.
- PP(2)—percentage contribution of the technical perspective.
- PP(3)—percentage contribution of the legal perspective.
- PP(4)—percentage contribution of the socioenvironmental perspective.
The BSC indicators are assessed on a scale ranging from 1 to 10. The same scoring system, ranging from 1 to 10, is applied to the partial performances for each perspective and the overall performance. The weights allocated to each indicator reveal their significance, rendering data normalization unnecessary.
The method presented in this study is universally applicable to SHP projects across different countries. While this research has focused on the Brazilian hydropower market, the proposed method’s practical application is detailed in the subsequent section.
4. Case Studies
Data from eight SHP projects were evaluated utilizing the computational program developed specifically for this study. The purpose was to verify the capacity and effectiveness of the strategic viability assessment of SHP. Notably, these selected projects exhibit distinct characteristics and collectively represent a substantial portion of ongoing SHP initiatives within Brazil.
While the methodology is amenable to application and adaptation in alternative systems or countries, its validation occurred within the framework of the Brazilian small hydropower plant market. As per Brazilian regulations, the installed capacity of an SHP is constrained to 30 MW. Nonetheless, the delineation of performance indicators, along with their corresponding weights and intricacies, necessitates a comprehensive re-evaluation within the specific context of the prevailing reality and legislative landscape of the intended system or country of implementation.
The assessment of SHP projects was helpful to fine-tuning the parameters and assumptions adopted in the program. The incorporation of expert opinions played a pivotal role in appraising the efficacy of the selected indicator, the corresponding weight allocations, and the overall performance evaluation of each SHP. Comparisons between different SHP projects conceived for these case studies facilitated meaningful comparisons, thereby substantially enhancing the utility of the findings.
In this stage, the recognition of the significance associated with juxtaposing outcomes derived from distinct SHP projects utilizing the program prompted the acknowledgement of a need. This observation, combined with the realization that the calculation spreadsheets and the “Data Entry” and “Results” screens of the program supported this comparison of up to three projects, motivated us to make these adjustments to the program.
Refinements to the calculation spreadsheet, embedded within the computational program, were iteratively undertaken across the spectrum of the eight case studies, notably, the indicator details and weights adopted. This enhancement empowers decision makers with the expeditious means to differentially evaluate diverse projects, promptly discerning their respective merits and limitations across a diverse array of viewpoints and key metrics. By facilitating these comparative analyses, this feature inherently streamlines the identification of pivotal areas warranting precedence within the ambit of project development and enhancement initiatives.
The SHP projects selected for the case study and their essential technical data are presented in Table 2.
Table 2.
Technical data of selected projects for the case studies.
5. Results
The software developed exhibits a user-friendly interface. Through numerical data and graphical representations, it facilitates swift assessments of individual projects as well as comparative analyses across multiple projects. The results distinctly elucidate the strengths and weaknesses inherent in the evaluated SHP projects, grounded in indicators and perspectives. The selected eight SHP projects span a spectrum development stages, featuring power capacities ranging from 5.1 MW to 30 MW. Notably, the software furnishes outcomes that seamlessly align with the unique context of each SHP project, thereby effectively spotlighting their respective strong points and areas for improvement. A comprehensive depiction of the aggregate and partial performance evaluations of the eight SHP projects is presented in Table 3.
Table 3.
Evaluation of the eight small hydropower plants (SHP).
In terms of the economic perspective, it is noteworthy that SHP6 has yet to commence energy trading This circumstance can be attributed to its comparatively inferior technical attributes and ongoing legal complications, as identified through the institutional perspective analysis. Additionally, SHP6 also has lower scores in the indicators of road infrastructure, distribution system tariff costs, environment, and transmission line costs. In other words, the engineering and environmental areas, responsible for the technical and socio-environmental perspectives, need to be engaged for the examination of road interferences and their potential solutions, issues related to the electrical system connection of this SHP, as well as environmental matters, in order to identify the best solutions for the high costs that will be incurred in complying with environmental plans and programs for the implementation of this SHP. Moreover, it is evident that the low head characteristic culminates in escalated equipment expenses, while the restricted power output contributes to elevated civil engineering costs per megawatt of installed capacity.
Similarly, the SHP8 has yet to commercialize its energy too. Analysis conducted through an institutional perspective underscores the necessity for SHP8 to secure essential regulatory clearances, namely the Water Resources Usage Permit and its Preliminary Environmental License, which are prerequisites for energy commercialization according to Brazilian legislation. It also has lower scores in the indicators of road infrastructure, distribution system tariff costs, and environment. Therefore, the engineering and environmental areas responsible for the technical and socio-environmental perspectives must be addressed to assess road interferences and possible solutions and, furthermore, to connect the SHP8 to the electrical system and identify the reasons behind the high costs of environmental studies for its implementation.
Moving on to the assessment of SHP3, it has lower scores in the indicators of land ownership, distribution or transmission system tariff costs, and environment. In parallel, SHP3 also needs the involvement of the engineering and environmental areas in addressing the environmental issues, such as identifying the factors driving the high costs of environmental studies and compliance with environmental plans and programs, as well as addressing the land ownership costs. High land ownership costs may indicate that this SHP has a large reservoir and environmental preservation areas or is being implemented in highly valued land areas. The large reservoir and preservation areas can also contribute to higher environmental costs, as they include costs for deforestation to create the reservoir and implement the SHP structures and costs for planting environmental preservation areas, which occur during the implementation phase. Since the unit costs of deforestation and planting of preservation areas are high, the costs will consequently be high considering the large scale of these activities.
Within this study, a foundational premise is established, stipulating an indicator baseline score that either equals or falls below 7.0. Hence, all indicators should be evaluated with the aim of improvement and, consequently, improving the overall performance of the SHP. While the primary emphasis centers on indicators demonstrating inferior performance, it is imperative to underscore that comprehensive attention must be devoted to addressing all indicators, irrespective of their current standing.
From the socio-environmental perspective, SHP1 has the lowest score. This result was influenced by the indicators of relocated families, affected properties, properties rendered unfeasible, fish migration route, population downstream from the SHP, and acceptance of the population towards the SHP, which significantly impacted its overall assessment. Despite having a low head and a small reservoir area, this SHP affects many properties and is located in a fish migration route. There are houses downstream in an area that would be affected in the event of a dam breach. For this reason, the SHP1 project has low acceptance by the local people. The complexity of these issues requires the involvement of the engineering and environmental areas to find solutions for reducing the flood area and the environmental preservation area to mitigate the socio-environmental impact.
Furthermore, the engineering project and dam safety plan must incorporate mechanisms to accommodate fish migration or safeguard their reproductive cycles. Additionally, effective communication with local people should approach countermeasures and advantages for them that can be reached with the SHP1 implementation. In contrast, SHP2 project is notably positioned at an advanced stage, and it has shown a higher maturity level in the socio-environmental perspective. A pragmatic recommendation for the implementation phase is that the decision makers channel their efforts into formulating negotiation strategies with landowners.
Moving on to the institutional perspective, SHP7 and SHP4 are analyzed. In the context of SHP7, a discernible trend emerges with lower scores in the indicators of flora and fauna compensation status, status with the Palmares Foundation, status with the National Institute of Colonization and Agrarian Reform (INCRA), and status of signing the Distribution System Usage Tariff (CUSD) and Transmission System Usage Tariff (CUST) agreements. This SHP is in an advanced stage of institutional development and requires collaboration between the regulatory and environmental teams to address environmental compensation issues involving the Palmares Foundation and INCRA and between the regulatory and engineering teams for CUSD/CUST agreement matters.
Regarding SHP4, an analogous pattern emerges, characterized by diminished ratings across indicators encompassing the status of flora and fauna compensation, the affiliation with the IPHAN, the engagement with the Palmares Foundation, the status with INCRA, and the endorsement status of CUSD/CUST agreements. Similar to SHP7, this SHP is also in an advanced stage of institutional development and requires collaboration between the regulatory and environmental teams to address environmental compensation issues involving IPHAN, the Palmares Foundation, and INCRA, as well as collaboration between the regulatory and engineering teams for CUSD/CUST agreement matters.
6. Conclusions
The purpose of the score obtained is not to identify the “best” project but rather to provide information on the areas of each project that are well developed and those that require greater attention to ensure the proper completion of their development. The economic perspective typically garners significant focus in most projects, while the technical assumes prominence in specific cases. However, even within perspectives reflecting a favorable score, a comprehensive analysis of individual indicators remains imperative and must be addressed for the successful completion of the project.
The achievements have shown that the computational program could identify the weaknesses and strengths of SHP projects by analyzing performance indicators. Analysis of the perspectives and a comprehensive understanding of the strengths and weaknesses of each analyzed SHP, measured through its performance indicators, trigger actions aimed at project improvement or compensatory actions to make an SHP project technically and economically viable. Thus, the software can assist decision makers in the development of SHP projects. Furthermore, this research has proven the effectiveness of the adapted Balanced Scorecard for the strategic assessment of SHP feasibility.
In addition to the structured tool based upon the BSC supporting decision makers in the analysis of the key SHP indicators during the development phase, the tool guides the definition of strategies, providing decision makers with the best information to focus on the principal vulnerabilities associated with each project.
Even in light of the concerted endeavors by the technical staff of the accountable company, certain indicators have unveiled subpar performance upon the end of development. Conversely, the lessons learned have been useful to the creation of strategies to overcome these weaknesses. To illustrate, consider the scenario of an SHP with a large environmental preservation area (APP), if the interactions with the competent environmental agency result in a large APP, the company can attempt to negotiate for a variable APP, focusing on nonproductive areas. This example reveals a strategy that saves costs and decreases the rejection from affected stakeholders. An alternative approach involves establishing the APP through an administrative easement, thereby curtailing costs for the SHP company and allowing the affected landowner to retain ownership of the area, which would be managed by the SHP while serving as their legal reserve.
These scenarios underscore the vital significance of achieving a lucid comprehension of the performance exhibited by each balanced performance indicator within an SHP context. A comprehensive understanding of the strengths and weaknesses of an SHP through the performance indicators drives actions toward continuous improvement or compensatory measures to make the SHP implementation feasible.
Notwithstanding its valuable findings, this research work is subject to certain limitations that warrant acknowledgment:
- The developed computational program is tailored to the context of SHP projects intended for development and implementation within Brazil, specifically connected to the Electrical Interconnected System (SIN). While the adaptability of this tool can be adapted for other systems or countries, the definition of performance indicators, weights, and contextual nuances must be thoroughly re-evaluated to align with the unique local circumstances and legal frameworks.
- Although a meticulous selection of the most illustrative performance indicators has been undertaken, accompanied by comprehensive contextual details rooted in the Brazilian SHP landscape, it is essential to acknowledge the potential existence of exceptional cases or projects with particular characteristics different from the usual that may need to correctly measure their performance within specific indicators or perspectives in this program. In such cases, it is up to the operator to discern these specificities.
- Specifically, within the realm of the economic perspective and the other perspectives, the detailed criteria of the indicators need to be updated annually to incorporate economic and financial variations and changes in criteria or legislation that may affect SHP. This proactive measure is imperative to ensure the perpetual relevance of the indicators and to maintain their alignment with the prevailing landscape.
- Finally, it warrants underscoring that the strategic assessment of SHP viability, as advanced in this research, does not intend to assess the economic and financial feasibility of SHP implementation, nor does it necessitate the procurement of specific information for such an evaluation. Rather, it offers a comprehensive analysis of the development process and the SHP under evaluation, assisting decision makers in defining strategies from the prospecting phase to the pre-implementation phase or comparing different SHP. It provides insights into the positive and negative aspects (indicators) of an SHP, allowing for a comprehensive understanding of the assets in the development portfolio and identifying perspectives and indicators that require greater attention to improve overall performance.
In the prevailing Brazilian landscape, characterized by elevated developmental expenditures, inherent risks, and prolonged business maturation periods from potential identification to implementation phases, the devised computational program, named SAID-pch (System for Evaluation by Performance Indicators for SHP), has been formulated with the intention of serving decision makers opting to harness its capabilities. This program can assist in evaluating all selected SHP and can also be used to compare different SHP in the context of asset transactions or internal prioritization within the developing company.
Author Contributions
Conceptualization, A.C.C.d.S.M., G.L.T.F. and T.M.d.A.; methodology, G.L.T.F. and F.F.; writing—original draft preparation, A.C.C.d.S.M.; writing—review and editing, T.M.d.A. and L.F.R.P.; supervision, R.F.d.S.; G.L.T.F. and F.F. All authors have read and agreed to the published version of the manuscript.
Funding
This research received no external funding.
Data Availability Statement
The data that support the findings of this study are available from the corresponding author, F.F., upon reasonable request.
Acknowledgments
The authors would like to thank the Foundation for Research Support of the State of Minas Gerais (FAPEMIG), the Coordination for the Improvement of Higher Education Personnel (CAPES), and the National Council for Scientific and Technological Development (CNPq) for their financial support.
Conflicts of Interest
The authors declare no conflict of interest.
References
- IRENA. Bracing for Climate Impact: Renewables as a Climate Change Adaptation Strategy; International Renewable Energy Agency: Abu Dhabi, United Arab Emirates, 2021. [Google Scholar]
- IRENA. World Energy Transitions Outlook: 1.5 °C Pathway; International Renewable Energy Agency: Abu Dhabi, United Arab Emirates, 2021. [Google Scholar]
- United Nations. COP26: Together for Our Planet. 2022. Available online: https://www.un.org/en/climatechange/cop26 (accessed on 18 May 2022).
- Furlan, C.; Mortarino, C. Forecasting the impact of renewable energies in competition with non-renewable sources. Renew. Sustain. Energy Rev. 2018, 81, 1879–1886. [Google Scholar] [CrossRef]
- Empresa de Pesquisa Energética—EPE. National Energy Balance (BEN) 2022. 2022. Available online: https://www.epe.gov.br/pt/publicacoes-dados-abertos/publicacoes/balanco-energetico-nacional-2022 (accessed on 18 May 2022).
- Larentis, D.G.; Collischonn, W.; Olivera, F.; Tucci, C.E.M. Gis-based procedures for hydropower potential spotting. Energy 2010, 35, 4237–4243. [Google Scholar] [CrossRef]
- Hoes, O.A.C.; Meijer, L.J.J.; Van der Ent, R.J.; Van de Giesen, N.C. Systematic high-resolution assessment of global hydropower potential. PLoS ONE 2017, 12, e0171844. [Google Scholar] [CrossRef] [PubMed]
- Couto, T.B.; Olden, J.D. Global proliferation of small hydropower plants—Science and policy. Front. Ecol. Environ. 2018, 16, 91–100. [Google Scholar] [CrossRef]
- Zhou, Y.; Hejazi, M.; Smith, S.; Edmonds, J.; Li, H.; Clarke, L.; Calvin, K.; Thomson, A. A comprehensive view of global potential for hydro-generated electricity. Energy Environ. Sci. 2015, 8, 2622–2633. [Google Scholar] [CrossRef]
- Bastos, P.; Bortoni, E.C. Portfolio analysis applied to small hydroelectric plant investment, in: Probabilistic Methods Applied to Power Systems. In Proceedings of the 2004 International Conference on Probabilistic Methods Applied to Power Systems, Ames, IA, USA, 12–16 September 2004; pp. 391–396. [Google Scholar]
- Bortoni, E.C.; Souza, Z.; Abreu, T.M.; Miguel, O.R.; Paula, L.G.R. Improving energy production by using diverse rated units in small hydropower plants. Sustain. Energy Technol. Assess. 2023, 57, 103306. [Google Scholar] [CrossRef]
- IRENA. Renewable Power Generation Costs in 2020; International Renewable Energy Agency: Abu Dhabi, United Arab Emirates, 2021. [Google Scholar]
- Dardot, L.; Barbosa, M.; Abreu, T.; Silva, B.C.D.; Barros, R.M.; Filho, G.L.T.; Santos, I.F.S.D. Assessing the role of the energy reallocation mechanism and hybrid generation in reducing risks to the Brazilian electricity grid. Lat. Am. J. Manag. Sustain. Dev. 2023, 6, 60–83. [Google Scholar] [CrossRef]
- Filho, G.L.T.; Santos, I.F.S.; Barros, R.M. Cost estimate of small hydroelectric power plants based on the aspect factor. Renew. Sustain. Energy Rev. 2017, 77, 229–238. [Google Scholar] [CrossRef]
- Baskoro, Y.L.; Taufik, T.A. Application of balanced scorecard (BSC) and stress testing method for strategy formulation in maintaining business sustainability of PT XYZ (PERSERO). In Proceedings of the 3rd International Conference on Management of Technology, Innovation, and Project, Xinxiang, China, 18–20 June 2021. [Google Scholar]
- Aceituno-Rojo, M.R.; Condori-Alejo, H.I.; Alzamora, G.S. Server monitoring model based on Balanced Scorecard and SNMP of an electric power company. In Proceedings of the 2021 IEEE XXVIII International Conference on Electronics, Electrical Engineering and Computing (INTERCON), Lima, Peru, 5–7 August 2021; pp. 1–4. [Google Scholar] [CrossRef]
- Kumar, J.; Prince, N.; Baker, H.K. Balanced Scorecard: A Systematic Literature Review and Future Research Issues. FIIB Bus. Rev. 2022, 11, 147–161. [Google Scholar] [CrossRef]
- Carvajal Zambrano, G.V.; Chávez López, A.C.; Velásquez Vera, M.L. Nogueira Rivera, D. Balanced Scorecard: A look from its evolution. Rev. Venez. De Gerenc. 2022, 27, 224–256. [Google Scholar] [CrossRef]
- Kaplan, R.S.; Norton, D.P. Transforming the Balanced Scorecard from Performance Measurement to Strategic Management: Part II. Account. Horiz. 2001, 15, 147–160. [Google Scholar] [CrossRef]
- Silva, R.F.; Andrade Melani, A.H.; Carvalho Michalski, M.A.; Martha de Souza, G.F.; Nabeta, S.I.; Hamaji, F.H. Defining Maintenance Performance Indicators for Asset Management based on ISO 55000 and Balanced Scorecard: A Hydropower Plant Case Study. In Proceedings of the 30th European Safety and Reliability Conference and 15th Probabilistic Safety Assessment and Management Conference, Singapore, 1–5 November 2020; pp. 371–378. [Google Scholar] [CrossRef]
- Yuan, J.; Zhang, Z.M.; Yüksel, S.; Dinçer, H. Evaluating recognitive balanced scorecard-based quality improvement strategies of energy investments with the integrated hesitant 2-tuple interval-valued Pythagorean fuzzy decision-making approach to QFD. IEEE Access 2020, 8, 171112–171128. [Google Scholar] [CrossRef]
- Rigo, P.D.; Siluk, J.C.M.; Lacerda, D.P.; Rediske, G.; Rosa, C.B. The competitiveness factors of photovoltaic installers companies and a BSC model. Sol. Energy 2022, 235, 36–49. [Google Scholar] [CrossRef]
- Dincer, H.; Yuksel, S. Balanced scorecard-based analysis of investment decisions for the renewable energy alternatives: A comparative analysis based on the hybrid fuzzy decision-making approach. Energy 2019, 175, 1259–1270. [Google Scholar] [CrossRef]
- Martínez, L.; Dinçer, H.; Yüksel, S. A hybrid decision making approach for new service development process of renewable energy investment. Appl. Soft Comput. 2023, 133, 109897. [Google Scholar] [CrossRef]
- Bach, N.; Calais, P.; Calais, M. Marketing residential grid-connected PV systems using a Balanced Scorecard as a marketing tool. Renew. Energy 2001, 22, 211–216. [Google Scholar] [CrossRef]
- Sánchez-Ortiz, J.; García-Valderrama, T.; Rodríguez-Cornejo, V. Towards a balanced scorecard in regulated companies: A study of the Spanish electricity sector. Electr. J. 2016, 29, 36–43. [Google Scholar] [CrossRef]
- Tawse, A.; Tabesh, P. Thirty years with the balanced scorecard: What we have learned. Bus. Horiz. 2023, 66, 123–132. [Google Scholar] [CrossRef]
- Kaplan, R.S. Conceptual Foundations of the Balanced Scorecard. In Handbook of Management Accounting Research; Chapman, C., Hopwood, A., Shields, M., Eds.; Elsevier: Amsterdam, The Netherlands, 2009; Volume 3. [Google Scholar]
Disclaimer/Publisher’s Note: The statements, opinions and data contained in all publications are solely those of the individual author(s) and contributor(s) and not of MDPI and/or the editor(s). MDPI and/or the editor(s) disclaim responsibility for any injury to people or property resulting from any ideas, methods, instructions or products referred to in the content. |
© 2023 by the authors. Licensee MDPI, Basel, Switzerland. This article is an open access article distributed under the terms and conditions of the Creative Commons Attribution (CC BY) license (https://creativecommons.org/licenses/by/4.0/).