Abstract
The main objective of this article is to evaluate the repercussions of the crises resulting from the COVID-19 pandemic and the war in Ukraine on changes to the European Union’s reliance on energy raw material imports, particularly from Russia. Furthermore, several specific objectives are outlined: to ascertain the EU’s energy balance and any alterations therein, to identify changes in the concentration of energy raw material imports among EU countries during the crises, to determine the level and fluctuations in energy raw material import dependence within the EU and individual member states throughout the crises, and lastly, to assess changes in the concentration of energy raw material imports from Russia in EU countries during the crises. The research encompassed all 27 EU member states as of 31 December 2022, and the examination period spanned 2010 to 2022. The information sources include relevant literature on the subject and data sourced from Eurostat. In conducting the analysis and presenting the data, several methodologies are employed, including descriptive, tabular, and graphical techniques. Additionally, quantitative measures such as the Gini structure concentration coefficient and concentration analysis via the Lorenz curve are utilized. In the initial phase, an analysis of changes to the energy balance of the entire EU in the period before and during the COVID-19 pandemic and the war in Ukraine was carried out. Changes to the concentration of energy imports in EU countries during crises are also shown. Secondly, dependence on imports of individual energy resources for the entire EU was identified. Various changes in this relationship during crises are shown. If the dependence of the entire EU on the import of individual groups of energy resources from Russia were identified, changes in individual EU countries in this respect are indicated. Finally, the changes in the concentration of energy imports from Russia in the EU countries during the crises are shown. During the COVID-19 pandemic, the EU experienced a slight reduction in dependence on energy raw material imports. However, this reduction was short-lived and mainly attributed to the decrease in energy demand caused by the pandemic. Conversely, the war in Ukraine had a substantial impact, leading to a notable surge in energy raw material imports as a result of stockpiling efforts and the need to safeguard against further disruptions in the energy market. Notably, the EU’s reliance on energy imports from Russia was already considerable. Following the outbreak of the conflict in Ukraine, imports of oil, petroleum products, and solid fossil fuels experienced significant decline due to imposed sanctions. Nonetheless, restrictions on natural gas imports were comparatively less severe. In 2023, imports of crude oil instead of petroleum products practically ceased, while restrictions in the case of natural gas were not so drastic.
1. Introduction
The European Union (EU) comprises a multitude of countries, each characterized by significant diversity, including variations in the sources of energy they rely upon. Given the paramount importance of energy, which serves as a prerequisite for all economic and societal activities, it becomes imperative to mitigate crises in the energy sector [1,2,3]. To achieve this, one must emphasize the significance of diversifying energy sources and suppliers alongside fostering self-sufficiency in energy production [4,5,6]. Such efforts become particularly critical in circumstances where energy resource shortages are prevalent.
Addressing energy shortages necessitates enhancing energy productivity, a course of action diligently pursued by EU member states [7]. By striving to improve energy productivity, the EU seeks to optimize energy consumption while maximizing output, thus efficiently utilizing available energy resources.
1.1. The Magnitude and Causes of the Shortage of Energy Raw Materials in the EU
Rokicki and Perkowska [8] stated in their study that energy security, in the simplest sense, means the stability of supply and diversification of energy sources. The EU produces an insufficient amount of energy resources to meet its reported energy needs. Additionally, there are disparities between countries in the pace of the transition towards renewable energy sources [9]. Over the past decade or so, the energy deficit has been just over 50%, and this proportion of energy has had to be imported to fulfill the economy’s and society’s requirements. Within the EU, the primary energy sources are oil and natural gas. Oil imports into the EU account for approximately 60% of total energy imports, while 25% go to natural gas and 7% to solid fuels [8]. This structure is based on production capacity and reported needs. Oil is essential for transportation, yet European countries do not possess significant oil reserves [10]. Consequently, efforts are being made to develop electromobility [11]. Natural gas also serves as a fairly important and convenient energy source, resulting in significant imports. However, there exists considerable variation across EU countries in terms of the energy balance and the energy sources employed [12]. In general, EU countries lack sufficient local energy resources to sustain their economies and societies, making energy resources and energy imports from abroad a necessity [13].
1.2. Problems in the Diversification of Energy Supply Sources in the EU
Regarding imports, the diversification of supply sources should play a crucial role. Several EU countries have become heavily reliant on raw energy materials supplied by Russia, facilitated via signed contracts and infrastructure construction for transportation of these raw materials [14]. An example of such infrastructure is Nord Stream and its second line. This investment faced opposition from many Central and Eastern European countries, who expressed concerns that it would deepen their dependence on Russia [15]. Circumstances have indicated that such dependence could be exploited by Russia for political leverage, potentially dividing EU countries by offering preferential rates to some while imposing high prices on others [16]. History has shown that these fears were well-founded [17]. The COVID-19 pandemic, along with the war in Ukraine, led to an energy crisis that necessitated a revaluation of the EU’s energy policy and those of its individual member states [18].
The EU’s energy security faces threats due to increasing geopolitical risks on the producer side, fluctuations in energy prices, supply problems, and disruptions from major suppliers due to political disagreements (energy blackmail) as well as environmental concerns related to the use of non-renewable energy sources with adverse impacts on the environment [19]. As far back as 2009, Luft and Korin [20] highlighted that European energy security was endangered due to its dependence on imported energy resources and limited domestic production compared to other regions. Helena [21] also underscored the critical issue of dependence on a limited number of energy resource suppliers, especially Russia, in 2010. Stulberg [22] emphasized the necessity of measures to strengthen the integration of the internal energy market and improve energy efficiency, while Burns [23] identified the most significant approach to reducing dependence on energy raw material imports: increasing the prominence of renewable energy sources.
Leal-Arcas et al. [24] suggested that European energy policy should prioritize the diversification of energy sources, which has become particularly crucial given that over 50% of the energy consumed in the EU is imported. Moreover, this dependence has grown over the past two decades [25]. Individual EU countries exhibit varying degrees of reliance on external energy carriers. For instance, Sweden, Belgium, and Portugal depend heavily on natural gas [26]. Nonetheless, most EU countries are to some extent dependent on external energy sources. These sources can be categorized into secure sources, such as those from Norway, and those that carry more uncertainty, such as those from Russia, Algeria, Central Asia, and the Persian Gulf. Russia, in particular, serves as a significant source of dependency, being the origin of imported natural gas, solid fuels, and oil [27]. Eastern European countries, especially those relying on energy imports from Russia, face a higher risk of over-reliance. Lithuania, Estonia, and Finland are examples of countries with limited connections to other energy exporters. Conversely, Denmark and the Netherlands demonstrate the greatest diversification of energy supplies, which directly contribute to their energy security [28]. It is crucial to acknowledge that the implications of the EU’s energy dependence extend beyond energy security, affecting the overall strength of European foreign policy. Consequently, many European countries avoid engaging in sharp political disputes with Russia to safeguard their energy supply [29,30]. This underscores the importance of diversifying the EU’s energy supply routes and sources, fostering regional cooperation, and developing an integrated internal energy market supported by well-established energy infrastructure [31,32].
1.3. Changes in EU Energy Policy and Its Adaptation to the Crisis Situation
Indeed, it appears crucial for the EU to adapt its energy policy to current needs. The existing energy policy of the EU is built on three pillars: competition, security of supply, and sustainability. However, during a crisis, ensuring security of supply becomes paramount, allowing for a more flexible approach towards reducing greenhouse gas emissions. The primary focus should be on ensuring energy security, and, in times of crisis, increasing energy production from renewable sources becomes an essential alternative to relying heavily on non-renewable energy imports. Enhancing energy efficiency also becomes increasingly crucial [33,34,35]. However, it is vital to keep in mind that such measures require time and substantial investments.
Crisis energy policy should also prioritize the development of a more sustainable energy sector to prevent future crises [36,37,38]. The EU has been pursuing an energy policy for many years that aims to achieve independence from external energy sources. However, achieving complete independence seems unlikely. For example, in 2010 strategy documents, one of the goals to be achieved by 2020 was to improve energy efficiency and implement low-carbon technologies [39]. In 2015, the ‘Energy Union Strategy’ defined five closely interlinked areas, including security, solidarity, and trust among EU countries; full integration of the internal energy market; energy efficiency with reduced dependence on energy imports; decarbonization of the economy; and research, innovation, and competitiveness towards low-carbon energy technologies [40]. Today, it could be argued that while these energy policy objectives were ambitious, they were not fully realized. The increasing dependence on external energy resources has become a significant concern, and while energy imports may be convenient, they have proven to be risky during crisis situations.
Subsequent modifications to the EU’s energy policy have placed a strong focus on addressing climate change and achieving carbon neutrality. A significant milestone was the introduction of the ‘Clean Energy for All Europeans’ package in 2019, which aimed to attain carbon neutrality by 2050. The objectives set forth were both ambitious and appropriate, calling for a gradual transition away from fossil fuels and towards cleaner energy sources, consequently leading to a reduction in energy imports. However, it is crucial to acknowledge that the 2050 perspective may seem distant and might not serve as a motivating factor for taking decisive action [41]. The European Green Deal is another noteworthy action plan aimed at tackling the challenges posed by climate change and environmental degradation. It specifically seeks to achieve zero net greenhouse gas emissions by 2050, enabling economic growth to be decoupled from resource consumption. This goal is envisaged to be achieved via the enhancement of energy efficiency in various sectors, including production and residential buildings, as well as developing an energy sector based on renewable sources [42]. These assumptions are undoubtedly ambitious and commendable. However, in the context of an ongoing energy crisis, it becomes necessary to critically evaluate their feasibility and consider accelerating the most effective measures to reduce dependence on energy resource imports in the most efficient manner possible. Taking proactive and immediate steps to diversify energy sources and enhance energy security will be essential to navigate through the energy crisis successfully.
1.4. Impact of the COVID-19 Pandemic and the War in Ukraine on Business and Social Life
The COVID-19 pandemic had a profoundly negative impact on the global economy, primarily due to the high level of interconnectedness and specialization in manufacturing activities. The disruption of supply chains had a cascading effect on various interconnected industries, creating a domino effect [43]. As a result of the pandemic, there was a significant decrease in demand for face-to-face, interactive services such as hotels and restaurants, while the demand for remote services, particularly information and communication technology (ICT) services, surged [44]. The severity of the pandemic and the restrictions imposed by governments varied among countries, leading to differentiated impacts [45]. The restrictions on physical goods’ production affected almost all industries, leading to a sharp decline in industrial production in the EU27 during March and April 2020, corresponding to the initial wave of the virus spread. Production values rebounded in May and June 2020, with an increase of 13% and 10.4%, respectively, compared to the previous period. The fluctuations in production were closely tied to the disease situation and the imposed restrictions [46]. The transportation sector also experienced significant disruptions during the early stages of the pandemic. There was a slight increase in goods transport but a substantial decrease in passenger transport. All transport sectors saw revenue declines, particularly in passenger transport [47]. This situation also led to a decrease in energy demand during the pandemic, which, from an environmental and energy import perspective, could be considered a favourable outcome. The COVID-19 pandemic highlighted the vulnerabilities in the interconnected global economy and underscored the importance of resilience and flexibility in supply chains and energy systems. As countries continue to navigate through and recover from the pandemic’s impacts, efforts to enhance energy security, diversify energy sources, and promote sustainable practices will be crucial for building a more robust and sustainable future.
The COVID-19 pandemic had a profound impact on society [48]. One of the primary challenges was the limited access to various services, including the cancellation or postponement of major sporting events, reduced national and international travel, service cancellations, and disruptions to cultural, religious, and holiday celebrations [49]. These changes created stress and depression among the population. Social distancing measures required people to stay away from peers and family members [50]. Many public places such as hotels, restaurants, places of worship, cinemas, theatres, sports clubs, gyms, and swimming pools were closed [51,52]. Examinations were postponed, leading to the introduction of distance learning [53]. Moreover, there were considerable health risks associated with contracting the coronavirus, leading to limited medical services. As a result of these restrictions, people spent more time at home, leading to increased household expenditures, including on energy consumption. On the other hand, expenditure on transport decreased significantly due to reduced travel and commuting. All these measures had significant consequences for energy demand, as the pattern of energy consumption shifted in response to the pandemic-induced changes in daily life.
1.5. The Impact of the War in Ukraine in Global Terms
The open war in Ukraine that erupted on 24 February 2022 with Russia’s frontal attack has deep-rooted sources, including events such as Russia’s annexation of Crimea in March 2014 and ongoing operations in Donbas and Donetsk [54]. The global impact of the conflict has been significant. In response to the war, the international community, led by the US, the EU, and other countries, imposed sanctions on Russia. These sanctions included export bans and import restrictions, particularly targeting ‘dual-use’ technologies, such as semiconductors, aviation-related goods and services, and oil and gas extraction [55]. Additionally, there were restrictions on imports of energy raw materials from Russia, with several countries progressively reducing or completely giving up on importing Russian fossil fuels and coal to avoid supporting the conflict. The EU introduced successive sanctions with the aim of reducing energy resource imports from Russia to zero. In retaliation, Russia demanded payment for energy in roubles and imposed licensing restrictions on exports. The Russian government also unilaterally halted gas supplies to selected EU countries such as Poland, Bulgaria, Finland, Latvia, and the Netherlands [56]. The war’s consequences also reverberated in many food commodity markets, as Ukraine is a major producer and exporter of wheat, sunflower, and other food commodities [57]. Humanitarian repercussions cannot be overlooked either. The conflict led to the migration of several million Ukrainians to neighbouring countries such as Poland, Romania, Moldova, Hungary, and Slovakia [58]. The war in Ukraine has had far-reaching implications on geopolitics, energy security, and humanitarian matters. The actions taken by the international community via sanctions have had significant economic consequences on Russia’s economy and energy trade while also impacting global markets and supply chains.
The sanctions imposed on Russia and the shift away from Russian gas and oil have indeed led to a surge in fuel and energy prices [59]. Countries that previously relied heavily on Russian energy resources had to seek alternative sources, often from distant locations. However, these new energy sources were often offered at higher prices [60]. The challenges in the energy market had a widespread impact on various economic sectors, particularly transport and production. As oil and gas prices rose, the costs of logistical operations increased proportionally. Consequently, the prices of many products, especially food items, have risen [61]. The higher prices of gas and oil had implications for both businesses and consumers, leading to increased costs and expenses. Additionally, the war in Ukraine contributed to high inflation rates [62]. The combination of geopolitical tensions, energy market disruptions, and rising fuel prices created a complex economic environment that affected both the supply chain and the overall cost of living. The situation highlights the interconnectedness of global energy markets and how geopolitical conflicts can reverberate across various sectors and affect economies on a broader scale. This underscores the importance of diversifying energy sources and enhancing energy security to mitigate the impacts of such disruptions in the future.
1.6. Justification, Aims, and Structure of the Article
EU energy policy is indeed cantered on the crucial goal of ensuring energy security, especially in the context of high dependence on energy imports, accounting for more than 50% of energy consumed. Despite efforts, this dependence has not significantly decreased over the years and has, in some cases, even slightly increased. The particular issue of dependence on energy raw material imports from Russia has posed both economic and political risks, as Russia has been known to utilize energy resources for political leverage, leading to varying prices for different countries. Eastern European countries, in particular, expressed concerns about over-dependence on Russia and criticized the expansion of the Nord Stream gas pipeline. These factors collectively put the EU’s energy security at risk.
The crises between 2020 and 2022, including the COVID-19 pandemic and the war in Ukraine, may have had varying impacts on energy security, potentially prompting moves towards greater independence from energy imports. Understanding how these crises affected dependence on energy commodity imports for the EU as a whole and specific member countries has become crucial. Different countries have diverse energy source structures and conditions, making comprehensive research into this area valuable, particularly considering the global distortions in the energy market. Changes in the global market have occurred during these crises, underscoring the significance of researching the effects on energy import dependence in the EU.
Our proposed research aims to address a research gap by providing comprehensive insights into how recent crises, namely the COVID-19 pandemic, and the war in Ukraine, have influenced EU countries’ dependence on energy imports. By exploring these factors, the research can shed light on potential strategies and policy measures to enhance energy security and reduce reliance on external energy sources in the future.
The main objective of this article is to assess the impact of the crises caused by the COVID-19 pandemic and the war in Ukraine on changes to the EU’s dependence on imports of energy raw materials, particularly from Russia. The specific objectives of the article are as follows:
- Determine the energy balance for the EU and analyse developments therein.
- Identify changes to the concentration of energy imports in EU countries during the crises.
- Assess the level and evolution of EU and national independence from energy imports during the crises.
- Examine changes in the concentration of energy imports from Russia in EU countries during the crises.
To achieve these objectives, the article seeks to answer three research hypotheses:
Hypothesis 1.
During the crises caused by the COVID-19 pandemic and the war in Ukraine, dependence on energy commodity imports decreased, with a greater impact of the disruption caused by the hostilities.
Hypothesis 2.
Dependence on energy imports from Russia was higher for oil and petroleum products than for natural gas, but in both cases, it was drastically reduced after the first year following the outbreak of the war in Ukraine.
Hypothesis 3.
The war in Ukraine caused a greater shift in EU concentration in imports of energy raw materials imported from Russia than the crisis caused by the COVID-19 pandemic.
This article aims to provide valuable insights into the effects of the COVID-19 pandemic and the war in Ukraine on the EU’s energy import dependence, with a specific focus on the role of Russia as a major energy supplier. By exploring the research hypotheses and objectives, the article intends to contribute to the understanding of energy security and diversification efforts in the EU during times of crisis.
The organization of the article is as follows:
Section 1 provides an overview of the energy resource shortage in the EU, including issues related to diversification of energy sources, changes to EU energy policy, and the impact of the crises on the economy and social life. It also outlines the rationale and objectives of the article. Section 2 presents the methodology used to assess changes in EU countries’ dependence on energy imports, particularly from Russia. Section 3 presents the research findings related to the energy balance, changes to energy import concentration, and EU and national independence from energy imports during the crises. Section 4 references other research results that have explored the relationships under investigation. Section 5 presents the main conclusions drawn from the research.
2. Materials and Methods
2.1. Data Collection, Processing, and Limitations
The study utilized a purposive sampling method, selecting all 27 EU Member States as of 31 December 2022 for the survey. The UK, which was a member of the EU until 31 January 2020, was excluded from the analyses due to the lack of detailed statistics collected by Eurostat after that date. The study period covered the years from 2010 to 2022, with particular emphasis on the years from 2020 to 2022, which were significant due to the crises caused by the COVID-19 pandemic and the war in Ukraine.
The chosen timeframe was substantively justified for several reasons. By 2010, the effects of the 2008 financial crisis, which could have influenced the results, were no longer visible. By 2019, changes in energy imports were likely to be a result of the normal functioning of the economy. The year 2020 marked the onset of an economic crisis due to the COVID-19 pandemic, the effects of which continued to be evident in 2021. In 2022, the impact of COVID-19 on economic activities started to wane as most restrictions were lifted. However, the ongoing war in Ukraine, which began in February 2022, presented another crisis, the full scale of which could be assessed from February 2022 to early 2023. The data available at the time of preparing the article included complete data up to March 2023, which served as the cut-off date for the data collected. Different year ranges were used in various analyses, depending on the availability of data for each specific study. In some cases, the most recent data available was for 2021.
This research relied on existing literature on the subject and statistical data from the Eurostat database. We acknowledge some limitations, particularly in the available datasets and their level of detail. However, despite these limitations, the data obtained enabled the research to be conducted, and conclusions were drawn based on the findings.
2.2. Applied Methods
The research was divided into stages. Figure 1 shows a diagram of the conducted research.
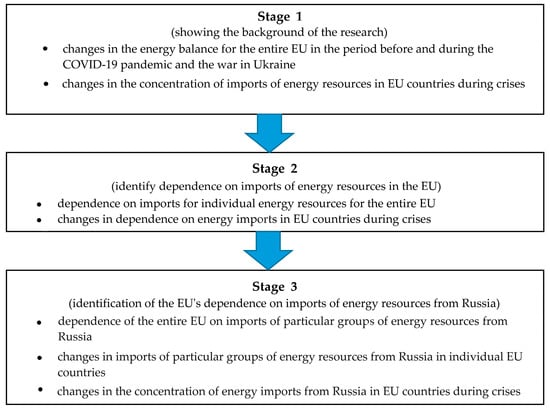
Figure 1.
Diagram of the conducted research.
The research was conducted in three stages. The initial stage provided an energy balance analysis for the entire EU along with changes in individual parameters. The following parameters were used:
- Primary production of energy is defined as any extraction of usable energy products from natural sources. It concerns the exploitation of natural sources, e.g., coal mines, oil fields, and water power plants. It is also related to the production of biofuels.
- Import of energy refers to importing primary and secondary energy products from outside the country.
- Export of energy means the sale of primary and secondary energy products out of the country.
- Total energy supply means total energy supply for all activities in the territory of the country. The aggregate is calculated using the following formula: Primary Production + Reclaimed and Recycled Products + Imports + Inventory Changes − Exports − International Aviation. This represents the amount of energy needed to meet domestic energy demand.
The data covered the period from 2010 to 2022 and were presented in gigawatt-hours, facilitating comparison via metrics. Both descriptive and graphical methods were employed in this stage. In the subsequent stage, the focus shifted to examining changes in the concentration of energy commodity imports in EU countries during crises. Descriptive methods were again used in this phase, alongside tabular and graphical methods. To represent the structure of a community, structure indices (frequency, relative numbers) were utilized, indicating the proportion of a specific part of the community (ni) in relation to the entire community (∑ni). This measure ranges from 0 to 1, with the sum of all indicators for the whole population equalling 1. Occasionally, it is valuable to identify the number of statistical units falling below an assumed indicator level, such as 50%. In such cases, cumulative structure indicators were determined by aggregating the indicators for successive parts of the community. Moreover, for some variables, understanding the degree of concentration and evenness of distribution among the units forming the community is essential. The Gini coefficient is a widely accepted measure for this purpose, and it can be calculated using the following formula [63]:
where:
n—number of observations,
—value of the ‘i-th’ observation,
—the average value of all observations, i.e., .
The degree of concentration of a one-dimensional random variable distribution determines the Lorenz curve [64]. With sorted observations yi, which are non-negative values, , the Lorenz curve is a polyline whose apexes , for h = 0, 1,..., n, have the following coordinates:
The Gini coefficient determines the Lorenz curve area and the diagonal of a unit square multiplied by 2.
The Gini concentration coefficients were presented at several points to determine whether there were changes, i.e., every three years during the stabilisation period for 2010, 2013, 2016, 2019, and every year during the crisis period for 2020 and 2021.
The second stage of the research presents the EU’s dependence on imports of energy raw materials during crises. Descriptive, tabular, and graphical methods were used. Firstly, the dependence on individual products for the whole of the EU from 2010 to 2022 was identified. Then, the changes in the dependence on imports of energy raw materials in EU countries during crises was determined. As the import dependency rate is presented in percentage terms, changes were denoted in percentage points.
The energy dependency rate was measured as the share of net imports (imports − exports) in gross domestic energy consumption (sum of energy produced and net imports).
Two periods were studied, i.e., before the crises from 2010 to 2019 and at the time of the crises from 2019 to 2021. These snapshots identify the actual changes in energy dependency.
In the third step, the changes in the EU’s dependence on energy imports from Russia during the COVID-19 pandemic and the war in Ukraine were determined. Descriptive, tabular, and graphical methods were used. At the outset, the dependence of the EU as a whole on imports of specific groups of energy raw materials from Russia was determined. The data were presented on a monthly basis so that the changes occurring could be observed. The study period was shorter than in previous analyses, as it covered the period from January 2019 to March 2023. The following section shows the share of imports for oil and petroleum products and natural gas by country and the changes therein. Only data for the first month of the year (January) were used. Only for 2023 do the results refer to March. This inclusion allows changes to be observed, as crises occurred in March 2020 (COVID-19 pandemic) and February 2022 (war in Ukraine) respectively. The final section again examines the concentration of energy commodity imports in EU countries during the crises, but this time in relation to imports from Russia. The results for each year between 2019 and 2023 were compared, and this provided an insight into how quickly and abruptly country-by-country changes in energy imports from Russia occurred.
3. Results
3.1. EU Primary Energy Commodity Balance
The first stage of the research indentified the balance of primary energy raw materials in the EU. When the total volume of all energy raw materials were considered, it became evident that the period between 2010 and 2022 remained relatively stable. The only exception was observed in 2020, when all parameters were lower than usual due to the impact of the COVID-19 pandemic. The pandemic led to reduced energy demand as many activities were either closed or scaled down, resulting in decreased consumption and trade of energy resources (Figure 2). Additionally, a slight decline in the extraction of energy feedstocks was noticed in 2022. Nevertheless, the overall situation in the EU energy market remained relatively stable, partly due to the existing restrictions imposed on individual countries. It is also worth mentioning the role of increasing productivity in maintaining stability. Consequently, production, consumption, and trade in energy raw materials demonstrated a notable level of stability throughout the period under consideration.
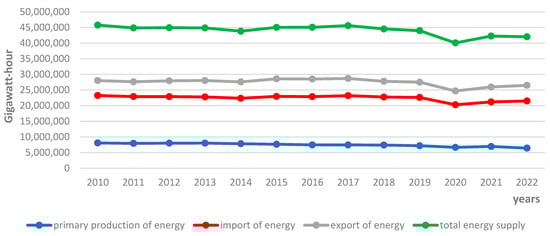
Figure 2.
Primary production, imports, exports, and total energy supply in European Union from 2010 to 2022.
Among the energy commodities that necessitate imports, notable examples include diesel, gas, and coal. Thus, it becomes imperative to analyse these commodity groups. Patterns similar to those observed for energy commodities as a whole were noted in the case of oil (see Figure 3). The initial year of the pandemic also resulted in lower consumption of oil as well as reduced imports and exports. The primary cause for this decline was the widespread lockdowns, implemented in most EU countries, compelling people to stay at home. As a result, commuting to work and school was significantly reduced, leading to a decline in the demand for the fuel required to power cars.
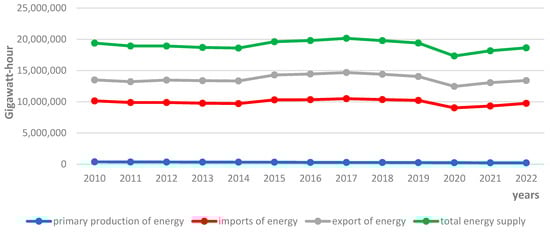
Figure 3.
Energy balance of oil and petroleum products in European Union from 2010 to 2022.
In principle, gas followed similar patterns to other raw materials. However, there were more fluctuations, and they were more noticeable. Even before the pandemic, there were periods of increased or decreased gas consumption (Figure 4). Nonetheless, it can be concluded that there was a great deal of stability in this respect, and the COVID-19 pandemic had the lowest impact on trade and gas consumption. A possible explanation is that gas consumption was linked to both home heating and use in manufacturing. Industrial production during the pandemic was generally limited in the short term. After the first waves, there was an adaptation to the situation. Of course, contact between workers was restricted, but production still took place.
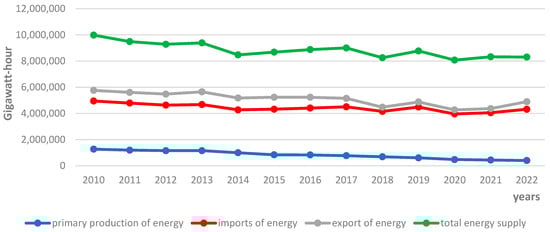
Figure 4.
Energy balance of natural gas in European Union from 2010 to 2022.
The final significant raw material worth mentioning is solid fossil fuels, primarily coal. The EU has been actively working towards reducing the use of coal, and therefore, declines in consumption were already evident prior to the pandemic (Figure 5). However, in 2020, there was a substantial reduction in the production, consumption, and trade of solid fossil fuels. The pandemic acted as an accelerator for the downward trends that were already in motion. In the subsequent years, i.e., 2021 and 2022, the declines were temporarily halted, and a slight increase was recorded. Nevertheless, the levels remained lower than those observed during the pre-pandemic period. This trend suggests that the move away from fossil fuels such as coal is a necessity and is likely to persist. It is worth noting that subsequent crises have demonstrated that the need to move away from fossil fuels is not always followed. For instance, during energy crises, there have been instances of returning to coal and other readily available energy resources.
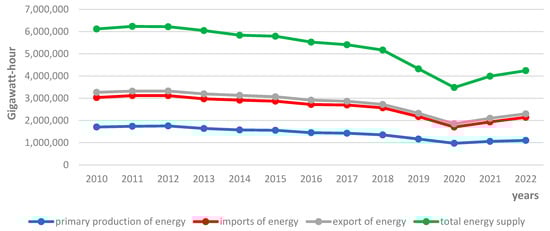
Figure 5.
Energy balance of solid fossil fuels in European Union from 2010 to 2022.
In general, it is essential to highlight that imports were crucial for all major energy raw materials, as the EU faced a deficiency in this regard. Alongside imports, there were also exports, as individual countries engaged in raw material trades. As a rule, import volumes were comparable to exports. Given such an energy balance, formulating an effective energy policy and ensuring the security and supply of raw materials to individual economies and the EU as a whole became of paramount importance. This should be given priority, particularly during times of various crises. The significance of energy is further magnified by its utilization in practically every economic activity.
3.2. Changes in the Concentration of Energy Commodity Imports in EU Countries during Crises
The next stage of the research was to present the concentration of imports of energy raw materials in the EU. Individual countries differ in their potential and level of economic development, which can influence the degree of import concentration. It is important to show how the relationships that occur have changed as a result of crises. Therefore, the results are presented at key moments when these changes should be visible.
The Gini coefficient was used to determine the degree of concentration of imports of energy raw materials into the European Union. The Gini coefficient calculated from the sample for total imports of energy raw materials in 2021 was 0.612 and when estimated for the population was 0.632. This indicates a high concentration of energy raw material imports in one or a few countries. The largest needs were reported by countries with large economies, such as Germany, France, Spain, and Italy, but also by smaller ones, such as the Netherlands and Belgium. In addition, the variation was shown by means of a Lorenz concentration curve (Figure 6).
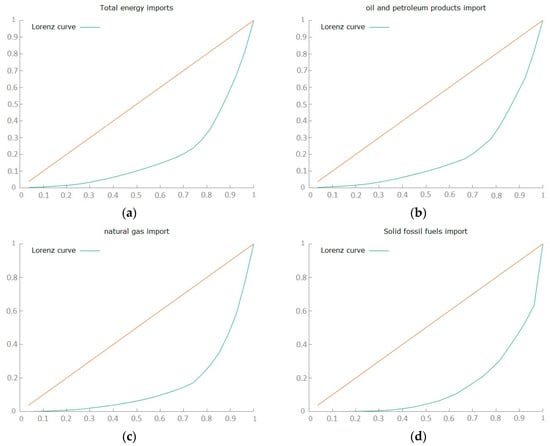
Figure 6.
Lorenz concentration curves for imports of energy raw materials into the EU in 2021. (a) Total energy imports. (b) Oil and petroleum products imports. (c) Natural gas imports. (d) Solid fossil fuels imports.
Gini coefficients were calculated for EU imports of energy raw materials by considering earlier years and the most significant energy product groups (see Table 1). Generally, a very high concentration of EU imports of energy raw materials was observed, with the highest concentration found in natural gas and solid fossil fuels and the lowest in oil and petroleum products. Concentration coefficients were assessed at a frequency of every 3 years for earlier periods and every 1 year for crisis years.

Table 1.
Estimated Gini coefficients for imports of energy raw materials in European Union from 2010 to 2021.
The analysis revealed that the concentration of total imports of energy raw materials had experienced a slight decrease over time, except for a slight increase in 2021. These changes occurred gradually and systematically, which is considered a positive development. Similar correlations were found for oil and petroleum products. However, in the case of solid fossil fuels imports, the concentration in several countries increased until 2016, followed by a decline, but increased again from 2020 onwards. Natural gas imports were also concentrated in several EU countries until 2016, after which they started to decline. The pandemic-induced crisis caused a renewed increase in the concentration of imports of this energy commodity.
In general, a high concentration in imports of individual energy raw material groups persisted, and the changes were not abrupt. The impact of the pandemic-induced crisis was evident in these trends. Typically, more developed countries attempted to build up larger stocks in preparation for future crises, which proved to be the right approach as another crisis struck in 2022, significantly affecting the energy sector and global energy markets.
3.3. Dependence on Imports of Energy Raw Materials in the EU during Crises
In the next step, the European Union’s dependence on imports of energy raw materials was determined. For this purpose, an energy import dependency index was calculated. For the total volume, the indicator remained at a similar level of around 55 to 60%, with a slight increase visible between 2019 and 2022. (Figure 7). Overall, the ratio was high, and, in addition, not much action was being taken to reduce this import dependence. It was even worse for individual groups of raw materials. Dependence on imports of solid fossil fuels was in the range of 70 to 75%. It was even worse for natural gas, where there was a very large increase in import dependency, from 70% in 2010 to 90% in 2022. Dependence on imports of oil and petroleum products was stable but very high at 95%. Based on the figures, the EU was at a severe disadvantage. Such a high dependence on energy raw materials could have been exploited by their suppliers. History shows that energy raw materials became the subject of politics and Russia’s attempt to influence the EU. They have also been an element capable of dividing the solidarity of individual EU countries, for better and for worse. Indeed, access to energy raw materials and their prices have been subject to political games.
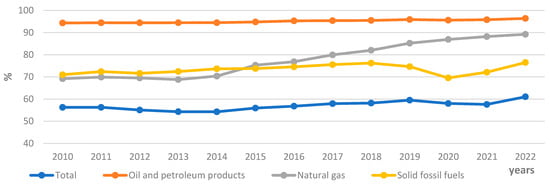
Figure 7.
Import dependency on third countries by fuel type in European Union from 2010 to 2022.
During the pandemic, there was an evident increase in dependence on natural gas imports, while solid fossil fuels initially experienced declines followed by an increase in imports in the subsequent year. However, in 2022, there was an overall increase in dependence on imports of energy raw materials, with the exception of oil. This increase in dependence was primarily influenced by the situation resulting from the war in Ukraine. Decisions to reduce the supply of energy raw materials from Russia, taken unilaterally or bilaterally, caused significant uncertainty and prompted the need to explore alternative sources of supply. This situation was exacerbated by the high prices of all energy raw materials, which were a consequence of the war and Russia’s actions aimed at destabilizing the EU. To cope with such a situation, countries resorted to increasing their stocks and hedging against potential future shortages. Consequently, many countries ordered more raw materials than they actually needed, contributing to market distortions and affecting the overall dynamics of energy raw material imports.
3.4. Changes in Dependence on Energy Imports in EU Countries during Crises
The European Union is made up of many diverse countries, so it is not surprising that the degree of dependence on energy raw materials varies from country to country. For example, in 2010, the highest dependence on imports of energy raw materials was in Lithuania (85%), Ireland (84%), and Italy (78%), and the lowest in Estonia (14%), Slovenia (17%), and Luxembourg (22%). In 2021, the scale of dependence on energy imports was lower. The highest dependence was in Greece (81%), again in Lithuania (75%), and Italy (73%), while the lowest dependence was again in Luxembourg (10%), Estonia (11%), and Slovenia (15%). Table 2 shows the scale of decreases or increases in dependence on these imports. The unit of measurement was percentage points (p.p.). The three best (most favourable) results are shown in blue, while the three most unfavourable results (increases in dependence) are shown in red. Over the period from 2010 to 2019, a reduction in dependence on energy imports occurred in 12 countries, with the largest in Malta by 30 percentage points. At the other extreme was Denmark, with an increase in import dependency of 16 percentage points. During the COVID-19 pandemic crisis, there was a reduction in dependence on imports of energy raw materials in 21 countries. The magnitude of the decreases in energy commodity imports between 2019 and 2021 was also greater than that between 2010 and 2019, suggesting that the crisis may have contributed to changes in the right direction in energy markets in EU countries.
Table 2.
Change in dependence on imports of energy raw materials in EU countries in 2010–2021.
In 2010, import dependence on oil and petroleum products was highest for Lithuania (94%), Italy (92%), and Ireland (90%), and lowest for Luxembourg (0%), Slovenia (19%), and Denmark (28%). Changes in dependence on imports of oil and petroleum products were similar to those for energy raw materials in general. Denmark was similarly the worst performer, increasing its dependence on oil imports by 27 percentage points between 2010 and 2019. Romania (up 14 percentage points) and Austria (11 p.p.) should also be mentioned. An increase in dependence was recorded in 13 EU countries. In contrast, the best results were achieved in Malta (36 p.p. decrease in dependence), Croatia (22 p.p.), and Latvia (17 p.p.). Between 2019 and 2021, the magnitude of the decrease in dependence on oil and petroleum products imports was greater than in the earlier period. A total of 21 countries saw a reduction in dependence. This was caused by the COVID-19 pandemic and the decline in mobility. This situation consequently caused a decline in demand for oil.
There was a very high dependence on natural gas imports in EU countries. In 2010, total dependence on this type of feedstock was found in Estonia, Portugal, and Finland. In contrast, a lack of natural gas imports was recorded in Sweden, Malta, and Cyprus. Between 2010 and 2019, dependency levels increased for 14 countries. The highest increases were in Latvia (38 p.p.), Germany (30 p.p.), and the Netherlands (28 p.p.), while the largest decreases were recorded for Slovenia (by 68 p.p.), Ireland (42 p.p.), and Croatia (28 p.p.). There was a decrease in dependence on natural gas imports between 2019 and 2021. A total of 15 countries showed decreases, with the largest decreases in Germany (by 88 p.p.), Luxembourg (56 p.p.), and Austria (41 p.p.). In contrast, increases in dependence were found in Croatia (49 p.p.), Ireland (18 p.p.), and Romania (13 p.p.). There were thus large changes, in large part influenced by the demand situation in individual markets and the drop in demand for this commodity during the pandemic. On the other hand, changes in the energy mix may have had some influence. However, these processes require a long time to become evident and should be considered on a country-by-country basis.
The analysis of import dependence on solid fossil fuels reveals significant variations among EU countries. In 2010, some countries, such as Estonia, Latvia, and Portugal, were almost entirely dependent on solid fossil fuel imports, with virtually 100% import dependence. In contrast, Malta displayed no dependence (0%), and the Czech Republic and Greece had very low dependence (2% and 5%, respectively). These differences in import dependence can be attributed to the existing energy systems in individual countries and their levels of self-sufficiency. For instance, the Czech Republic was largely self-sufficient, whereas Malta relied on other energy sources. By 2021, some countries still relied entirely on imports of solid fossil fuels, including the Netherlands, Ireland, and Cyprus. In contrast, Malta and Portugal showed no dependence, and the Czech Republic exhibited minimal dependence (5%). Between 2010 and 2019, only nine countries experienced a decrease in dependence on solid fossil fuel imports. Generally, import dependence increased during this period, with the most rapid increases observed in Denmark, Cyprus, and Slovakia (34–35 percentage point increase). On the other hand, the most substantial decreases in dependence were noted in Bulgaria (17 percentage point decrease), Luxembourg (9 percentage point decrease), and Ireland (6 percentage point decrease). Between 2019 and 2021, the trend reversed, and 18 countries saw a decrease in dependence on solid fossil fuel imports. The most significant reductions occurred in Portugal (99 percentage point decrease), Denmark (62 percentage point decrease), and Latvia (43 percentage point decrease). However, Ireland, Sweden, and Greece displayed the largest patterns of import dependence during this period. Overall, the COVID-19 pandemic crisis had a positive impact on the decrease in dependence on imports of solid fossil fuels, primarily due to reasons similar to other energy commodities. Additionally, individual EU countries are undergoing an energy transition, shifting away from coal-based energy. Mine closures, such as those in Germany, also contributed to these changes. The development of renewable energy sources is on the rise, leading to a restructuring of the energy production in individual countries.
3.5. Changes in the EU’s Dependence on Energy Imports from Russia during the COVID-19 Pandemic and the War in Ukraine
Figure 8 depicts the changes in the EU’s dependence on imports of primary energy commodities from Russia. For oil and petroleum products and natural gas, the situation remained stable before and during the COVID-19 pandemic. Imports from Russia were consistently steady until the outbreak of the war in Ukraine in February 2022. At that point, there was a notable reduction in the impact of imports from Russia. The decline in imports of solid fossil fuels was particularly prominent during the initial months of the war, leading to a complete halt in these imports from September onwards. Short-term contracts generally govern solid fossil fuel imports, making it relatively easier to discontinue them. However, the situation with other raw materials, such as natural gas and oil and petroleum products, was more complex. Long-term contracts were in place, and the EU had to search for alternatives to replace supplies from Russia, which took time. Consequently, the supply of these raw materials from Russia was not terminated swiftly. Reducing oil supply was comparatively easier than reducing natural gas supply. A significant challenge in many countries was the lack of infrastructure suitable for ships carrying raw materials and the absence of adequate storage facilities. Consequently, restricting imports of energy raw materials from Russia was a prolonged process and is still ongoing. Complete cessation of imports from Russia to the EU might prove challenging, as each country operates independently in the energy market. They all sign new contracts and seek raw material supplies from various directions based on their individual needs and circumstances.
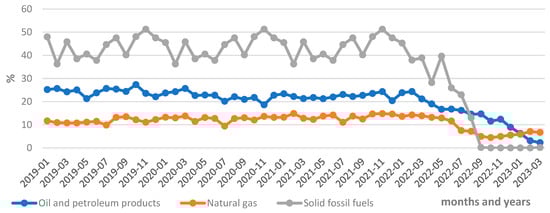
Figure 8.
Share of imports from Russia of basic energy raw materials in total EU imports by month (January 2019 to March 2023).
3.6. Changes in Dependence on Energy Imports from Russia in Individual EU Countries during the COVID-19 Pandemic and the War in Ukraine
At the beginning of 2019, the dependence of individual EU countries on imports of oil and petroleum products from Russia varied significantly. Lithuania, Slovakia, and Finland were the most import-dependent countries, with 87%, 79%, and 72% of their total imports coming from Russia, respectively (see Table 3). Conversely, Luxembourg, Austria, and Spain were the least dependent on imports from Russia for these energy commodities. During the COVID-19 pandemic, there were minimal changes in the most dependent countries, and only a few countries managed to reduce their dependence on imports of oil and petroleum products from Russia. For example, Bulgaria decreased its share of imports from Russia from 64% in January 2019 to 7% in January 2022, while Slovenia and Croatia managed to reduce their dependence from 56% to 0% and from 10% to 0%, respectively. However, there were also cases of increased dependency during this period, such as Germany (from 28% to 32%), Greece (from 20% to 27%), and Italy (from 7% to 17%). Far more substantial changes occurred during the war in Ukraine. Notably, a significant reduction in imports from Russia took place in the first months of 2023, making March 2023 a more appropriate time for the analysis. The reduction in imports of oil and petroleum products affected virtually all EU countries. As a result, at the beginning of 2023, as many as 14 countries showed no imports from Russia, and several others had only a very small share of purchases from this direction. In only a few countries, the scale of reduction was small. However, a problem lay in signed contracts that could not be terminated on short notice. Another factor may have been limitations in finding raw materials of suitable quality and price. Nonetheless, it is evident that the crisis resulting from the war in Ukraine had a substantial impact on the reduction of imports of oil and petroleum products from Russia for individual EU countries.
Table 3.
Share of oil and petroleum products imports in EU countries in selected months from 2019 to 2023.
Natural gas was another significant raw material imported from Russia to the EU. At the beginning of 2019, Bulgaria and Latvia were completely dependent on Russian natural gas imports, with Finland heavily reliant at 92% (see Table 4). In contrast, there were numerous countries that were entirely independent from Russian natural gas imports due to reasons such as lack of access to pipelines or utilization of alternative sources. Between January 2019 and January 2022, there were minimal changes in dependence on Russian natural gas imports. Some exceptions included Estonia, which reduced its dependence from 59% to 0%, and Sweden, which increased its reliance from 0% to 20%. However, more significant changes occurred after the outbreak of the war in Ukraine. Latvia, which was entirely dependent on natural gas imports from Russia, achieved complete independence in 2023. Germany also abandoned Russian natural gas imports, and Finland considerably curtailed its imports. Overall, it can be concluded that the COVID-19 pandemic had little impact on natural gas imports from Russia to the EU. The major changes in imports occurred due to the outbreak of the war in Ukraine, with several countries abandoning or reducing their reliance on Russian natural gas imports.
Table 4.
Share of natural gas imports in EU countries in selected months from 2019 to 2023.
3.7. Changes in the Concentration of Energy Imports from Russia in EU Countries during Crises
The following step involved an examination of the shifting concentration of primary energy commodity imports from Russia within the EU. We analysed concentration levels during the periods of January 2019 to 2022 and March 2023. Generally, it was observed that several EU countries displayed a high level of import concentration. To visually represent this concentration, the Lorenz curve was employed (Figure 9).
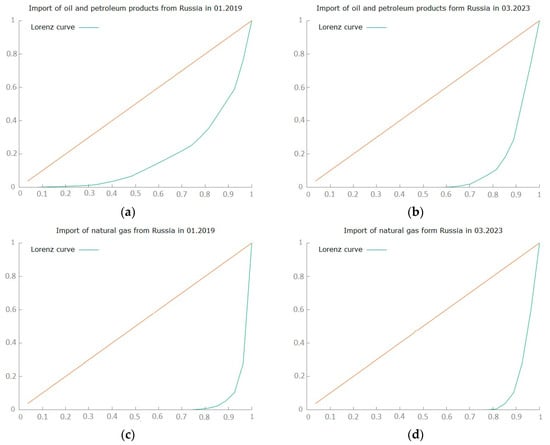
Figure 9.
Lorenz concentration curves for imports of energy raw materials from Russia to the EU in 2019–2023. (a) Import of oil and petroleum products in January 2019. (b) Imports of oil and petroleum products in January 2019. (c) Import of natural gas in January 2019. (d) Imports of natural gas in January 2019.
Notably, there was a much higher concentration in the case of natural gas imports from Russia. Conversely, there was a sharp spike in concentration regarding imports of oil and petroleum products, which was a consequence of many countries choosing to refrain from importing these raw materials from Russia.
The numerical changes in the Gini coefficient are provided in Table 5. Prior to the outbreak of the COVID-19 pandemic, there were negligible alterations in the concentration of energy raw material imports from Russia. However, the conflict in Ukraine led to an intensified concentration in oil and petroleum product imports from Russia, with only a limited number of countries being involved. Surprisingly, there was a notable increase in concentration for natural gas imports, primarily driven by the significant reduction in imports of this raw material from Russia. Additionally, a small group of countries had already been importing natural gas from Russia.
Table 5.
Estimated Gini coefficients for imports of energy raw materials from Russia to European Union countries from 2019 to 2023.
4. Discussion
The politicization of the issue surrounding the supply of energy resources from Russia to the European Union had already become a subject of political debate in 2014. During that time, Russia annexed Crimea, which was previously part of Ukraine, serving as a wake-up call for the EU to consider reducing its reliance on Russia or, at the very least, diversifying its energy sources [2]. Costantini et al. [65] argue that the contemporary economic crises were caused by the European Union’s disregard for the economic, geopolitical, and climatic challenges faced by its peripheral eastern countries. This led to energy dependence and economic instability across the entire Union, increasing the risk of economic crises. Western European countries appeared unconcerned, as they leveraged their bargaining position to secure favourable contracts with Russia, thus gaining an advantage over other EU nations [66]. Our research supports these findings, as it reveals that the EU’s energy import dependence was not declining but rather increasing. Gökgöz and Güvercin [67] highlight that imports accounted for 54% of total EU energy consumption. Our study yielded similar results, indicating a significant dependence on natural gas imports, exceeding 83% and even reaching 100% for certain countries such as Sweden, Belgium, and Portugal. Specifically, between 2020 and 2022, gas dependency saw a sharp rise, nearly reaching 90% for the EU as a whole. This elevated reliance on energy imports from Russia posed a considerable risk to energy security. Proedrou [68] argues that the EU’s main challenge was balancing competitiveness and efficiency. Consequently, the Union opted for cheaper raw materials from Russia and invested in new infrastructures such as Nord Stream I and II. However, Siddi [69] pointed out that diversification should not merely involve reducing supplies from Russia but also increasing energy imports from other sources such as Norway and Algeria, and a pipeline from Azerbaijan. Nevertheless, the scale of these alternative supplies was relatively limited, and LNG imports were being reduced due to higher costs compared to pipelines.
According to Goldthau and Sitter [70], after the start of the war in Ukraine in February 2022, the EU applied autonomous measures to reduce its dependence on Russian natural gas and other energy resources. The reason for this was the strong geopolitical pressure caused by the Russian invasion. In such a context, energy security became a priority and could not be outsourced. Farrell and Newman [71] believed that a trade partnership could only be secure if the actors were not rivals. Such a condition was no longer met after the outbreak of war. Fulwood et al. [72] point out that the EU’s actions aim to reduce its natural gas imports from Russia by 2/3 in 2022 and to completely abandon supplies from this direction within four years. In our study, we also found a large reduction in natural gas imports from Russia in the first year after the outbreak of the war in Ukraine. Some countries have completely abandoned supplies from Russia, and others have significantly reduced it. There are also cases of countries such as Hungary that have signed a new contract for gas supplies from Russia. The Czech Republic, on the other hand, has replaced gas from Russia with its own coal and is considering phasing out the use of this resource by the 2030s. Similarly, Germany, Austria, and the Netherlands have lifted restrictions on coal-fired power generation. The war in Ukraine has been treated as an emergency [56]. Tani [73] suggests that the problem with rapid independence from Russian gas is the lack of expensive infrastructure, such as regasification terminals. This problem is, however, being addressed. For example, Germany has signed its first long-term contract with Qatar after the Russian invasion, which will secure gas supplies until 2041. In addition, Germany will also spend USD 3 billion to build floating LNG terminals [56]. Not all countries can afford such expenditures. These observations justify the results we have obtained. The abandonment of gas imports from Russia was a long-term process and did not happen overnight.
In the EU, it is suggested that a way to diversify energy supply is to develop clean energy production, such as from solar, wind, hydrogen, and biomethane [74]. It is estimated that by the end of 2022, renewable energy sources could replace about 20 billion m3 of imported gas in the EU [56]. Eliminating energy dependence on Russia by 2027 is referred to as the REPowerEU plan. The plan addresses supply diversification, energy savings, electrification, the use of renewable and low-carbon gases, and new industrial processes, including industrial heat pumps. In the short term, it also includes the diversification of LNG imports by sea from the US and the Middle East. Reversing the dominant flow direction cannot be done overnight [75].
The reduction of oil imports into the EU depends on the situation in the transport sector, which is the main consumer of oil. According to Claes and Hveem [76], changes in transport behaviour, means of transport, and technology are the key drivers for reducing oil consumption. The problem in diversifying oil supply is that it is quite concentrated in a few regions of the world. OPEC (Organisation of Petroleum Exporting Countries) countries hold more than 70% of the world’s proven oil reserves and control more than 40% of global oil production [77]. In our study, a consistent and very high level of oil imports was evident. In addition, it was a commodity for which there were no large fluctuations in demand despite crisis situations. After the outbreak of war in Ukraine, the European Commission proposed a plan to phase out Russian oil within six months and refine oil by the end of 2022 [78]. Our results confirm these trends. In March 2023, the share of Russian oil imports in total EU imports was 2.28%. It must also be stated that oil substitution in the short term is impossible. In the long term, it can be done by promoting, for example, electromobility [79].
The EU’s dependence on Russian coal was quite low. The reason for this was the decline in the consumption of this raw material in Europe over the last 30 years as a result of the implementation of the energy policy to reduce CO2 emissions to zero [80]. The reduction in coal imports from Russia can be compensated by an increase in extraction in individual EU countries and by imports from the USA Australia, Colombia, but at a higher price. Coal is one option to replace natural gas [59]. Our results indicate that Coal and other solid fuels were the raw materials whose imports from Russia were completely reduced 6 months after the outbreak of war. There was a great deal of flexibility associated with the substitution of this energy resource.
It should also be emphasised that the sequence of structural changes in global energy markets was triggered by the outbreak of the COVID-19 pandemic in early 2020. These changes were only reinforced two years later by the Russian invasion of Ukraine. Both crises had significant repercussions for the energy market [81,82]. First and foremost, in addition to demand and supply changes, there was an increase in energy prices and both wholesale and retail. The increase in energy prices is a social problem because nobody wants to pay a lot for energy. Studies from earlier years confirm that before the crises, energy prices for households did not rise very quickly [83]. Different countries were affected differently by the energy crisis after the outbreak of war in Ukraine. In Belgium, prices in the energy sector rose by 30–50% [84]. Germany is at the time of writing trying to reduce oil imports from Russia, which has caused problems in industries dependent on this resource [85]. In Greece, the effects of the crisis have been felt especially in the tourism sector due to a large increase in oil prices [86]. In Spain, electricity prices rose by 200%, which had a major impact on business and household operations. The cessation of energy imports from Algeria was also a problem [87]. Romania was not in the worst situation, as it produces one third of its oil consumption domestically [88]. The consequences of the energy crisis for the economy are large. According to estimates, higher energy prices will reduce European economic growth by 0.2 percentage points in 2022 [89]. Chepeliev et al. [90], on the other hand, argue that the consequence of both crises will be the long-term environmental benefits of faster CO2 reductions as a result of the acceleration in the introduction of renewable energy [91].
In general, it can be said that dependence on imports of energy raw materials is a major problem for the EU. The crises caused by COVID-19 and later the outbreak of war in Ukraine caused rapid changes. At the beginning of 2023, the EU has given up almost all energy raw materials from Russia, and this will be full independence in 4 years. The positive aspect of this situation is the greater diversification of energy supplies and the acceleration of the introduction of renewable energy so that it can replace non-renewable energy in the future. There would then be complete independence from imports of energy resources and increased energy security.
5. Conclusions and Recommendations
5.1. Conclusions
The conducted research allows for a few generalisations.
- There were no significant changes in the overall EU energy balance between 2010 and 2022. For individual feedstocks, a large reduction in production volumes, imports, exports and total energy supply for solid fossil fuels was evident in the first year of the COVID-19 pandemic. The reason for this was the energy policy that was prompting a move away from this type of fuel. For other energy commodities, reductions in volumes for energy balance parameters were only evident in the first year of the pandemic.
- During the crisis caused by the COVID-19 pandemic, dependence on energy imports decreased slightly and was short-lived. This was due to the reduced demand for energy during the lockdowns. The war in Ukraine, on the other hand, influenced a large increase in dependence on energy feedstock imports, which was driven by the desire to build up stocks and protect against further energy market disruptions. This was particularly true for solid fossil fuels and natural gas. Hence, hypothesis one was verified positively.
- Dependence on energy imports from Russia was higher for oil and petroleum products than natural gas until the end of 2022. In 2023, imports of oil over petroleum products were practically discontinued, while restrictions of natural gas were not so drastic. Hence, hypothesis two was only positively verified at the end of 2022. In both cases of energy sources, there was a very large reduction in imports from Russia. Many countries have abandoned energy imports from Russia altogether.
- The war in Ukraine caused a greater change in EU concentration in imports of energy raw materials imported from Russia than the crisis caused by the COVID-19 pandemic. A particularly large increase in concentration was evident in the case of oil and petroleum products. This was due to the complete reduction in imports by most EU countries. Import concentration for natural gas was high even before the crises, with an increase in the ratio during the pandemic and a decrease during the war. The latter change was due to the reduction or complete abandonment of imports of this raw material from Russia. More changes in the concentration of imports of energy raw materials were observed when importing raw materials from Russia than in total imports. Hypothesis three was confirmed.
5.2. Recommendations and Limitation
The study outlines the changes in EU countries’ dependence on energy imports, particularly from Russia, during the 2020–2022 crises. Such a comprehensive approach is a novelty. Research on such relationships during the COVID-19 pandemic in other European and global countries is lacking. It would be useful to contrast the results for individual countries, as the determinants and scale of constraints during the pandemic and the war in Ukraine differed between countries and regions of the world. The research may concern pairwise comparisons of individual countries from different continents, but also in Europe itself with different geographical locations and with different levels of economic development. These could be future research directions. In addition, the EU was highly dependent on energy from Russia. It can be clearly stated that the crises caused a lot of disruption and subversion of the existing links and flows of energy resources. Everything had to be redefined and therefore requires further clarification.
A limitation of conducting such studies is the lack of up-to-date and detailed data available for the last year and months. Such data are published late, so the analysis could be more detailed.
Author Contributions
Conceptualization, T.R.; Methodology, T.R.; Software, T.R.; Validation, T.R.; Formal analysis, T.R. and A.S.; Investigation, T.R.; Resources, T.R.; Data curation, T.R.; Writing—original draft, T.R., P.B. and A.S.; Writing—review & editing, T.R., P.B. and A.S.; Visualization, T.R.; Supervision, T.R.; Project administration, T.R.; Funding acquisition, T.R. and A.S. All authors have read and agreed to the published version of the manuscript.
Funding
This research received no external funding.
Data Availability Statement
Not applicable.
Conflicts of Interest
The authors declare no conflict of interest.
References
- Richter, P.M.; Holz, F. All quiet on the eastern front? Disruption scenarios of Russian natural gas supply to Europe. Energy Policy 2015, 80, 177–189. [Google Scholar] [CrossRef]
- Kustova, I. EU-Russia Energy Relations, EU Energy Integration, and Energy Security: The State of the Art and a Roadmap for Future Research. J. Contemp. Eur. Res. 2015, 11, 287–295. [Google Scholar] [CrossRef]
- Bouwmeester, M.C.; Oosterhaven, J. Economic impacts of natural gas flow disruptions between Russia and the EU. Energy Policy 2017, 106, 288–297. [Google Scholar] [CrossRef]
- Osieczko, K.; Polaszczyk, J. Comparison of chosen aspects of Energy Security Index for the natural gas sector in Poland and Ukraine. Int. J. Manag. Econ. 2018, 54, 185–196. [Google Scholar] [CrossRef]
- Jääskeläinen, J.J.; Höysniemi, S.; Syri, S.; Tynkkynen, V.P. Finland’s Dependence on Russian Energy-Mutually Beneficial Trade Relations or an Energy Security Threat? Sustainability 2018, 10, 3445. [Google Scholar] [CrossRef]
- Jääskeläinen, J.; Lager, J.; Syri, S. Development of Energy Security in Finland and in the Baltic States since 1991. In Proceedings of the 2019 16th International Conference on the European Energy Market (EEM), Ljubljana, Slovenia, 18–20 September 2019; IEEE: New York, NY, USA, 2019; pp. 1–6. [Google Scholar]
- Rokicki, T.; Jadczak, R.; Kucharski, A.; Bórawski, P.; Bełdycka-Bórawska, A.; Szeberényi, A.; Perkowska, A. Changes in Energy Consumption and Energy Intensity in EU Countries as a Result of the COVID-19 Pandemic by Sector and Area Economy. Energies 2022, 15, 6243. [Google Scholar] [CrossRef]
- Rokicki, T.; Perkowska, A. Diversity and Changes in the Energy Balance in EU Countries. Energies 2021, 14, 1098. [Google Scholar] [CrossRef]
- Pérez, M.D.L.E.M.; Scholten, D.; Stegen, K.S. The multi-speed energy transition in Europe: Opportunities and challenges for EU energy security. Energy Strategy Rev. 2019, 26, 100415. [Google Scholar] [CrossRef]
- Rokicki, T.; Bórawski, P.; Bełdycka-Bórawska, A.; Żak, A.; Koszela, G. Development of Electromobility in European Union Countries under COVID-19 Conditions. Energies 2022, 15, 9. [Google Scholar] [CrossRef]
- Rokicki, T.; Koszela, G.; Ochnio, L.; Wojtczuk, K.; Ratajczak, M.; Szczepaniuk, H.; Michalski, K.; Bórawski, P.; Bełdycka-Bórawska, A. Diversity and Changes in Energy Consumption by Transport in EU Countries. Energies 2021, 14, 5414. [Google Scholar] [CrossRef]
- Rokicki, T.; Perkowska, A. Changes in Energy Supplies in the Countries of the Visegrad Group. Sustainability 2020, 12, 7916. [Google Scholar] [CrossRef]
- Mišík, M. The EU needs to improve its external energy security. Energy Policy 2022, 165, 112930. [Google Scholar] [CrossRef]
- Simbar, R.; Rezapoor, D. Russia’s geopolitical power and geo-energy relations with the European Union in Greater Eurasia. Foreign Relat. 2020, 11, 35–61. [Google Scholar]
- Tar, Z. Political motivation: Reviewing Germany’s support for Nord Stream 2. Amst. Rev. Eur. Aff. 2022, 1, 76–88. [Google Scholar]
- Dubský, Z.; Tichý, L. The European Union as a Recognised Energy Actor in Relations with the Russian Federation, 2014–2019. Eur.-Asia Stud. 2022, 74, 1846–1870. [Google Scholar] [CrossRef]
- Stančík, A.; Osička, J.; Overland, I. Villain or victim? Framing strategies and legitimation practices in the Russian perspective on the European Union’s Third Energy Package. Energy Res. Soc. Sci. 2021, 74, 101962. [Google Scholar] [CrossRef]
- Polak, P.; Polakova, B. Changes in the EU’s geopolitical position and energy doctrine in light of the Ukraine invasion. Society 2022, 59, 254–258. [Google Scholar] [CrossRef]
- Elbassoussy, A. The European energy security dilemma: Major challenges and confrontation strategies. Rev. Econ. Political Sci. 2019, 4, 321–343. [Google Scholar] [CrossRef]
- Luft, G.; Korin, A. Energy Security Challenges for the 21st Century: A Reference Handbook (Contemporary Military, Strategic, and Security Issues); Praeger Security International: Santa Barbara, CA, USA, 2009. [Google Scholar]
- Helén, H. The EU’s energy security dilemma with Russia. Polis (Misc) 2010, 4, 1. [Google Scholar]
- Stulberg, A.N. Natural gas and the Russia-Ukraine crisis: Strategic restraint and the emerging Europe-Eurasia gas network. Energy Res. Soc. Sci. 2017, 24, 71–85. [Google Scholar] [CrossRef]
- Burns, J. Pulling the Plug on Europe’s Energy Dependence. The American Century Project. Available online: www.americansecurityproject.org/pulling-the-plug-on-europes-energy-dependence/ (accessed on 28 July 2023).
- Leal-Arcas, R.; Alemany Ríos, J.; Grasso, C. The European Union and its energy security challenges: Engagement through and with networks. Contemp. Politics 2015, 21, 273–293. [Google Scholar] [CrossRef]
- Carfora, A.; Pansini, R.V.; Scandurra, G. Energy dependence, renewable energy generation and import demand: Are EU countries resilient? Renew. Energy 2022, 195, 1262–1274. [Google Scholar] [CrossRef]
- Su, C.W.; Qin, M.; Chang, H.L.; Țăran, A.M. Which risks drive European natural gas bubbles? Novel evidence from geopolitics and climate. Resour. Policy 2023, 81, 103381. [Google Scholar] [CrossRef]
- Rodríguez-Fernández, L.; Carvajal, A.B.F.; Ruiz-Gómez, L.M. Evolution of European Union’s energy security in gas supply during Russia-Ukraine gas crises (2006–2009). Energy Strategy Rev. 2020, 30, 100518. [Google Scholar] [CrossRef]
- Mitrova, T.; Boersma, T.; Galkina, A. Some future scenarios of Russian natural gas in Europe. Energy Strategy Rev. 2016, 11, 19–28. [Google Scholar] [CrossRef]
- Austvik, O.G. The Energy Union and security-of-gas supply. Energy Policy 2016, 96, 372–382. [Google Scholar] [CrossRef]
- Szulecki, K.; Fischer, S.; Gullberg, A.T.; Sartor, O. Shaping the ‘Energy Union’: Between national positions and governance innovation in EU energy and climate policy. Clim. Policy 2016, 16, 548–567. [Google Scholar] [CrossRef]
- Szulecki, K.; Westphal, K. Taking security seriously in EU energy governance: Crimean shock and the energy union. In Energy Security in Europe; Palgrave Macmillan: Cham, Switzerland, 2018; pp. 177–202. [Google Scholar]
- Dumitrescu, A.L.; Prisecaru, P. The Energy Union Progress. The Evaluation Reports and The Strategic Directions, 2015–2019. Euroinfo 2019, 3, 47–67. [Google Scholar]
- Van den Bergh, K.; Delarue, E.; D’haeseleer, W. Impact of renewables deployment on the CO2 price and the CO2 emissions in the European electricity sector. Energy Policy 2013, 63, 1021–1031. [Google Scholar] [CrossRef]
- Strambo, C.; Nilsson, M.; Månsson, A. Coherent or inconsistent? Assessing energy security and climate policy interaction within the European Union. Energy Res. Soc. Sci. 2015, 8, 1–12. [Google Scholar] [CrossRef]
- Leal-Arcas, R.; Lesniewska, F.; Proedrou, F. Prosumers: New actors in EU energy security. In Netherlands Yearbook of International Law; TMC Asser Press: The Hague, The Netherlands, 2018; pp. 139–172. [Google Scholar]
- Pereira, G.I.; da Silva, P.P.; Soule, D. Policy-adaptation for a smarter and more sustainable EU electricity distribution industry: A foresight analysis. Environ. Dev. Sustain. 2018, 20, 231–267. [Google Scholar]
- Soares, N.; Martins, A.G.; Carvalho, A.L.; Caldeira, C.; Du, C.; Castanheira, É.; Garcia, R. The challenging paradigm of interrelated energy systems towards a more sustainable future. Renew. Sustain. Energy Rev. 2018, 95, 171–193. [Google Scholar]
- Pereira, G.; da Silva, P.P.; Soule, D. Designing Markets for Innovative Electricity Services in the EU: The Roles of Policy, Technology, and Utility Capabilities; Academic Press: Cambridge, MA, USA, 2019; pp. 22–35. [Google Scholar]
- European Commission. Energy 2020. In A Strategy for Competitive, Sustainable and Secure Energy; European Commission: Brussels, Belgium, 2010. [Google Scholar]
- Wach, K.; Glodowska, A.; Maciejewski, M.; Sieja, M. Europeanization Processes of the EU Energy Policy in Visegrad Countries in the Years 2005–2018. Energies 2021, 14, 1802. [Google Scholar] [CrossRef]
- Allen, M.L.; Allen, M.M.; Cumming, D.; Johan, S. Comparative capitalisms and energy transitions: Renewable energy in the European Union. Br. J. Manag. 2021, 32, 611–629. [Google Scholar] [CrossRef]
- A European Green Deal. Available online: https://ec.europa.eu/info/strategy/priorities-2019-2024/european-green-deal_en (accessed on 26 July 2022).
- Gourinchas, P.O. Flattening the pandemic and recession curves. In Mitigating the COVID Economic Crisis: Act Fast and Do Whatever; Baldwin, R., Weder di Mauro, B., Eds.; CEPR Press: London, UK, 2020; Volume 31, pp. 57–62. [Google Scholar]
- Baldwin, R. Keeping the lights on: Economic medicine for a medical shock. VoxEU 2020, 13. [Google Scholar]
- Abay, K.A.; Tafere, K.; Woldemichael, A. Winners and losers from COVID-19: Global evidence from Google Search. World Bank Policy Res. Work. Pap. 2021, 2020, 9268. [Google Scholar]
- De Vet, J.M.; Nigohosyan, D.; Ferrer, J.N.; Gross, A.K.; Kuehl, S.; Flickenschild, M. Impacts of the COVID-19 Pandemic on EU Industries; European Parliament: Strasbourg, France, 2021; pp. 1–86. [Google Scholar]
- Arellana, J.; Márquez, L.; Cantillo, V. COVID-19 outbreak in Colombia: An analysis of its impacts on transport systems. J. Adv. Transp. 2020, 2020, 8867316. [Google Scholar] [CrossRef]
- Haleem, A.; Javaid, M.; Vaishya, R. Effects of COVID-19 pandemic in daily life. Curr. Med. Res. Pract. 2020, 10, 78. [Google Scholar] [CrossRef]
- Sulkowski, L.; Ignatowski, G. Impact of COVID-19 pandemic on organization of religious behaviour in different Christian denominations in Poland. Religions 2020, 11, 254. [Google Scholar] [CrossRef]
- Hussain, M.W.; Mirza, T.; Hassan, M.M. Impact of COVID-19 pandemic on the human behavior. Int. J. Educ. Manag. Eng. 2020, 10, 35–61. [Google Scholar] [CrossRef]
- Škare, M.; Soriano, D.R.; Porada-Rochoń, M. Impact of COVID-19 on the travel and tourism industry. Technol. Forecast. Soc. Change 2021, 163, 120469. [Google Scholar] [CrossRef] [PubMed]
- Grix, J.; Brannagan, P.M.; Grimes, H.; Neville, R. The impact of Covid-19 on sport. Int. J. Sport Policy Politics 2021, 13, 1–12. [Google Scholar] [CrossRef]
- Tadesse, S.; Muluye, W. The impact of COVID-19 pandemic on education system in developing countries: A review. Open J. Soc. Sci. 2020, 8, 159–170. [Google Scholar] [CrossRef]
- Vorbrugg, A.; Bluwstein, J. Making sense of (the Russian war in) Ukraine: On the politics of knowledge and expertise. Political Geogr. 2022, 2022, 102700. [Google Scholar] [CrossRef]
- Sokhanvar, A.; Lee, C.C. How do energy price hikes affect exchange rates during the war in Ukraine. Empir. Econ. 2023, 64, 2151–2164. [Google Scholar] [CrossRef]
- Kuzemko, C.; Blondeel, M.; Dupont, C.; Brisbois, M.C. Russia’s war on Ukraine, European energy policy responses & implications for sustainable transformations. Energy Res. Soc. Sci. 2022, 93, 102842. [Google Scholar]
- Ahn, S.; Kim, D.; Steinbach, S. The impact of the Russian invasion of Ukraine on grain and oilseed trade. Agribusiness 2023, 39, 291–299. [Google Scholar] [CrossRef]
- Ihle, R.; Bar-Nahum, Z.; Nivievskyi, O.; Rubin, O.D. Russia’s invasion of Ukraine increased the synchronisation of global commodity prices. Aust. J. Agric. Resour. Econ. 2022, 66, 775–796. [Google Scholar] [CrossRef]
- Liadze, I.; Macchiarelli, C.; Mortimer-Lee, P.; Sanchez Juanino, P. Economic costs of the Russia-Ukraine war. World Econ. 2023, 46, 874–886. [Google Scholar] [CrossRef]
- Zhuk, P. The war in Ukraine: Consequences for the economy, labour class and equitable development in Europe and beyond. Econ. Labour Relat. Rev. 2023, 34, 343–356. [Google Scholar] [CrossRef]
- Cui, L.; Yue, S.; Nghiem, X.H.; Duan, M. Exploring the risk and economic vulnerability of global energy supply chain interruption in the context of Russo-Ukrainian war. Resour. Policy 2023, 81, 103373. [Google Scholar] [CrossRef]
- Sohag, K.; Islam, M.M.; Tomas Žiković, I.; Mansour, H. Food inflation and geopolitical risks: Analysing European regions amid the Russia-Ukraine war. Br. Food J. 2023, 125, 2368–2391. [Google Scholar] [CrossRef]
- Dixon, P.M.; Weiner, J.; Mitchell-Olds, T.; Woodley, R. Erratum to ‘Bootstrapping the Gini Coefficient of Inequality. Ecology 1988, 69, 1307. [Google Scholar] [CrossRef]
- Dagum, C. The Generation and Distribution of Income, the Lorenz Curve and the Gini Ratio. Econ. Appliquée 1980, 33, 327–367. [Google Scholar] [CrossRef]
- Costantini, V.; Morando, V.; Olk, C.; Tausch, L. Fuelling the Fire: Rethinking European Policy in Times of Energy and Climate Crises. Energies 2022, 15, 7781. [Google Scholar] [CrossRef]
- Proedrou, F. EU Decarbonization under Geopolitical Pressure: Changing Paradigms and Implications for Energy and Climate Policy. Sustainability 2023, 15, 5083. [Google Scholar] [CrossRef]
- Gökgöz, F.; Güvercin, M.T. Energy security and renewable energy efficiency in EU. Renew. Sustain. Energy Rev. 2018, 96, 226–239. [Google Scholar] [CrossRef]
- Proedrou, F. Behind the EU’s energy and climate policy conundrum: Erroneous power toolboxes, deadlocks and the way forward. JCMS J. Common Mark. Stud. 2020, 58, 402–418. [Google Scholar] [CrossRef]
- Siddi, M. The EU’s botched geopolitical approach to external energy policy: The case of the Southern Gas Corridor. Geopolitics 2019, 24, 124–144. [Google Scholar] [CrossRef]
- Goldthau, A.; Sitter, N. Whither the liberal European Union energy model? The public policy consequences of Russia’s weaponization of Energy. In EconPol Forum; CESifo GmbH: Munich, Germany, 2022; Volume 23, pp. 4–7. [Google Scholar]
- Farrell, H.; Newman, A.L. Weaponized interdependence: How global economic networks shape state coercion. Int. Secur. 2019, 44, 42–79. [Google Scholar] [CrossRef]
- Fulwood, M.; Honoré, A.; Sharples, J.; Hall, M. The EU plan to reduce Russian gas imports by two-thirds by the end of 2022: Practical realities and implications. Oxf. Inst. Energy Stud. Energy Insight 2022, 110, 1–28. [Google Scholar]
- Tani, S. Qatar to supply Germany with LNG for 15 years as EU Seeks other Energy Options. Financ. Times, 29 November 2022. [Google Scholar]
- European Commission. Communication from the Commission to the European Parliament, the Council, the European Economic and Social Committee and the Committee of the Regions Youth Opportunities Initiative; European Commission: Brussels, Belgium, 2011. [Google Scholar]
- Rokke, N. How Ukraine Invasion Is Changing Europe’s Energy Plans. Forbes 30 May 2022. Available online: https://www.forbes.com/sites/nilsrokke/2022/05/30/how-ukraine-invasion-is-changing-europes-energy-plans/?sh=176376a76d17 (accessed on 29 July 2023).
- Claes, D.H.; Hveem, H. From Paris to the end of oil. Politics Gov. 2016, 4, 197–208. [Google Scholar] [CrossRef][Green Version]
- Kamyk, J.; Kot-Niewiadomska, A.; Galos, K. The criticality of crude oil for energy security: A case of Poland. Energy 2021, 220, 119707. [Google Scholar] [CrossRef]
- Mulholland, E.; Rodríguez, F. Reducing Oil Dependence in the EU through Applied Measures for Trucks and Buses; The International Council on Clean Transportation (ICCT): San Francisco, CA, USA, 2022. [Google Scholar]
- Arezki, R.; Nysveen, P.M. Ukraine invasion: From oil sanctions to accelerating the energy transition. In Global Economic Consequences of the War in Ukraine Sanctions, Supply Chains and Sustainability; Centre for Economic Policy Research: London, UK, 2022; Volume 13, pp. 84–86. [Google Scholar]
- Perdana, S.; Vielle, M.; Schenckery, M. European economic impacts of cutting energy imports from Russia: A computable general equilibrium analysis. Energy Strategy Rev. 2022, 44, 101006. [Google Scholar] [CrossRef]
- Baumeister, C. Pandemic, War, Inflation: Oil Markets at a Crossroads? (No. w31496); National Bureau of Economic Research: Cambridge, MA, USA, 2023. [Google Scholar]
- Bozsik, N.; Szeberényi, A.; Bozsik, N. Examination of the Hungarian Electricity Industry Structure with Special Regard to Renewables. Energies 2023, 16, 3826. [Google Scholar] [CrossRef]
- Rokicki, T.; Bórawski, P.; Gradziuk, B.; Gradziuk, P.; Mrówczyńska-Kamińska, A.; Kozak, J.; Guzal-Dec, D.J.; Wojtczuk, K. Differentiation and Changes of Household Electricity Prices in EU Countries. Energies 2021, 14, 6894. [Google Scholar] [CrossRef]
- Corroenne, O. Les Prix du Gaz et de L’électricité Explosent. Available online: https://www.rtbf.be/article/les-prix-du-gaz-et-de-lelectricite-explosent-10834503 (accessed on 29 July 2023).
- Connolly, K. Firms Will Go Bust’: Germany Prepares for a Future without Russian Gas. Available online: https://www.theguardian.com/world/2022/apr/09/firms-will-go-bust-germany-prepares-for-a-future-without-russian-gas (accessed on 29 July 2023).
- Kyriaki, T. ΘΕΜA: ΚAΘHΜΕΡΙΝO ΔΕΛΤΙO ΕΠΙΣΚOΠHΣHΣ ΤΙΜΩΝ ΥΓΡΩΝ ΚAΥΣΙΜΩΝ. 2022. Available online: http://www.fuelprices.gr/files/deltia/IMERISIO_DELTIO_PANELLINIO_14_04_2022.pdf (accessed on 29 July 2023).
- Euronews. Europe’s Energy Crisis: Spain Presses Algeria to Guarantee Natural Gas Supply. Available online: https://www.euronews.com/2021/10/28/spain-presses-algeria-to-guarantee-natural-gas-supply# (accessed on 29 July 2023).
- Petrescu, R. România is Una Dintre Cele Mai Sigure Poziţii Faţii de Importurile de Petrol: O Treime Din Necesar e Produsă Local. La Nivelul UE Dependenţa Este de 96%. Prin Producţia Proprie de Petrol România îşi Asigură o Treime Din Necesarul internale de Consum, Avantaj. Ziarul Financiar. Available online: https://www.zf.ro/companii/energie/romania-una-dintre-cele-sigure-pozitii-fata-importurile-petrol-20612615 (accessed on 29 July 2023).
- Gunnella, V.; Jarvis, V.; Morris, R.; Tóth, M. Natural gas dependence and risks to activity in the euro area. Econ. Bull. Boxes 2022, 1. [Google Scholar]
- Chepeliev, M.; Hertel, T.; van der Mensbrugghe, D. Cutting Russia’s fossil fuel exports: Short-term economic pain for long-term environmental gain. World Econ. 2022, 45, 3314–3343. [Google Scholar] [CrossRef]
- Szeberényi, A.; Rokicki, T.; Papp-Váry, Á. Examining the Relationship between Renewable Energy and Environmental Awareness. Energies 2022, 15, 7082. [Google Scholar] [CrossRef]


Disclaimer/Publisher’s Note: The statements, opinions and data contained in all publications are solely those of the individual author(s) and contributor(s) and not of MDPI and/or the editor(s). MDPI and/or the editor(s) disclaim responsibility for any injury to people or property resulting from any ideas, methods, instructions or products referred to in the content. |
© 2023 by the authors. Licensee MDPI, Basel, Switzerland. This article is an open access article distributed under the terms and conditions of the Creative Commons Attribution (CC BY) license (https://creativecommons.org/licenses/by/4.0/).