Abstract
In a stand-alone DC microgrid featuring several distributed energy resources (DERs), droop control is adopted to achieve a proportional distribution of current among the DERs within the microgrid. The operation of the droop control mechanism leads to a variation in bus voltage, which is further amplified by the line impedance between the DC bus and DERs. This paper proposes an enhanced distributed secondary control technique aimed at achieving equitable current sharing and voltage regulation simultaneously within a DC microgrid. The proposed distributed secondary control is incorporated into the cyber layer of the microgrid, facilitating the exchange of information among the controllers. In the event of a communication link breakdown, this technique upholds the reliability of the entire system. The control loop utilizes a type-II fuzzy logic control framework for the adaptive selection of the control parameters to improve the control response. Furthermore, the proposed technique can handle both resistive and constant power loads without any particular prerequisites. Utilizing the Lyapunov method, appropriate stability criteria for the proposed controller have been formulated. Various tests were performed across a range of operational scenarios to assess the robustness of the proposed control technique through MATLAB/Simulink models, which have been validated with real-time experiments. The outcomes revealed that the proposed control effectively achieves its control objectives within a DC microgrid, showcasing rapid responsiveness and minimal oscillation.
1. Introduction
The consensus among most nations is that reducing greenhouse gas emissions is imperative to mitigate the influence of climate change. In pursuit of this objective and to meet the growing electricity demand, South Africa is actively strategizing a shift towards an electricity generation system more reliant on renewable energy sources (RESs) [1]. Since 2011, South Africa has undertaken an initiative to promote independent power generation using RESs through a competitive bidding approach. In its latest energy plan, the country aims for RESs to account for over 25% of its total energy generation by 2030 [2]. The integration of these renewable energy sources into the present power grid poses intricate issues, such as capacity issues and losses incurred during unfavorable power conversion processes. Consequently, the imperative arises to develop small-scale grids, known as microgrids (MGs), equipped with their control structure, loads, energy storage technologies, and generating sources, particularly for remote areas [3]. The use of microgrids alleviates capacity issues as the power is generated and used locally instead of through the power system. Microgrids enable cost-effective utilization of locally available renewable energy sources and facilitate their distribution to nearby loads, ensuring energy independence with economic viability. Based on their coupling bus, MGs can be categorized into hybrid AC-DC, DC, and AC configurations [4]. Microgrids can operate either as stand-alone systems or be connected to the main power grid. Significant progress has been made in recent years to enhance the operations of the AC microgrid. In recent times, DC microgrids have gained considerable attention due to their compatibility (DC interface) with most renewable distributed energy resources (DERs). Additionally, they offer advantages such as increased stability, enhanced efficiency, improved power quality, and reduced control complexity (eliminating the need for reactive power and frequency controls) [5,6]. Research carried out by [7] revealed that DC networks exhibit a 15% enhancement in voltage stability when juxtaposed with AC networks.
The DERs are interconnected in parallel to a shared bus within a DC microgrid configuration. Therefore, ensuring stable operation of the MG relies on effectively controlling the power electronics converter that interfaces with an individual DER. The control functions within a DC microgrid encompass various tasks, such as cost optimization, management of energy storage systems, power balancing, voltage restoration, and load distribution [8,9]. The control structure can be classified hierarchically into three tiers: tertiary, secondary, and primary control [4]. The control at the primary stage comprises conventional inner voltage and current controllers based on proportional–integral (PI) controls in the converters of the DERs. In the case of parallel connections of multiple DERs, the control loop at the primary stage incorporates a droop control to establish current distribution among the DERs. In [10], an enhanced droop control approach is introduced to address the negative impact of voltage deviation-induced circulating current in direct current MGs. To strengthen the transient capabilities of DER converters operating within the microgrids, a conventional integral controller is introduced as a droop control mechanism in [11]. A non-linear droop control is presented in [12] to reinforce the operational abilities of the traditional droop control, which is prone to degradation due to the impedance of the line within an MG.
Alongside the concern regarding current distribution among DERs operating within a DC microgrid, there is an impending concern regarding voltage restoration at the DC bus. This issue arises due to the voltage drop emanating from the implementation of droop control using a virtual droop resistance. Hence, ensuring voltage restoration and proper current distribution are the primary goals of the control system within the DC microgrid [4]. In order to accomplish these goals, a secondary control loop, which can be implemented in a distributed, decentralized or centralized manner, is integrated into the control system [3,13,14]. In the context of centralized control, only one central controller is employed in the secondary layer. This controller, typically PI-based, takes the error signal as input and transmits its output to the primary control of all the DERs operating within the microgrid to rectify deviations from the droop control mechanism. Susceptibility to single-point failures is one of the significant drawbacks of a centralized secondary control approach; this can have disastrous consequences for the MG [3,15]. Another constraint of the centralized secondary approach is the substantial communication bandwidth it demands [3]. A decentralized secondary scheme overcomes these constraints by eliminating the need for significant communication bandwidth. The control under the decentralized secondary scheme is implemented by assigning current and voltage references for each DER operating within the microgrid to follow. Despite its ease of implementation, the decentralized secondary control scheme has the drawback of potentially degrading the overall performance of the MG. The unavailability of global communication is the reason behind this potential degradation; the controller’s output alone might not adequately offset the necessary deviation induced by the primary droop controller [3,16].
Due to its exceptional stability and reliability, distributed secondary control has gained significant traction in DC microgrids for attaining proportional voltage regulation and current-sharing goals in recent years [15,17,18,19]. The lack of a single central control improves system stability and reduces the likelihood of total system breakdown [17,20]. Employing a consensus algorithm enables a communication system with fewer connections, thereby lowering the expenses related to the communication network [15]. This distributed secondary approach involves equipping each DER with its secondary control. These secondary controllers establish communication links with neighboring DER units through a defined topology, enabling information sharing and attaining consensus among all units [17]. This collective operation of the secondary controllers forms a multi-agent system. This technique provides the benefit of sustaining functionality even in the event of a breakdown in a section of the communication network. Consequently, the likelihood of a single-point failure is substantially diminished [20].
In [21], an autonomous microgrid was equipped with a distributed secondary control, employing a multi-agent framework that is data-driven to accomplish efficient current distribution and voltage recovery within the MG. A notable drawback of this approach is its substantial computational cost. With increased penetration of DERs, the algorithm could encounter an overwhelming computational burden regarding parameter estimation. This is due to the extensive number of parameters that may necessitate vast datasets for efficient training, demanding significant computing resources and time. The potential impact of communication delays or failures was also not discussed. An improved power distribution technique for multi-bus direct current MGs was proposed in [22] to eliminate voltage variations by considering the intermittent change in time delays. An anti-heterogeneous time delay estimator based on scattering transformation and a PI consensus algorithm was utilized to achieve accurate power sharing and voltage compensation in a distributed manner. Despite achieving power allocation and voltage compensation, the secondary controller design requires periodic communication, which may foster communication redundancy. In [23], a distributed voltage regulation and power distribution technique for a stand-alone direct current MG is designed using an aperiodic event-triggered communication topology. Also, in [24], an event-triggered distributed control technique for microgrids was introduced, and the algorithm put forth attained the secondary control objective within a directed graph structure, making it applicable for situations under less robust communication conditions. However, the event-triggering algorithms proposed in these methods do not consider the impact of communication time delay and the line capacity limit. Taking into consideration the effects of communication time delay, a distributed control approach utilizing the PI consensus algorithm was also introduced in [25] for DC microgrids. This approach simultaneously achieves bus power distribution and voltage restoration within a single controller, simplifying its complexity and ensuring that control accuracy remains unaffected by time delays. In [26], a consensus protocol-based distributed secondary control was developed to tackle voltage restoration and current distribution challenges within a direct current MG. This method employs a pair of PI controllers, with one designated for equitable current distribution and the other concentrating on voltage restoration. The correction signals originating from these secondary controllers are disseminated to their corresponding local primary controllers. Although the implementation of this technique is straightforward, the error correction term it offers does not align with the required correction term. Consequently, this mismatch may lead to a degradation in control performance. A distributed supervisory control system is presented in [5], facilitating the seamless transition between two distinct secondary controllers. These distributed controllers are designed for voltage recovery and current distribution within the direct current MG. The shortcomings of this approach encompass the transients resulting from the continuous operation of the switching circuit and the difficulty associated with configuring multiple controller coefficients. The idea of virtual voltage drop (VVD) as a control parameter was introduced in [6] as an approach for designing secondary control in direct current MGs. It was demonstrated that by combining the VVD concept with a dynamic averaging algorithm, both voltage restoration and effective current sharing could be achieved, but the effect of communication time delay on the controller was not considered. Based on VVD, an event-triggered secondary control method was introduced in [27]. The employment of the event-triggering mechanism efficiently decreases redundancy in signal transmissions. Through the combination of a time-varying droop gain and VVD, the distributed control approach presented in [28] ensures voltage restoration and adaptable current-sharing capabilities, making it adaptable to various operational scenarios. In [29], a distributed fixed-time secondary control technique based on VVD is proposed. This controller can effectively attain both accurate voltage regulation and current distribution within a predetermined settling time. Despite the advancements in these control techniques mentioned above, none of the authors considered the impact of transmission line impedances. In [30], a secondary controller that combines discrete and continuous signals is introduced. In this control approach, the exchange of current signals among converters only occurs at discrete intervals, resulting in the achievement of control objectives with a reduced communication burden. In [19], a secondary distributed control scheme for a stand-alone direct current MG is proposed to maintain proper power distribution and voltage regulation. The microgrid incorporates multiple energy storage technologies, considering transmission delays. However, only resistive loads were considered in the above control techniques, and no theoretical guarantee was provided for constant power load. The effect of DER plug-and-play was also not considered. In [31], a distributed linear multi-agent consensus protocol was utilized to develop a leader–follower consensus algorithm for the secondary layer of multiple battery energy storage units to achieve voltage control and balanced power distribution, while a distributed voltage observer was proposed in [32] for a similar DC microgrid. The drawback of the posited leader–follower algorithm is the substantial deviation in the bus voltage when the leader breaks down. In [33], a distributed control approach is proposed, which combines the voltage and current sharing error as inputs to the control within the secondary control layer. This approach employs the pinning gain technique to ensure that only one secondary controller within the system can access voltage measurements, given that voltage regulation is a common objective. One main drawback associated with this approach is the latency impact when switching voltage control between the distributed controls. In [34], a line-independent plug-and-play voltage control technique was proposed for MGs. This approach ensures a stable voltage regulation performance in a decentralized manner, which allows for scalability. Nonetheless, the system performance is prone to degradation due to the lack of global communication. In [35], a solution for managing high-volume data traffic to attain optimal power flow in MGs was presented. This was accomplished by introducing a distributed power management scheme designed to function over a low-bandwidth wireless network, relying on inputs from just two sensors. As a result, the data necessary for successful operation are significantly reduced. While the architecture offers plug-and-play capabilities to the system, the impact of communication delays was not considered in the approach. In [36], a control framework based on power buffering is implemented for direct current MGs, aiming to restore the plug-and-play functionality of grid-forming units while simultaneously achieving specific control performance of the MG. However, incorporating power buffers into the control framework will unavoidably raise the total system cost. The effects of loading conditions on the control performance were also not considered.
In addition, the distributed control approaches discussed in all the aforementioned overviews are based on the conventional linear control approach. These controllers have limitations when handling non-linear loads. Table 1 presents a more in-depth comparison between the proposed technique and the previously discussed methods. To control current and voltage, a PI controller is typically employed to eliminate steady-state errors. Nevertheless, a PI controller excels in terms of performance when dealing with specific load points. Satisfactory performance in full-load or different load scenarios may not be guaranteed [37]. Fuzzy logic schemes are recognized as a viable option for addressing control issues in developing power grids, particularly DC microgrids, offering a more resilient solution with improved reliability [38]. Controllers based on type-I fuzzy logic schemes are widely regarded as the most prevalent form of fuzzy control due to their ease of design and minimal requirement of system model knowledge. They have achieved considerable success in addressing diverse power system issues [38,39]. Nonetheless, a notable drawback of type-I fuzzy logic control schemes is their limited ability to effectively manage uncertainties inherent in dynamic environments, such as those encountered in direct current MGs [40]. Therefore, to address these external disturbances and uncertainties, type-II fuzzy logic schemes have emerged as a proficient control technique due to the additional degree of freedom they offer in their output by incorporating the uncertainty footprint, which enhances their ability to handle such challenges [41]. Therefore, this research introduces a novel distributed secondary technique designed for a stand-alone direct current microgrid, incorporating two integral-type candidate controllers and a type-II fuzzy logic controller. This technique endeavors to simultaneously achieve a dual purpose: attaining equitable current distribution among the different components of the microgrid and maintaining the bus voltage at the designated operational DC voltage. The first controller utilizes a bus voltage feedback system to regulate voltage, while the second controller employs a balanced current feedback system to manage the current distribution within the microgrid. In order to bolster the flexibility and resilience of this secondary distributed control, a type-II fuzzy logic control scheme is integrated to adaptively compute the controller parameters based on the magnitudes of the voltage and current errors. The control signal, generated by the secondary controller, is utilized as the reference signal for the primary control loop of each DER, aiming to offset any deviations from the droop.

Table 1.
Comparison of the proposed control approach with alternative techniques.
The secondary control approach put forth effectively attains a consensus output similar to centralized control by leveraging a communication network that facilitates interactivity among neighboring controllers. Lyapunov analysis has been employed to establish sufficient stability conditions for the controller proposed in this research. In addition, the proposed technique has been devised to be entirely distributed and capable of managing both linear and non-linear loads, providing proper performance despite the plug-and-play and communication link breakdown. Moreover, during the control parameter design, the proposed control does not require information about the line resistances, yet it achieved a thorough stability analysis. In order to evaluate the efficiency and robustness of the introduced distributed secondary control approach in attaining voltage restoration and equitable distribution of current within direct current MGs, real-time experiments were conducted across diverse operational scenarios employing a Speedgoat real-time digital machine.
The article’s organization is structured as follows. Section 2 delves into the mathematical modeling of direct current MGs. Section 3 presents the test model of the direct current MG featuring the innovative type-II fuzzy-based secondary control system. An examination of the simulation results, accompanied by an in-depth discourse, is outlined in Section 4. Section 5 showcases a real-time experimental execution of the proposed secondary control to verify the outcomes derived from the simulations. The final section of this article provides a summary and conclusion for the entire body of research.
2. DC Microgrid Mathematical Model
This section focuses on formulating an analytical model for a stand-alone direct current MG comprising N DERs, as depicted in Figure 1. The DERs, via DC-DC converters, are connected in parallel through a distribution line to a common DC bus. This power line is represented as an RL network, having parameters and to characterize its resistance and inductance. Likewise, all electronic loads incorporated within the MG are linked to the DC bus. The derivation of the dynamic model for a converter in a single DER, along with its controls, allows for its extension to accommodate multiple DERs within the direct current MG configuration.
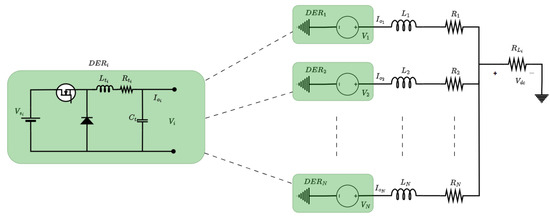
Figure 1.
Model of an islanded DC microgrid.
2.1. Buck DC-DC Converter Modeling
In a buck converter, the input voltage is stepped down to a lower output voltage . The dynamic model of a buck DC-DC converter for the ith DER is derived from Figure 1, and using the electric circuit theory, is formulated as [18,42]
for , where represents the output voltage of the ith DER at the point of common coupling (PCC), and depicts the filter current. represents the ith converter input DC voltage, represents the duty cycle of the ith converter. , , and represent the shunt capacitance, filter inductance, and inductance parasitic resistance, respectively. Furthermore, from Equation (1), the load current can be defined as
Let , , , , . Then from (1) and (2), the overall dynamical equation of the direct current MG is mathematically modeled in vector form as [18]
where , , , .
The minimum values of C and L can be estimated from [4]
where , , and denote the switching frequency of the converter, peak ripple of the output voltage, and peak ripple of the inductor current, respectively.
2.2. Communication Graph
Typically, in a direct current MG comprising n DERs, the communication topology of the DERs is expressed as an undirected graph , where each DER is treated as a node in the communication network. The group of its nodes is represented by , and the aggregate of nodes is denoted as n. represents the edge sets, while denotes the graph edges. The adjacency matrix, represented as , is commonly employed to depict the connections among nodes, where depicts the connection weight of node i to node j. In the event that node i is capable of receiving information from node j, then ; otherwise, . Therefore, for each node , its neighbor node set is expressed as . Graph is considered connected if there exists at least one communication path between every pair of nodes (DERs) within the graph. The Laplacian matrix is commonly employed to characterize agent communication, such that , where , . This paper assumes that the converters in the communication graph are weight-balanced and strongly connected, with a connection weight of 1.
An expression of a continuous-time consistency algorithm is feasible for a multi-agent network comprising n agents [19]:
where represents agent i state variable. If the network’s communication topology contains a directed spanning tree, meaning there exists a node from which at least one directed path connects it to all others, then (5) is valid for satisfying . Figure 2a depicts the near-neighbor communication topology, also known as reduced communication. This topology offers significant advantages over the all-to-all communication topology, shown in Figure 2b. In the all-to-all communication approach, all controllers within the microgrid receive information from every distributed energy resource in the microgrid. Consequently, a substantial number of communication links are required, leading to increased system complexity when integrating new DERs. This hampers the scalability of the DC microgrid and can negatively impact its reliability and resilience. In contrast, the reduced communication topology allows each controller to communicate solely with its adjacent neighbors. This minimizes the system’s complexity by utilizing only a limited number of communication links. As a result, integrating new DERs becomes simpler, requiring just a few additional links, thereby enhancing the overall scalability of the microgrid. Moreover, the implementation and operation costs are reduced due to lighter communication burdens. Therefore, our proposed distributed control system incorporates a near-neighbor communication topology in its cyber layer to facilitate streamlined data exchange.
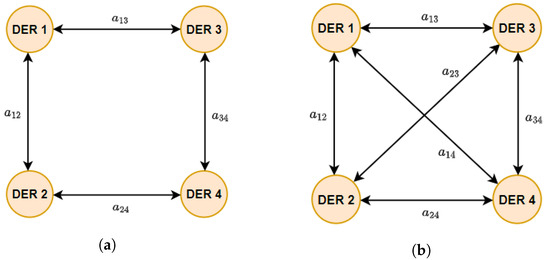
Figure 2.
(a) Reduced communication. (b) All-to-all communication.
Examining the communication network’s topology employed in the proposed control architecture, as shown in Figure 2a, it becomes evident that each node is equipped with at least one communication link. As shown in Figure 3, matrix A represents the configuration of connections among nodes, with its individual elements denoted as . In this context, j represents the neighboring node, while i symbolizes the local node. Within matrix A, nodes without connections are distinctly represented by a zero value. The communication matrix demonstrates dynamism, enabling any disconnected node to shift into a state with zero value.
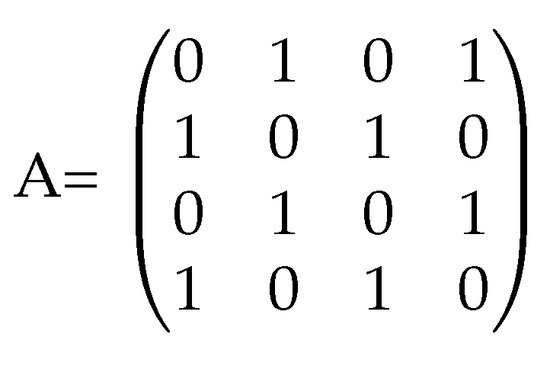
Figure 3.
Communication matrix.
2.3. Primary Control
The main goal of the control loop is to maintain stability within the converter circuit, especially when dealing with transients. Figure 4 illustrates the primary control for the ith converter, which comprises a P-type droop controller, a PI-type voltage, and current controllers. The current reference, generated by the voltage controller, is fed into the current controller to maintain the desired voltage output. The duty cycle required by the PWM to switch the converter is generated by the current controller, ensuring the regulation of its output current. In design, the current controller has quicker responses than the voltage controller to prevent instability.
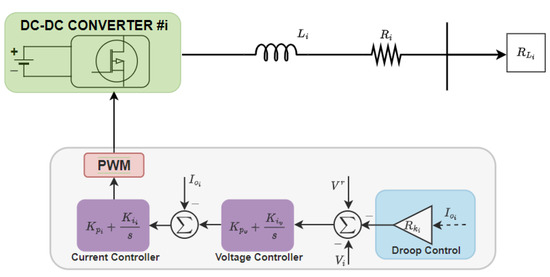
Figure 4.
Primary control of an islanded DC microgrid.
The droop control is the first control level for achieving coordination among multiple DC converters connected in parallel to a common bus in a DC microgrid. The objective of the droop controller is to guarantee a predetermined distribution of current among the converters. Given the configuration of the DC microgrid illustrated in Figure 1, the expression for the bus voltage is computed as follows [4,6]:
where , , and represent the output current, line resistance, and output voltage for the ith DER converter, respectively. The voltage reference derived from the droop control to facilitate proper current distribution is expressed as follows [6]:
where and represent the droop resistance and nominal DC voltage of the direct current MG (rated bus voltage). From (6) and (7), the bus voltage of the microgrid can be formulated as [6,28]
Therefore, from (8), it becomes evident that as long as there is a non-zero output current , there will be a consistent deviation between the nominal DC voltage, , and the actual voltage at the DC bus, . Likewise, the extent of the voltage deviation depends on both the resistance of the droop, , and transmission line, . This study focuses on achieving average power distribution among N DERs operating within a stand-alone DC microgrid to meet the load requirements effectively. This is formulated from (8) as follows:
Thus, the ratio of current distribution among the converters in the microgrid is influenced by both and values associated with each DER. The ratio of the output current shared between and for a constant bus voltage is represented as follows [6,28]:
where the ratio of the current sharing for and is represented by and , respectively. It is crucial to note that each DER can be preassigned a specific current-sharing ratio during the design stage, typically based on its capacity. In past research, the consideration of line resistance has frequently been omitted to simplify their analysis. Nevertheless, the line resistance becomes crucial in real-world direct current MGs as the DERs are located at different positions relative to the common bus. Even though the converters usually have identical rated voltage outputs, the resistance externally added by the droop and the line resistance may not be assumed to be equal, especially if they are positioned at different locations. When a minor voltage variation takes place in the converters, a circulating current is triggered to flow in proportion to the voltage error. Therefore, this study incorporates line resistance, , into the problem formulation and evaluation of the proposed control scheme.
2.4. Control Objectives
The traditional droop control expressed in (7) typically involves selecting a large value of resistance for the droop control to achieve balanced current distribution among the converters. Consequently, this results in a voltage deviation , which is computed as
Hence, ensuring voltage restoration or regulation in the MG is the foremost control objective. It is important to highlight that this is a global objective, which means that a constant DC voltage must be sustained within the MG, and it is formulated as follows:
Moreover, ensuring current sharing or distribution among the DERs in the direct current MG requires compliance with the condition outlined in (10). Achieving this requirement without causing substantial voltage deviation presents a challenging task. Therefore, the second control goal is to ensure the elimination of current-sharing errors while ensuring the preservation of the bus voltage. This is formulated for the ith DER as follows:
where
where the ratio of the current sharing for the DERs is represented by d. This objective embodies a consensus approach, signifying that every distributed energy resource is required to ensure that . The values assigned to the entries in the adjacency matrix, , are set to one to signify the existence of a connection and zero to indicate a disconnection or absence of a communication link. The proposed secondary control designed to fulfill the formulated objectives is presented in the following section.
3. Distributed Secondary Control Technique
The proposed distributed secondary control approach designed to attain both voltage recovery and proportional current distribution within a stand-alone direct current MG is introduced in this section.
3.1. Secondary Control Design
Under the hierarchical control approach, the secondary control loop is incorporated to counterbalance any deviations induced by the control action of the droop within the primary control loop. The proposed secondary controller is implemented within the stand-alone direct current MG for generating the voltage reference required. Considering the control goals outlined in the aforementioned section, the regulation of the DC voltage specified in (8) can be carried out effectively while also guaranteeing an equitable sharing of average current through the utilization of the secondary control system. This is formulated as
Here, represents the amendment signal originating from the proposed secondary control, specifically designed as
where denotes the cumulative integration of current and voltage deviations; the secondary control technique proposed involves the incorporation of weighting parameters , , and , whose amplitude impacts the control response of the secondary controller. A higher amplitude of leads to a quicker convergence of the voltage regulation objective, while a higher amplitude of expedites the convergence of the current-sharing objective. In order to circumvent the trade-off between the voltage regulation and current distribution characteristics of the secondary control, careful design of parameter is necessary. Typically, the design and tuning process of is intricate and time-consuming, mainly because the direct current MG exhibits significant variability. Hence, in order to streamline the tuning technique and enhance the adaptability and flexibility of the distributed secondary control, a type-II fuzzy logic approach is introduced to deduce the appropriate coefficient of . The coefficient plays a crucial role as a scaling parameter, ensuring a proper balance between the objectives of voltage restoration and current sharing.
3.2. Fundamentals of Type-II Fuzzy Logic Control
The fuzzy logic control (FLC) strategy is widely recognized as an effective and intuitive control approach, mainly due to its ability to handle intricate problem solving and uncertainties within any system. Fuzzy logic control operates without the requirement for a precise mathematical model, demonstrating adaptability to imprecise inputs, nonlinearities, and superior disturbance insensitivity compared to the majority of nonlinear controllers. These controllers do not concern themselves with the parameters or fluctuations of the switching power converter, nor do they take into account the operating conditions. Instead, they solely rely on empirical knowledge of the switching power converter’s dynamics [43]. Consequently, such a controller can be used with a wide diversity of switching power converters, implying only minor adjustments. The essential fuzzy rules are derived by approximating the dynamic behavior of the switching power converter. FLCs are a type of control system that is used in various applications where traditional, binary logic controllers may not be suitable or efficient. FLCs are based on fuzzy logic, a mathematical framework that deals with uncertainty and imprecision. Here are some reasons why fuzzy logic controllers are used [43,44]:
- Fuzzy logic is particularly effective at dealing with systems or processes that involve imprecise, uncertain, or vague information.
- Fuzzy logic allows the incorporation of human-like linguistic terms and expert knowledge into the control system. This makes it easier for non-experts to design and understand control rules because it uses terms like ‘low’, ‘medium’, and ‘high’ instead of numerical thresholds.
- FLCs are well-suited for controlling nonlinear systems, which can be difficult to model accurately using traditional control methods. FLCs can adapt and respond to nonlinearities in a more flexible manner.
- FLCs operate based on a set of if-then rules that describe how inputs should be processed to generate control outputs. This rule-based approach makes it relatively simple to implement control strategies and fine-tune them, even for complex systems.
- FLCs are inherently robust and can handle noisy sensor data and input signals without experiencing abrupt changes in control outputs.
- FLCs can be designed to adapt to changing operating conditions or parameters, making them suitable for systems that require continuous adjustment.
Determining membership functions is a crucial step when designing a fuzzy logic system, as they define how input values are mapped to fuzzy sets and play a significant role in the overall system’s performance. A membership function for a fuzzy set A over the universe of discourse x is formally denoted as , wherein every element within x is assigned a value ranging from 0 to 1. This quantity, referred to as the membership value or degree of membership, quantifies the extent to which an element in x belongs to the fuzzy set A [43]. In this context, x represents the universal set, while A is the fuzzy set derived from x. The fuzzy membership function provides a graphical representation that illustrates the degree of membership for any value within a specified fuzzy set. Within the graph, the X-axis corresponds to the universe of discourse, while the Y-axis represents the degree of membership within the range. Membership functions are typically defined based on expert knowledge, data analysis, or a combination of both. Common membership function shapes used in fuzzy logic systems include triangular, trapezoidal, Gaussian, and sigmoidal. The choice of shape may depend on the nature of the input variable and the domain knowledge. Triangular membership functions are utilized in this research because they offer simplicity, adaptability, stability, ease of interpretation, and computational efficiency [45]. Illustrated in Figure 5, a triangular membership function which fuzzifies the input is characterized by a lower limit (b), an upper limit (z), and a central value (m), which are the x coordinates of the three vertices of in a fuzzy set, with the condition that . The membership degree at y and z is zero, while the membership degree at the center m is 1. Hence, the membership degree at any x coordinate point can be determined by [45]

Figure 5.
Triangular membership function.
Figure 6 depicts the general structure of the type-II FLC (T2FLC). The inputs are processed at the fuzzification stage, converting crisp inputs into fuzzy sets (FS). The inference engine computes the appropriate fuzzy output values by employing a predefined set of rules and arithmetic computations. The fuzzy outputs undergo a reduction process to become type-I fuzzy outputs using the type-reducer, and subsequently, at the defuzzification stage, these outputs are transformed into crisp outputs [46].
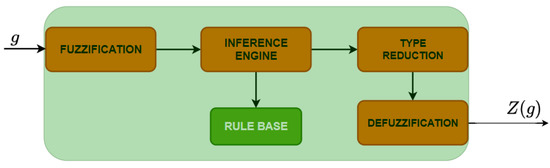
Figure 6.
Type-II fuzzy logic structure.
A type-II FS represented by , where , is specified by [44]
where denotes the type-II membership function, g represents a primary variable, b represents a secondary variable in which , and denotes a primary membership of g. Therefore, can be illustrated as [44]
In (19), the double integral sign represents a union over all viable g and u. In the absence of uncertainties, type-II FS is reduced to type-I FS such that u becomes . Consequently, the boundary of a type-II FS should conform to the fact the vertical slices of the membership functions need to be between 0 and 1. In a case where all , the is regarded as a type-II FS (T2FS), which reduces (19) to
The footprint of uncertainty (FOU) is used to establish the boundary of uncertainty in the interval type-II FS membership functions. The upper membership function (UMF) represents the outer boundary of the FOU, denoted by , while the lower membership function (LMF) corresponds to its inner boundary, denoted by [44,45].
The formulation of rules in type-II FLC closely resembles the approach used in the type-I FLC (T1FLC) scheme. The jth rule of an FLC structure with N rules is illustrated as [44]
where . Using (24), the centroid of the T2FLC related to each fired rule can be calculated. This enables the type reduction block to convert a T2FLC to a T1FLC [45].
where are given as [44,45]
The Karnik–Mendel algorithm [44] is used to compute the switching points D and P in (25) iteratively. The defuzzifier is finally utilized to calculate the crisp output z using (26).
3.3. Type-II Fuzzy-Based Distributed Secondary Control Framework (TFDC)
The control structure of the TFDC proposed for an islanded direct current MG in this research is shown in Figure 7. The standard procedure in microgrid operation entails using the droop technique as the primary control mechanism. This method enables efficient power allocation by facilitating the equitable sharing of current among numerous DERs. Implementing droop control within the MG leads to deviations in the converter voltage output. As a consequence, achieving both current distribution and voltage restoration simultaneously presents a challenge when utilizing primary control. To overcome the limitation posed by the droop control, a secondary control system is employed. The secondary control system under consideration utilizes a type-II fuzzy logic methodology to generate a reference signal for the primary controller. Employing this approach compensates for voltage errors and ensures a balanced distribution of current among the DERs simultaneously. In order to achieve distributed attributes, each DER operating within the MG is equipped with its own secondary control system, allowing communication with those of the neighboring DERs. The framework of the consensus-based TFDC being proposed, depicted in Figure 7, incorporates a dynamic and adaptive regulation of the virtual impedance using a type-II fuzzy logic technique. A fuzzy inference system generally comprises elements such as fuzzy logic operators, membership functions (MFs), and ‘-’ rules. These elements are utilized to evaluate the translation from inputs to output values, encompassing the four consecutive processes elucidated in the preceding subsection: fuzzification, inference engine, type reduction, and defuzzification. In this context, the implementation of the Mamdani fuzzy inference system was carried out. To create a nonlinear correlation between the input and output variables, MFs spanning the universe of discourse were employed by fuzzy logic. Because of their straightforward nature and effective applicability, triangular MFs were employed for the fuzzy sets associated with both the output and input membership functions, as depicted in Figure 8 and Figure 9.
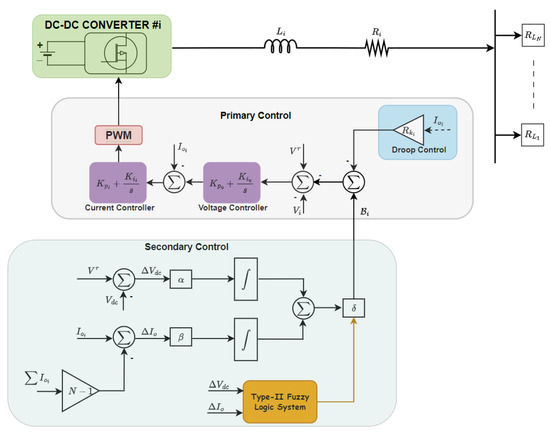
Figure 7.
Structure of proposed TFDC technique.
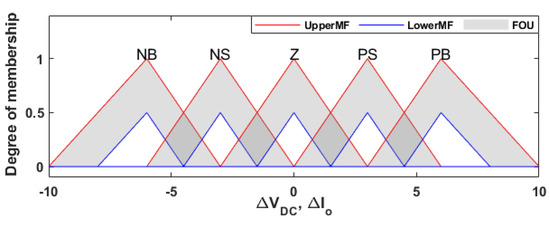
Figure 8.
Input membership functions with FOU.
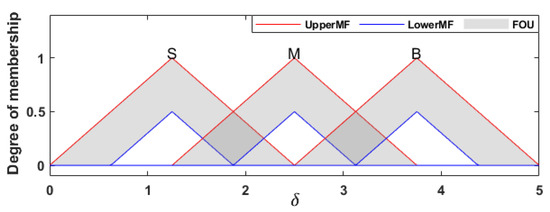
Figure 9.
Input membership functions with FOU.
The arrangement for the training process is described in the following manner.
Fuzzification: During this phase, the inputs, output, and their respective ranges were determined. The voltage deviation, , and current distribution error, , were utilized as inputs for the type-II fuzzy logic system of the individual DER, while the output is represented by the virtual impedance, . Five membership functions were applied to the input variables, and each was assigned a shortened linguistic label: PB (Positive Big), PS (Positive Small), Z (Zero), NS (Negative Small), and NB (Negative Big). The output variable was characterized using three membership functions, denoted as S (Small), M (Moderate), and B (Big).
Inference Engine: The foundation of the fuzzy system’s knowledge is constructed upon a set of twenty-five ‘-’ fuzzy rules, formulated as shown in the following equation. For instance, it is illustrated by rule 16 in Table 2, which outlines the particular rules utilized within the fuzzy system and offers an explanation as follows:
Table 2.
Fuzzy ‘-’ rules.
Following this fuzzy rule, when the membership degree of the voltage deviation is categorized as , and simultaneously the membership degree of the current sharing error is identified as , the resultant membership degree of the virtual impedance is classified as M. Emphasizing the significance, it should be noted that the resulting degrees of the at this stage are classified as type-II fuzzy sets.
Type Reduction: At this stage of the process, the type-II fuzzy sets of the virtual impedance are transformed into a type-I fuzzy set before the defuzzification process. In this article, the type-reducer employed is the center-of-sets approach. Utilizing the Karnik–Mendel iteration method, it aggregates all the type-II fuzzy sets of and subsequently applies center-of-sets computation to generate a type-I fuzzy set of , using (24). This is commonly referred to as a type-reduced set.
Defuzzification: During this sub-process, a crisp output of (virtual impedance) is generated from the type-reduced fuzzy set using (26).
The output signal generated by the proposed TFDC scheme, referred to as the amendment signal , serves the purpose of rectifying the deviations caused by the primary control loop. In mathematical terms, the proposed TFDC can be represented as follows:
where denotes the proposed TFDC.
3.4. Stability Analysis
This subsection delves into the analysis of stability for the proposed TFDC. The stability assessment performed employs Lyapunov stability criteria, facilitating the determination of stability within nonlinear systems through the utilization of a Lyapunov function (LF). By employing a quadratic Lyapunov function , it becomes possible to ascertain the stability conditions that satisfy the Lyapunov criteria within a region encompassing the symmetric point (, depicting a state variable). Taking into account a non-linear system = , the required stability conditions can be established using the subsequent formula [47], in the event that a Lyapunov function exists, expressed as = Q, and it adheres to the subsequent stability criteria, as outlined below [47].
Consequently, the non-linear system is deemed to exhibit asymptotic stability (, ≠ 0). Deriving is crucial for validating the stability of the system, and it is computed as follows:
Hence, to ascertain the system stability, it is necessary for to exhibit negativity (be less than zero). This circumstance will obtain when the requirement < 0.
It is crucial to highlight that during islanded operation of direct current MGs, all distributed energy resource converters function under voltage control mode. Consequently, alterations in the DC voltage inherently impact variations in the output current. Taking into account (3) and (15), the current output derivative following the activation of the distributed secondary control can be computed as
where . Also, from (2), it can be inferred that ; hence, the voltage and current output derivatives of the ith DER in reference to the control signal generated by the distributed secondary control can be computed from (31) as follows:
where . Depicting , , , , and , then (12) and (13) can be computed as
where and denotes the Laplacian matrix of the communication graph.
Lemma 1.
A symmetric matrix exhibiting the subsequent attribute is presumed to be
where and are maximum and minimum positive eigenvalues of matrix , respectively; is the symbol denoting the identity matrix with a proper dimension. The Lyapunov equation offers a method for determining the solution to matrix .
where , while matrix is definite and positive.
Lemma 2.
Assume an undirected communication graph with the objective of ensuring a balanced current distribution, given that , where emerges as the solution for solving .
Theorem 1.
The current distribution and voltage regulation objectives outlined in (12) and (13) are realized via the proposed TFDC specified in (27); this implies that the accumulated deviation, , tends towards zero asymptotically, given that the subsequent condition is met: , where represents the minimum eigenvalue of .
Proof.
Define a Lyapunov function:
Computing the derivative of (37)
Therefore,
The expression is simplified in the following manner:
Considering (42), if as demonstrated in Lemma 1, then . Therefore, examining (42) and contrasting with the theoretical stability criterion defined in (29), the sufficient condition to ensure the asymptotic stability of the secondary distributed controller, in accordance with Lemma 1, mandates the design of the virtual impedance coefficient in the proposed TFDC to be a positive value. □
4. Simulation Results and Discussion
In this section, five cases of simulation are showcased. These scenarios were conducted on a validated direct current MG, developed using MATLAB/Simulink, aiming to illustrate the effectiveness and resilience of the proposed TFDC technique. The MG was modeled as consisting of four distributed energy resources. Each of these resources, with its secondary and primary controls, employs a DC-DC buck converter that is linked to the common bus. The primary control loop is modeled as depicted in Figure 4, integrating the voltage and current PI controller in a decentralized control mode of operation. The secondary control technique proposed in this study employs a distributed scheme facilitated by a communication network. The system and control specifications of the microgrid are outlined in Table 3.
Table 3.
Microgrid parameters.
The first scenario illustrates the capability of the proposed TFDC to achieve the control objectives, specifically the appropriate current distribution and voltage recovery. In order to evaluate the robustness and efficiency of the proposed TFDC, a comparison of its overall performance with alternative control approaches investigated in previous research was conducted. Additional scenarios were considered in order to assess comprehensively the practical capabilities of the proposed TFDC. Scenarios two and three analyze the control response to variations in resistive and constant power loads, respectively. These scenarios enabled us to assess and evaluate the performance of the proposed TFDC under varying load conditions. Under the fourth scenario, the plug-and-play potential of the DERs functioning within the microgrid was explored. In addition, the response of the proposed TFDC to both DER converters and communication link failures with their subsequent recovery is investigated. In doing this, the adaptability and resilience of the proposed TFDC are assessed. The concluding scenario examined the capabilities of TFDC under communication delay. Furthermore, the simulation results of the proposed TFDC technique are additionally substantiated through experimental validation in real-time, as elaborated in Section 5. This validation process has been carried out in real-time utilizing the Speedgoat real-time machine.
4.1. Control Objective Actualization
This section delves into evaluating the resilience and effectiveness of the proposed TFDC in achieving the control goals outlined in Section 2.4. In light of the advantages previously outlined in Section 2.2, the reduced distributed communication topology, shown in Figure 2a, was adopted. It is noteworthy to highlight that the topology is a bidirectional communication, i.e., . The entire simulation duration, split into two phases, extended for a duration of 10 s. During the time interval , corresponding to the initial phase, only the droop control within each distributed energy resource was active, with the loads and connected. At s, signifying the onset of the second phase (), the proposed secondary controller for each DER was actuated. The simulation outcomes for this scenario are illustrated in Figure 10, Figure 11 and Figure 12 and subsequently translated into Table 4.
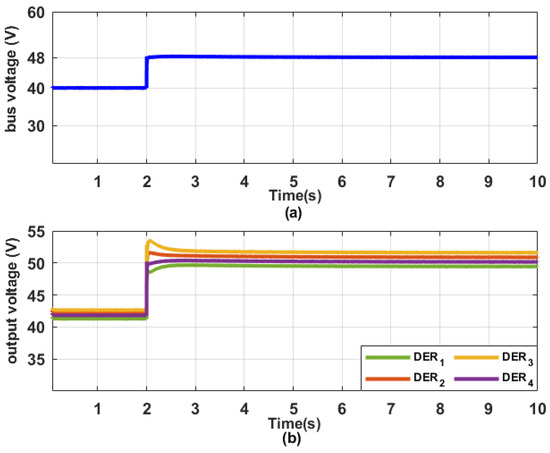
Figure 10.
(a) Bus voltage. (b) Output voltage of individual DERs with proposed TFDC.
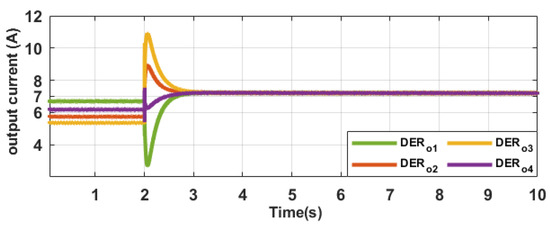
Figure 11.
Output current of individual DER with proposed TFDC.
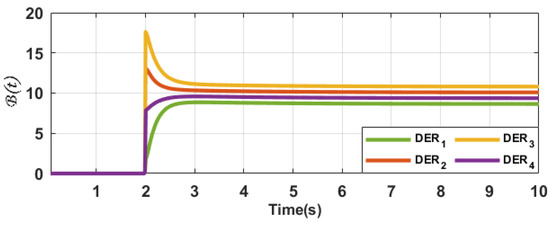
Figure 12.
Output signals of the proposed TFDC with proposed TFDC.
Table 4.
Output voltage outcomes with proposed TFDC.
Observing Figure 10a reveals a noticeable decrease in the bus voltage of the microgrid, which reached a level of 39.8 V during the first phase, falling below its designated rated value of 48 V. This phenomenon may be ascribed to the voltage deviation arising from the line resistance and the droop virtual resistance, as articulated in (8). Comparable results are observable in Figure 10b, illustrating the output voltage of individual distributed energy resources within the MG. As indicated by the results presented in Table 4, a rise in bus voltage to the designated rated value (48 V) is noticed upon the initiation of the proposed TFDC at s, while the output voltage of the distributed energy resources is higher than the rated value. This elevation in voltage beyond the rated level can be ascribed to the considerable line resistance existing between each individual DER and the common bus, and it is established from (6) as . Furthermore, Figure 11 depicts the distribution of current within the MG. It is evident that the intended objective of achieving a consensus on current sharing was not attained in the first phase ( A, A, A, A). Nevertheless, the disparities in current sharing were entirely eliminated when the proposed TFDC was activated in the second phase. In a span of 1 s, the output current of the distributed energy resources came together and reached a consistent value of ( A). This rapid convergence was achieved to satisfy the conditions specified in (13) and (14). Figure 12 shows the output signal, , generated by the proposed secondary control to attain the control goals for each distributed energy resource successfully.
To further explain the efficiency of our proposed TFDC, Table 5 is presented. This table highlights how the proposed secondary controller outperforms previously recommended techniques from the current body of literature in achieving the control objectives. The chosen control strategies share identical objectives (voltage restoration and current sharing), yet their control parameters are devised using distinct methods: distributed consensus secondary control, denoted as T1, proposed in [26]; secondary supervisory control, T2, suggested in [5]; model predictive secondary control, T3, proposed in [48]; and traditional secondary control, denoted as T4, which entails adjusting the parameters of the control through a trial-and-error technique. Upon analyzing the results displayed in Table 5, it becomes evident that our proposed TFDC, compared with T1, exhibits a 98.3% decrease in response time for bus voltage recovery and a decrease of 70.6% in response time for accurate current sharing. Contrasted with T2, our proposed TFDC displays a 97.1% reduction in response time to promptly restore the bus voltage to its intended rated level, along with a 50% decrease in response time for effective current distribution. Relative to T3, our proposed TFDC showcases a 96.2% reduction in response time for bus voltage recovery to its rated value, coupled with a 33.3% decrease in response time for achieving effective current distribution. Moreover, when compared against the traditional secondary control method, our proposed TFDC excels by achieving a 97.5% reduction in response time for swiftly restoring voltage to its designated rated level, along with a 64.3% decrease in response time for achieving balanced current sharing. Therefore, the TFDC proposed in this research proves its efficacy and robustness by attaining the fastest convergence for both current distribution and voltage restoration objectives, outperforming the alternative control techniques.
Table 5.
Response comparison of the proposed TFDC with alternative techniques.
4.2. Control Performance under Varying Resistive Loads
This subsection assesses the performance of the proposed TFDC technique in response to changes in resistive load scenarios. In this particular scenario, the secondary control within each DER is anticipated to attain a new equilibrium for current distribution and uphold the bus voltage at its specified nominal level when one or multiple loads are introduced or withdrawn from the microgrid. To evaluate this scenario, the simulation was split into four phases and conducted over a span of 25 s. In the interval , corresponding to the first phase, the droop control within each distributed energy resource is exclusively activated at s, while the loads , , and are connected. During the interval , which constitutes the second phase, the proposed TFDC for all the distributed energy resources becomes operational at s. In the third phase, , is disconnected from the MG at s and reconnected to the bus at s during the final phase, . The results for this scenario are illustrated in Figure 13, Figure 14 and Figure 15 and subsequently interpreted into Table 6 and Table 7. The results observed during phases one and two share similarities with those analyzed in Section 4.1, with the bus voltage not attaining the rated value and the current not being a consensus in the first phase, while achieving the control objective in the second phase, as presented in Table 7. The voltage at the common bus, along with the voltage outputs of individual DERs, are depicted in Figure 13. Upon disconnecting load, , in the third phase, a brief voltage transient occurred at the common bus, characterized by an overshoot of 11.50%, as indicated in Table 6. Nevertheless, this transient dampens out rapidly within a span of 0.9 s, thereby reinstating the bus voltage to its steady-state value, 48 V. Reconnecting to the microgrid in the fourth phase, a brief transient characterized by a voltage undershoot of 10.41% is noticed. The transient subsides rapidly, specifically within a duration of 0.9 s, as the bus voltage is swiftly restored to its steady-state value, thereby achieving system stabilization. Hence, the common bus voltage remains adequately maintained despite the fluctuations in load demands. Table 7 additionally furnishes the current and voltage output for every DER throughout each phase. As previously stated and detailed in Table 7, the presence of line resistances between the DERs and DC bus is responsible for the noted elevated voltage outputs of the DERs surpassing the rated value.
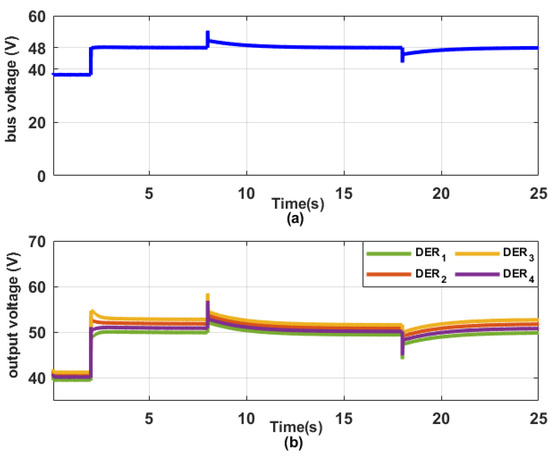
Figure 13.
(a) Bus voltage. (b) Output voltage of individual DERs with resistive load changes.
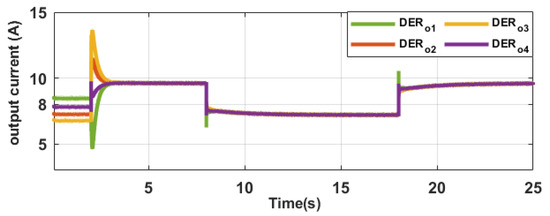
Figure 14.
Output current of individual DER with resistive load changes.

Figure 15.
Output signals of proposed TFDC with resistive load changes.
Table 6.
Bus voltage transient response of TFDC with resistive load changes.
Table 7.
Output current and voltage of DERs with resistive load changes.
The behavior of output current under this scenario is depicted in Figure 14. The results illustrate that the disconnection of the load, , from the microgrid led to a drop in the current generated by the DERs. Notably, DER 1 displayed a minimal undershoot of 13.9% yet managed to align with the consensus of the other distributed energy resources within a mere 0.6 s. Reconnecting the load leads to an augmentation in the current, with DER 1 exhibiting the most overshoot, at 10.5%, and achieving consensus in merely 0.6 s. Consequently, it can be deduced that the control strategy proposed in this study is robust and efficient. It ensures proficient current distribution and voltage recovery, irrespective of any fluctuations in the load. In addition, Figure 15 showcases the amendment signal, , produced by the proposed TFDC for every individual DER. As outlined in (16), this amendment signal adeptly eliminates any deviations arising from the droop operations. Comparable results were also identified in prior studies [6,19,49], which similarly explored the scenario involving variations in resistive load demand.
4.3. Control Performance under Constant Power Load (CPL) Changes
The capabilities of the proposed TFDC under variations in constant power load demands are examined in this section. The simulation, structured into four phases, as detailed in Section 4.2, was executed over a span of 25 s. In the interval , corresponding to the first phase, the droop control within each distributed energy resource is exclusively activated at s, while the loads , , and are connected. During the interval , which constitutes the second phase, the proposed TFDC for all the distributed energy resources becomes operational at s. In the third phase, , is disconnected from the MG at s and reconnected to the bus at s during the final phase, . The results for this scenario are illustrated in Figure 16, Figure 17 and Figure 18 and subsequently interpreted into Table 8 and Table 9. The results observed during phases one and two share similarities with those analyzed in Section 4.1, with the bus voltage not attaining the rated value and the current not being a consensus in the first phase, while achieving the control objective in the second phase, as presented in Table 9. The voltage at the common bus, along with the voltage outputs of individual DERs, are depicted in Figure 16. The results distinctly illustrate that the sole application of droop control falls short in maintaining the DC bus voltage at its nominal value when confronted with constant power load demand. In the third phase, upon the disconnection of , a short bus voltage transient occurs, exhibiting a voltage overshoot of 4.17%, which dampens out within a duration of 0.9 s to achieve its steady-state voltage. Nevertheless, when the load is reconnected to the MG in the fourth phase, a brief transient emerges with a voltage undershoot of 5.87%. This transient is rapidly rectified within 0.9 s, reinstating the bus voltage to 48 V and thereby achieving system stabilization. Hence, our proposed TFDC technique effectively preserved the common bus voltage at its designated rated value. Furthermore, as depicted in Figure 17, when is disconnected, a rapid current drop from 6.67 A to 5.59 A, accompanied by a brief transient, becomes apparent. This transient shows a modest undershoot of 7.5% in current from DER 1, while reaching a consensus within 0.4 s. At the reconnection of , a sudden and sharp rise in current output from 5.59 A to 6.67 A, accompanied by a brief transient, is observed. This transient exhibits a peak current overshoot of 5.64% with DER 1, and consensus is achieved within 0.4 s. Consequently, it can be inferred that the proposed control technique successfully achieved the control objective for current distribution when the constant power load was connected and disconnected. As depicted in Figure 18, the amendment signal responded effectively to promptly fulfill the control objectives at the necessary moments.
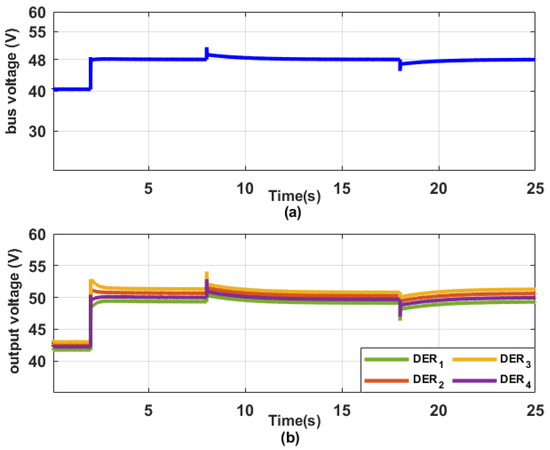
Figure 16.
(a) Bus voltage. (b) Output voltage of individual DERs with CPL changes.
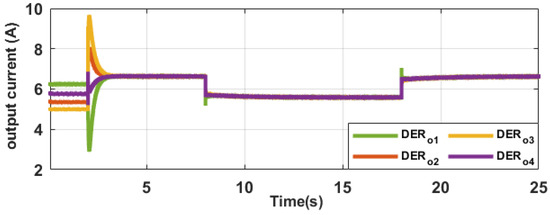
Figure 17.
Output current of individual DER with CPL changes.
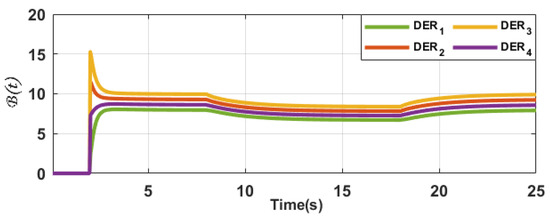
Figure 18.
Output signals of proposed TFDC with CPL changes.
Table 8.
Bus voltage transient response of TFDC under CPL changes.
Table 9.
Output current and voltage of DERs under CPL changes.
The results establish the reliability and robustness of the proposed TFDC, effectively managing CPL perturbations through precise current distribution and bus voltage recovery in alignment with the capabilities of the distributed energy resources, which are in operation within the MG. Comparable results were also achieved in prior studies [6,18,49], wherein the efficacy of their proposed approach was assessed using variations in CPL.
4.4. Control Performance under Inductive Loads
This section examines how the proposed TFDC system performs when subjected to varying inductive (L) load demands. The simulation, organized into four phases, as outlined in Section 4.3, was carried out over a duration of 25 s. In the interval , corresponding to the first phase, the droop control within each distributed energy resource is exclusively activated at s, while the loads , , and are connected. During the interval , which constitutes the second phase, the proposed TFDC for all the distributed energy resources becomes operational at s. In the third phase, , is disconnected from the MG at s and reconnected to the bus at s during the final phase, . Figure 19, Figure 20 and Figure 21 depict the outcomes for this scenario, which are then further elaborated upon in Table 10. The results obtained in phases one and two exhibit resemblances to the findings discussed in Section 4.1, where the bus voltage does not reach the rated value in the first phase, and the current does not reach a consensus, but in the second phase, the control objective is achieved. Figure 19 illustrates the voltage at the common bus and the voltage outputs of individual DERs. The results clearly demonstrate that relying solely on droop control is insufficient to sustain the DC bus voltage at its nominal value when faced with inductive load demands. In the third phase, upon the disconnection of , a short bus voltage transient occurs, exhibiting a voltage overshoot of 10.47%, which dampens out within a duration of 1.8 s to achieve its steady-state voltage. Nevertheless, when the load is reconnected to the MG in the fourth phase, a brief transient emerges with a voltage undershoot of 8.76%. This transient is rapidly rectified within 1.8 s, reinstating the bus voltage to 48 V, thereby stabilizing the system. Hence, our proposed TFDC technique effectively preserved the common bus voltage at its designated rated value. Furthermore, as depicted in Figure 20, when is disconnected, a rapid current drop from 9.23 A to 7.29 A, accompanied by a brief transient, becomes apparent. This transient shows a modest undershoot of 10.3% in current from DER 1, while reaching a consensus within 0.4 s. At the reconnection of , a sudden and sharp rise in current output from 7.29 A to 9.27 A, accompanied by a brief transient with no overshoot and achieving consensus within 0.4s, is observed. Therefore, we can deduce that the proposed control technique effectively met the current distribution objective when the inductive load was connected and disconnected. As shown in Figure 21, the amendment signal promptly and effectively responded to meet the control objectives when required.
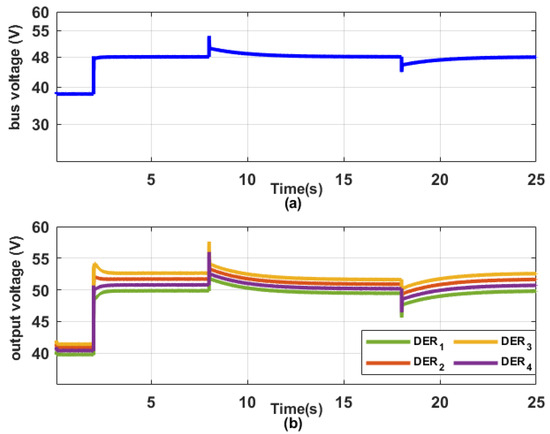
Figure 19.
(a) Bus voltage. (b) Output voltage of individual DERs with inductive load changes.
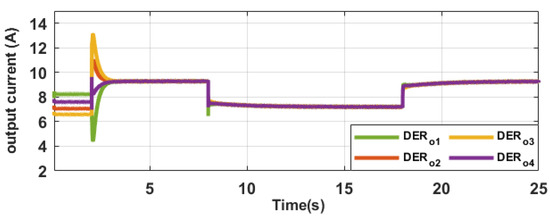
Figure 20.
Output current of individual DER with inductive load changes.
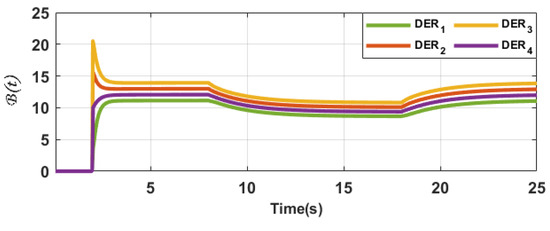
Figure 21.
Output signals of proposed TFDC with inductive load changes.
Table 10.
Bus voltage transient response of TFDC under inductive load changes.
Evidently, the system exhibits rapid responses to load disturbances and demonstrates good steady-state performance when subjected to inductive loads. These results confirm the reliability and robustness of the proposed TFDC system, as it adeptly handles inductive load perturbations by ensuring precise current distribution and swift recovery of the bus voltage, aligning with the capabilities of the distributed energy resources operating within the microgrid.
4.5. Control Performance under Capacitive Loads
This section examines how the proposed TFDC system performs when subjected to varying capacitive (C) load demands. The simulation, organized into four phases, as outlined in Section 4.3, was carried out over a duration of 25 s. In the interval , corresponding to the first phase, the droop control within each distributed energy resource is exclusively activated at s, while only the loads , are connected. During the interval , which constitutes the second phase, the proposed TFDC for all the distributed energy resources becomes operational at s. In the third phase, , is connected to the MG at s and disconnected from the bus at s during the final phase, . Figure 22, Figure 23 and Figure 24 depict the outcomes for this scenario, which are then further elaborated upon in Table 11. The results obtained in phases one and two exhibit resemblances to the findings discussed in Section 4.1, where the bus voltage does not reach the rated value in the first phase, and the current does not reach a consensus, but in the second phase, the control objective is achieved. Figure 22 illustrates the voltage at the common bus and the voltage outputs of individual DERs. The outcomes illustrate that depending solely on droop control is inadequate for maintaining the DC bus voltage at its nominal level in the presence of capacitive load requirements. Connecting in the third phase resulted in a very short transient in bus voltage, exhibiting a voltage undershoot of 6.25%, which dampens out within a duration of 0.04 s to achieve its steady-state voltage. Nevertheless, when the load was disconnected from the MG in the fourth phase, no transient occurred in the bus voltage, and it was kept at its steady-state value. Therefore, our proposed TFDC technique efficiently maintained the common bus voltage at its nominal value. Furthermore, as depicted in Figure 23, a short spike in current occurred when was connected. This spike has the highest magnitude of 9.7 A with DER 1. No transient or spike occurred at the disconnection of , and the consensus was maintained. From our observations, it can be inferred that the proposed control technique effectively achieved the desired current distribution objective during both the connection and disconnection of the capacitive load.
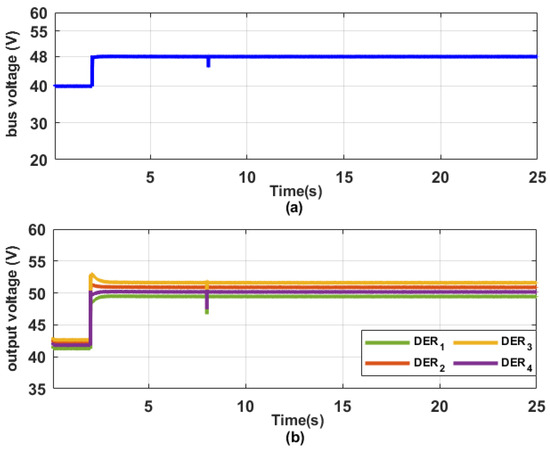
Figure 22.
(a) Bus voltage. (b) Output voltage of individual DERs with capacitive load changes.
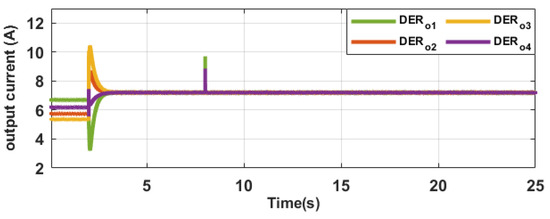
Figure 23.
Output current of individual DER with capacitive load changes.
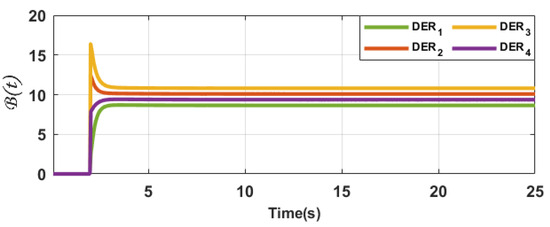
Figure 24.
Output signals of proposed TFDC with capacitive load changes.
Table 11.
Bus voltage transient response of TFDC under capacitive load changes.
These results confirm the reliability and robustness of the proposed TFDC system, which proficiently manages disturbances from capacitive loads, ensuring accurate current distribution and rapid bus voltage recovery.
4.6. DER Plug-and-Play Ability of Proposed Control Technique
In this particular scenario, the effectiveness of the proposed control scheme with regard to its ability to seamlessly integrate DERs is examined using a plug-and-play approach. The simulation comprised three distinct phases and covered the time interval s. During the time interval , which constitutes the first phase, the proposed secondary and primary droop controls are both active within each distributed energy resource from the start of the phase, s. This is concurrent with the connection of loads , , and . In the second phase, , DER 4 is disconnected from the MG at s. Subsequently, in the third phase, encompassing the time interval of , DER 4 is reconnected at s. Figure 25, Figure 26 and Figure 27 show the results obtained under this scenario, which are further presented in Table 12 and Table 13. During the first phase, it can be noted that the bus voltage remains consistent at the designated rated value, while the output current is evenly distributed among the distributed energy resources. In the second phase, as illustrated in Figure 25, the voltage of the common bus returns to its steady-state level subsequent to a brief transient period resulting from the disconnection event. As indicated by the analysis in Table 12, the transient, characterized by a 5.0% voltage undershoot, attenuated rapidly within a duration of 0.9 s. Additional insights from Figure 25b and Figure 26 demonstrate that when disconnected from the microgrid, DER 4 transitioned into standby mode, exhibiting an output voltage of 47.79 V and an amendment signal of zero. However, disconnecting DER 4 led to a complete cessation of its output current to the microgrid, as revealed in Figure 27. Simultaneously, the output current from the remaining DERs experiences a sudden rise from 9.61 A to 12.74 A, and this consensus is upheld without encountering any instances of current overshooting. As observed in Figure 26, the proposed TFDC demonstrates its rapid responsiveness in ensuring equitable distribution of current among the other operational distributed energy resources within the system, as required.
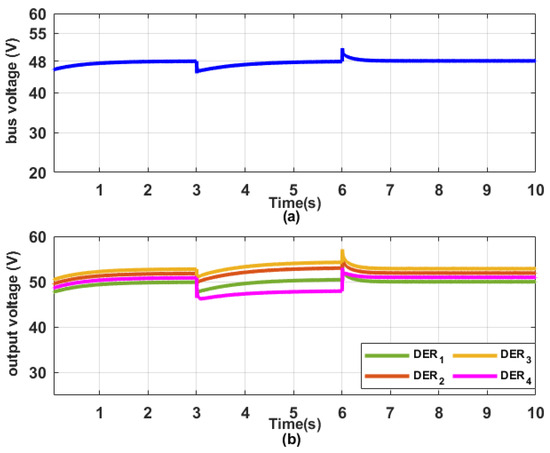
Figure 25.
(a) Bus voltage. (b) Output voltage of individual DERs under plug-and-play.
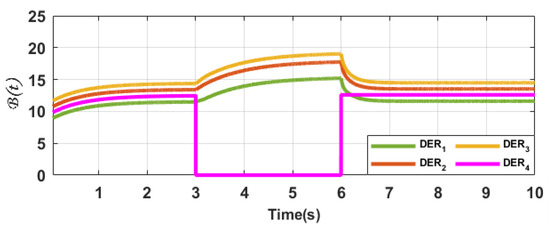
Figure 26.
Output signals of proposed TFDC under plug-and-play.
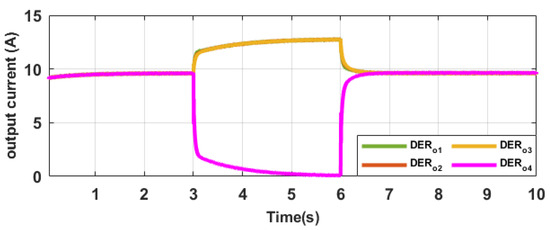
Figure 27.
Output current of individual DER under plug-and-play.
Table 12.
Bus voltage transient response of TFDC under DER plug-and-play.
Table 13.
Output current and voltage of DERs under DER plug-and-play.
During the third phase, the results illustrate that upon the reintegration of DER 4, there is a precise distribution of current among the operational four DERs. This consensus leads to a stable and consistent current of 9.61 A being established within a span of 0.5 s, devoid of any instances of current undershoot or overshoot. The voltage at the common bus swiftly recovers to its stable level in 0.5 s, subsequent to an abrupt 4.5% voltage overshoot triggered by the reconnection. Therefore, regardless of the instances of DER disconnection and reconnection, the TFDC scheme proposed consistently ensures the attainment of control objectives. This serves as a notable illustration of its effective and resilient plug-and-play ability.
Moreover, the employed communication topology, shown in Figure 2a, is characterized by a balanced graph structure. Opting for a balanced communication graph holds significant importance, as it ensures that the algorithm proposed can deliver precise current estimates, reflecting the actual steady-state average current from all distributed energy resources, exclusively under this circumstance. It is worth highlighting that the detachment of DER 4 from the microgrid, which could arise from its converter malfunction in a real-world situation, might also entail the communication loss of all links connected to DER 4 [50]. Hence, in the event of a communication link breakdown, as demonstrated in this scenario, the automatic disconnection of DER 4 at results in the consequent non-functionality of communication links and . However, the remaining links persist to form the interconnected graph, ensuring that the overall balance of the graph is preserved. As discovered in Figure 25, in the event of a communication link failure within the MG, even though the communication topology remains unchanged, the system encounters an imbalanced current generation, resulting in a minor bus voltage fluctuation. This voltage variation is subsequently rectified, leading the system back to its designated steady-state value. Figure 27 further demonstrates that subsequent to the breakdown of the communication link, the current output of the other active DERs exhibits an uptick, while DER 4 encounters a total cessation of its current output. Consequently, the current distribution then conforms to the available capacity of the remaining active DERs. Comparable findings were acquired in prior studies [6,19,36,50]. Through the utilization of the reduced communication topology, it becomes possible to minimize communication redundancy, ensuring continuous system connectivity without interruption, even in the occurrence of a breakdown in communication links. Thus, the proposed TFDC technique establishes its reliability and robustness by ensuring the microgrid’s resilience in the event of communication link failures.
4.7. Control Performance under Time Delay in Communication
Communication links are essential for the functioning of distributed secondary controllers, enabling them to interact and exchange information within the microgrid. This interaction is vital for achieving the designated control objectives. Therefore, it is imperative to assess the impact of delays in the communication network on the behavior of the proposed TFDC scheme. Using the reduced communication topology, various time delays were explored among the secondary controls of the distributed energy resources. Specifically, , , and were configured as 250 ms, 100 ms, and 150 ms, respectively. The simulation comprised three phases and extended over a duration of 10 s. In the first phase, which encompasses the time interval , the load , and are connected, while both the proposed secondary and primary droop control loops of the distributed energy resources are activated from the inception of the phase. During the second phase , an additional load is connected at , and subsequently disconnected in the third phase at . The obtained results are presented in Figure 26 and Figure 28. Drawing from the observation in Figure 28, it is evident that the commencement times of the current output from the distributed energy resources exhibit variation throughout the first phase. This discrepancy arises due to the diverse time delays within the communication protocol of the system. Nevertheless, the TFDC proposed in this research ensures the attainment of the current sharing consensus within an operational time frame of under 0.6 s. Similarly, at the integration and disconnection of the load, during the second and third phases, respectively, the output current of each distributed energy source adapts accordingly in both situations to align with the changing demands. The responses of output current reflect the influence of time delay, while the overall current demand is distributed uniformly among the energy sources.

Figure 28.
Output current of individual DER with communication time delay.
In addition, the voltage at the common bus under this scenario is presented in Figure 29. In comparison to the current output response, the impact of time delay on the bus voltage is not readily discernible. This stems from the fact that the objective for voltage recovery is global, necessitating control action from at least one operational distributed energy resource, whereas the objective for current distribution is consensus, mandating control action from all operational distributed energy sources in the MG. Figure 30 displays the amendment signal, demonstrating the control action of the distributed secondary control proposed for the MG. It can be noticed that every secondary controller responds to achieve the control objectives, ensuring the maintenance of the bus voltage at the rated value and the equitable distribution of load current among the distributed energy sources. Consequently, it can be deduced that the TFDC proposed in this research remains advantageous in facilitating system recovery, even in the presence of communication latency. Comparable results were also achieved in previous studies [18,33,49], which similarly examined the impact of communication delay.

Figure 29.
Bus voltage with communication time delay.

Figure 30.
Output signals of proposed TFDC with communication time delay.
5. Real-Time Experimental Testing
In order to verify the efficacy and resilience of the TFDC scheme proposed for DC microgrids in application to real-world scenarios, a real-time testing environment for a DC microgrid is established for this research, employing the Speedgoat real-time machine. The Speedgoat simulator is a state-of-the-art real-time platform explicitly built for real-time experimental tests through the utilization of Simulink and its Real-Time toolboxes offered by MathWorks. Its application encompasses simulations involving hardware-in-the-loop, implementation of control algorithms, and swift control prototyping for testing systems that have been designed using MATLAB/Simulink software. The real-time system comprises three distinct components, as illustrated in Figure 31: a Xilinx Spartan 6 100k I/O318-100 k reconfigurable FPGA module having a 75 MHz clock frequency; a digital and analog I/O module (IO135); and a Speedgoat Performance real-time target machine having an Intel 4.2 GHz core i7-7700 K quad-core CPU. The control algorithms were developed and assessed within a simulation environment using Matlab/Simulink. The HDL Coder and Simulink Real-Time generate codes automatically from the Simulink models of the DC microgrid, and the code is subsequently deployed to the FPGA and Speedgoat real-time target simulator, respectively. The sampling frequency is set to 20 kHz. The system and control parameters outlined in Table 3 were emulated, and the results were acquired through the oscilloscope, employing a current scale of 1:2 and a voltage scale of 1:10 for measurements. These adjustments were necessitated by the constraints posed by the I/O modules of the real-time simulator. Validation was carried out on four specific test scenarios among those considered during the simulation. The overall schematic of the test system is shown in Figure 32.

Figure 31.
(a) Test bench of speedgoat real-time machine. (b) Real-time simulation setup for DC microgrid.
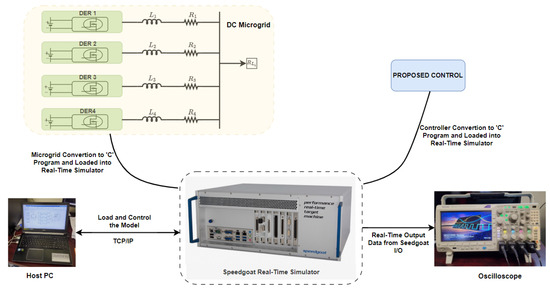
Figure 32.
Schematic diagram of real-time test system.
5.1. Test One: Control Objective Actualization Experimental Results
Under this test condition, the validation process assesses the effectiveness of the proposed TFDC in attaining its control objective. Initially, the droop control loop is engaged with two resistive loads = 10 and = 15 connected, while the secondary control remains in a dormant state. At s, the proposed secondary controls for all distributed energy resources were activated. As depicted in Figure 33, when solely employing the droop control, the voltage at the common bus was measured at 40 V, falling below its designated rated value. Upon activation, the proposed TFDC was able to regulate and uphold the voltage at the bus at its rated value (48 V). A similar phenomenon was noted in Figure 34, which presents the results of the current distribution. The TFDC proposed for the DC microgrid ensured a balanced distribution of current, resulting in a consensus output current, 7.2 A. These results affirm the validity of the simulation analyses pertaining to the control performance in actualizing the intended objectives.
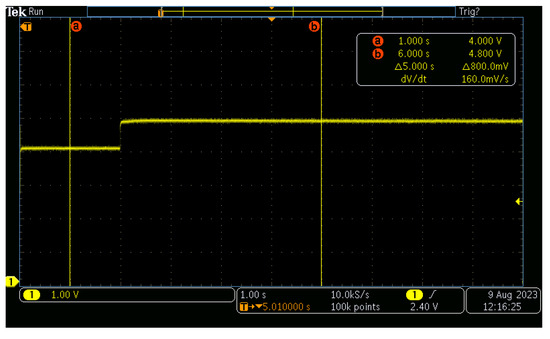
Figure 33.
Bus voltage of DC microgrid.
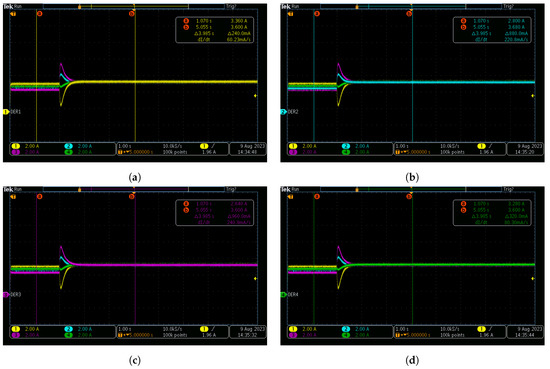
Figure 34.
DC microgrid output current measurement; (a) DER 1; (b) DER 2; (c) DER 3; (d) DER 4.
5.2. Test Two: Experimental Control Performance under Varying Resistive Loads
In this test condition, an initial connection of the resistive loads, = 10 and = 15 , is established with the bus, while the secondary control remains dormant. Illustrated in Figure 35, the voltage at the common bus strays from the designated nominal voltage, decreasing to 38 V. At s, the proposed TFDC is activated, and it can be noted that the bus voltage promptly reverts to its designated rated voltage, 48 V. Evaluating the effectiveness of our control approach when faced with load demand changes, was disconnected from the bus at s and reconnected at s. By examining Figure 35, it becomes evident that the bus voltage remains steady at the specified nominal voltage level, with brief transients as observed and analyzed in the simulation studies, even in the presence of load variations.
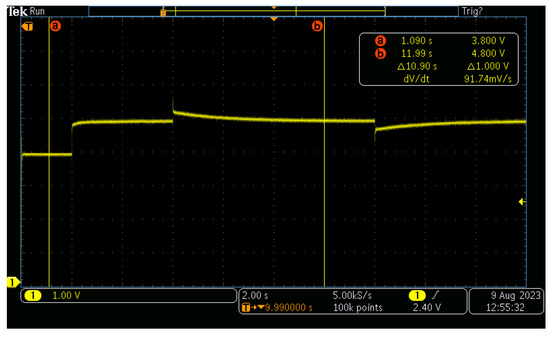
Figure 35.
Bus voltage of DC microgrid under experimental test two.
Moreover, Figure 36 illustrates that the distribution of current among the four DERs aligns with the intended design, showcasing a consensual pattern. The experimental outcomes of this test case correspond with the simulation analyses, thereby validating their coherence.
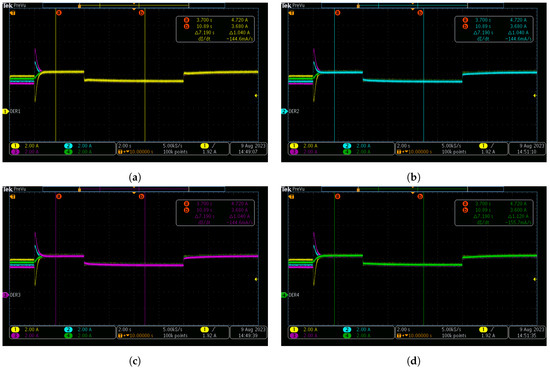
Figure 36.
DC microgrid output current measurement under test two; (a) DER 1; (b) DER 2; (c) DER 3; (d) DER 4.
5.3. Test Three: Experimental Control Performance under Constant Power Load (CPL) Changes
In this test situation, an initial connection of the resistive loads, = 10 and CPL, = 200 W, is established with the bus, while the secondary control remains dormant. Presented in Figure 37, the voltage at the common bus deviates from the designated nominal voltage, decreasing to 40 V. At s, the proposed TFDC was activated, and it can be noted that the bus voltage rapidly recovers back to its designated rated voltage, 48 V. Evaluating the efficacy of the proposed control approach when faced with CPL demand changes, was disconnected from the bus at s and reconnected at s. As evident from Figure 37, it is noticeable that the bus voltage maintains its stability at the designated nominal voltage level, with short transients, as observed and analyzed in the simulation studies, even in the presence of CPL variations. Additionally, Figure 38 illustrates that the current sharing among the DERs aligns with the intended design, displaying a consensus-oriented pattern. The experimental findings for this test case are in agreement with the simulation analyses, thus affirming their congruity.
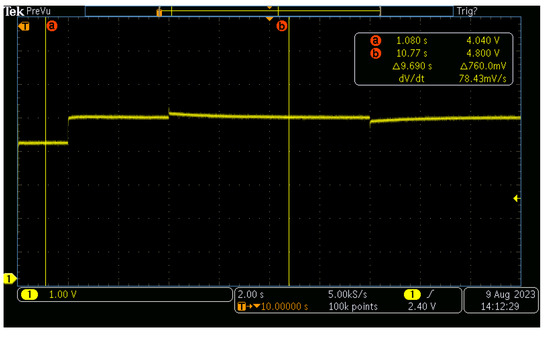
Figure 37.
Bus voltage of DC microgrid under test three.
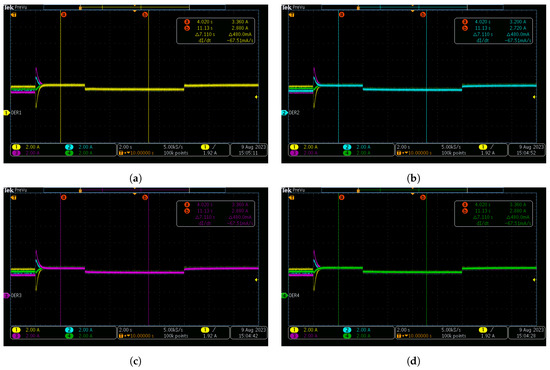
Figure 38.
DC microgrid output current measurement under test three; (a) DER 1; (b) DER 2; (c) DER 3; (d) DER 4.
5.4. Test Four: Experimental Control Performance under Time Delay in Communication
Under this condition, tests were performed to assess the impacts of time delays on the control technique proposed in this research. In this setup, the loads = 10 and = 15 are connected, while both the proposed secondary and primary droop control loops of the distributed energy resources are simultaneously activated from the inception. Subsequently, = 15 is disconnected from the MG at s and then reconnected at s. Using the reduced communication topology, various time delays were explored among the secondary controls of the distributed energy resources. Specifically, , , and were configured as 150 ms, 100 ms, and 250 ms, respectively. Figure 39 and Figure 40 display the experimental results. The observation underscores the satisfactory performance of the TFDC proposed in this research in effective voltage regulation and achieving consensus in the current distribution, even when confronted with various time delays in the direct current MG. Finally, these experimental outcomes substantiate the effectiveness of the proposed TFDC approach, affirming its suitability for practical implementation.
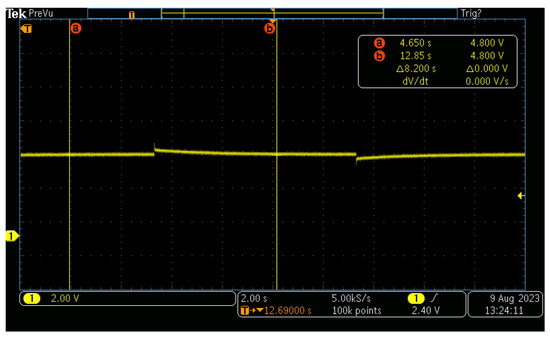
Figure 39.
Bus voltage of DC microgrid under test four.
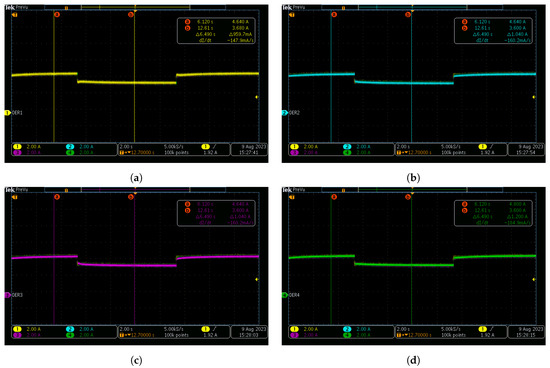
Figure 40.
DC microgrid output current measurement under test four; (a) DER 1; (b) DER 2; (c) DER 3; (d) DER 4.
6. Conclusions
This paper presents an innovative and improved distributed secondary control approach for a stand-alone DC microgrid that encompasses several distributed energy resources (DERs). The secondary control approach put forth in this article guarantees a balanced average current distribution among the energy sources and tackles droop-triggered voltage deviations within a DC microgrid. A type-II fuzzy logic control approach is employed to bolster the control capacity of the secondary control proposed in this research. The type-II fuzzy logic system is driven by inputs related to voltage and current distribution errors. As an output, it produces a secondary control parameter that fine-tunes the weights associated with voltage and current distribution appropriately. Each DER is outfitted with a type-II fuzzy-based secondary control loop, enabling seamless communication with other secondary controls operating in the microgrid to enact distributed control attributes effectively. Utilizing the Lyapunov stability technique, the article also demonstrated the requisite criteria for ensuring the stable operational performance of the type-II fuzzy logic secondary distributed control (TFDC) proposed for DC microgrids. The simulation validated by experimental results confirms the resilience and efficiency of the proposed TFDC in ensuring voltage restoration and accurate current distribution. These validations encompass a range of different test scenarios, such as constant power and resistive load variations, DER plug-and-play, and communication time delays. The results reveal that the proposed TFDC surpasses the traditional secondary control method, exhibiting a significant 97.5% decrease in response time for restoring voltage to its rated level, along with a 64.3% reduction in response time for achieving optimal current sharing. Therefore, implementing the proposed TFDC in real-world DC microgrids provides a smooth solution for addressing issues related to equitable current sharing and voltage restoration. Considering the pivotal role of communication within the distributed secondary control system, the assurance of cyber-physical system safety is closely intertwined with the realm of cybersecurity, an aspect that has garnered substantial attention in control research. Focusing on potential vulnerabilities like "Replay Attack" or "False Data Injection" within our proposed TFDC will be a forthcoming emphasis of this research, aimed at fortifying defenses against malicious actions. Other future research endeavors might also encompass the investigation of diverse converter topologies and the incorporation of hybrid distributed energy resources.
Author Contributions
Conceptualization, O.L., A.A. and A.S.; methodology, A.A., O.L. and A.S.; software, A.A., O.L. and A.S.; validation, A.S., A.A. and L.J.; formal analysis, A.A., O.L. and A.S.; resources, L.J. and A.S.; writing—original draft preparation, A.A., O.L. and A.S.; writing—review and editing, O.L., L.J. and A.S.; visualization, A.S. and O.L.; supervision, L.J. and A.S.; project administration, A.S.; funding acquisition, A.S. and L.J. All authors have read and agreed to the published version of the manuscript.
Funding
This research received no external funding.
Institutional Review Board Statement
Not applicable.
Informed Consent Statement
Not applicable.
Data Availability Statement
No new data were created or analyzed in this study. Data sharing is not applicable to this article.
Acknowledgments
The authors extend their gratitude to the Centre for Power and Energy Systems at the University of KwaZulu-Natal for the invaluable administrative and technical support provided during the course of this project.
Conflicts of Interest
The authors declare no conflict of interest.
Abbreviations
The following abbreviations are used in this manuscript:
| CPL | Constant Power Load |
| TFDC | Type-II Fuzzy-Based Distributed Secondary Control |
| PWM | Pulse Width Modulation |
| MGs | Microgrids |
| ESTs | Energy Storage Technologies |
| DERs | Distributed Energy Resources |
| DC | Direct Current |
| LF | Lyapunov function |
| AC | Alternating Current |
| RESs | renewable energy sources |
References
- Clark, S.; Van Niekerk, J.; Petrie, J.; McGregor, C. The role of natural gas in facilitating the transition to renewable electricity generation in South Africa. J. Energy S. Afr. 2022, 33, 22–35. [Google Scholar] [CrossRef]
- Merven, B.; Burton, J.; Lehmann-Grube, P. Assessment of New Coal Generation Capacity Targets in South Africa’s 2019 Integrated Resource Plan for Electricity; ESRG (Energy Systems Research Group), University of Cape Town: Cape Town, South Africa, 2021; Volume 1. [Google Scholar]
- Modu, B.; Abdullah, M.P.; Sanusi, M.A.; Hamza, M.F. DC-Based microgrid: Topologies, control schemes, and implementations. Alex. Eng. J. 2023, 70, 61–92. [Google Scholar] [CrossRef]
- Aluko, A.; Swanson, A.; Jarvis, L.; Dorrell, D. Modeling and Stability Analysis of Distributed Secondary Control Scheme for Stand-Alone DC Microgrid Applications. Energies 2022, 15, 5411. [Google Scholar] [CrossRef]
- Liu, X.K.; Wang, Y.W.; Lin, P.; Wang, P. Distributed supervisory secondary control for a DC microgrid. IEEE Trans. Energy Convers. 2020, 35, 1736–1746. [Google Scholar] [CrossRef]
- Xing, L.; Mishra, Y.; Guo, F.; Lin, P.; Yang, Y.; Ledwich, G.; Tian, Y.C. Distributed secondary control for current sharing and voltage restoration in DC microgrid. IEEE Trans. Smart Grid 2020, 11, 2487–2497. [Google Scholar] [CrossRef]
- Abhishek, A.; Ranjan, A.; Devassy, S.; Kumar Verma, B.; Ram, S.K.; Dhakar, A.K. Review of hierarchical control strategies for DC microgrid. IET Renew. Power Gener. 2020, 14, 1631–1640. [Google Scholar] [CrossRef]
- Al-Ismail, F.S. DC microgrid planning, operation, and control: A comprehensive review. IEEE Access 2021, 9, 36154–36172. [Google Scholar] [CrossRef]
- Lasabi, O.; Swanson, A.; Jarvis, L.; Aluko, A.; Brown, M. Enhanced Distributed Non-Linear Voltage Regulation and Power Apportion Technique for an Islanded DC Microgrid. Applied Sciences 2023, 13, 8659. [Google Scholar] [CrossRef]
- Thomas, V.; Kumaravel, S.; Ashok, S. Control of parallel DC-DC converters in a DC microgrid using virtual output impedance method. In Proceedings of the 2016 2nd International Conference on Advances in Electrical, Electronics, Information, Communication and Bio-Informatics (AEEICB), Chennai, India, 27–28 February 2016; pp. 587–591. [Google Scholar]
- Gao, L.; Liu, Y.; Ren, H.; Guerrero, J.M. A DC microgrid coordinated control strategy based on integrator current-sharing. Energies 2017, 10, 1116. [Google Scholar] [CrossRef]
- Papadimitriou, C.; Zountouridou, E.; Hatziargyriou, N. Review of hierarchical control in DC microgrids. Electr. Power Syst. Res. 2015, 122, 159–167. [Google Scholar] [CrossRef]
- Peyghami, S.; Mokhtari, H.; Loh, P.C.; Davari, P.; Blaabjerg, F. Distributed primary and secondary power sharing in a droop-controlled LVDC microgrid with merged AC and DC characteristics. IEEE Trans. Smart Grid 2018, 9, 2284–2294. [Google Scholar] [CrossRef]
- Aluko, A.; Buraimoh, E.; Oni, O.E.; Davidson, I.E. Advanced distributed cooperative secondary control of Islanded DC Microgrids. Energies 2022, 15, 3988. [Google Scholar] [CrossRef]
- Nguyen, D.L.; Lee, H.H. A survey on cooperative control strategies for DC microgrids. Neurocomputing 2022, 486, 225–236. [Google Scholar] [CrossRef]
- Espina, E.; Llanos, J.; Burgos-Mellado, C.; Cardenas-Dobson, R.; Martinez-Gomez, M.; Saez, D. Distributed control strategies for microgrids: An overview. IEEE Access 2020, 8, 193412–193448. [Google Scholar] [CrossRef]
- Nahata, P.; La Bella, A.; Scattolini, R.; Ferrari-Trecate, G. Hierarchical control in islanded DC microgrids with flexible structures. IEEE Trans. Control Syst. Technol. 2021, 29, 2379–2392. [Google Scholar] [CrossRef]
- Sadabadi, M.S.; Mijatovic, N.; Dragičević, T. A robust cooperative distributed secondary control strategy for DC microgrids with fewer communication requirements. IEEE Trans. Power Electron. 2023, 38, 271–282. [Google Scholar] [CrossRef]
- Zhang, N.; Yang, D.; Zhang, H.; Luo, Y. Distributed control strategy of DC microgrid based on consistency theory. Energy Rep. 2022, 8, 739–750. [Google Scholar] [CrossRef]
- Gao, F.; Kang, R.; Cao, J.; Yang, T. Primary and secondary control in DC microgrids: A review. J. Mod. Power Syst. Clean Energy 2019, 7, 227–242. [Google Scholar] [CrossRef]
- Xia, Y.; Xu, Y.; Wang, Y.; Dasgupta, S. A Distributed Control in Islanded DC Microgrid based on Multi-Agent Deep Reinforcement Learning. In Proceedings of the IECON 2020—The 46th Annual Conference of the IEEE Industrial Electronics Society, Singapore, 18–21 October 2020; pp. 2359–2363. [Google Scholar]
- Nguyen, D.L.; Lee, H.H. Enhanced distributed secondary control method for DC microgrids against heterogeneous communication time delays. J. Power Electron. 2023, 23, 127–138. [Google Scholar] [CrossRef]
- Guo, F.; Huang, Z.; Wang, L.; Wang, Y. Distributed event-triggered voltage restoration and optimal power sharing control for an islanded DC microgrid. Int. J. Electr. Power Energy Syst. 2023, 153, 109308. [Google Scholar] [CrossRef]
- Zhang, X.; Cai, H.; Xia, Y.; Yang, P.; Zhou, Y. Distributed event-triggered secondary control for microgrids applicable to directed communication graph. Eng. Rep. 2023, e12710. [Google Scholar] [CrossRef]
- Shi, M.; Chen, X.; Zhou, J.; Chen, Y.; Wen, J.; He, H. Distributed optimal control of energy storages in a DC microgrid with communication delay. IEEE Trans. Smart Grid 2020, 11, 2033–2042. [Google Scholar] [CrossRef]
- Dong, M.; Li, L.; Nie, Y.; Song, D.; Yang, J. Stability analysis of a novel distributed secondary control considering communication delay in DC microgrids. IEEE Trans. Smart Grid 2019, 10, 6690–6700. [Google Scholar] [CrossRef]
- Xing, L.; Xu, Q.; Guo, F.; Wu, Z.G.; Liu, M. Distributed secondary control for DC microgrid with event-triggered signal transmissions. IEEE Trans. Sustain. Energy 2021, 12, 1801–1810. [Google Scholar] [CrossRef]
- Xing, L.; Guo, F.; Liu, X.; Wen, C.; Mishra, Y.; Tian, Y.C. Voltage restoration and adjustable current sharing for DC microgrid with time delay via distributed secondary control. IEEE Trans. Sustain. Energy 2021, 12, 1068–1077. [Google Scholar] [CrossRef]
- Yuan, Q.F.; Wang, Y.W.; Liu, X.K.; Lei, Y. Distributed fixed-time secondary control for DC microgrid via dynamic average consensus. IEEE Trans. Sustain. Energy 2021, 12, 2008–2018. [Google Scholar] [CrossRef]
- Liu, X.K.; He, H.; Wang, Y.W.; Xu, Q.; Guo, F. Distributed hybrid secondary control for a DC microgrid via discrete-time interaction. IEEE Trans. Energy Convers. 2018, 33, 1865–1875. [Google Scholar] [CrossRef]
- Bhargavi, K.; Jayalakshmi, N. Leader–follower-based distributed secondary voltage control for a stand-alone PV and wind-integrated DC microgrid system with EVs. J. Control Autom. Electr. Syst. 2020, 31, 233–246. [Google Scholar] [CrossRef]
- Krishna Metihalli, B.; Narayana Sabhahit, J. Disturbance observer-based distributed consensus control strategy of multi-agent system with external disturbance in a standalone DC microgrid. Asian J. Control 2021, 23, 920–936. [Google Scholar] [CrossRef]
- Guo, F.; Xu, Q.; Wen, C.; Wang, L.; Wang, P. Distributed secondary control for power allocation and voltage restoration in islanded DC microgrids. IEEE Trans. Sustain. Energy 2019, 9, 1857–1869. [Google Scholar] [CrossRef]
- Sadabadi, M.S. Line-Independent Plug-and-Play Voltage Stabilization and L2 Gain Performance of DC Microgrids. IEEE Control Syst. Lett. 2020, 5, 1609–1614. [Google Scholar] [CrossRef]
- Hosseinzadeh, M.; Schenato, L.; Garone, E. A distributed optimal power management system for microgrids with plug and play capabilities. Adv. Control Appl. Eng. Ind. Syst. 2021, 3, e65. [Google Scholar] [CrossRef]
- Su, J.; Li, K.; Xing, C. Plug-and-Play of Grid-Forming Units in DC Microgrids Assisted with Power Buffers. IEEE Trans. Smart Grid 2023. [Google Scholar] [CrossRef]
- Maurya, R.; Prakash, S.; Singh, A.K. Challenges, configuration, control, and scope of DC microgrid systems: A review. J. Electr. Eng. Technol. 2023, 18, 1655–1674. [Google Scholar] [CrossRef]
- Gheisarnejad, M.; Khooban, M.H.; Dragičevié, T. The future 5G network-based secondary load frequency control in shipboard microgrids. IEEE J. Emerg. Sel. Top. Power Electron. 2020, 8, 836–844. [Google Scholar] [CrossRef]
- Deshmukh, R.R.; Ballal, M.S.; Suryawanshi, H.M. A fuzzy logic-based supervisory control for power management in multibus DC microgrid. IEEE Trans. Ind. Appl. 2020, 56, 6174–6185. [Google Scholar] [CrossRef]
- Farsizadeh, H.; Gheisarnejad, M.; Mosayebi, M.; Rafiei, M.; Khooban, M.H. An intelligent and fast controller for DC/DC converter feeding CPL in a DC microgrid. IEEE Trans. Circuits Syst. II Express Briefs 2020, 67, 1104–1108. [Google Scholar] [CrossRef]
- Khooban, M.H.; Gheisarnejad, M.; Vafamand, N.; Boudjadar, J. Electric vehicle power propulsion system control based on time-varying fractional calculus: Implementation and experimental results. IEEE Trans. Intell. Veh. 2019, 4, 255–264. [Google Scholar] [CrossRef]
- Ahsan, M.; Alsenani, T.R. Distributed consensus control for voltage tracking and current distribution in DC microgrid. Ain Shams Eng. J. 2023, 102363. [Google Scholar] [CrossRef]
- Silva, J.F.; Pinto, S.F. Linear and nonlinear control of switching power converters. In Power Electronics Handbook; Elsevier: Amsterdam, The Netherlands, 2018; pp. 1141–1220. [Google Scholar]
- Castillo, O.; Amador-Angulo, L.; Castro, J.R.; Garcia-Valdez, M. A comparative study of type-1 fuzzy logic systems, interval type-2 fuzzy logic systems and generalized type-2 fuzzy logic systems in control problems. Inf. Sci. 2016, 354, 257–274. [Google Scholar] [CrossRef]
- Khairuddin, S.H.; Hasan, M.H.; Hashmani, M.A.; Azam, M.H. Generating clustering-based interval fuzzy type-2 triangular and trapezoidal membership functions: A structured literature review. Symmetry 2021, 13, 239. [Google Scholar] [CrossRef]
- Aluko, A.O.; Carpanen, R.P.; Dorrell, D.G.; Ojo, E.E. Robust State Estimation Method for Adaptive Load Frequency Control of Interconnected Power System in a Restructured Environment. IEEE Syst. J. 2021, 15, 5046–5056. [Google Scholar] [CrossRef]
- Khalil, H. Nonlinear Systems, 3rd ed.; Prentice Hall: Upper Saddle River, NJ, USA, 2002; pp. 111–181. [Google Scholar]
- Chandrasekar, A.; Sengupta, S.; Hingane, S.; Gururaja, C.; Pandit, S. Comparative Analysis of Model Predictive Control (MPC) and Conventional Control in Supervisory Controller of a Retrofit HEV. In Proceedings of the SAE Technical Paper Series; SAE International; SAE: Warrendale, PA, USA, 2017. [Google Scholar] [CrossRef]
- Guo, F.; Wang, L.; Wen, C.; Zhang, D.; Xu, Q. Distributed voltage restoration and current sharing control in islanded DC microgrid systems without continuous communication. IEEE Trans. Ind. Electron. 2020, 67, 3043–3053. [Google Scholar] [CrossRef]
- Nasirian, V.; Moayedi, S.; Davoudi, A.; Lewis, F.L. Distributed cooperative control of DC microgrids. IEEE Trans. Power Electron. 2015, 30, 2288–2303. [Google Scholar] [CrossRef]

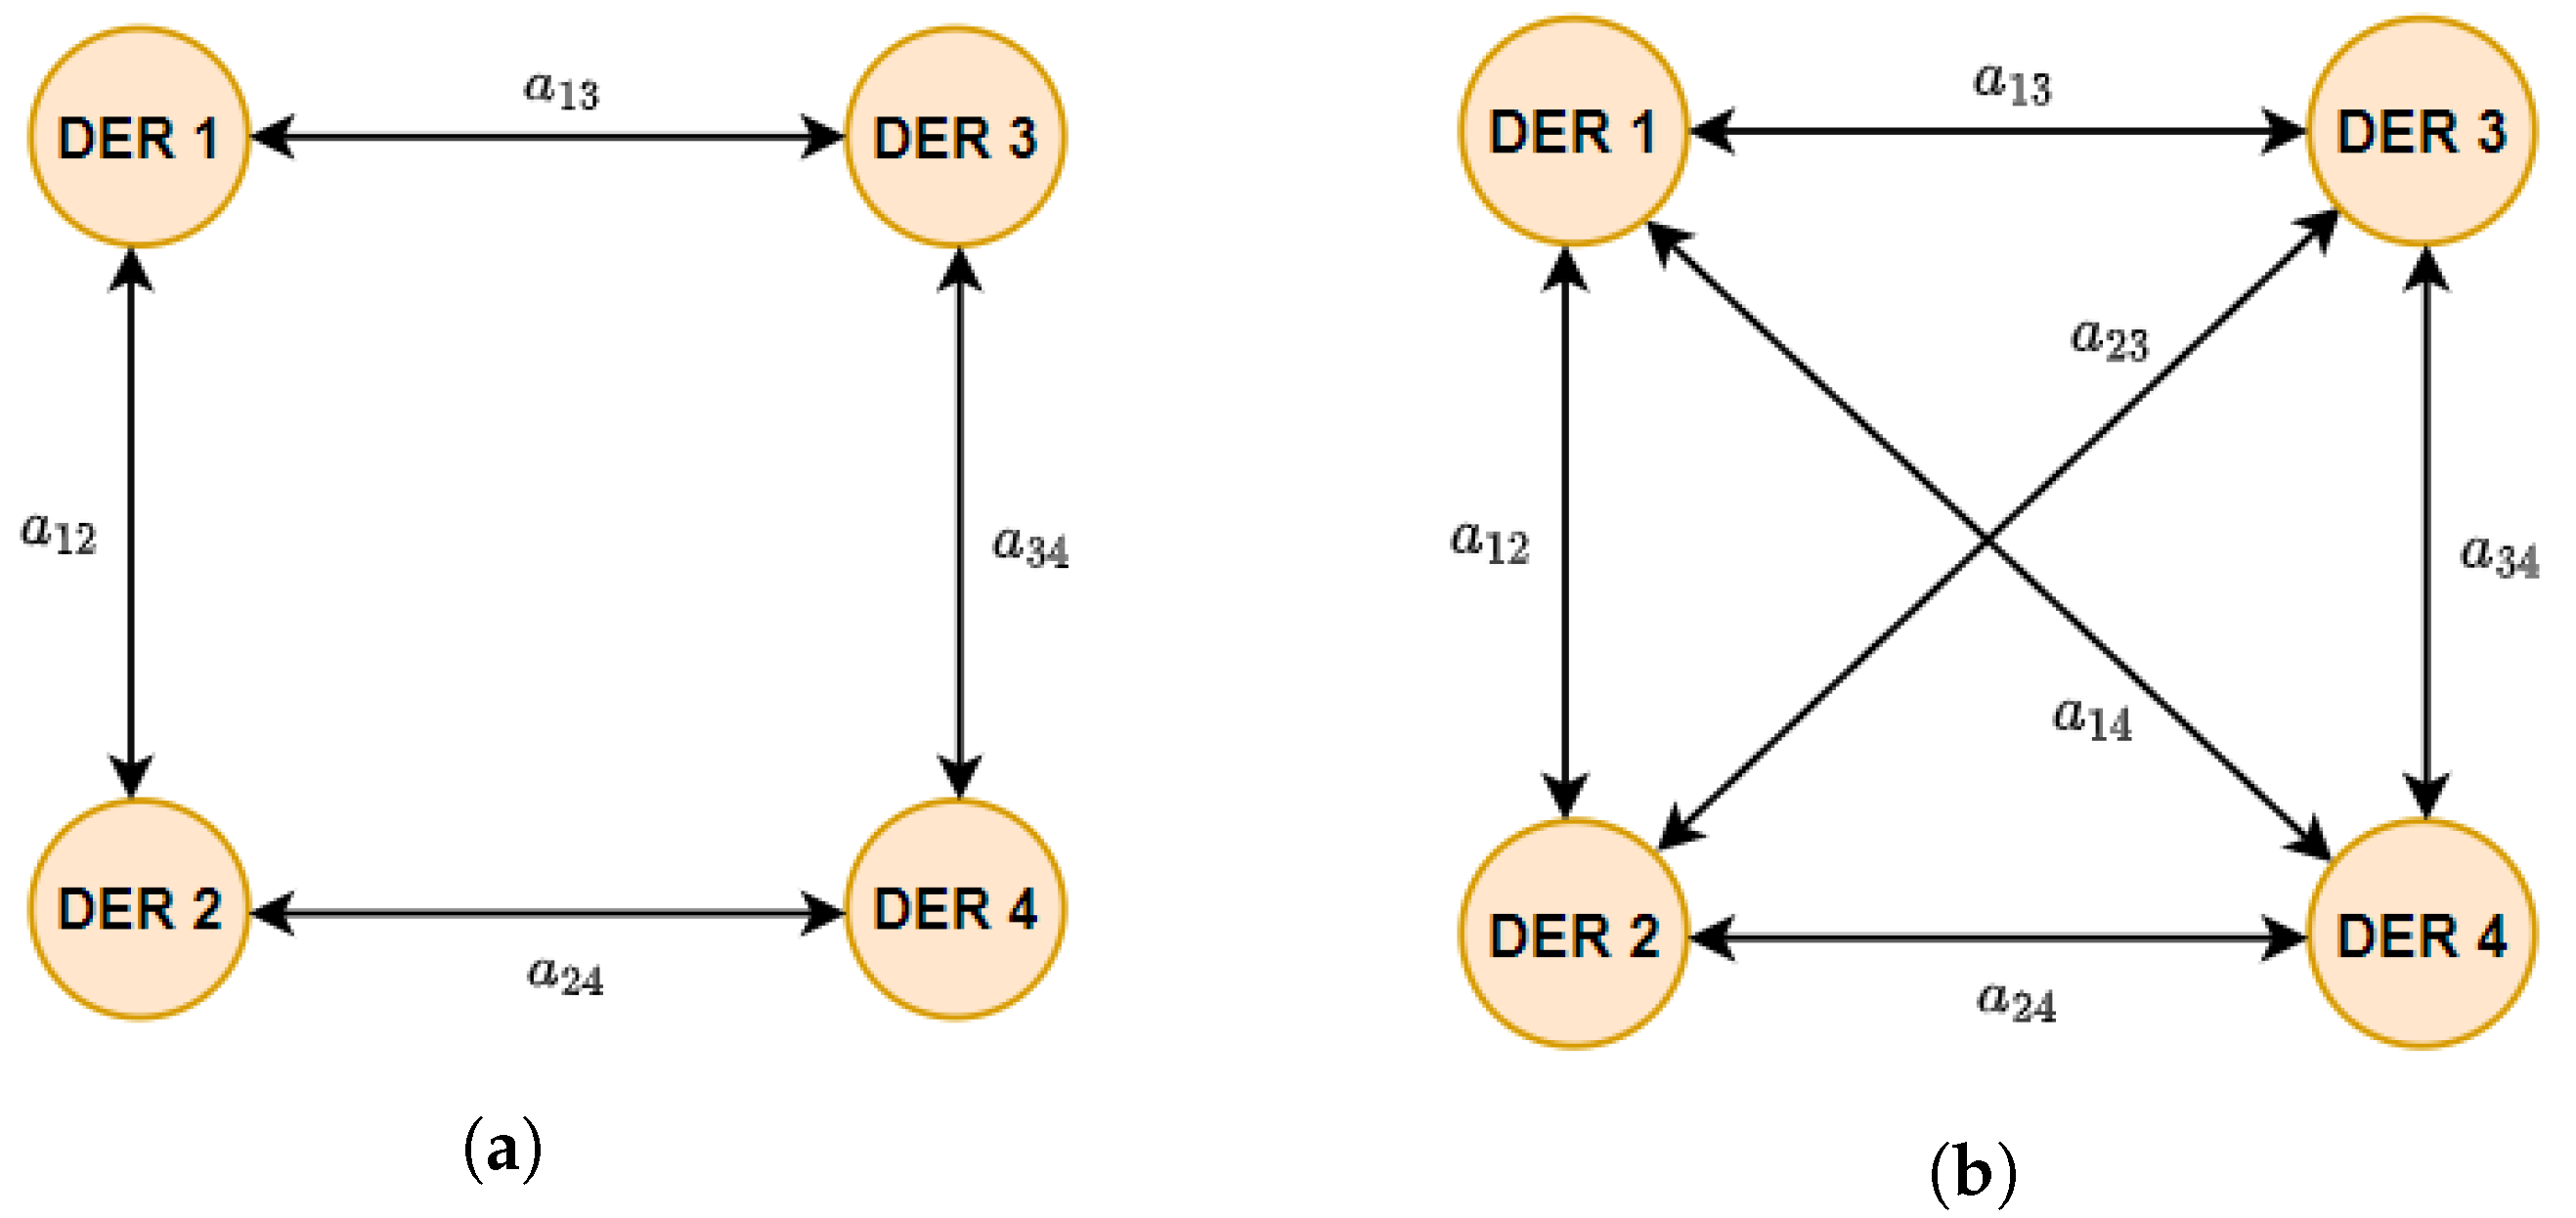

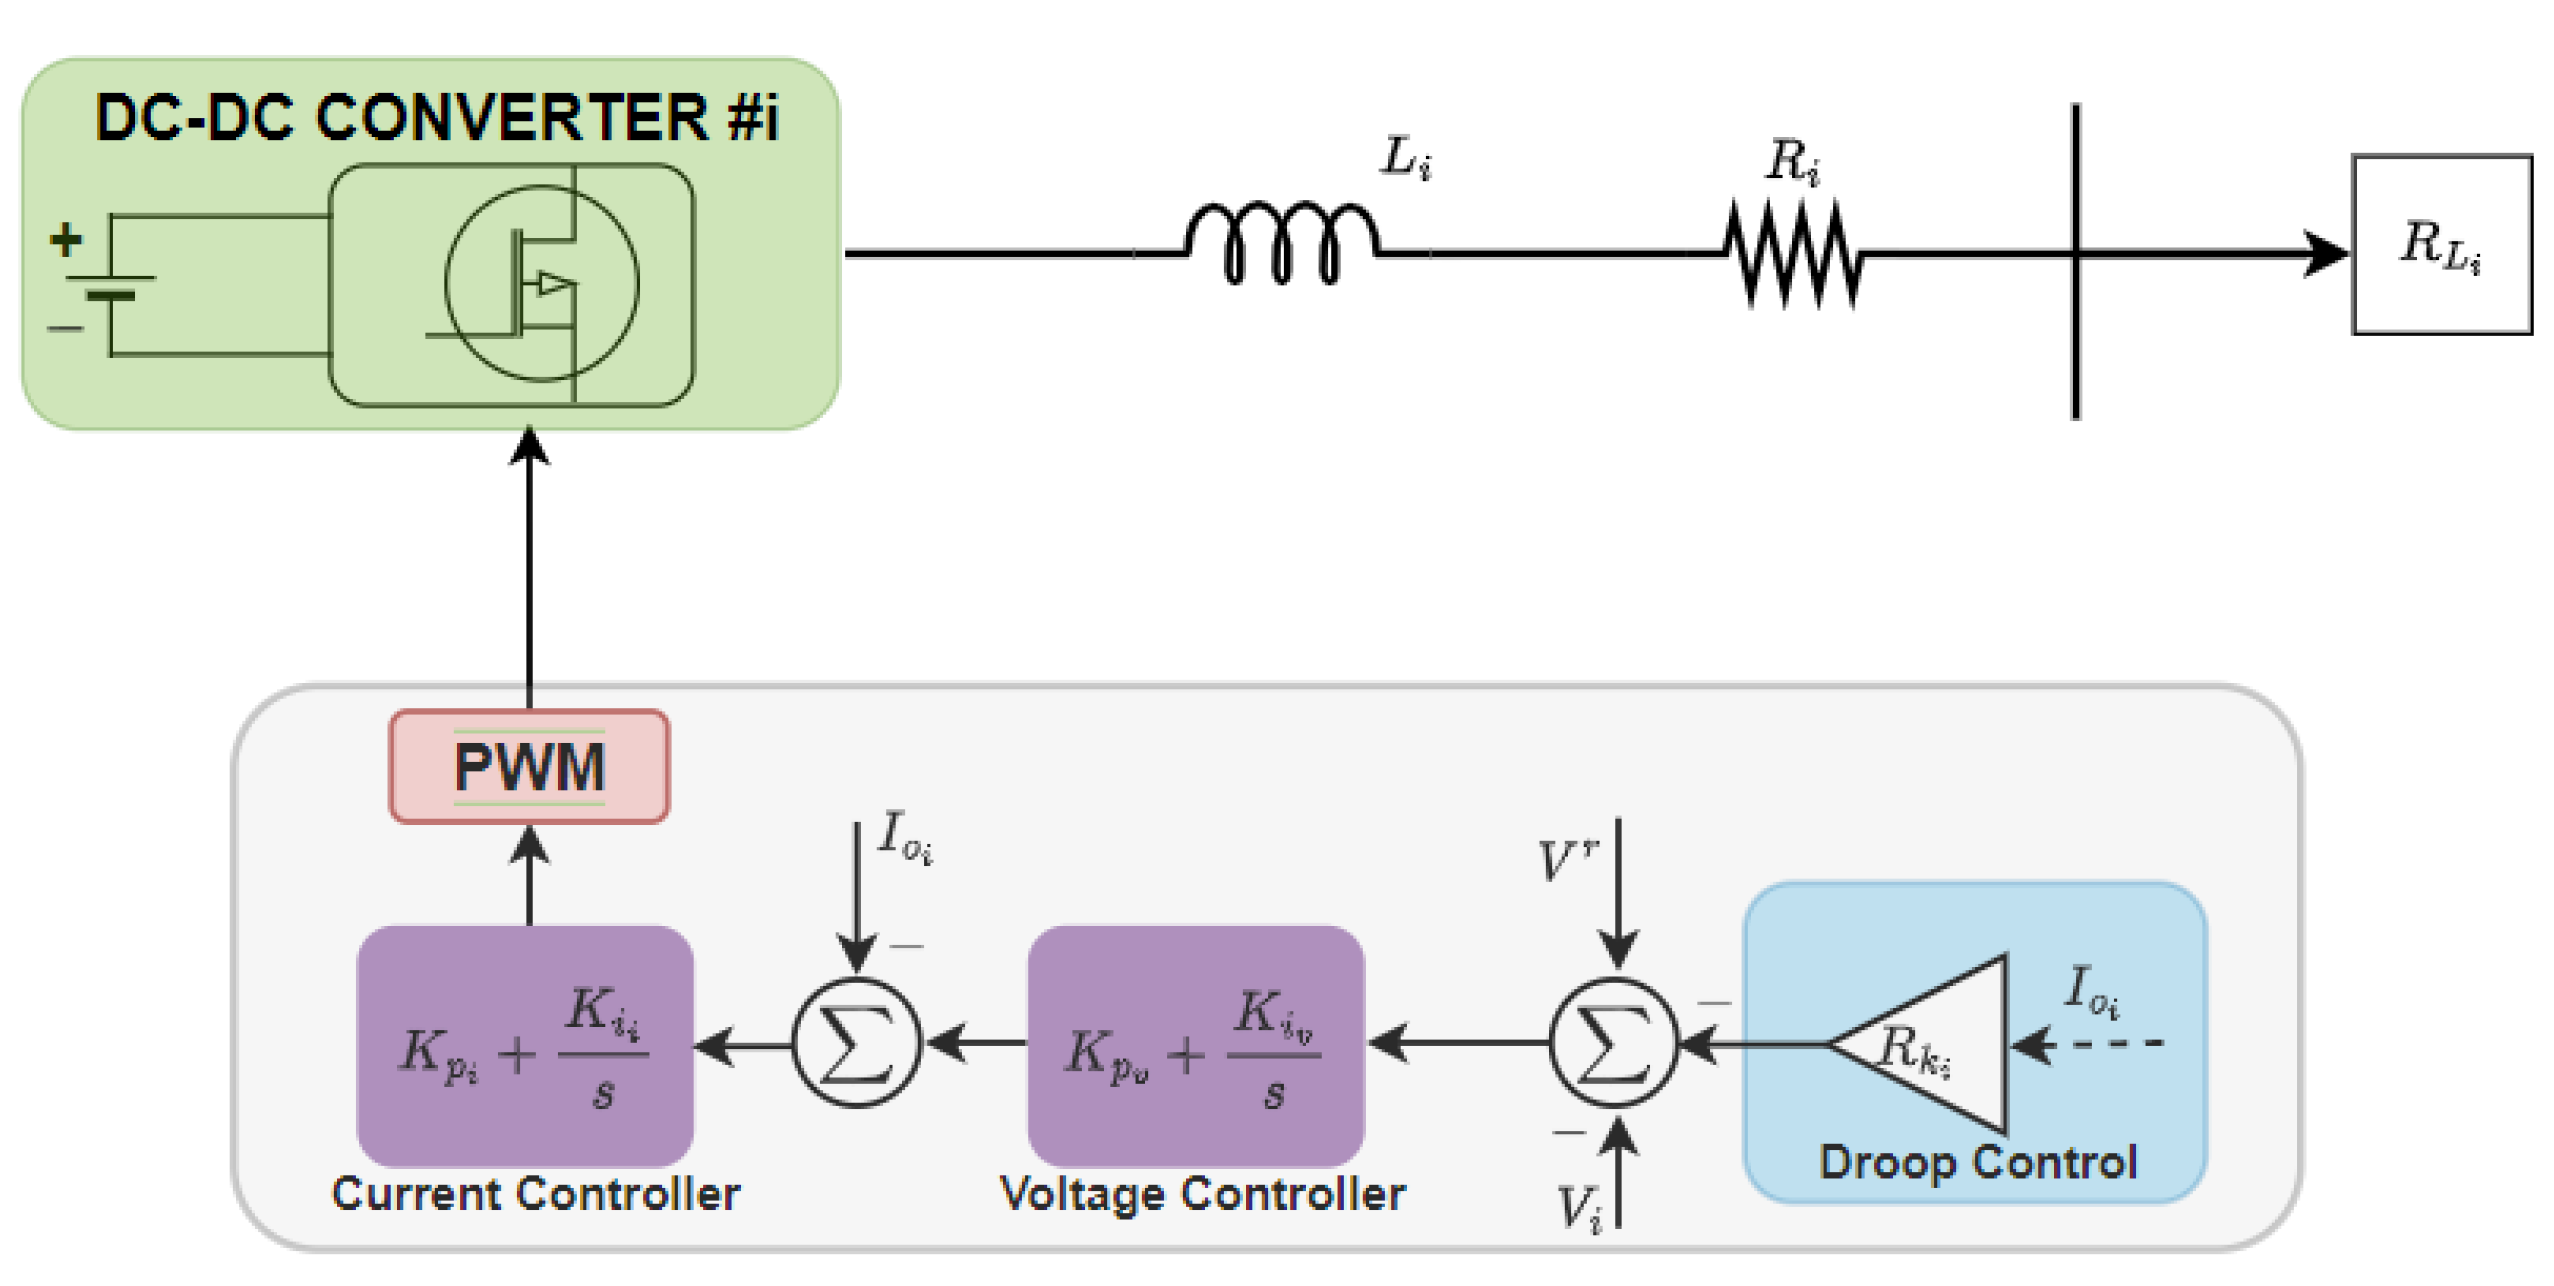
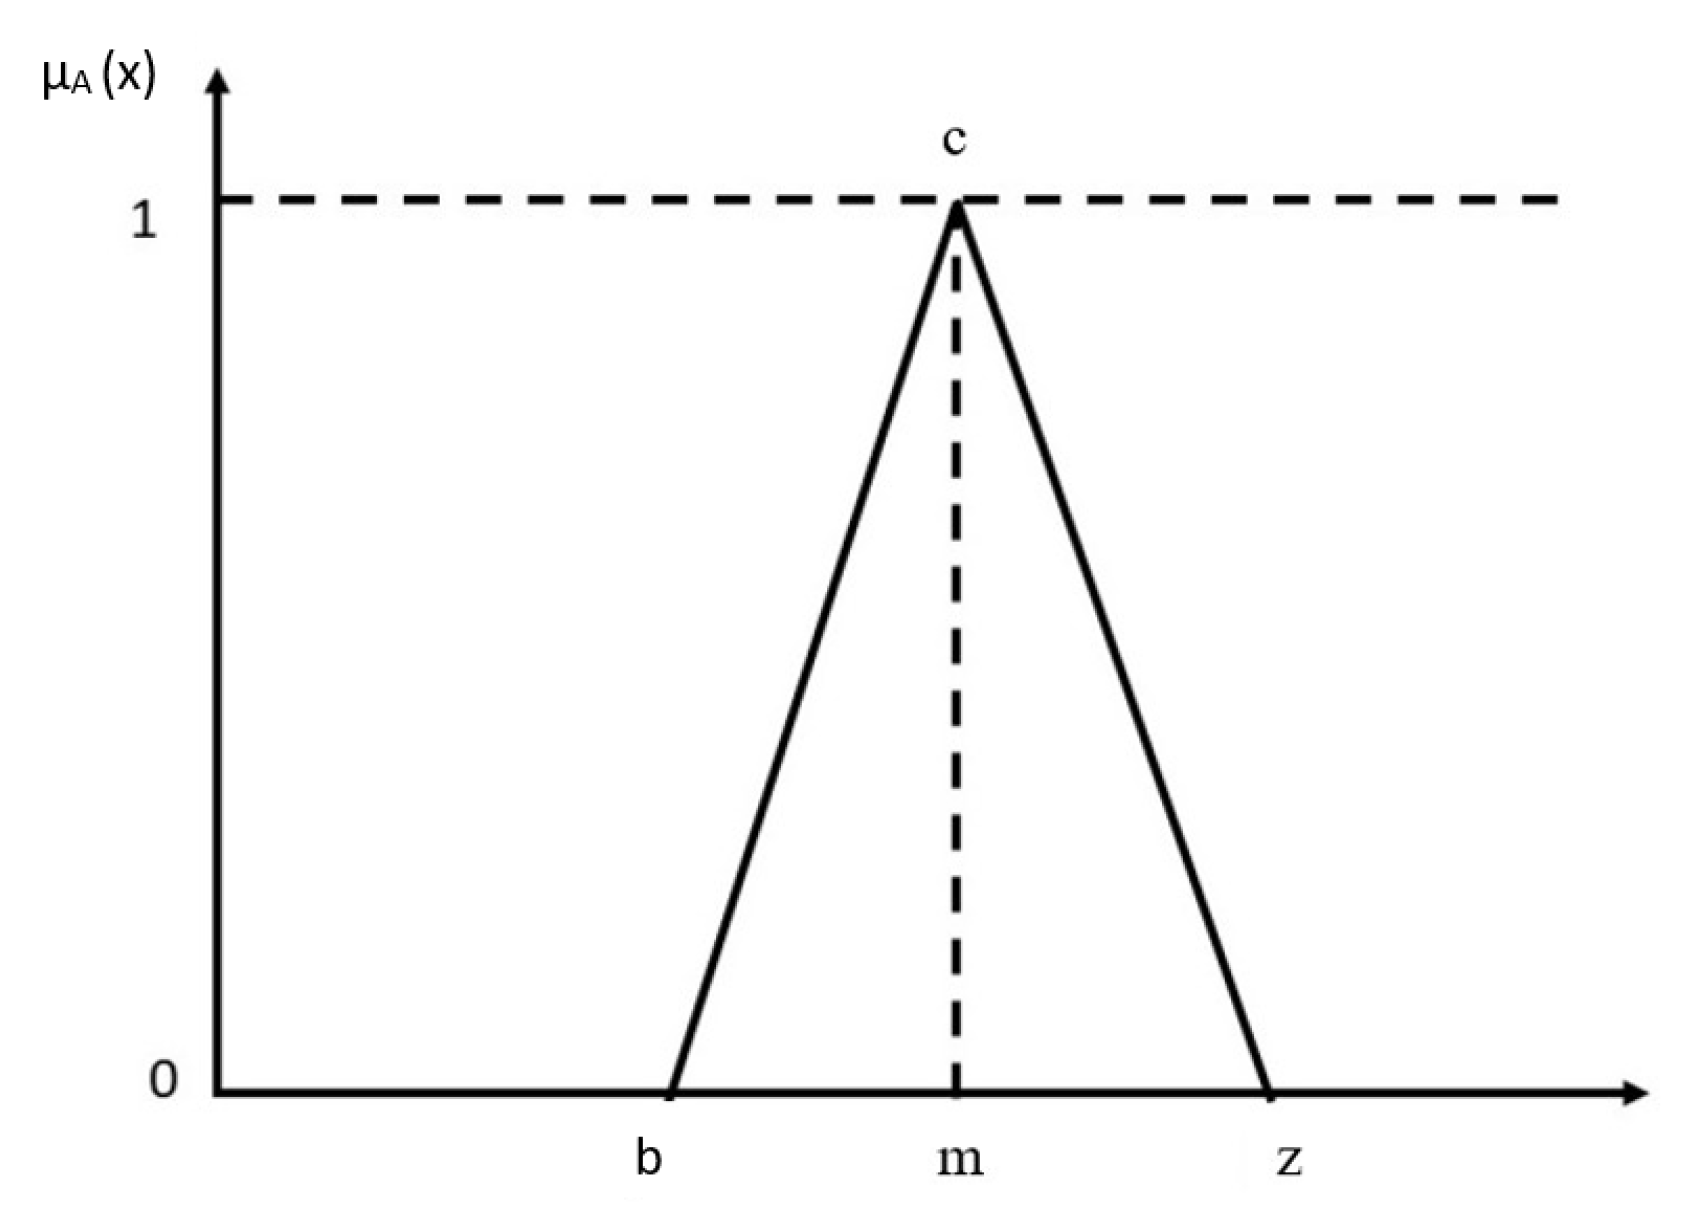

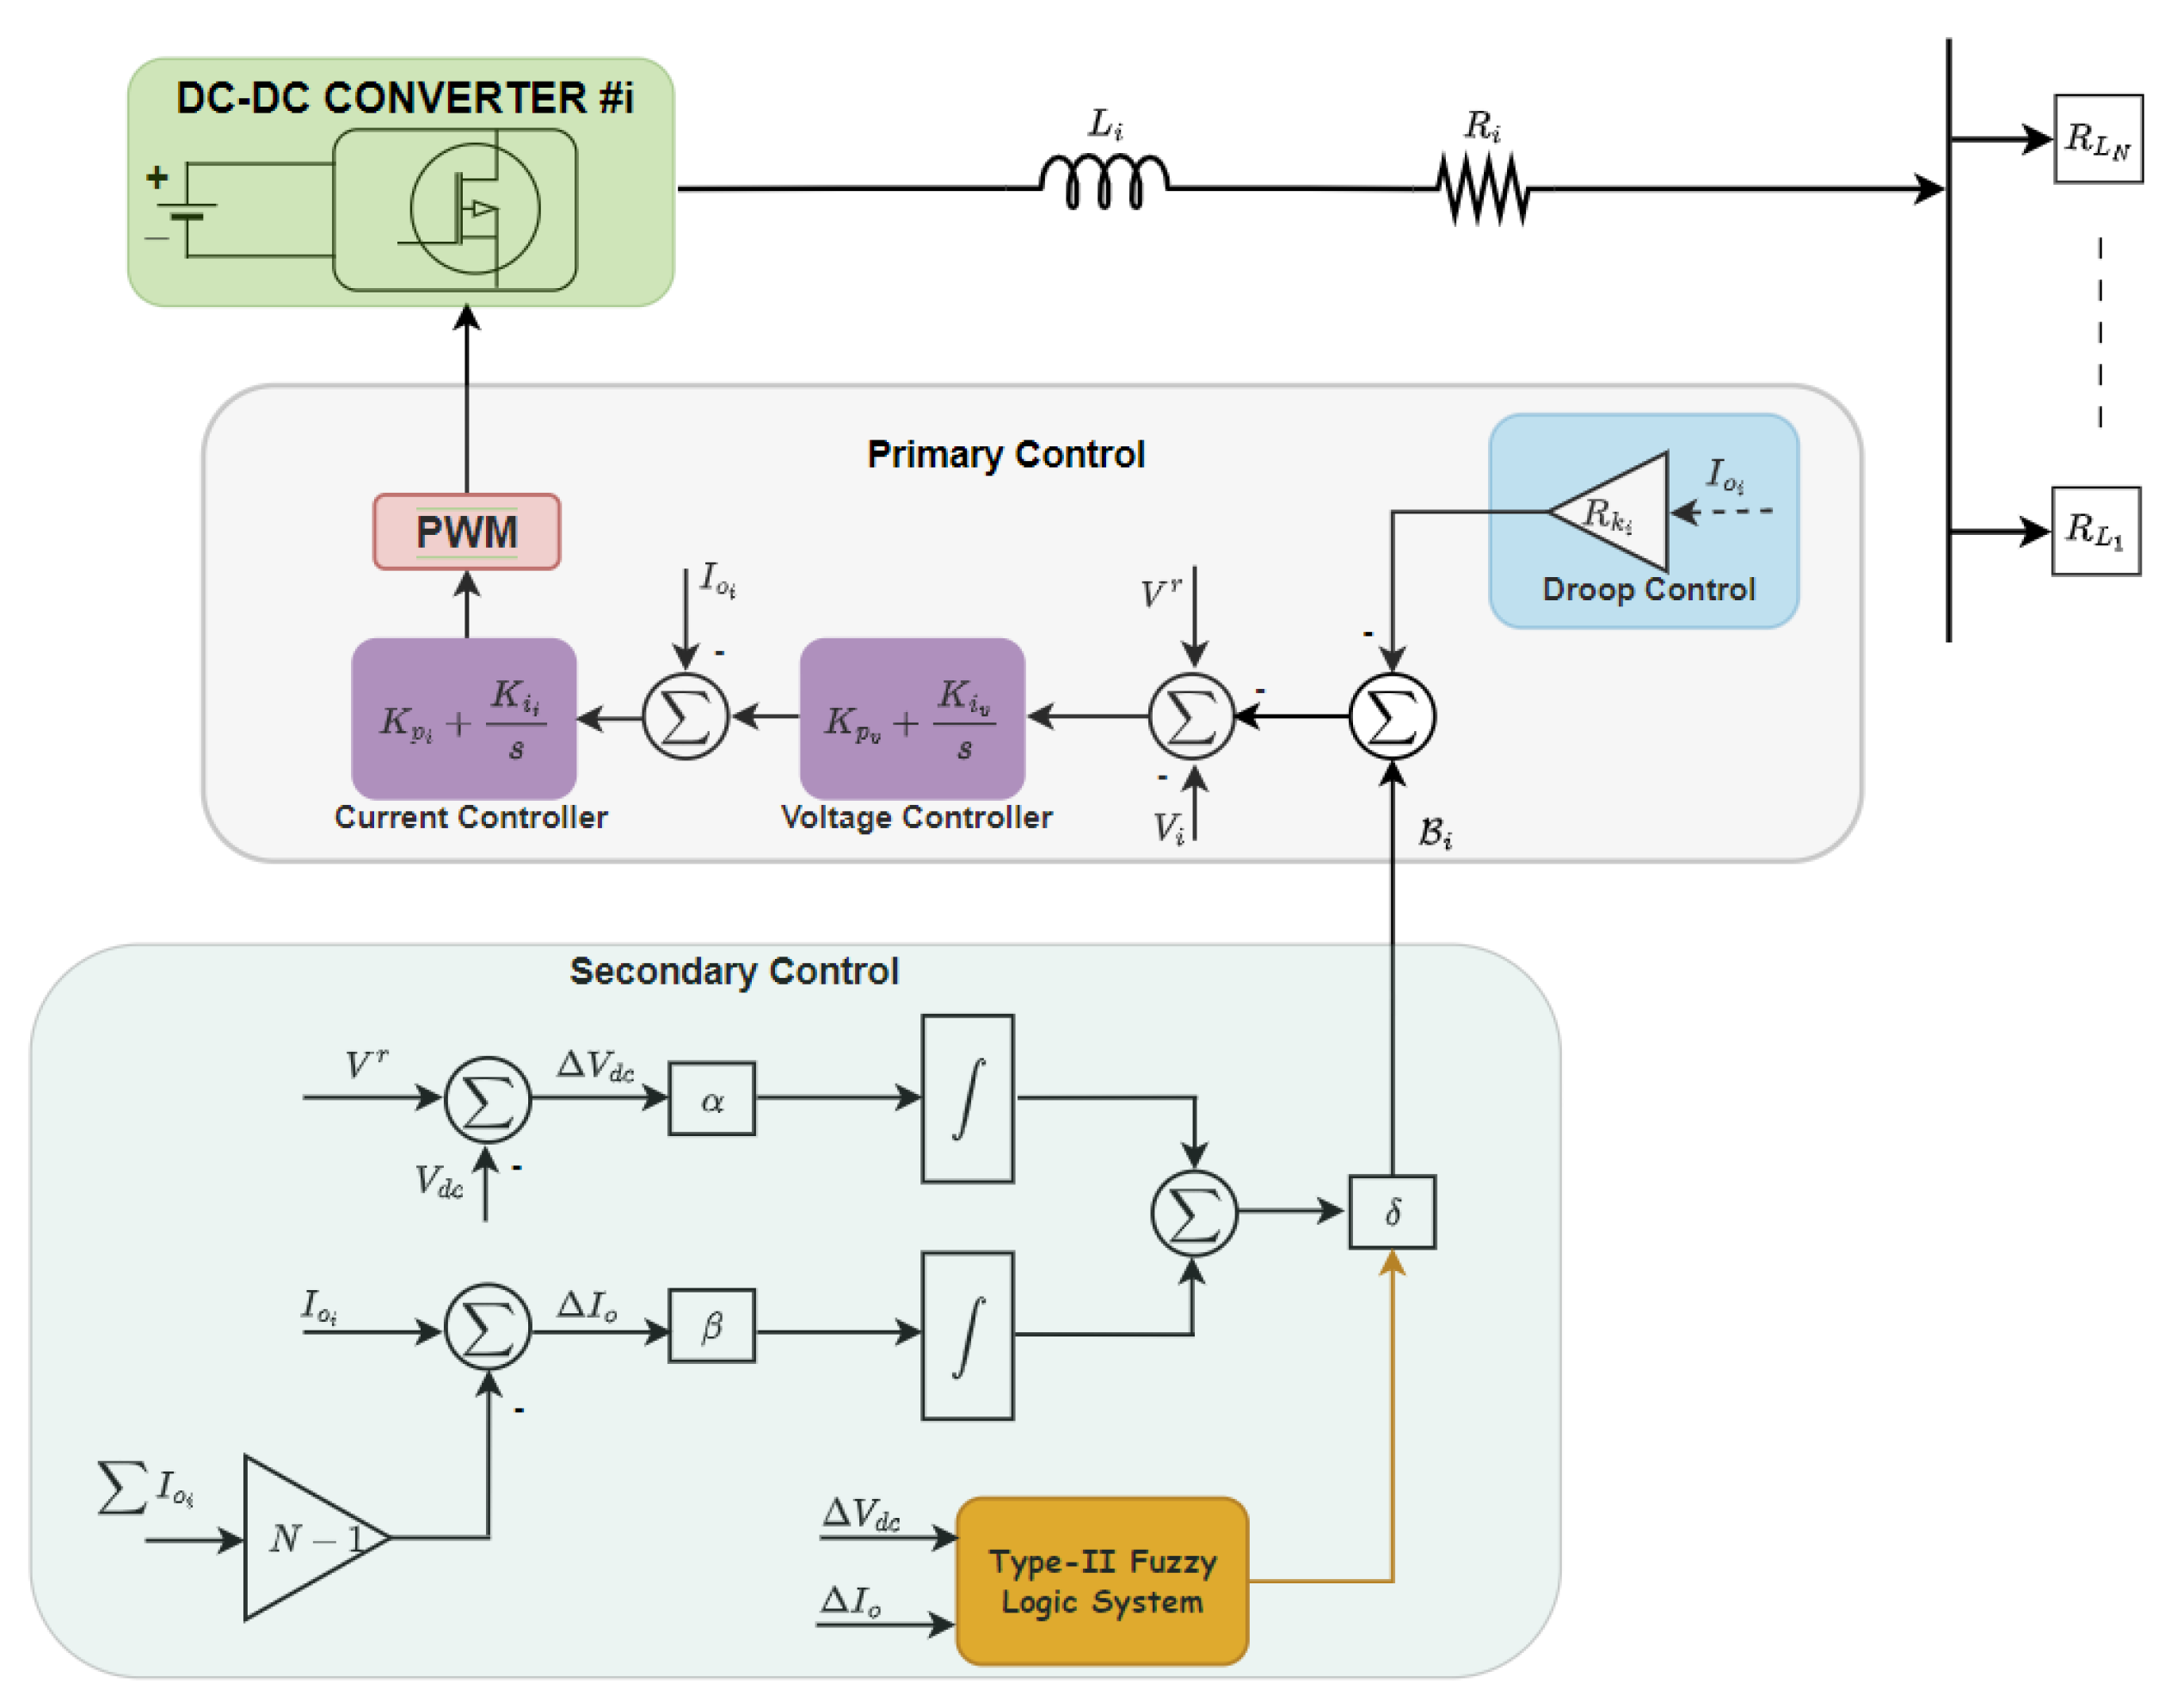
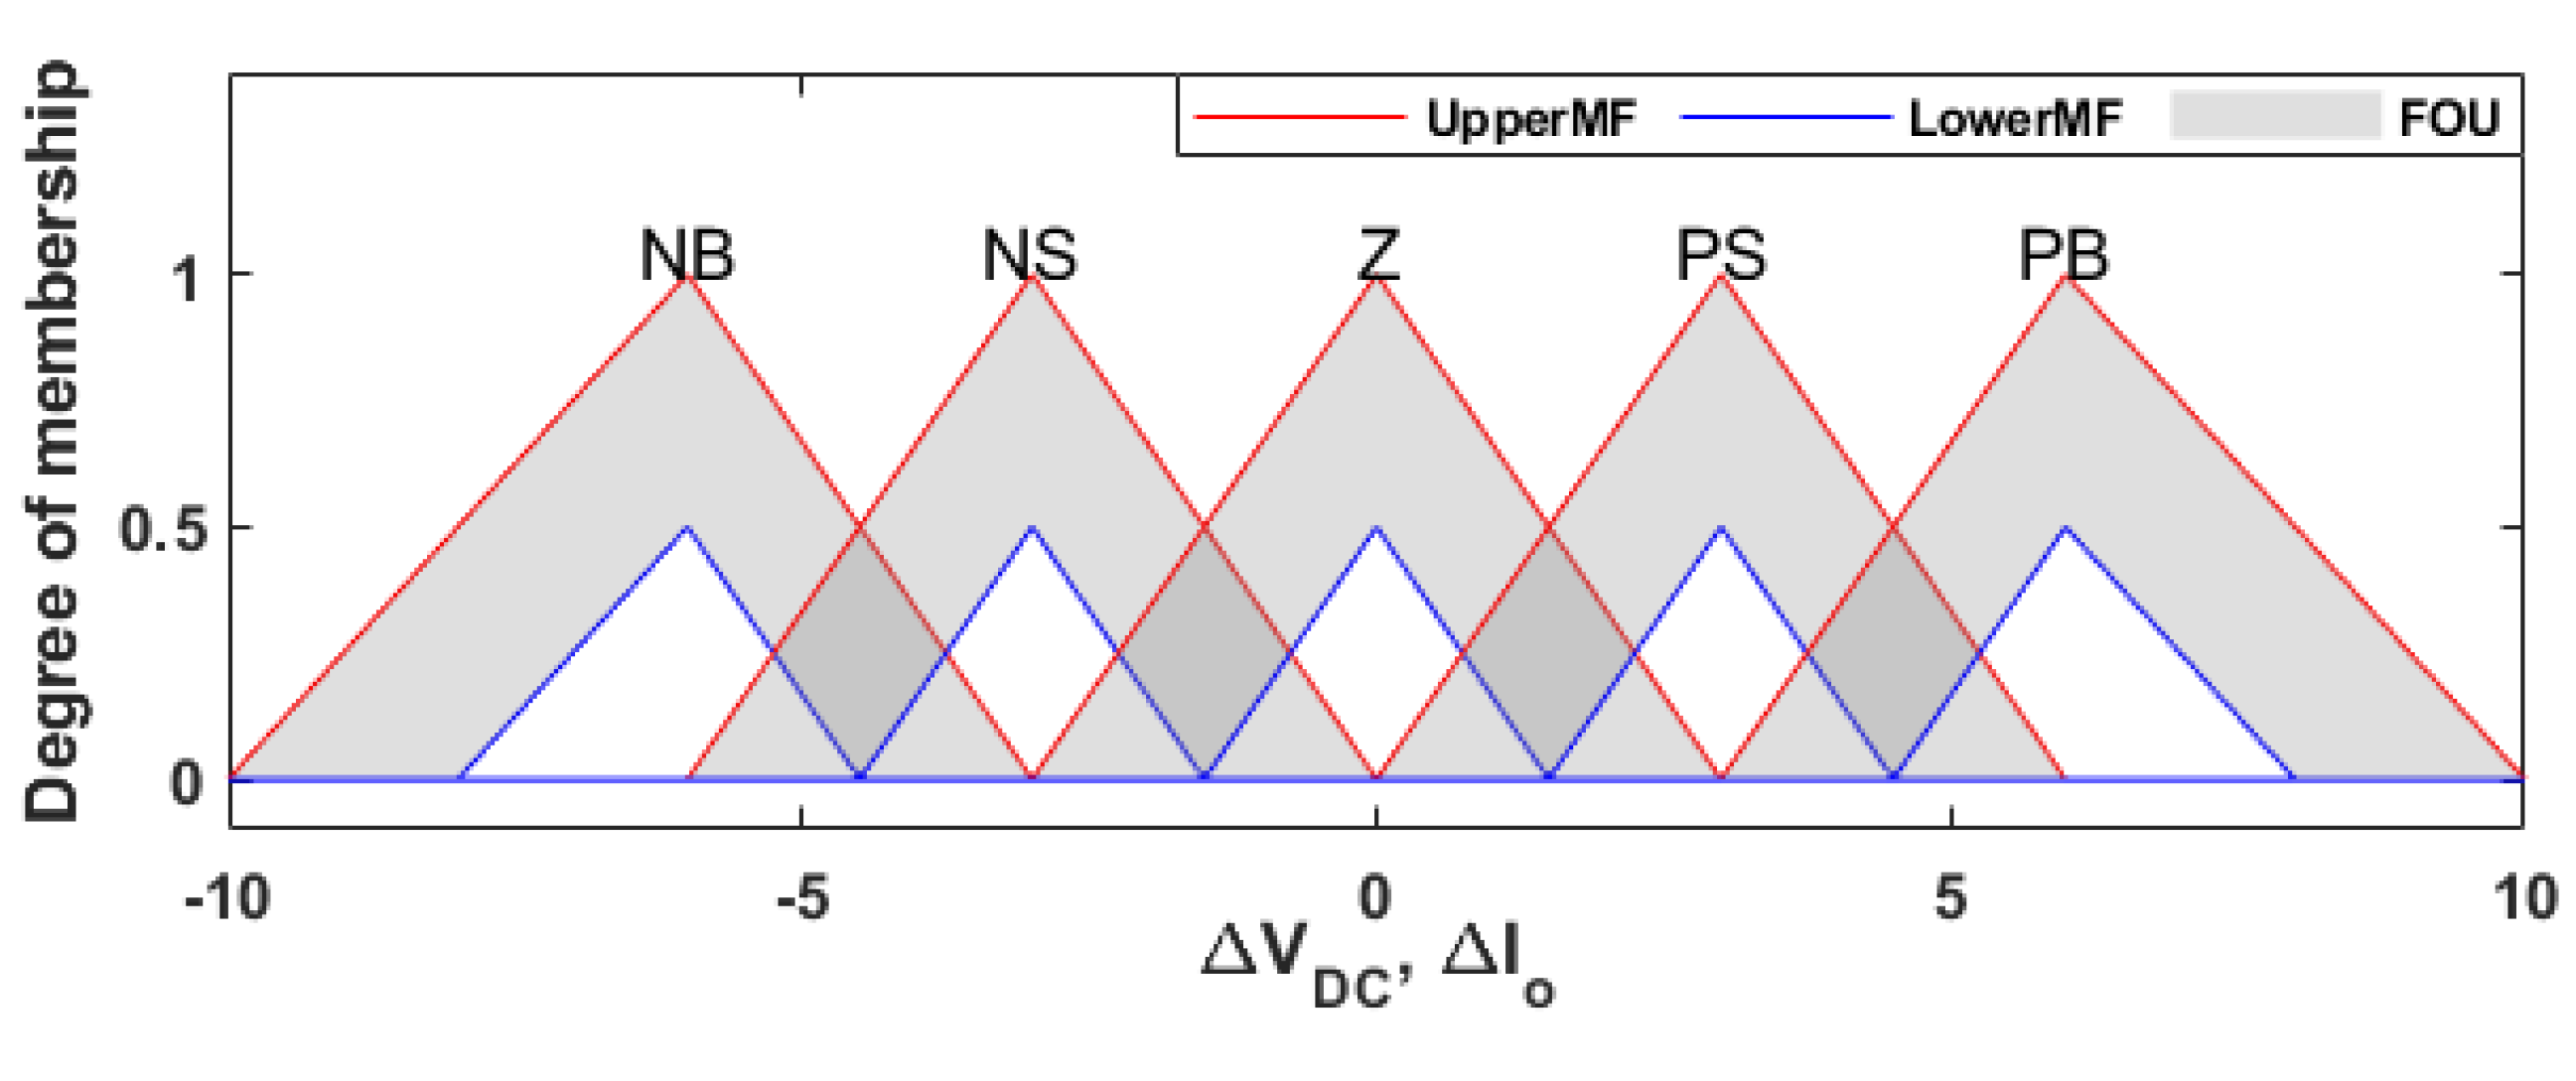
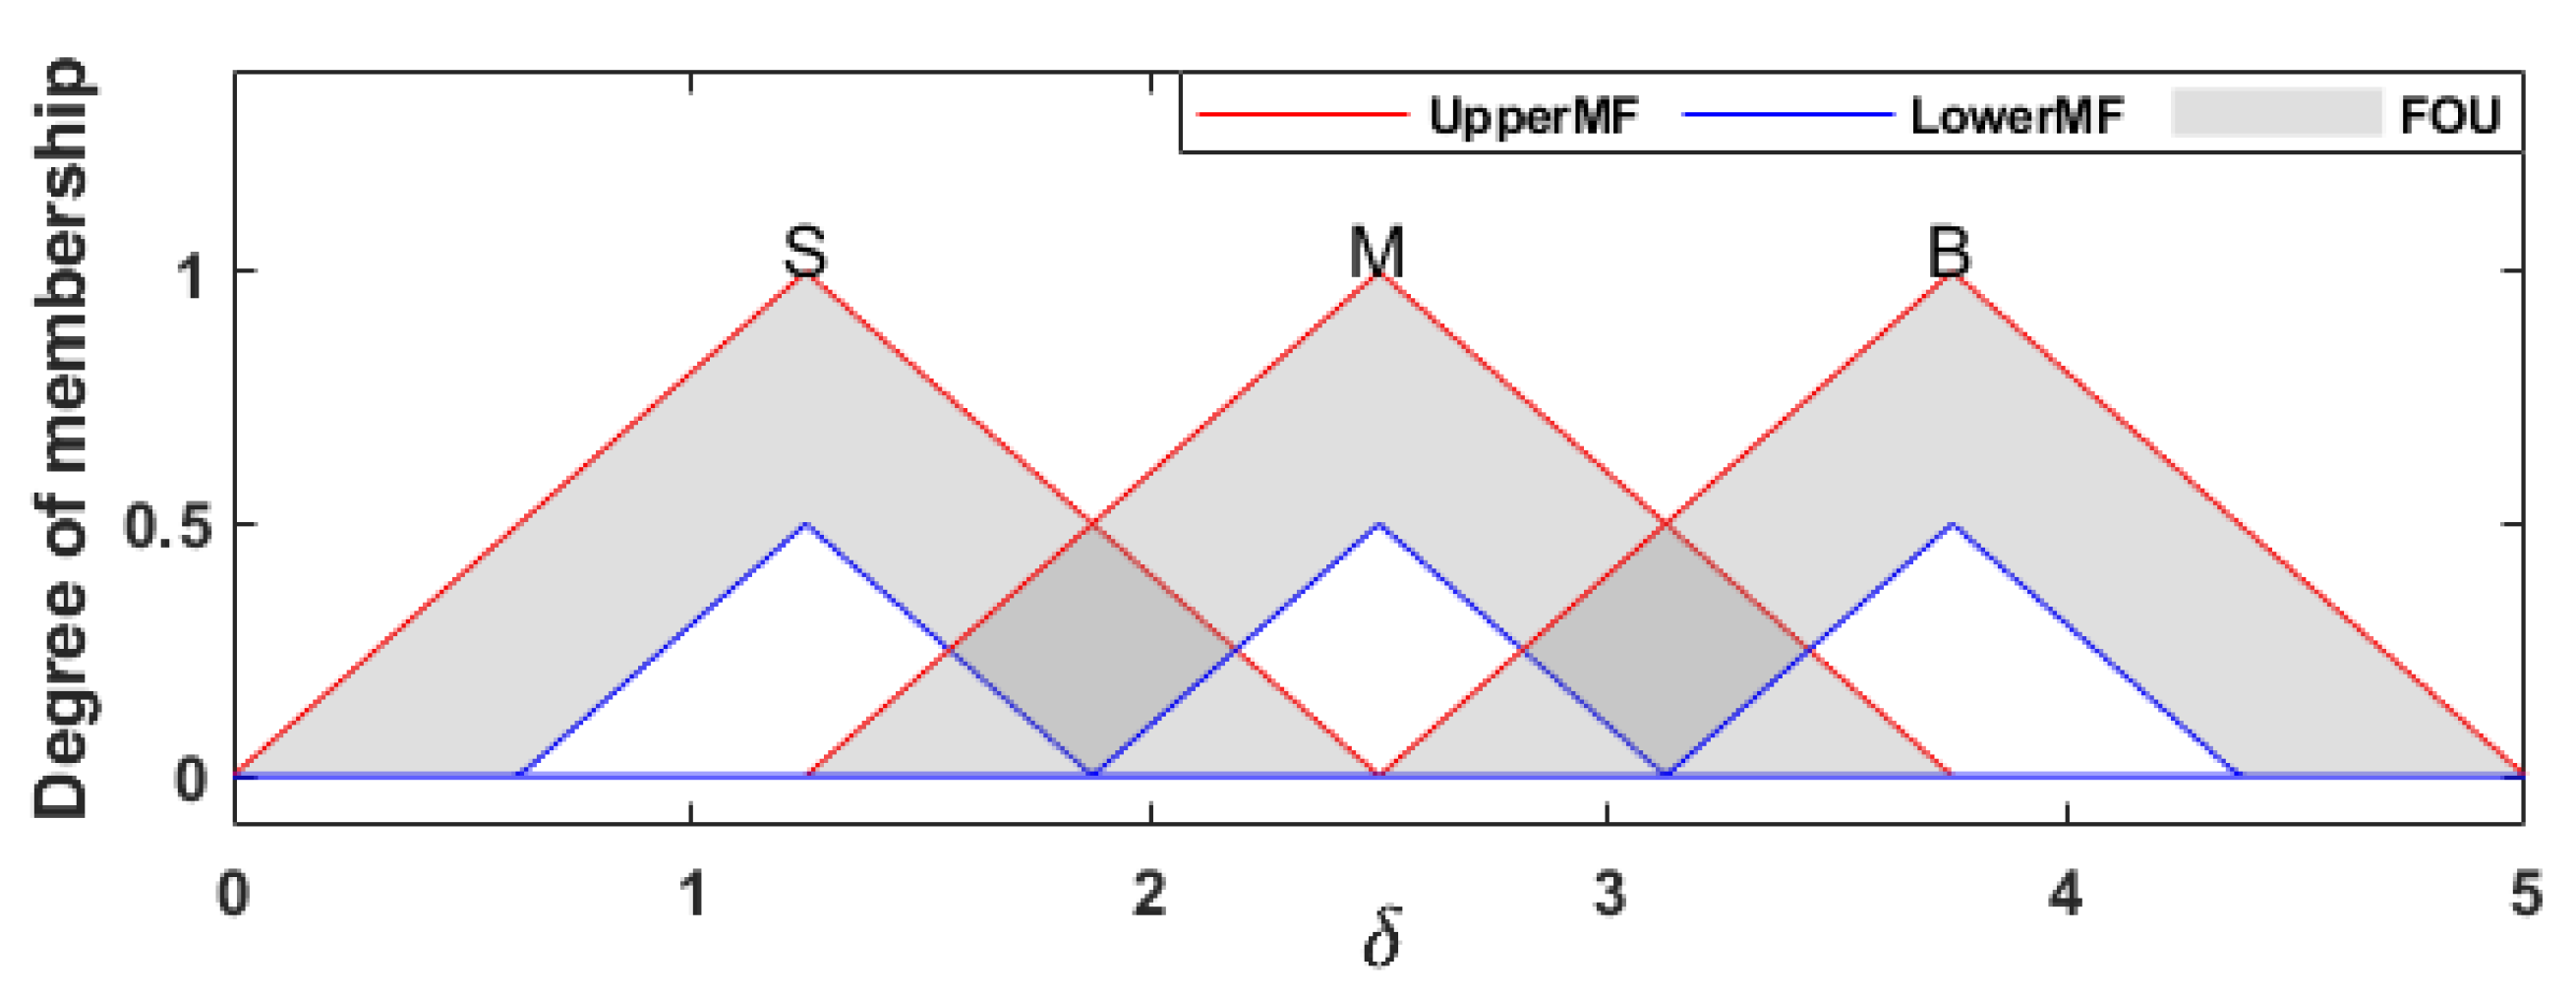

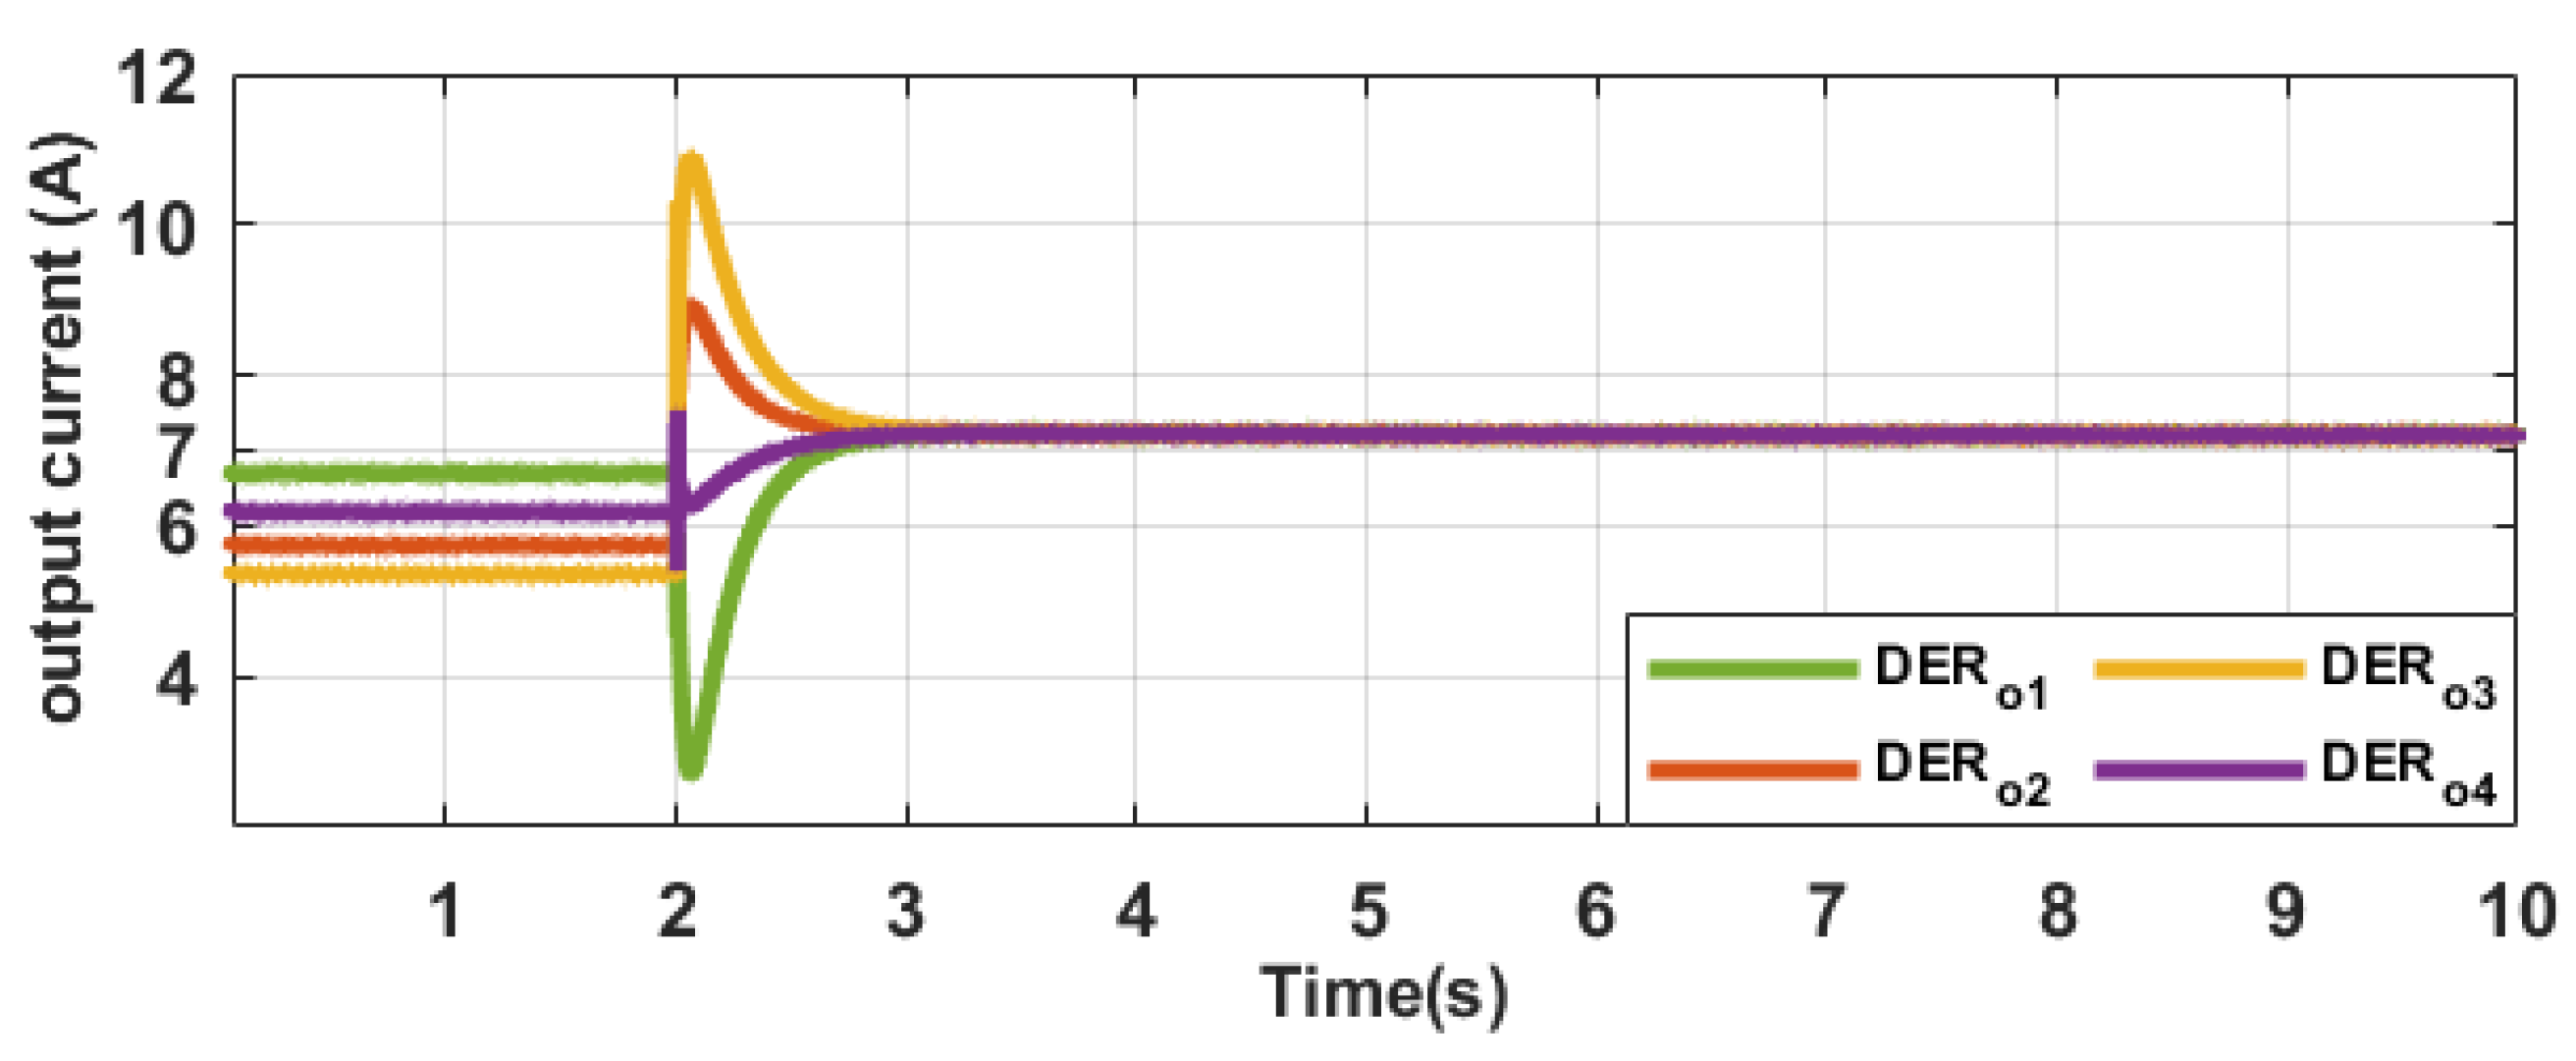
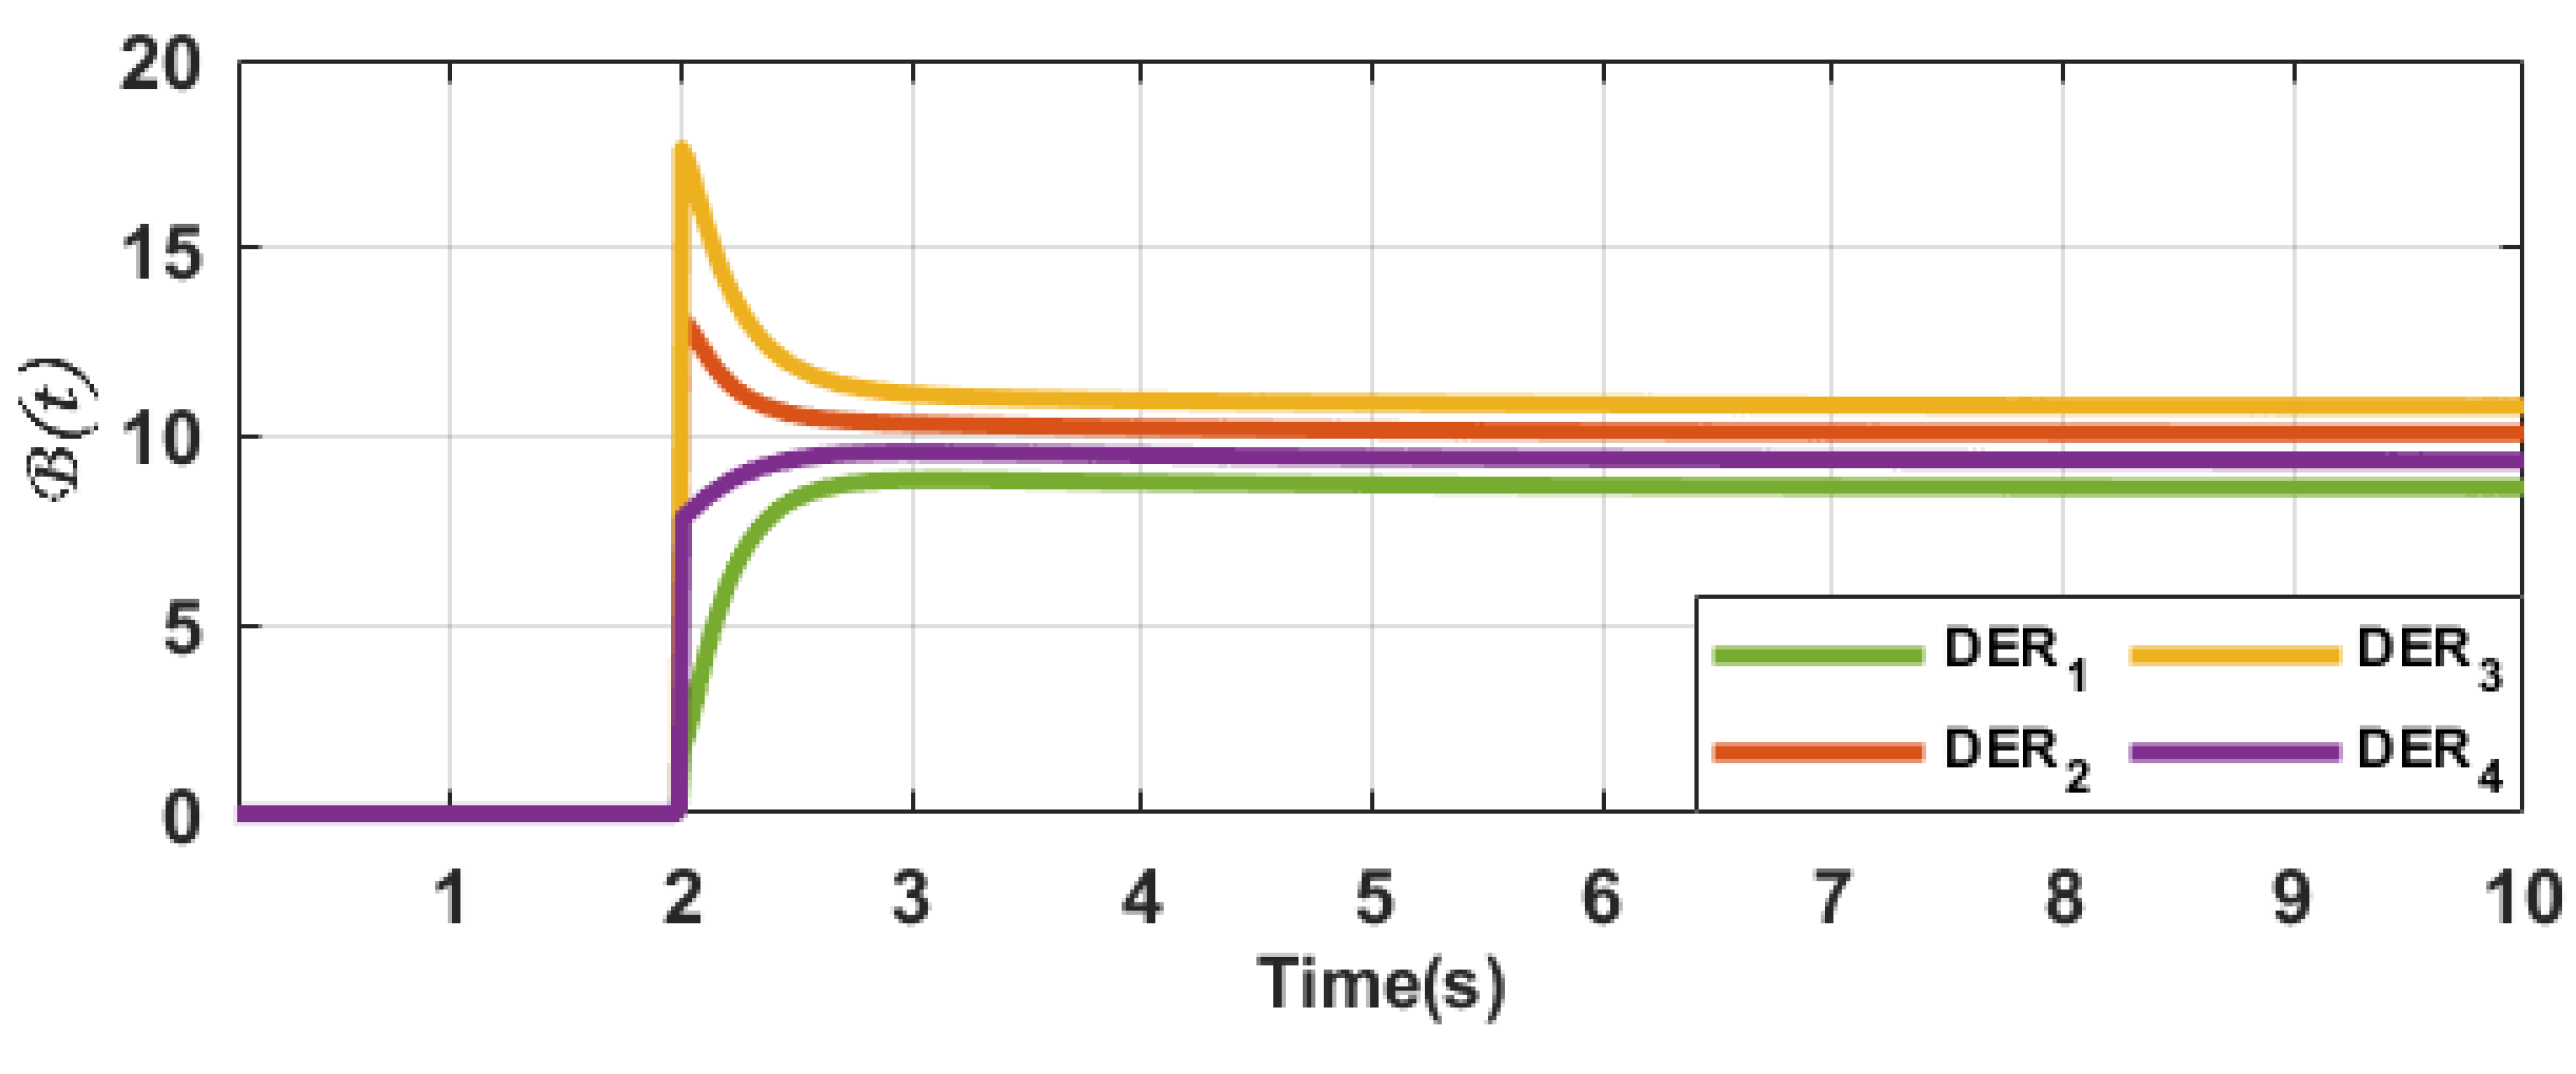
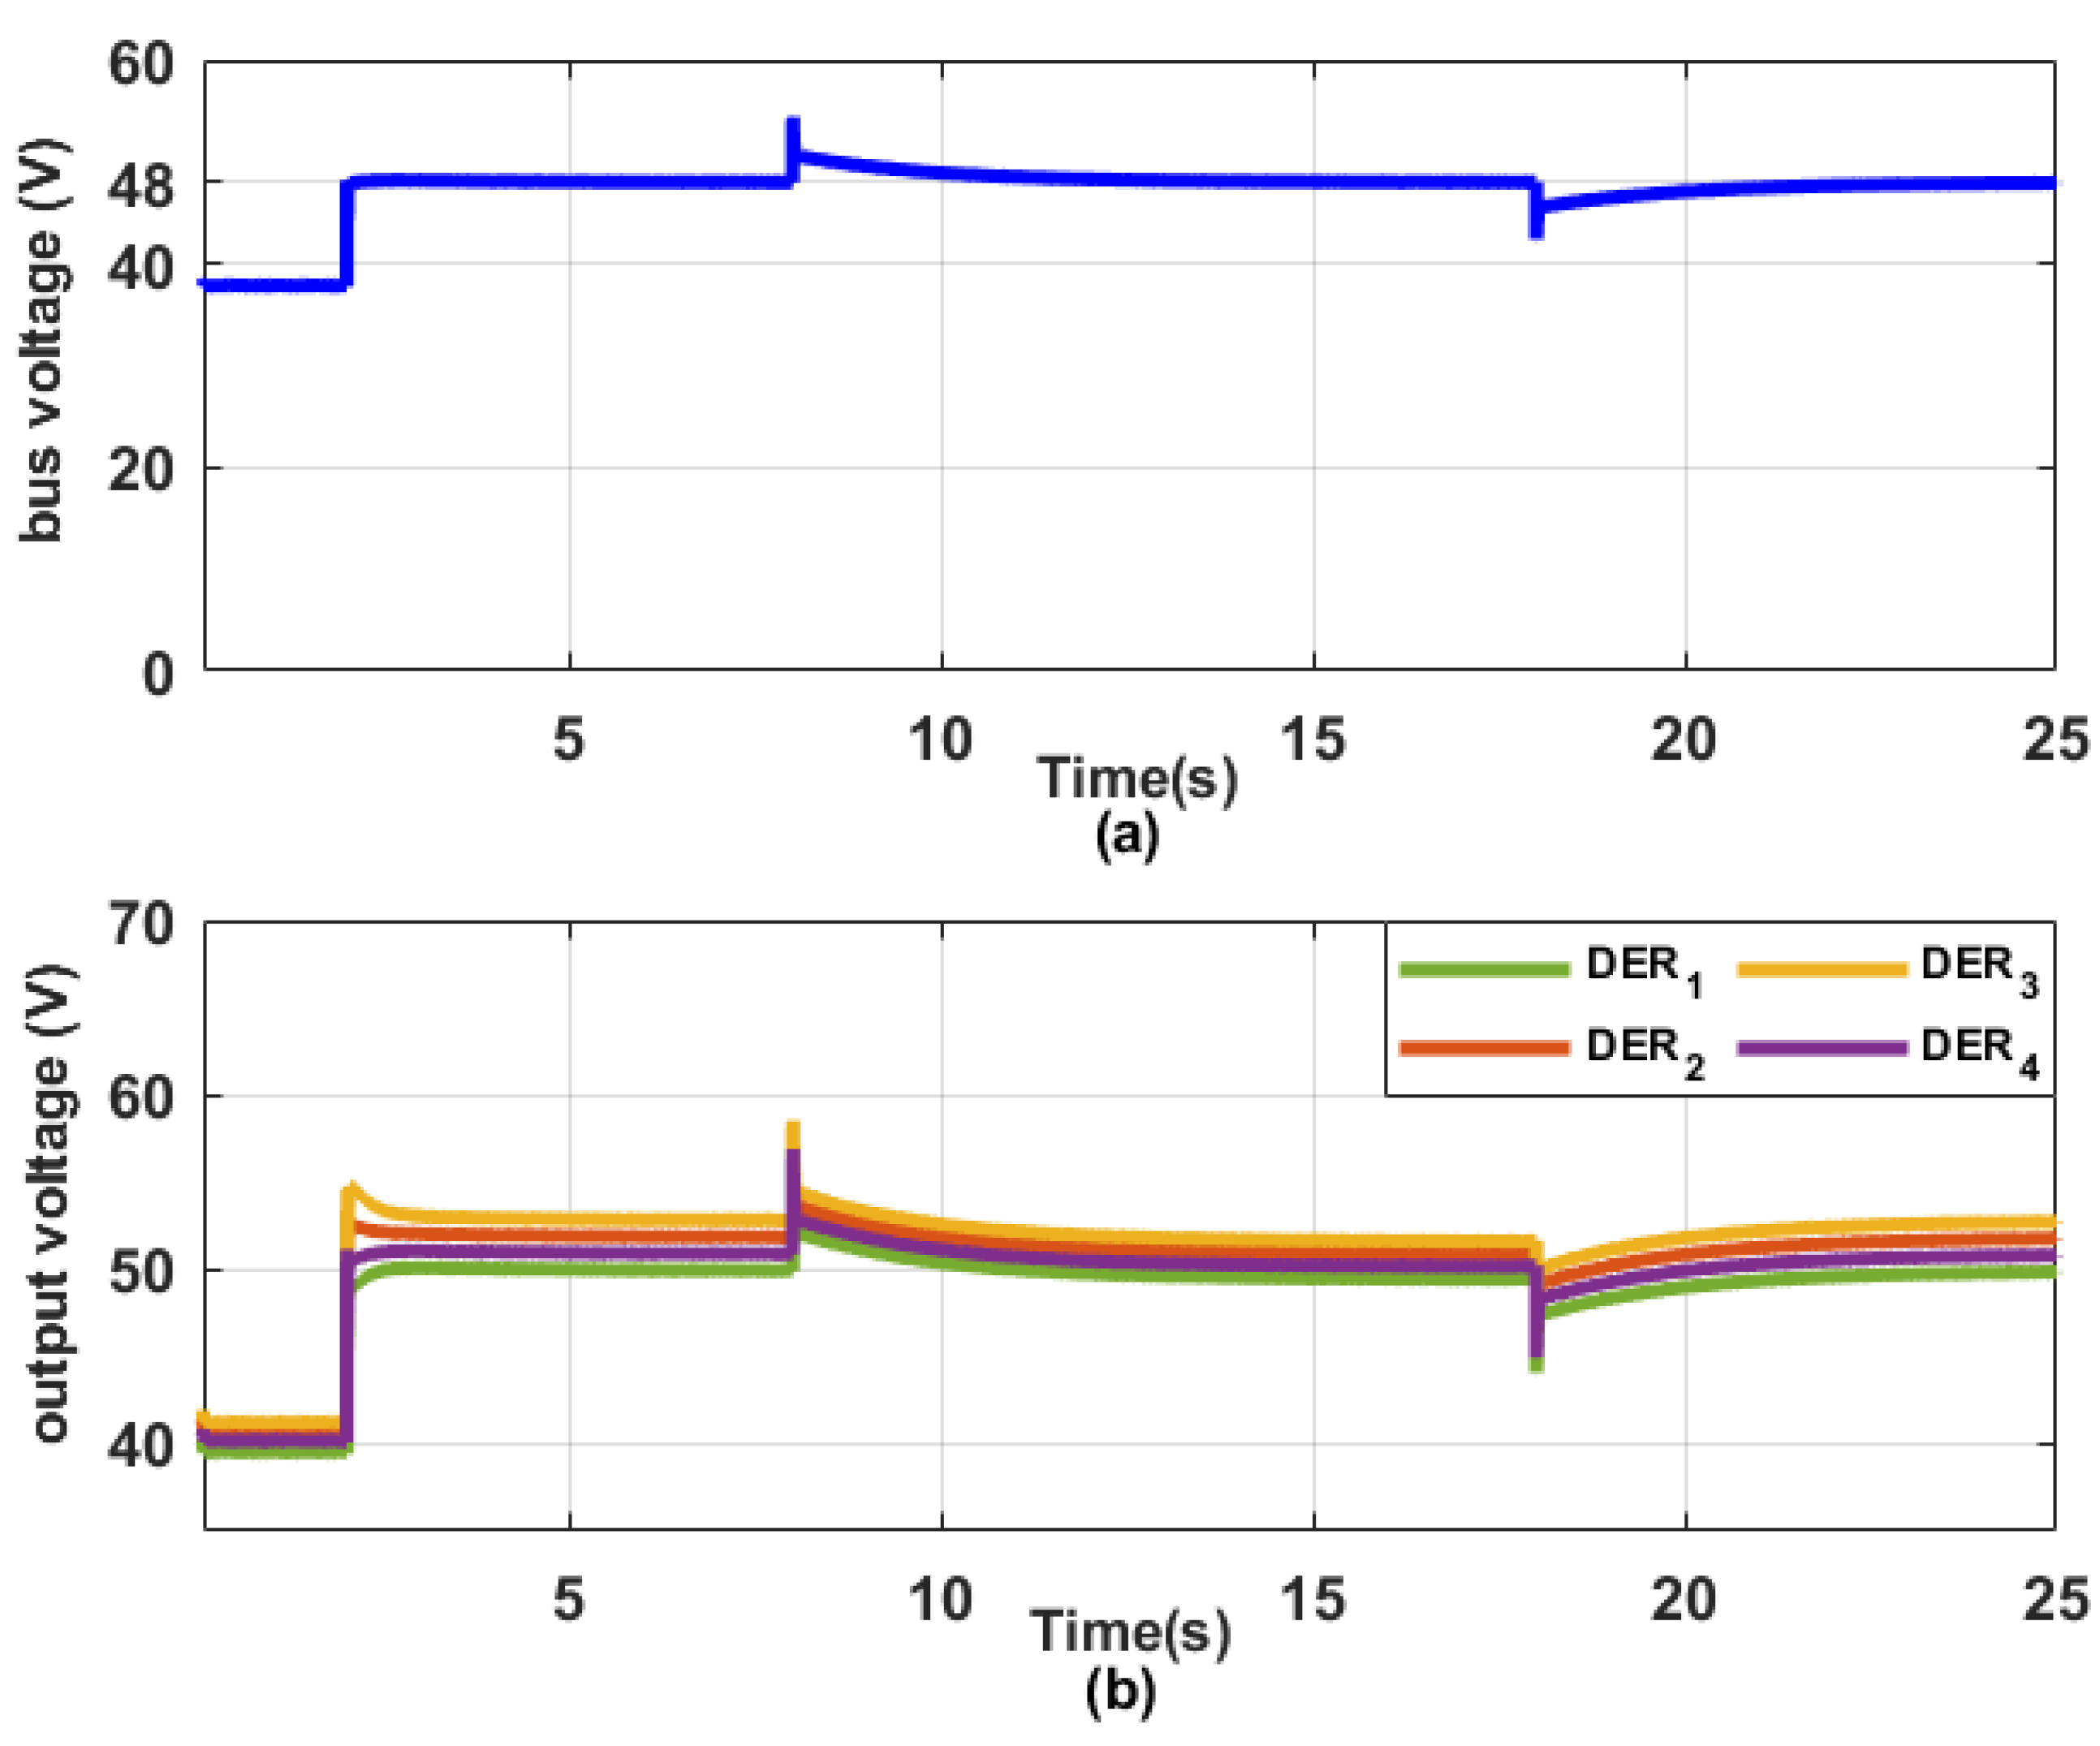
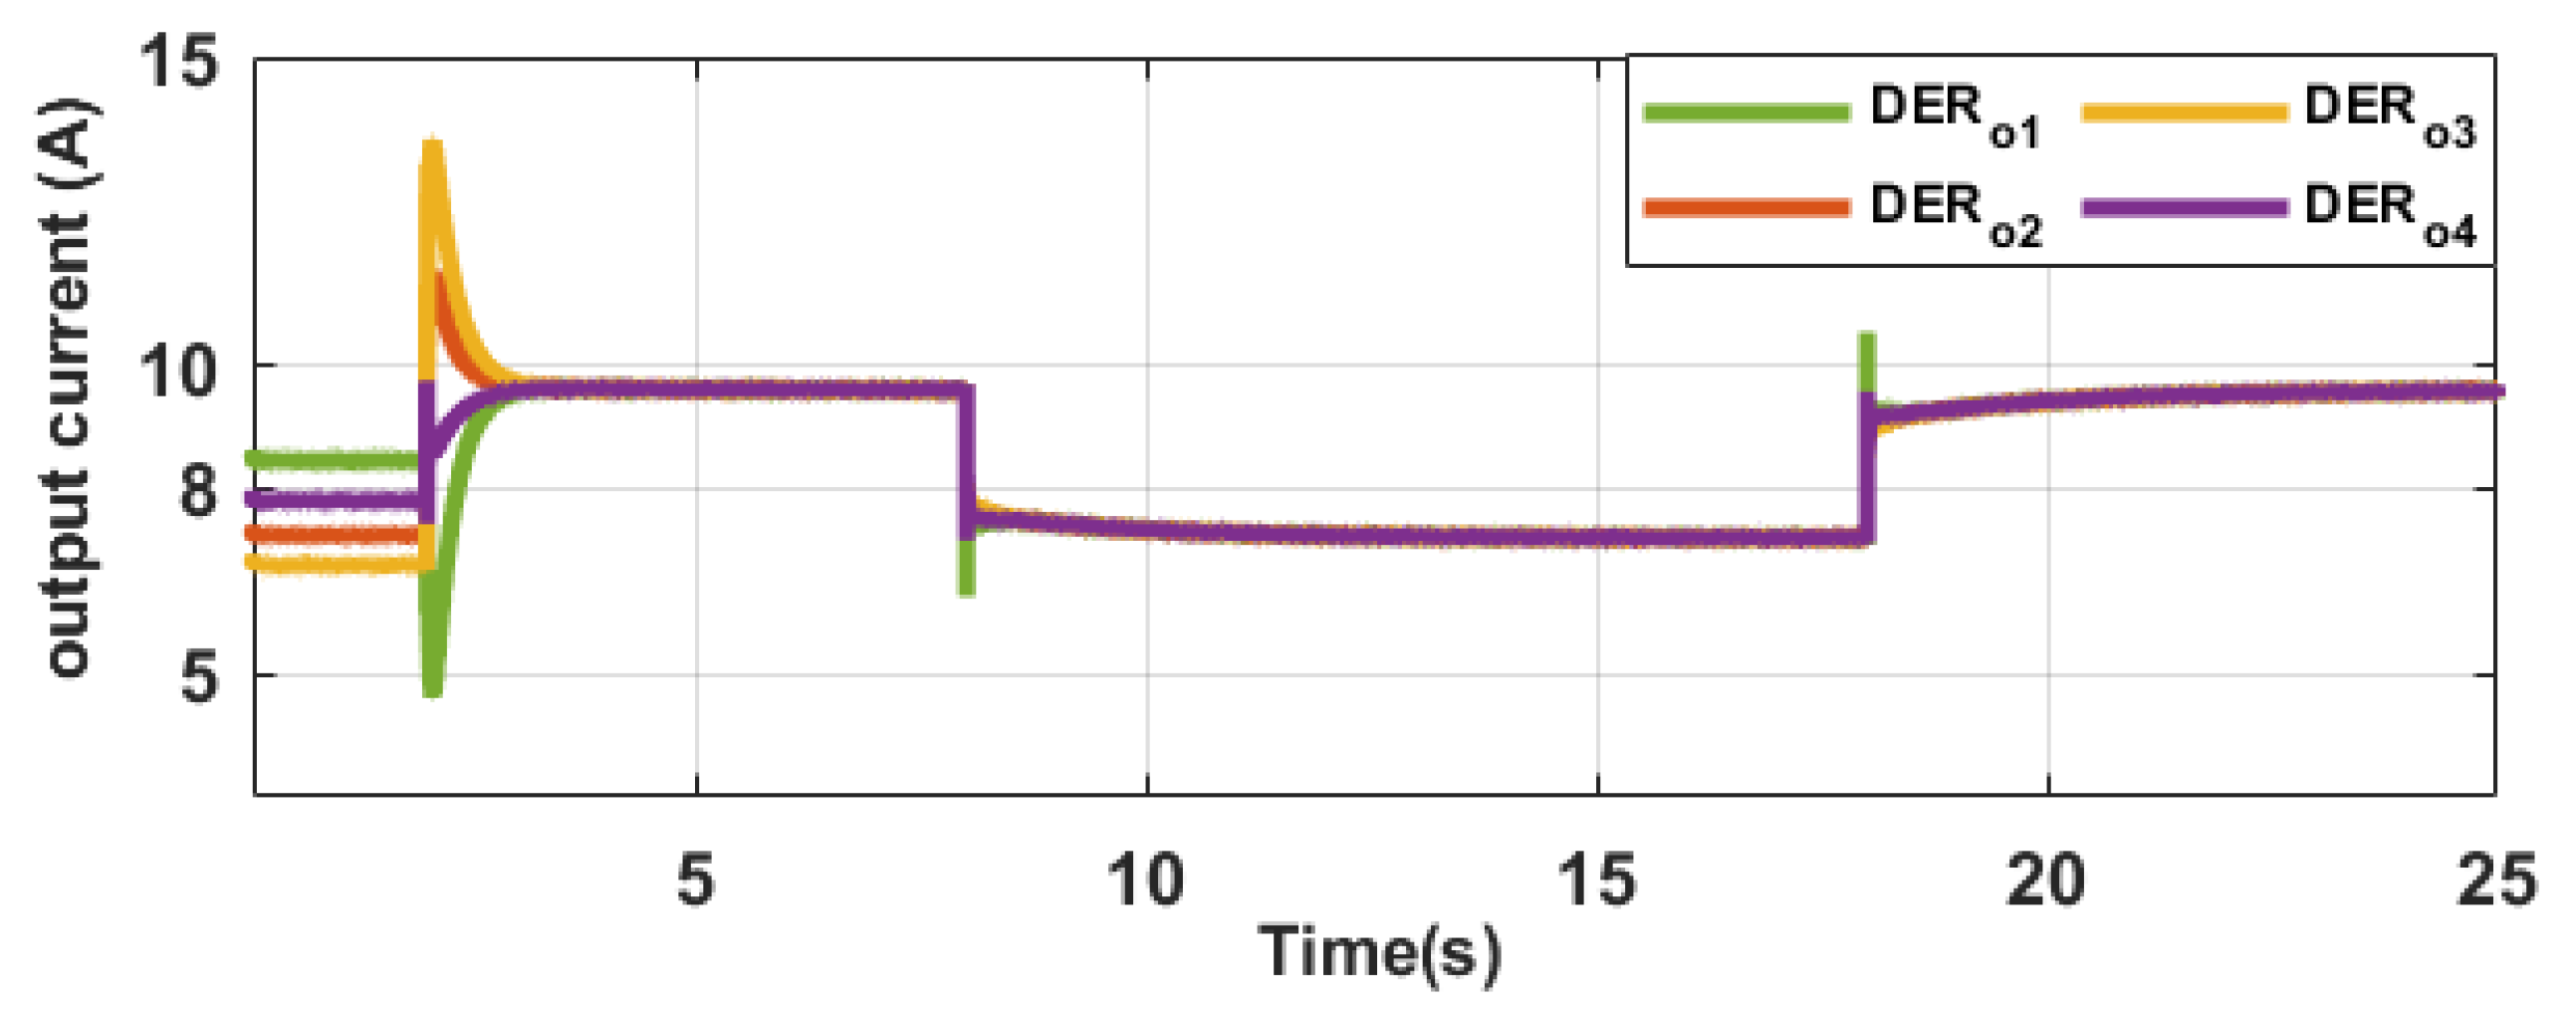
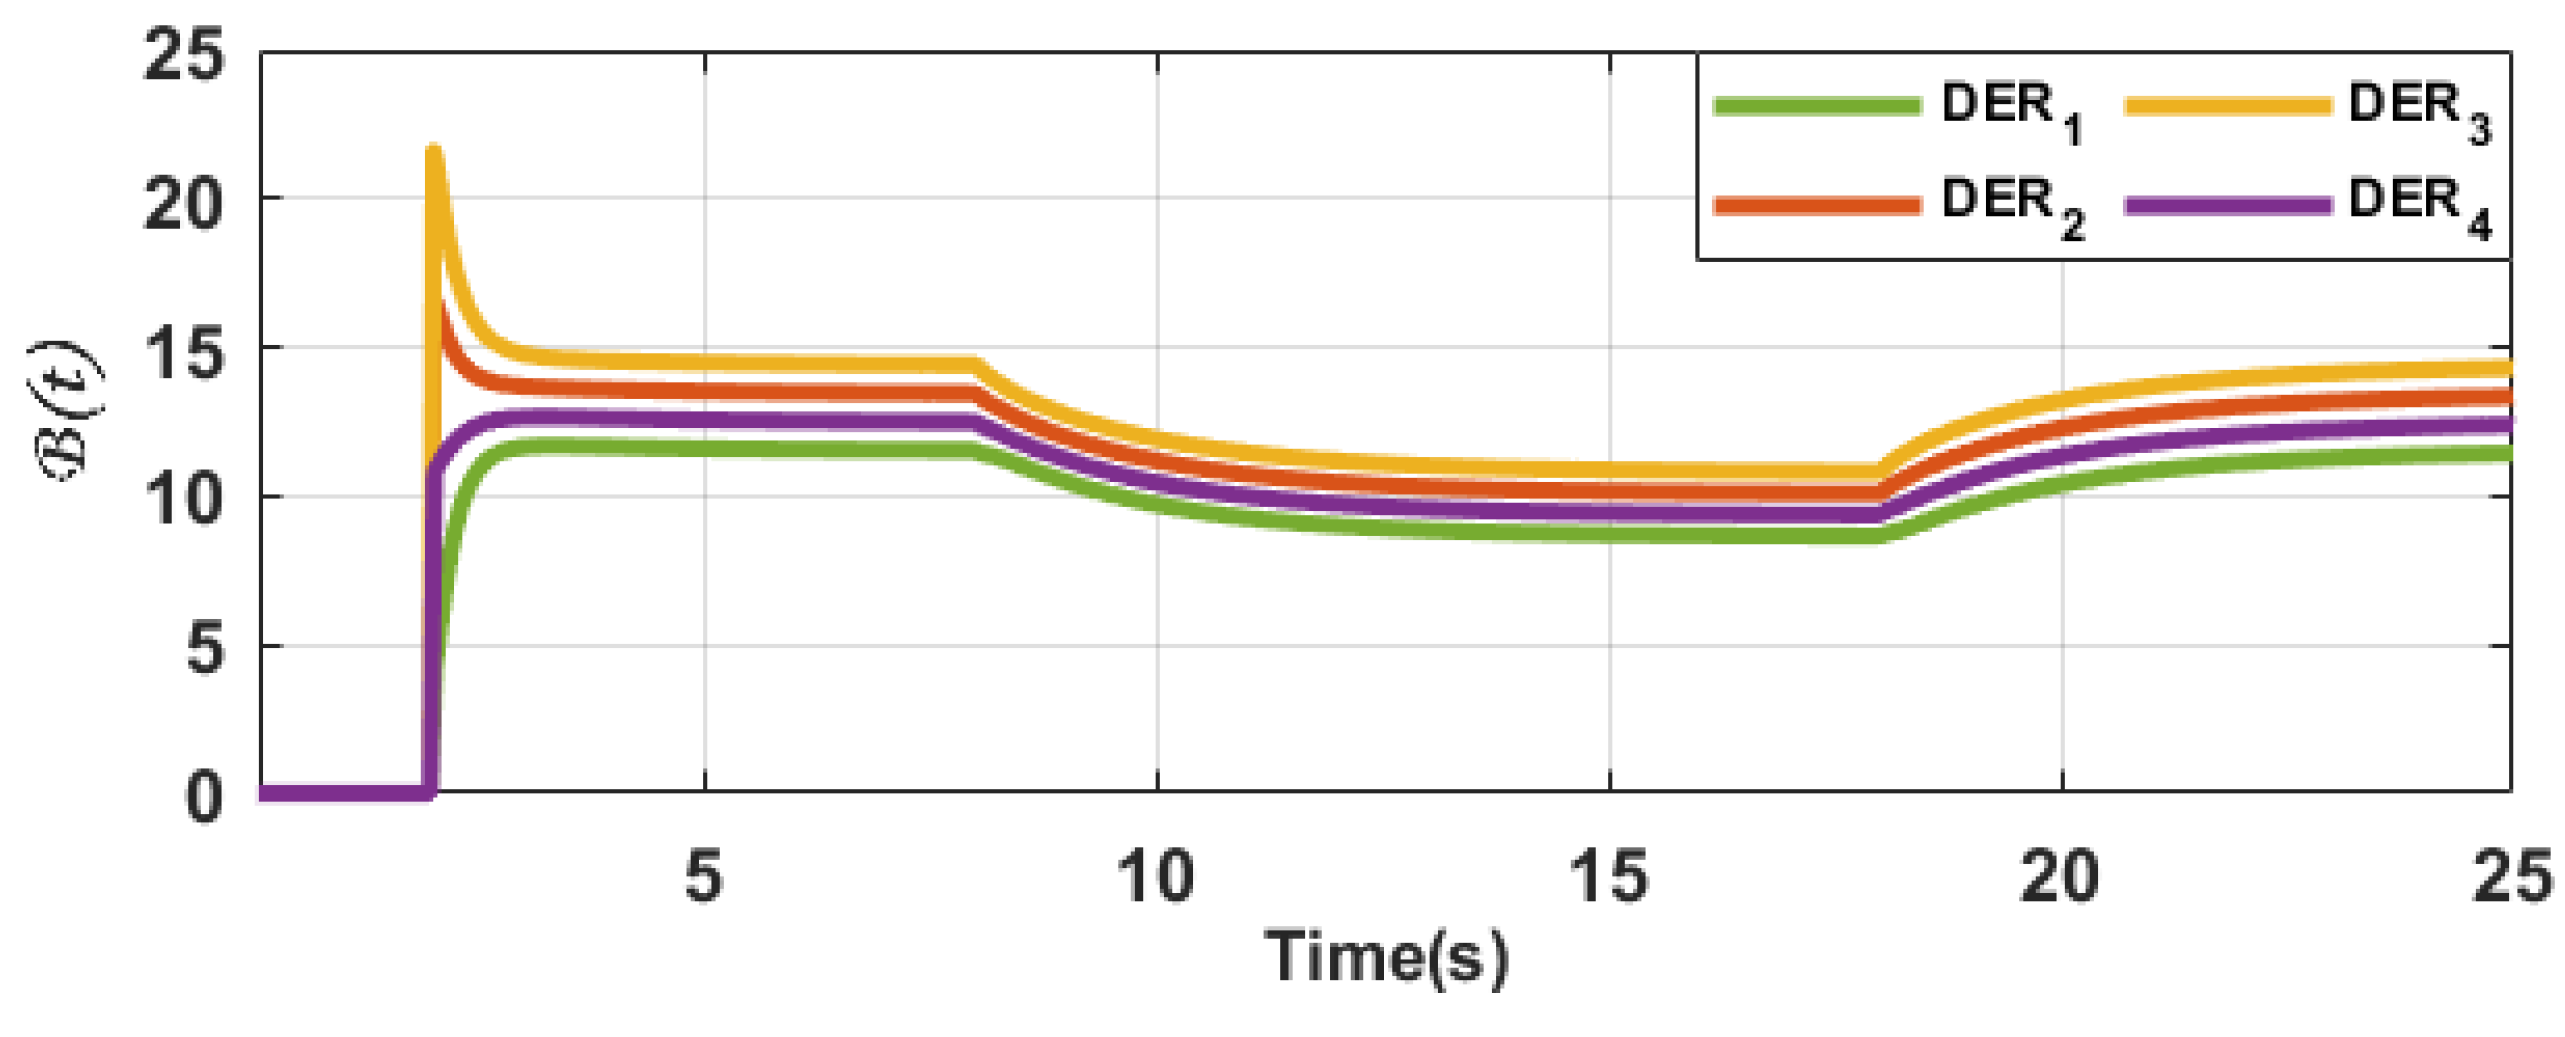


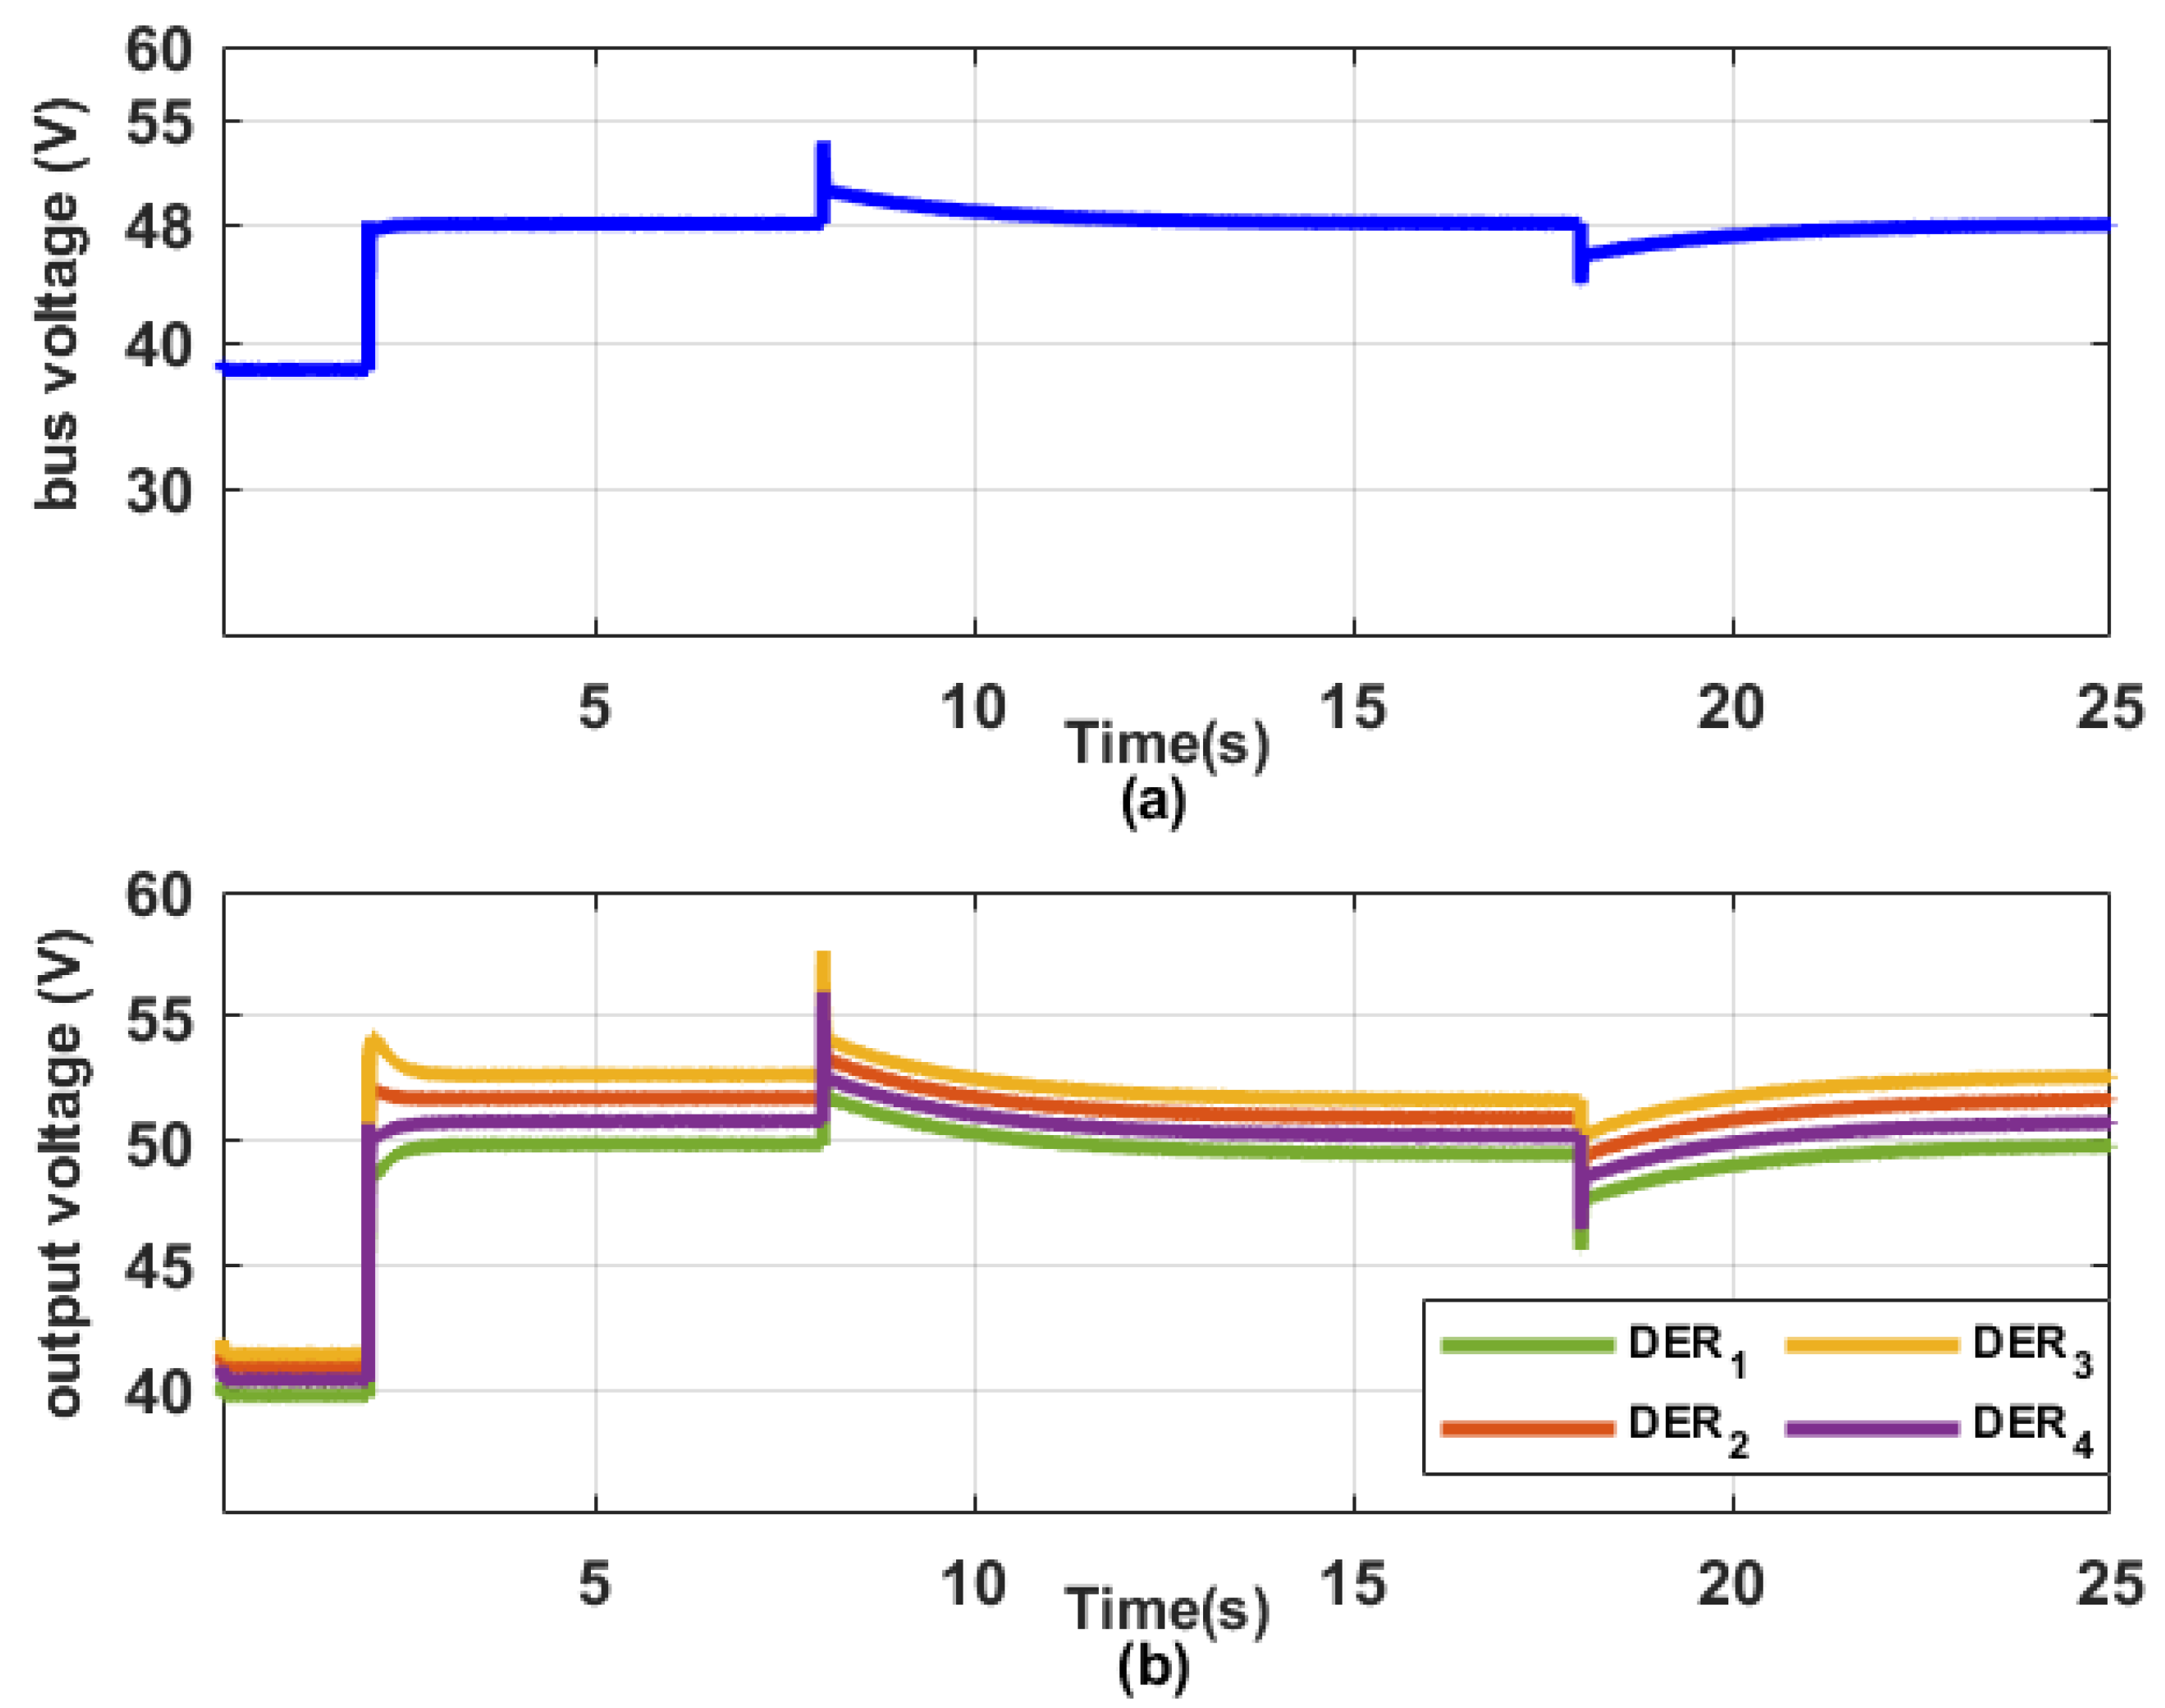
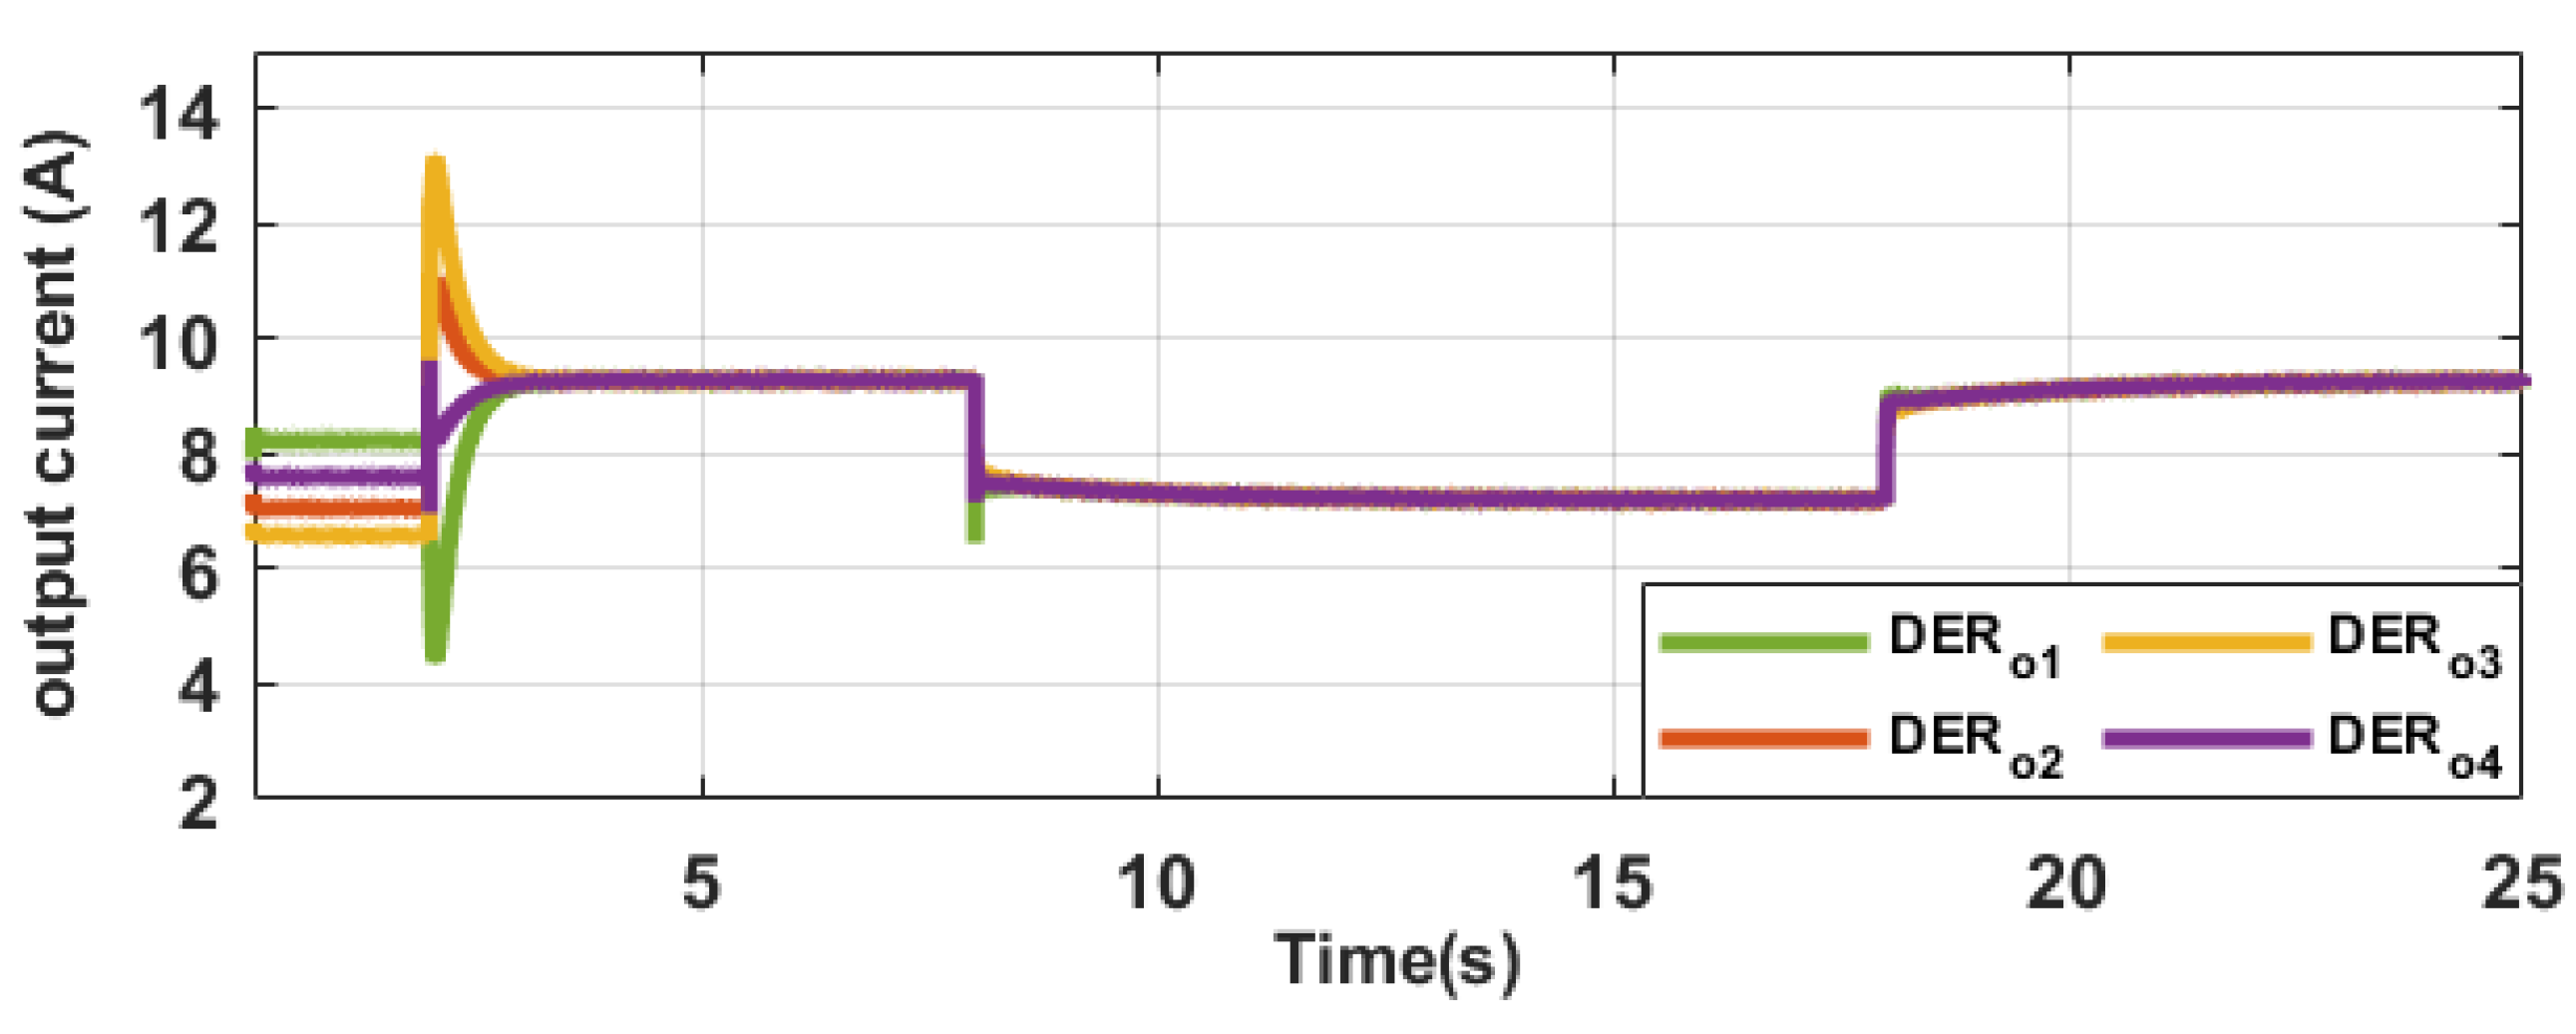


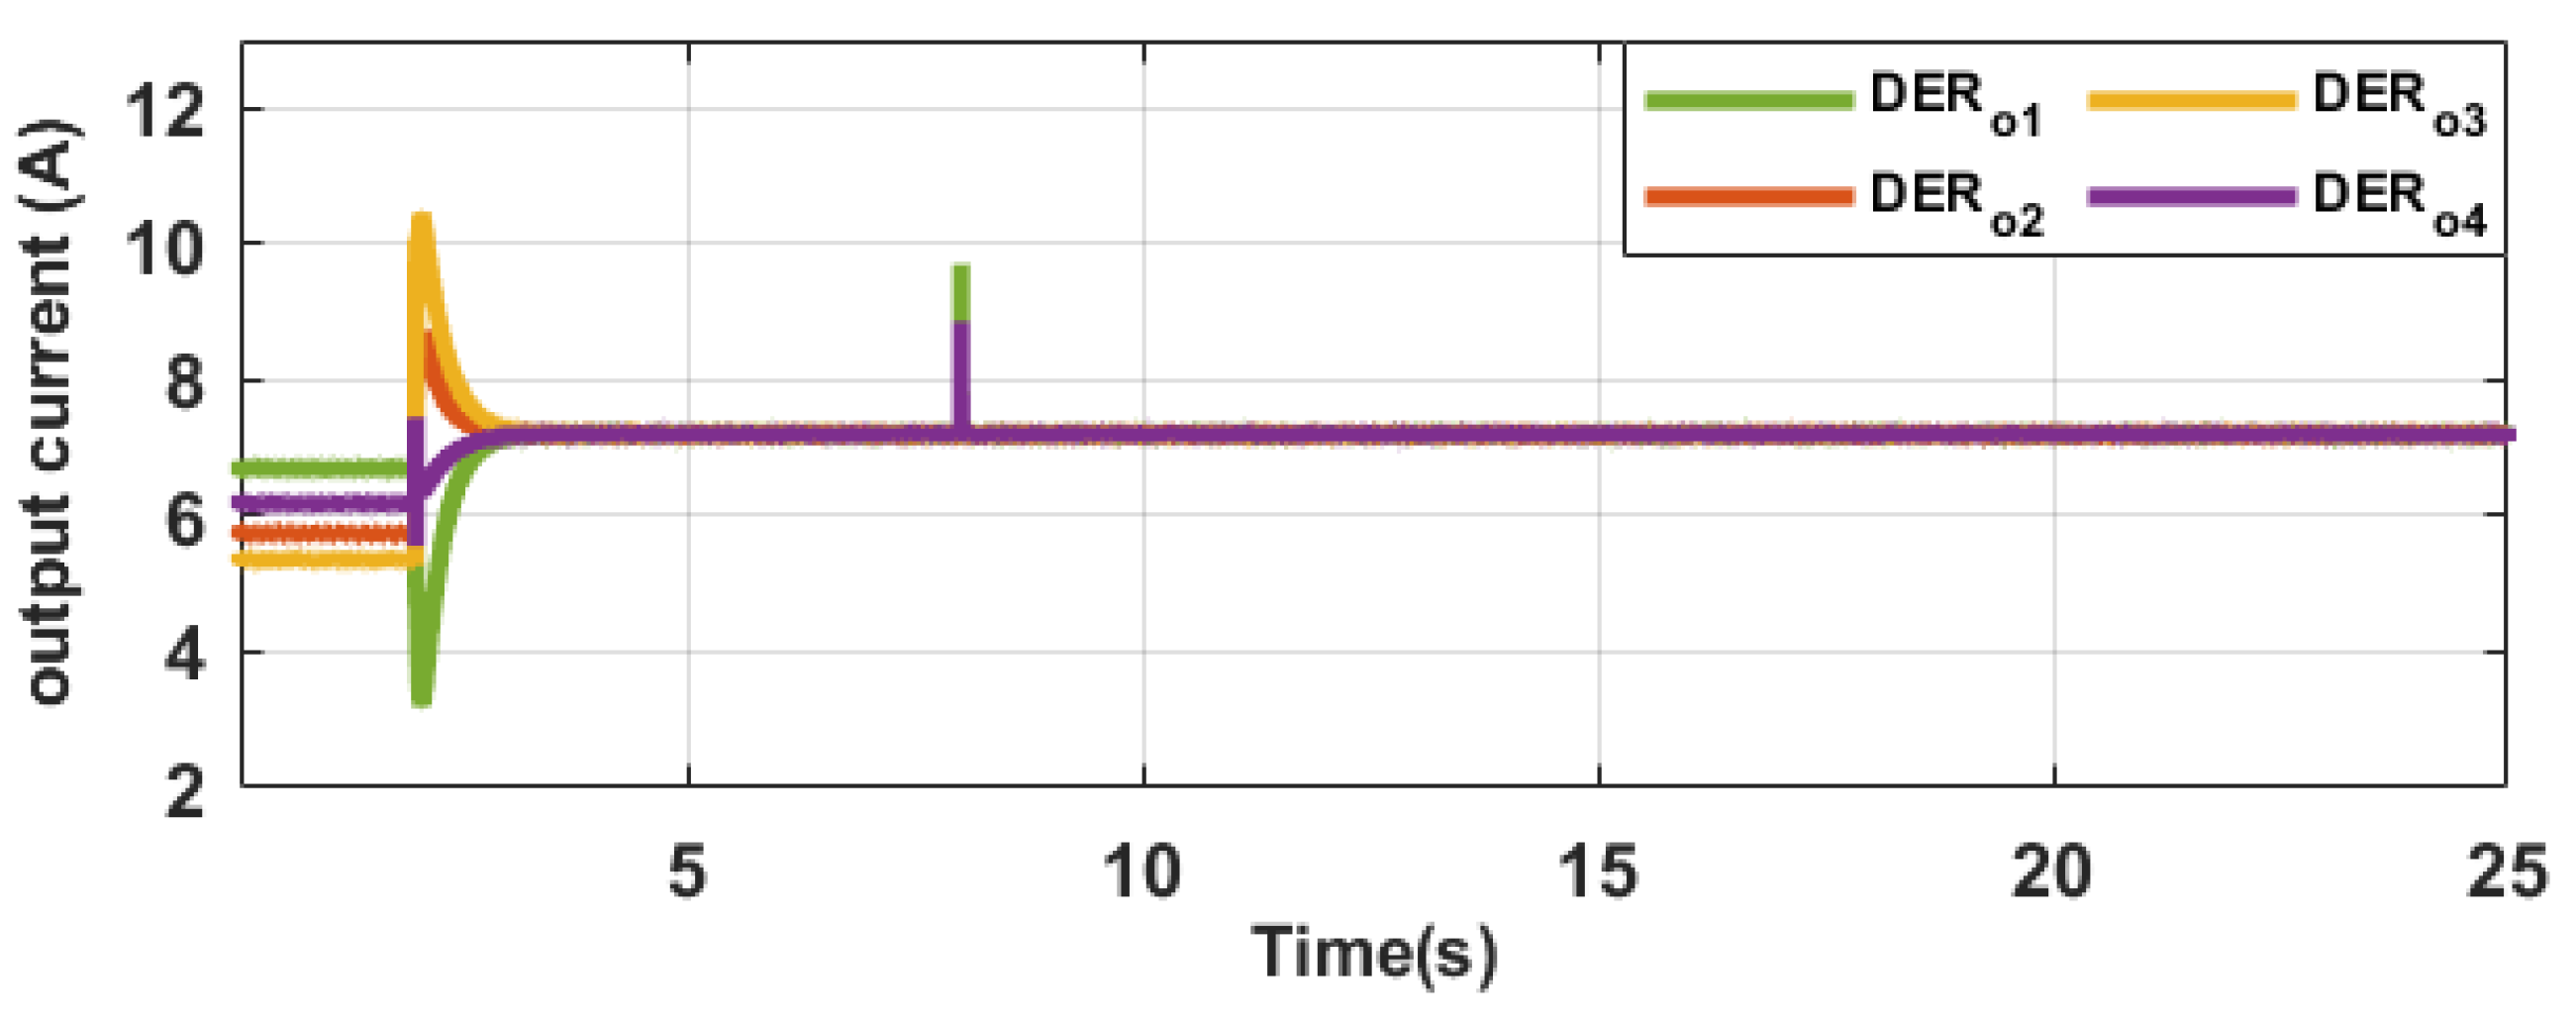

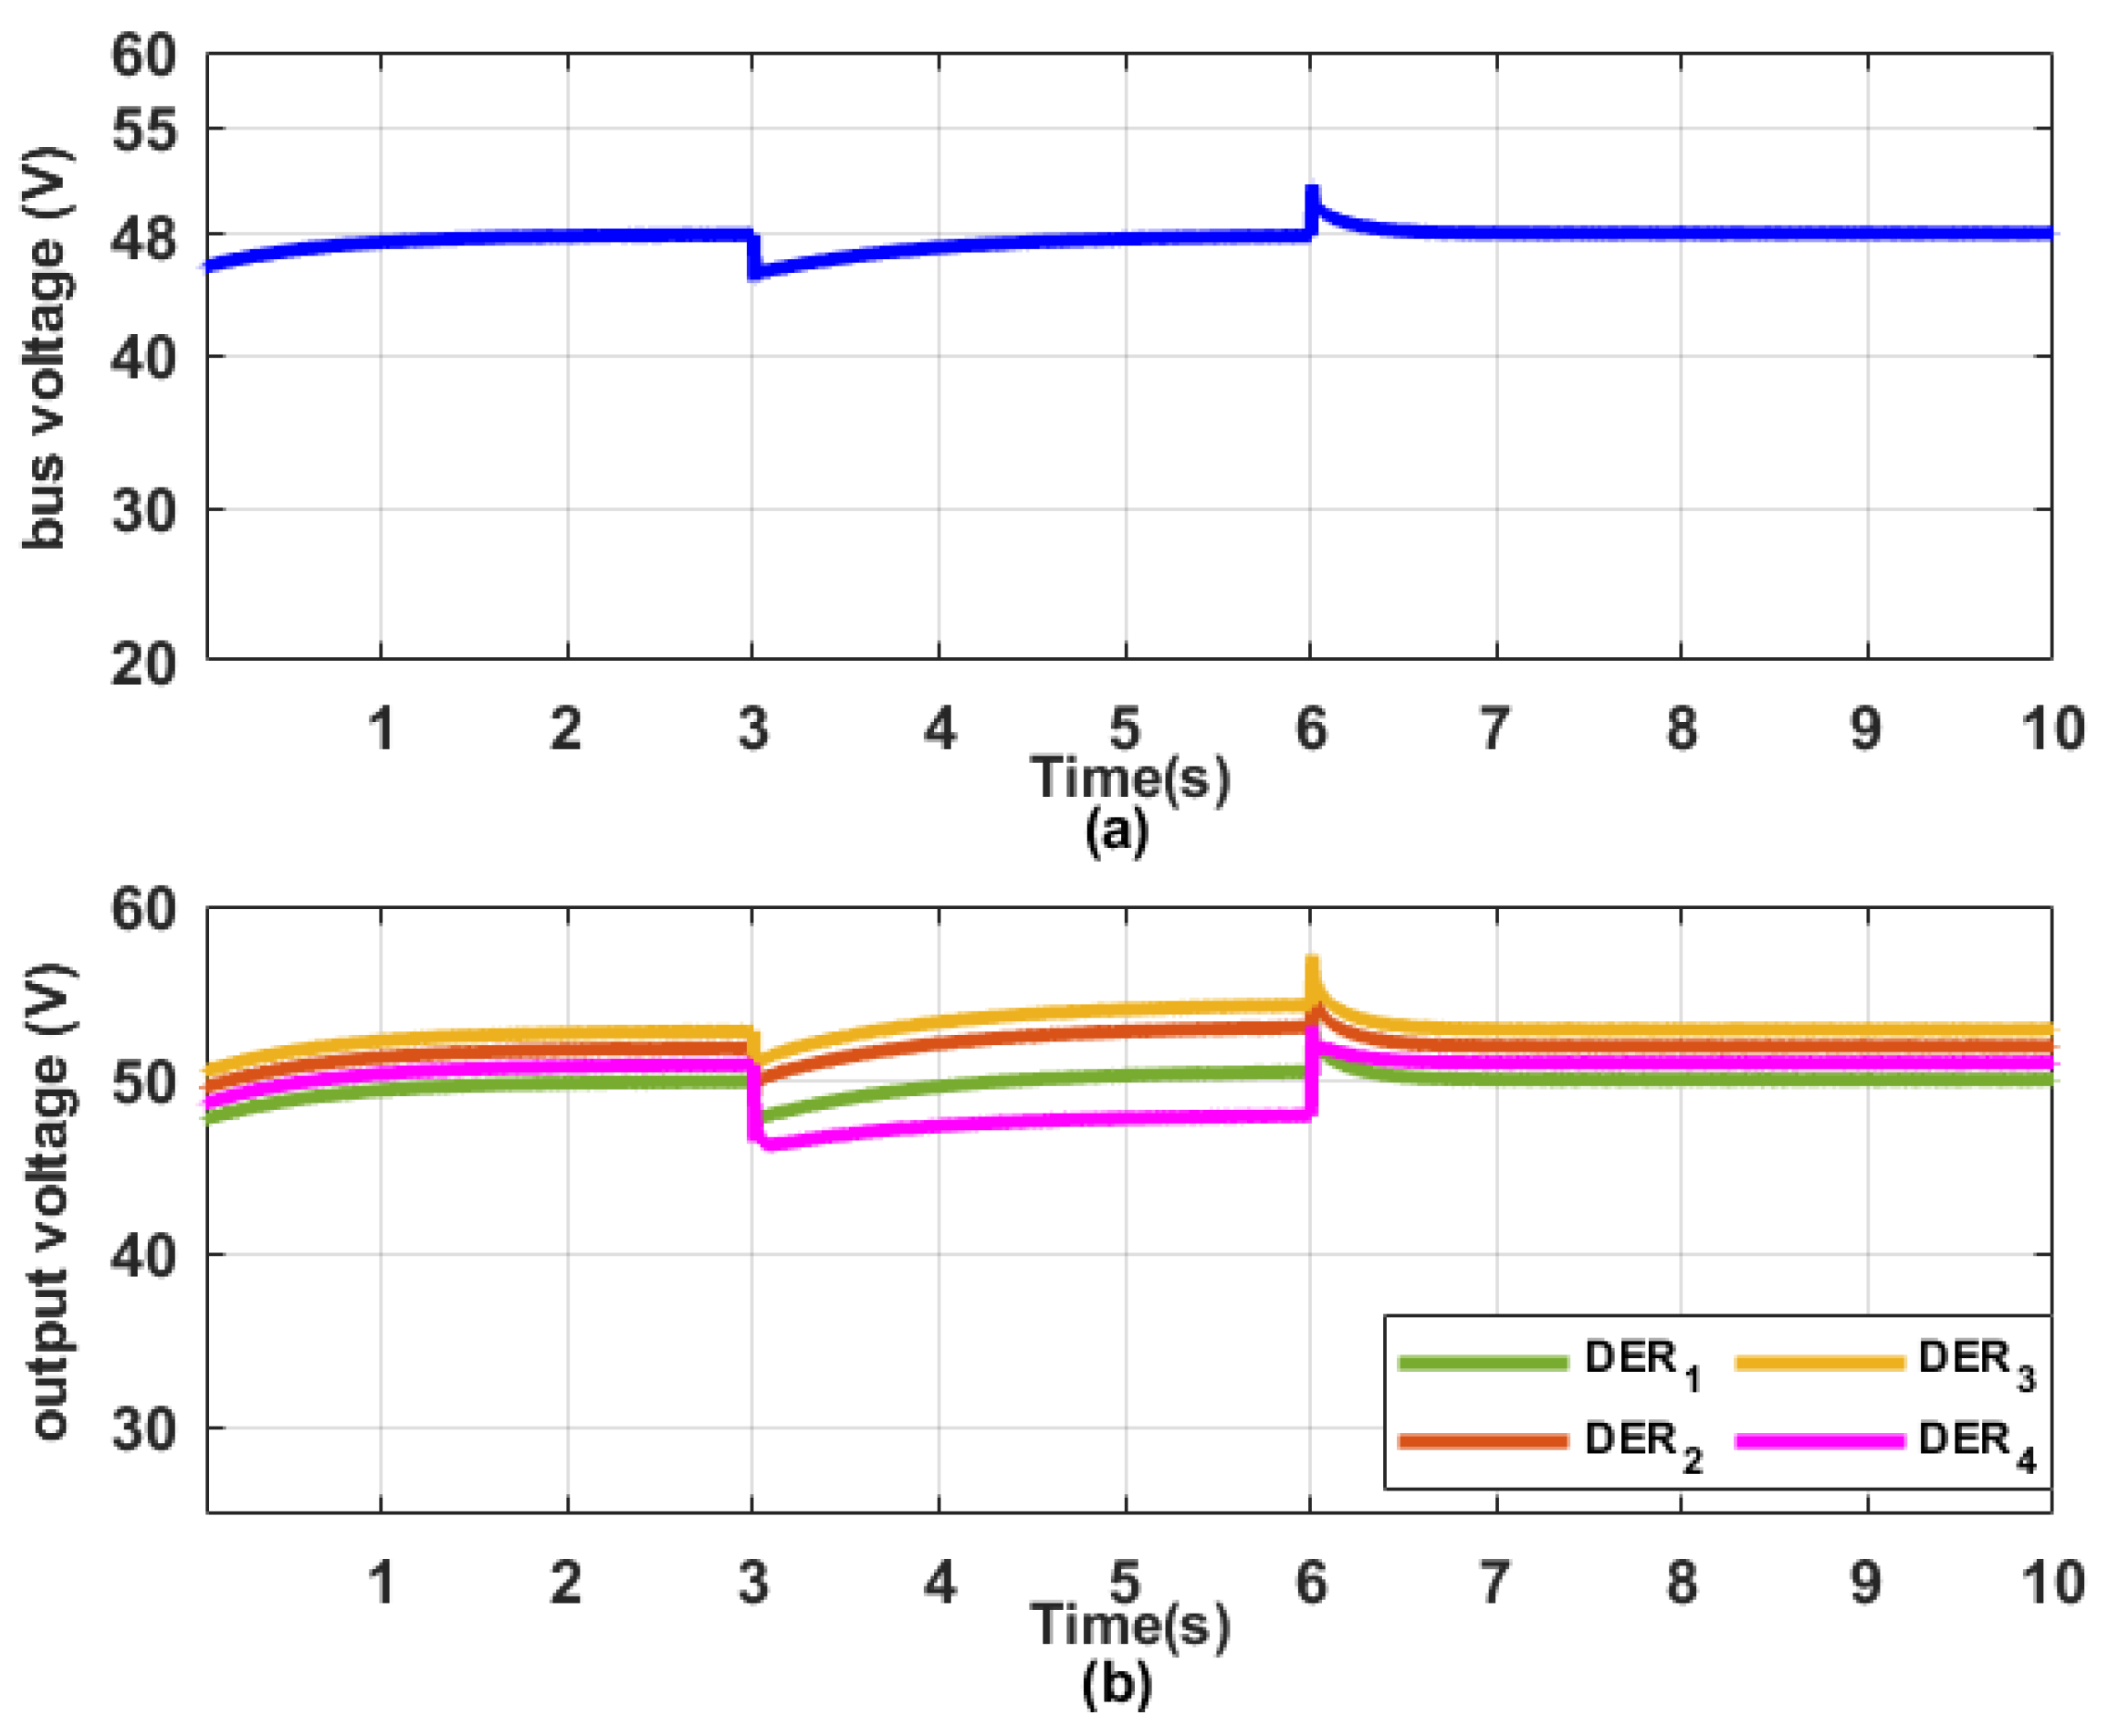


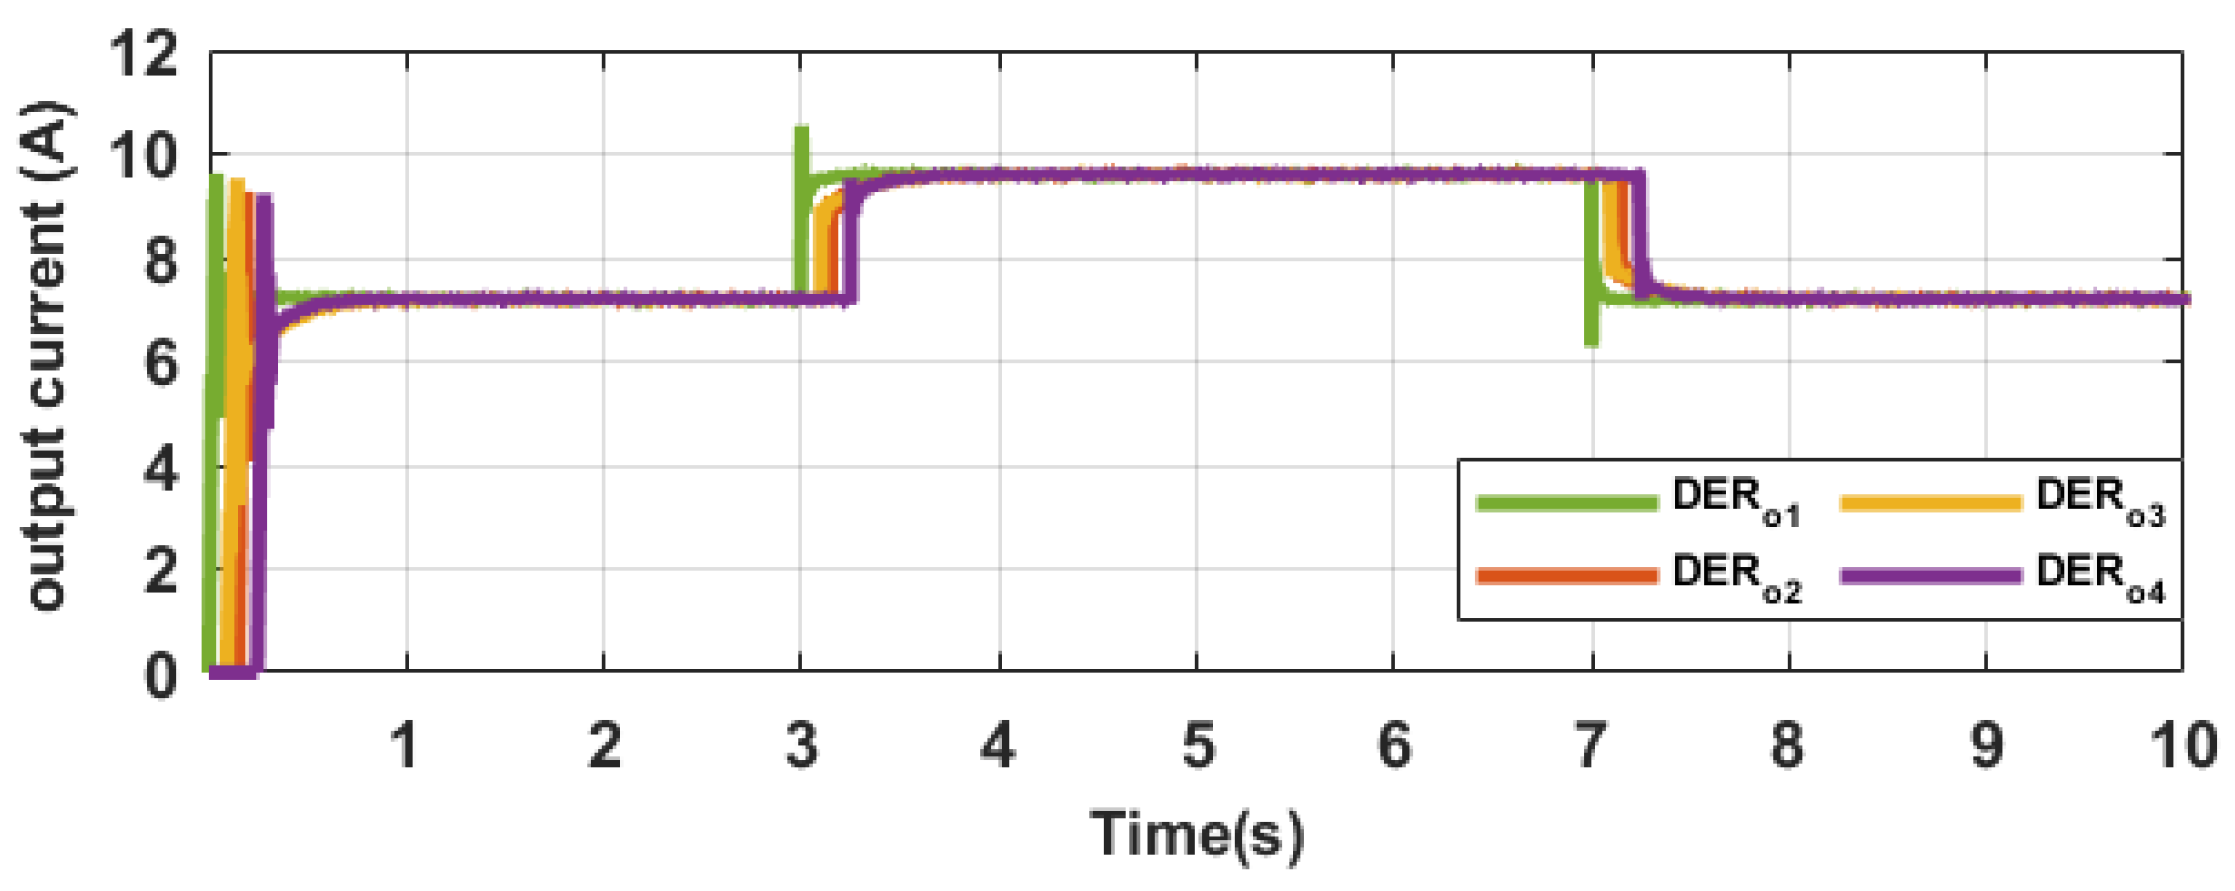
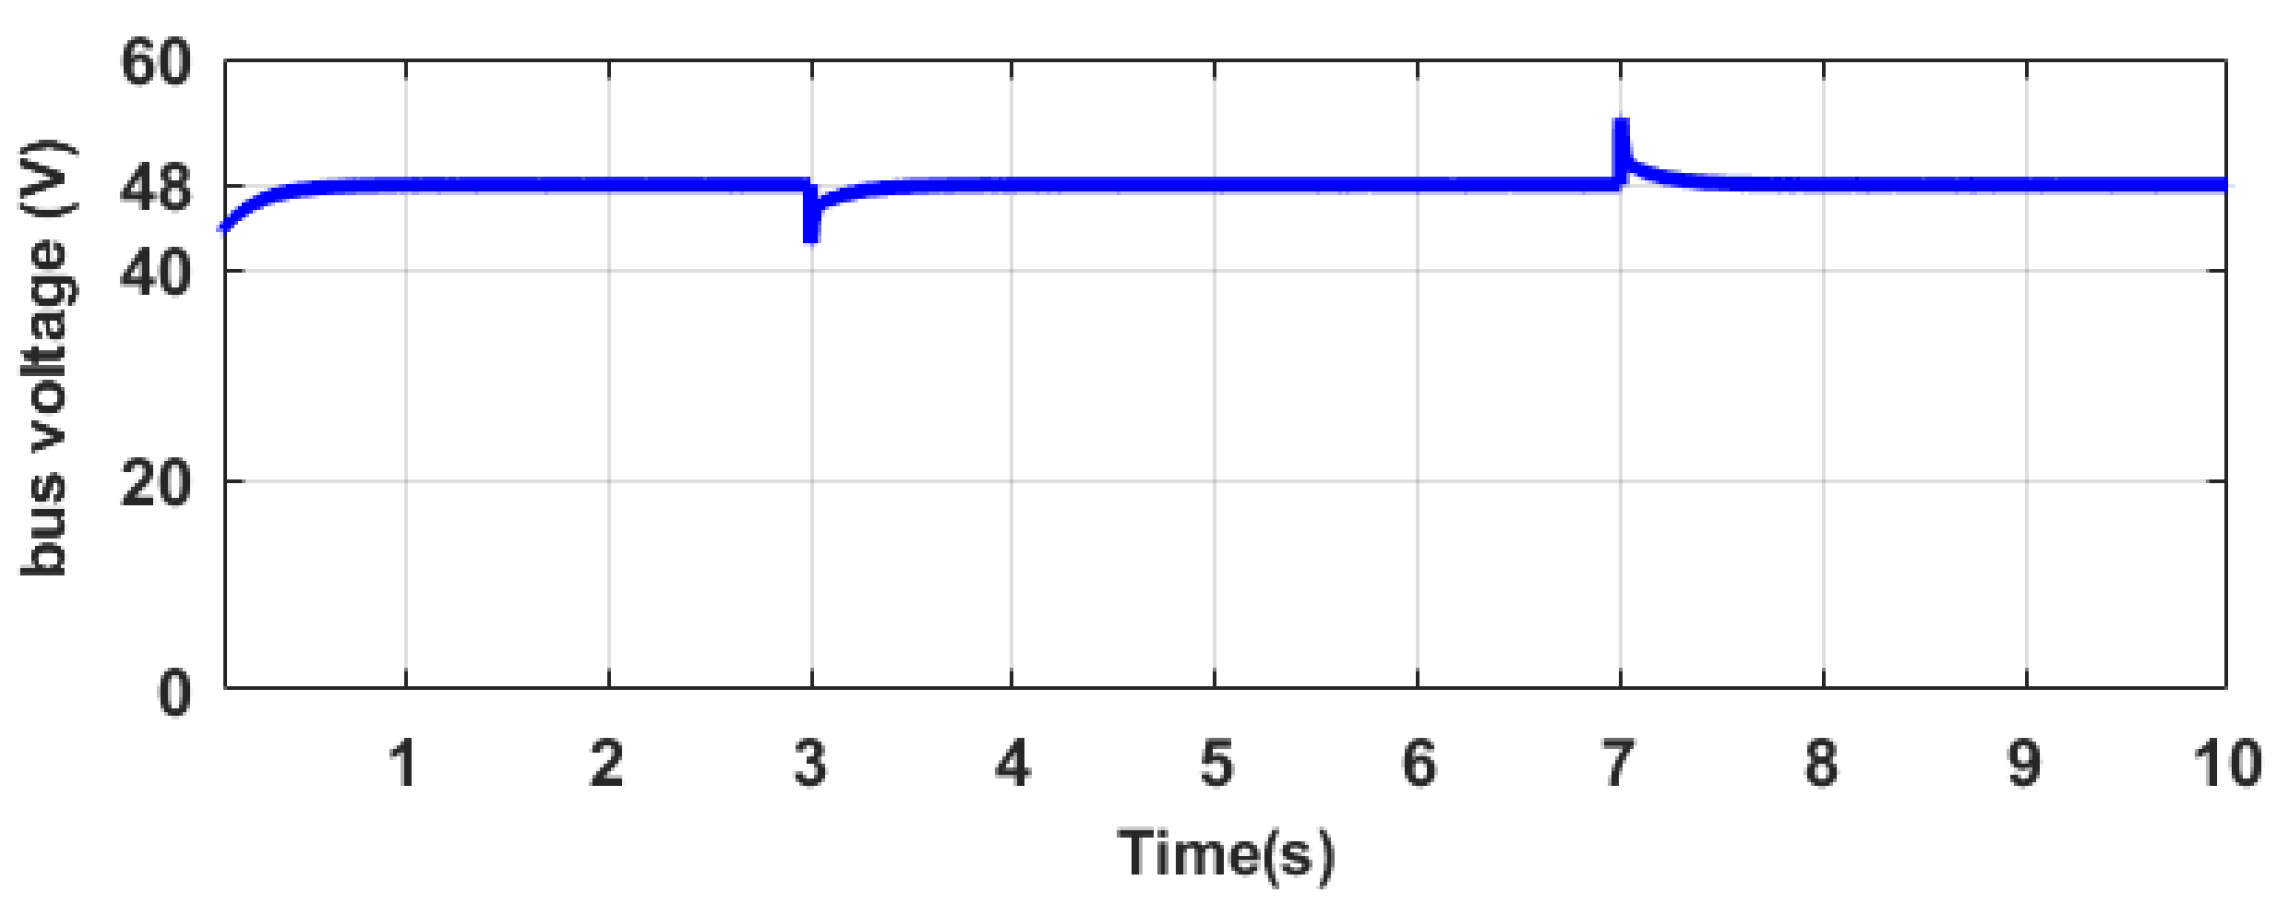
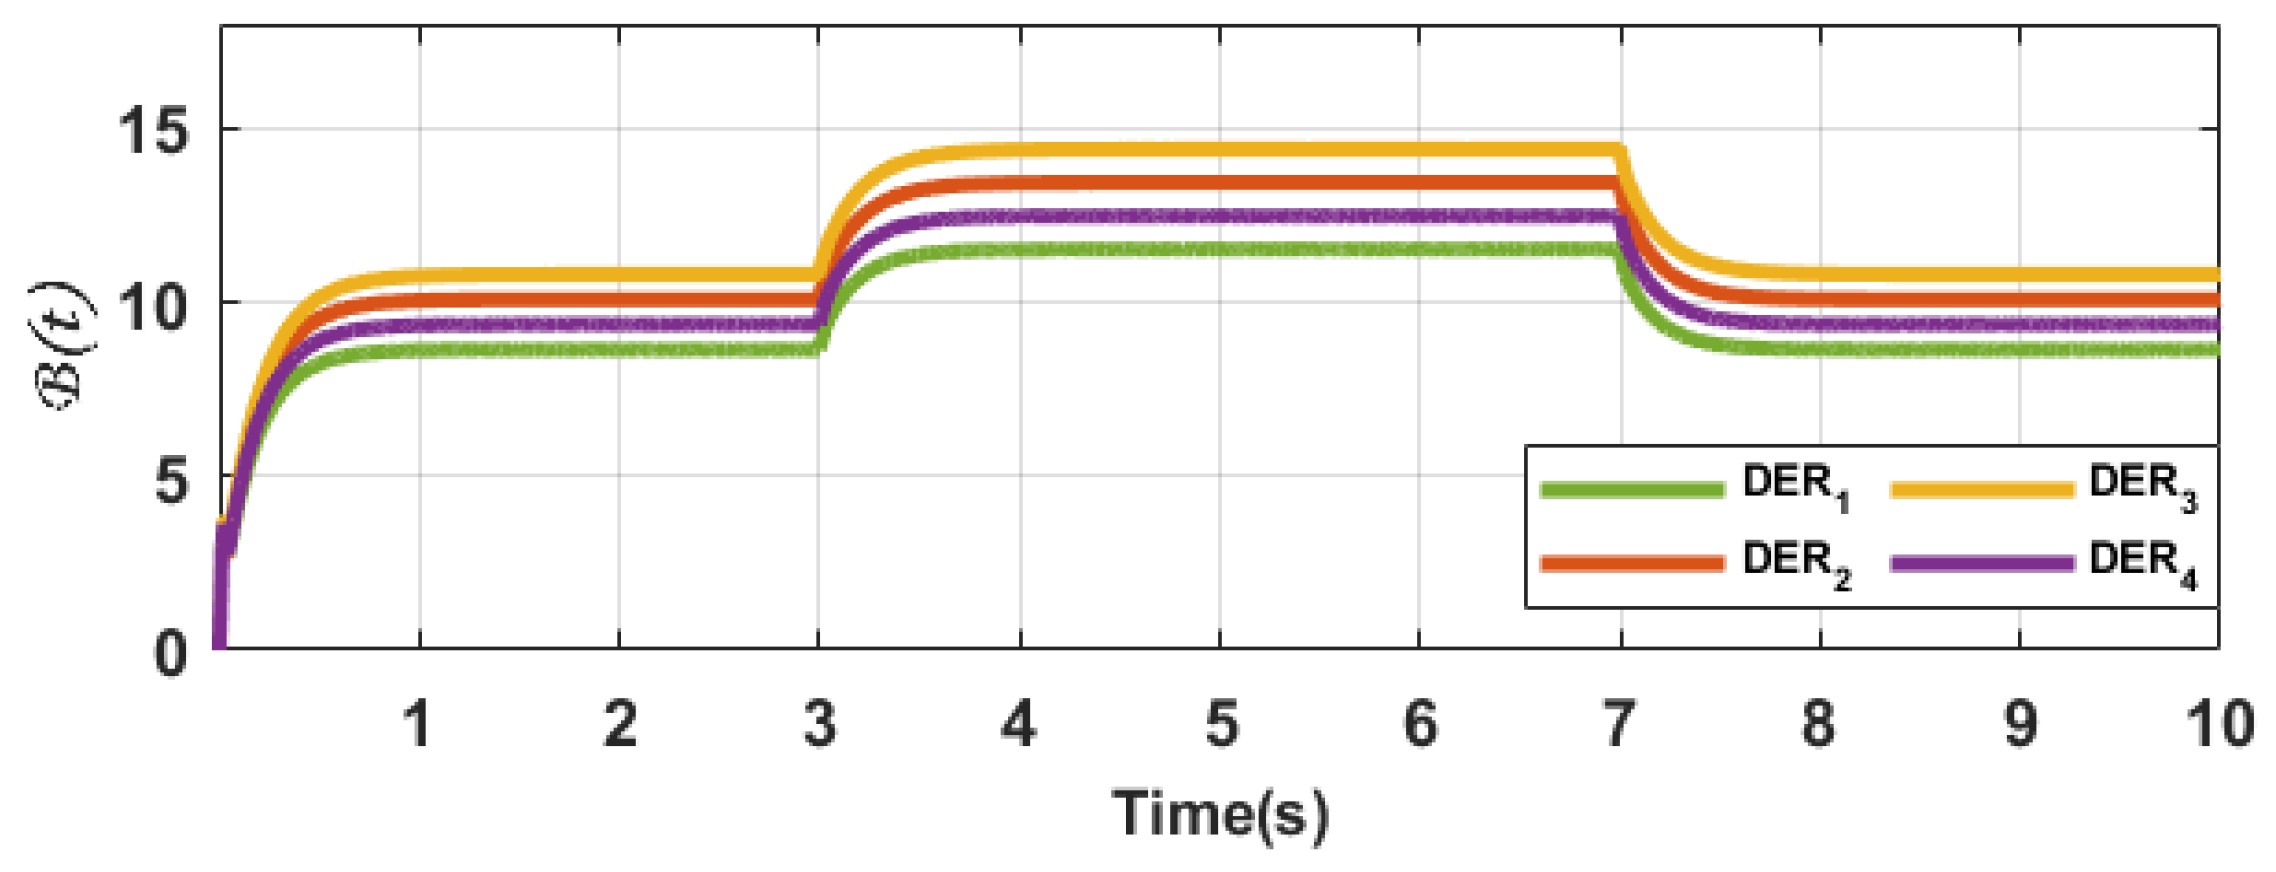
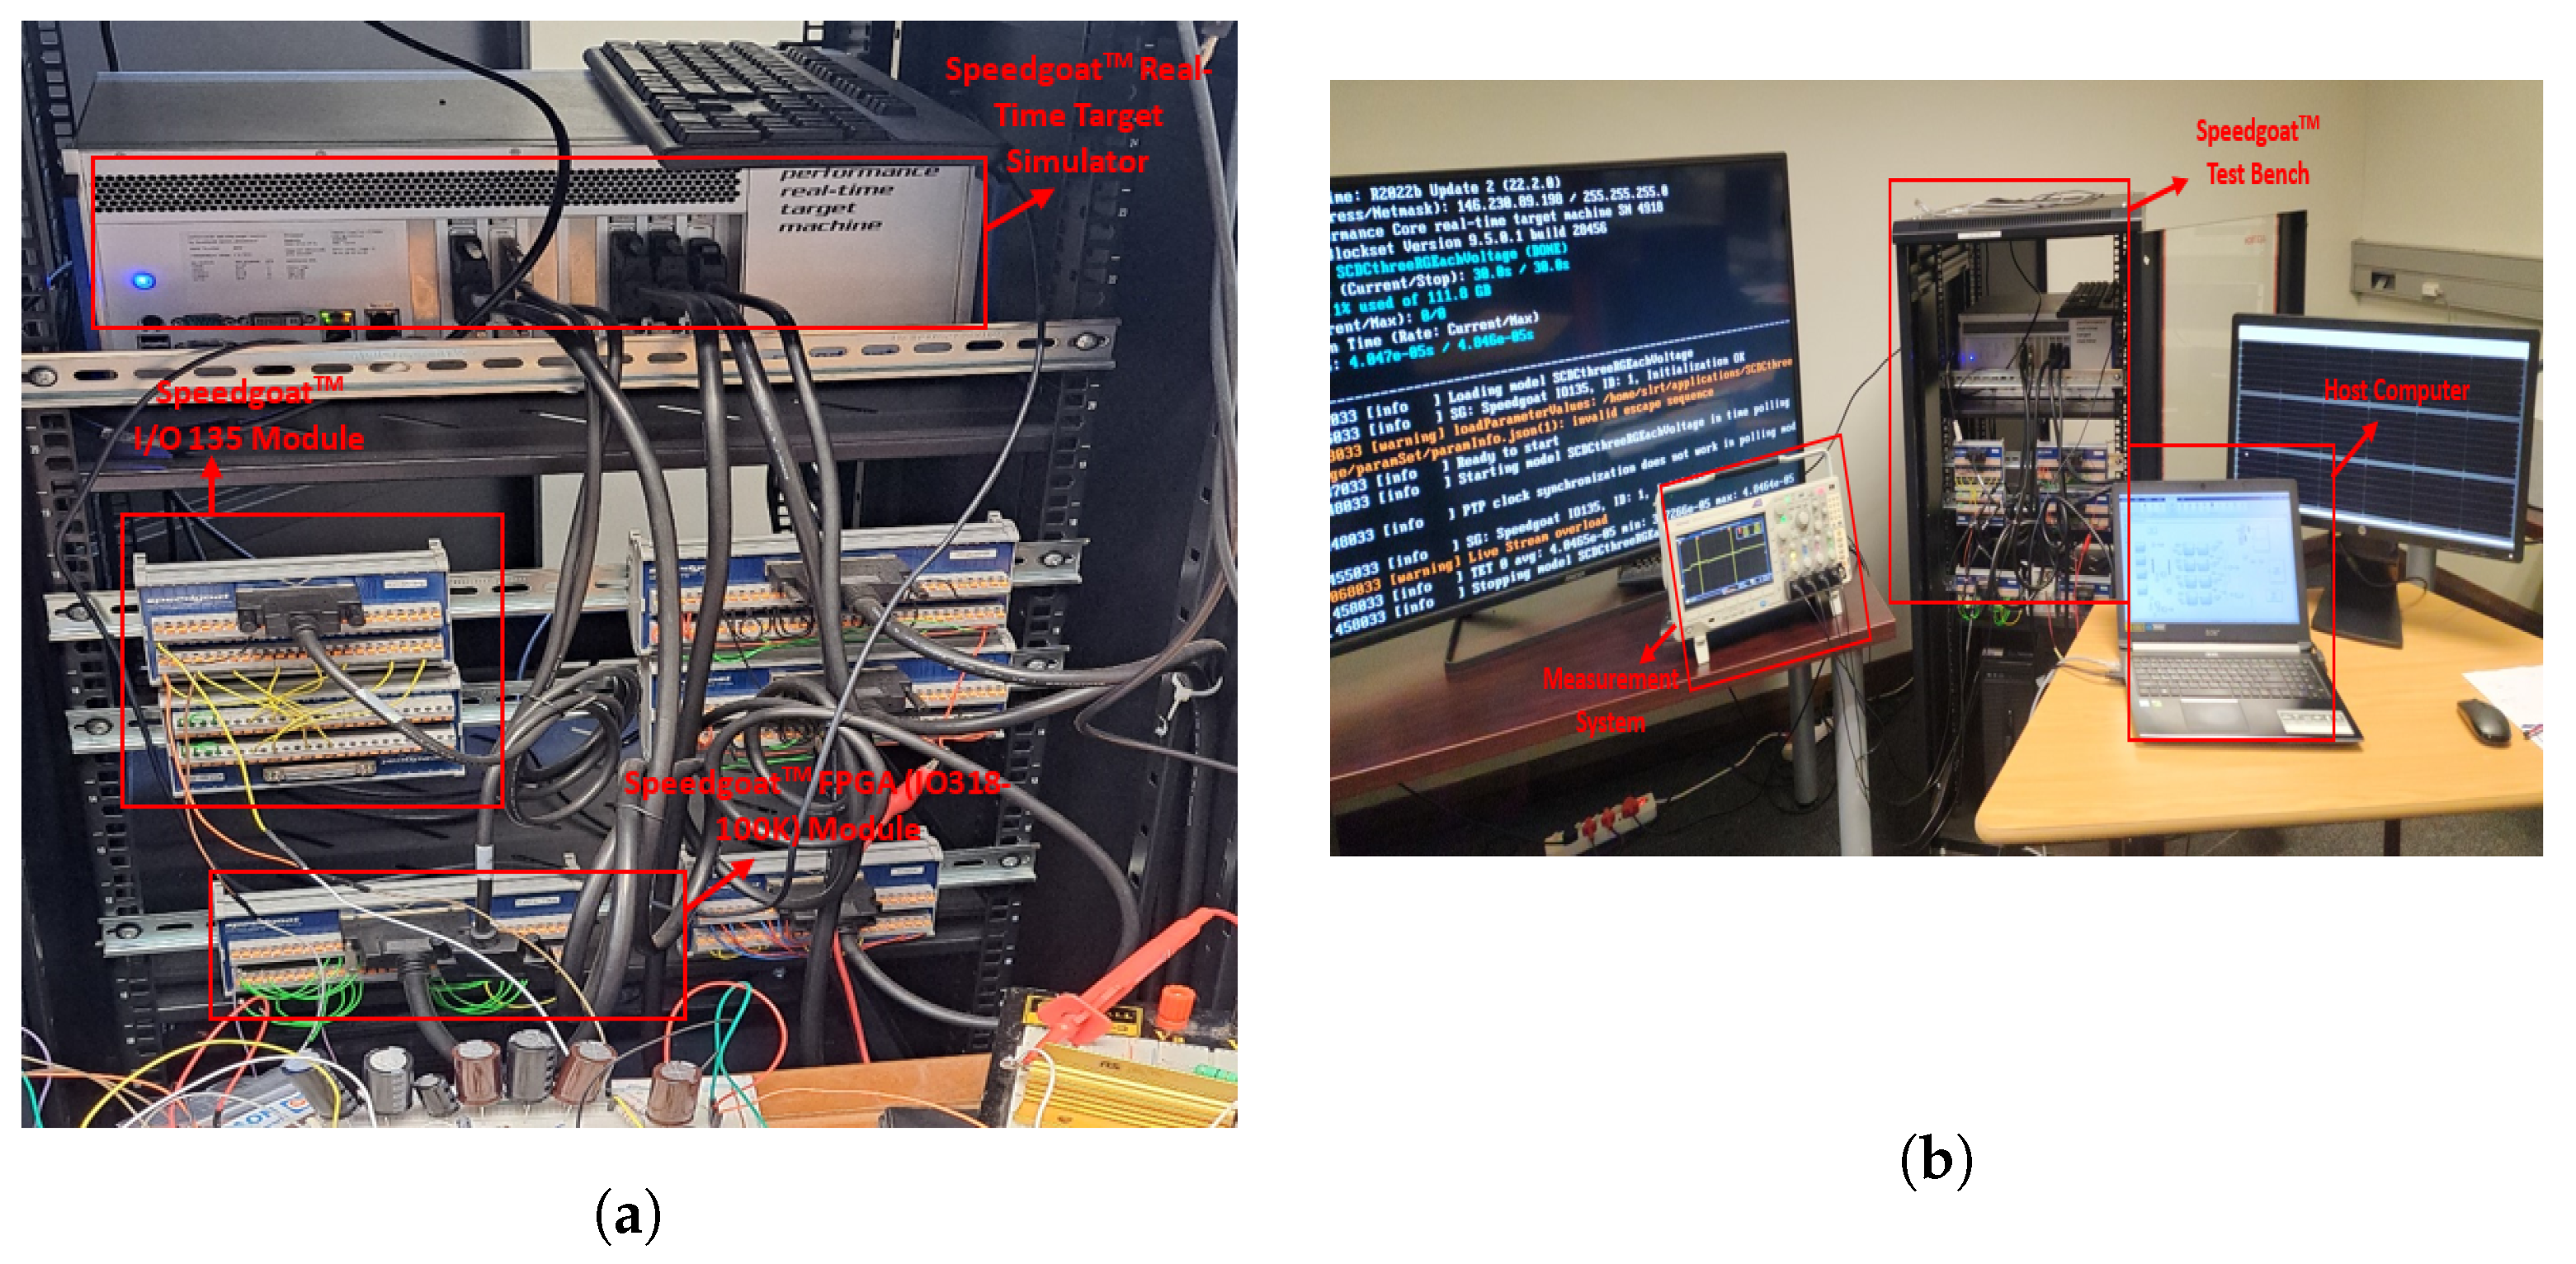
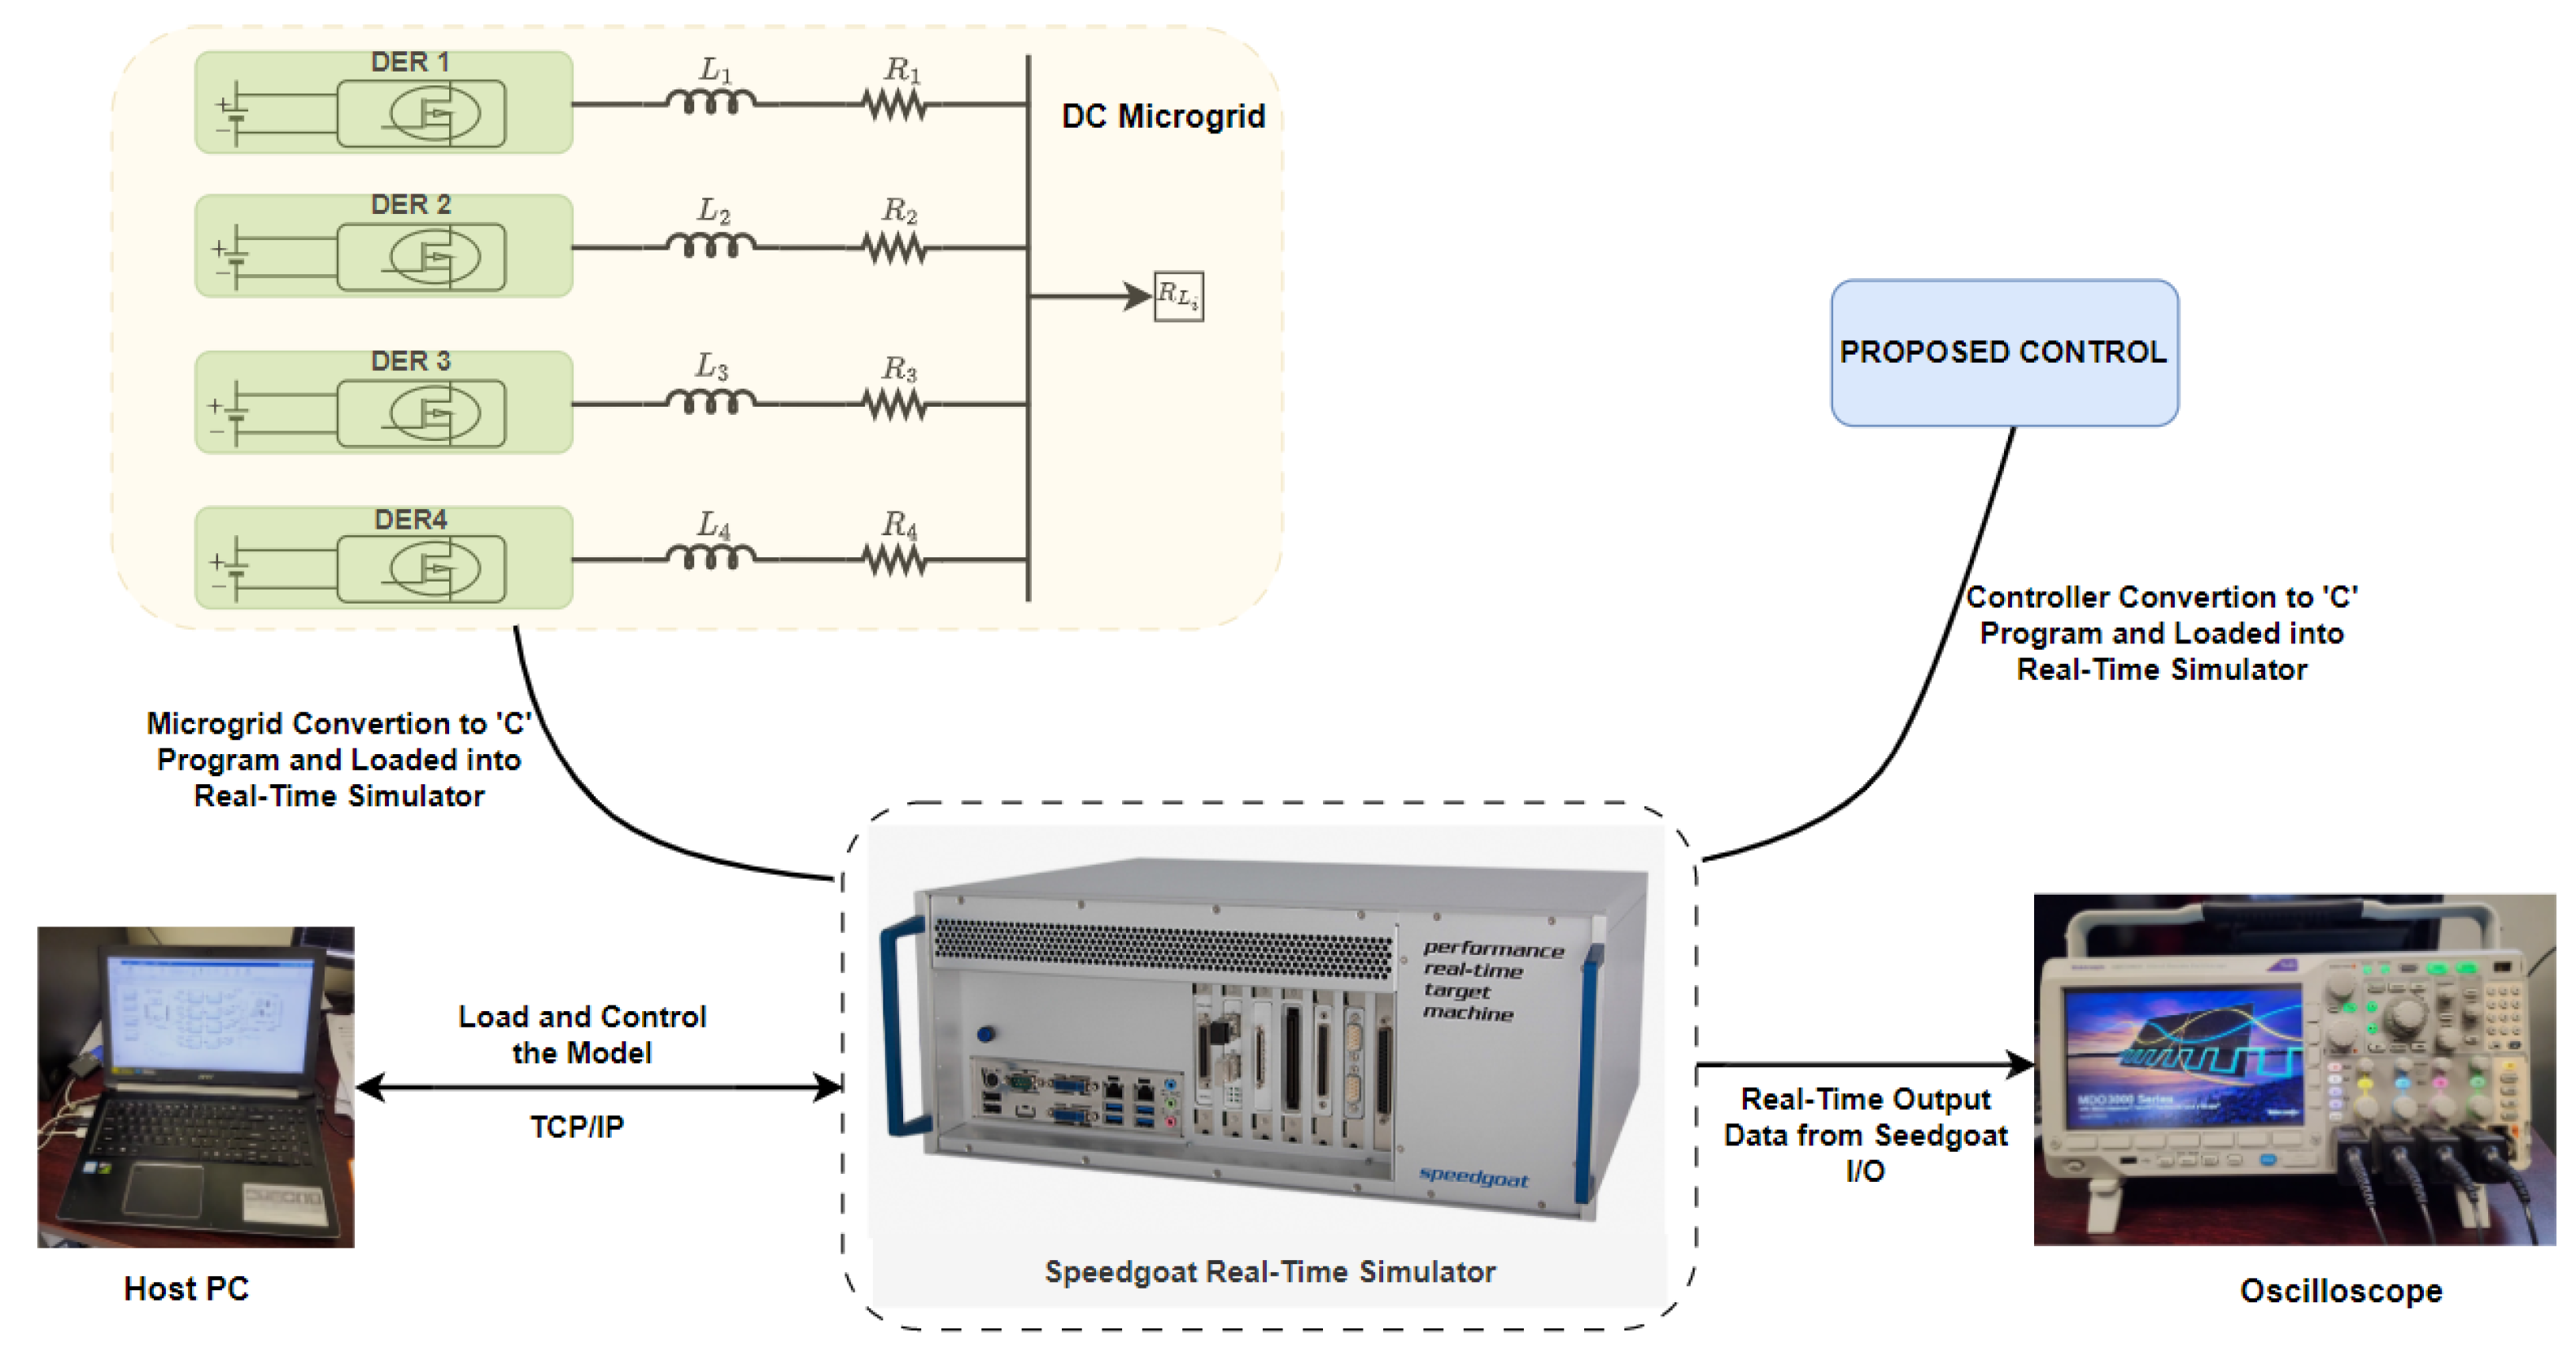
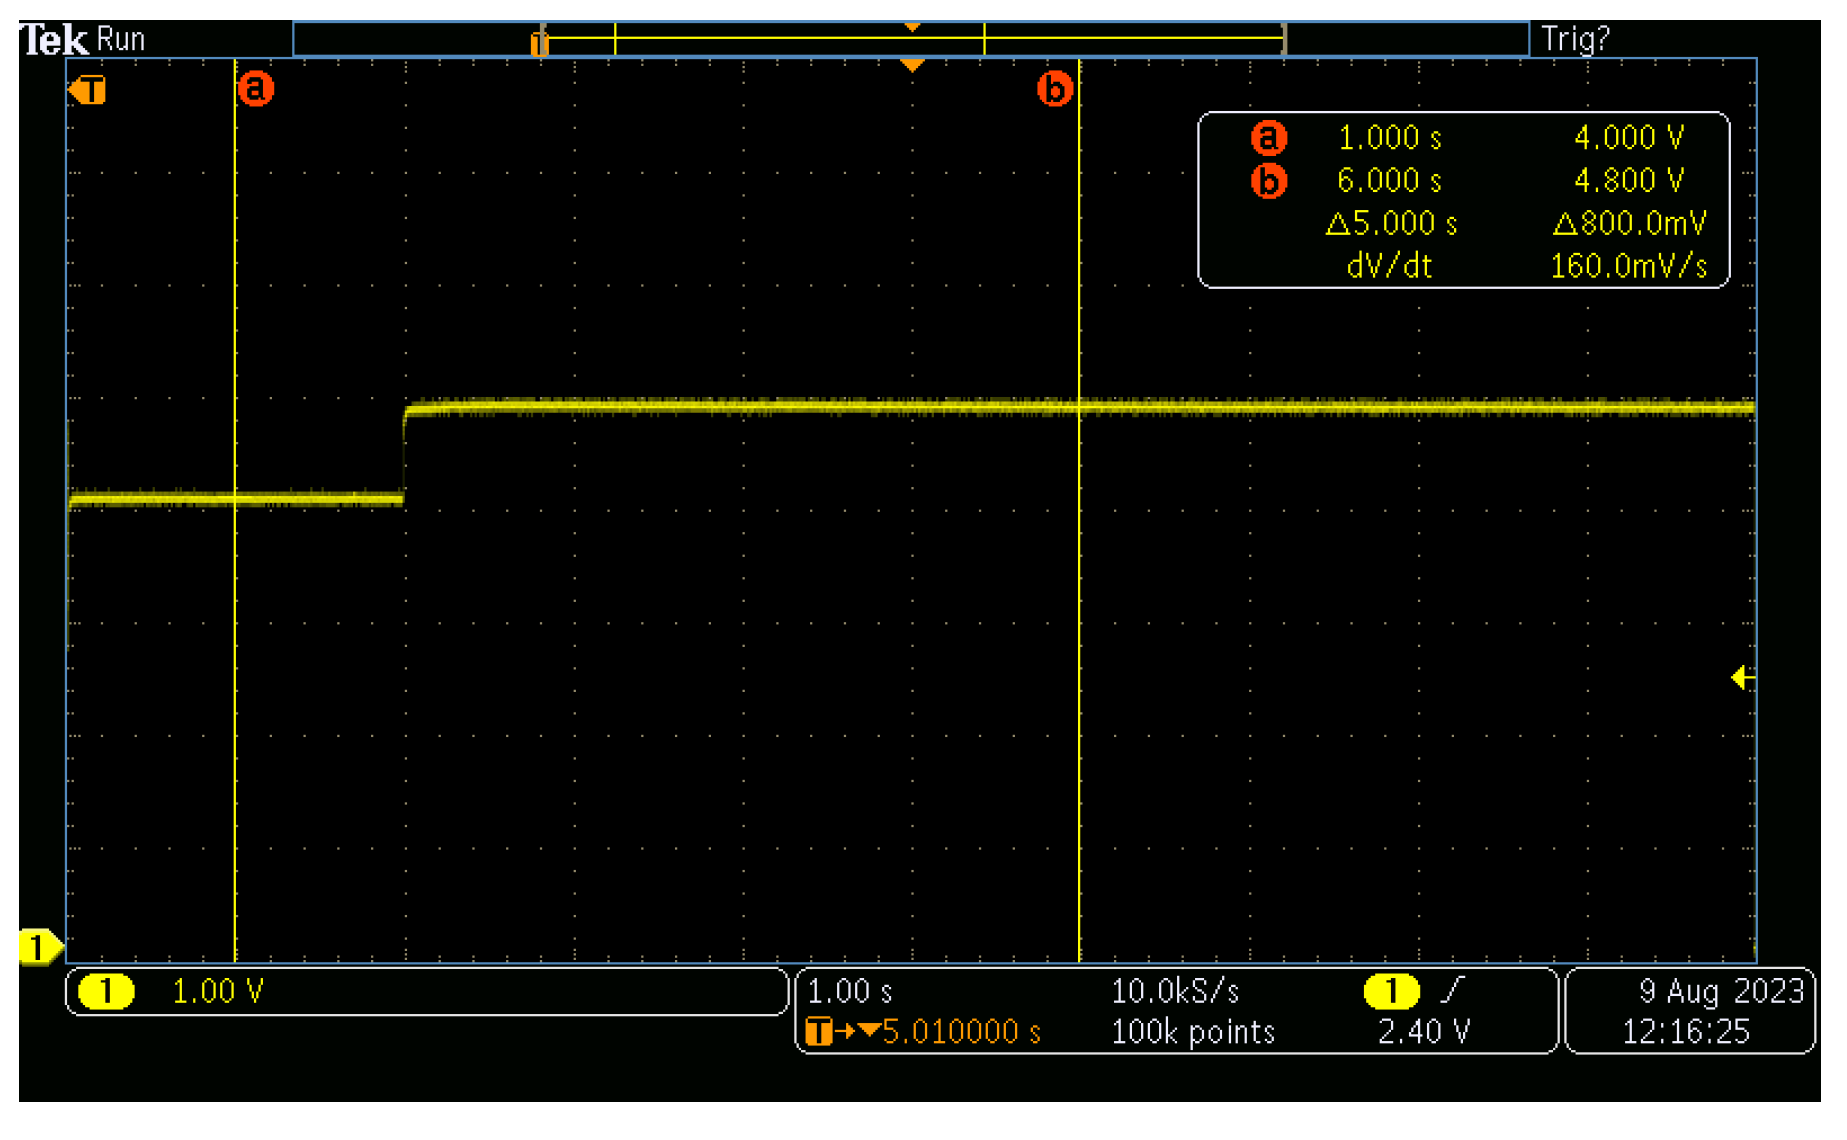
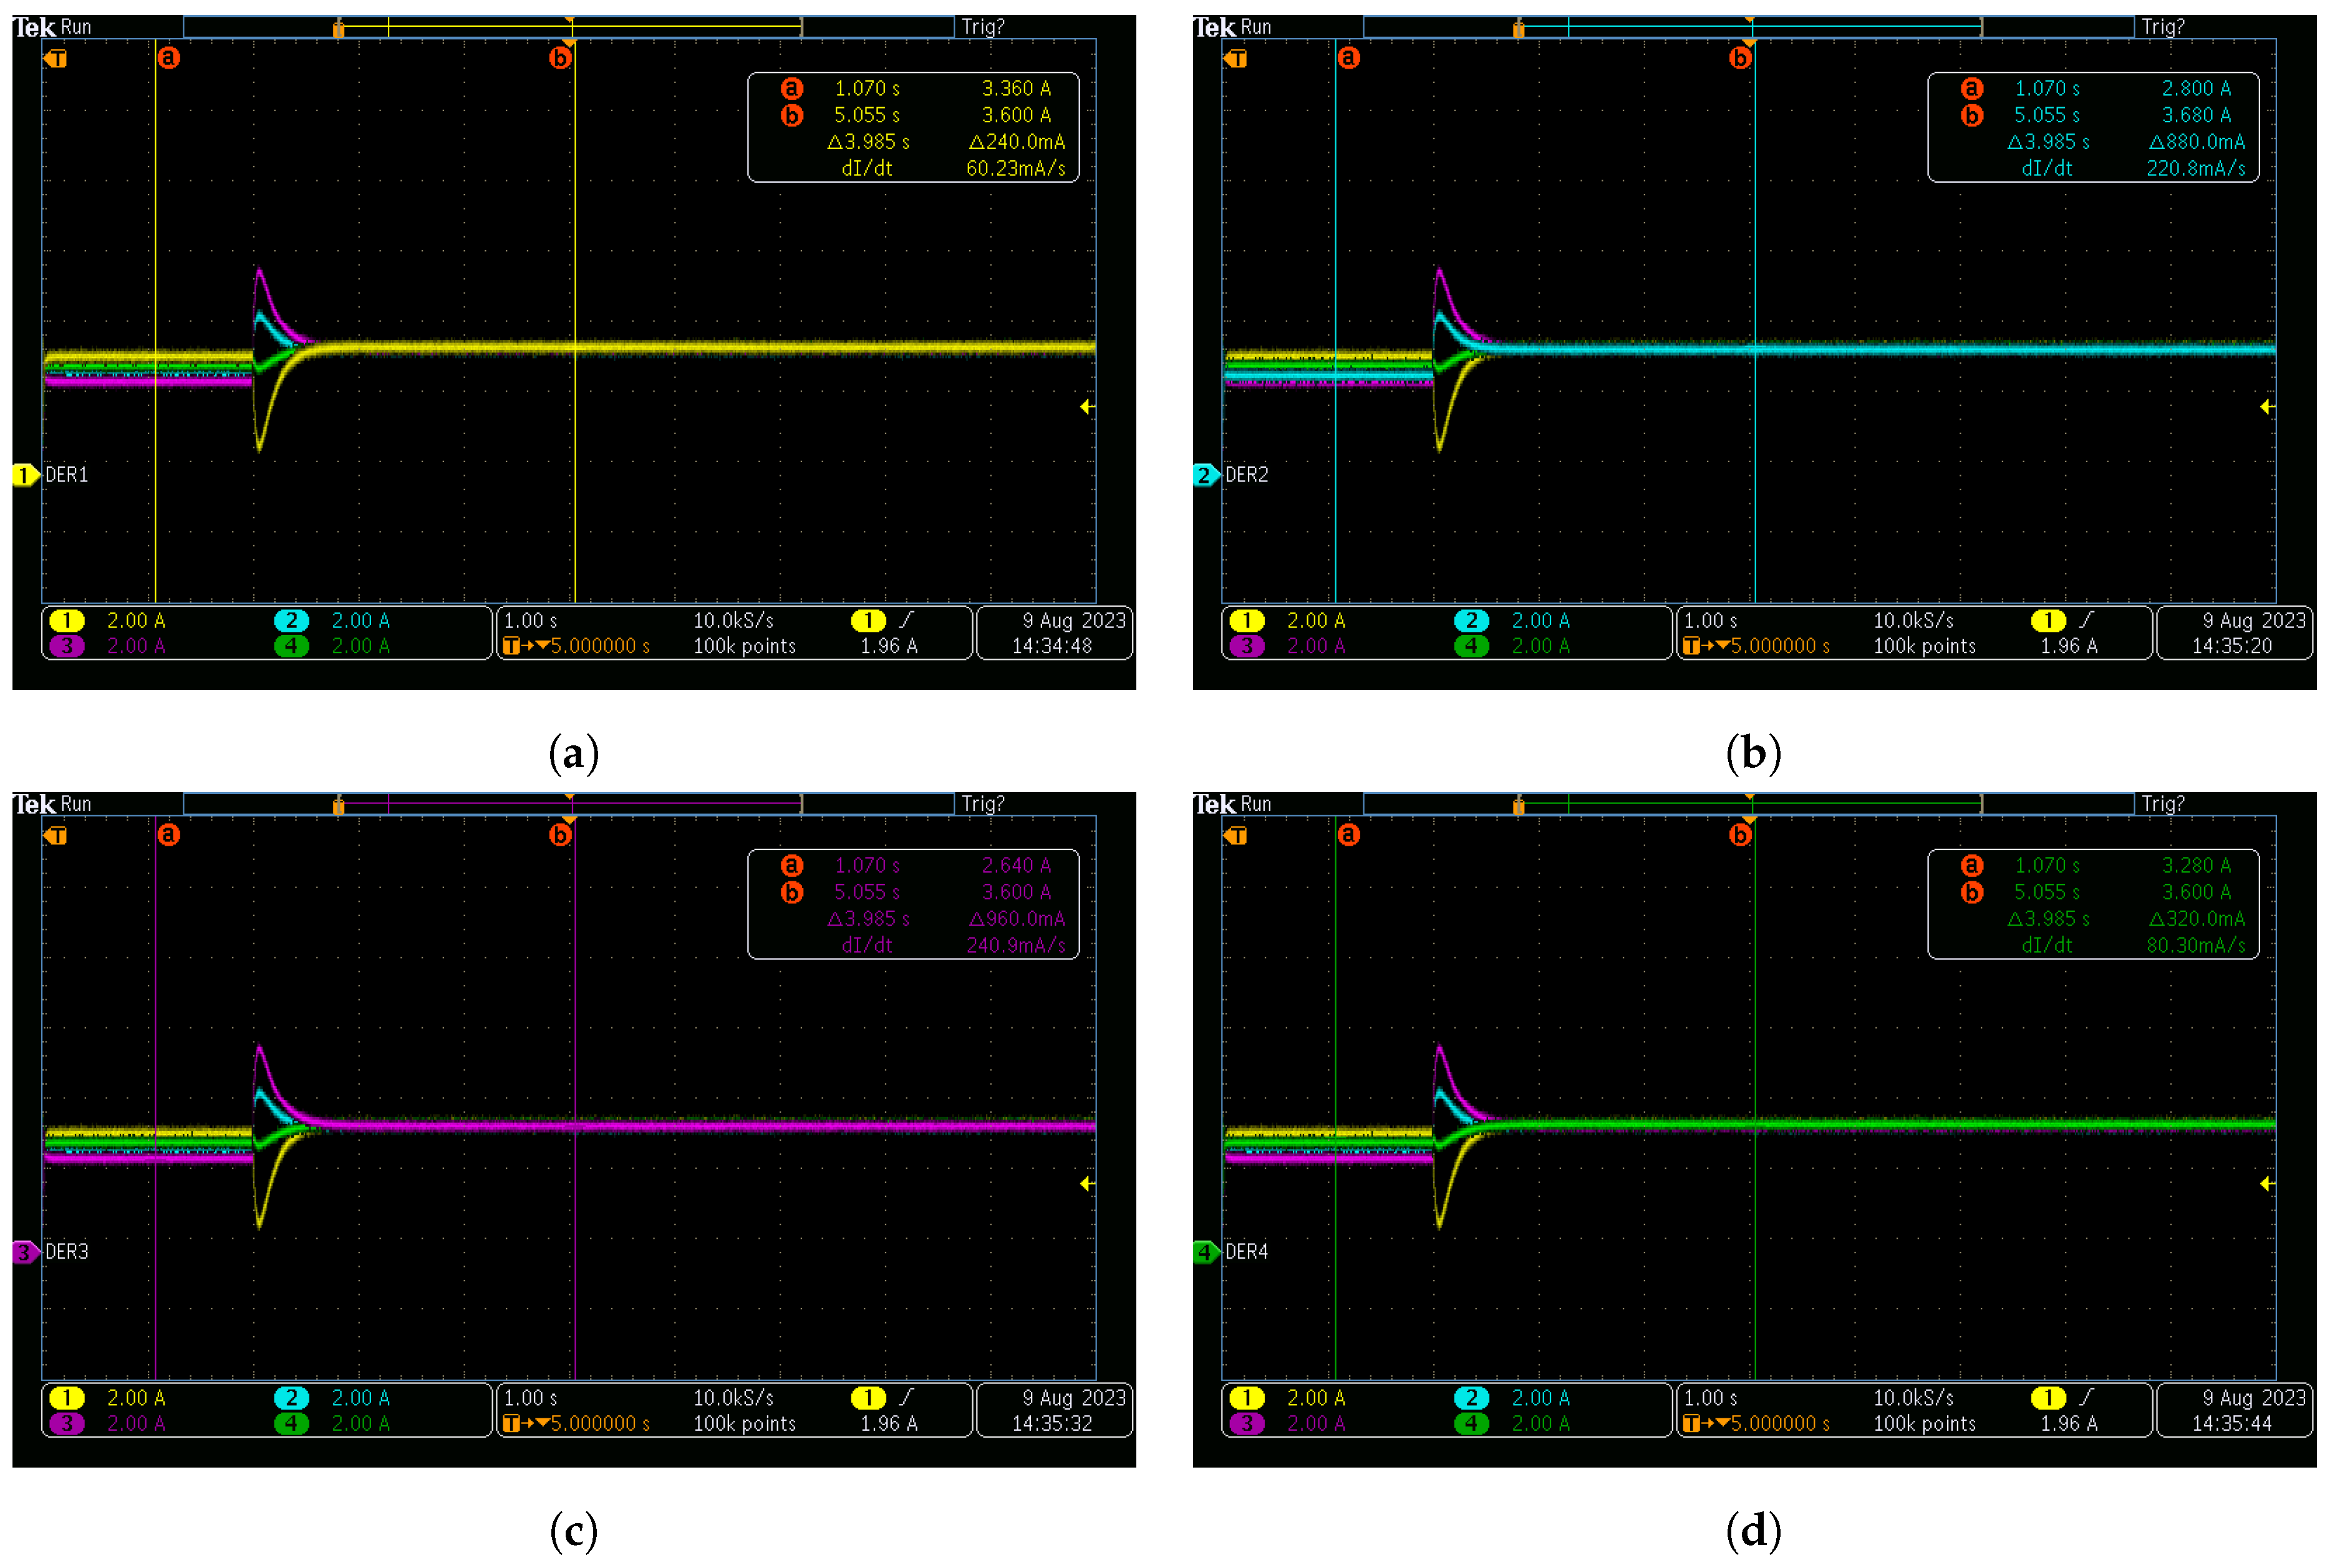
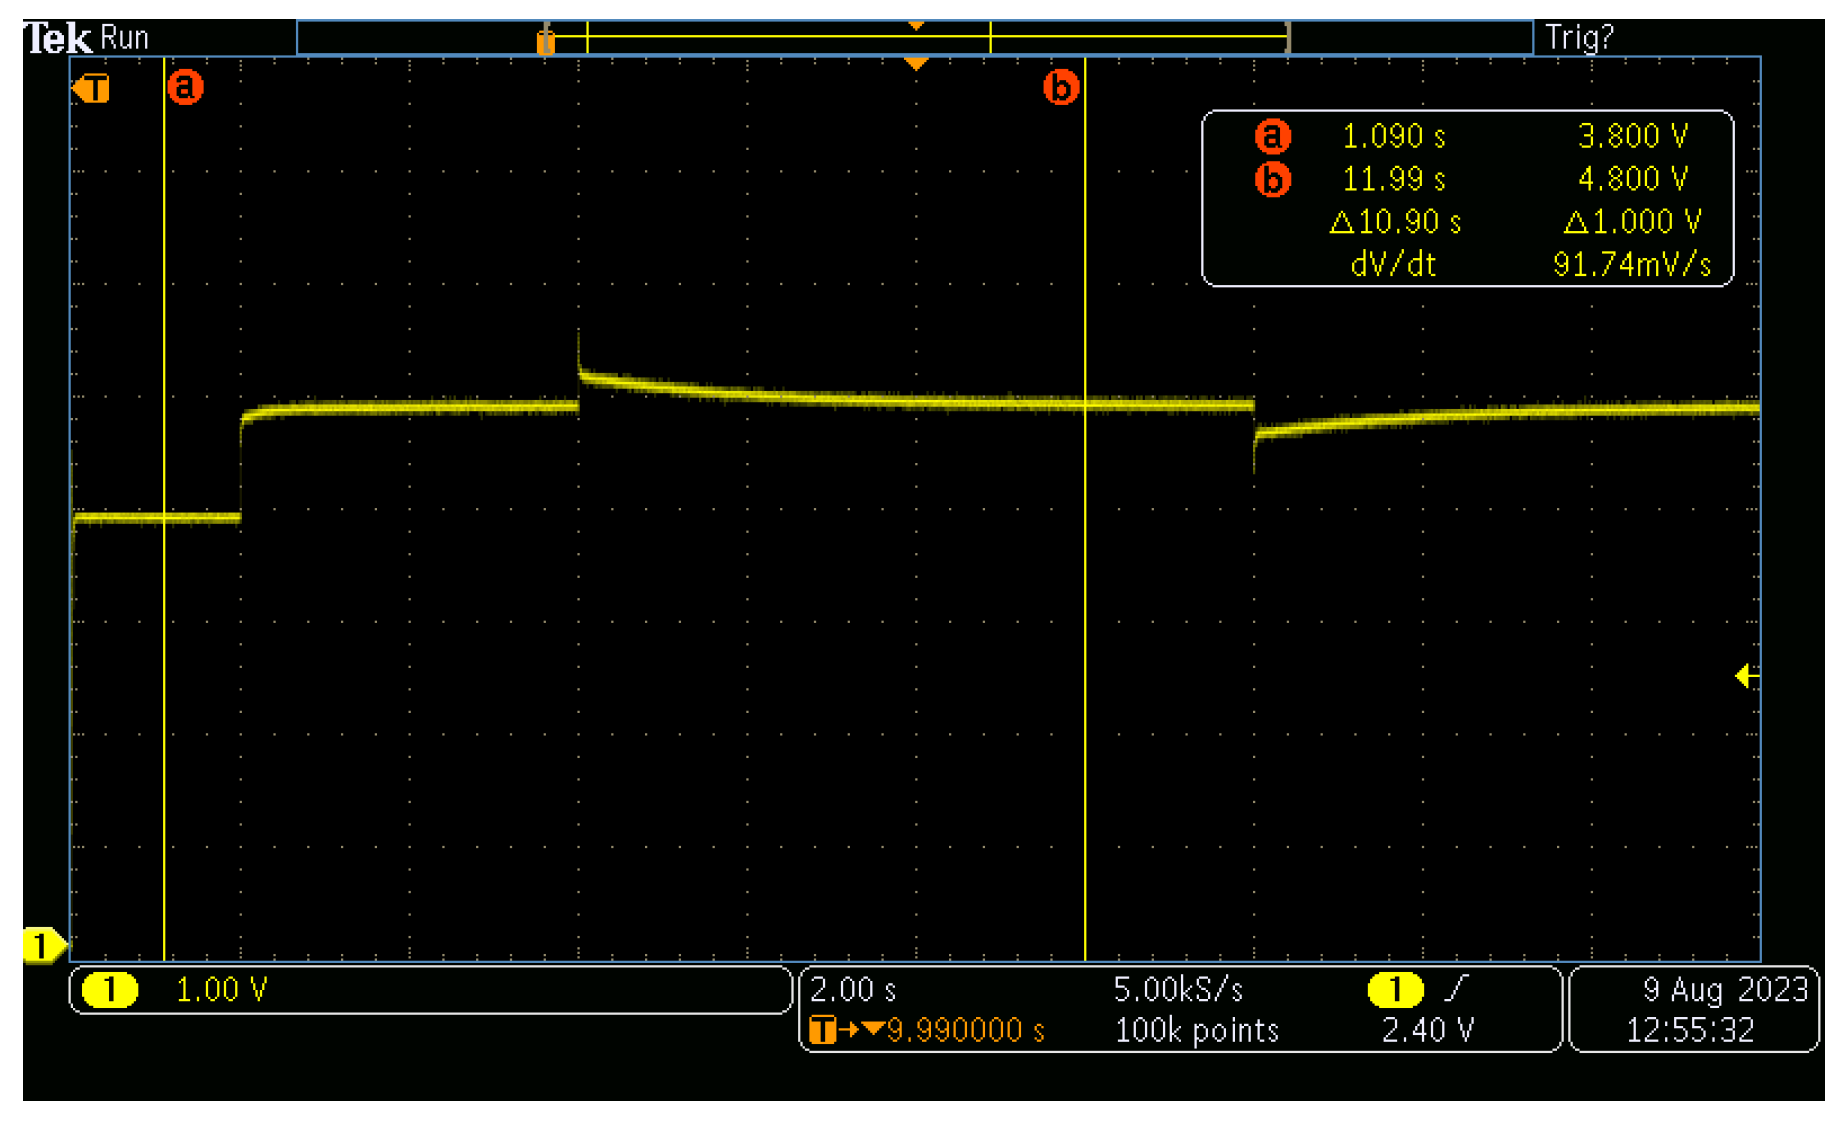
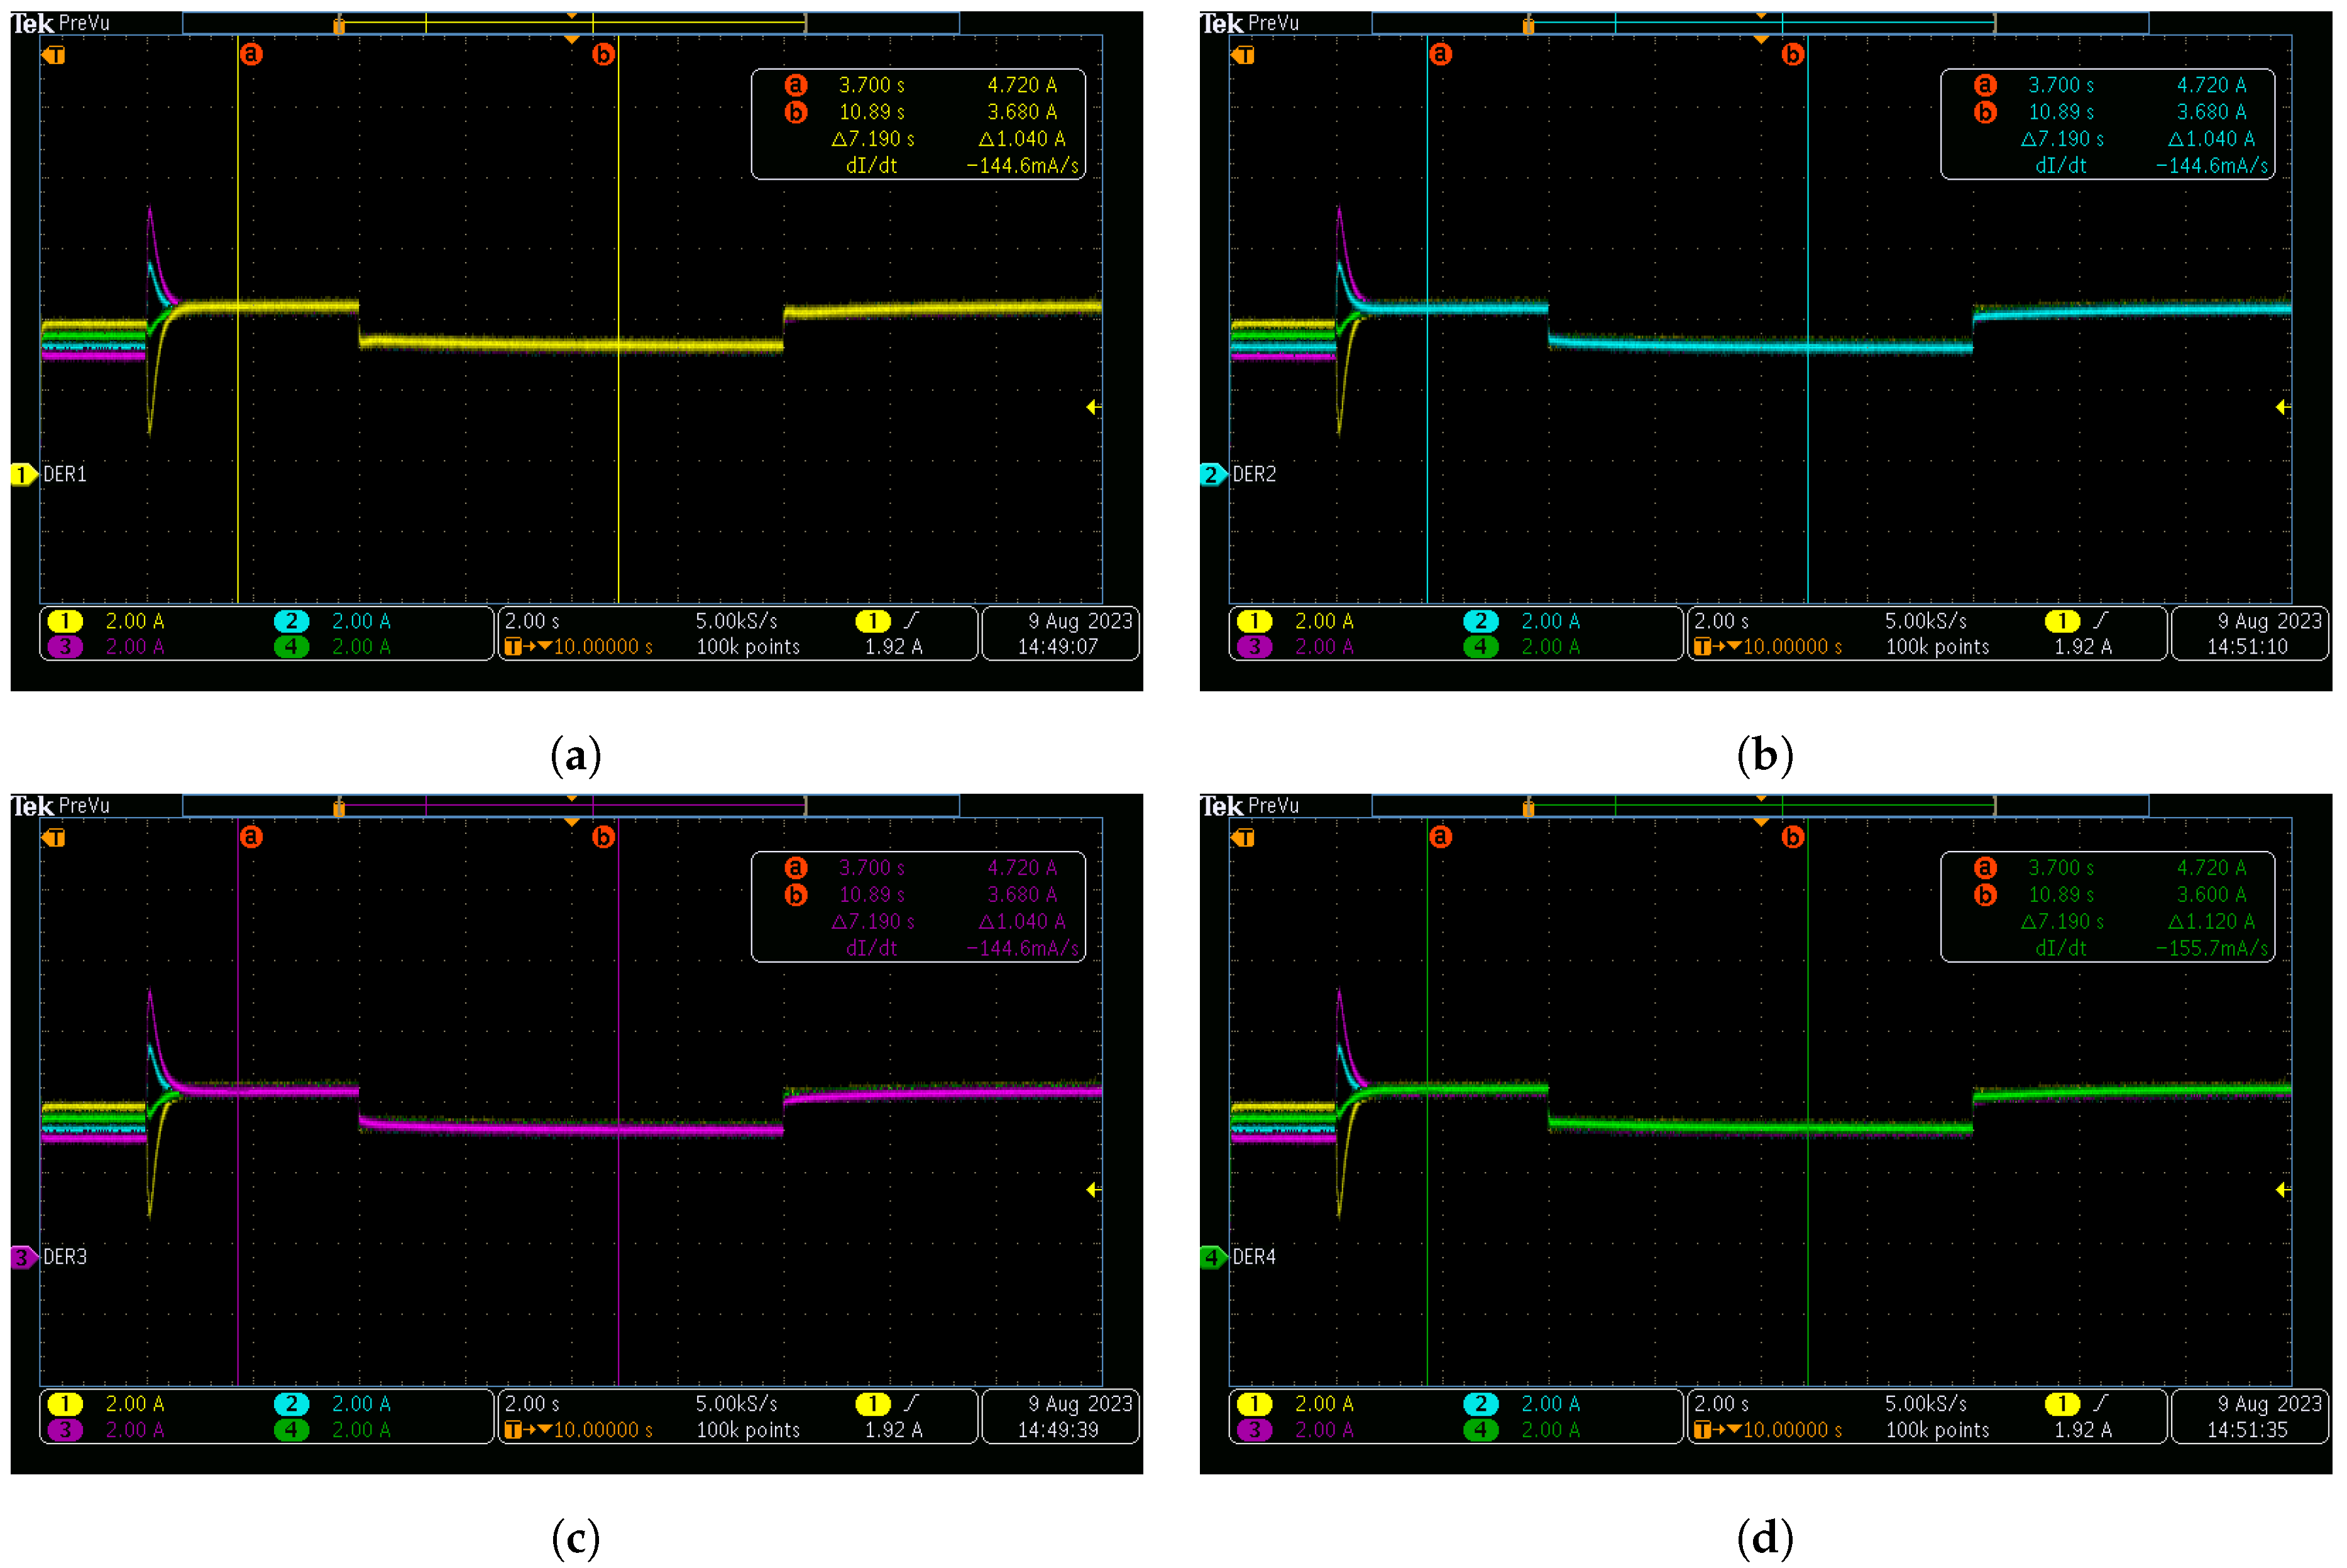
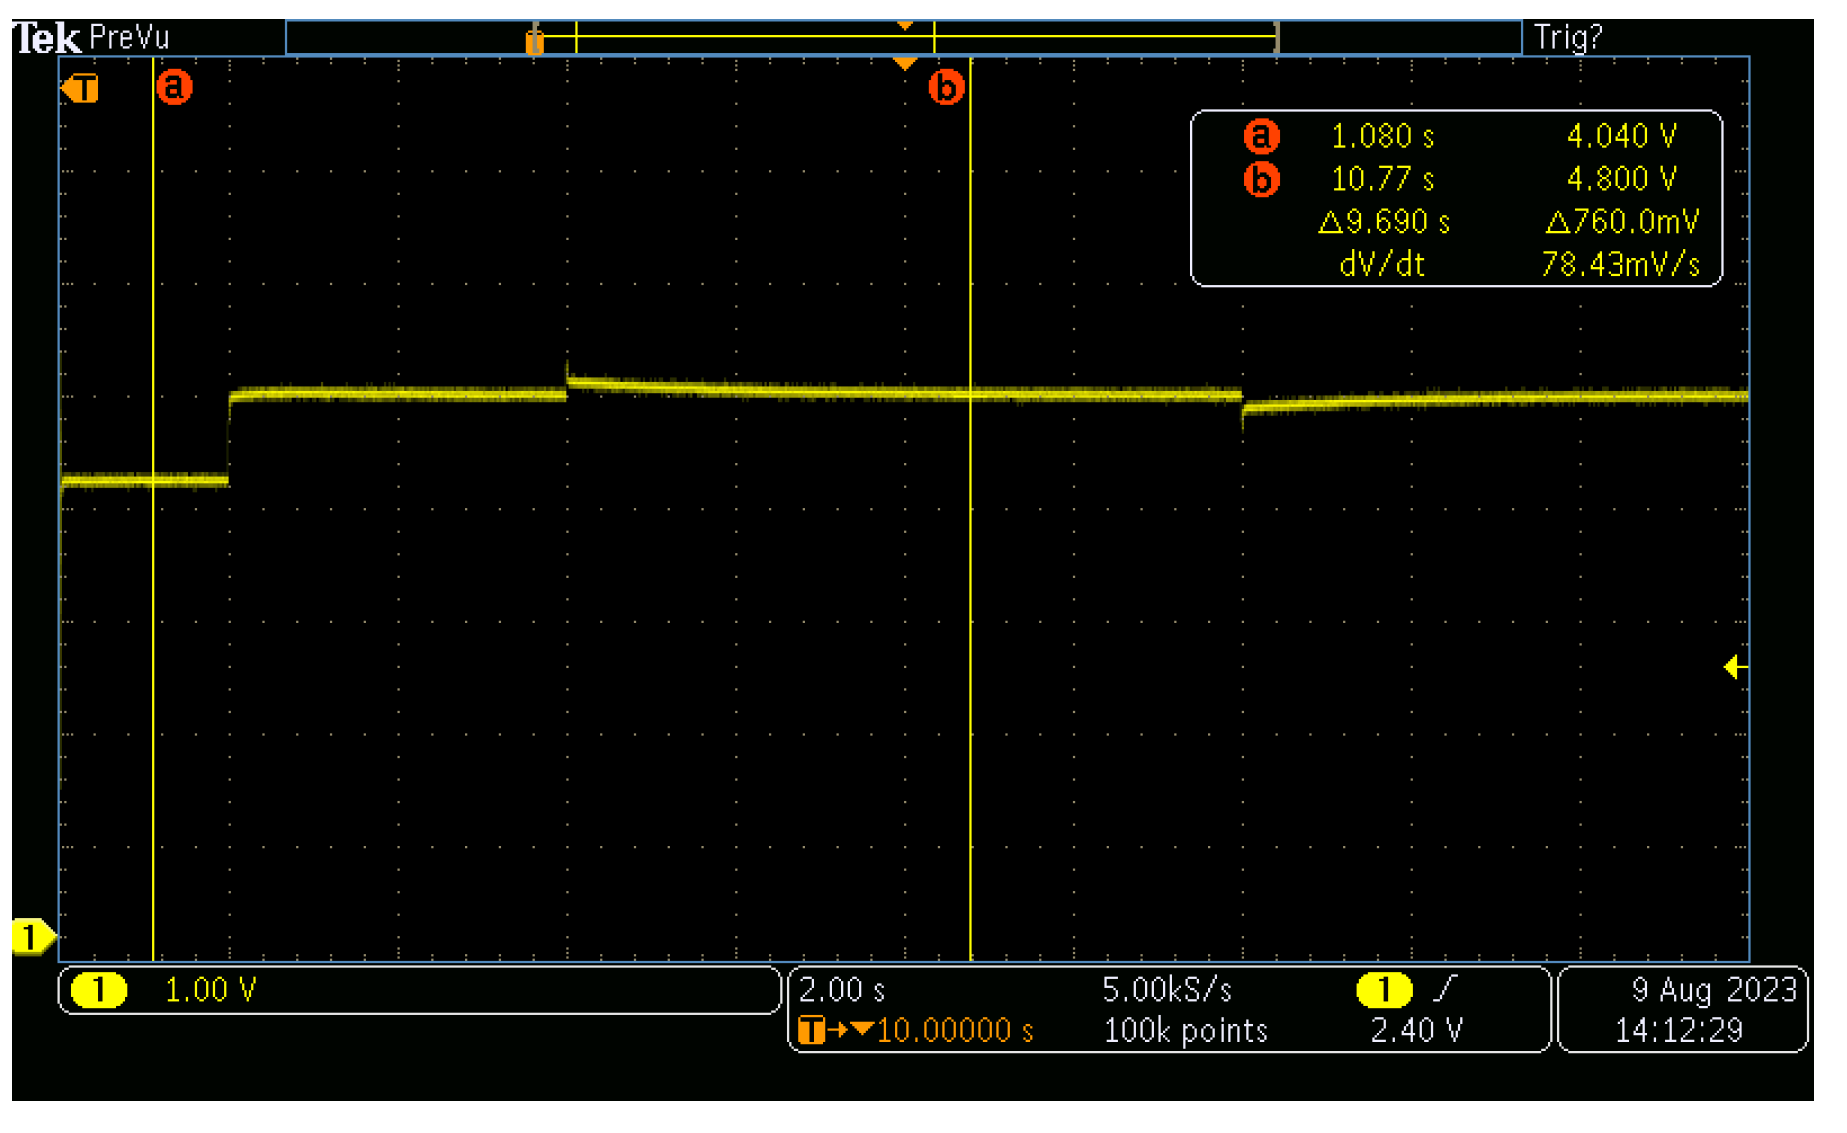
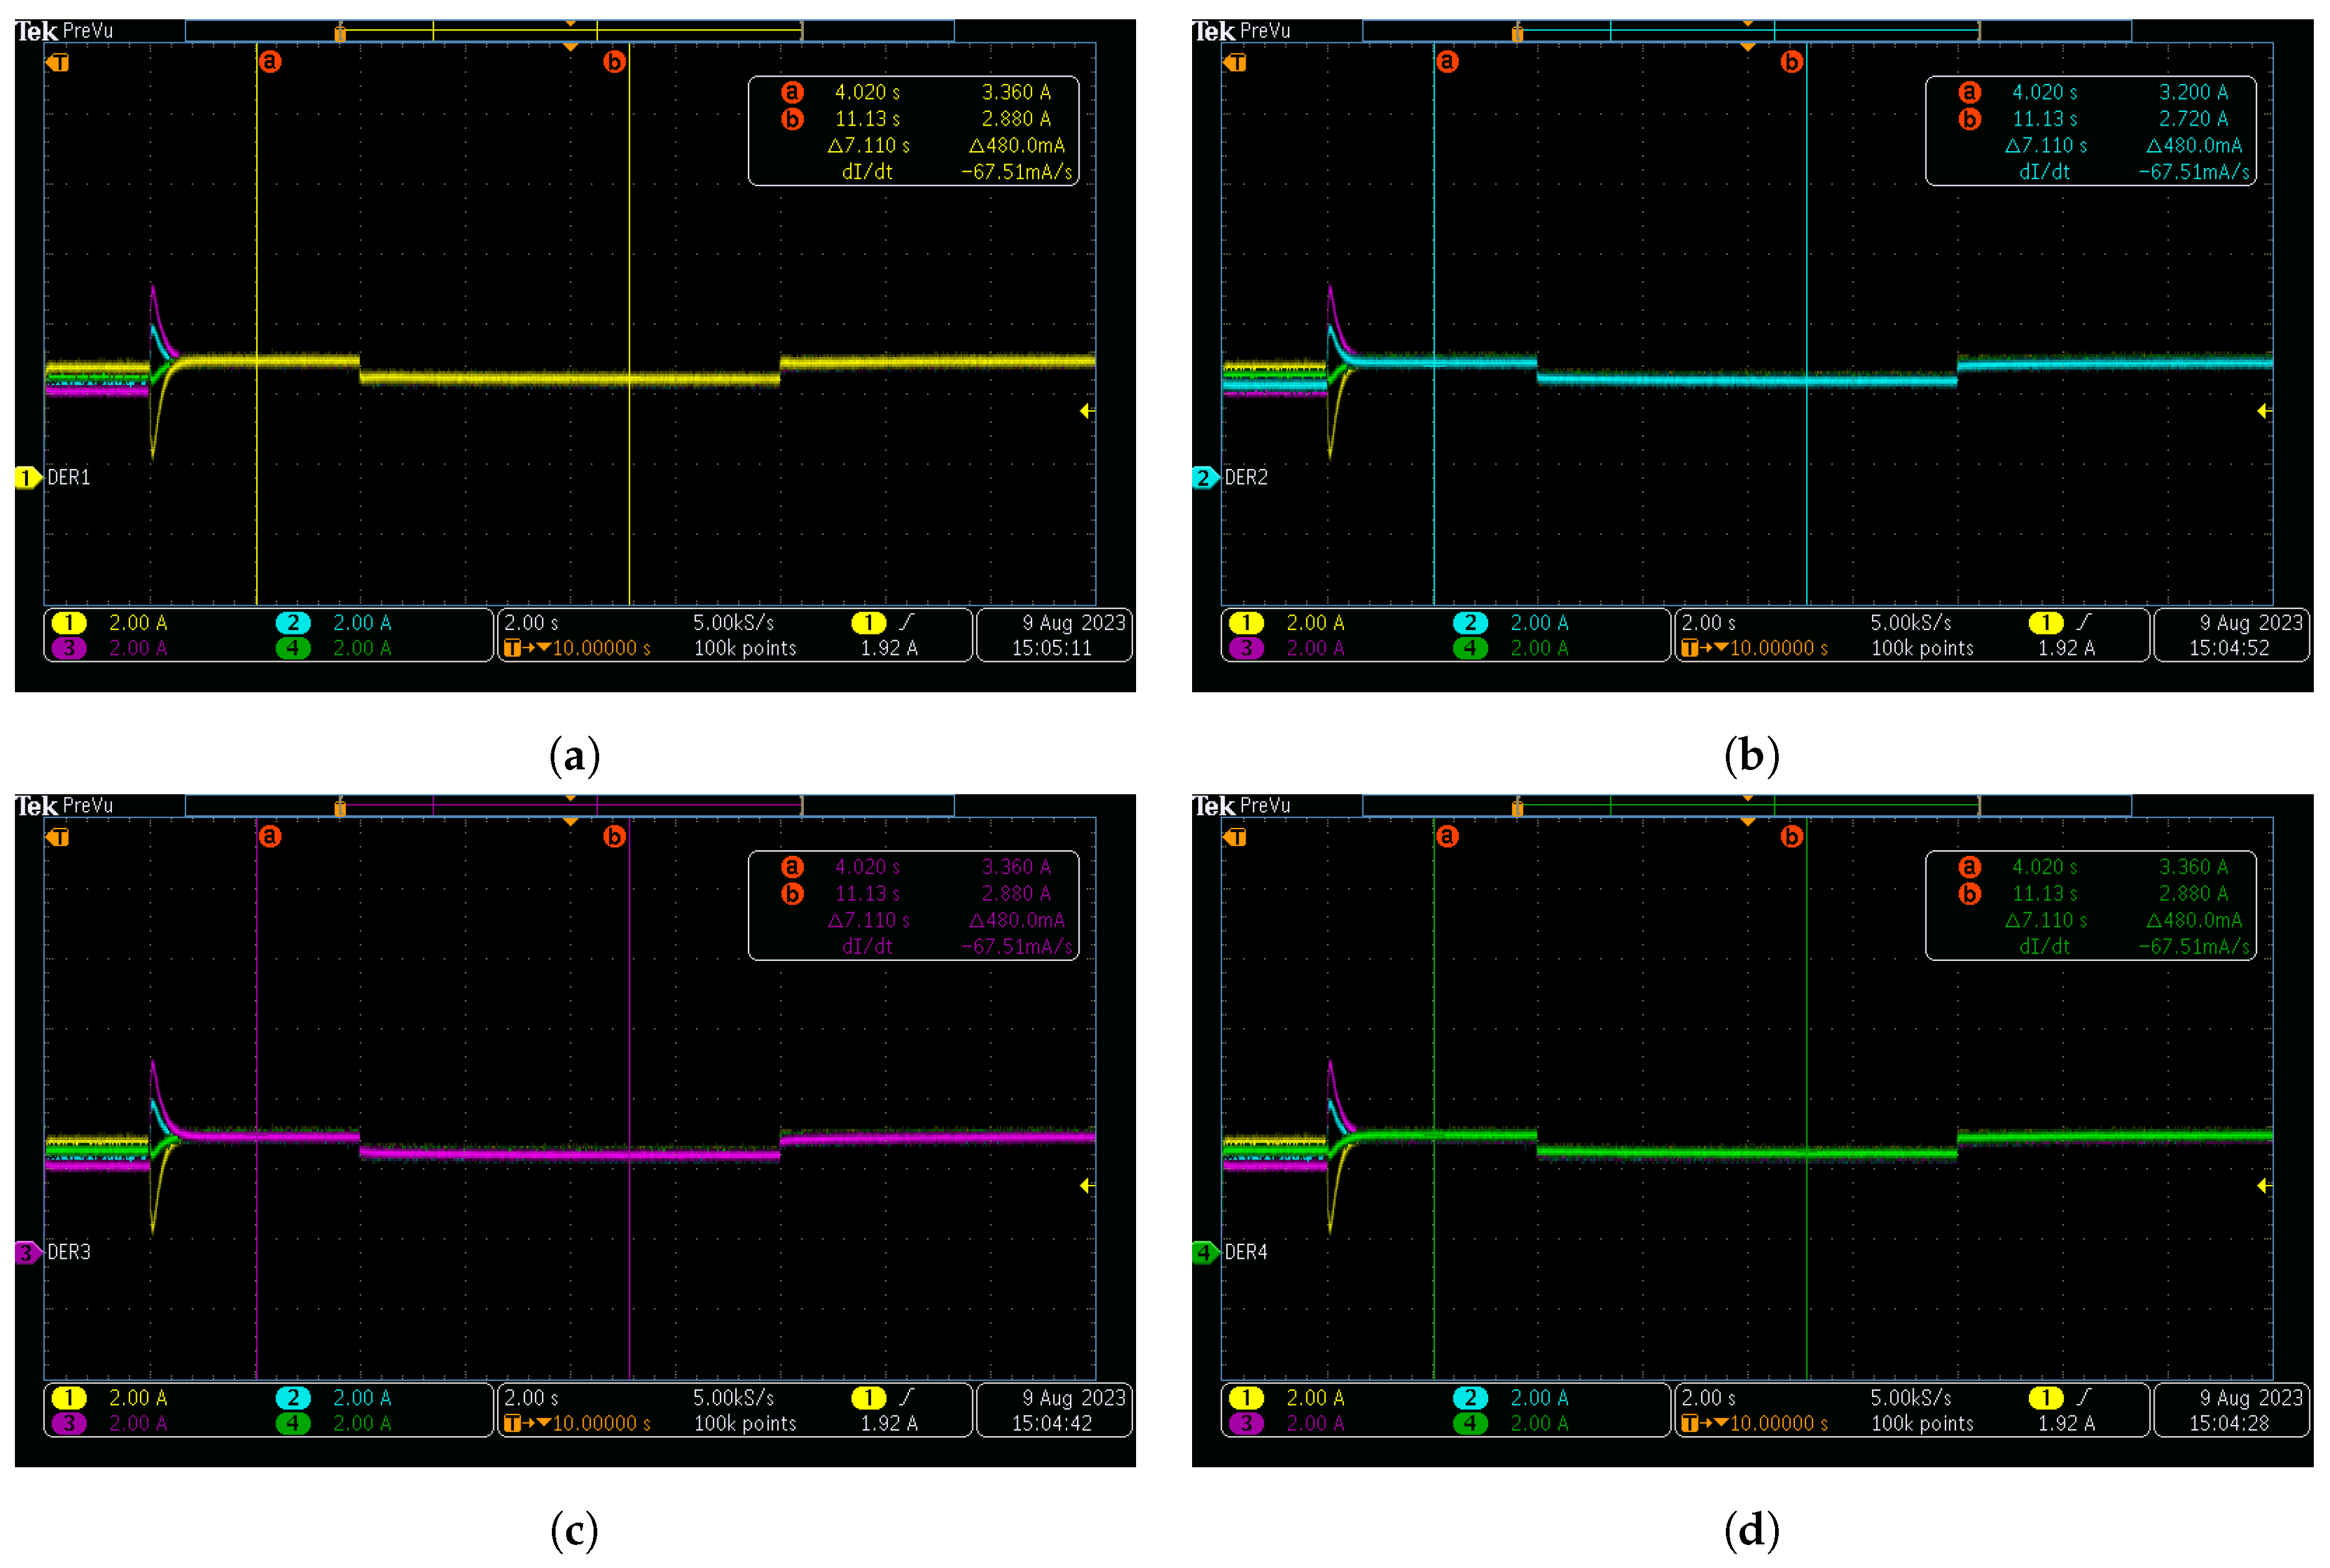
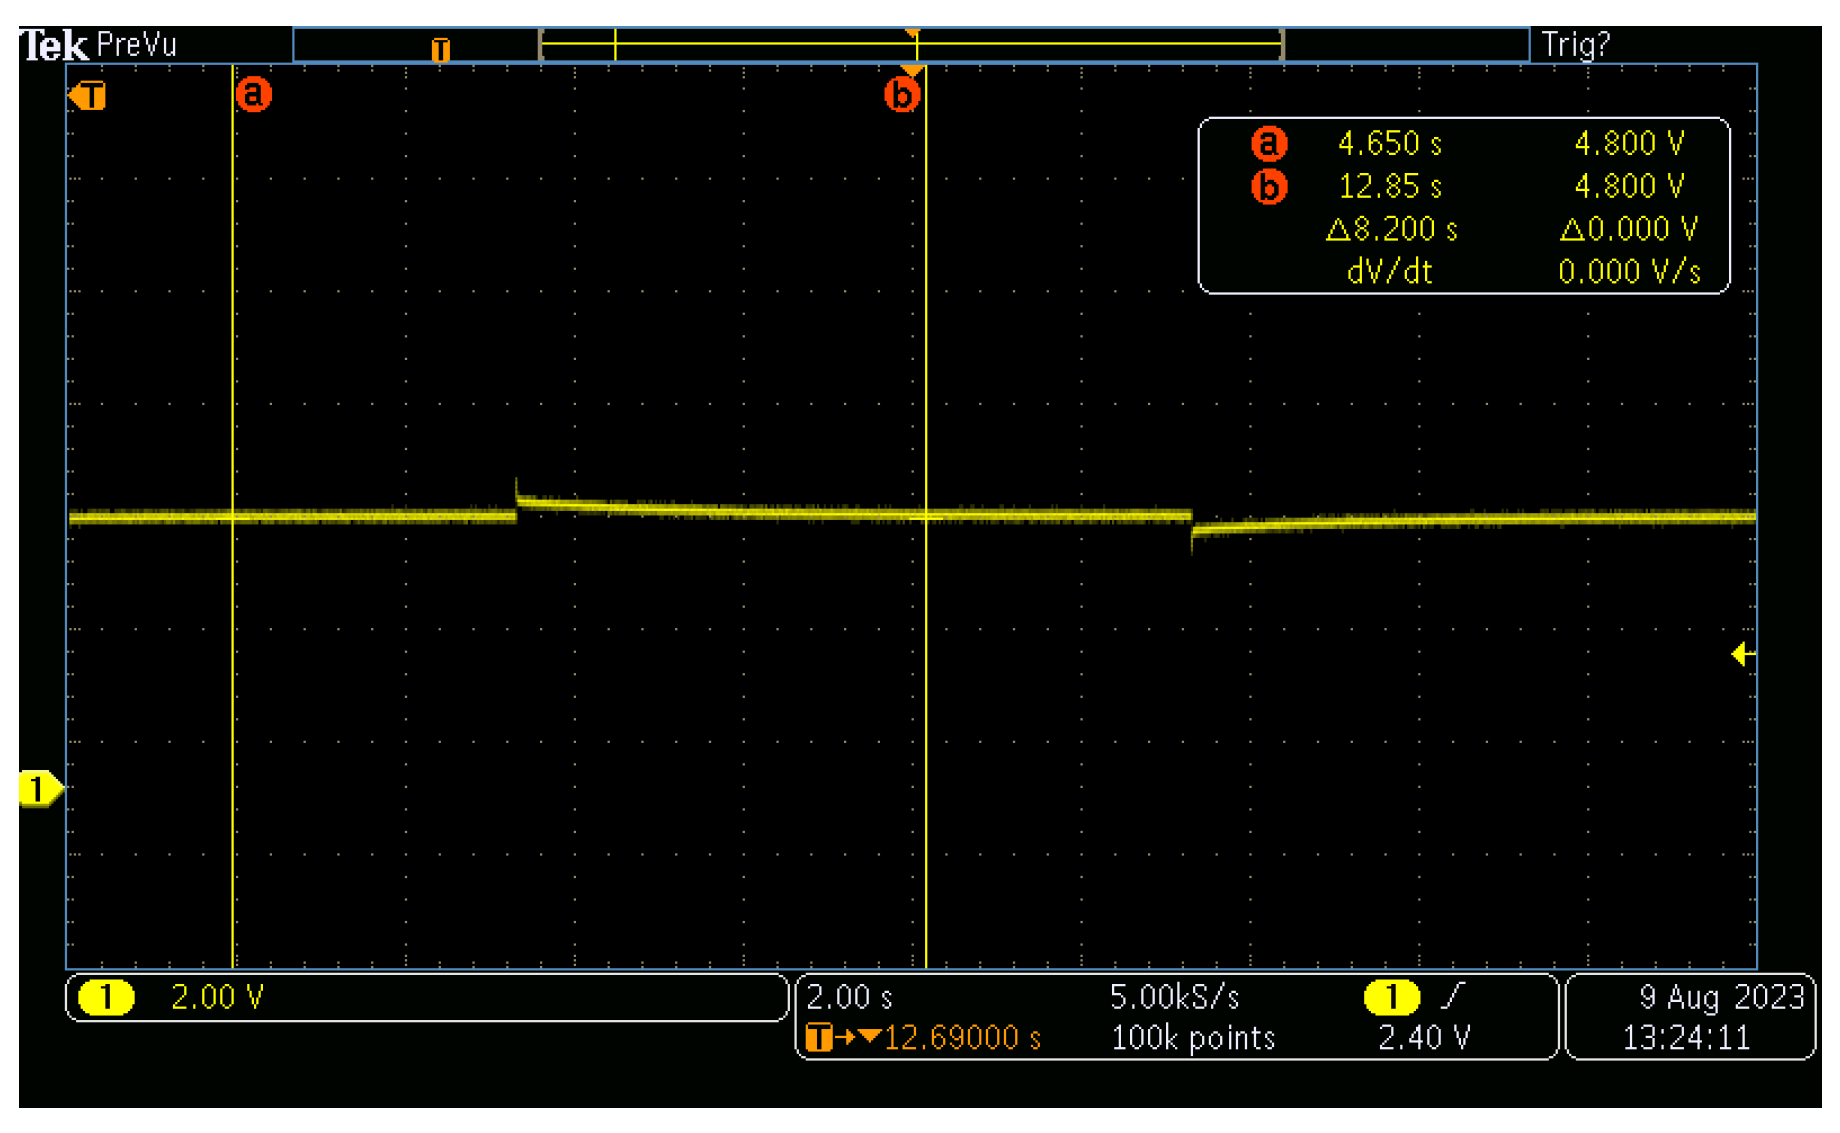
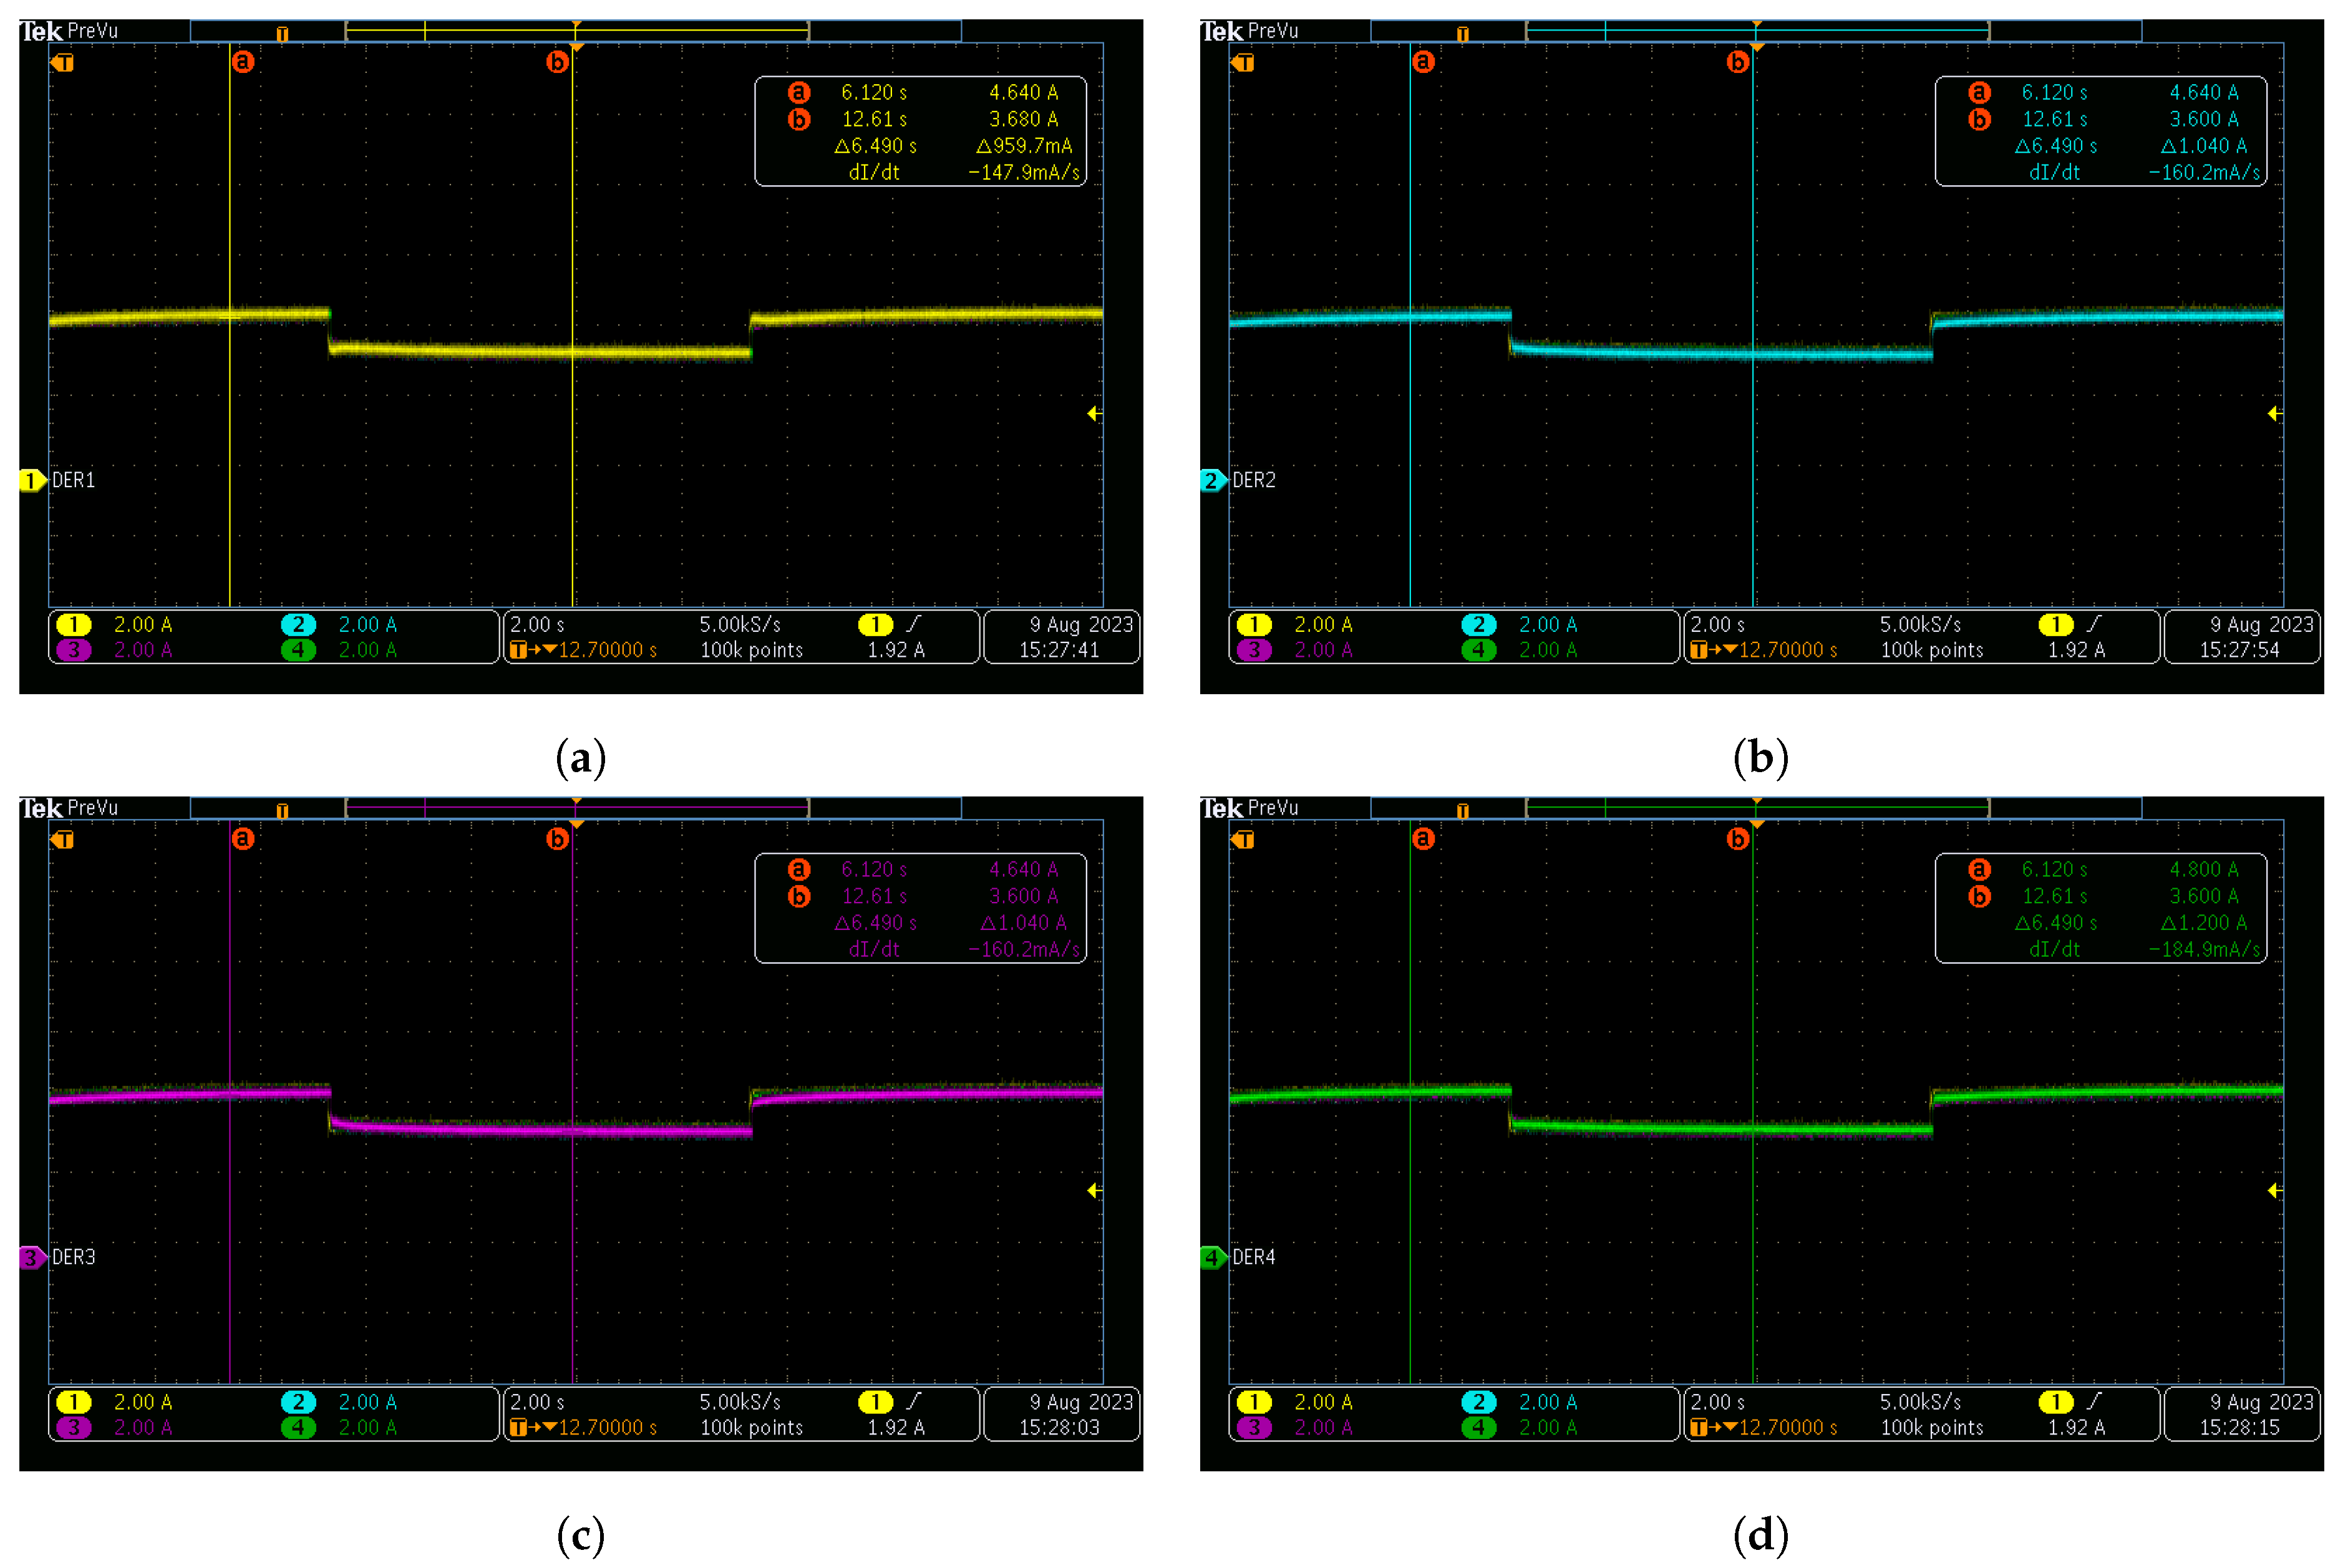
Disclaimer/Publisher’s Note: The statements, opinions and data contained in all publications are solely those of the individual author(s) and contributor(s) and not of MDPI and/or the editor(s). MDPI and/or the editor(s) disclaim responsibility for any injury to people or property resulting from any ideas, methods, instructions or products referred to in the content. |
© 2023 by the authors. Licensee MDPI, Basel, Switzerland. This article is an open access article distributed under the terms and conditions of the Creative Commons Attribution (CC BY) license (https://creativecommons.org/licenses/by/4.0/).