Article

Study of Supercritical State Characteristics of Miscible CO2 Used in the Flooding Process

1
Research Institute of Petroleum Exploration and Development, PetroChina Company Limited, Beijing 100083, China
2
State Key Laboratory of Enhanced Oil Recovery, PetroChina Company Limited, Beijing 100083, China
3
Jidong Oilfield of PetroChina, Tangshan 063000, China
4
State Key Laboratory of Heavy Oil Processing, China University of Petroleum, Beijing 102249, China
*
Author to whom correspondence should be addressed.
Energies 2023, 16(18), 6693; https://doi.org/10.3390/en16186693
Submission received: 13 August 2023 / Revised: 30 August 2023 / Accepted: 15 September 2023 / Published: 18 September 2023
(This article belongs to the Section H: Geo-Energy)

Abstract

:
Carbon dioxide flooding is a strategic replacement technology for greatly enhancing oil recovery in low-permeability oilfields, which includes social benefits resulting from carbon emission reduction and economic benefits owing to the improvement of oil recovery. Therefore, it is of great significance to develop and apply the technology of CO2 flooding and storage in the petroleum industry. In reservoir conditions, CO2 is usually under a supercritical state, presenting both low viscosity and high diffusivity of a gaseous state and high density of a liquid state. The special phase behavior of CO2 directly affects its extraction capacity, resulting in the change of miscible behavior between CO2 and crude oil. In this paper, the ultra-high-pressure–high-temperature pressure–volume–temperature (PVT) system was used to evaluate the phase characteristics of CO2 during the process of reservoir development. The phase behaviors of the CO2/CH4/N2 crude oil system were compared and analyzed. Moreover, the matching mechanism between supercritical CO2 characteristics and oil–gas system miscibility was investigated and defined. This work deepened the understanding of the phase characteristics of CO2 in the process of miscible flooding, providing both theoretical guidance for the application of CO2 injection on oilfields and the essential scientific basis for the implementation of CCUS-EOR technology.

1. Introduction

Under the circumstances of global warming and climate change, carbon capture, utilization and storage (CCUS) technology has gradually been recognized as a technology that shows the most potential for reducing carbon emissions worldwide [1,2,3,4,5]. The technology of carbon dioxide capture, storage and enhanced oil recovery (CCS-EOR) has broad prospects due to the temperature and pressure of oil and gas reservoirs closing to those required for CO2 accumulation [6,7,8]. The conception of CCUS was proposed by China around 2005. Since then, more than 30 CO2 flooding and storage projects have been implemented [9,10,11,12]. In particular, a series of CCUS-EOR technology that is suitable for continental oil reservoirs was innovated and formed after 30 years of exploration and research in Jilin Oilfield. It is the first-ever Chinese industrial chain and a full-process CCUS-EOR demonstration project was carried out [13,14,15]. This project is not only the Chinese project among the 21 large-scale CCUS projects in operation in the world, but also the largest CCUS-EOR project in Asia [16]. Waterflooding is widely applied to many oilfields in China, but the technology of CO2 flooding can enhance oil recovery remarkably (about 10~15%), which is greatly beneficial for the oil industry [17]. At present, there are hundreds of pilot tests or commercial projects in the world that are implementing CO2 injection for enhancing oil recovery. The unique characteristics and remarkable solvation ability of supercritical CO2 make it a very promising EOR injection gas [18,19]. When the temperature and pressure are higher than its critical temperature and pressure, it lies in the supercritical region [20]. Compared with other types of gases, CO2 has a critical temperature of 31.1 °C and a critical pressure of 7.38 MPa. Hence, CO2 will be at a supercritical state under reservoir conditions while the buried depth of the corresponding reservoir is greater than 800 m with a normal pressure gradient and temperature gradient. At this condition, the density and diffusion coefficient will increase while the viscosity will decrease [20,21]. Currently, research on supercritical CO2 concentrate has focused on its drying and extraction properties. Few studies have been conducted on its phase behavior in detail.
To unveil the mechanisms of CO2 EOR, researchers have carried out various investigations on various aspects such as CO2 miscible flooding, solubilization expansion and swelling, extraction capacity and displacement efficiency. Cao et al. [22] carried out compositional numerical simulation and mathematical derivation to analyze the migration pattern of the miscible zone and its influence on the recovery factor. It was found that the increase of the sweep coefficient of the miscible zone is the key factor affecting the recovery efficiency of CO2 miscible flooding. Liu et al. [23] designed a high-temperature–high-pressure (HTHP) microscopic visualization experimental device to study the mechanism of CO2 huff-puff under HTHP conditions at microscopic scale. Su et al. [24] investigated the miscibility mechanism and change of physical properties of the gas–liquid phase behavior during a multi-contact process by establishing a one-dimensional numerical simulation method. Combined with the data of produced fluid from the Zhongyuan Oilfield, the dynamic parameters of miscible front and trailing edge, such as composition, density of gas and liquid and viscosity, were studied to determine the main miscibility factors between CO2 and crude oil. In addition, numerous scholars have studied the effects of different injection gases on the properties of oil under high pressure [25,26,27].
However, few researchers have focused on the phase behavior of the injected gas–oil system at a supercritical state, the quantitative analysis of the dynamic process of mass transfer between injection gas and oil or the ability of the injection gas to extract key components of the oil. In this paper, the phase characteristics of CO2 during the process of reservoir development were evaluated systematically. The mass transfer capacity and the change of phase characteristics of CO2/CH4/N2–crude oil systems were analyzed. The influence of different injection gases on the oil–gas mass transfer process was clarified. This work provides not only the theoretical guidance for the injection strategy of miscible flooding and the adjustment of composition of injection gas, but also a new way for reducing the minimum miscible pressure of gas flooding under reservoir conditions.

2. Experimental Equipment and Methods

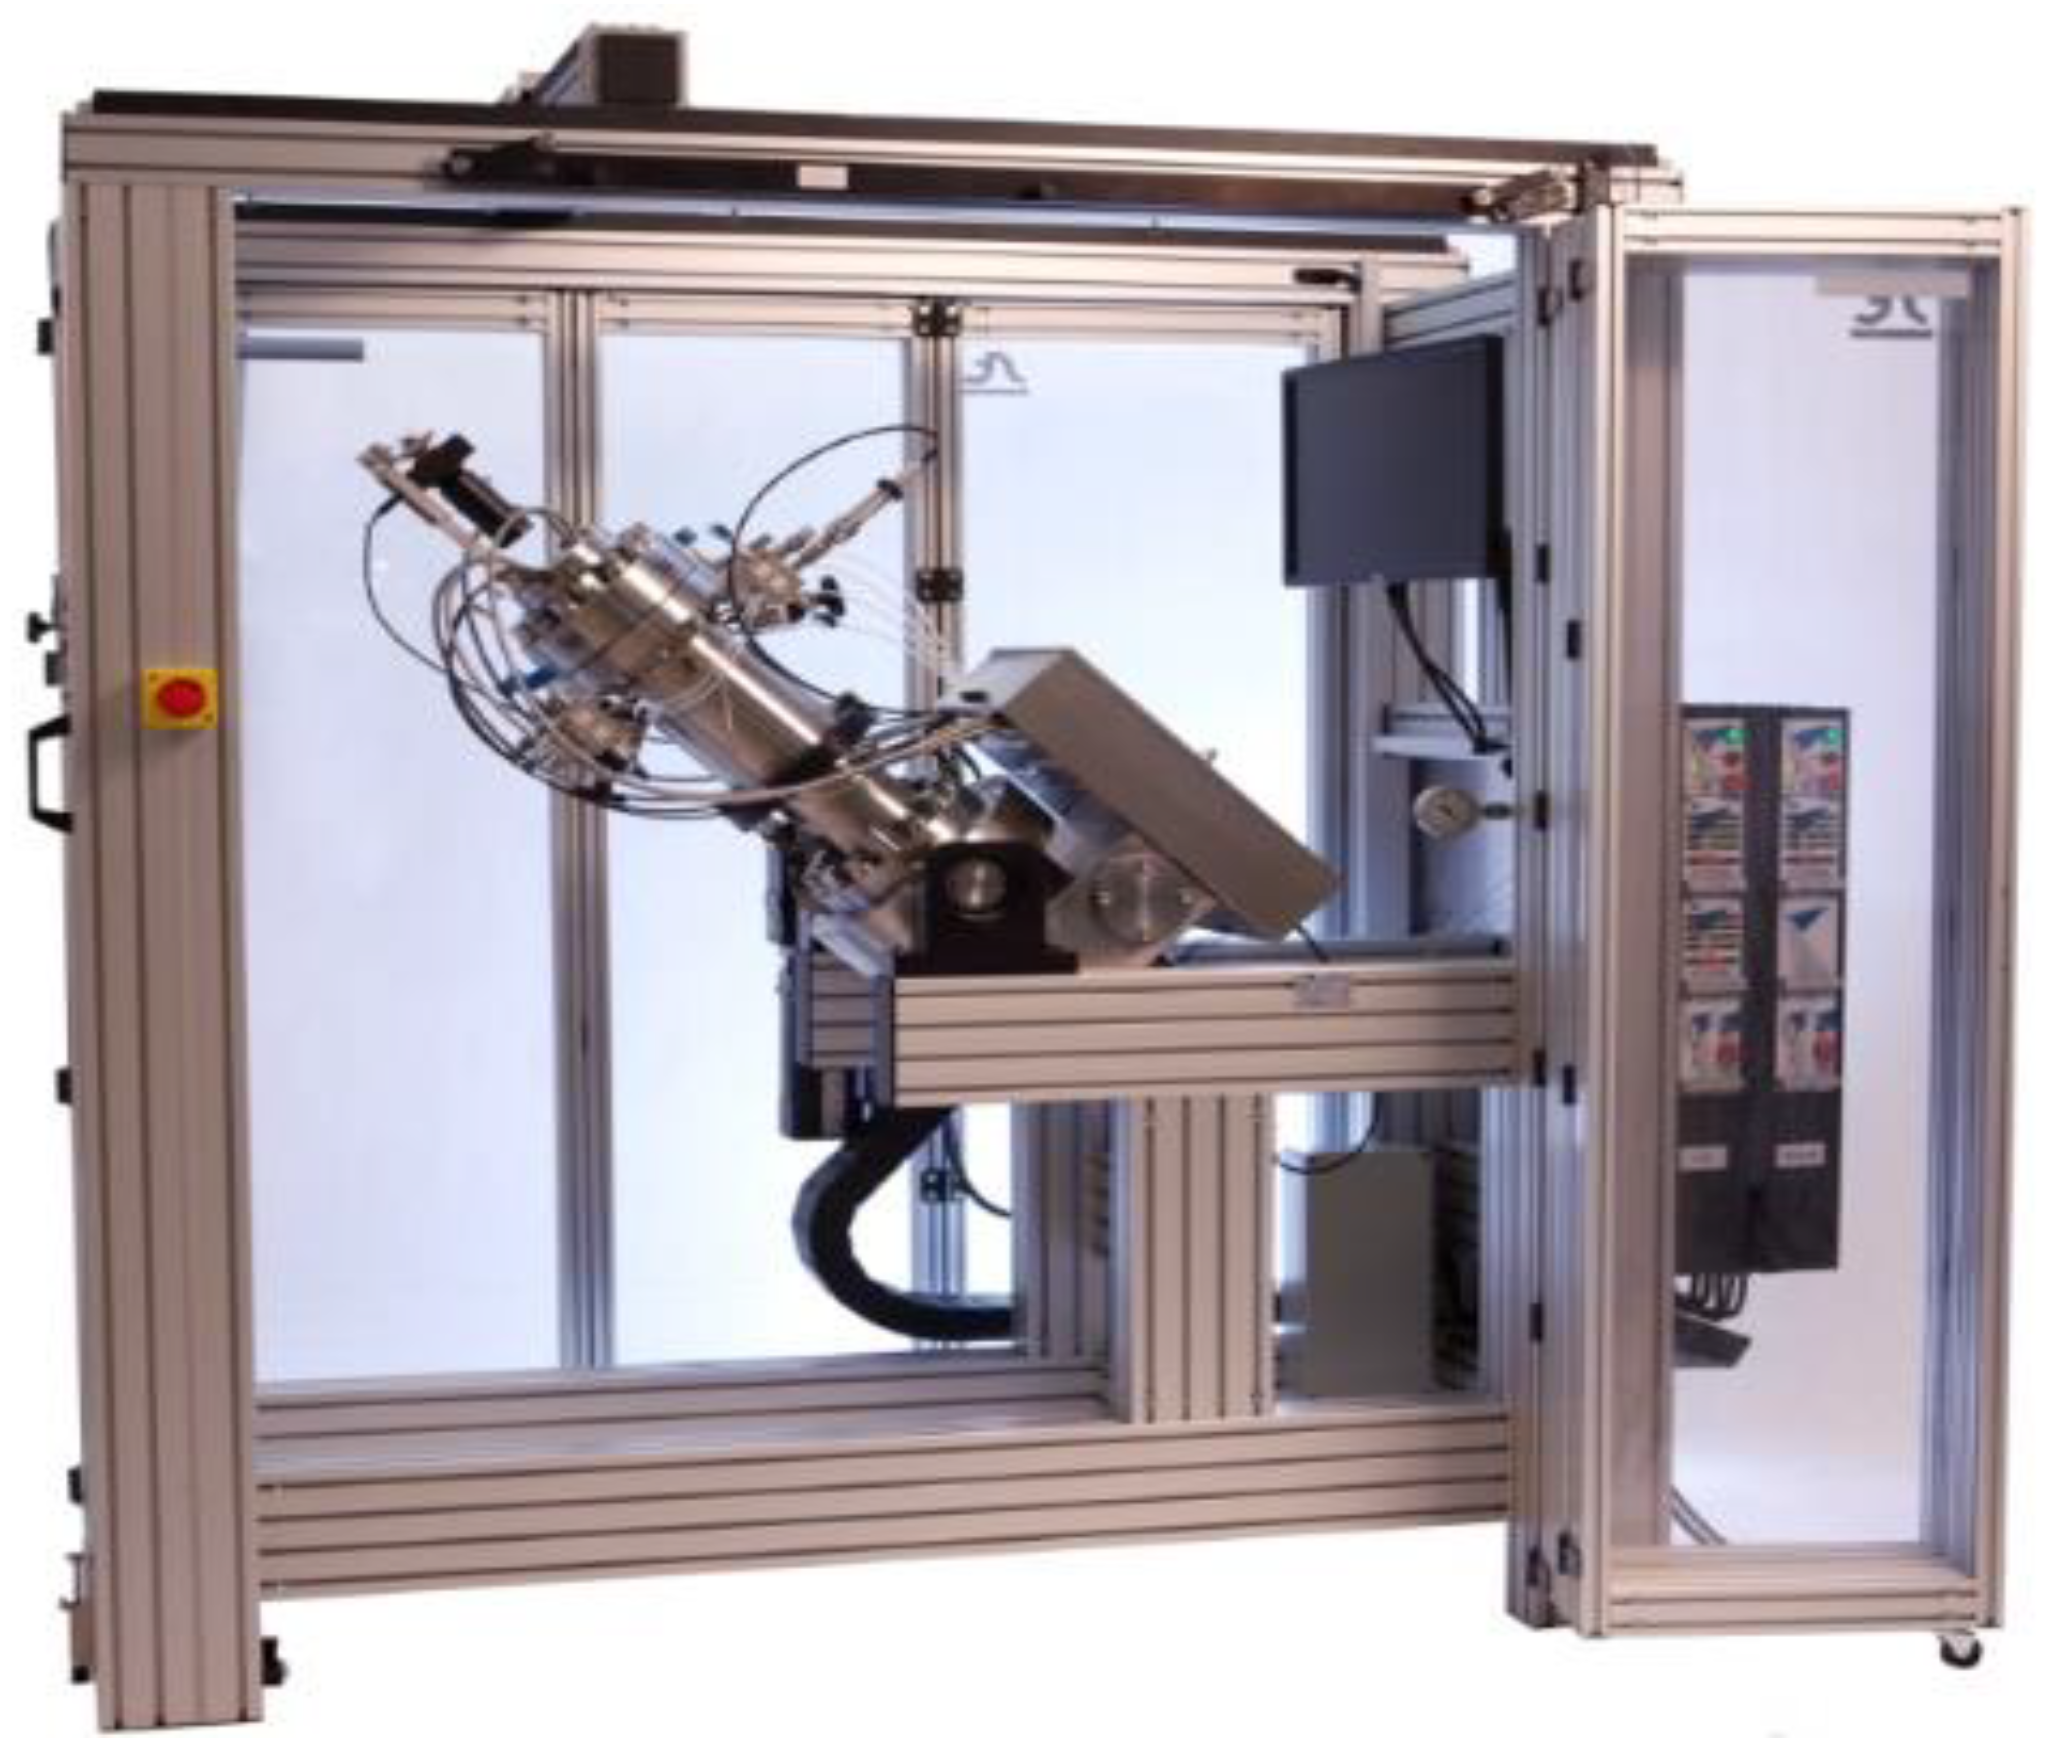
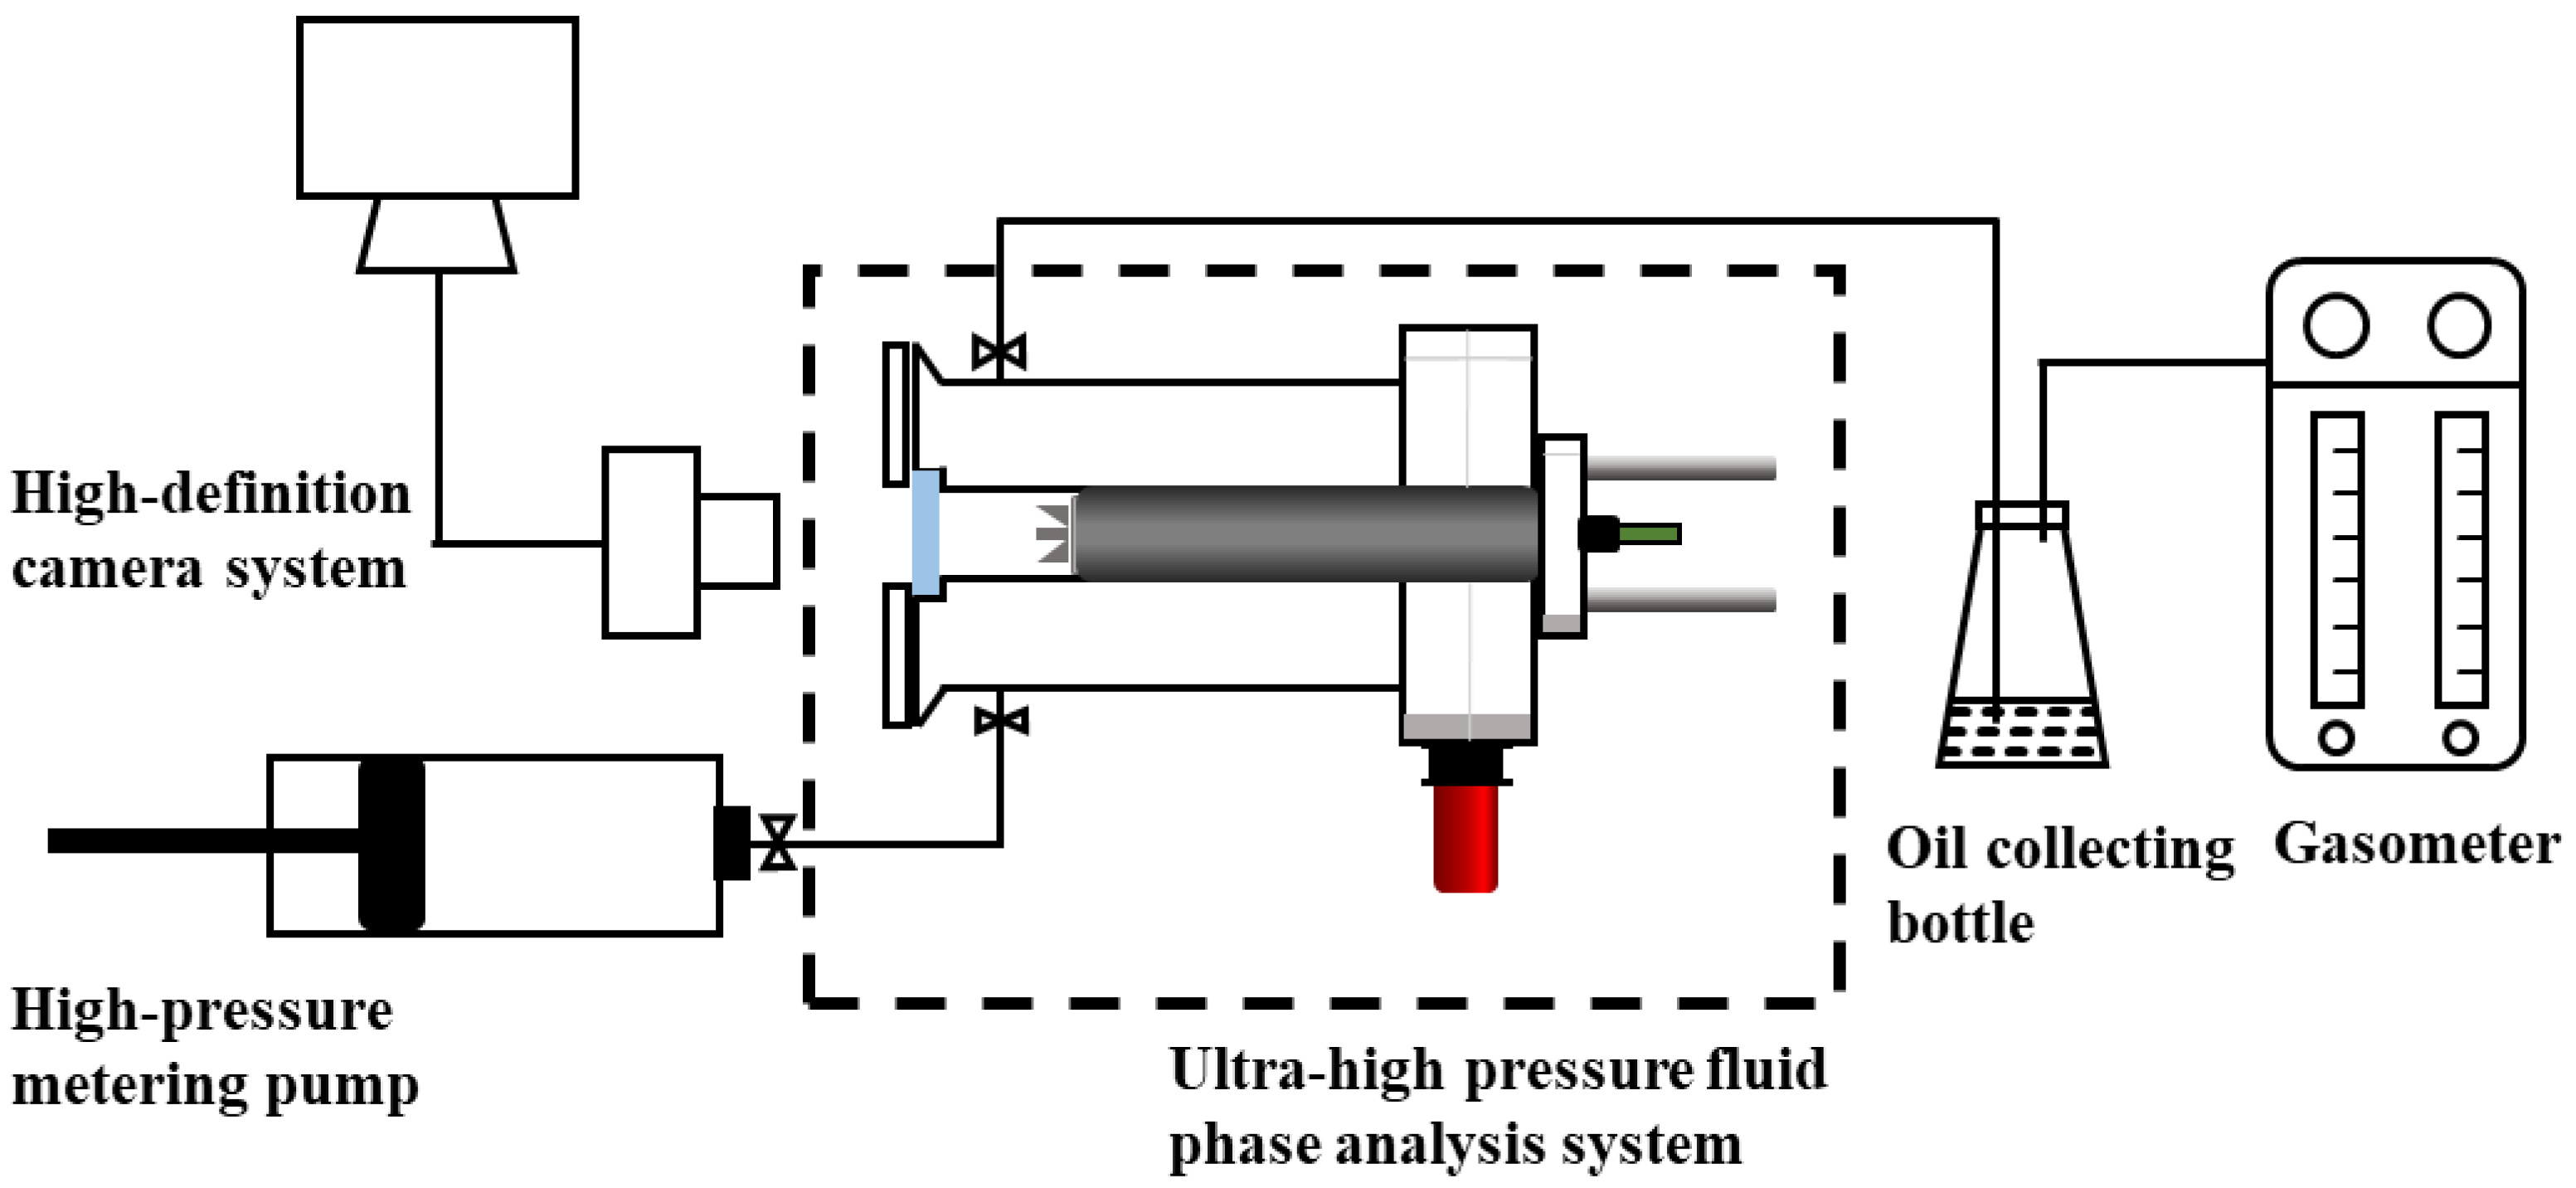
2.1. Experimental Equipment

The ultra-high-pressure–high-temperature pressure–volume–temperature (PVT) system (Figure 1), which is manufactured by Sanchez Technologies in France, was used in this study. It is mainly composed of a PVT cell with a maximum volume of 240 mL, electromagnetic stirring system, temperature control system, high-definition camera system and operation control system. The volume of PVT cells can be controlled by a computer-driven precision motor piston with an accuracy of 0.0001 mL. The high-definition camera system can capture and record the fluid’s phase changes in the PVT cell over time through a fully transparent sapphire window. The PVT system’s maximum working pressure and temperature are 150 MPa and 200 °C, with accuracies of 0.01 MPa and 0.001 °C, respectively.

2.2. Experimental Materials

The crude oil is obtained from a certain block in Xinjiang Oilfield (Xinjiang, China). The density is 0.8127 g/cm3 and the average molecular weight is 218 g/mol. The compositions of light components (C2–C6), intermediate components (C7–C15) and heavy components (C16+) in crude oil are 8.57%, 67.00% and 24.43%, respectively. CO2, CH4 and N2 are all provided by Air Liquide with purity of 99.9%.

2.3. Experimental Procedures

2.3.1. Phase Behavior of Supercritical CO2

The ultra-high pressure fluid phase analysis system used and the experimental flow chart is shown in Figure 2. The specific experimental procedures are as follows: (1) The PVT system is adjusted to the target temperature. Then, the CO2 is injected into the PVT cell by the air booster pump while the system is maintained at the anticipated pressure and temperature. (2) By operating the control system, only one parameter (temperature/pressure/volume) of the system is changed to study the phase change of CO2 which could be observed and recorded by the high-definition camera system.

2.3.2. Phase Behavior of Supercritical CO2—Formation Oil System

The experimental flow chart of the phase behavior of supercritical CO2-formation oil system is also shown in Figure 2. The specific experimental procedures are as follows: (1) After the PVT cell is evacuated for 30 min, a certain amount of formation oil is injected from the bottom of the PVT cell. Then, the system temperature is increased to the target temperature, and the system pressure is stabilized at 10 MPa. (2) Inject the gas into the high-pressure metering pump through the air booster pump and pressurize to 10 MPa, and set to the target temperature and stabilize it. (3) Connect the high-pressure metering pump to the top of the PVT cell. Slightly open the valve to inject gas and simultaneously withdraw the piston in the PVT cell at a constant speed (5 mL/min). Adjust the valve to ensure the pressure in the PVT cell is stabilized at 10 MPa. Stop injecting gas after the volume of the PVT cell increases to twice the initial volume. (4) Quickly increase the pressure on the PVT cell to the experimental pressure, then advance the pump at a certain rate (0.4 mL/min), without stirring during the experiment. (5) Fluids in different layers are collected from the top of the PVT cell, and the composition is analyzed by gas chromatography.

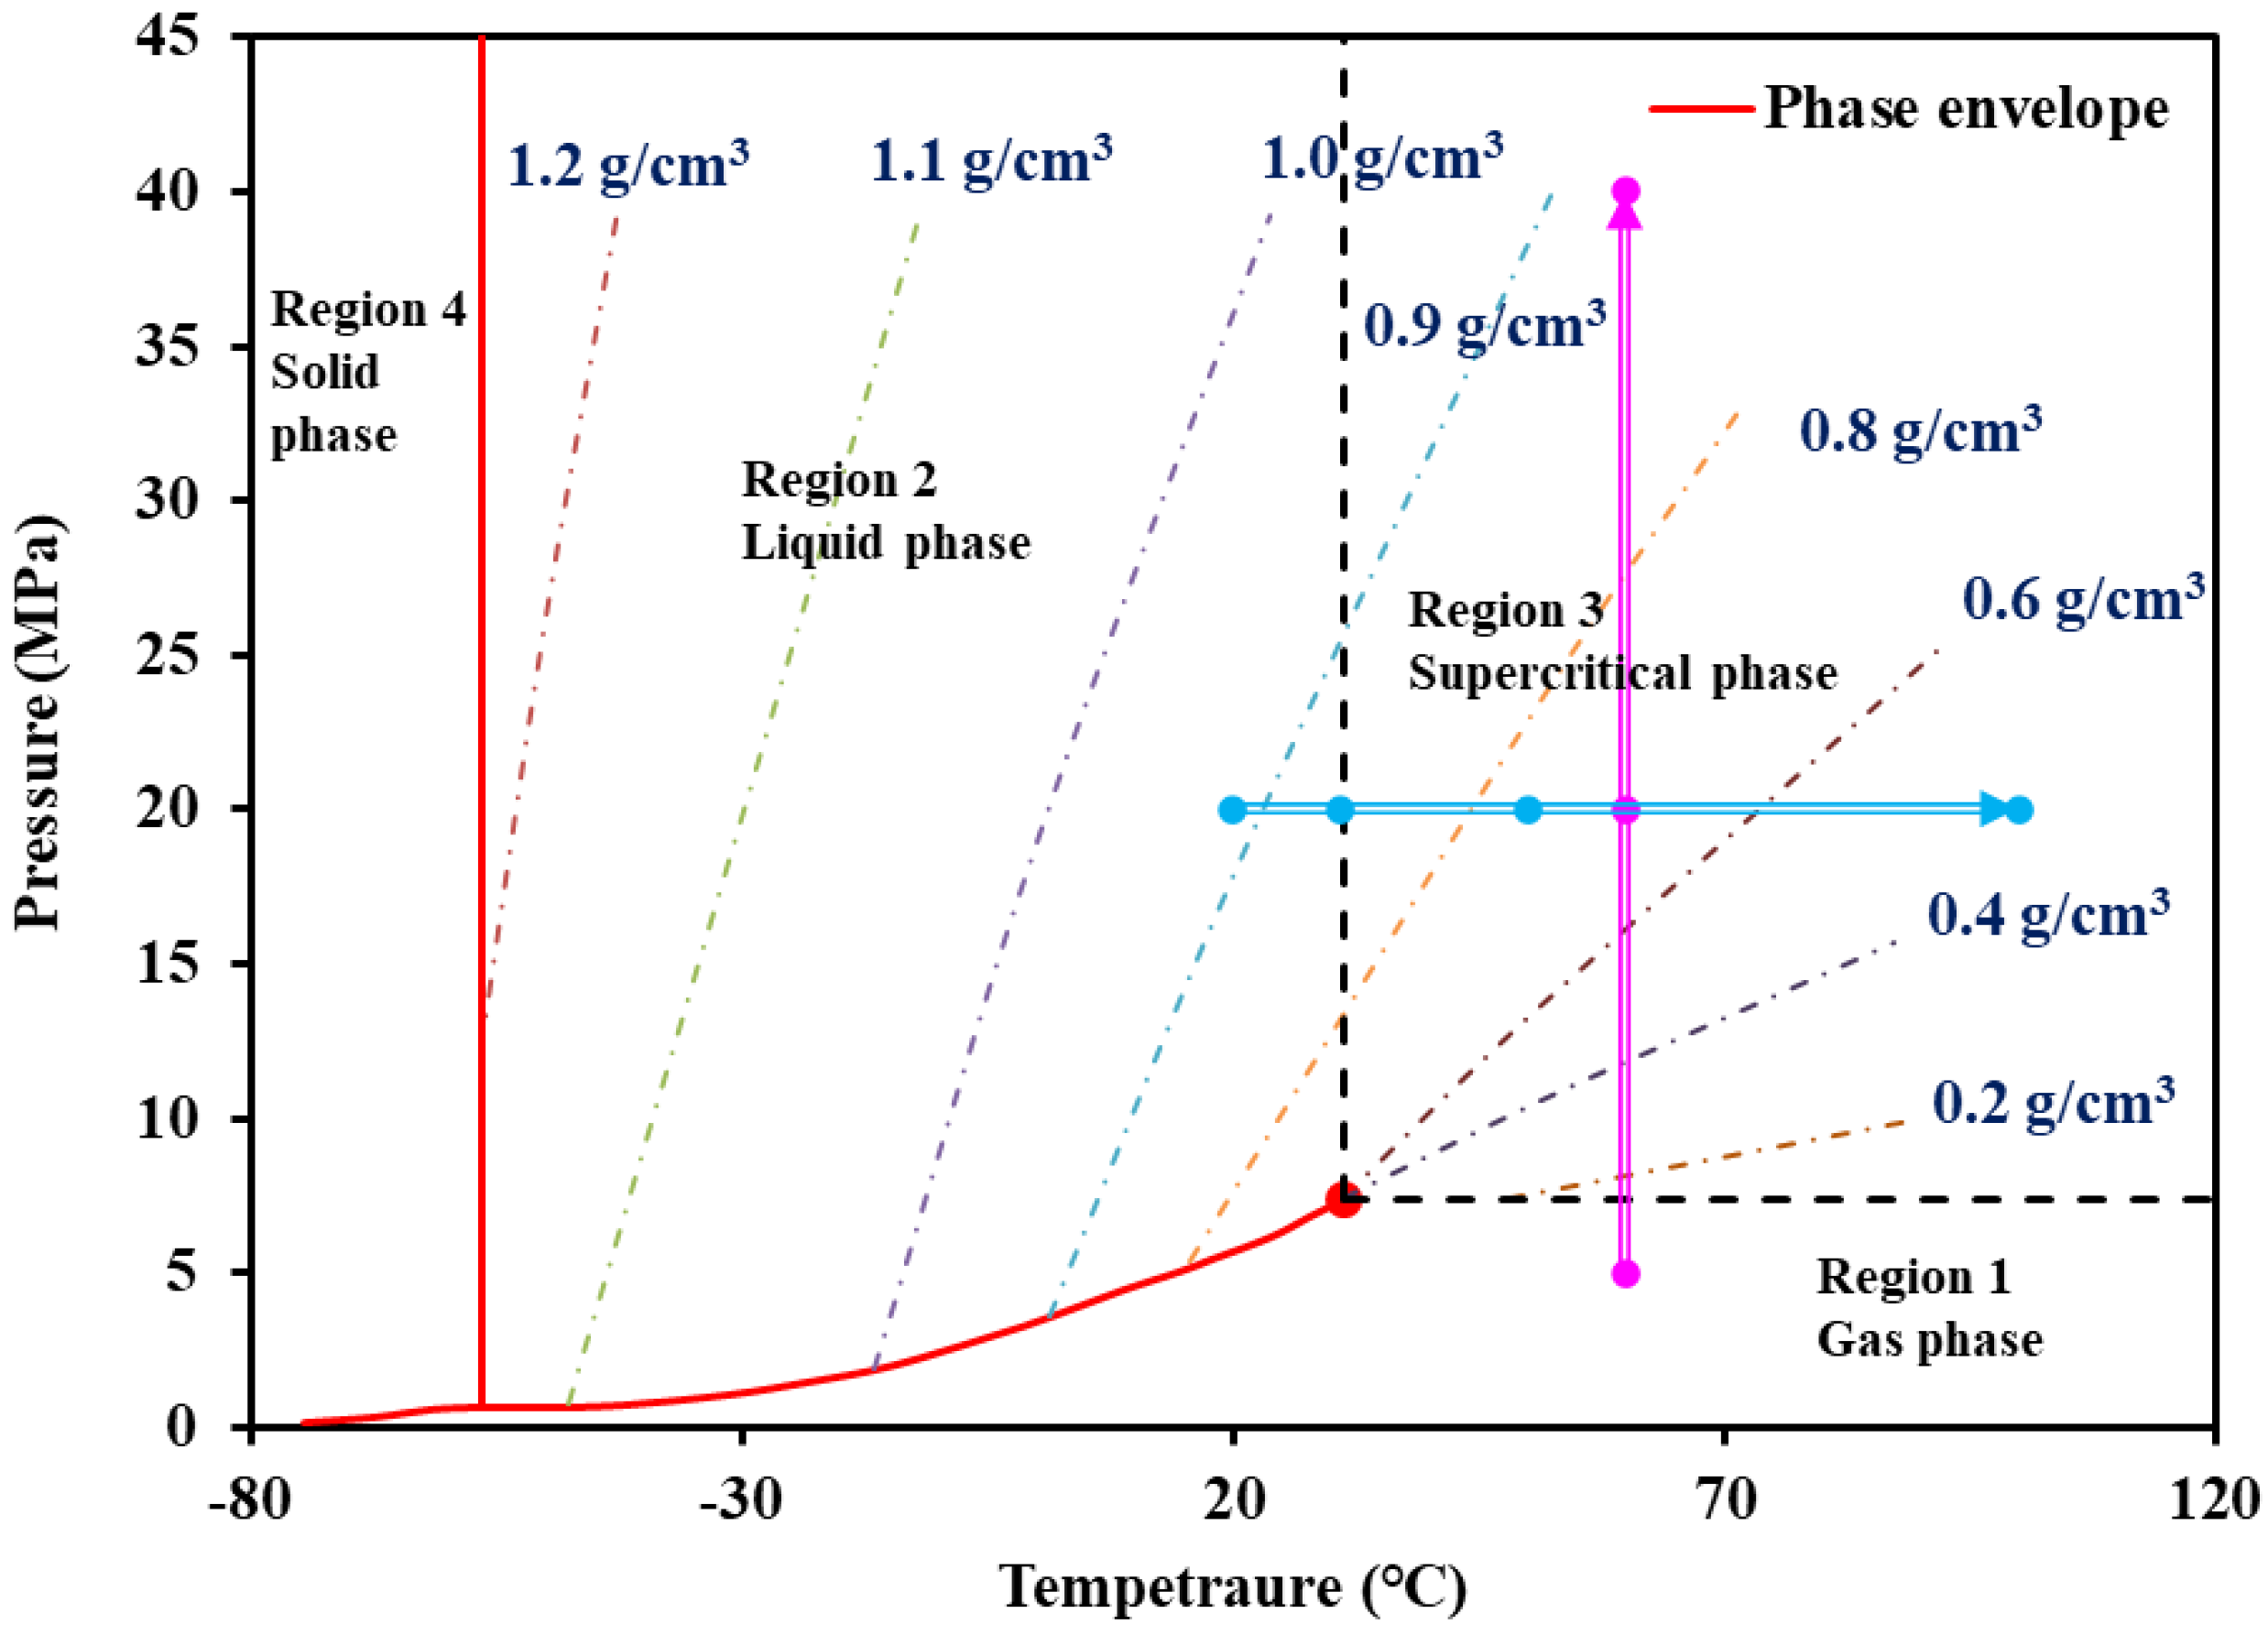
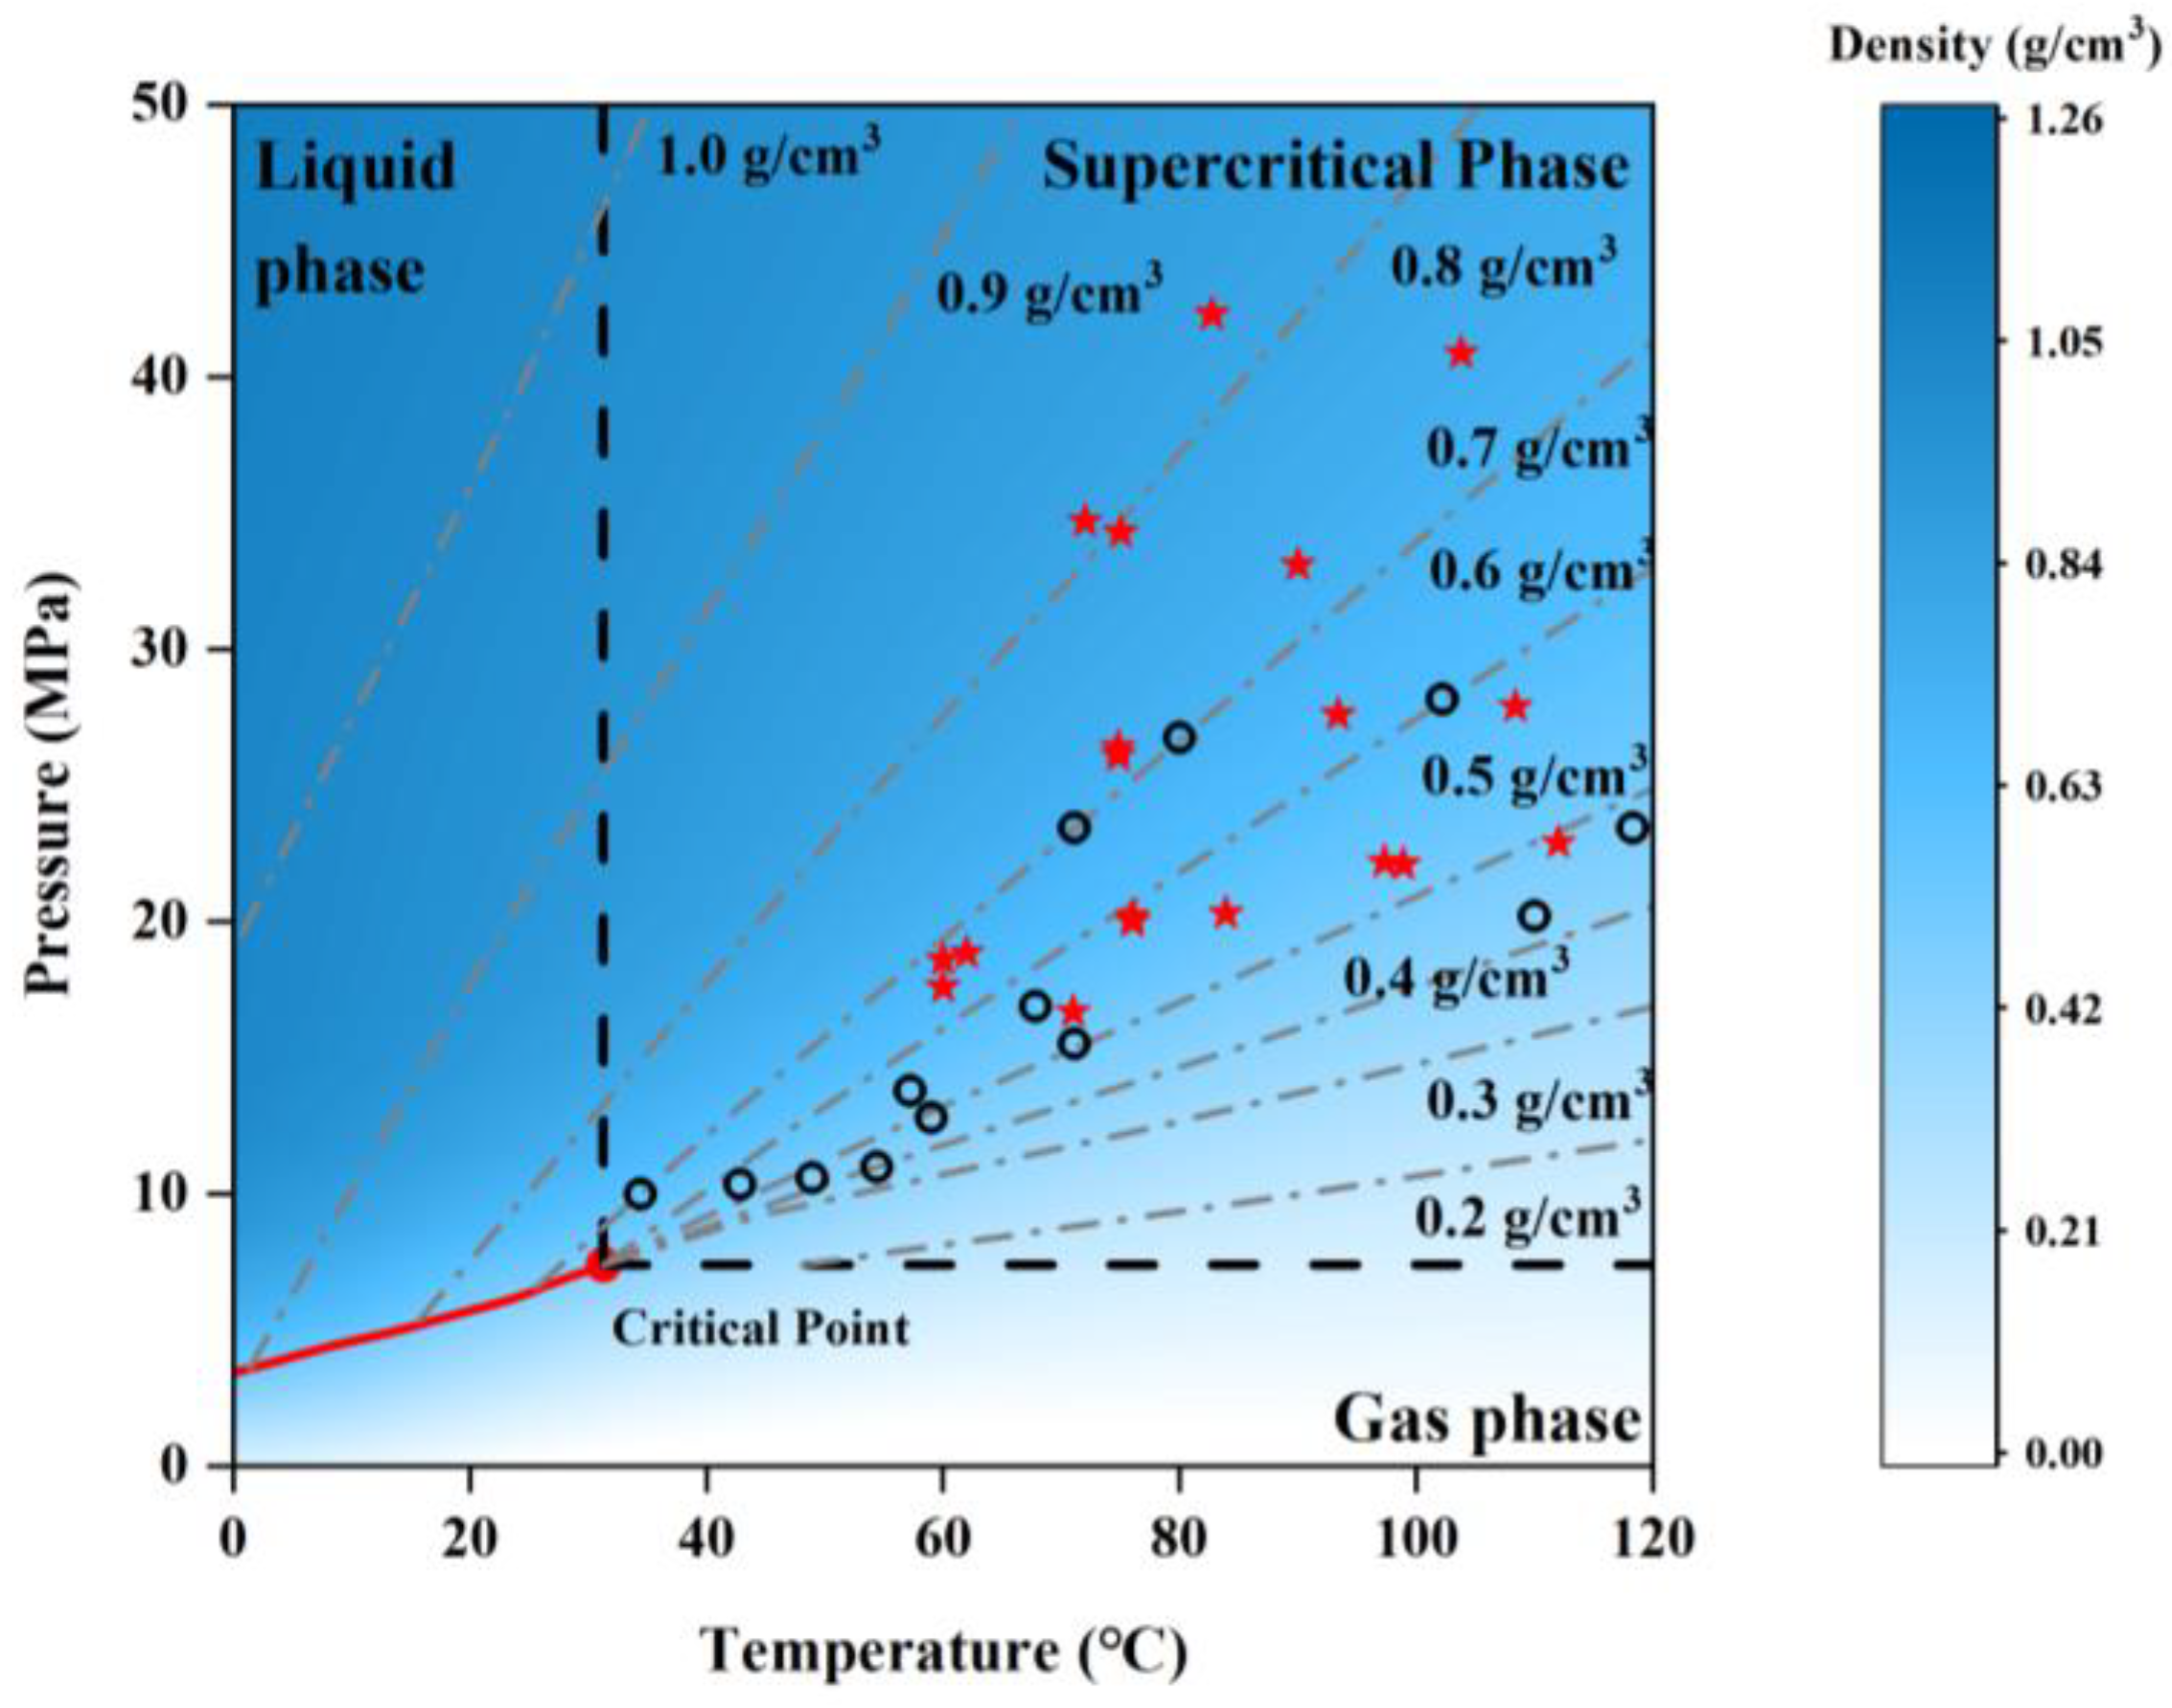
3. CO2 Supercritical Phase Behavior

The temperature–pressure system of the reservoir will make CO2 enter the supercritical state during the implementation of the CCUS-EOR technology, which has excellent solubility and mass transfer performance. In order to clearly understand the phase behavior of supercritical CO2 under reservoir conditions, this section studies the phase behavior of supercritical CO2 from three phase transition paths based on the three common phase states in the pressure−temperature (P–T) phase diagram of CO2 (Figure 3).

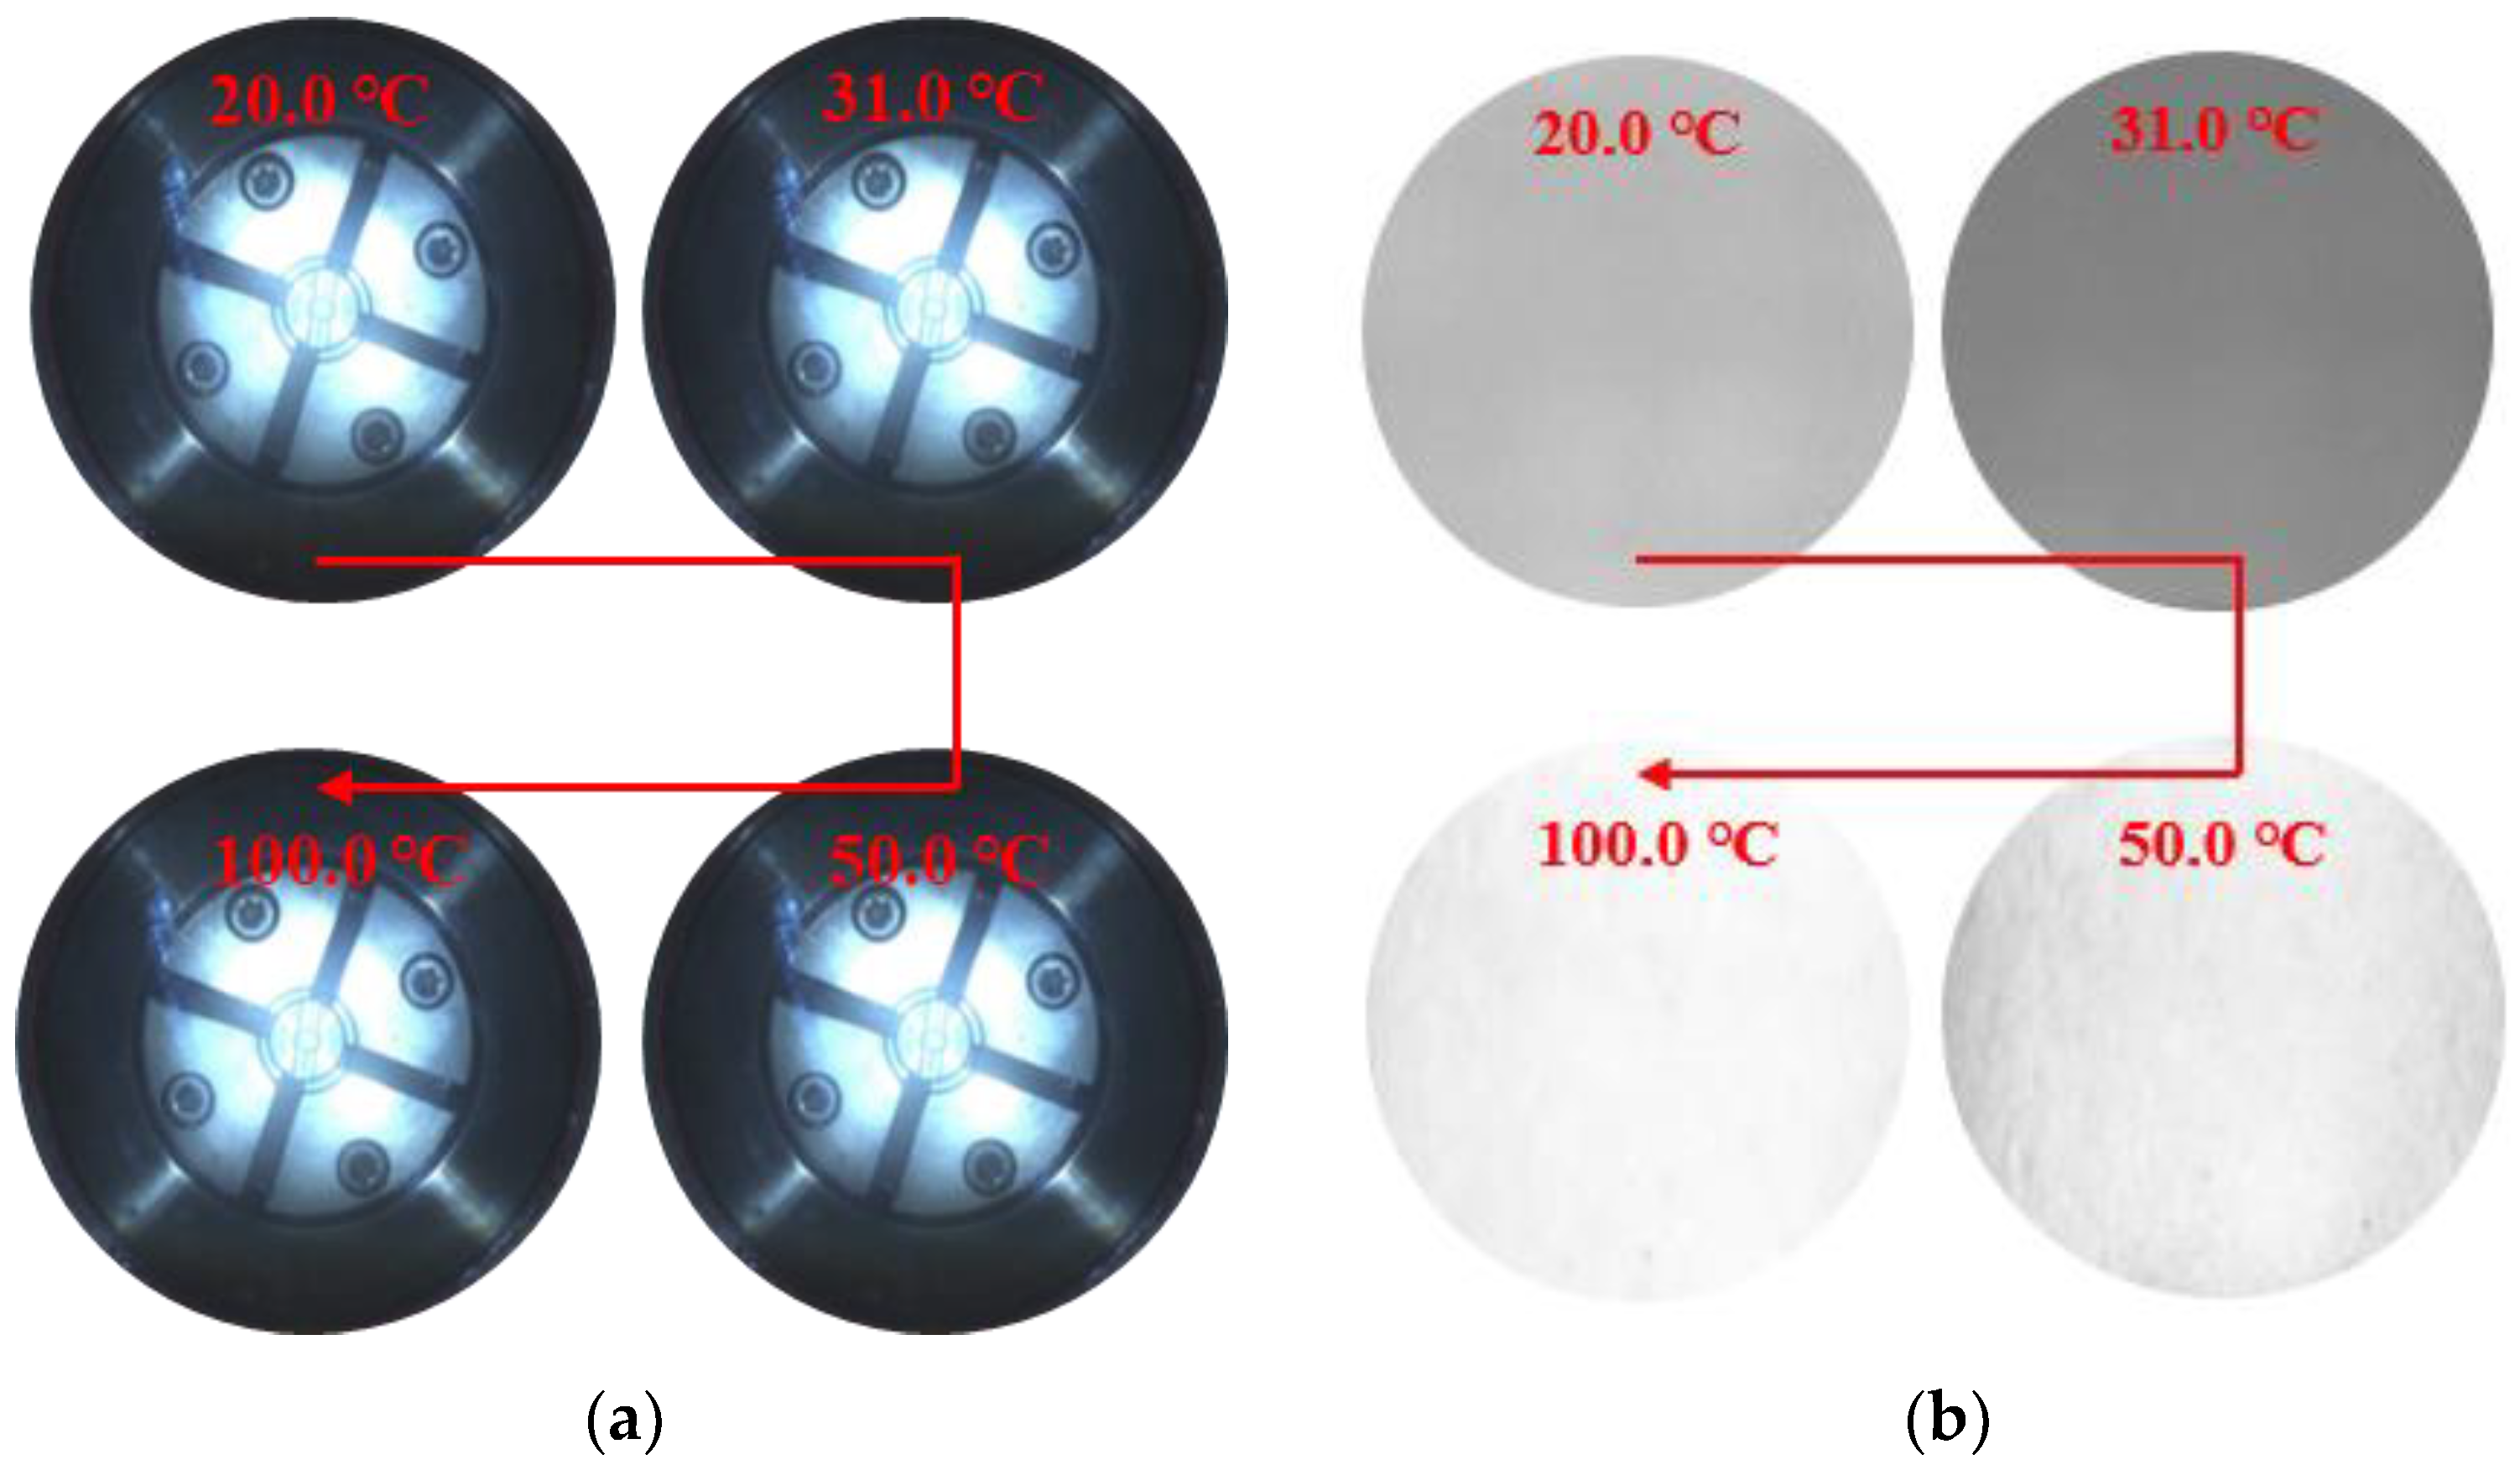
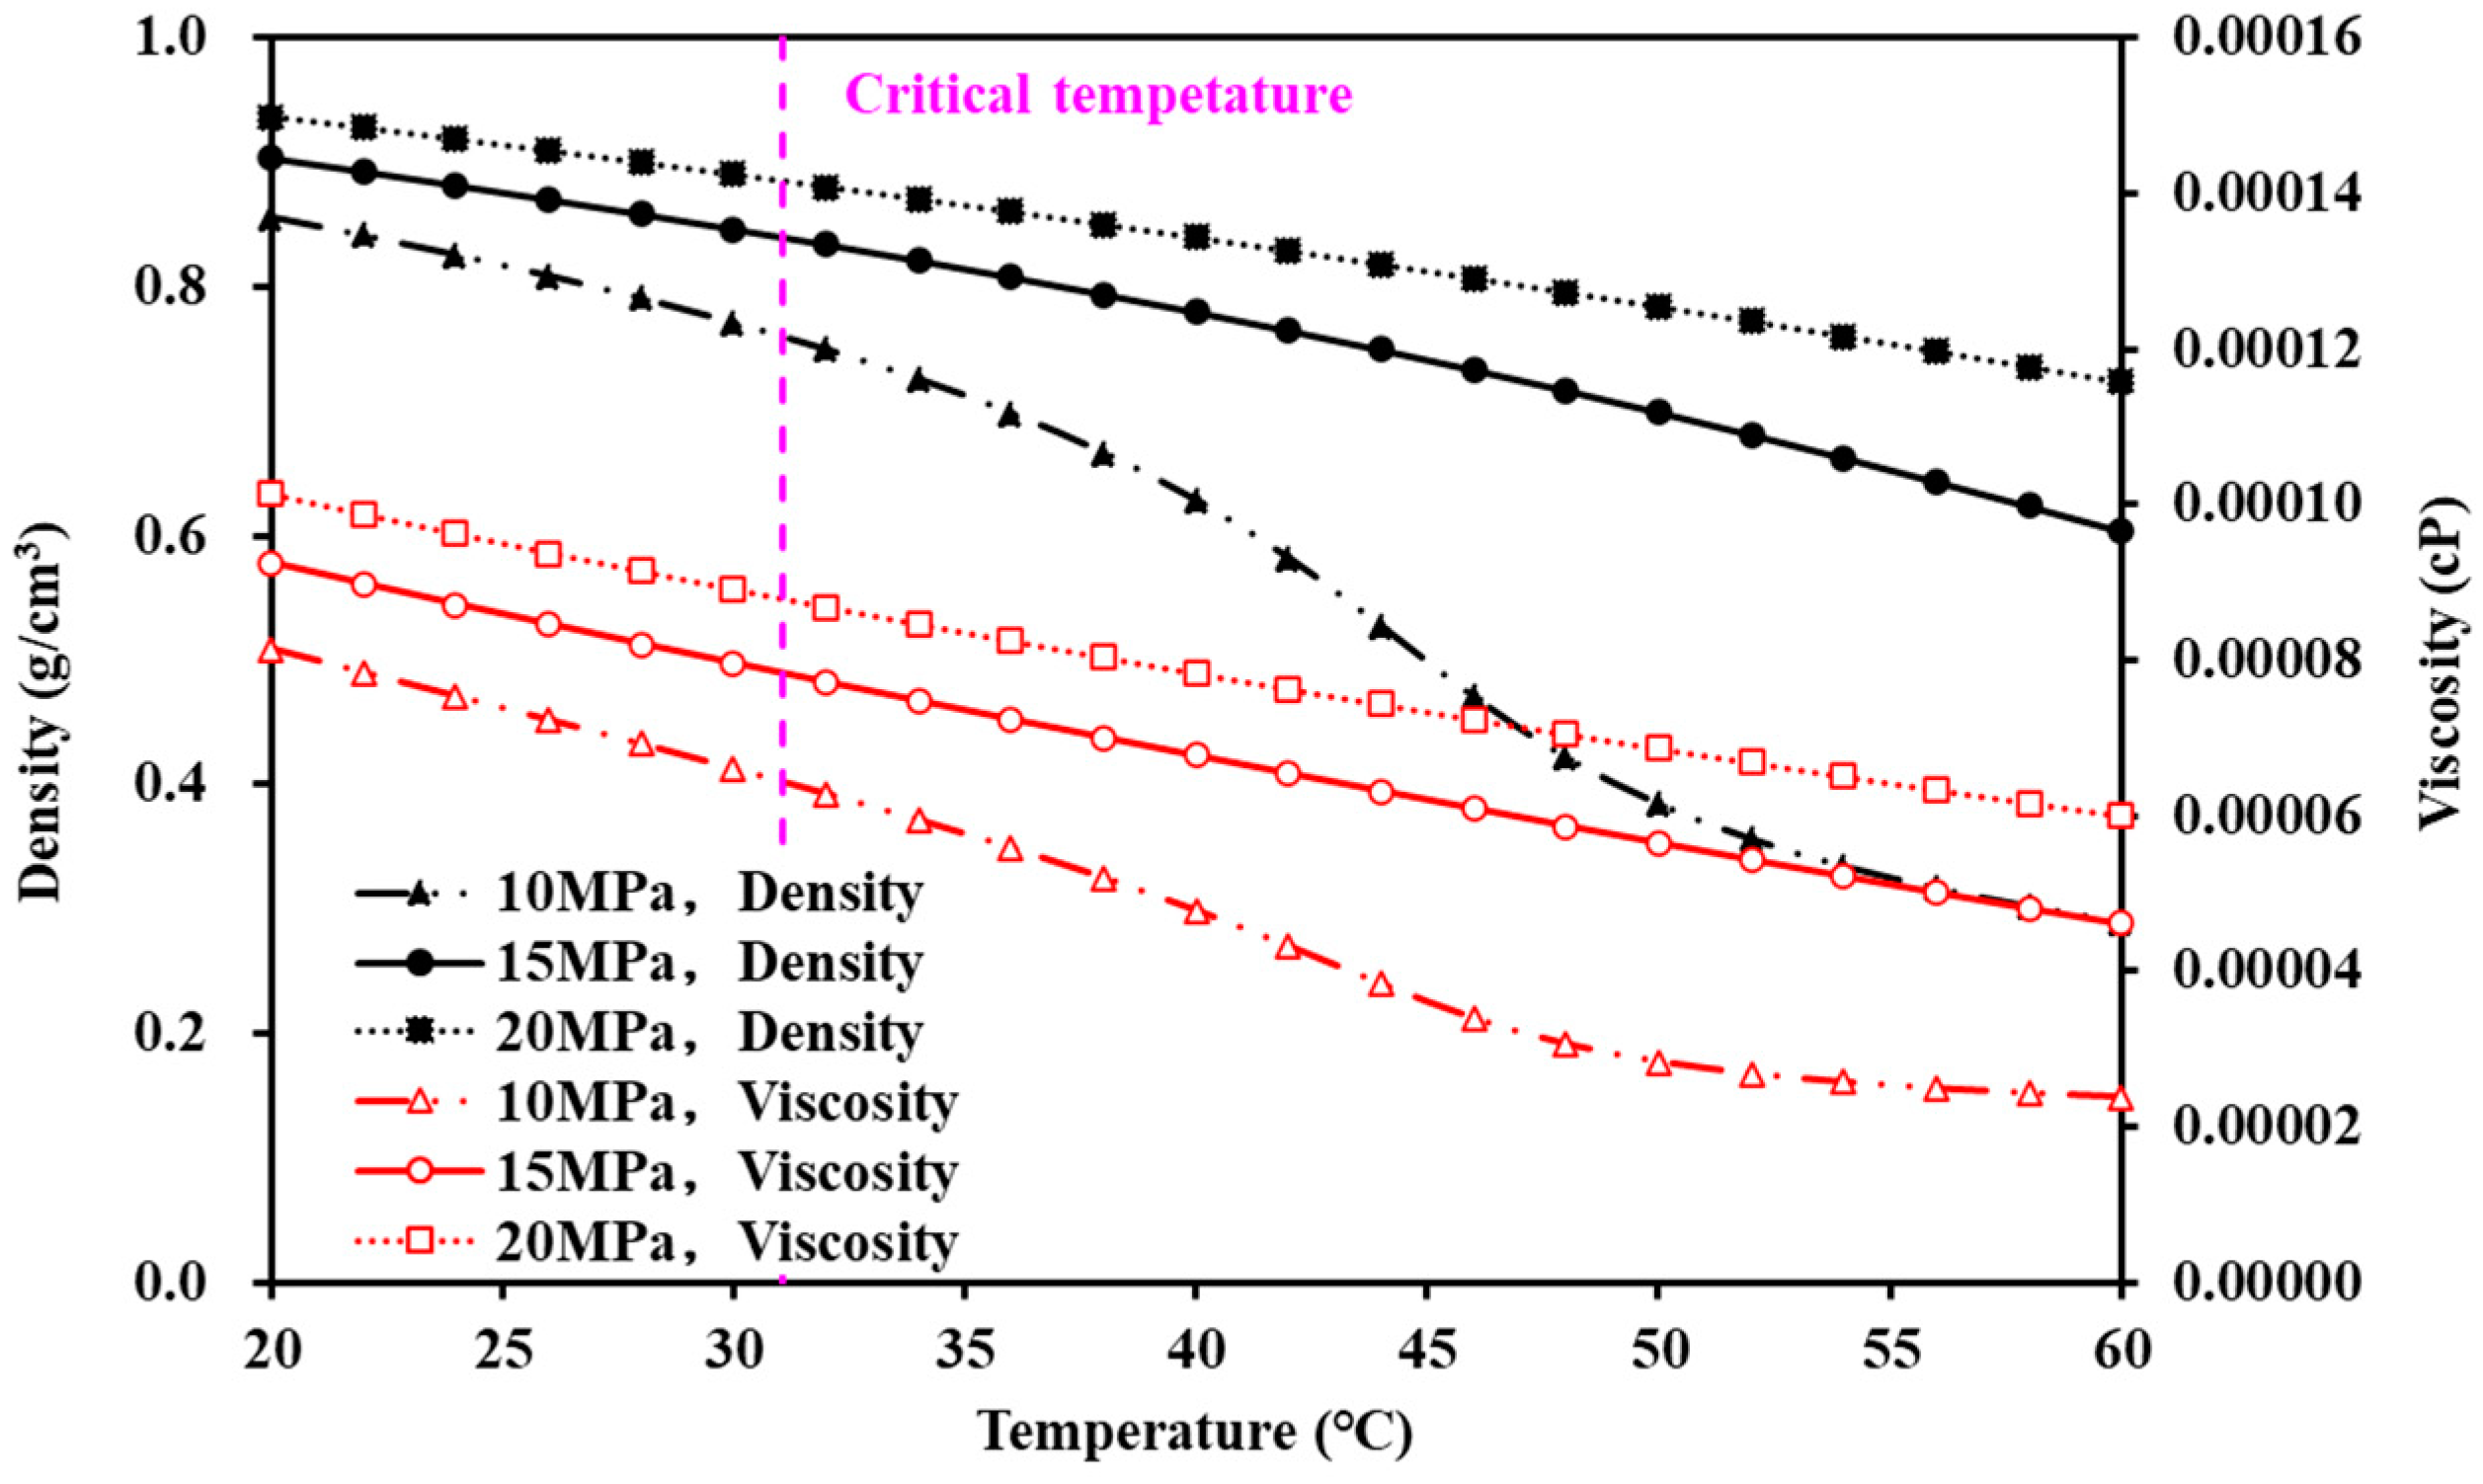
3.1. Phase Behavior of CO2 at Saturation Vapor Pressure Line

When the temperature is lower than 31.1 °C, CO2 changes from the gas phase to the liquid phase with the increase of pressure. At room temperature (20 °C), with continuously increasing the pressure at a rate of 100 mL/min, CO2 begins to liquify and the liquid volume gradually increases. The gas: liquid ratio under different PVT cell volumes were calculated and shown in Figure 4. Meanwhile, the phase changes of CO2 in the visual PVT cell were recorded, as shown in Figure 5.
When the gas phase pressure increases to 5.73 MPa, the system pressure remains constant as the volume of the PVT cell continues to decrease. The gas–liquid interface begins to appear and the volume ratio increases rapidly. During the phase transition process, the interface between gaseous CO2 and liquid CO2 was clear (Figure 5). This is because during the phase transition process, the fluid density increases significantly, and the number of molecules per unit volume in the liquid phase increases, resulting in the change of the distance between molecules per unit volume (i.e., from large to small) and the extremely fast molecular motion speed, which contributed to the clear phase interface.

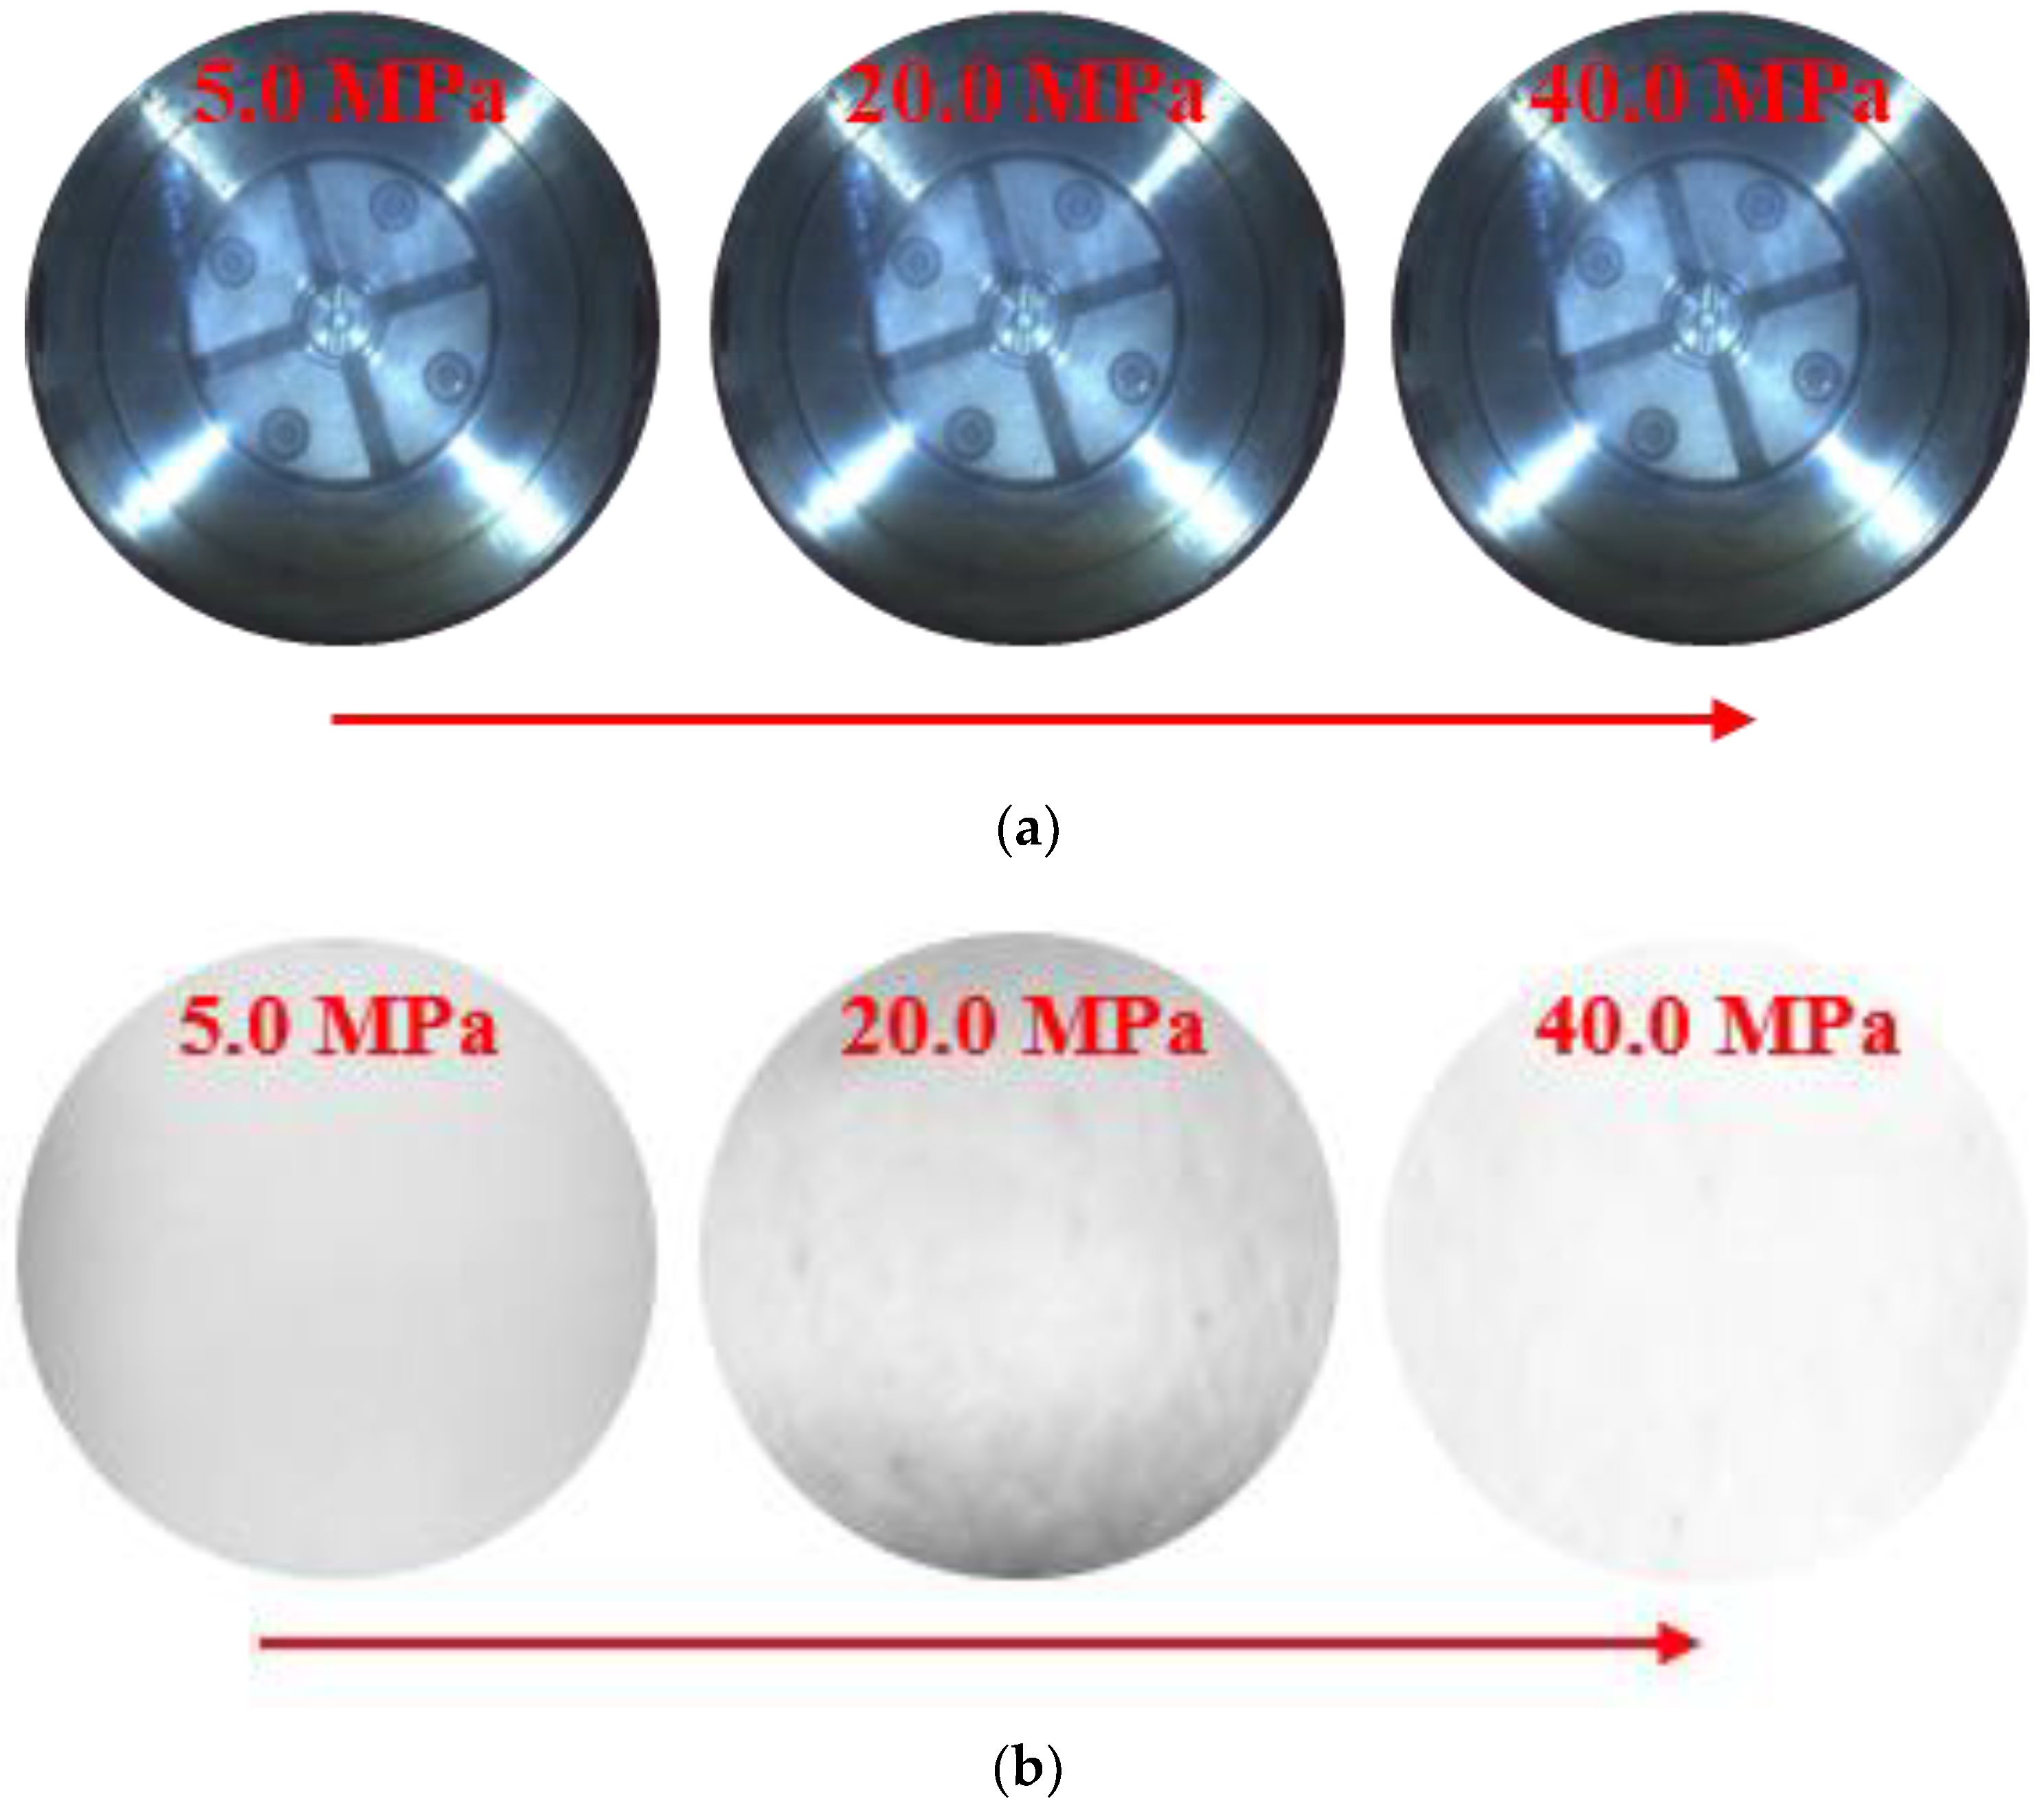
3.2. Phase Behavior of CO2 from Gas Phase to Supercritical Phase

When the temperature is higher than 31.1 °C, CO2 changes from the gas phase to the supercritical phase as the pressure increases. Under the experimental temperature of 60 °C, the pressure was continuously increased from 5 MPa to 40 MPa at a rate of 100 mL/min. The phase change path is shown in Figure 3 expressed as pink arrows. Meanwhile, the phase change of CO2 from the gaseous state to the supercritical state is shown in Figure 6.
As the pressure was higher than 7.38 MPa, CO2 transformed into the supercritical phase. No phase interface was found during the whole process. The phase state change between the CO2 gas phase region and the supercritical phase region was small. However, in the supercritical phase region, the CO2 density changed drastically with the rise of pressure. The phase change of CO2 in the supercritical phase region was photographed and recorded by an infrared camera, as shown in Figure 6b. As the CO2 comes into the supercritical state, the number of CO2 liquid molecules increases, and the CO2 density changed drastically, resulting in a significant increase in solubility and extraction capacity. Thus, the CO2 infrared image at 20 MPa is darker than that at 5 MPa. As the pressure continues to rise to 40 MPa, the captured image becomes more transparent, which indicates that the CO2 density gradually becomes smaller as the pressure continues to rise.
Figure 7 shows the CO2 density and viscosity change curves from the gas phase region to the supercritical phase region at three temperatures. It can be found that as the pressure increases, both the density and viscosity increase significantly in the pressure range of 7.38 MPa to 10 MPa. With the increase of temperature, the increase rate of density and viscosity decreases, and the difference in properties between the gas phase region and supercritical phase region reduces.

3.3. Phase Behavior of CO2 from Liquid Phase to Supercritical Phase

CO2 changes from a liquid phase to a supercritical phase as the temperature rises at the temperature and pressure conditions above the saturated vapor pressure line. When the pressure is 20 MPa, the temperature is continuously increased from 20 °C to 100° C at a rate of 2 °C/min. The phase change path is shown in Figure 3 expressed as blue arrows. Meanwhile, the phase change of CO2 from the liquid phase region to the supercritical phase region is shown in Figure 8.
CO2 changes from a liquid state to a supercritical state as the temperature increases, and no phase change was observed. The phase change between the liquid phase region and the supercritical region of CO2 is small. However, the CO2 density changed drastically during this process. The phase change of CO2 in the supercritical phase region was photographed and recorded by an infrared camera, as shown in Figure 8b. It can be found that the CO2 supercritical state is more transparent when the temperature is lower. As the temperature rises to 31 °C, the CO2 turns into supercritical state. When the temperature and pressure conditions are closer to the critical point, supercritical CO2 has the characteristics of local density inhomogeneity, making the captured image especially darker. As the temperature continues to rise, the local density inhomogeneity is reduced contributing to a more transparent infrared image.
Figure 9 shows the CO2 density and viscosity change curve from the liquid phase region to the supercritical phase region under different pressures. It can be found that as the temperature increases, the density and viscosity of CO2 decrease rapidly under low pressure in the temperature range of 31.1 °C to 50 °C. As the temperature increases, the range of decrease in CO2 density and viscosity decreases, and the difference in properties between the liquid phase region and the supercritical region decreases.

4. Supercritical Phase Behavior of CO2-Formation Oil System

4.1. Phase Behavior of Supercritical Injection Gas-Formation Oil System during Mass Transfer Process

Using the formation oil in Xinjiang as the research object, the oil and gas system was boosted under the same initial conditions (90 °C, 10 MPa), and the supercritical mass transfer features of three types of gas (CO2/CH4/N2)-formation oil system was photographed and recorded, as shown in Figure 10. It can be seen from Figure 10a that CO2 and formation oil were clearly separated into two layers under initial conditions. The oil–gas interface was clearly visible. As the pressure increases, CO2 was further compressed, and the volume of formation oil began to expand and CO2 was mainly dissolved. As the pressure increased further, the oil–gas contact interface began to fluctuate, and a small amount of volatile components in the formation oil was extracted. When the pressure reached 16 MPa, the oil–gas interface underwent intense mass transfer, and a large amount of hydrocarbon components in the formation oil were extracted into the gas phase. There was an obvious oil–gas mass transfer transition zone between CO2 and formation oil, and its width increases with the increase of pressure. Under the same initial conditions, the CH4-formation oil system is boosted to 16 MPa as shown in Figure 10b. The oil–gas contact was still clearly visible. The mass transfer between oil and gas is mainly dominated by the dissolution of CH4, resulting in the swelling of the formation oil. As the pressure increases further, the oil–gas contact fluctuated, and a small amount of volatile components in the formation oil was extracted into the gas phase. When the pressure increased to 40 MPa, the width of the oil–gas mass transfer transition zone increases and the color becomes significantly darker. At this time, a large amount of formation oil components was extracted into the gas phase. For the N2-formation oil system, as shown in Figure 10c, the interface between the two phases of the N2-formation oil system was still clear without fluctuations as the pressure gradually increased to 40 MPa. The mass transfer between oil and gas was mainly based on the dissolution of N2.

4.2. Difference of Components in Supercritical Phase Region during Mass Transfer Process

According to the supercritical mass transfer phase state change of the injection gas-formation oil system during the pressurization process (Figure 10), the gas phase region was divided into three layers, as shown in Figure 11. Each layer of the CO2/CH4/N2-formation oil system was separately sampled, and the chromatographic component composition analysis of the produced fluid was performed. The flash evaporation process was carried out at −5 °C to avoid the loss of flash oil.
At the condition of 90 °C and 16 MPa, the chromatographic composition analysis of the flash oil recovered from the three layers in the CO2-formation oil system gas phase was tested. The molar contents of light hydrocarbon components in layers 1–3 are 91.00%, 87.96% and 61.81%, respectively. Moreover, the molar contents of the intermediate components are 9.00%, 12.04% and 38.19%, respectively. The results show that the mass transfer of hydrocarbon components between phases in the CO2-formation oil system is a stage-like process. The mass transfer of light hydrocarbons first forms a gas-rich phase, followed by the mass transfer of intermediate components to form a transition phase, which promotes the mass transfer process of heavy components, and finally miscibility between oil and gas is achieved.
Chromatographic analysis was performed on the layer 1 of the three gas samples at 90 °C and 16 MPa. The heaviest hydrocarbons extracted by the CO2/CH4/N2-formation oil system were C13, C and C6, respectively. For the CO2/CH4/N2-formation oil system, after increasing the pressure to 40 MPa, the chromatographic analysis of layer 1 is carried out. The CO2-formation oil system reached miscibility at 40 MPa. Therefore, the CO2-formation oil system was analyzed in the condition of 16 MPa (Figure 12). Chromatographic analysis results show that when the pressure increases to 40 MPa, the heaviest hydrocarbon extracted from layer 1 of the CH4-formation oil system is C13, which is consistent with hydrocarbon extraction behavior by the CO2-formation oil system in the condition of 16 MPa. The heaviest hydrocarbon extracted from layer 1 of the N2-formation oil system is C9. It is worth noting that the molar content of intermediate components extracted from layer 1 of the CO2-formation oil system at 16 MPa (32.88%) is much higher than that of the CH4-formation oil system at 40 MPa (14.82%). It can be concluded that the increase of system pressure will increase the extraction and mass transfer capacity of gas. The extraction and mass transfer capacity of CO2 is most affected by pressure, followed by CH4 and N2 the least.

4.3. Mass Transfer Capacity of Supercritical CO2 Extraction

Supercritical fluid has the characteristics of local density inhomogeneity. When the temperature and pressure conditions are closer to the critical point, the inhomogeneity of supercritical fluid density is more obvious. The manifestation of it is that the inconsistency between the microscopic local density and the macroscopic bulk phase density is stronger, and the local density can be much larger than the bulk phase density. This phenomenon is usually due to the attraction between molecules, resulting in the aggregation of molecules or the formation of molecular aggregates.
In this study, when the supercritical CO2-formation oil system is under reservoir conditions, supercritical CO2 forms molecular aggregates and distributes at the oil–gas interface. This causes the hydrocarbon components in the formation oil at the oil–gas interface to be surrounded by these molecular aggregates, and then extracted into the gas phase, thus greatly improving the extraction and mass transfer capacity of supercritical CO2. Compared with CO2, the critical points of CH4 and N2 are far away from the reservoir temperature and pressure conditions, as shown in Figure 13. On the other hand, the lower the critical temperature, the weaker the intermolecular attraction that exists between gas molecules. The critical temperatures of CO2, CH4 and N2 are 31.1 °C, −82.6 °C and −146.9 °C, respectively. Since the critical temperature of CH4 and N2 is much lower than that of CO2, the intermolecular attraction between CH4 and N2 is weaker than that of CO2. Hence, under the reservoir conditions, the bulk phases of supercritical CH4 and N2 have reached a homogeneous state and cannot form molecular aggregates, resulting in the extraction and mass transfer capacity being far weaker than that of supercritical CO2.

5. Supercritical CO2 and Miscible-Phase Matching Mechanism

The density of supercritical CO2, which is similar with temperature and pressure, is an important parameter that reflects the state and properties of matter. It directly reflects the distance between the molecules of the substance and the magnitude of the intermolecular force. In this section, 15 sets of minimum miscible pressure data of crude oil from different regions in China are plotted in the pressure–temperature–density (P-T-ρ) diagram of CO2 (Figure 14) to clarify the relationship between the supercritical state of CO2 and the reverberation ability of CO2-formation oil. The minimum miscibility pressure of CO2-formation oil mostly locates in the density range of supercritical CO2 of 0.50–0.85 g/cm3. The difference in minimum miscibility pressure between different oil reservoirs at the same temperature increases with the increasing temperature.
The data of 13 groups of CO2-crude oil minimum miscible pressure tests abroad are also plotted in Figure 14. The minimum miscible pressure of CO2-crude oil mainly lies in the density range of supercritical CO2 of 0.40–0.80 g/cm3. Compared with Chinese formation oil, the density of supercritical CO2 required for foreign oil reservoirs to achieve miscibility is significantly lower. The distribution characteristics of components of formation oil in 22 low-permeability blocks of 12 oilfields in 8 major basins worldwide were collected, as shown in Figure 15. It is found that the content of light hydrocarbon components (C2–C6) in Chinese oil reservoirs is lower than that in foreign oil reservoirs, and the composition of crude oil is also significantly different. The corresponding density of supercritical CO2 is mainly affected by temperature and oil composition when CO2-formation oil reaches miscibility. It is noted that the increase of light hydrocarbon content in formation oil will increase the mass transfer capacity and dissolution capacity of supercritical CO2, thereby reducing the density of supercritical CO2 required for the oil–gas system to reach miscibility. The higher the temperature, the higher the entropy value, resulting in a more violent collision between supercritical CO2 molecules and crude oil molecules. Therefore, the gas phase needs to have stronger mass transfer ability and solubility to achieve phase miscibility.
The minimum miscible pressure of CO2-formation oil and the corresponding change of density of supercritical CO2 were investigated at different temperatures in a certain oil reservoir, as shown in Figure 16. For the same oil, the temperature has a linear relationship with the minimum miscible pressure. It is found that, as the temperature increases, the corresponding density of supercritical CO2 required for the CO2-formation oil reaching miscibility gradually decreases until it becomes stable. It shows that in high temperature reservoirs, the minimum miscible pressure of supercritical CO2-formation oil is less affected by the density of supercritical CO2.

6. Conclusions

(1)
During the development process, the phase behavior of supercritical CO2 is complex. Experimental research shows that CO2 is a continuous change process when transitioning from a gas (or liquid) phase to a critical phase. When the pressure in the supercritical phase region increases, the number of droplet molecules increases, the density of CO2 changes drastically and the dissolving capacity and extraction capacity are significantly improved.
(2)
Supercritical CO2 has a significantly higher extraction capacity for formation oil components compared to supercritical CH4 and N2. The extraction and mass transfer capacity of CO2 is the most affected by the pressure, followed by CH4 and N2. The understanding of the phase behavior of CO2 provided the theoretical guidance for the application of CO2 flooding on the oilfields.
(3)
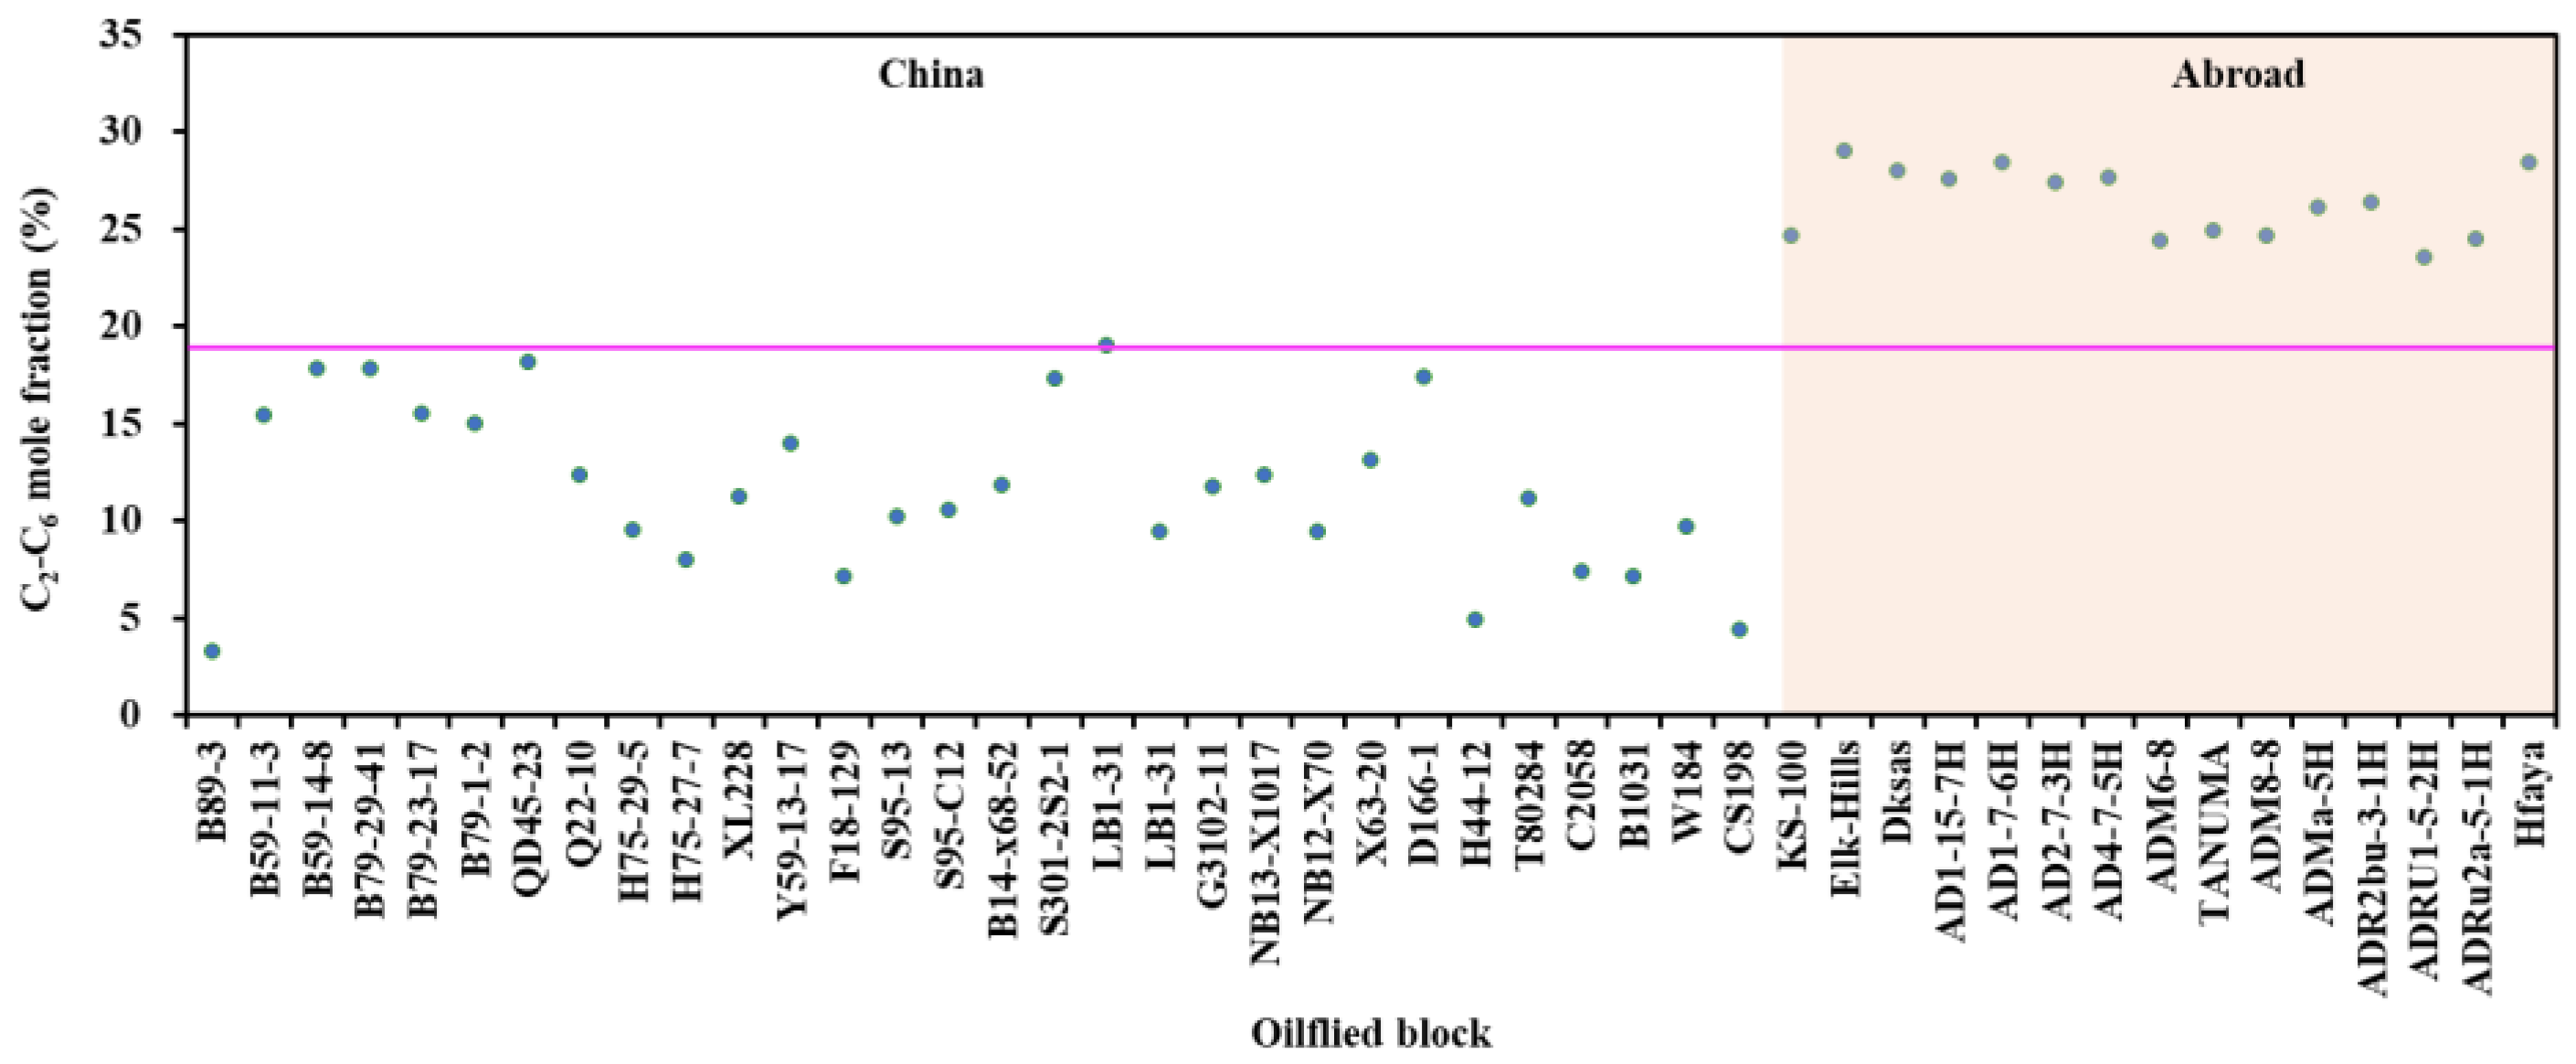
The density of supercritical CO2 is closely related to the oil–gas miscibility. The minimum miscible pressure of low-permeability reservoirs lies in the density range of supercritical CO2 of 0.50–0.85 g/cm3 in China and 0.40–0.80 g/cm3 abroad. The density of supercritical CO2 when CO2-formation oil reaches miscibility is mainly affected by temperature and oil composition, which provides a deeper view to understand the inner relationship between the supercritical CO2 and the oil–gas miscibility.

Author Contributions

Conceptualization and formal analysis, W.L., K.Z. and D.H.; methodology and supervision, Y.Z., W.L. and D.H.; investigation, K.Z. and Y.C.; oilfield data, A.L. and J.G.; writing—original draft, Y.Z., W.L. and Y.C.; writing—review and editing, Y.Z., Y.C. and J.G.; paper layout, Y.Z. and A.L. All authors have read and agreed to the published version of the manuscript.

Funding

This research was funded by the major science and technology projects of the PetroChina Company Limited, grant number 2021ZZ01 and 2021DJ1001.

Data Availability Statement

Not applicable.

Conflicts of Interest

The authors declare no conflict of interest.

References

  1. Xiang, Y.; Hou, L.; Du, M.; Jia, N.-H.; Lyu, W.-F. Research progress and development prospect of CCUS-EOR technologies in China. Pet. Geol. Recovery Effic. 2023, 30, 1–17. [Google Scholar]
  2. Gambelli, A.-M. CCUS Strategies as Most Viable Option for Global Warming Mitigation. Energies 2023, 16, 4077. [Google Scholar] [CrossRef]
  3. Zhao, Z.-Y.; Yao, S.; Yang, S.-P.; Wang, X.-L. Under Goals of Carbon Peaking and Carbon Neutrality: Status, Problems, and Suggestions of CCUS in China. Environ. Sci. 2023, 44, 1128–1138. [Google Scholar]
  4. Peng, X.-T.; Lyu, H.-D.; Zhang, X. Interpretation of IPCC AR6 report on carbon capture, utilization and storage (CCUS) technology development. Clim. Chang. Res. 2022, 18, 580–590. [Google Scholar]
  5. Zhao, Y.; Itakura, K.-I. A State-of-the-Art Review on Technology for Carbon Utilization and Storage. Energies 2023, 16, 3992. [Google Scholar] [CrossRef]
  6. Li, Y. Technical advancement and prospect for CO2 flooding enhanced oil recovery in low permeability reservoirs. Pet. Geol. Recovery Effic. 2020, 27, 1–10. [Google Scholar]
  7. Shen, P.-P.; Liao, X.-W. The Technology of Carbon Dioxide Stored in Geological Media and Enhanced Oil Recovery; Petroleum Industry Press: Beijing, China, 2009. [Google Scholar]
  8. Yuan, S.-Y.; Ma, D.-S.; Li, J.-S.; Zhou, T.-Y.; Ji, Z.-M.; Han, H.-S. Progress and prospects of carbon dioxide capture, EOR-utilization and storage industrialization. Pet. Explor. Dev. 2022, 49, 828–834. [Google Scholar] [CrossRef]
  9. Zhang, X.; Li, Y.; Ma, Q.; Liu, L.-N. Development of Carbon Capture, Utilization and Storage Technology in China. Strateg. Study CAE 2021, 23, 70–80. [Google Scholar] [CrossRef]
  10. Dou, L.-R.; Sun, L.-D.; Lyu, W.-F.; Wang, M.-Y.; Gao, F.; Gao, M.; Jiang, H. Trend of global carbon dioxide capture, utilization and storage industry and challenges and countermeasures in China. Pet. Explor. Dev. 2023, 50, 1–14. [Google Scholar]
  11. He, D.-B.; Jia, C.-Y.; Wei, Y.-S.; Guo, J.-L.; Ji, G.; Li, Y.-L. Current situation and development trend of world natural gas industry. Nat. Gas Ind. 2022, 42, 1–12. [Google Scholar]
  12. Liao, G.-Z.; He, D.-B.; Wang, G.-F.; Wang, L.-G.; Wang, Z.-M.; Su, C.-M.; Qin, Q.; Bai, J.-H.; Hu, Z.-Q.; Huang, Z.-J.; et al. Discussion on the limit recovery factor of carbon dioxide flooding in a permanent sequestration scenario. Pet. Explor. Dev. 2022, 49, 1463–1470. [Google Scholar] [CrossRef]
  13. Liao, G.-Z.; Wang, L.-G.; Wang, Z.-M. Practice and Reflection of Important Development Experiments. Pet. Sci. Technol. Forum 2019, 38, 1–10. [Google Scholar]
  14. Zhu, X. Jilin Oilfield to Build CCUS-EOR Technology Incubation Base. Unconv. Oil Gas 2022, 9, 118. [Google Scholar]
  15. Liu, Z.-Q. Exploration of New Path of Global Carbon Emission Reduction. China Petroleum Daily, 11 May 2019. [Google Scholar]
  16. Lei, Y.-J. The China Carbon Dioxide Capture, Utilization and Storage (CCUS) Annual Report (2021) was released, suggesting the development of large-scale CCUS demonstration and industrial cluster construction. Environ. Econ. 2021, 16, 40–42. [Google Scholar]
  17. Zhang, Z.-B.; Chen, X.; Qian, Y.-C.; Liu, Q.; Lyu, W.-F.; Luo, M.-L.; Fan, X.-L. Experimental study of CO2 storage in water-flooded oilfields. Pet. Res. 2017, 2, 378–382. [Google Scholar]
  18. Shang, B.-B.; Liao, X.-W.; Li, J.-F.; Lu, N.; Su, X.-K. Influence of N2 and CH4 on CO2 immiscible flooding effect. J. Shaanxi Univ. Sci. Technol. 2013, 31, 106–110. [Google Scholar]
  19. Li, L.; Zheng, Z.-G.; Yang, C.-W.; Chen, Z.; Zhang, W.-X.; Xu, B.-C. Experimental Study on the Displacement Characteristics and Capacity of Supercritical CO2 Flooding in Ultra Low Permeability Reservoirs. Sci. Technol. Eng. 2021, 21, 12551–12558. [Google Scholar]
  20. Dai, X.; Ma, Y.; Zhang, L.; Xu, Z.; Sun, X.; Zhao, S. Optimization of Molecular Composition Distribution of Slurry Oil by Supercritical Fluid Extraction to Improve the Structure and Performance of Mesophase Pitch. Energies 2022, 15, 7041. [Google Scholar] [CrossRef]
  21. Lian, L.-M.; Qin, J.-S.; Yang, S.-Y. Research progress and development directions of mathematical models in CO2 flooding. Pet. Geol. Recovery Effic. 2013, 20, 77–82. [Google Scholar]
  22. Cao, X.-P.; Feng, Q.-H.; Yang, Y.; Wang, S.; Kang, Y.-Y.; Zhang, C.-B. Migration law of CO2-crude oil miscible zone and its influence on development effect. Pet. Geol. Recovery Effic. 2021, 28, 137–143. [Google Scholar]
  23. Liu, J.; Li, M.; Liu, Y.; Zhao, H. Visualization experiment on micro mechanism of CO2 huff and puff. Fault-Block Oil Gas Field 2017, 24, 230–232. [Google Scholar]
  24. Su, C.; Sun, L.; Li, S.-L. Mechanism of CO2 Miscible Flooding During Multiple Contact Procedures. J. Southwest Pet. Univ. 2001, 23, 33–36. [Google Scholar]
  25. Guo, P.; Sun, L.-T.; Li, S.-L.; Xiong, Y.; Sun, L.; Peng, P.-S.; Yue, L. Theoretical Simulation and Experimental Study of The Influence of CO2 Injection on PVT of Crude Oil. Nat. Gas Ind. 2000, 2, 76–79. [Google Scholar]
  26. Belhaj, H.; Abukhalifeh, H.; Javid, K. Miscible oil recovery utilizing N2 and/or HC gases in CO2 injection. J. Pet. Sci. Eng. 2013, 111, 144–152. [Google Scholar] [CrossRef]
  27. Hu, Z.-H.; Song, W.-Z.; Yang, Y. Experimental study of the influence of natural gas injection on PVT of crude oil. Petrochem. Ind. Appl. 2014, 33, 36–39. [Google Scholar]
Figure 1. Ultra-high pressure fluid phase analysis (PVT) system.
Energies 16 06693 g001
Figure 2. Flow chart of experimental simulation of supercritical phase behavior in oil–gas system.
Energies 16 06693 g002
Figure 3. CO2 P–T phase diagram and phase transition path. (The different colored chain lines represent different densities at the corresponding pressure and temperature, and the black dotted lines represent the boundary of the supercritical state).
Energies 16 06693 g003
Figure 4. Gas–liquid volume changes in the two-phase region.
Energies 16 06693 g004
Figure 5. Phase change of CO2 on saturated vapor pressure. (The yellow lines represent the liquid–gas boundary, and the yellow arrows represent liquid height).
Energies 16 06693 g005
Figure 6. CO2 phase changes from the gas phase region to the supercritical region. (a) PVT cell characteristics. (b) Infrared phase characteristics.
Energies 16 06693 g006
Figure 7. Changes of CO2 physical property parameters from the gas phase region to the supercritical phase region.
Energies 16 06693 g007
Figure 8. CO2 phase changes from liquid phase region to supercritical phase region. (a) PVT cell characteristics. (b) Infrared phase characteristics.
Energies 16 06693 g008
Figure 9. Changes of CO2 physical property parameters from the liquid phase region to the supercritical phase region.
Energies 16 06693 g009
Figure 10. Supercritical mass transfer characteristics of three kinds of gas (CO2/CH4/N2)-formation oil. (a) CO2-formation oil system. (b) CH4-formation oil system. (c) N2-formation oil system.
Energies 16 06693 g010
Figure 11. Supercritical mass transfer layer division in oil and gas system during boosting process.
Energies 16 06693 g011
Figure 12. Composition distribution of carbon numbers extracted from layer 1 of the gas formation oil system.
Energies 16 06693 g012
Figure 13. Distribution diagram of critical point of general fluid.
Energies 16 06693 g013
Figure 14. Relationship between CO2 density and miscible pressure. ( represents Chinese oil reservoirs, represents foreign oil reservoirs, the gray chain lines represent different densities at corresponding pressure and temperature and the black dotted lines represent the boundary of the supercritical state).
Energies 16 06693 g014
Figure 15. Distribution of light hydrocarbon components in formation oil at China and abroad.
Energies 16 06693 g015
Figure 16. Relationship between oil and gas minimum miscibility pressure and CO2 density.
Energies 16 06693 g016
Disclaimer/Publisher’s Note: The statements, opinions and data contained in all publications are solely those of the individual author(s) and contributor(s) and not of MDPI and/or the editor(s). MDPI and/or the editor(s) disclaim responsibility for any injury to people or property resulting from any ideas, methods, instructions or products referred to in the content.

