Abstract
The ramped temperature oxidation (RTO) test is a screening method used to assess the stability of a reservoir for air-injection Enhanced Oil Recovery (EOR) and to evaluate the oxidation behavior of oil samples. It provides valuable kinetic data for specific cases. The RTO test allows for the analysis of various characteristics, such as temperature evolution, peak temperatures, oxygen uptake, carbon dioxide generation, oxidation and combustion front velocity, recovered and burned hydrocarbons, and residual coke. The adaptation of RTO experiments to in situ combustion (ISC) modeling involves validation and history matching based on numerical simulation of RTO tests, using 3D digital models of experimental setup. The objective is to estimate the kinetic parameters for a customized reaction model that accurately represents ISC. Within this research, the RTO test was provided for bitumen samples related to the Samara oil region. A 3D digital model of the RTO test is constructed using CMG STARS, a thermal hydrodynamic simulator. The model is designed with multiple layers and appropriate heating regimes to account for uncertainties in the experimental setup and to validate the numerical model. The insulation of the setup affects radial heat transfers and helps to control the observed temperature levels. The modified traditional reaction model incorporates thermal cracking of Asphaltenes, low-temperature oxidation (LTO) of Asphaltenes and Maltenes, and high-temperature combustion of coke. Additionally, the model incorporates high-temperature combustion of light oil in the vapor phase, which is generated through Asphaltenes cracking and LTO reactions.
1. Introduction
In Situ Combustion (ISC) is a promising and effective method for enhanced oil recovery (EOR), particularly for heavy oil or bitumen reservoirs, which are challenging to recover due to low mobility and extremely high viscosity [1,2,3]. This technique assumes an injection of air into the reservoir, which ignites and sustains the combustion of oil within the reservoir. As the oil burns it generates heat, which helps to reduce the viscosity of the heavy oil or bitumen, facilitating its recovery [2,4,5,6,7]. ISC is considered to be an efficient thermal EOR method, as it avoids the need for heat delivery to the reservoir, resulting in minimal energy losses [8]. Additionally, ISC has a lower requirement for natural gas and water compared to steam-based EOR methods [9].
This study investigates the ISC process for bitumen oil sand found in the South Tatar oil and gas area in the Volga-Ural province. The reservoir characteristics of interest are as follows: formation depth ranging from 145 to 195 m, average porosity of 28–30%, permeability of 730–740 mD, oil-saturated part thickness of 10.2–10.6 m, reservoir thickness of 17.1–17.8 m, and an average oil saturation of 94%, which makes it economically promising. The considered oil exhibits an average oil viscosity of 9000–9500 mPa·s and a gravity of 15.8–16 °API. Currently, the reservoir pressure stands at 0.72 MPa, while the reservoir temperature is relatively low at 9–10 °C. Preliminary calculations indicate elevated combustion temperature predictions due to the high porosity and oil viscosity.
The prediction of field performance for ISC projects relies on the utilization of laboratory experiments and numerical modeling. However, this process is highly challenging and encompasses various complexities. In numerical reservoir modeling, researchers encounter several key difficulties, and the most challenging is the construction of an appropriate kinetic model for a specific range of components [2,10,11,12]. Numerous studies have tackled this issue and proposed approaches to overcome these challenges [13,14,15,16,17]. There are a number of proposed ISC kinetic models for crude oils, specifically for Maltenes and Asphaltenes fractions [4,12,16,18] and Saturate, Aromatic, Resin, and Asphaltene (SARA) fractions [19,20,21,22]. Nevertheless, the majority of the existing models are constructed based on static oxidation experiments, which do not account for thermal and hydrodynamic processes during ISC. Another significant challenge lies in accurately determining phase equilibria within the system, while considering parallel chemical reactions and critical conditions. Several research works have addressed this matter, investigating the impact of phase behavior on the ISC process and proposing methodologies to account for these complex phenomena [23,24]. Moreover, the changes in porosity resulting from chemical reactions, the presence of anisotropy, and the discrepancy between laboratory-scale and field-scale effects, present additional obstacles to be overcome in numerical modeling studies [25,26,27,28]. A seminal work by [29] emphasized the fundamental role of a reliable kinetic model in accurately representing the combustion process. The authors highlighted that a robust kinetic model forms the foundation of a well-developed combustion model. In their study, they specifically focused on the validation of appropriate kinetic models that effectively capture the oxidation of the target oil. In the field of ISC, there are two well-accepted mechanisms for the oxidation of oil compounds: low-temperature oxidation (LTO) and high-temperature oxidation (HTO). LTO involves reactions where oxygen is added to the oil species, while HTO is characterized by reactions that break bonds and result in the formation of water and carbon oxides. These oxidation reactions are accompanied by different rates of oxygen uptake and heat generation and take place within specific temperature ranges [30,31,32].
There are several laboratory tests available to evaluate the oxidation process in ISC. One can investigate oxidation behavior of crude oil fractions by separate or a combination of static oxidation tests, including differential scanning calorimetry, accelerating rate calorimetry, and thermogravimetric analysis [20,21,33,34,35]. Nonetheless, the results of these tests are sensible to operational parameters and do not take into account influence of hydrodynamic characteristics [16]. Nevertheless, the results after proper upscaling should be considered as a starting point for the further ISC performance evaluation. Among dynamic tests, one can provide a quantitative screening experiment, the combustion tube (CT) test, which holds significant importance for assessing ISC performance in a specific oil field [4,36]. It provides valuable data for full-field modeling and crucial combustion parameters. Nonetheless, due to the features of experimental setup and complexity of physio-chemical processes occurring in the reactor, it becomes challenging to distinguish different ranges of oxygen uptake and match it to corresponding temperature ranges. Consequently, verification of oxidation reaction model becomes obstructed. For these purposes, the ramped temperature oxidation (RTO) test could be more appropriate to verify relevant kinetic data and evaluate oxidation behavior, due to the hydrodynamic aspect of ISC. Researchers have found that the integration of RTO experimental results with numerical simulations of ISC, under controlled experimental conditions, can yield the required kinetic parameters for the adapted oxidation reaction scheme [16]. This approach allows for a better understanding of the oxidation process and enables accurate evaluation of ISC performance.
This study focused on conducting a ramped temperature oxidation (RTO) test using a sample of oil sand bitumen obtained from the Samara oil region. The collected bitumen sample was analyzed to investigate its oxidation behavior. Additionally, three-dimensional numerical modeling of the RTO experiment was performed by utilizing CMG STARS. The main objective of these simulations was to validate reaction kinetic model for bitumen oxidation and reproduce the temperature regions detected during the experimental process. The reaction model, proposed and validated based on the various reaction kinetic models, investigated for maltene and asphaltene fractions [4] and includes the principal modification that allows for consideration of the effect of the vapor-phase combustion reaction of volatile oil fractions [16]. By adjusting the corresponding kinetic parameters based on the simulation results, a laboratory-scale numerical model of the ISC process was developed specifically for the bitumen under investigation. Through this integrated approach of experimental testing, analysis, and numerical modeling, a better understanding of the oxidation behavior of the bitumen sample was achieved. The developed numerical model provides valuable insights into the ISC process and aids in predicting and optimizing the performance of the specific oil field in question.
2. Description of the RTO Test
The RTO test was conducted under reservoir conditions with a pressure of 0.7 MPa. The experimental work involved the preparation of equipment and a laboratory-scale reservoir model, the actual execution of the experiment, and the subsequent analysis of the extracted samples. The RTO experiment was performed using a setup that incorporated a cylindrical reactor filled with crushed rock, which was saturated with oil, water, and gas in fixed proportions to replicate realistic oil saturation conditions. However, it is worth noting that the porosity values of the setup were higher (48%) than those found in actual reservoirs, primarily due to the use of a premixed strategy and the presence of initial gas in the mixture. The oil sand bitumen that was utilized in the experiment consists of 16.96 wt% of Asphaltenes. Its density at 20 °C is 965 kg/m3 and viscosity at 25 °C is 1387 cP. The element composition includes 66.9 wt% of Carbon, 8.77 wt% of Hydrogen, 0.26 wt% of Nitrogen and 3.85 wt% of Sulfur. During the RTO experiment, a mixture of oxygen and nitrogen is injected into the reactor, which is heated linearly according to a predetermined heating schedule. The reactor operates in a differential mode until the first exothermic behavior is observed. A detailed description of the design of the RTO experimental setup can be found in the references [7,37,38].
The experimental setup configuration is outlined in [39]. The RTO tube is a thin-walled reactor with an outer diameter of 25.4 mm, a wall thickness of 1.65 mm, and a reactor length of 483 mm made of steel grade Inconel. In this setup, a copper bar stock is affixed around the reactor to facilitate heat transmission throughout the entire model. The RTO tube is divided into seven zones of equal length, each equipped with thermocouples positioned at the inner point to monitor the temperature in each zone. This experimental arrangement allows for conducting field pressure experiments and enables real-time measurements of temperature response, as well as the quantity and composition of the produced gases and fluids. The reactor is capable of achieving and sustaining operating pressures up to 41 MPa. The gas chromatographs are directly connected to the reactor outlet, enabling a comprehensive analysis of all gases produced, including hydrocarbons. Unlike volumetric models, this setup eliminates restrictions associated with the organic substance content. Many gas analyzers face limitations due to their narrow detection range for carbon monoxide.
The liquid fluids produced during the experiment are collected in a sampling system equipped with four traps, allowing for analysis of their composition and correlation to the corresponding oxidation temperature range. The temperature and heating rate can be precisely controlled within the range of 25–800 °C, facilitating experiments in both isothermal and non-isothermal modes with the desired heating rate to replicate the specific heating rate during ISC. Furthermore, the low heating rate enables the evaluation of compositional data associated with oxygen-addition reactions in the low temperature region (LTR), while a rapid heating rate would minimize its effect during the experiment. Key operational events for the RTO test included the initiation of helium injection with a rate of 15.34 st.l/h, pressurization to 0.7 MPa, air injection with a rate of 15.34 st.l/h, preset linear heating with a speed of 40 °C/h, and pressure drop.
3. Experimental Results
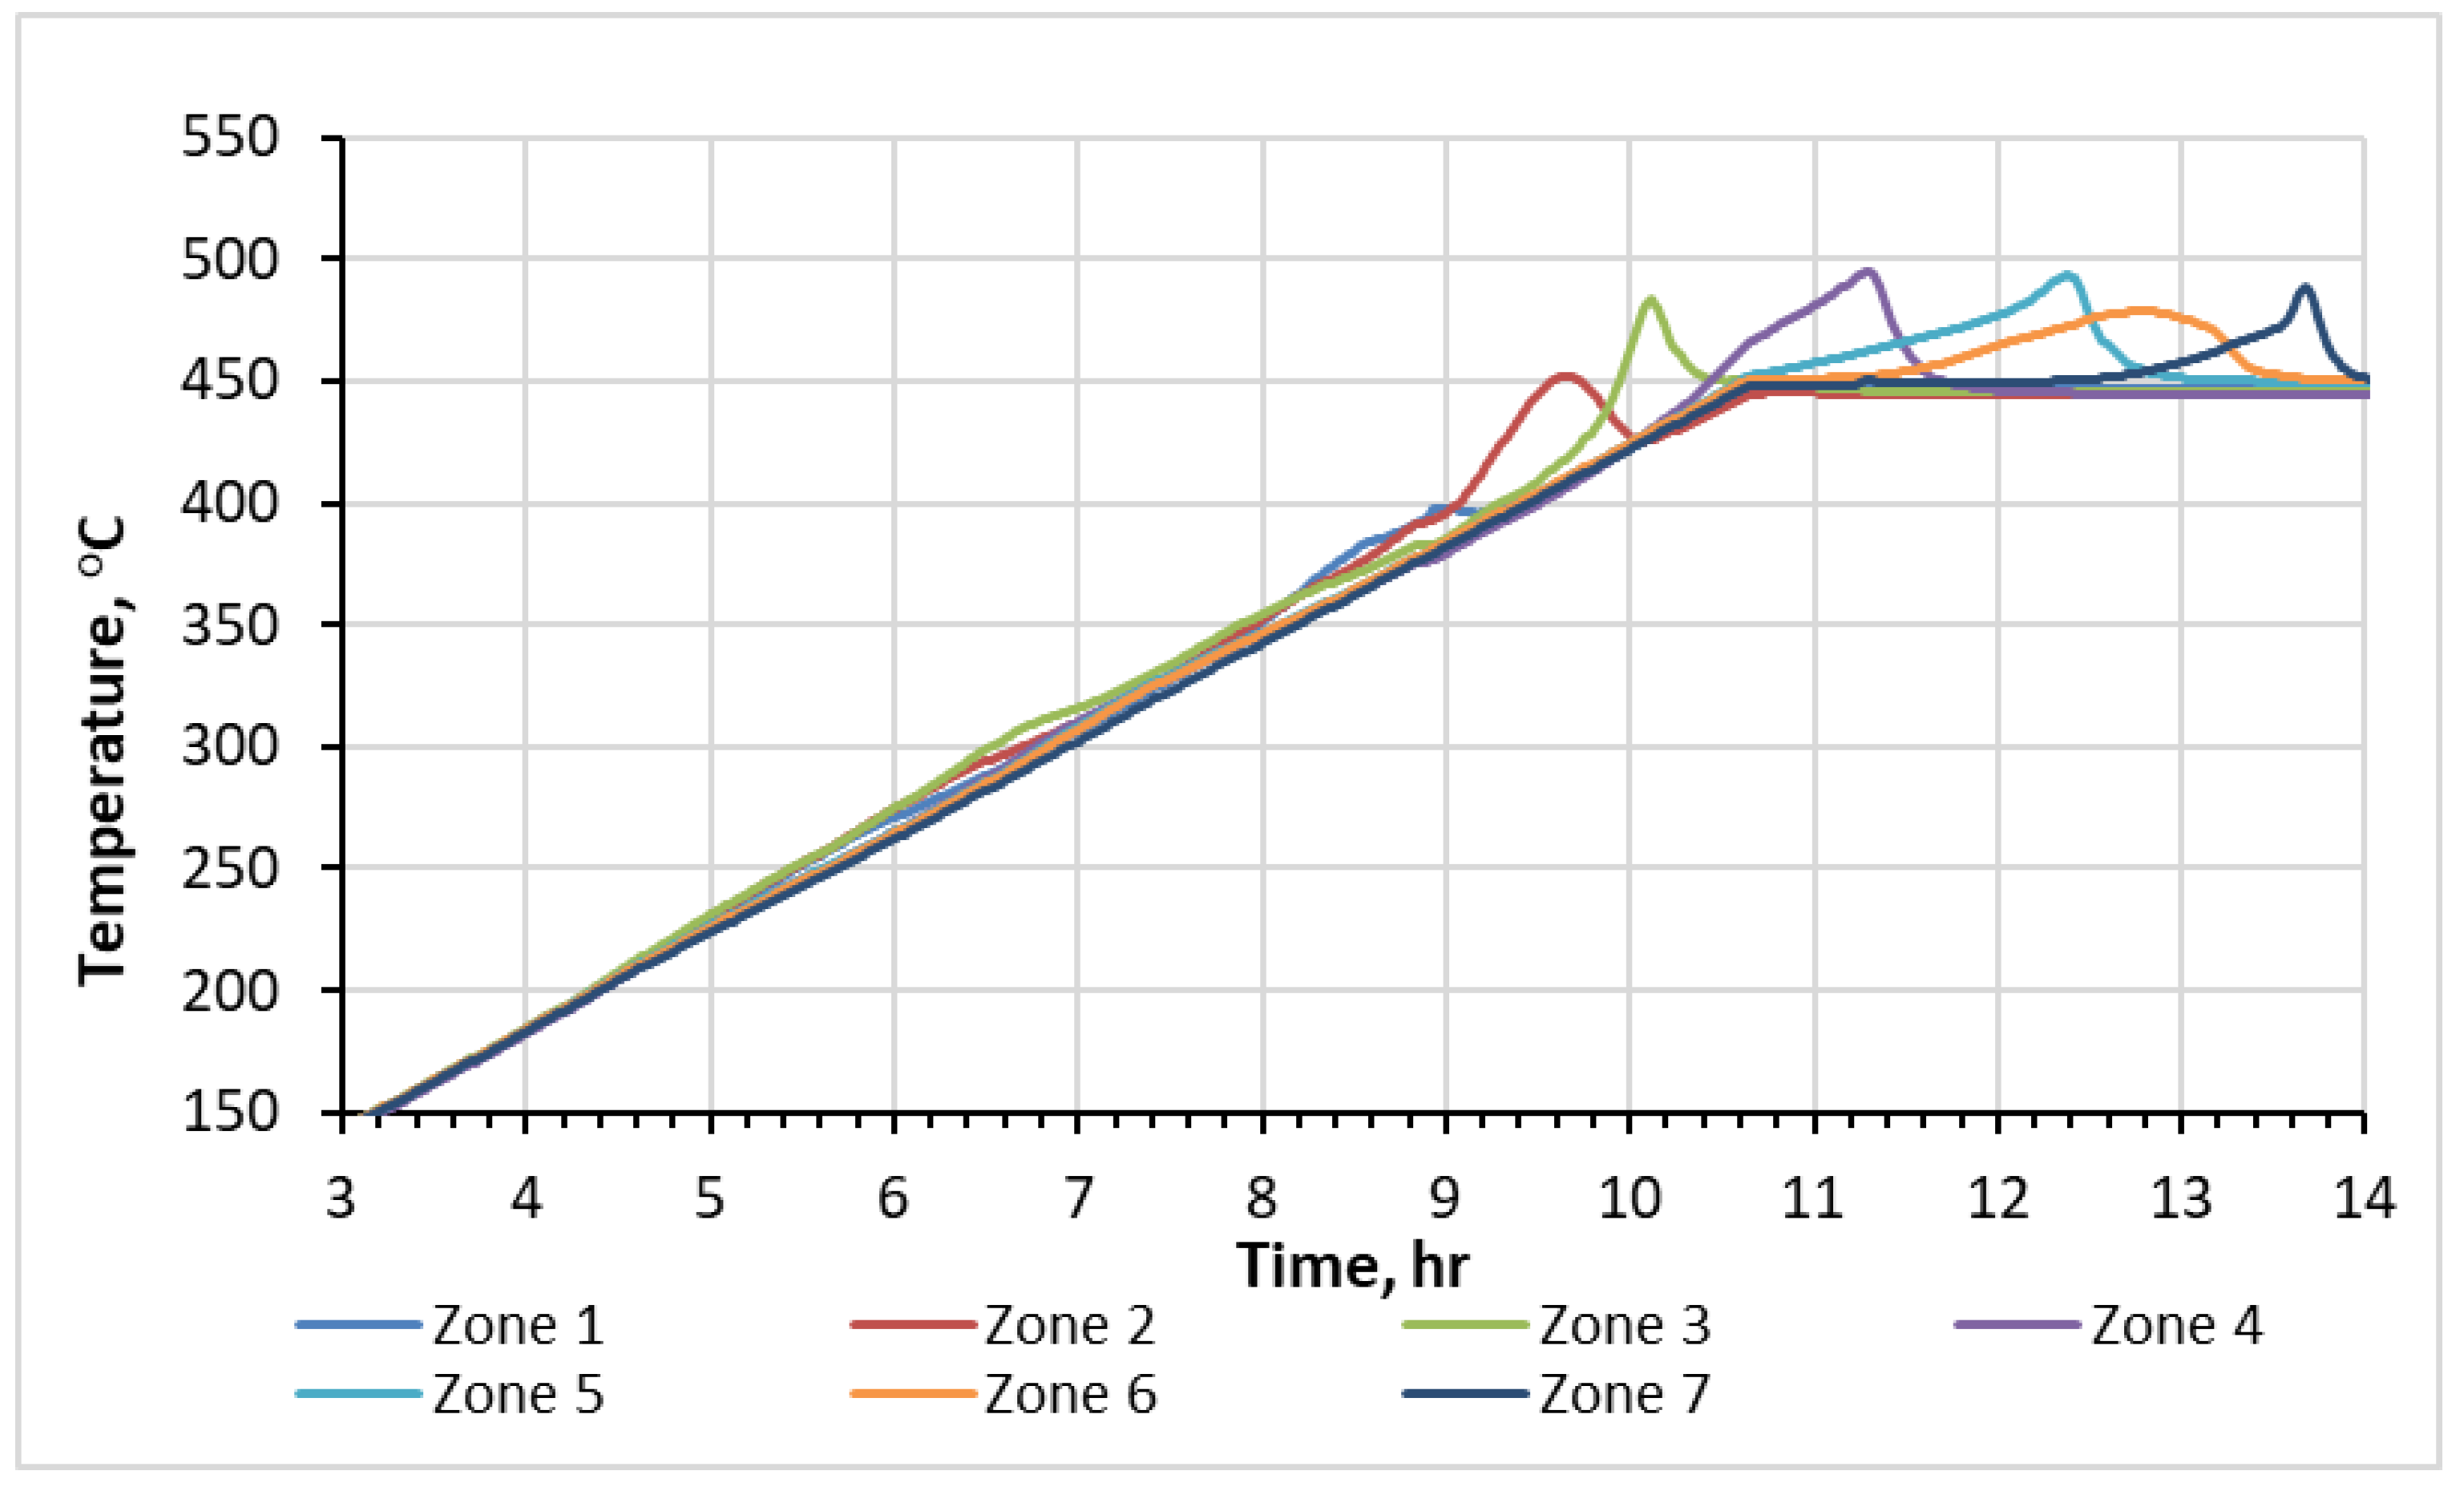
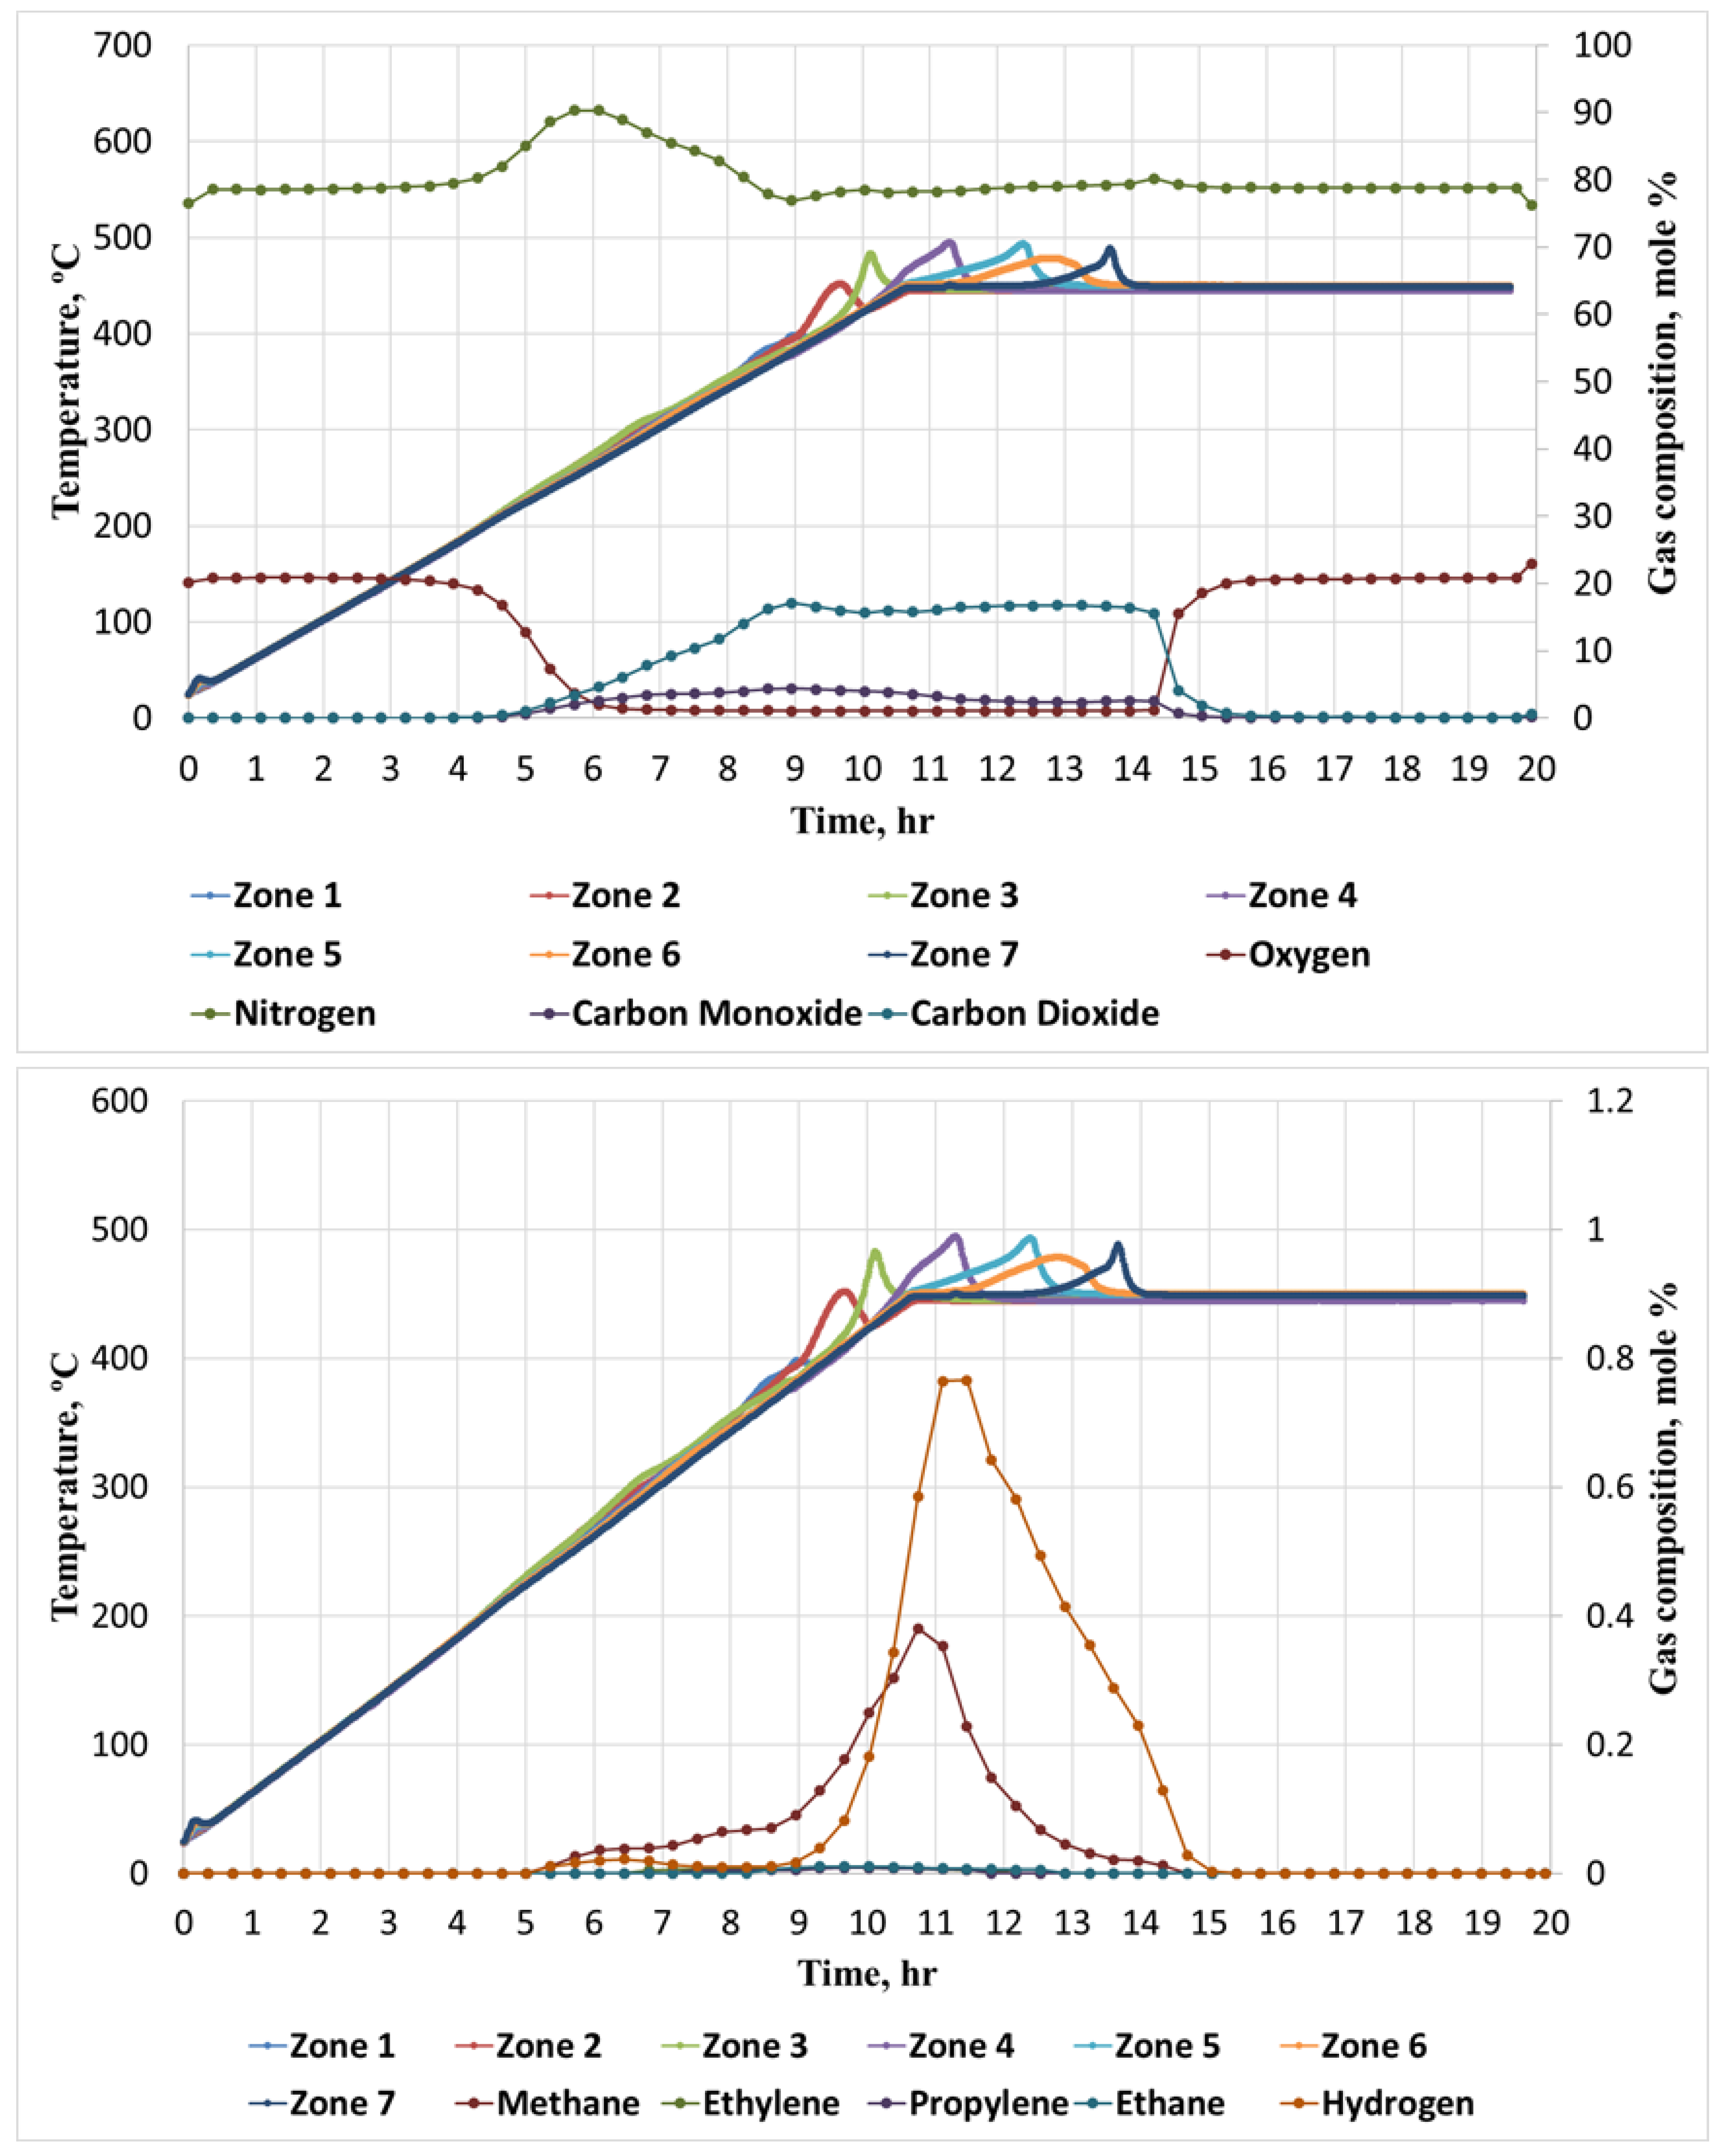
The internal thermocouples within the reactor detected the movement of two waves, endothermic and exothermic, as they traversed through the saturated crushed rock during the experiment. The resulting temperature profiles over time, recorded by thermocouples placed in each of the seven sectors of the RTO tube, are presented in Figure 1. The observed heat releases correspond to oxygen-addition and bond-scission reactions, followed with O2 uptake. The temperature elevation in zone 1 of the reactor commences at approximately 190 °C, signifying the onset of the exothermic oxidation process. Figure 1 highlights the existence of NTGR, which is observed between the temperature range of 315 °C and 360 °C. This region represents the transitional phase between two distinct oxidation regimes occurring at different temperature levels: the low-temperature region (<315 °C) and the high-temperature region (>360 °C). These regions display different shapes of temperature peaks. The temperature profiles for the first three sectors exhibit two local maxima, indicating the presence of two distinct exothermic fronts moving through the core pack during the experiment. The first temperature peaks in these three zones locate between 190 °C and 315 °C, corresponding to the LTR. Plane-shaped patterns and magnitudes of these peaks suggest a relatively slow rate of oxygen consumption. Therefore, it can be inferred that these exothermic waves are primarily a result of predominance of oxygen-addition reactions in between 190 °C and 315 °C. Additionally, alongside the exothermic waves, endothermic wave should occur during the ISC. However, in this experiment, the low initial water content leads to a relatively low impact of water evaporation. Consequently, the endothermic episodes are not easily recorded.
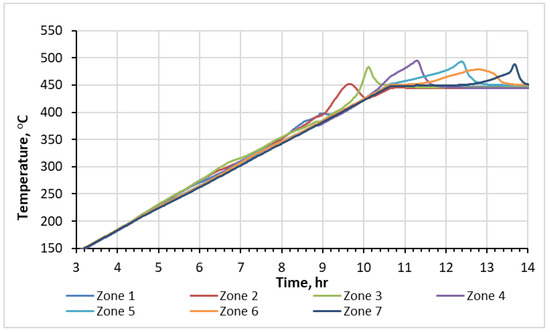
Figure 1.
Temperature profiles measured with thermocouples during RTO test.
Figure 2 illustrates correspondence between time evolution of molar fractions of N2, O2, CO, CO2, He, and time evolution of temperature. Following the initiation of exothermic reactions, there is a noticeable increase in the molar fraction of N2. The highest molar fraction of nitrogen detected is achieved in the LTR. Figure 2 also depicts only partial consumption of O2 within the LTR, suggesting the prevalence of oxygen-addition reactions in the LTR. However, this consumption does not compensate for simultaneous formation of CO2 and other combustion gases. Furthermore, the positioning of the initial local temperature maximum in the first three sections of the reactor indicates that the exothermic processes in these areas of the reactor occur concurrently. This simultaneous reaction pattern may be a result of incomplete O2 consumption in the first section, allowing it to propagate through the core pack and react simultaneously in the first three sections. At approximately 360 °C, a substantial generation of hydrocarbon gas is observed as a result of bond-scission reactions in the high temperature region (HTR). Within this temperature range, distinct and clearly defined temperature peaks are observed. Similarly, the highest molar concentration of generated CO2 is also attained at this temperature level. Figure 2 visually portrays the reestablishment of the initial molar fraction of N2 taking place at approximately the identical temperature, thereby denoting the commencement of the high-temperature oxidation process at around 360 °C.
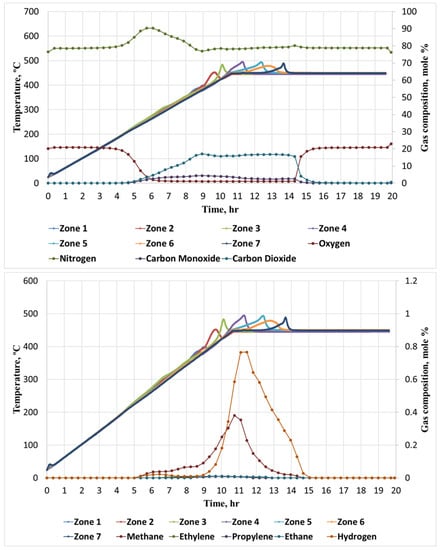
Figure 2.
Time evolution of temperature and molar concentration of hydrocarbon and non-hydrocarbon gasses during RTO experiment.
The temperature at which combustion is initiated is determined to be 190 °C. This value is obtained by analyzing the highest gradient of the initial temperature peak observed during the RTO test. In Figure 3, the propagation of the combustion front along the reactor in the HTR is depicted, starting from a temperature of 360 °C. The velocity of the combustion front through zones 4 and 7 was measured to be 7.25 cm/h. The corresponding data for zones 4 to 7 are represented by black solid dots in Figure 3. It is important to note that the first three zones are not considered in this analysis since the velocity of the front had not yet stabilized in those regions.
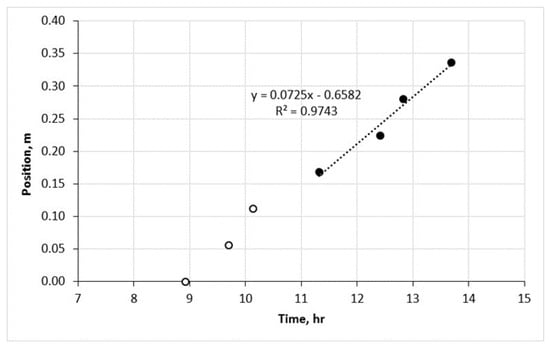
Figure 3.
The stable combustion front propagation in the HTR.
4. Numerical Simulation of the RTO Test
4.1. Model Description
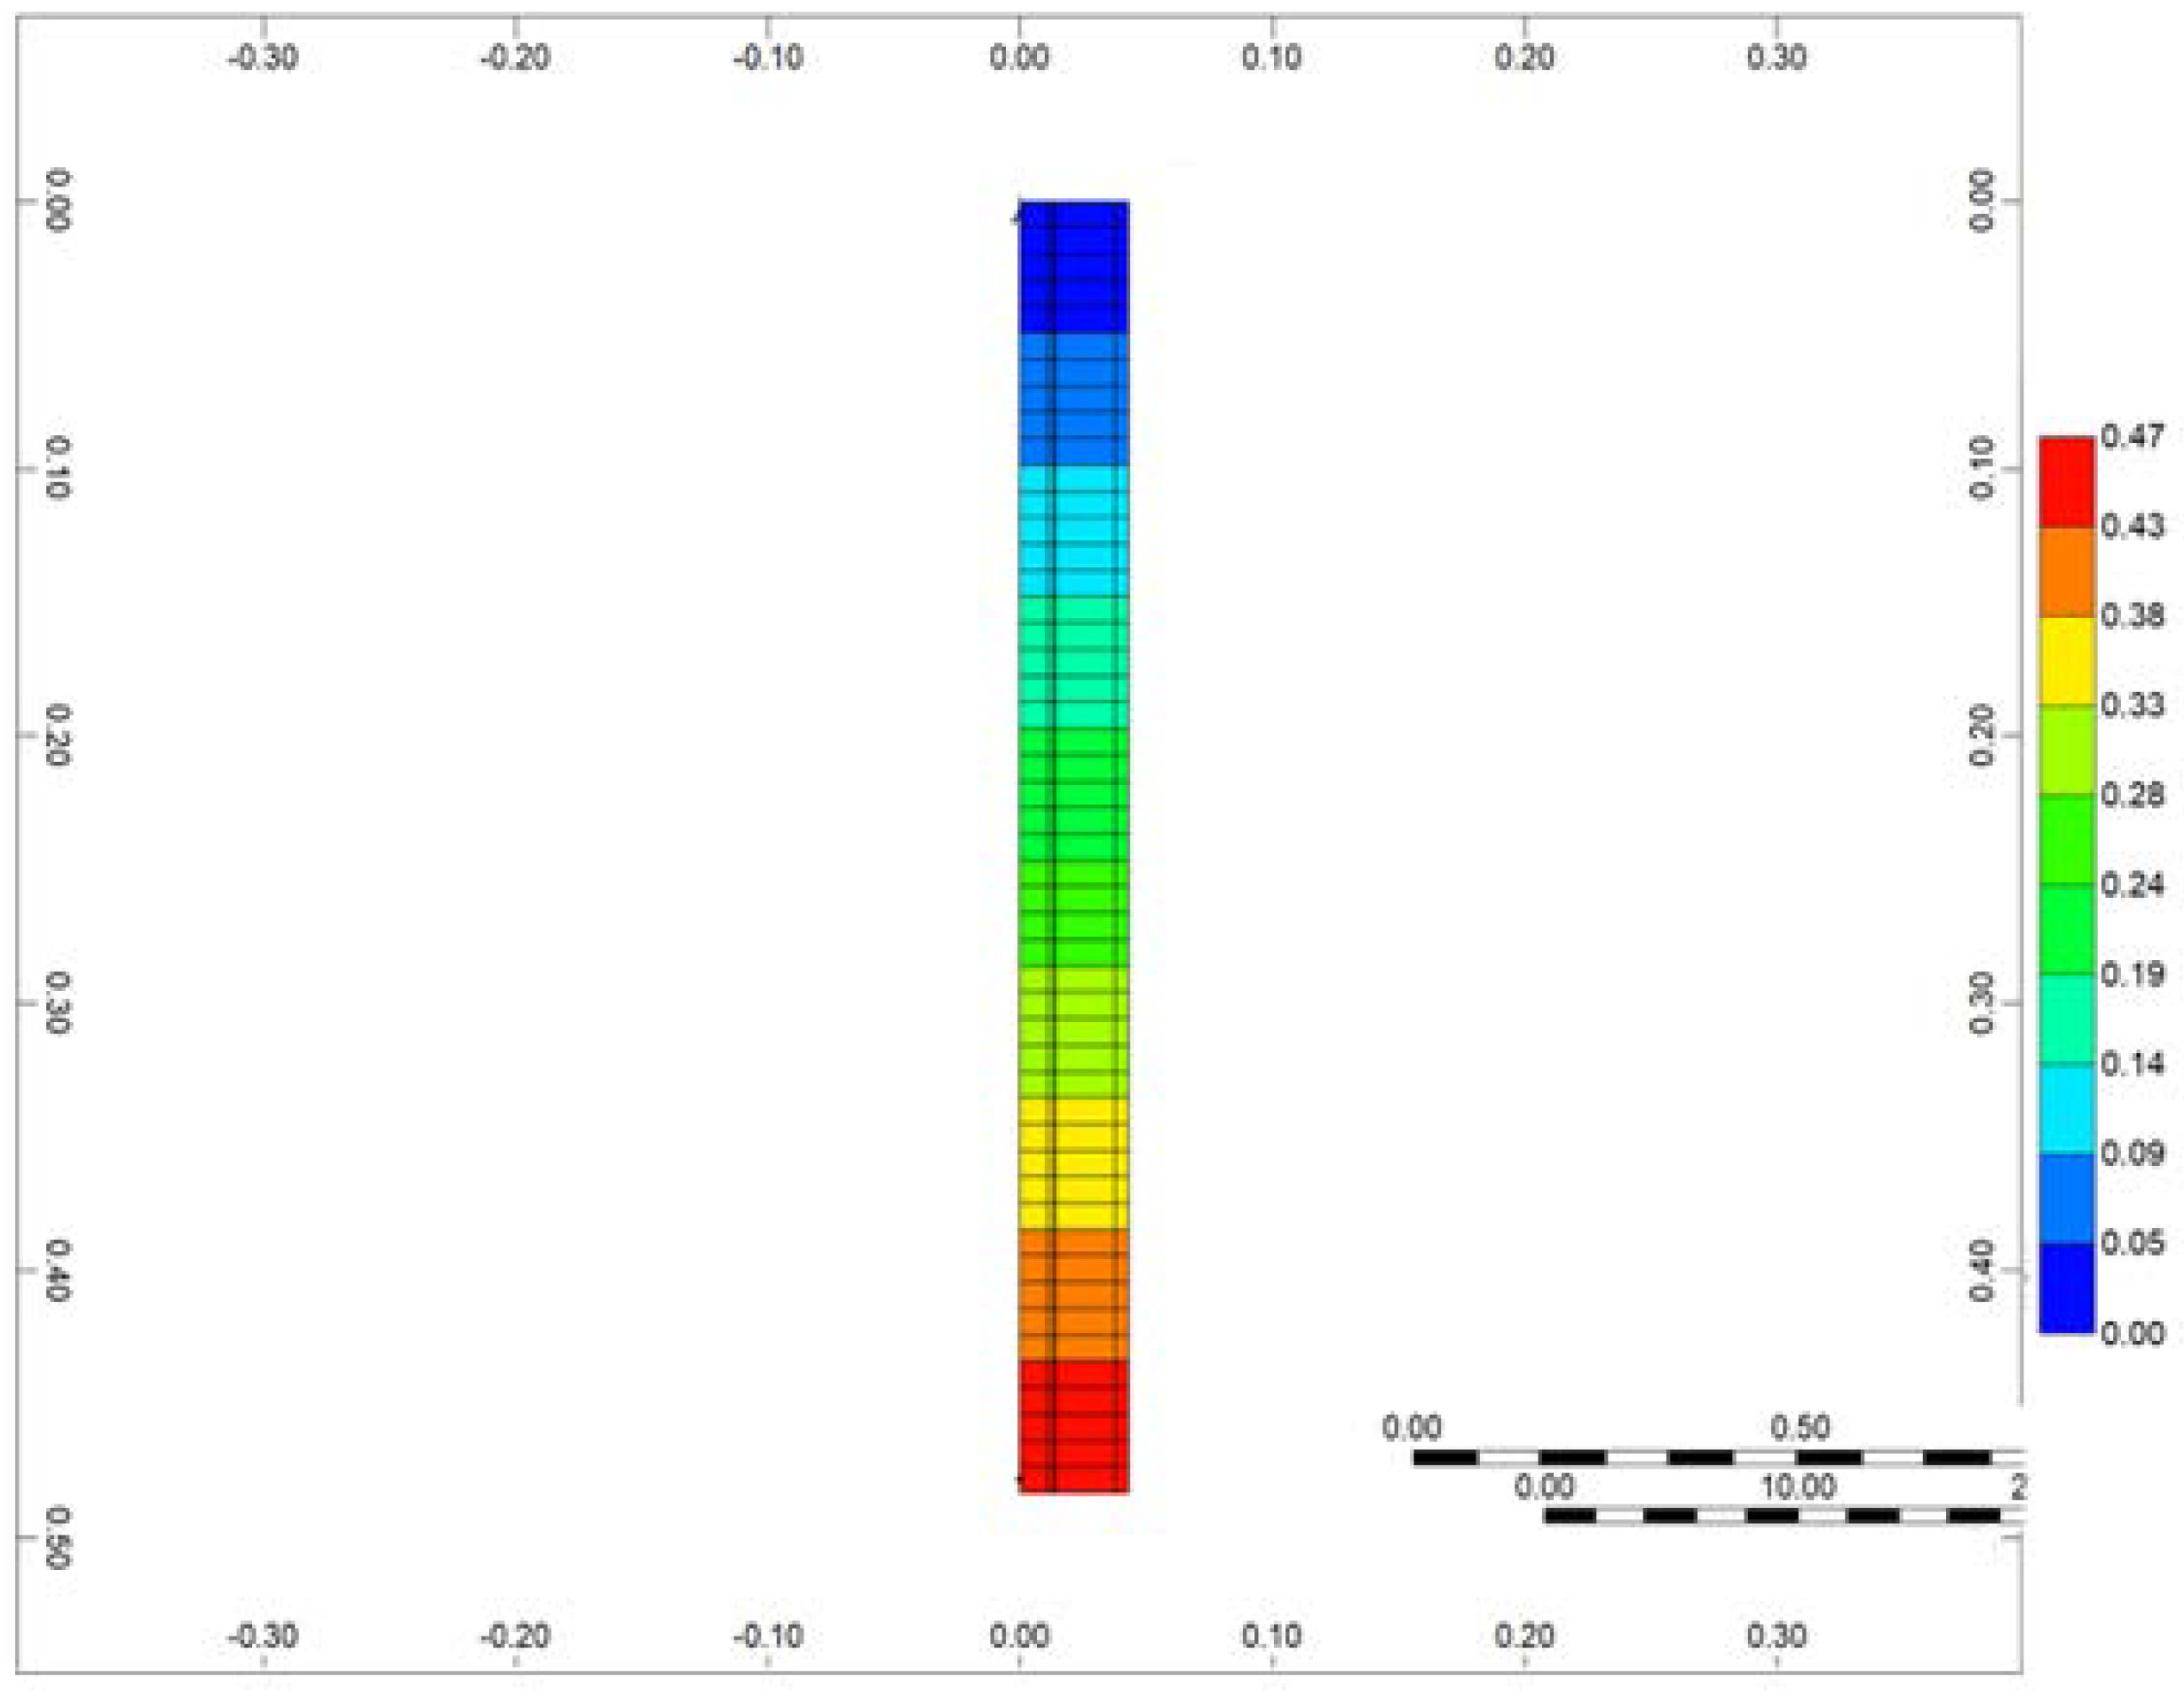
The simulation of the RTO reactor was conducted using the CMG STARS thermal hydrodynamic simulator. For the numerical simulation of the RTO experiment, a radial model was employed (Figure 4). The resolution of the model at each direction was based on spatial convergence tests to ensure the stability of the model. In the simulation, the radial blocks were designed to replicate the layers of the experimental setup, including the reactor, steel wall, insulation, and heaters. By incorporating these layers into the model, a comprehensive representation of the RTO reactor system was achieved. The detailed 3D design of the RTO reactor, along with the specific characteristics of each layer, can be found in [39]. This publication provides in-depth information and insights into the structure and operational aspects of the RTO reactor.

Figure 4.
3D numerical setup of RTO tube.
Initial porosity of the model varied from 47 to 49% and initial thermal properties of the rock were as follows: thermal conductivity—1.72 W/m/K and thermal capacity—2120 kJ/m3/K. Table 1 provides a summary of the additional conditions required to initialize the model, specifically focusing on the temperature-dependent variations of density and viscosity for bitumen. These reference conditions were utilized as benchmarks in the test simulations. Additionally, Table 1 displays the initial saturations and molar fractions of Maltenes and Asphaltenes within the experimental model. These values were estimated according to measured mass balance parameters and the molar masses of target bitumen, Maltenes, and Asphaltenes.

Table 1.
Model initial conditions.
The approach employed for determining the viscosities of the oil pseudo components at different temperatures relied on a mixing rule [40], formulated as follows:
Temperature dependence of used viscosity was interpolated by utilizing Walther’s relation [41,42] not by using Andrade’s equation:
The decision was made to avoid extrapolation to combustion temperatures due to the resulting viscosities, which were found to be unrealistically low.
The traditional reaction kinetic model [4] is utilized as a foundation to represent oxygen consumption, carbon dioxide, water, and heat generation resulting from bitumen oxidation and compositional changes during the RTO test. This model, originally developed for Athabasca Bitumen, incorporates thermal cracking of Asphaltenes, polymerization of Maltenes and Asphaltenes, or LTO, and combustion of coke, or HTO. However, in this study, the model has been modified to account for the influence of combustion of volatile hydrocarbons in vapor phase. This modification has proven to be crucial in correct description of ISC [16,43]. The modified model includes Light oil vapor phase combustion in HTR. The highly volatile Light oil arises from series of LTO reactions and thermal cracking. The flammable limits for vapor-phase combustion, crucial for controlling component migration to vapor phase, are adopted from [43].
Here is a summary of the reaction model employed in this research:
LTO:
(1) 1.0 Asph + 7.5075 O2 = 0.01327 LO + 106.37116 Coke,
(2) 1.0 Malt + 2.77594 O2 = 0.004009 LO + 0.38185 Asph,
HTO:
(3) 1.0 Coke + 1.1245 O2 = 0.249 H2O +1.0 CO2,
(4) 1.0 LO + 20.347 O2 = 15.51 H2O +13.269 CO2,
Thermal Cracking:
(5) 1.0 Asp = 0.66383 Malt + 0.515094 LO + 12.40909 CO2 + 17.264822 Coke.
To integrate this reaction model into hydrodynamic one the bitumen was characterized by four pseudo-components including LO (light oil) to reproduce HTO of evaporated hydrocarbons. Table 2 provides the gas–liquid k-value correlation and PVT properties of the modeled pseudo-components.
Table 2.
Pseudo-components and K-value correlation coefficients.
4.2. History Matching and Numerical Results
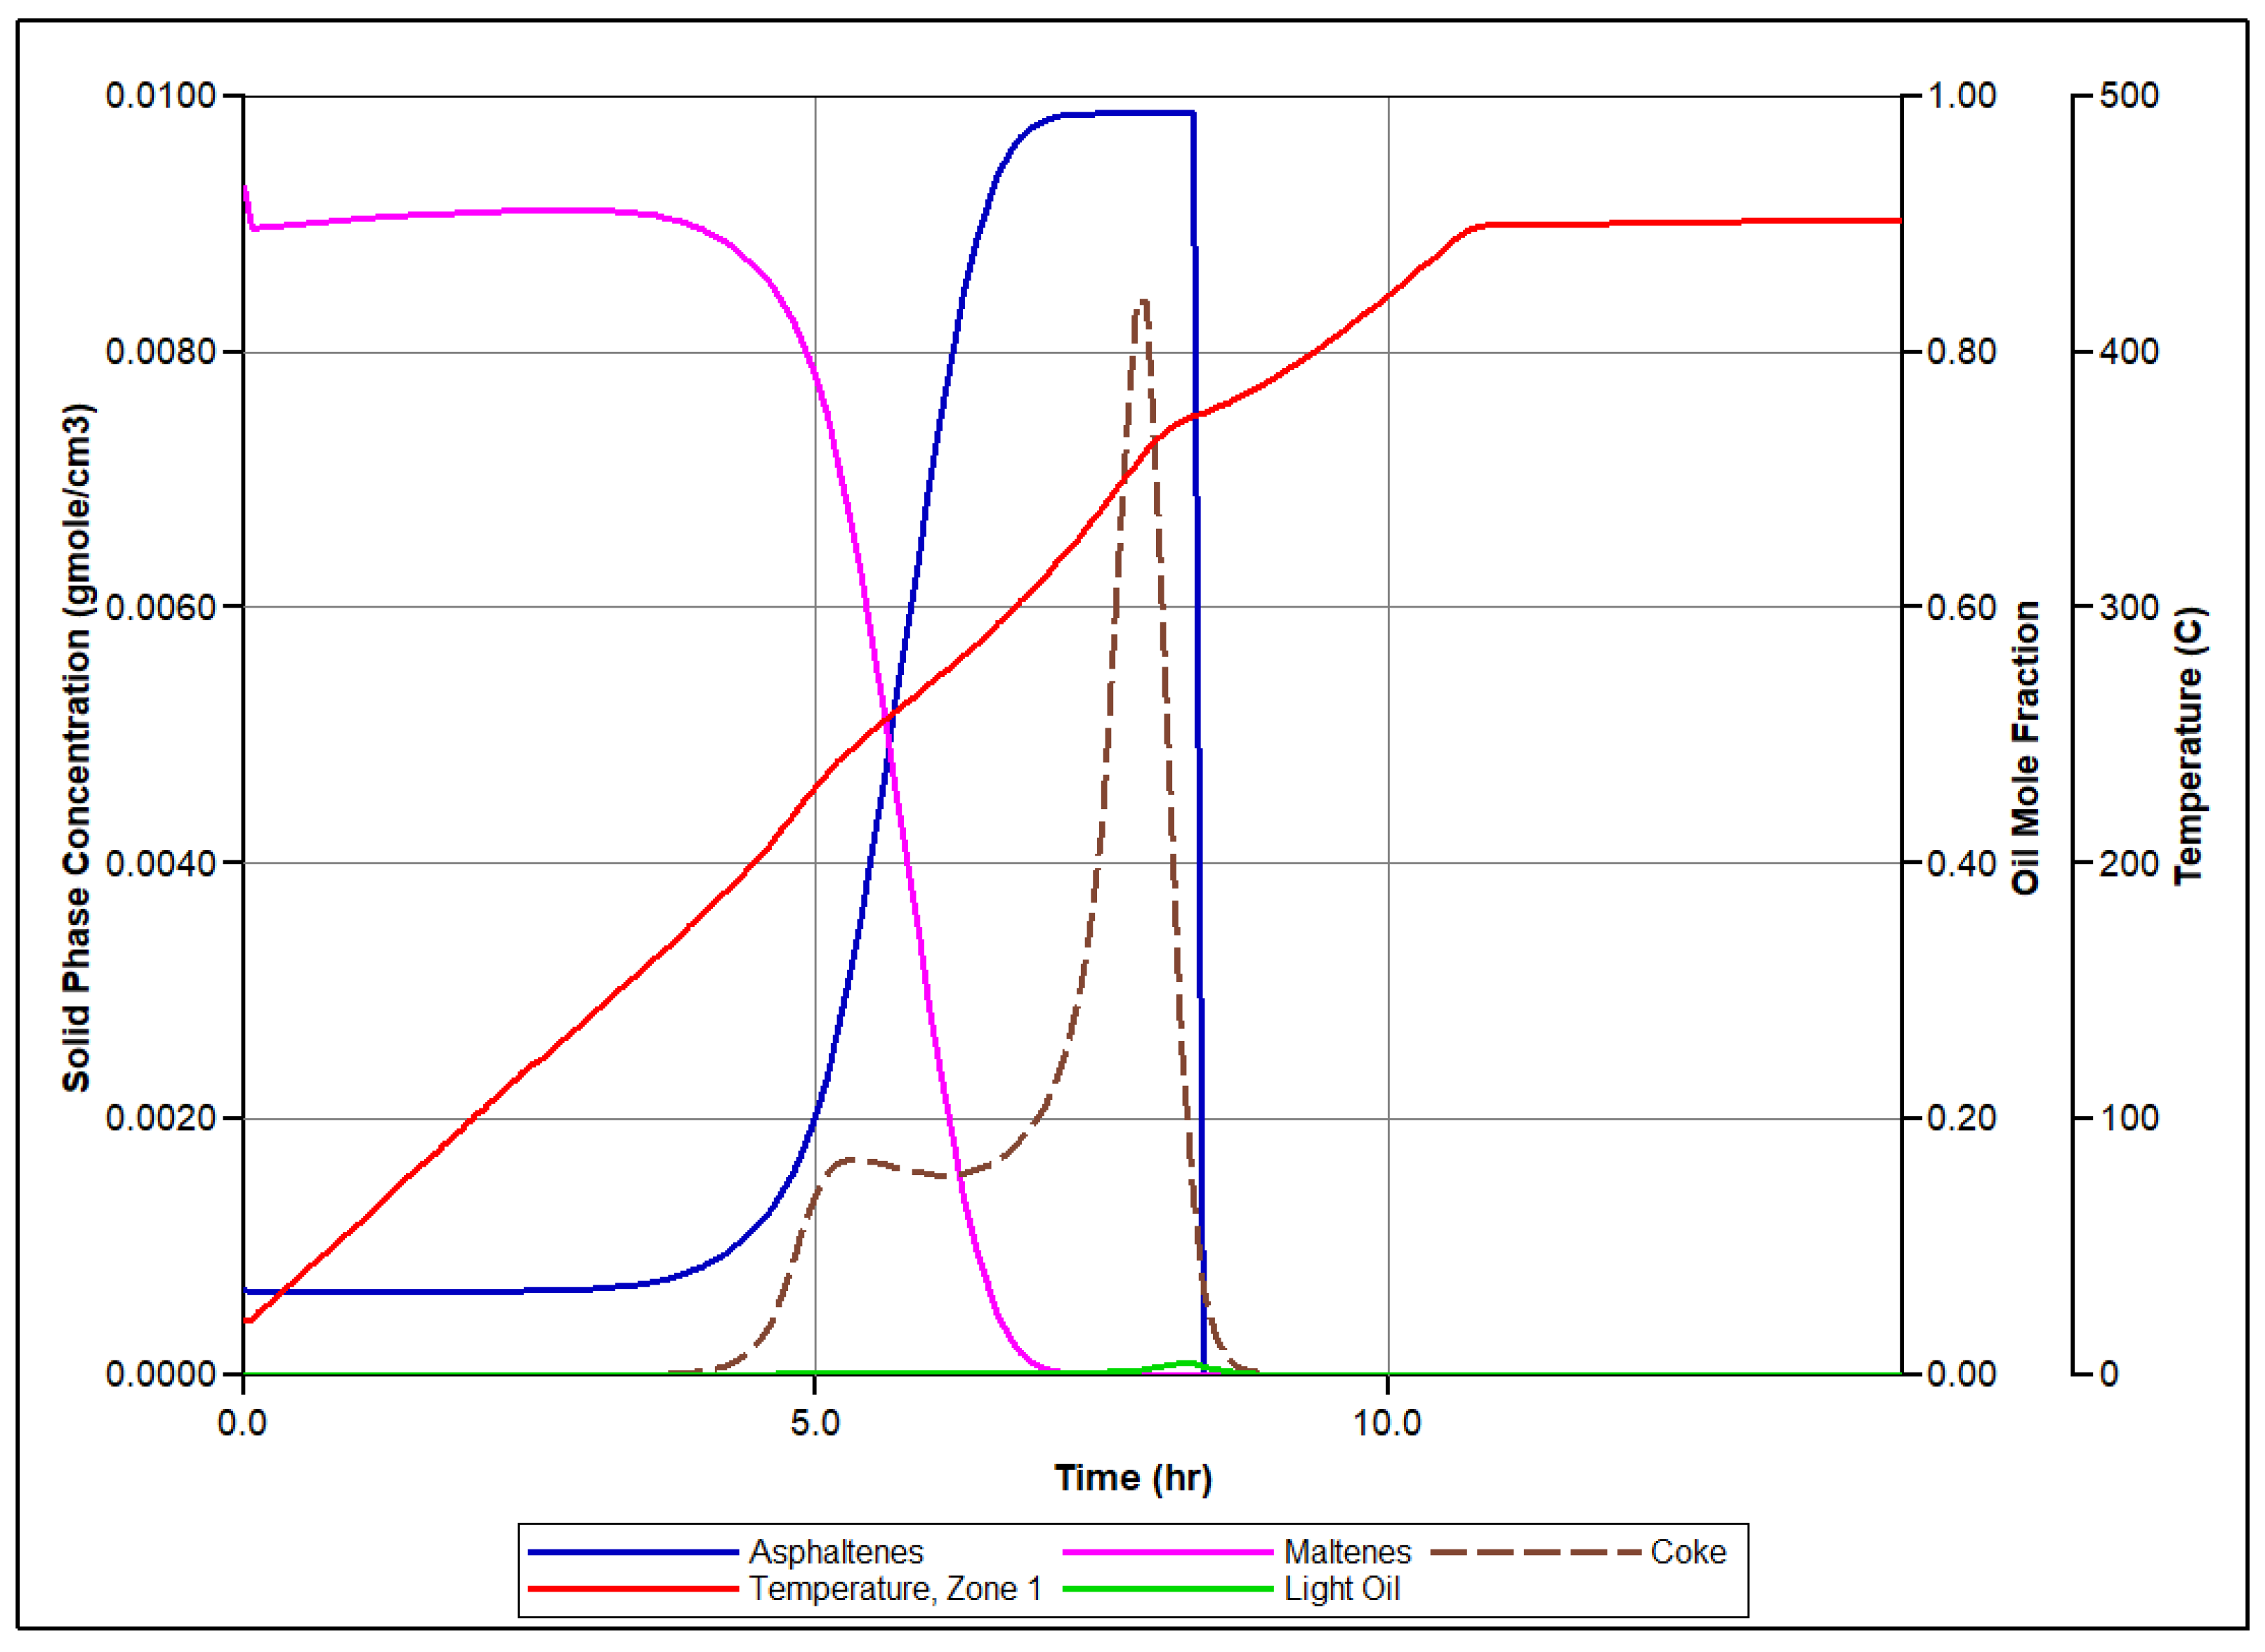
Figure 5 presents the simulated molar concentrations of produced O2, N2, and CO2 over time, along with the associated temperature profiles for each zone of the reactor. Let us focus on the set of events conducted in the first sector of the RTO tube during numerical modeling of the RTO experiment to illustrate the mechanism of bitumen oxidation underlying the model. Figure 6 illustrates time evolution of mole concentration of modeled pseudo-components and associated temperature evolution. In this zone, LTO of Maltenes takes place at the first exothermic peak release depicted in Figure 6. This local temperature maximum represents the first exothermic wave moving through the reactor during experiment. Additionally, the presence of the Light oil component arises due to thermal cracking and polymerization of Maltenes and Asphaltenes in LTR. The second local temperature maximum observed in the HTR associated with the next exothermic front propagating through the coke pack occurs due to the vapor Light Oil and Coke combustion in HTR.
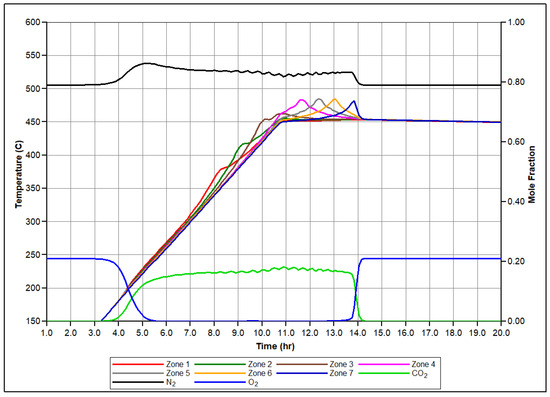
Figure 5.
Produced molar fractions of O2, N2, CO2, and temperature profiles for each sector of the RTO tube during numerical simulation.
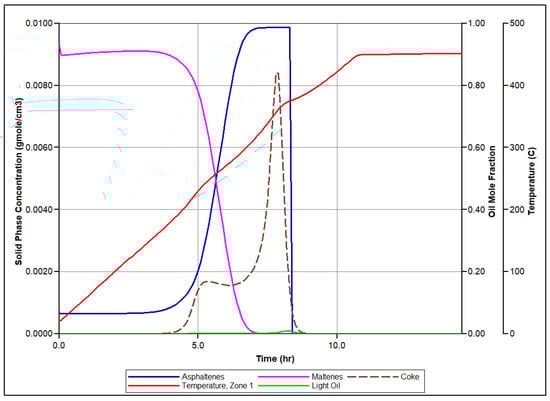
Figure 6.
Numerical simulation results for the first zone of RTO rector: time evolution of the temperature in correspondence with evolution of pseudo-components concentration considered in the numerical model.
After performing a history matching procedure, the numerically calculated masses of produced water, oil, nitrogen, oxygen, combustion gases, the location of NTGR, and the temperature at which oxidation processes initiate can be matched with the corresponding experimentally measured values. These functions serve as the objective functions in the history matching procedure. Meanwhile, kinetic parameters such as the frequency factor, heat of reactions, and activation energies are manually adjusted during the process. The resulting kinetic model, which is associated with the utilized reaction scheme, is summarized in Table 3.
Table 3.
Kinetic parameters for the modified reaction model for bitumen.
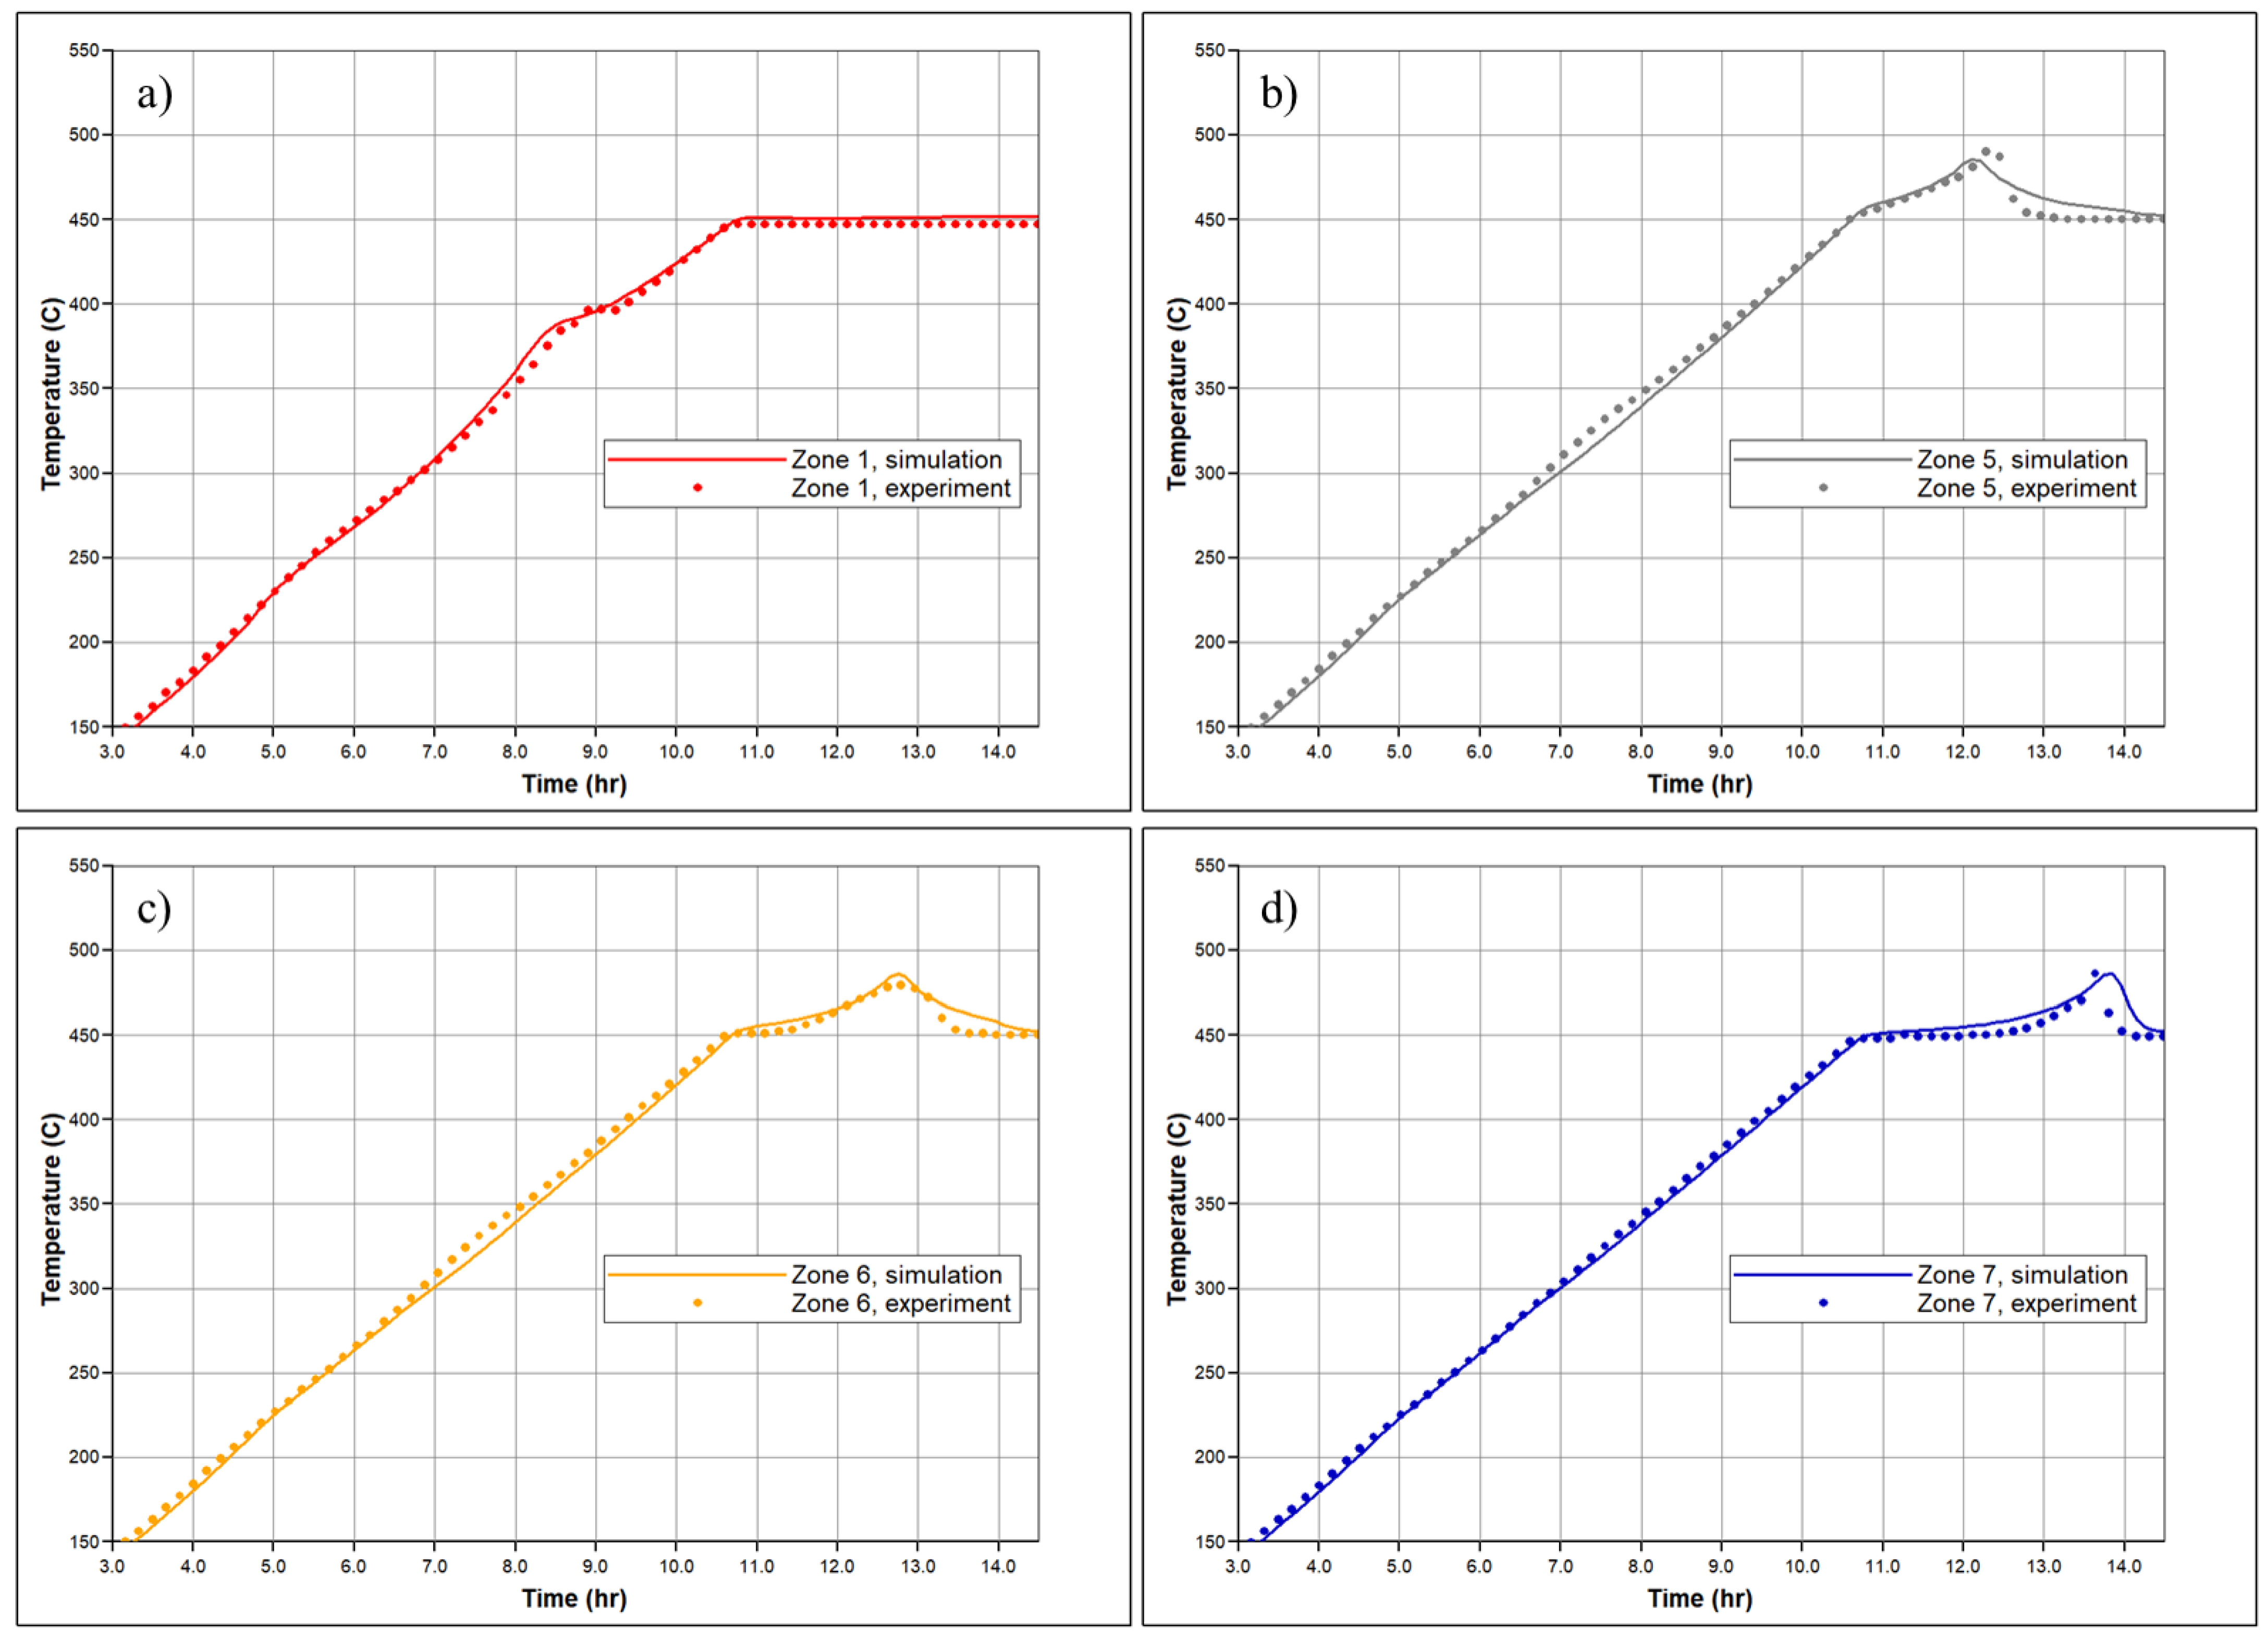
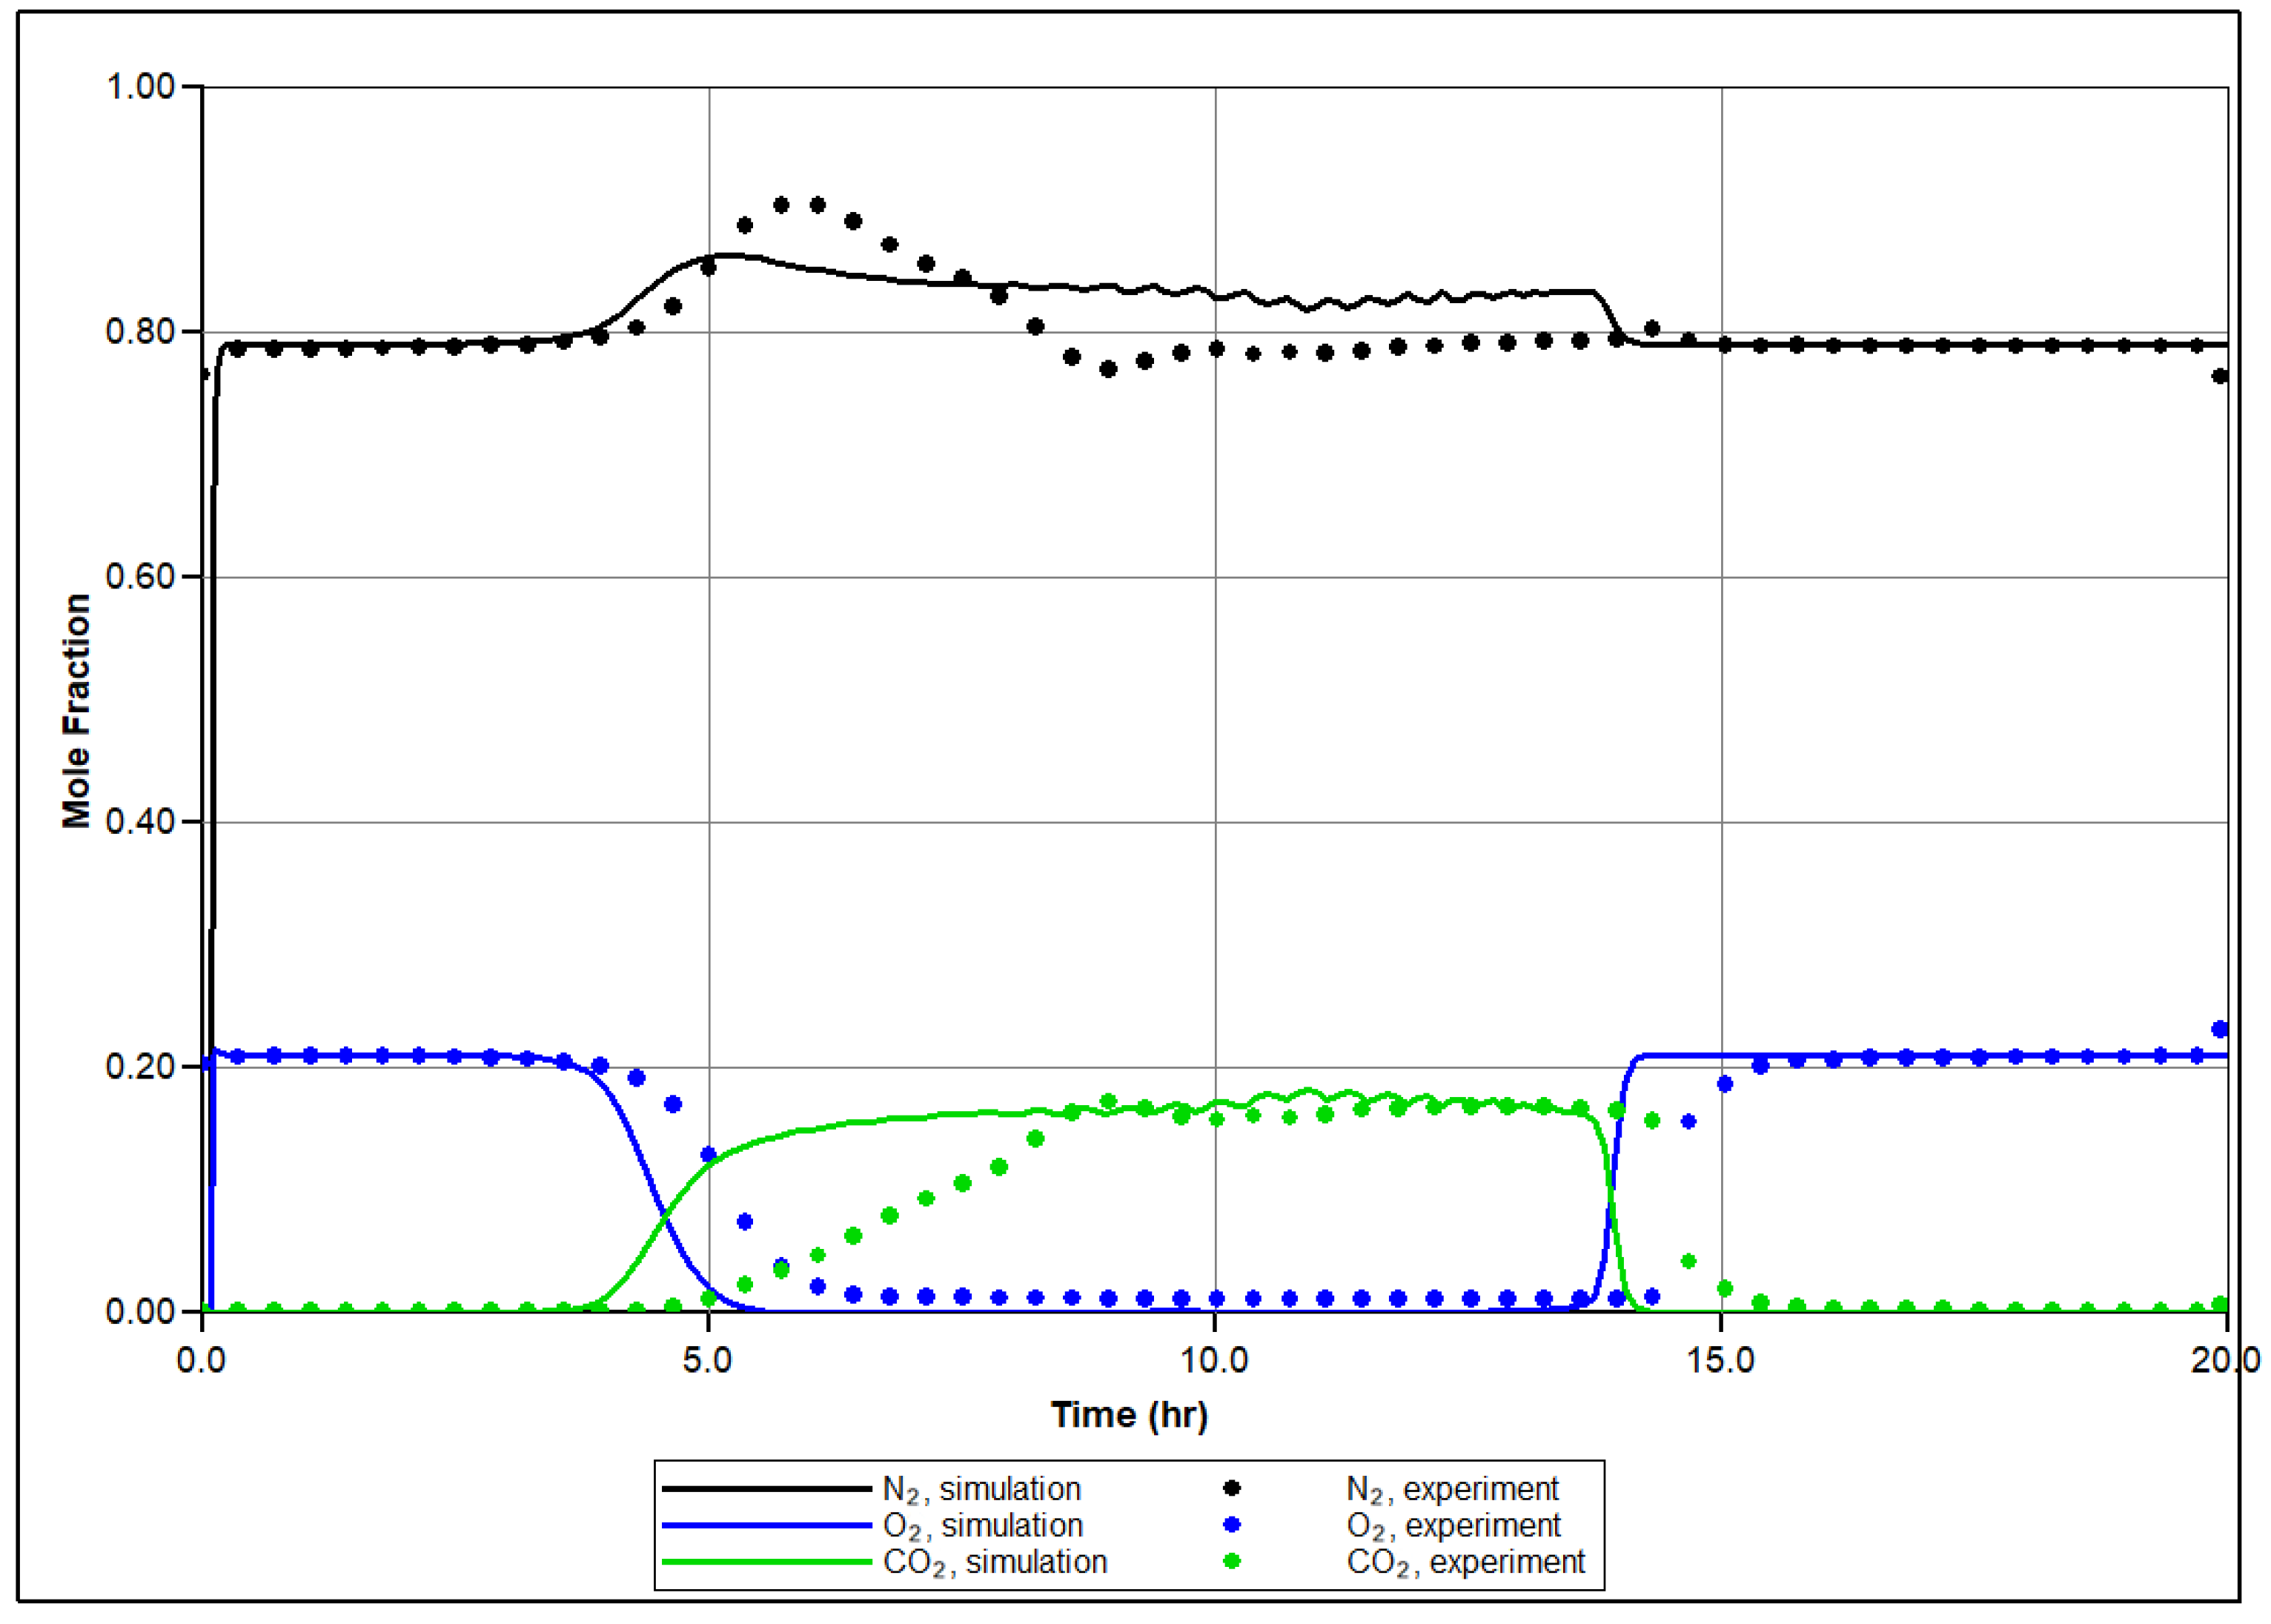
In Figure 7, the temperature profiles in several sectors of the RTO reactor are shown based on history matching, with a comparison to the experimentally observed temperature changes reported by thermocouples in specific sectors of the RTO tube. The numerical modeling demonstrates an agreement with the experimental results, successfully capturing the exothermic peaks registered in the low and high-temperature regions. A key objective of the history matching is to determine the initiation of the first exothermic episode. The simulation effectively reproduces two distinct in time exothermic fronts propagating through the core pack, as indicated by the presence of two temperature peaks in the first sector of the reactor (Figure 7a). Figure 8 depicts molar concentrations of produced O2, N2, and CO2 for the experiment and numerical simulation. The model accurately reproduces changes in generation of N2 during the experiment depending on corresponding temperature region (for example, higher value of produced N2 in LTR). The model also captures partial utilization of reactants at the first half-part of oxidation, although it does not fully replicate this behavior across the entire temperature range encompassing the LTR and NTGR, as observed in the experiment. Efforts have been made to address discrepancies in the numerically predicted NTGR, and the model reflects significant slowing down of oxidation between the LTR and HTR, as shown in Figure 5. Nonetheless, the anticipated exothermic pattern does not exhibit strong concurrence with the empirical findings in the vicinity of the upper temperature threshold of NTGR. The presence of NTGR is presumed to be correlated with the evaporation of volatile hydrocarbons, which subsequently undergo HTO [16]. This underscores the necessity for additional investigation of the fundamental oxidation process in conjunction with a description of hydrocarbon phase behavior.
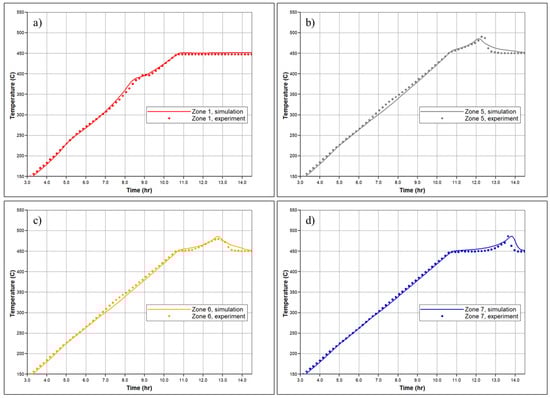
Figure 7.
Temperature profiles for the (a) 1st; (b) 5th; (c) 6th and (d) 7th zones of the reactor measured in the experiment (dashed lines) and calculated during numerical simulation of RTO test (solid line).
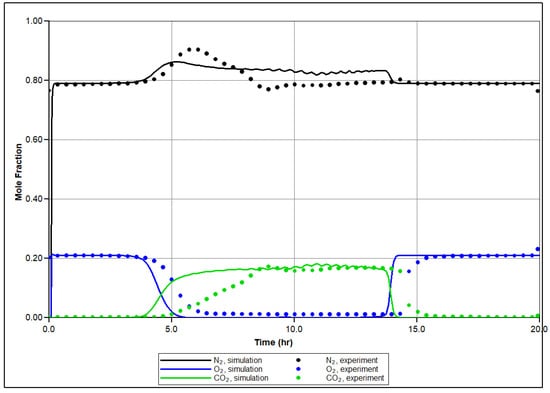
Figure 8.
Produced mole fraction of N2, O2 and CO2 during the experiment (dashed lines) and calculated during numerical simulation of RTO test (solid line).
Table 4 provides the mass of produced water, oil, and carbon dioxide during the RTO test, as well as the corresponding values from the numerical modeling. The discrepancy between the experimental and numerical results is less than 15%. The numerically predicted recovery factor is 0.345, while the experimentally observed one is 0.33, demonstrating a close agreement between the simulation and experimental results.
Table 4.
Mass of produced oil, water, and carbon dioxide during experiment and numerical simulation.
5. Conclusions
A laboratory-scale numerical model was developed and validated to assess RTO testing using bitumen from the Samara region. The model utilized a 3D digital representation of the RTO test, constructed with the CMG STARS thermal hydrodynamic simulator. By incorporating a multilayer design and appropriate heater regimes, the numerical model accounted for potential uncertainties in the experimental results and facilitated their adaptation and validation. The numerical simulations exhibited a strong correlation with experimental data, including factors such as produced mass of carbon dioxide, water and oil, oxygen uptake, recovery factor (0.33), rate of combustion front propagation (6.79 cm/h), and temperature profiles.
By adapting the RTO test results, valuable kinetic parameters for bitumen ISC processes were obtained. The traditional reaction model was modified to include thermal cracking and LTO of Asphaltenes, LTO of Maltenes, and HTO of coke. Additionally, the model accounted for vapor-phase combustion of light oil in HTR, resulting from Asphaltenes cracking and polymerization reactions in LTR. This modification expanded the energy generation in HTR to include both coke burning and vapor-phase combustion.
The proposed model successfully replicated temperature peaks observed in LTR (ranging from 190 to 315 °C), HTR (ranging from 360 to 480 °C), and NGTR (ranging from 315 to 360 °C). The model also accurately reproduces temperature regions for each oxidation mode. However, it was noted that the numerical temperature peaks near NTGR did not precisely replicate the experimental data. This discrepancy stemmed from the mechanism in NTGR involving the vaporization of oil fractions for subsequent combustion. Hence, it became crucial to accurately calculate phase transitions in hydrocarbon mixtures containing multiple components. Further research is needed to address this issue, as the current approach utilizing k-values correlations does not consider the compositional effects of oxidation and combustion processes on phase equilibria structures.
Author Contributions
Conceptualization, L.K. and A.C.; methodology, L.K. and E.P.; software, L.K.; validation, L.K.; formal analysis, L.K. and E.P.; investigation, L.K., E.P. and A.C.; resources, L.K., E.P. and A.C.; data curation, L.K., E.P. and A.C.; writing—original draft preparation, L.K.; writing—review and editing, L.K., E.P. and A.C.; visualization, L.K.; project administration, L.K. and A.C.; funding acquisition, A.C. All authors have read and agreed to the published version of the manuscript.
Funding
This work was supported by the Ministry of Science and Higher Education of the Russian Federation under agreement No. 075-10-2022-011 within the framework of the development program for a world-class Research Center.
Data Availability Statement
The data presented in this study are available on request from the corresponding author.
Acknowledgments
L.K. thanks Yury Podladchikov for inspiring discussions and comments related to the study, and also gratefully acknowledges support from the Ministry of Science and Higher Education of the Russian Federation (project No. 075-15-2022-1106).
Conflicts of Interest
The authors declare no conflict of interest.
References
- Sun, X.F.; Song, Z.Y.; Cai, L.F.; Zhang, Y.Y.; Li, P. Phase behavior of heavy oil–solvent mixture systems under reservoir conditions. Pet. Sci. 2020, 17, 1683–1698. [Google Scholar] [CrossRef]
- Anderson, T.I.; Kovscek, A.R. Optimization and uncertainty quantification of in situ combustion chemical reaction models. Fuel 2022, 319, 123683. [Google Scholar] [CrossRef]
- Sharma, J.; Dean, J.; Aljaberi, F.; Altememee, N. In-situ combustion in Bellevue field in Louisiana–History, current state and future strategies. Fuel 2021, 284, 118992. [Google Scholar] [CrossRef]
- Belgrave, J.D.M.; Moore, R.G.; Ursenbach, M.G.; Bennion, D.W. A comprehensive approach to in-situ combustion modeling. SPE Adv. Technol. Ser. 1993, 1, 98–107. [Google Scholar] [CrossRef]
- Duiveman, M.W.; Herwin, H.; Grivot, P. Integrated management of water, lean gas, and air injection: The successful ingredients to EOR projects on the mature Handil Field. In Proceedings of the SPE Asia Pacific Oil and Gas Conference and Exhibition, Jakarta, Indonesia, 5–7 April 2005. [Google Scholar] [CrossRef]
- Hongmin, Y.; Shaoran, R.; Jiexiang, W.; Baoquan, Y.; Hongyun, S. Numerical simulation study on enhanced oil recovery by air injection process in Shengli Oilfield. Oil Drill. Prod. Technol. 2008, 30, 105–109. [Google Scholar]
- Moore, R.G.; Mehta, S.A.; Ursenbach, M.G.; Gutierrez, D. Potential for in situ combustion in depleted conventional oil reservoirs. In Proceedings of the SPE Improved Oil Recovery Symposium, Tulsa, OK, USA, 14–18 April 2012. [Google Scholar] [CrossRef]
- Wei, W.; Wang, J.; Afshordi, S.; Gates, I.D. Detailed analysis of Toe-to-Heel Air Injection for heavy oil production. J. Pet. Sci. Eng. 2020, 186, 106704. [Google Scholar] [CrossRef]
- Gates, I.D.; Larter, S.R. Energy efficiency and emissions intensity of SAGD. Fuel 2014, 115, 706–713. [Google Scholar] [CrossRef]
- Yang, M.; Harding, T.G.; Chen, Z. Field-scale modeling of hybrid steam and in-situ-combustion recovery process in oil-sands reservoirs using dynamic gridding. SPE Reserv. Eval. Eng. 2020, 23, 311–325. [Google Scholar] [CrossRef]
- Kapadia, P.R.; Kallos, M.S.; Gates, I.D. A review of pyrolysis, aquathermolysis, and oxidation of Athabasca bitumen. Fuel Process. Technol. 2015, 131, 270–289. [Google Scholar] [CrossRef]
- Pu, W.; Zhao, S.; Hu, L.; Varfolomeev, M.A.; Yuan, C.; Wang, L.; Rodionov, N.O. Thermal effect caused by low temperature oxidation of heavy crude oil and its in-situ combustion behavior. J. Pet. Sci. Eng. 2020, 184, 106521. [Google Scholar] [CrossRef]
- Barzin, Y.; Moore, R.G.; Mehta, S.A.; Ursenbach, M.G.; Tabasinejad, F. Impact of distillation on the combustion kinetics of high-pressure air injection (HPAI). In Proceedings of the SPE Improved Oil Recovery Symposium, Tulsa, OK, USA, 24–28 April 2010. [Google Scholar]
- Gutierrez, D.; Moore, R.G.; Ursenbach, M.G.; Mehta, S.A. The ABCs of in-situ-combustion simulations: From laboratory experiments to field scale. J. Can. Pet. Technol. 2012, 51, 256–267. [Google Scholar] [CrossRef]
- Bondarenko, T.; Khakimova, L.; Cheremisin, A.; Spasennykh, M. High-Pressure Air Injection Laboratory and Numerical Modelling in Bazhenov Source Rocks. In Proceedings of the SPE Russian Petroleum Technology Conference, Moscow, Russia, 16–18 October 2017. [Google Scholar] [CrossRef]
- Mallory, D.G.; Moore, R.G.; Mehta, S.A. Ramped temperature oxidation testing and in situ combustion projects. Energy Fuels 2018, 32, 8040–8056. [Google Scholar] [CrossRef]
- Khakimova, L.; Bondarenko, T.; Cheremisin, A.; Myasnikov, A.; Varfolomeev, M. High pressure air injection kinetic model for Bazhenov Shale Formation based on a set of oxidation studies. J. Pet. Sci. Eng. 2019, 172, 1120–1132. [Google Scholar] [CrossRef]
- Jia, N.; Moore, R.G.; Mehta, S.A.; Ursenbach, M.G. Kinetic modelling of thermal cracking and low temperature oxidation reactions. J. Can. Pet. Technol. 2006, 45. [Google Scholar] [CrossRef]
- Zhao, S.; Pu, W.; Sun, B.; Gu, F.; Wang, L. Comparative evaluation on the thermal behaviors and kinetics of combustion of heavy crude oil and its SARA fractions. Fuel 2019, 239, 117–125. [Google Scholar] [CrossRef]
- dos Santos, R.G.; Vidal Vargas, J.A.; Trevisan, O.V. Thermal analysis and combustion kinetic of heavy oils and their asphaltene and maltene fractions using accelerating rate calorimetry. Energy Fuels 2014, 28, 7140–7148. [Google Scholar] [CrossRef]
- Vargas, J.A.V.; dos Santos, R.G.; Trevisan, O.V. Evaluation of crude oil oxidation by accelerating rate calorimetry: Effects of combustion process variables on thermal and kinetic parameters. J. Therm. Anal. Calorim. 2013, 113, 897–908. [Google Scholar] [CrossRef]
- Kök, M.V.; Karacan, Ö.; Pamir, R. Kinetic analysis of oxidation behavior of crude oil SARA constituents. Energy Fuels 1998, 12, 580–588. [Google Scholar] [CrossRef]
- Freitag, N.P.; Verkoczy, B. Low-temperature oxidation of oils in terms of SARA fractions: Why simple reaction models don’t work. J. Can. Pet. Technol. 2005, 44, 54–61. [Google Scholar] [CrossRef]
- Gutiérrez, D.; Moore, R.G.; Mehta, S.A.; Ursenbach, M.; Bernal, A. Phase-behavior modeling of oils in terms of saturates/aromatics/resins/asphaltenes fractions. SPE Reserv. Eval. Eng. 2019, 22, 1–015. [Google Scholar] [CrossRef]
- Christensen, J.R.; Darche, G.; Dechelette, B.; Ma, H.; Sammon, P.H. Applications of dynamic gridding to thermal simulations. In Proceedings of the SPE International Thermal Operations and Heavy Oil Symposium and Western Regional Meeting, Bakersfield, CA, USA, 16–18 March 2004. [Google Scholar] [CrossRef]
- De Zwart, A.H.; van Batenburg, D.W.; Blom, C.; Tsolakidis, A.; Glandt, C.A.; Boerrigter, P. The modeling challenge of high pressure air injection. In Proceedings of the SPE Symposium on Improved Oil Recovery, Tulsa, OK, USA, 20–23 April 2008. [Google Scholar] [CrossRef]
- Kovscek, A.R.; Castanier, L.M.; Gerritsen, M.G. Improved predictability of in-situ-combustion enhanced oil recovery. SPE Reserv. Eval. Eng. 2013, 16, 172–182. [Google Scholar] [CrossRef]
- Nissen, A.; Zhu, Z.; Kovscek, A.; Castanier, L.; Gerritsen, M. Upscaling kinetics for field-scale in-situ-combustion simulation. SPE Reserv. Eval. Eng. 2015, 18, 158–170. [Google Scholar] [CrossRef]
- Gutierrez, D.; Skoreyko, F.; Moore, R.G.; Mehta, S.A.; Ursenbach, M.G. The challenge of predicting field performance of air injection projects based on laboratory and numerical modelling. J. Can. Pet. Technol. 2009, 48, 23–33. [Google Scholar] [CrossRef]
- Moore, R.G.; Belgrave, J.D.M.; Mehta, R.; Ursenbach, M.; Laureshen, C.J.; Xi, K. Some insights into the low-temperature and high-temperature in-situ combustion kinetics. In Proceedings of the SPE/DOE Enhanced Oil Recovery Symposium, Tulsa, OK, USA, 22–24 April 1992. [Google Scholar] [CrossRef]
- Moore, R.G.; Mehta, S.A.; Ursenbach, M.G. A guide to high pressure air injection (HPAI) based oil recovery. In Proceedings of the SPE/DOE Improved Oil Recovery Symposium, Tulsa, OK, USA, 13–17 April 2002. [Google Scholar] [CrossRef]
- Yang, J.; Xu, Q.; Jiang, H.; Shi, L. Reaction model of low asphaltene heavy oil from ramped temperature oxidation experimental analyses and numerical simulations. Energy 2021, 219, 119669. [Google Scholar] [CrossRef]
- Wang, Y.; Ren, S.; Zhang, L.; Deng, J.; Peng, X.; Cheng, H. New insights into the oxidation behaviors of crude oils and their exothermic characteristics: Experimental study via simultaneous TGA/DSC. Fuel 2018, 219, 141–150. [Google Scholar] [CrossRef]
- Huang, S.; Sheng, J.J. A practical method to obtain kinetic data from TGA (thermogravimetric analysis) experiments to build an air injection model for enhanced oil recovery. Fuel 2017, 206, 199–209. [Google Scholar] [CrossRef]
- Li, Y.; Liao, G.; Wang, Z.; Su, R.; Ma, S.; Zhang, H.; Shi, Q. Molecular composition of low-temperature oxidation products in a simulated crude oil In-situ combustion. Fuel 2022, 316, 123297. [Google Scholar] [CrossRef]
- Yang, M.; Harding, T.G.; Chen, Z. Numerical investigation of the mechanisms in co-injection of steam and enriched air process using combustion tube tests. Fuel 2019, 242, 638–648. [Google Scholar] [CrossRef]
- Fassihi, M.R.; Brigham, W.E.; Ramey, H.J., Jr. Reaction kinetics of in-situ combustion: Part 1-observations. Soc. Pet. Eng. J. 1984, 24, 399–407. [Google Scholar] [CrossRef]
- Burger, J.G. Chemical aspects of in-situ combustion-heat of combustion and kinetics. Soc. Pet. Eng. J. 1972, 12, 410–422. [Google Scholar] [CrossRef]
- Khakimova, L.; Askarova, A.; Popov, E.; Moore, R.G.; Solovyev, A.; Simakov, Y.; Cheremisin, A. High-pressure air injection laboratory-scale numerical models of oxidation experiments for Kirsanovskoye oil field. J. Pet. Sci. Eng. 2020, 188, 106796. [Google Scholar] [CrossRef]
- Arrhenius, S. Über die Dissociation der in Wasser gelösten Stoffe. Z. Phys. Chem. 1887, 1, 631–648. [Google Scholar] [CrossRef]
- Walther, C. The evaluation of viscosity data. Erdol. Teer 1931, 7, 382–384. [Google Scholar]
- Mehrotra, A.K. Modeling the effects of temperature, pressure, and composition on the viscosity of crude oil mixtures. Ind. Eng. Chem. Res. 1990, 29, 1574–1578. [Google Scholar] [CrossRef]
- Bhattacharya, S.; Mallory, D.G.; Moore, R.G.; Ursenbach, M.G.; Mehta, S.A. Vapor phase combustion in Accelerating Rate Calorimetry for air-injection EOR processes. In Proceedings of the SPE Western Regional Meeting, Anchorage, AK, USA, 23–26 May 2016. [Google Scholar] [CrossRef]


Disclaimer/Publisher’s Note: The statements, opinions and data contained in all publications are solely those of the individual author(s) and contributor(s) and not of MDPI and/or the editor(s). MDPI and/or the editor(s) disclaim responsibility for any injury to people or property resulting from any ideas, methods, instructions or products referred to in the content. |
© 2023 by the authors. Licensee MDPI, Basel, Switzerland. This article is an open access article distributed under the terms and conditions of the Creative Commons Attribution (CC BY) license (https://creativecommons.org/licenses/by/4.0/).