Article

Policy Design for Electricity Efficiency: A Case Study of Bottom-Up Energy Modeling in the Residential Sector and Buildings

by
Marlene Ofelia Sanchez-Escobar
1,
Julieta Noguez
1,*,
Jose Martin Molina-Espinosa
2,
David Escobar-Castillejos
3 and
Sergio Ruiz-Loza
1
1
Tecnologico de Monterrey, School of Engineering and Science, Ciudad de Mexico 14380, Mexico
2
Tecnologico de Monterrey, Institute for the Future of Education, Monterrey 64849, Mexico
3
Universidad Panamericana, Facultad de Ingeniería, Augusto Rodin 498, Ciudad de Mexico 03920, Mexico
*
Author to whom correspondence should be addressed.
Energies 2023, 16(19), 6765; https://doi.org/10.3390/en16196765
Submission received: 9 August 2023 / Revised: 1 September 2023 / Accepted: 11 September 2023 / Published: 22 September 2023
(This article belongs to the Section C: Energy Economics and Policy)

Abstract

:
Energy models play a crucial role in the domain of energy policy by serving as essential instruments for decision-making. However, a significant limitation of numerous bottom-up energy models (BUEMs) is their empirical design, which hinders their ability to effectively inform policy design. This study presents a structured framework that can be used to improve the effectiveness of behavior, understanding, and engagement measures in the development of BUEMs for enhancing energy end-use efficiency. The model selected for this case study was provided by the Mexican Commission for the Efficient Use of Energy (CONUEE), and it examines the impact of regulatory instruments on the residential sector and residential buildings. The benefits of the proposed framework were successfully demonstrated through a quantitative comparison of real energy models, using and without using the said framework, revealing the advantages of its use. The framework significantly decreases the time required for model generation in various aspects by 59.43%. The obtained results highlight the effectiveness of the framework, and it could enhance the existing knowledge in the sector.

1. Introduction

The global policy-making community recognizes the urgent need to tackle the increasing energy consumption and growing levels of carbon dioxide (CO 2 ) emissions due to their detrimental impacts on climate change and energy stability. According to the World Energy Outlook’s projections for 2040, the building sector, which includes both households and services, is expected to remain the predominant contributor to global electricity demand. This rise is associated with the heightened use of air conditioning systems, domestic appliances, and electric automobiles. To tackle this issue, policymakers require the implementation of methodologies to assess the effectiveness of approaches aimed at improving electricity consumption efficiency while simultaneously ensuring the unimpeded expansion of electricity services [1].
The field of electricity end-use efficiency policy design, a sub-field of energy efficiency, focuses on analyzing the various factors in the market that impede the adoption of efficient solutions. Given that electricity generation accounts for a third of total Economic Co-operation and Development (OECD) country emissions [2], and the residential sector is increasingly contributing to these emissions [3], it is crucial to prioritize the improvement of energy use efficiency [4]. Energy efficiency regulations offer advantageous approaches for the energy sector that do not entail significant cost burdens. Nevertheless, the success of their design is dependent on the establishment of a model. The use of models plays a crucial role in the decision-making process for policy selection. However, research has revealed that there exists a notable deficiency in the implementation of bottom-up energy models (BUEMs), specifically designed for residential structures, and these models frequently fail to conform to established best practices [1].
This research paper presents a novel framework aimed at enhancing the effectiveness of BUEM strategies in the development of policies related to electricity end-use efficiency. The main contributions lie in the incorporation of energy efficiency metrics, the use of scenarios for informed decision-making, and the implementation of different design methodologies. The implementation of these improvements in BUEMs is of utmost importance for conducting scenario analysis, as it assists policymakers in avoiding the implementation of policies that are not optimal. This research offers a novel perspective on energy modeling by enhancing the design and quality of BUEMs, providing valuable guidance to stakeholders in formulating energy policies with greater possibilities for impact.
To assess the viability of developing a new methodology for constructing BUEMs, this study is based on the following research questions:
(a)
What strategies may be employed to provide an efficient method for measuring, monitoring, and enhancing the generation process of BUEMs?
(b)
What are the effective methods for guiding and structuring the construction of scenarios in BUEMs?
The present paper is organized in the following manner. The related work is presented in Section 2. The proposed framework is outlined in Section 3. In Section 4, a case study regarding the design and implementation of the framework is described. Finally, Section 5 provides a comprehensive analysis of the main discoveries derived from the present study, whereas Section 6 offers the conclusions for this research.

2. Related Work

The design of energy policy continues to present a significant worldwide problem, as policymakers endeavor to achieve a delicate equilibrium between ensuring a reliable energy supply, promoting cost-effectiveness, and upholding environmental sustainability [5,6]. The policy life cycle plays a crucial role in the development of energy policies, particularly in OECD countries, with the objective of promoting a more robust, environmentally sustainable, and equitable global society [7].
The concept of end-use energy efficiency encompasses a wide range of sectors, namely industry, services, agriculture, households, transportation, and buildings [8]. BUEMs have attracted considerable interest owing to their various characteristics, including comprehensive sector coverage, extensive geographical scope, and a rigorous scientific approach. Nevertheless, the complexity of modeling energy production and consumption is evident, and the absence of governmental assistance for BUEMs might be attributed to their departure from established industry standards [9].
In this context, Mundaca et al. provided a description of the modeling dimension of energy models and highlighted significant activities that should be taken into account in the development of a methodology for constructing BUEMs [10]. Nevertheless, the authors do not devise a specific framework or approach for this purpose. The authors presented arguments and emphasized the challenges related to the development of BUEMs, notably emphasizing the absence of a comprehensive framework that offers optimal strategies for designing policy instruments.
In the study of Abbasabadi et al., the authors proposed a comprehensive approach to modeling urban energy consumption by including socio-spatial factors in a bottom-up data-driven paradigm [11]. The energy consumption data are analyzed through the application of machine learning methodologies. The resulting model demonstrates a satisfactory level of accuracy in explaining the variability of energy usage in both buildings and vehicles. Although the model shows promise, the authors’ work lacked recognition of the critical importance of decision-making and policy-making processes. The design phases of the model exhibit a deficiency in stakeholder engagement and fail to offer explicit advice in the development of scenarios.
Another study is the one conducted by Fleiter et al. [12]. This research presents a detailed description of the approaches used to create long-term decarbonization scenarios in the industrial sector, utilizing the FORECAST model. The process of scenario generation involves the consideration of distinct sectors, including industry, services, and households, along with diverse end-uses, technology, and numerous types of input and output data. This framework functions as a fundamental basis for the construction and establishment of models, mostly relying on simulation methodologies. However, the authors noted that the scope of its use was limited to the industrial sector.
On the other hand, Schwabeneder et al. conducted a study wherein they examined the benefits associated with the integration of flexible energy consumption, production, and storage across several power markets [13]. The authors present an optimization approach that demonstrates how engaging in many marketplaces, particularly with the inclusion of battery storage, can enhance economic benefits. This study examines the economic feasibility of aggregators and customers in the European electrical market, with a particular focus on the advantages of distributed flexible energy methods. The research conducted by the authors sheds light on the difficulties associated with formulating tariffs that are advantageous for all parties involved, as well as the necessity of robust data exchange, which may give rise to concerns over privacy.
In parallel, Kapitonov and Patapas emphasized the necessity of a comprehensive tariff formation model that incorporates both conventional and unconventional energy sources within the domain of electricity tariff control [14]. The authors argued in favor of a theoretical framework based on economic reasoning and the intricacies of employing alternative energy sources. They underscored the importance of including risk factors to effectively tackle anticipated declines in energy production.
Additionally, Ren et al. presented a comprehensive study to investigate the impact of photovoltaic (PV) battery systems on energy consumption and potential cost reductions for families in Australia, considering different tariff structures [15]. This study took into account two existing and nine potential power tariffs. The results of their study demonstrated that the incorporation of PV battery systems within residential properties has the potential to significantly reduce peak electricity demand and overall annual energy consumption. Consequently, this might lead to considerable savings on utility bills. However, the study does not focus on how to implement a methodology to integrate these systems seamlessly into the creation of BUEMs.
According to recent studies, there are not many publications that specifically address this subject, and there does not seem to be any consistency in the usage of scenarios or important metrics [16]. These findings demonstrate the urgent need to develop a cutting-edge strategy that would successfully guide decision-makers in developing energy efficiency initiatives.

3. Materials and Methods

The objective of this study is to provide standardized development techniques for BUEMs. The proposed framework incorporates a series of general processes and combines established methodologies in energy policy and energy efficiency. Its primary objective is to address prevalent issues encountered in existing BUEMs. These issues include (a) difficulty in implementing policy design across various levels of abstraction (high, medium, and low levels); (b) the absence of a systematic approach for documenting processes, inputs, and outputs; and (c) the inconsistent integration of scenarios into energy models.
This study will assess the following hypotheses:
  • The process of developing BUEMs can be quantified, monitored, and controlled to ensure adherence to established procedures and alignment with policy objectives.
  • The process of developing BUEMs can be modified to guide the formulation of energy efficiency scenarios that facilitate decision-making.

3.1. Framework Overview

The proposed framework consists of a number of standardized phases and processes, each of which has its own unique set of activities and artifacts. These artifacts include best practice templates and technical sheets, which serve to provide extensive guidance and support throughout the implementation process. The framework consists of six distinct phases (see Figure 1 and Figure 2), each dedicated to a certain component of model creation.
  • Business Understanding: the initial phase of the process focuses on comprehending the problem at hand, its surrounding context, and the corresponding policy objectives.
  • Policy Alignment: this phase places emphasis on aligning models with the objectives of the policy.
  • Data Definition and Understanding: this phase entails a comprehensive understanding of the pertinent data.
  • Scenario Definition and Design: this phase is focused on the conceptualization and creation of scenarios.
  • Model Construction: this phase is centered around the selection of suitable modeling techniques and the subsequent construction of the model.
  • Model Evaluation: the final phase is focused on the examination, evaluation, and assessment of both the model and the process of its development.
The defined phases within this process have been developed with the intention of ensuring that BUEMs are closely aligned with specific policy objectives and the needs of stakeholders. The motivation behind these procedures originates from the CRISP-DM and Decision-Making Center techniques [17,18,19]. Furthermore, these phases are specifically formulated to collect and comprehend the primary issue(s) that the model aims to address, the needs and expectations of the individuals or groups involved, and the policy goals that the model is intended to support.

3.1.1. Business Understanding
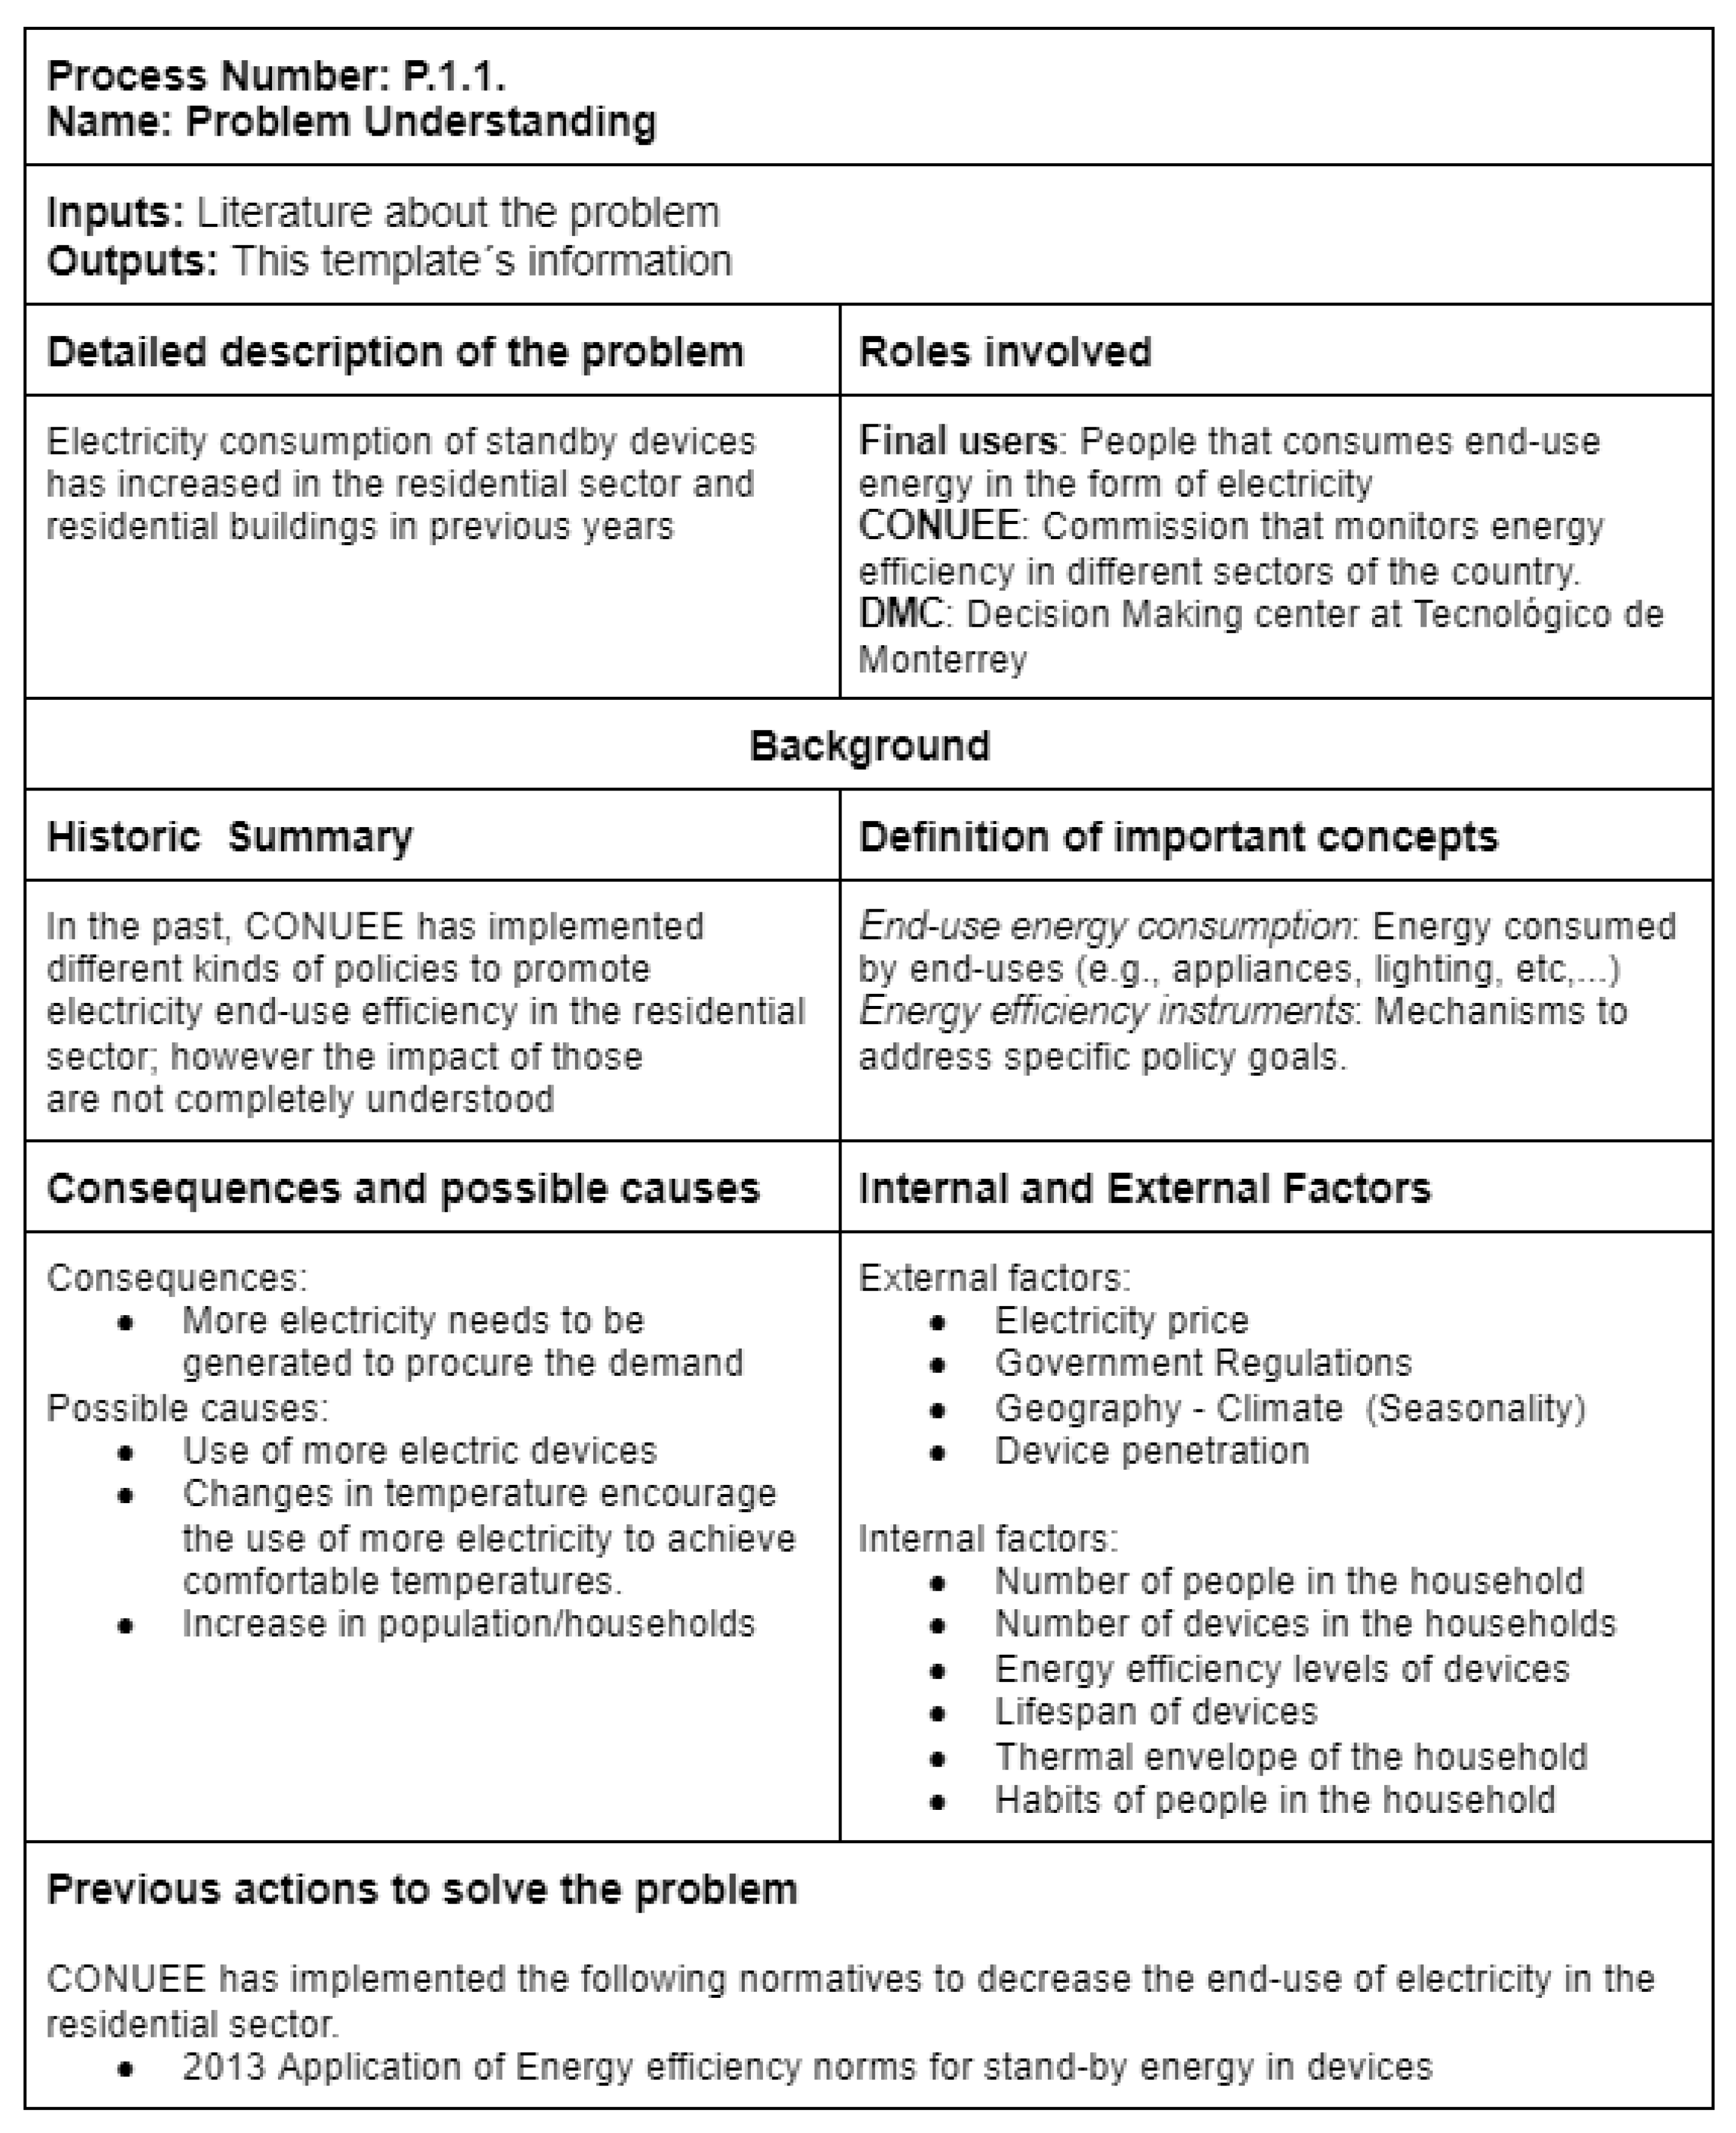
The phase can be divided into several distinct processes. To establish a coherent and effective problem-solving methodology, this phase serves as the initial attempt to align policy objectives with the structure of the model. The processes included in this phase are:
P.1.1
Problem Understanding: It involves a comprehensive overview of the issue at hand, its context, and relevant background. This process relies on a variety of inputs, such as scholarly articles, books, or reports that shed light on the problem.
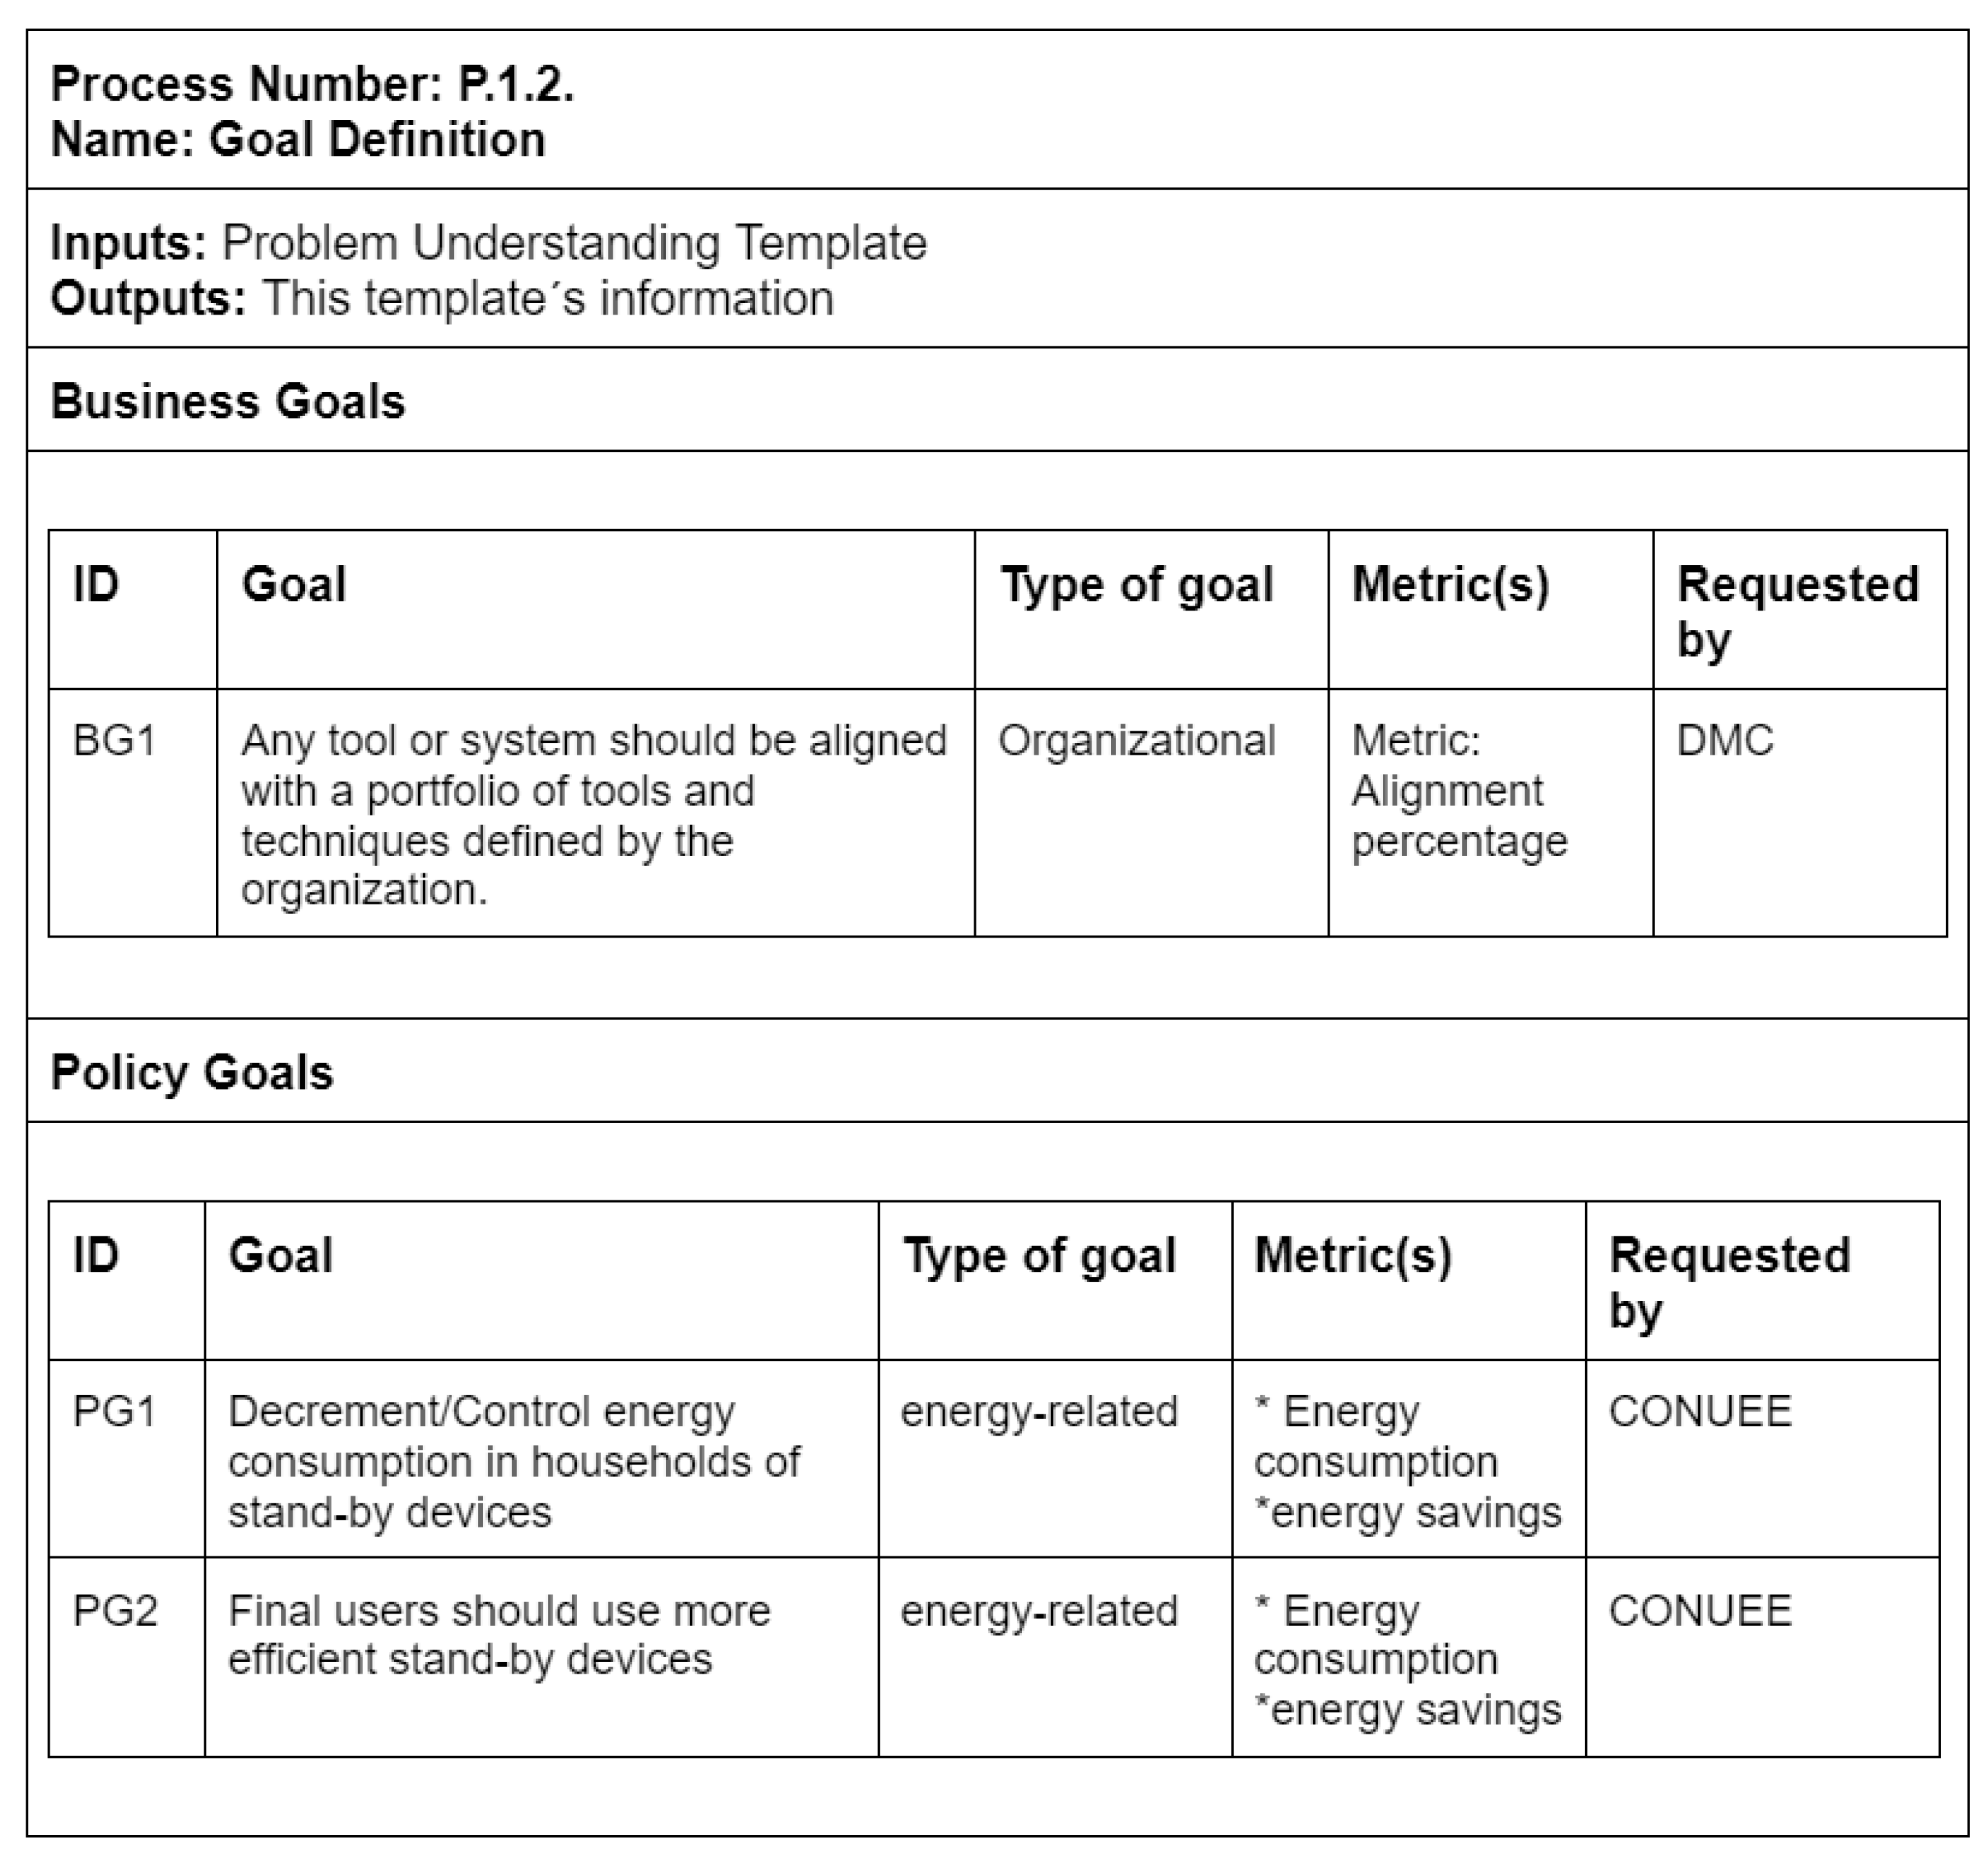
P.1.2
Goal Definition: It entails defining business and policy goals, taking into account the information gathered in the first process. Business goals encompass the intended results established by a company, division, or specific stakeholder. These objectives may span several domains, such as financial, organizational, temporal, or model design characteristics. On the other hand, policy goals refer to the expected results that arise from the implementation of particular policy instruments. The objectives could include financial or energy-related aspects. An integral component of this process entails the identification of metrics for the purpose of evaluating the attainment of every objective.
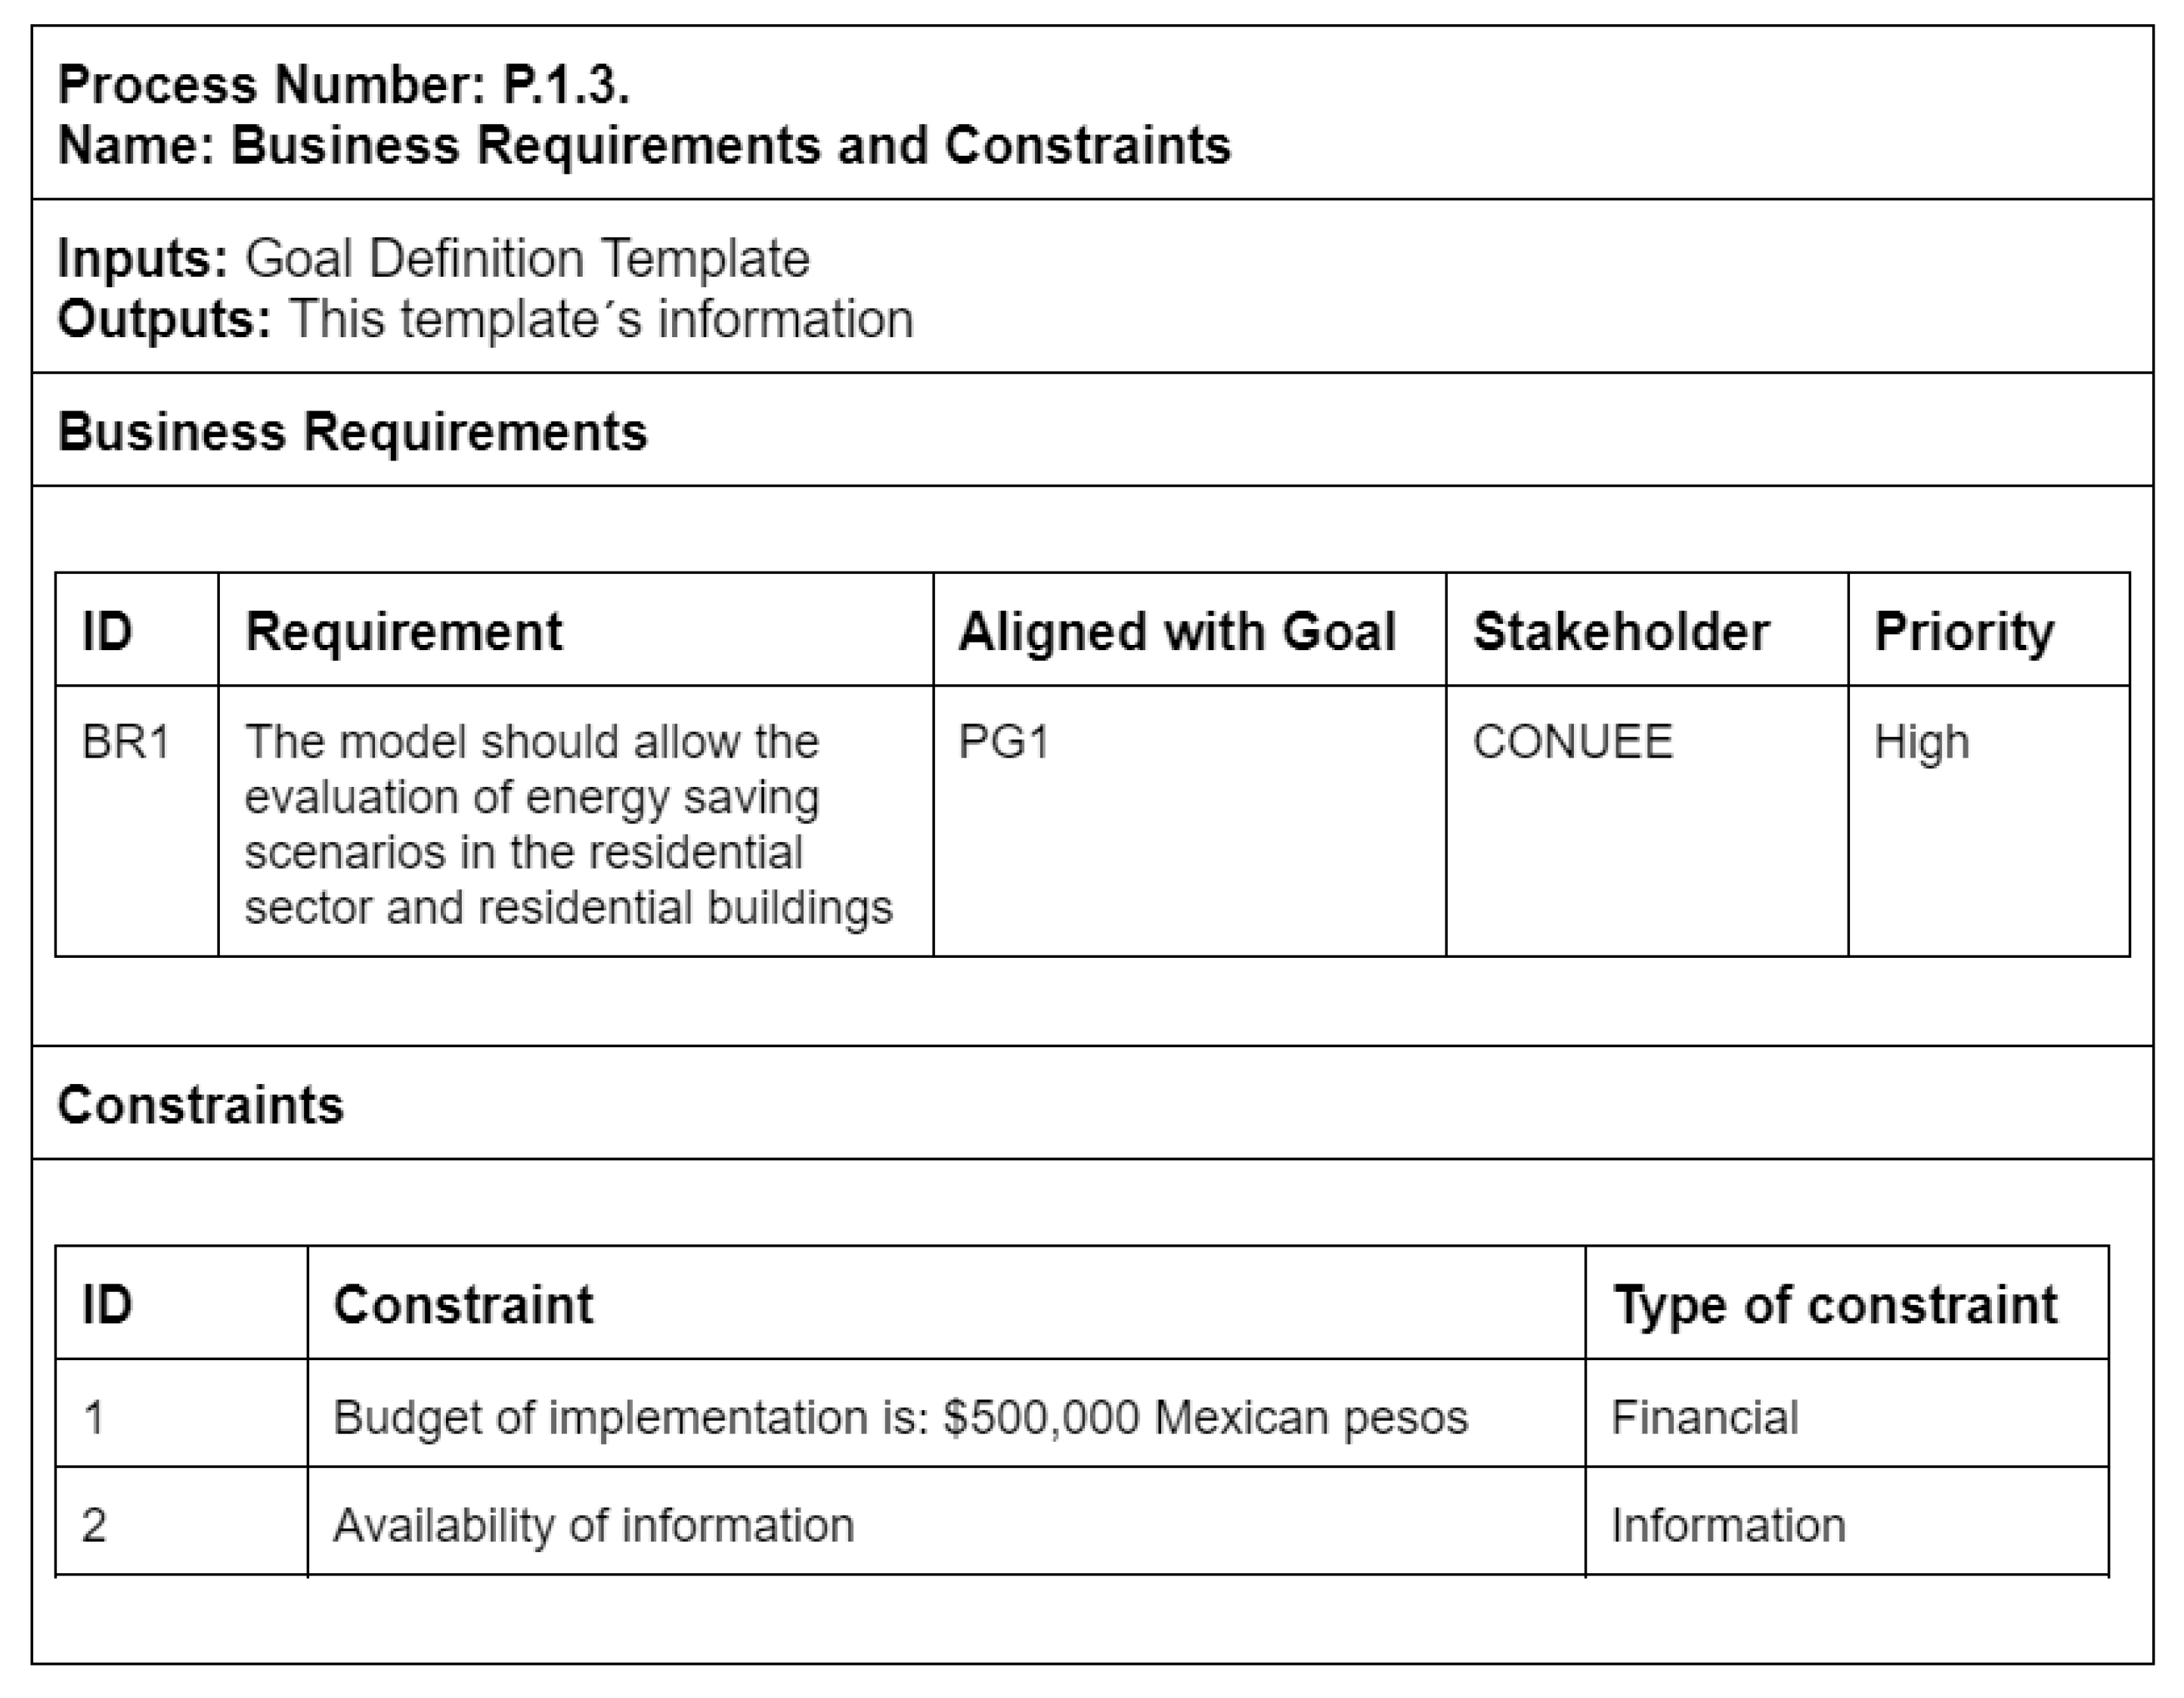
P.1.3
Business Requirements and Constraints: During this process, the primary objective is to extract business requirements that are pertinent to the model and identify any potential constraints that could affect its development. This process facilitates the delineation of both the primary scope and other aspects that may exert an impact on the construction process. Requirements are assigned priority and chosen based on their importance and congruence with pre-established business and policy goals. It is of utmost importance to simultaneously identify the constraints linked to the model since these constraints have the potential to impact the process of constructing the model.
P.1.4
Strategies to Achieve Objectives: This process places emphasis on the careful and detailed formulation of actions, methodologies, and resources to effectively attain each specified objective. Strategies can be categorized into two distinct types: corporate strategies and policy plans. Corporate strategies exhibit a wide range of variations and are specifically customized to align with the unique circumstances and environment of the firm. In contrast, policy plans are shaped by a predetermined set of policy instruments.
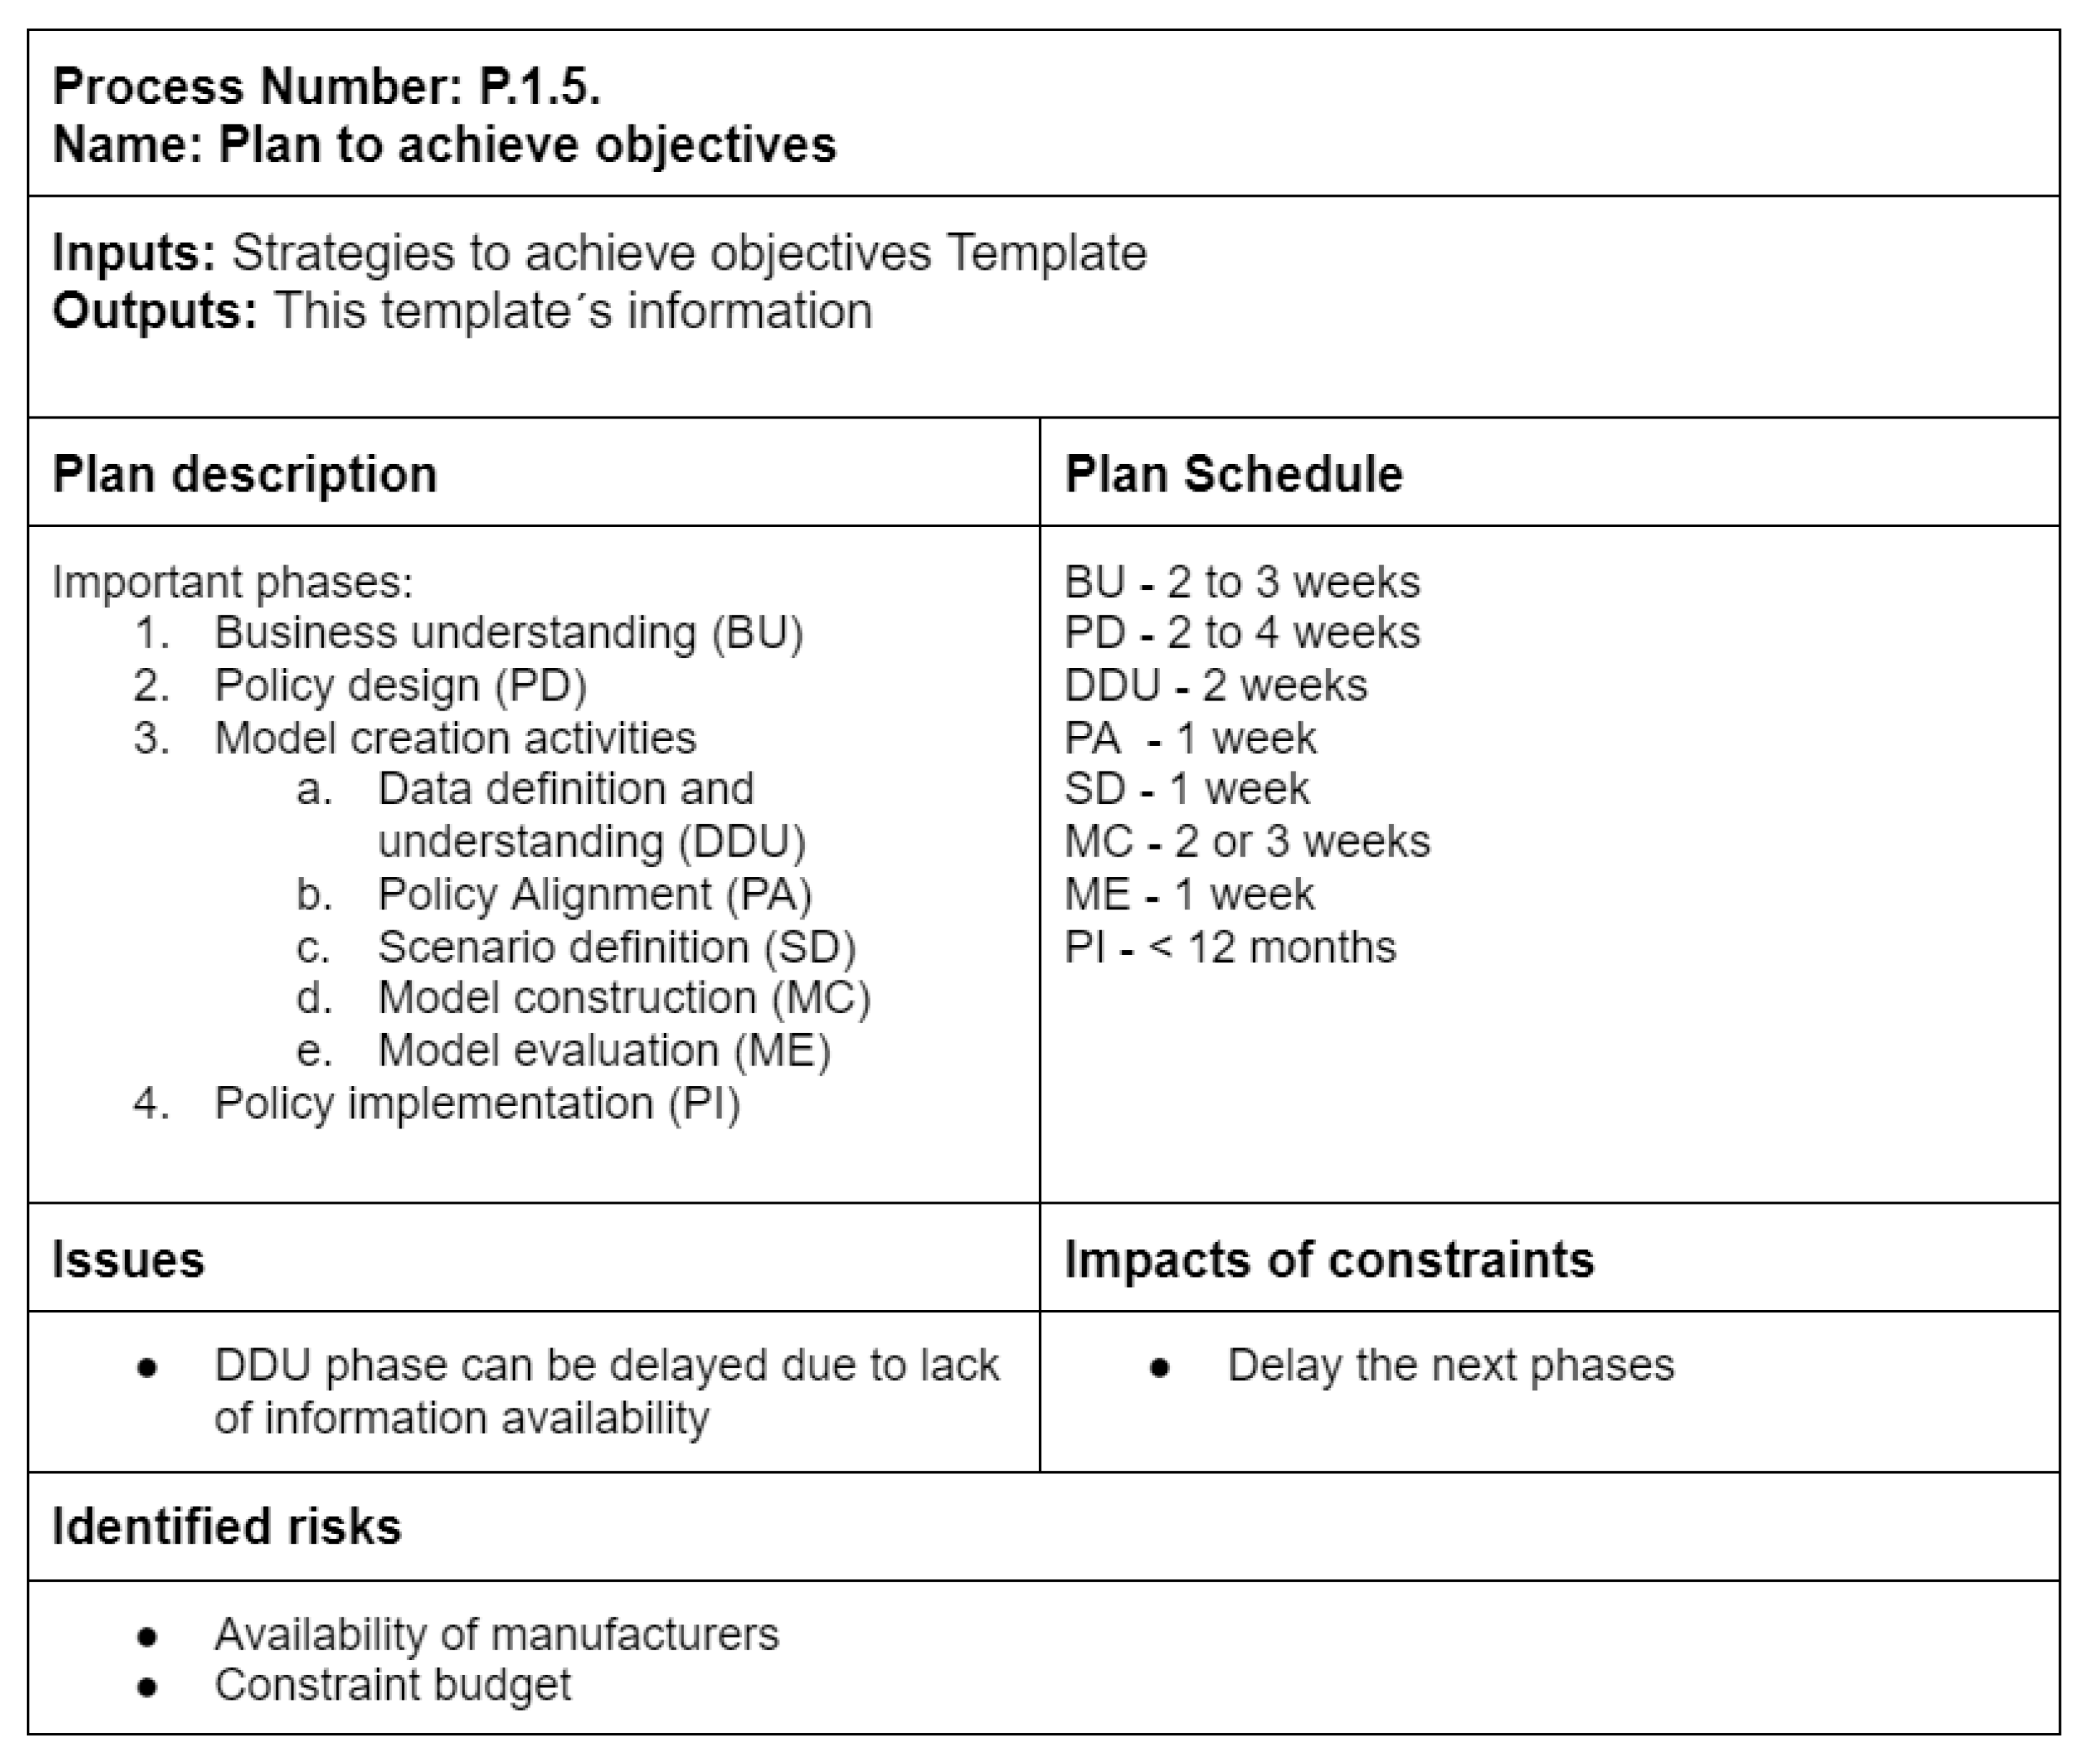
P.1.5
Plan to Achieve Objectives: The process entails formulating a comprehensive strategy for the execution of policies, incorporating the various initiatives, instruments, and strategies outlined in the preceding processes. This opportunity allows for the identification of prospective resource challenges and the assessment of the impacts associated with various constraints.

3.1.2. Policy Alignment
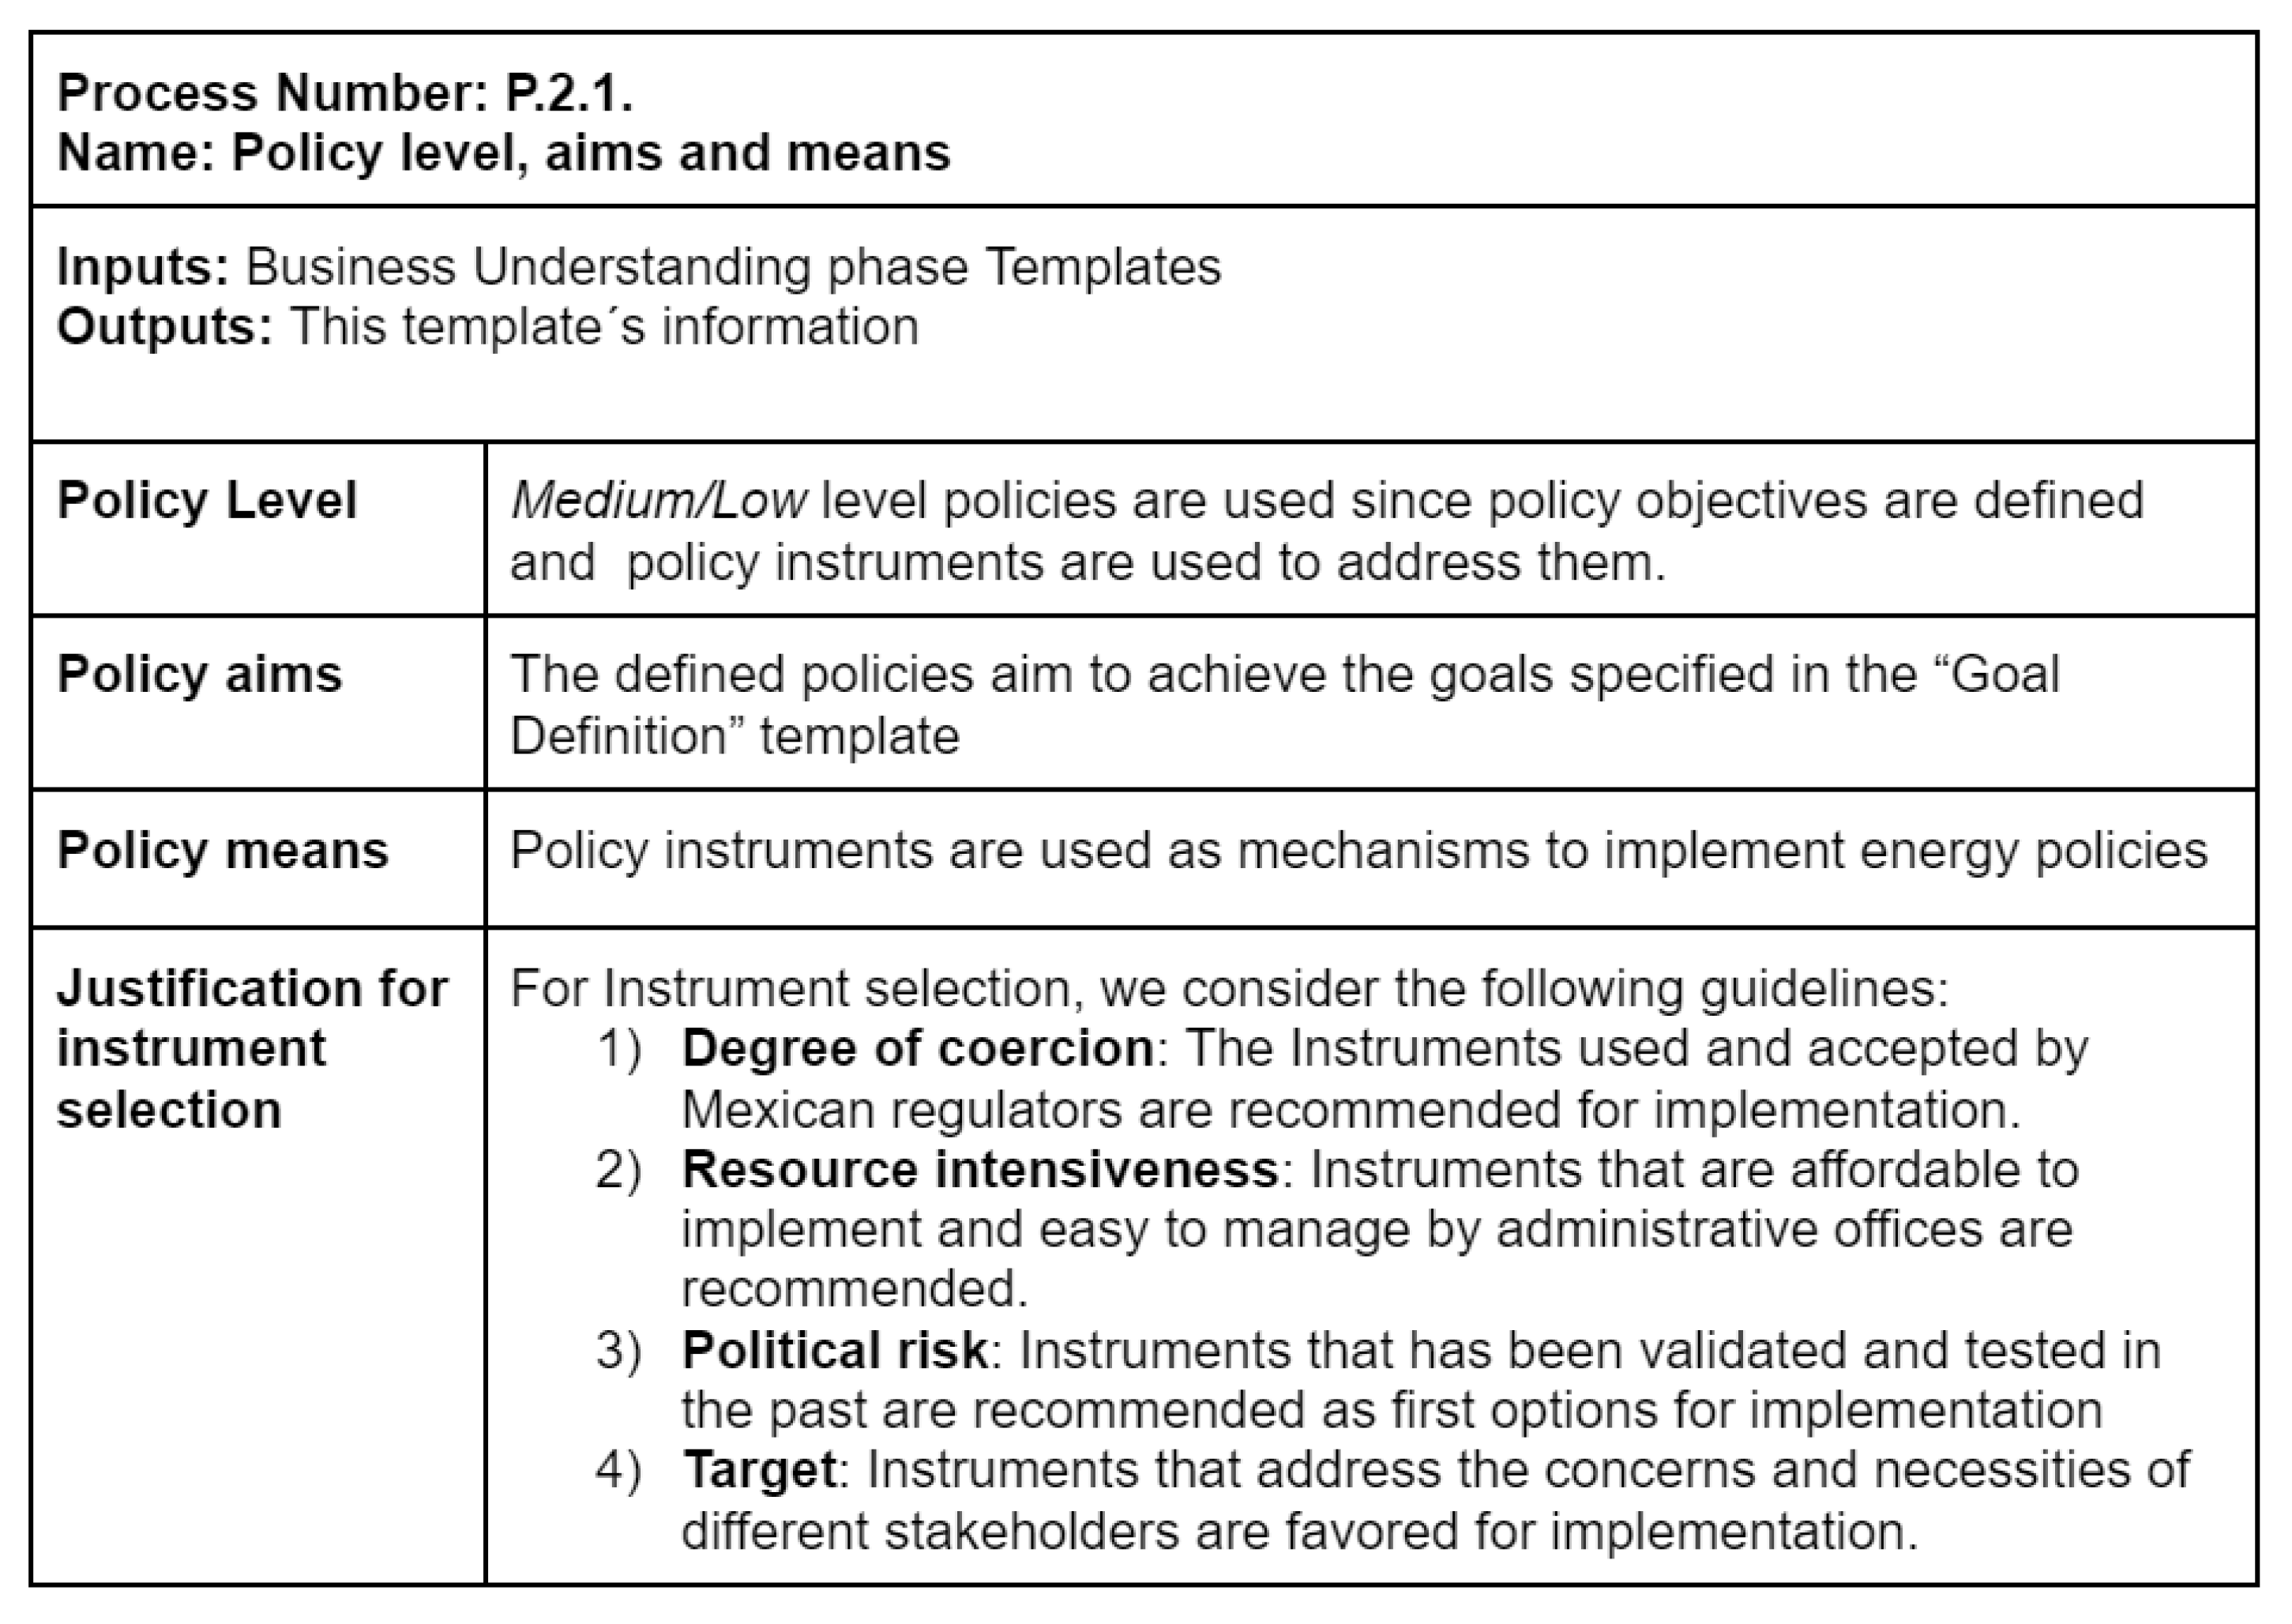
The primary objective of the policy alignment phase is to precisely delineate the implementation strategy of the policy design through the utilization of BUEMs. To comprehend the extent of detail that the model is designed to accommodate, it is imperative to determine the policy level(s), objectives, and means. Subsequently, and dependent upon the level of granularity of the model, it is imperative to delineate the energy policy instruments (such as policy tools) that will be implemented, clarifying the manner, timing, and agents responsible for their execution. Subsequently, the objectives that the model must attain should be articulated.
P.2.1
Policy level, aims, and means: During this process, an analysis is conducted to determine the policy level by examining the stakeholder requirements and the available data for policy design. The execution of this process necessitates the determination of different degrees of abstraction, including high, medium, and low, along with a substantiated rationale for the chosen level. It is imperative to explicitly articulate the goals and objectives of a policy while establishing clear criteria for selecting an instrument. The establishment of these standards should consider various elements, such as the level of coercion involved, the necessary resources, the potential political risks, and the intended audience.
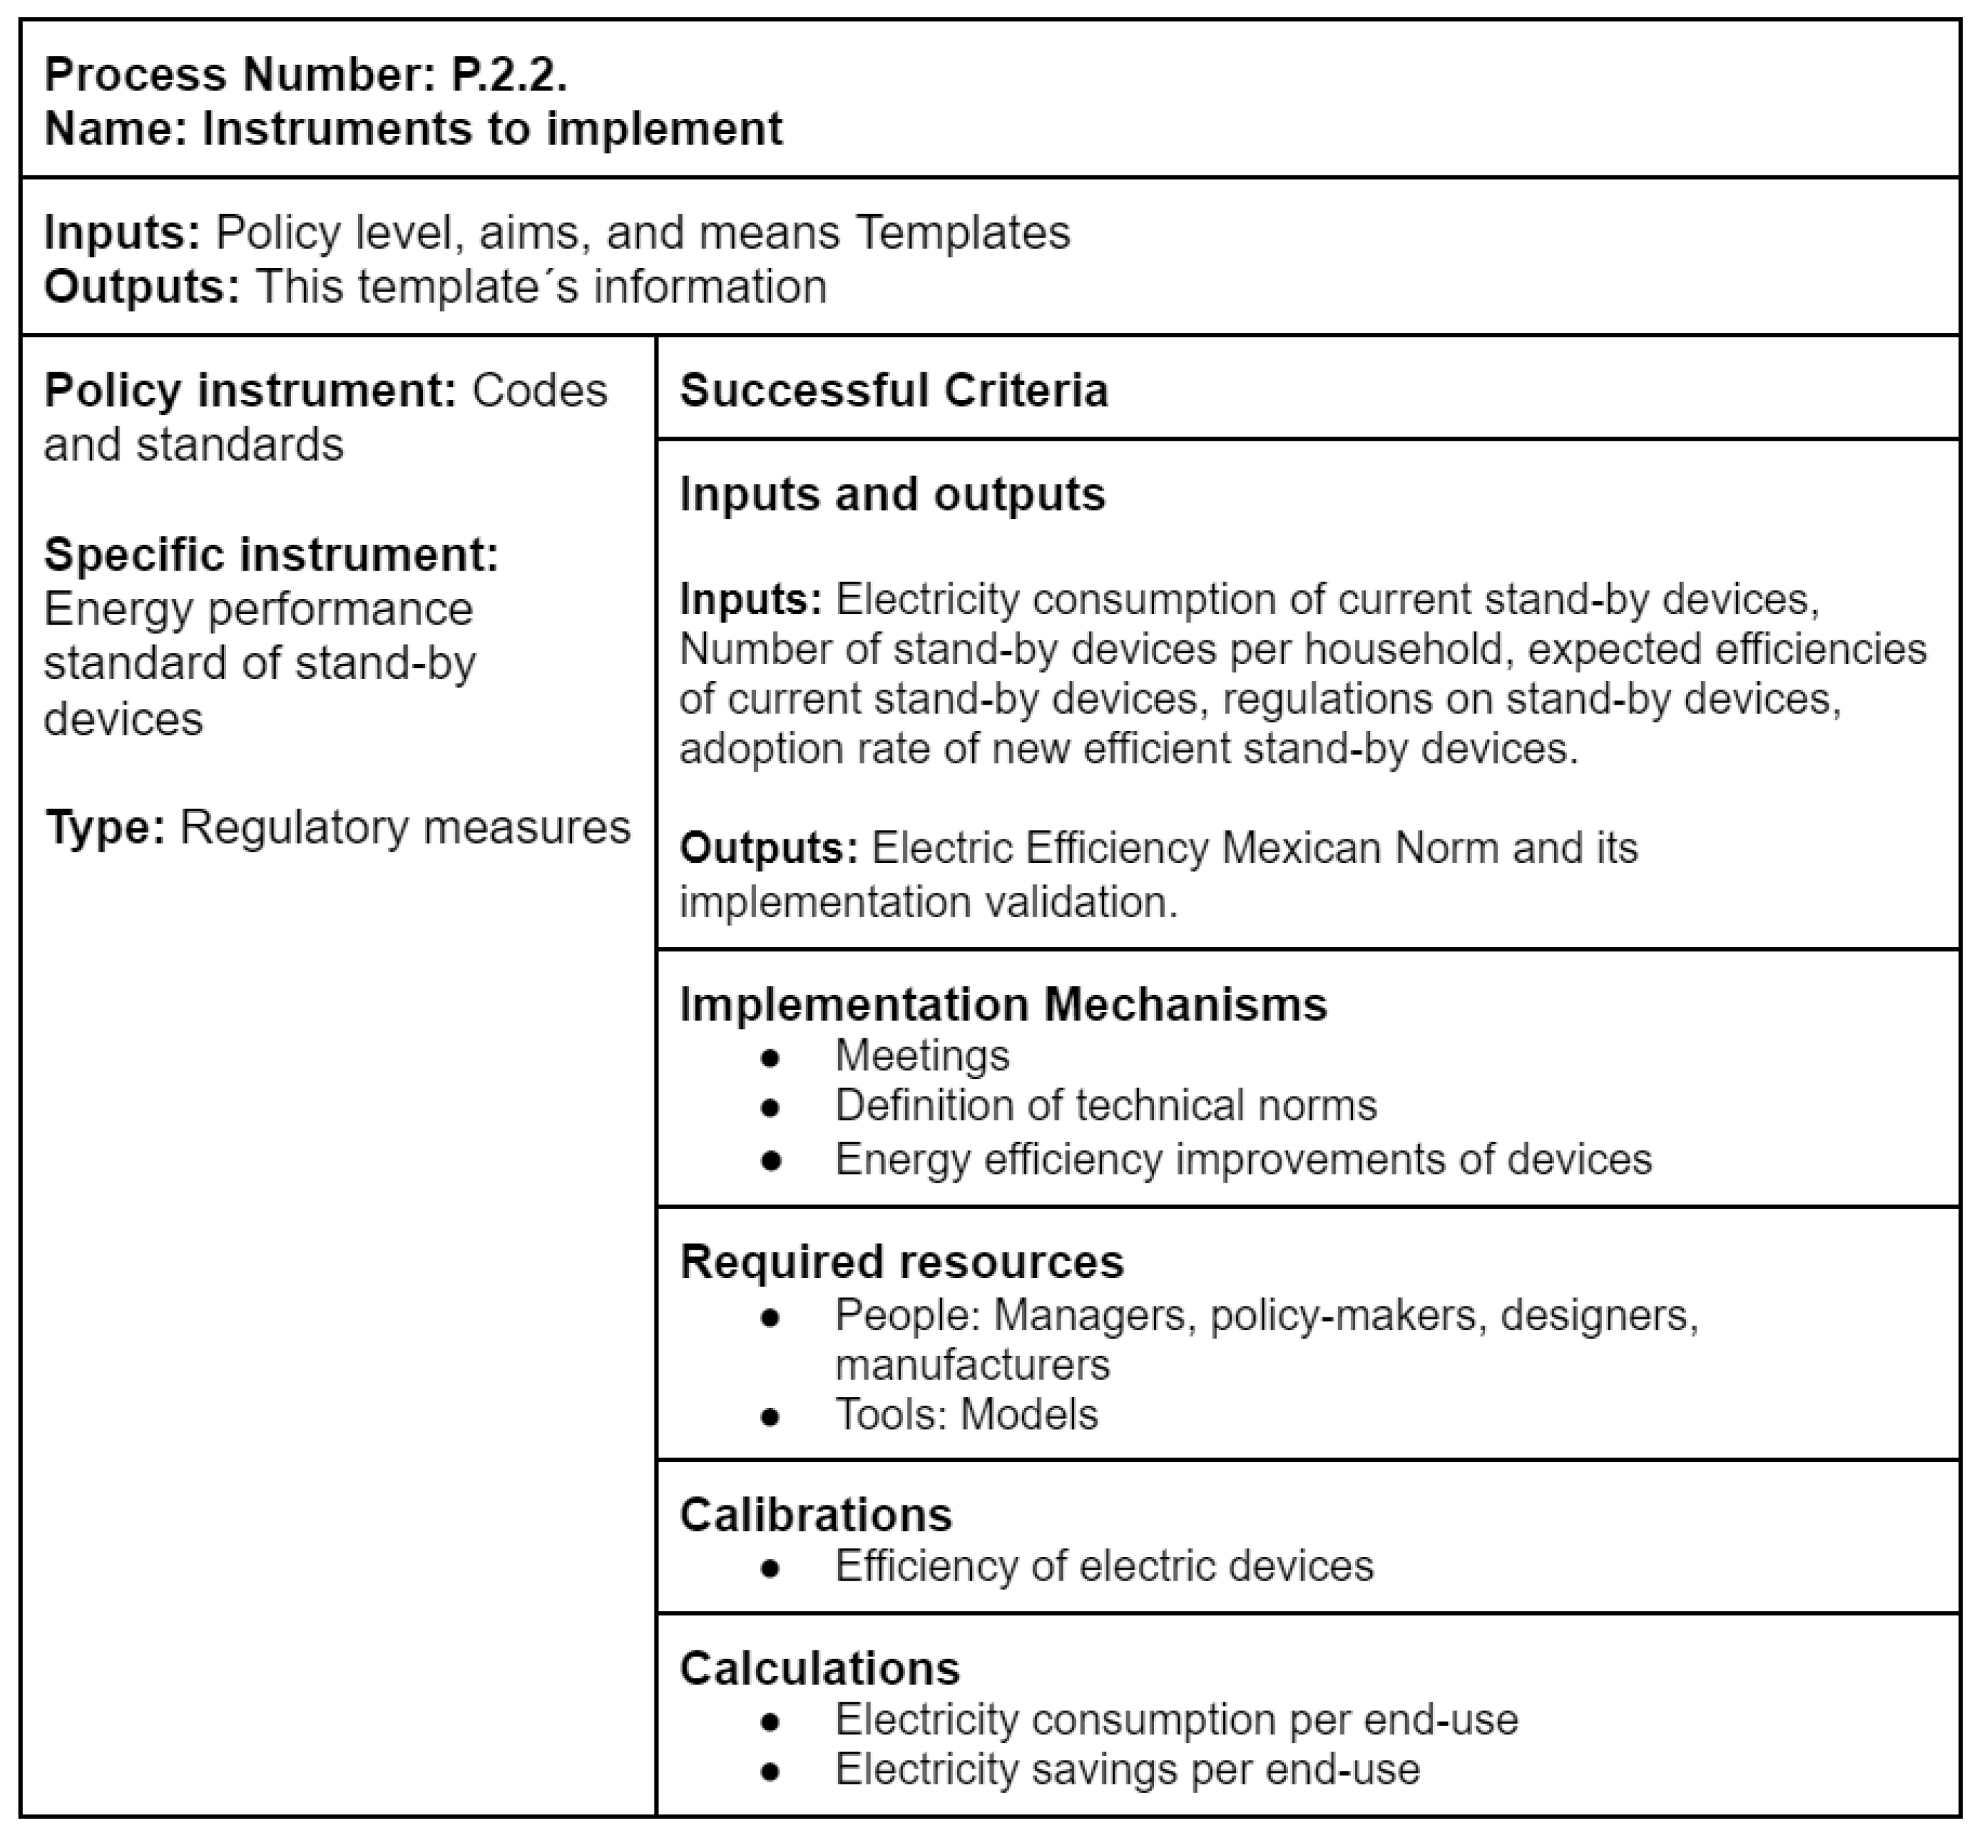
P.2.2
Instruments to implement: In this process, it is imperative to identify and pre-select the requisite instruments necessary to effectively execute the objectives outlined in the policy. Success criteria are established for each instrument, encompassing expected inputs, outputs (including metrics), implementation mechanisms, required resources, calibrations, and computations. By subjecting inputs, outputs, and calculations to several calibrations, this process facilitates the incorporation of variability and provides decision-makers with a holistic understanding of the potential applications of the instruments. This step holds considerable importance as it delineates the policy tools that are to be analyzed by the BUEM.
P.2.3
Model’s requirements definition and goal alignment: This process establishes the criteria that the model must satisfy and ensures its congruence with the objectives and requirements established in the Business Understanding phase.

3.1.3. Data Definition and Understanding

This phase encompasses the identification, analysis, interpretation, and documentation of data sources, as well as the information derived from these sources. It is important to acknowledge that stakeholders often engage in the policy alignment and data definition and understanding phases simultaneously, as these are interdependent. One example of a necessary step in the data search process is the identification of the information demands of the stakeholders. The policy alignment phase underscores the significance of data availability in influencing the policy level of a given model. Hence, it is imperative to carry out these treatments with meticulous coordination to mitigate any potential delays and prolonged dependency periods.
The following procedures are included in this phase:
P.3.1
Guidelines for Data Definition: The objective of this process is to establish a standardized approach for documenting information related to data sources, including details on the sources themselves as well as the data they include. The documentation for data sources should provide essential details such as the name, description, ownership, and location of the data sources. Furthermore, it is imperative to provide comprehensive information regarding the number of records, the division of data by time, the type of data source, the policy for updating the data, as well as the dates corresponding to the beginning and final records.
P.3.2
Data Acquisition: The establishment of a solid foundation is essential in the creation of any model, and it holds particular significance in the field of energy analysis. Hence, this process effectively tackles this issue by advocating for the adoption of well-established taxonomies and data-gathering methodologies, such as the one put forth by Wang et al. [20]. These approaches can be observed in Table 1.
P.3.3
Data Processing: The purpose of this process is to facilitate the processing of the data obtained during the preceding process, whereas some frameworks offer a broad approach to acquiring data and knowledge, they lack direction on gathering specific types of information and the methods to obtain it [21]. The data processing process in this framework covers two sub-activities: (1) examining and analyzing data to gain insights and identify patterns or trends, and (2) the assessment and evaluation of the reliability, accuracy, and completeness of data, ensuring its suitability for analysis and decision-making purposes. The previously mentioned activities are already covered within the CRISP-DM framework and are thoroughly explained in the CRISP-DM Guide [22].

3.1.4. Scenario Definition and Design

The scenario definition and design phase assumes a pivotal role in enhancing the alignment between the support provided by the model and the needs of decision-makers. This phase consists of two main activities:
P.4.1
Scenario Definition: This process implies a novel methodology within the domain of energy model development frameworks. It enhances the efficiency of policy design, promotes effective stakeholder decision-making, and assures the seamless alignment of models with policy objectives. The framework presented in this study draws inspiration from the works of Mahmoud et al. and Cao et al. [23,24]. These studies influenced this framework to provide an innovative technique for defining scenarios. The process includes the subsequent activities: (a) name the scenario; (b) define the scenario characteristics; (c) set the method by which scenarios will offer policy recommendations; (d) identify key factors and driving forces of the scenario; (e) detail the narrative and outputs of the scenario; (f) describe the underlying assumptions pertaining to the input and output data, calculations, and processes employed within the scenario; (g) clarify the potential impact of the assumptions on the resulting outcomes; and (h) determine and analyze sources of uncertainty.
P.4.2
Scenario Design: This process involves four crucial activities: (a) the determination of causal relationships between variables and external conditions; (b) the identification of significant uncertainties [23]; (c) the documentation and acquisition of scenario datasets; (d) the verification of data resolutions and scales. Therefore, this process plays a significant role in the advancement of robust, effective, and efficient BUEMs.

3.1.5. Model Construction
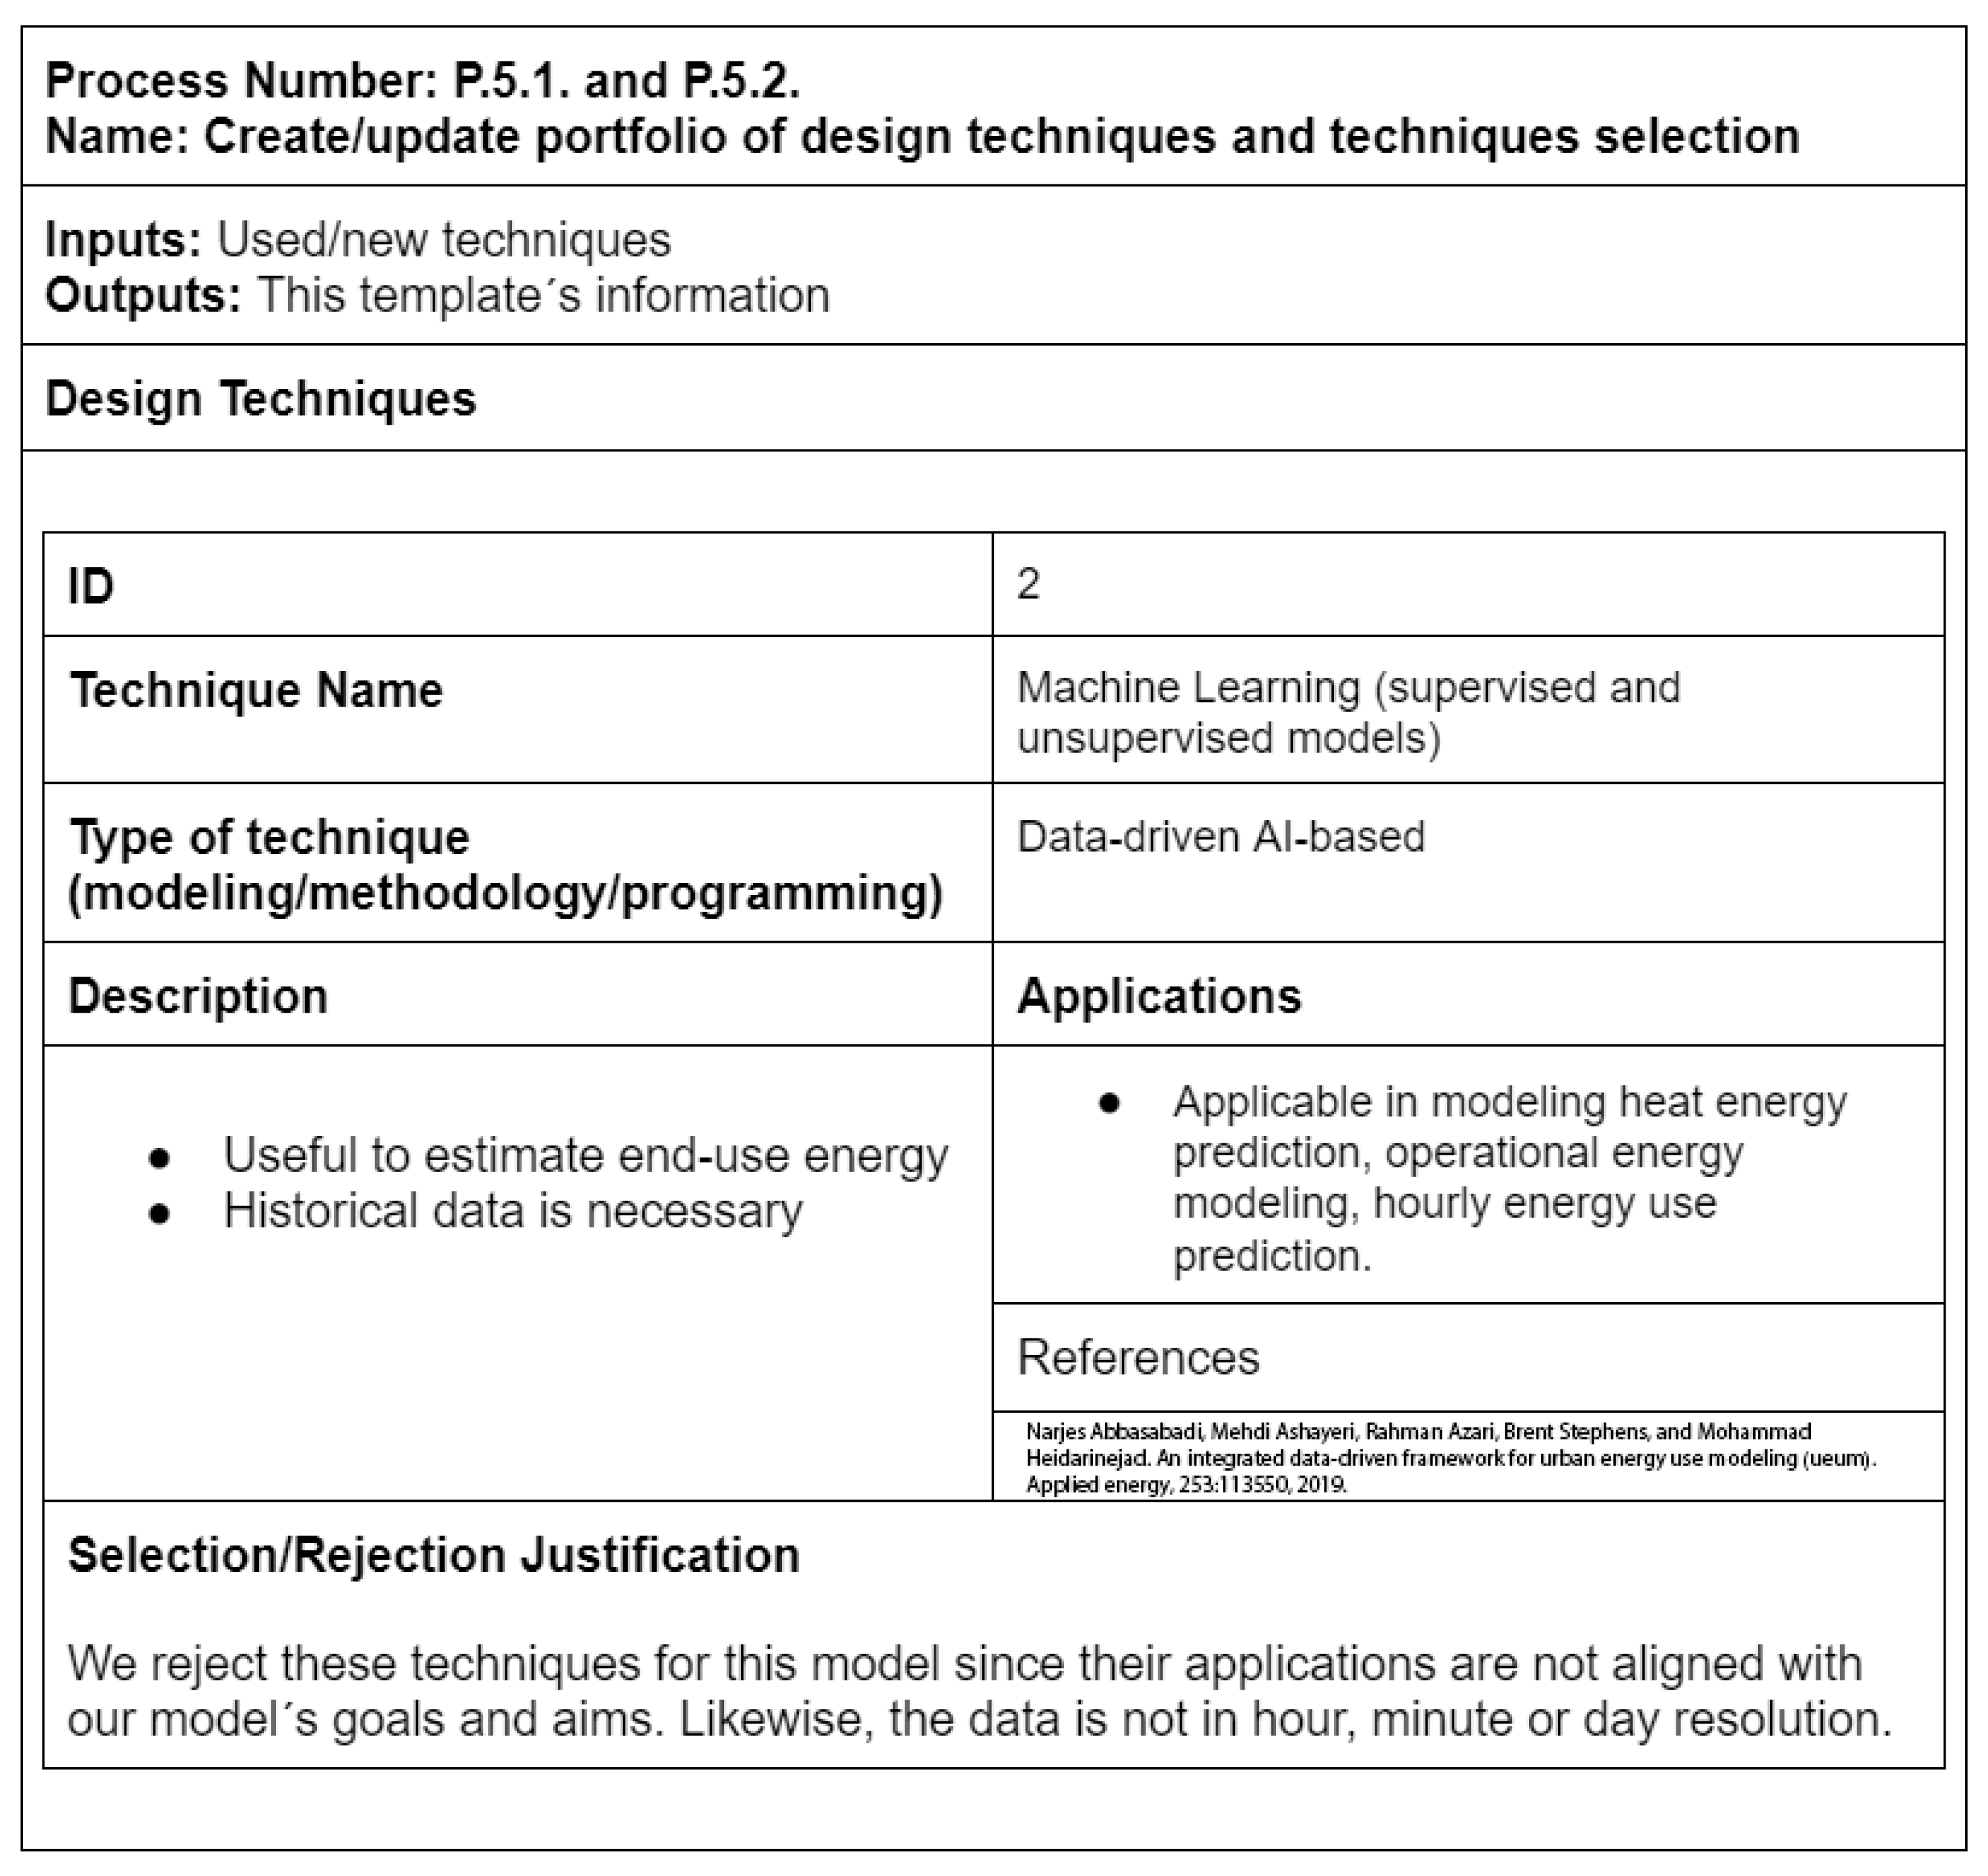
The aim of the model construction phase is to develop a comprehensive and practical model that effectively corresponds with the stated objectives of the model. This is achieved by employing various design strategies to ensure both effectiveness and efficiency. The phase involves the subsequent processes:
P.5.1
Create/Update the Portfolio of Design Techniques: The range of approaches and methodologies employed in system modeling is vast and depends on the particular type of model being developed. This study presents an extensive categorization of modeling approaches and procedures specifically designed for the residential sector and residential buildings (see Table 2). The Residential Electricity end-uses option exhibits promising potential for expansion and enhancement, placing it as a valuable resource for future reference by organizations.
P.5.2
Modeling Techniques Selection: Although frameworks such as CRISP-DM provide useful insights, their primary emphasis lies in the selection of data-driven modeling tools. This framework provides a detailed explanation of the methodologies employed in the design of BUEMs with the objective of facilitating policy development for enhancing energy efficiency in end-use applications. Table 3 and Table 4 provide valuable reference points for stakeholders to aid in the selection of the most appropriate strategies. Nevertheless, it is imperative for stakeholders to take into account particular limitations, such as corporate or organizational policies, financial restraints, or prospective expenses for upkeep, prior to reaching a conclusive determination.
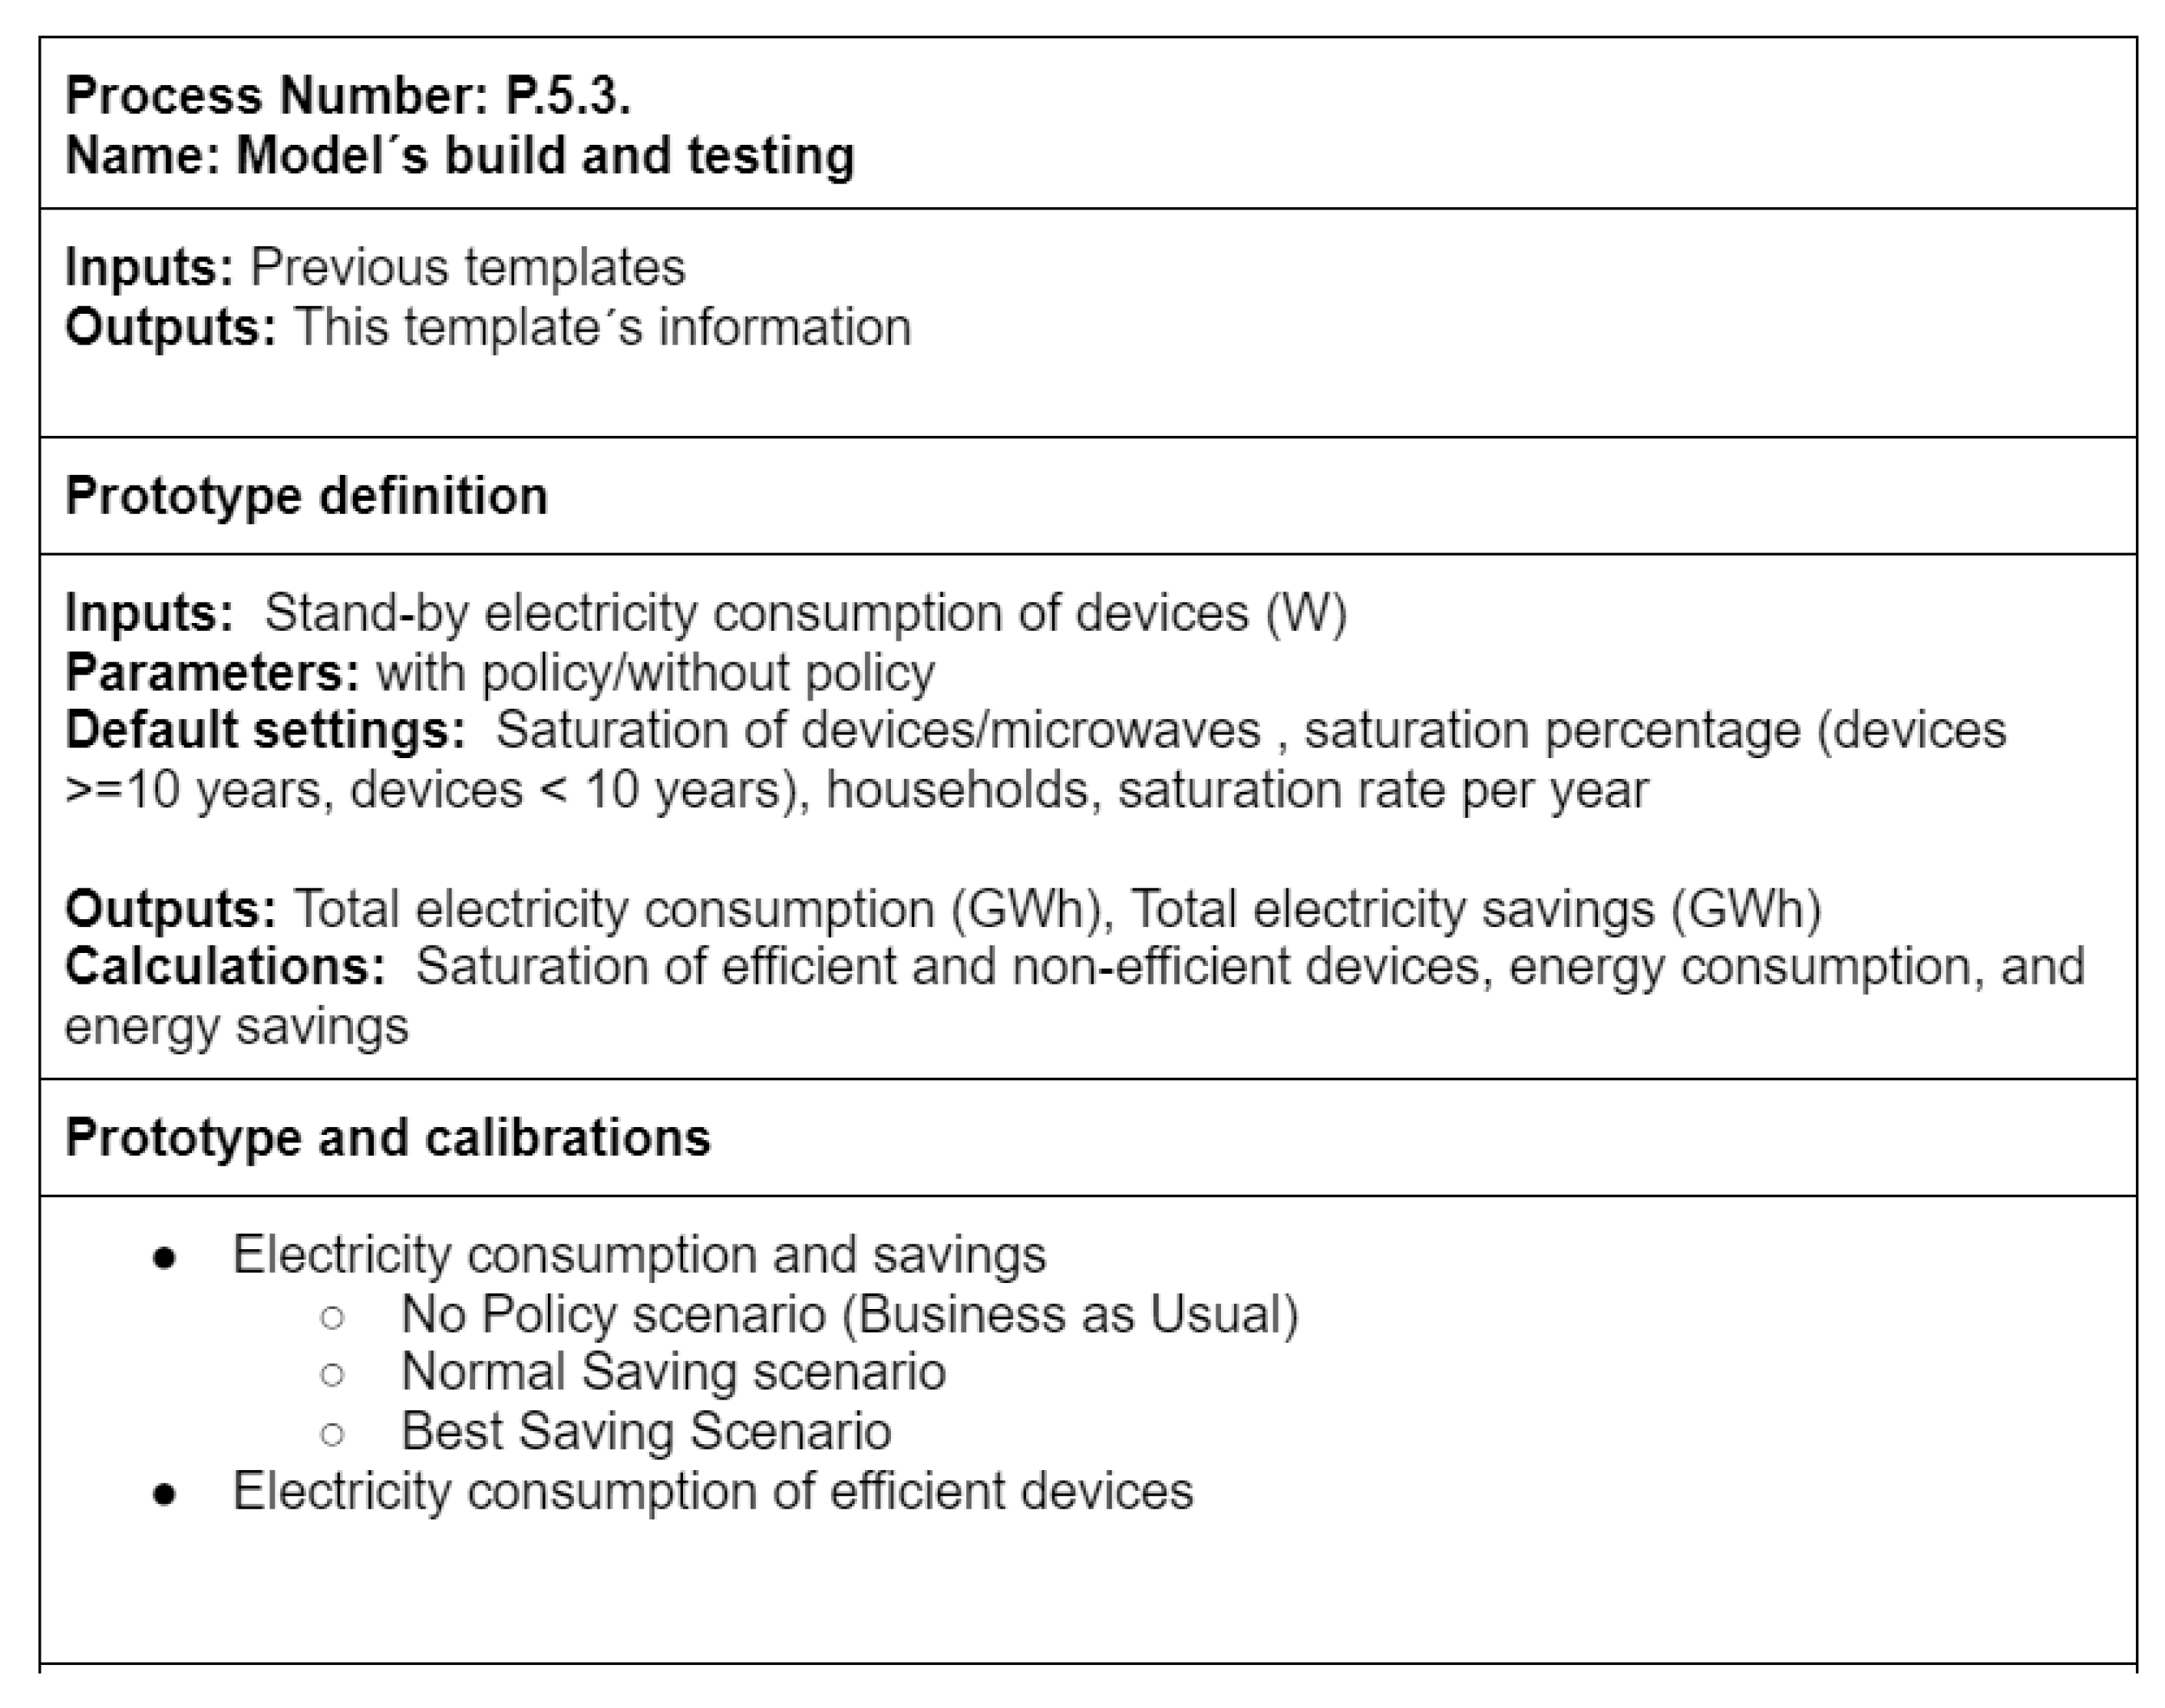
P.5.3
Model’s Build and Testing: The creation of the model must align with the specified objectives and scenarios, while also assuring the availability of data. To construct the model in a proficient manner, it is advisable to engage in a number of recommended tasks. (1) Define a prototype to construct (inputs, output parameters, default settings, and calculations); (2) develop a comprehensive test design for the prototype, encompassing several calibration parameters; (3) create the prototype of the model; (4) conduct experiments by manipulating inputs and calibrations for each scenario; and (5) repeat this iterative process until the final model is achieved. The construction of the model occurs through a series of incremental stages. This methodology enables the detection and resolution of operational issues within the initial stages of the construction process.

3.1.6. Model Evaluation
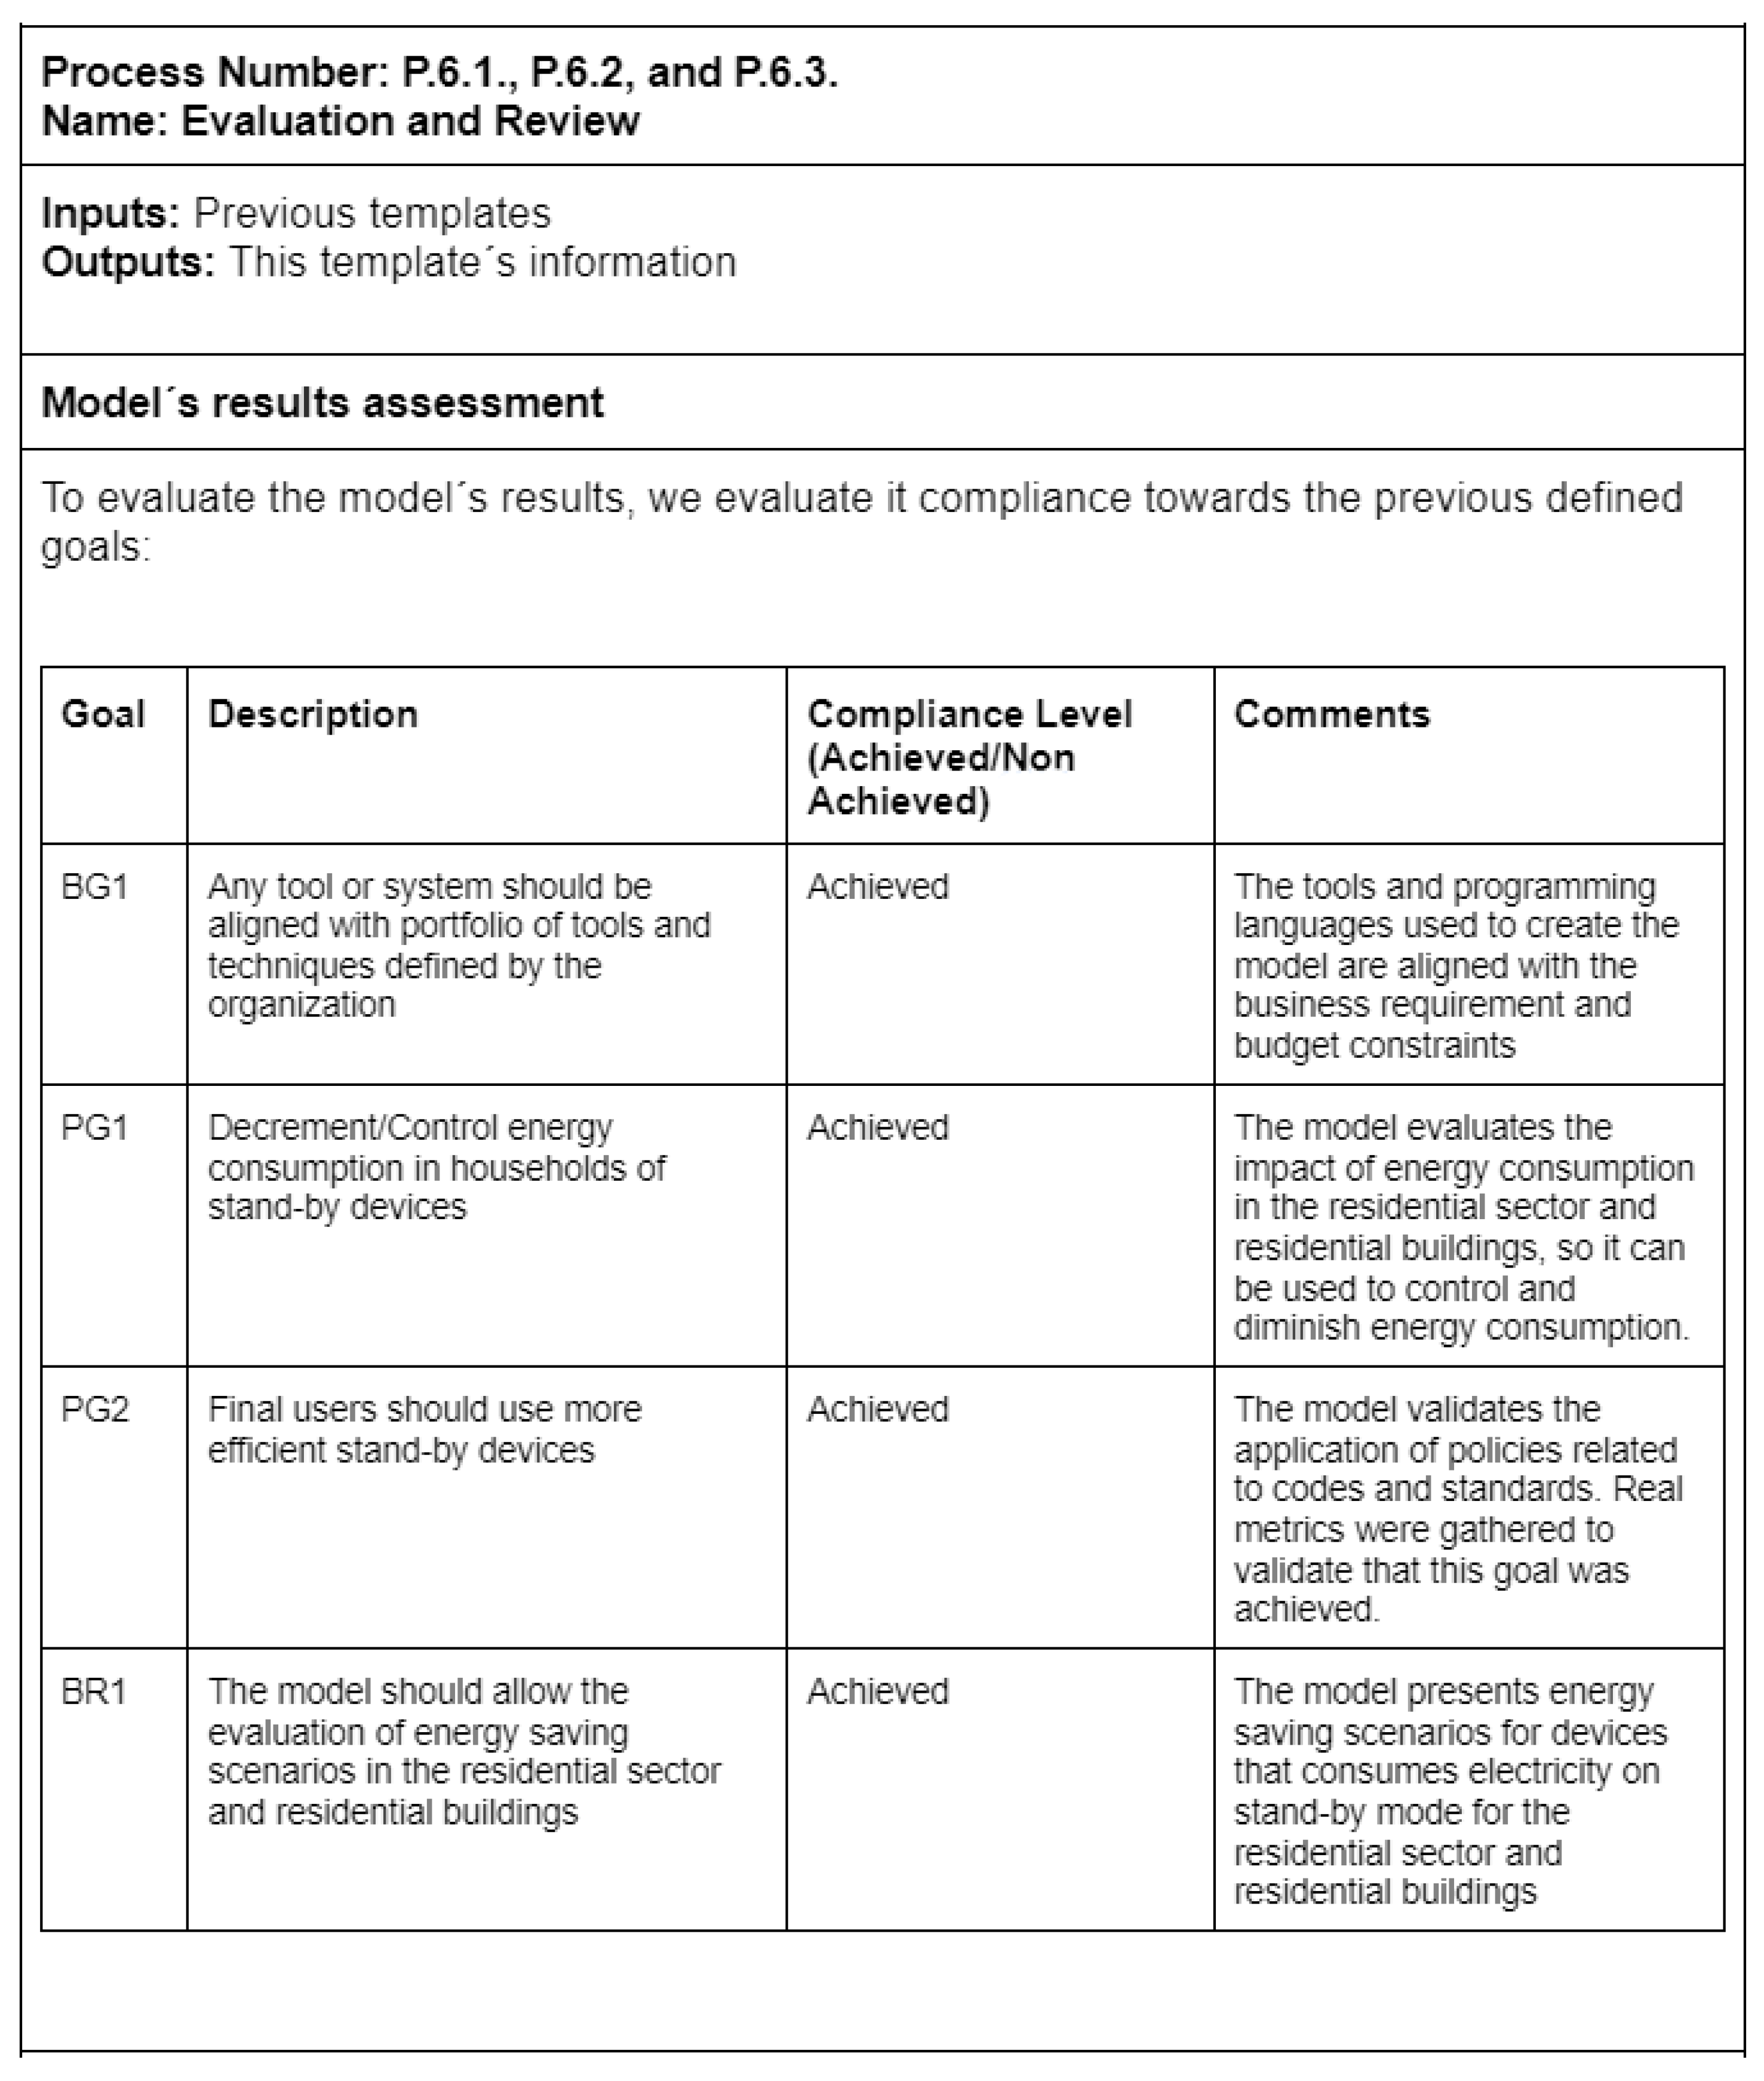
This phase was designed to ensure that the model and scenarios are in accordance with and fulfill the objectives and requirements established by the stakeholders. The activities associated with this phase include the following:
P.6.1
Model’s results assessment: the stakeholders are provided with the outcomes of the model for assessment, drawing upon their specialized expertise.
P.6.2
Review process: decision-makers and designers have the opportunity to evaluate and analyze the methodologies used in constructing the model, with the aim of finding areas that can be enhanced and identifying practices that deserve recognition.
P.6.3
Determine next steps: A comprehensive list of potential tasks developed to effectively tackle the stated concerns is offered. Subsequently, individuals in positions of authority engage in the process of evaluating and selecting the most suitable courses of action to effectively address these aforementioned difficulties.

4. Case Study

A case study was conducted to demonstrate the application of the framework in guiding the creation of BUEMs aimed at facilitating policy design. The model selected for this case study was provided by the Mexican Commission for the Efficient Use of Energy (CONUEE) [50], and it examines the impact of regulatory instruments on the residential sector and residential buildings. This case study investigated the impact of regulatory tools on energy efficiency, with a specific focus on the residential sector and residential structures. The design of the model under consideration was in accordance with the analysis requirements of the Decision-Making Center at Tecnologico de Monterrey. The institution has a track record of engaging in collaborative efforts with the Mexican government pertaining to diverse energy modeling initiatives. Therefore, there exists a potential to improve and broaden the scope of these pre-existing models. This particular model was designed to forecast the potential outcomes of implementing energy efficiency initiatives within the residential sector, including residential structures.

4.1. Business Understanding Phase

The primary emphasis of the model revolved around the implementation of energy efficiency standards for standby equipment. The stand-by end-use model has been recognized as a significant contributor to the energy consumption of Mexico’s residential sector in recent times. According to the reports of the CONUEE, it has been determined that end-use devices contribute to approximately 5.6% of the total energy consumption in residential settings. Consequently, this observation has led to the classification of end-use devices as a distinct and separate category. This classification has been acknowledged and supported by previous research conducted by the Economic Commission for Latin America and the Caribbean (CEPAL) in 2018 [51]. The complete description of the problem, the roles involved, and background research related to the issue are presented in Figure 3.
A comprehensive understanding of the problem necessitates a thorough examination of its context and background. Key inputs in this process include relevant literature such as books, articles, or reports pertaining to the problem. The background research relied on technical reports [52,53] from previous projects and government-published reports. These sources facilitated the identification of potential causes, consequences, and various factors related to the problem. For instance, one significant finding from this phase was the government’s issuance of a normative for stand-by energy devices in 2013 [51], which predicted the energy savings of that program.
To achieve a comprehensive understanding of the problem, it is imperative to conduct a thorough investigation of its contextual factors and historical past. Critical inputs in this procedure include pertinent scholarly sources, such as books, journals, or reports that pertain to the issue at hand. The background research was conducted using technical publications [52,53] from prior projects, as well as reports provided by the government [51]. These sources were crucial in enabling the identification of potential causes, repercussions, and other elements associated with the situation. One notable discovery from this phase involved the government’s introduction of a regulatory standard for standby energy devices in 2013, which projected the anticipated energy conservation outcomes of the initiative [51].
In relation to the objectives of the organization, the Decision-Making Center at Tecnologico de Monterrey places emphasis on the alignment of the modeling tools with their current decision-making centers (DMCs) environment technologies, as depicted in Figure 4. However, the main objective of CONUEE is to decrease energy consumption in residential settings by advocating for the use of more efficient stand-by equipment in the Mexican market [51].
The incorporation of scenarios within the model was recognized as a crucial necessity, while also acknowledging potential limitations on policy formulation. The constraints included in this study consist of financial restrictions and probable deficiencies in data availability that could impede the development of the model, as illustrated in Figure 5.
To achieve the specified goals, various stakeholders proposed forward strategies. These strategies included the exploration and evaluation of tools for scenario building using prototypes with limited scope. Additionally, stakeholders suggested promoting the development of efficient standby devices by adhering to established codes and standards, as depicted in Figure 6.
The plan presented by the DMC comprises not only the tasks involved in constructing a model, but also the steps required for implementing, monitoring, and evaluating the chosen policy, as illustrated in Figure 7.

4.2. Policy Alignment Phase

The preceding phase provided a comprehensive comprehension of the problem and various approaches for its resolution. For instance, it was observed that policy instruments designed for broad implementation, such as at the national level, would need to be established by a national energy agency such as CONUEE, and enforced across the entire country, as depicted in Figure 8.
In recent years, there has been a discernible preference by the Mexican government for regulatory tools in the residential sector, mostly motivated by their advantageous attributes such as minimal risks, moderate costs, and diverse consequences for many stakeholders. The tendency towards regulatory policies is expected to persist, as seen by the implementation of codes and standards (Figure 9).
The implementation of regulatory policies is a time-consuming process that is influenced by various factors. These factors include the technical capabilities of device manufacturers, the lifespan of existing devices in the market, the introduction of efficient devices into the market, and the eventual acquisition of these devices by end-users. The model should accurately represent the reality under the given settings. Typically, stakeholders demand that this BUEM is capable of estimating and forecasting the overall electricity usage of particular stand-by devices (such as microwave ovens) at a national level over a span of 5 to 8 years. Therefore, the primary outcome of this phase is the formulation of the policy itself, together with its verification. The agreed requirements for this model are shown in Figure 10.

4.3. Data Definition and Understanding Phase

The creation of the model involved the identification of numerous important data sources, which are depicted in Figure 11.
The surveys conducted by the Mexican government spanned the period from 2014 to 2020. However, it should be noted that no official survey was undertaken by the government in the year 2019. Therefore, for the sake of this analysis, it is assumed that the number of microwaves remained constant between the years 2020 and 2019. Moreover, this phase also considered the regulations established by the Mexican government concerning the upper limits of energy consumption for microwaves in standby mode.
The present study aimed to analyze the metrics pertaining to the current efficiency and longevity of microwaves available in the market. These metrics were collected from the most up-to-date sources, as no official reports in Mexico provide this information. Additionally, The Energy Efficiency National Reports encompass energy efficiency measures pertaining to the residential sector and residential buildings over the past two decades. These metrics include the average number of microwaves in households and the saturation rates of microwaves.
Lastly, the process of data collecting was carefully recorded and carried out for each individual data source.

4.4. Scenario Definition and Design

Considering the standard time frame for policy changes to produce discernible effects, which is generally observed to be within five to ten years after implementation, it is regarded as suitable to employ an eight-year forecast span (2021–2028).
Therefore, during this phase, stakeholders put forth two prospective scenarios for modeling. The initial scenario, referred to as Business As Usual (BAU), depicted a state of affairs characterized by the absence of any newly implemented policies. The second scenario, referred to as the technology potential scenario, proposes the substitution of inefficient equipment with more efficient alternatives, prioritizing the achievement of average efficient consumption. The detailed parameters for these scenarios can be found in Figure 12, Figure 13 and Figure 14.
Furthermore, in the technology potential scenario, the variable that represents the effectiveness of newly introduced gadgets in the market functions as the calibration mechanism for the presented scenarios (Figure 14).
The design of these scenarios is based on the underlying assumptions: (a) the market encompasses a variety of devices, with varying levels of efficiency, distributed in different proportions; (b) a consistent annual rate of appliance saturation is observed; (c) this rate of saturation is directly influenced by the number of efficient devices and inversely influenced by the quantity of non-efficient devices; and (d) energy consumption is dependent on the total count of both efficient and non-efficient devices, as well as their respective energy usage patterns. Figure 15 depicts a thorough causal link diagram that highlights the intricate interactions among model variables, uncertainties, and the necessary datasets. The establishment of these inputs marked the beginning of the model implementation.

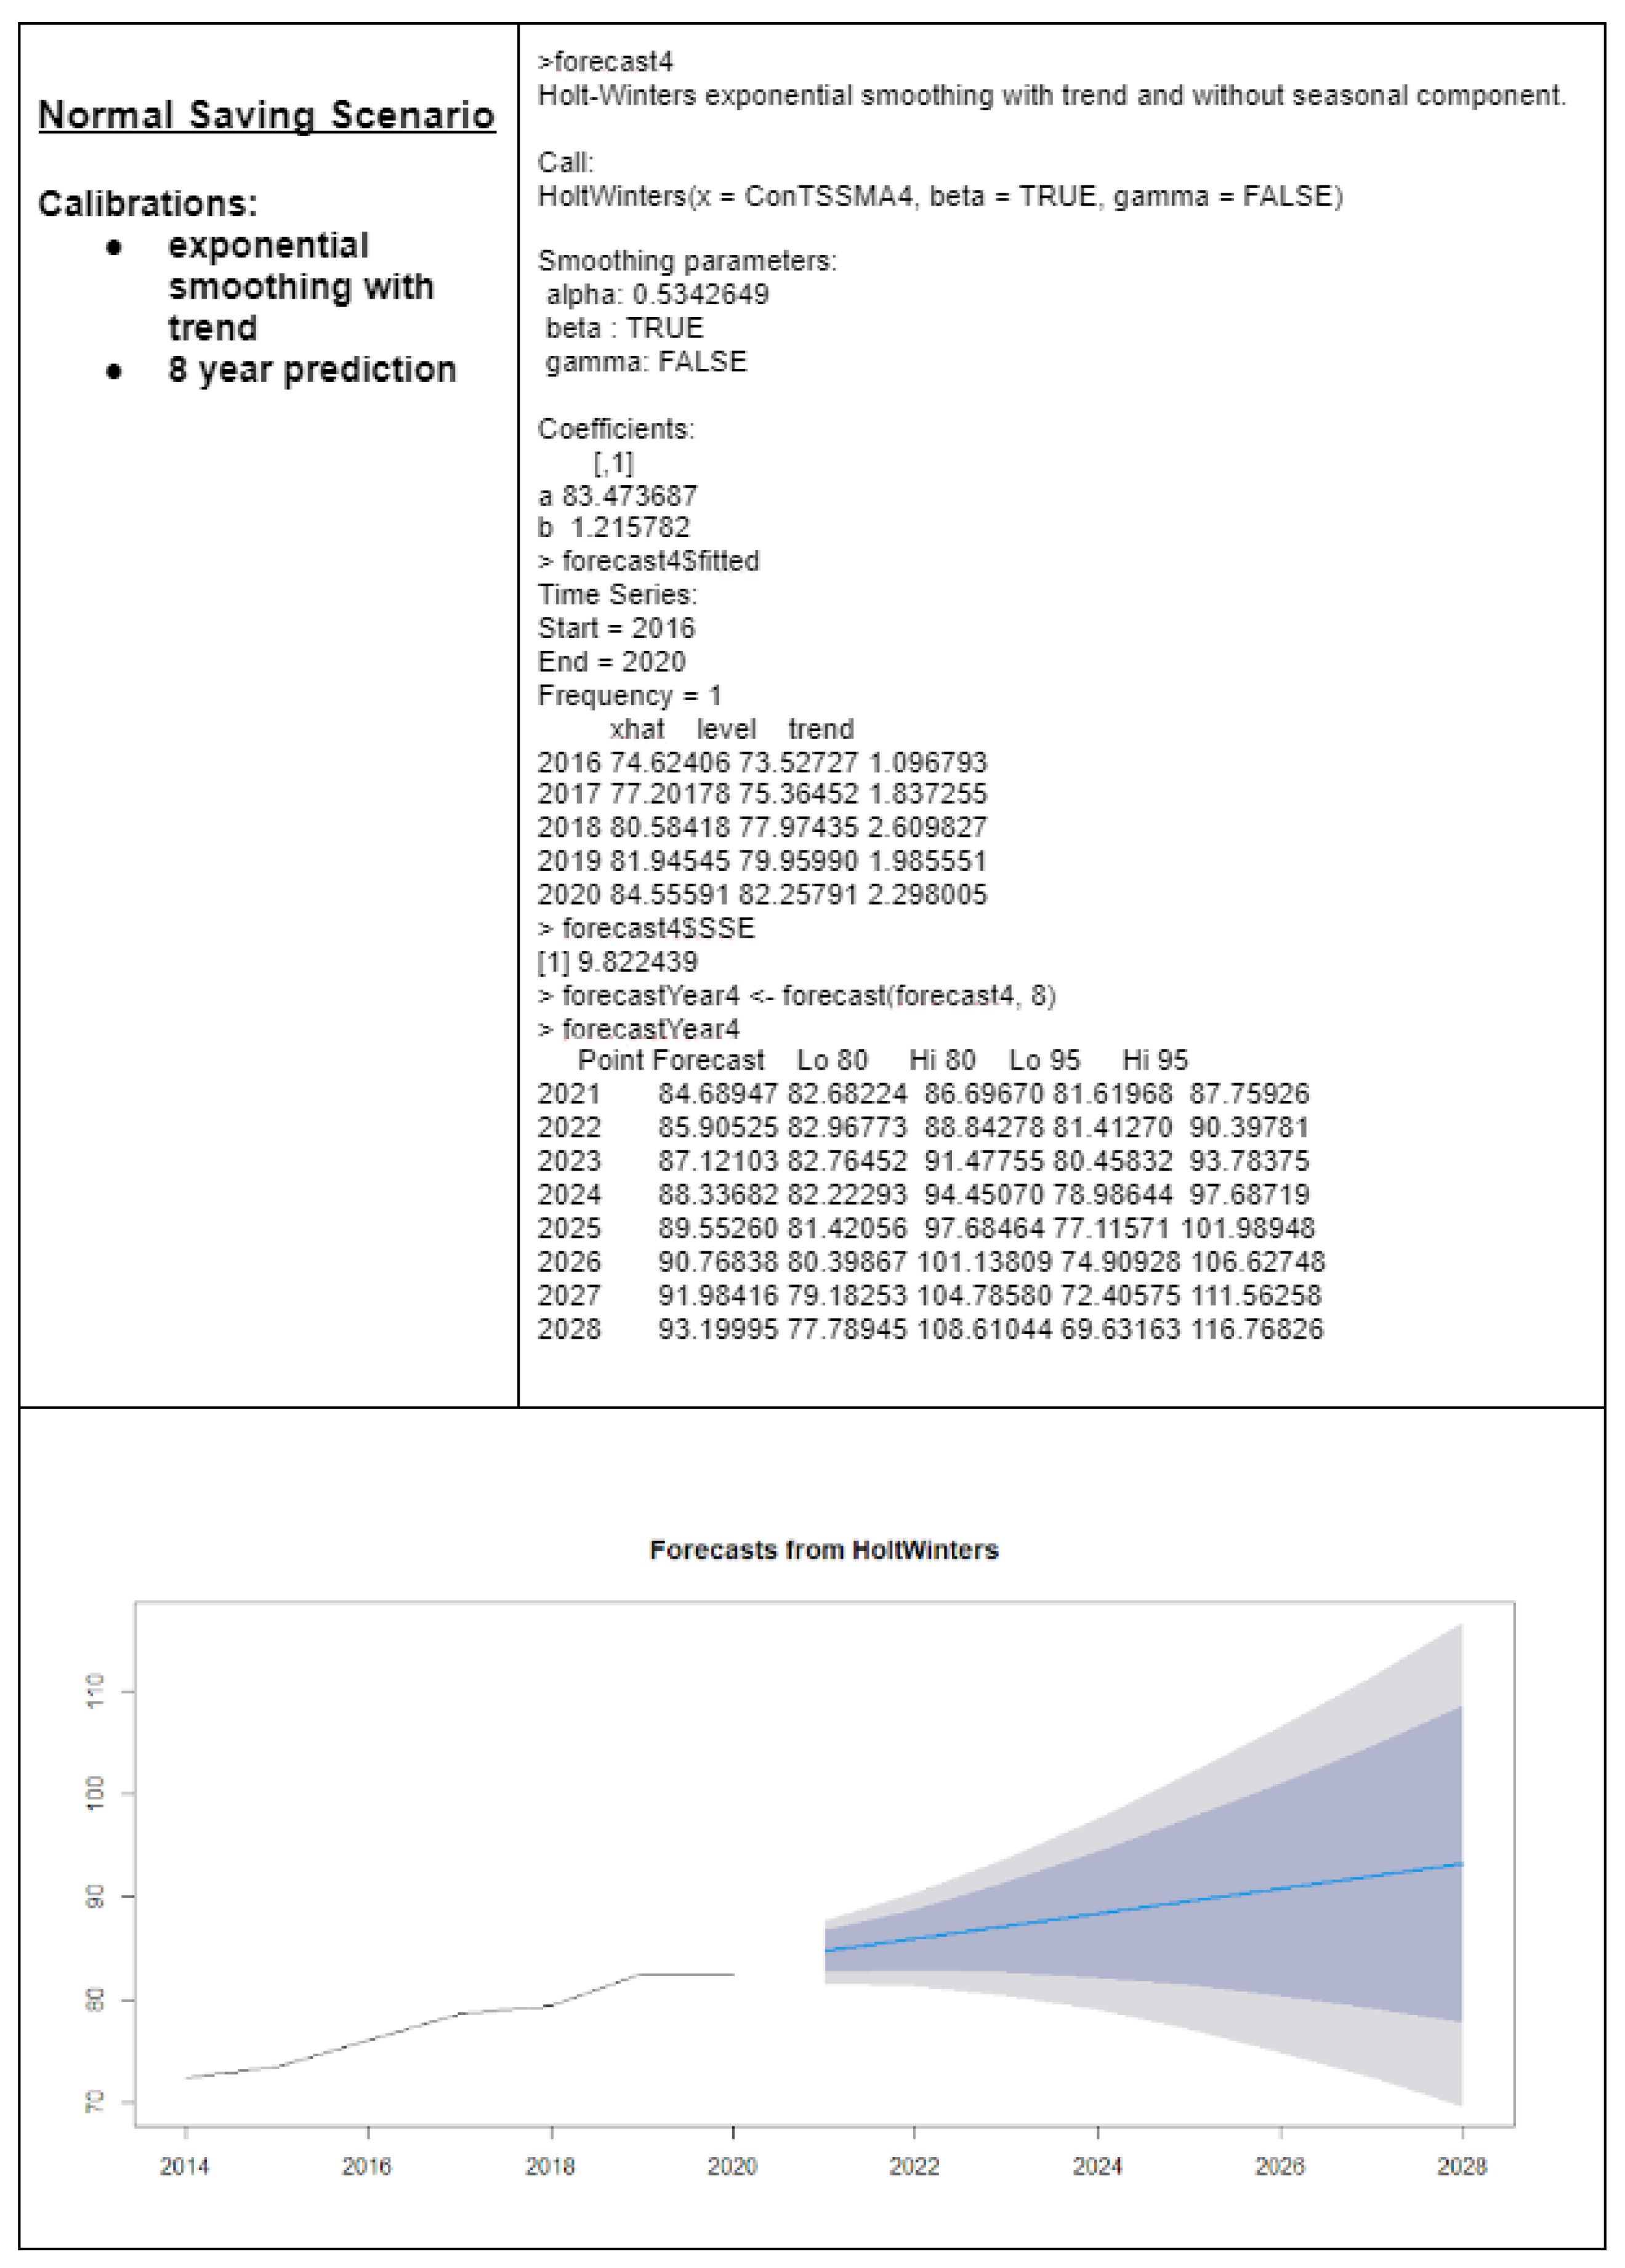
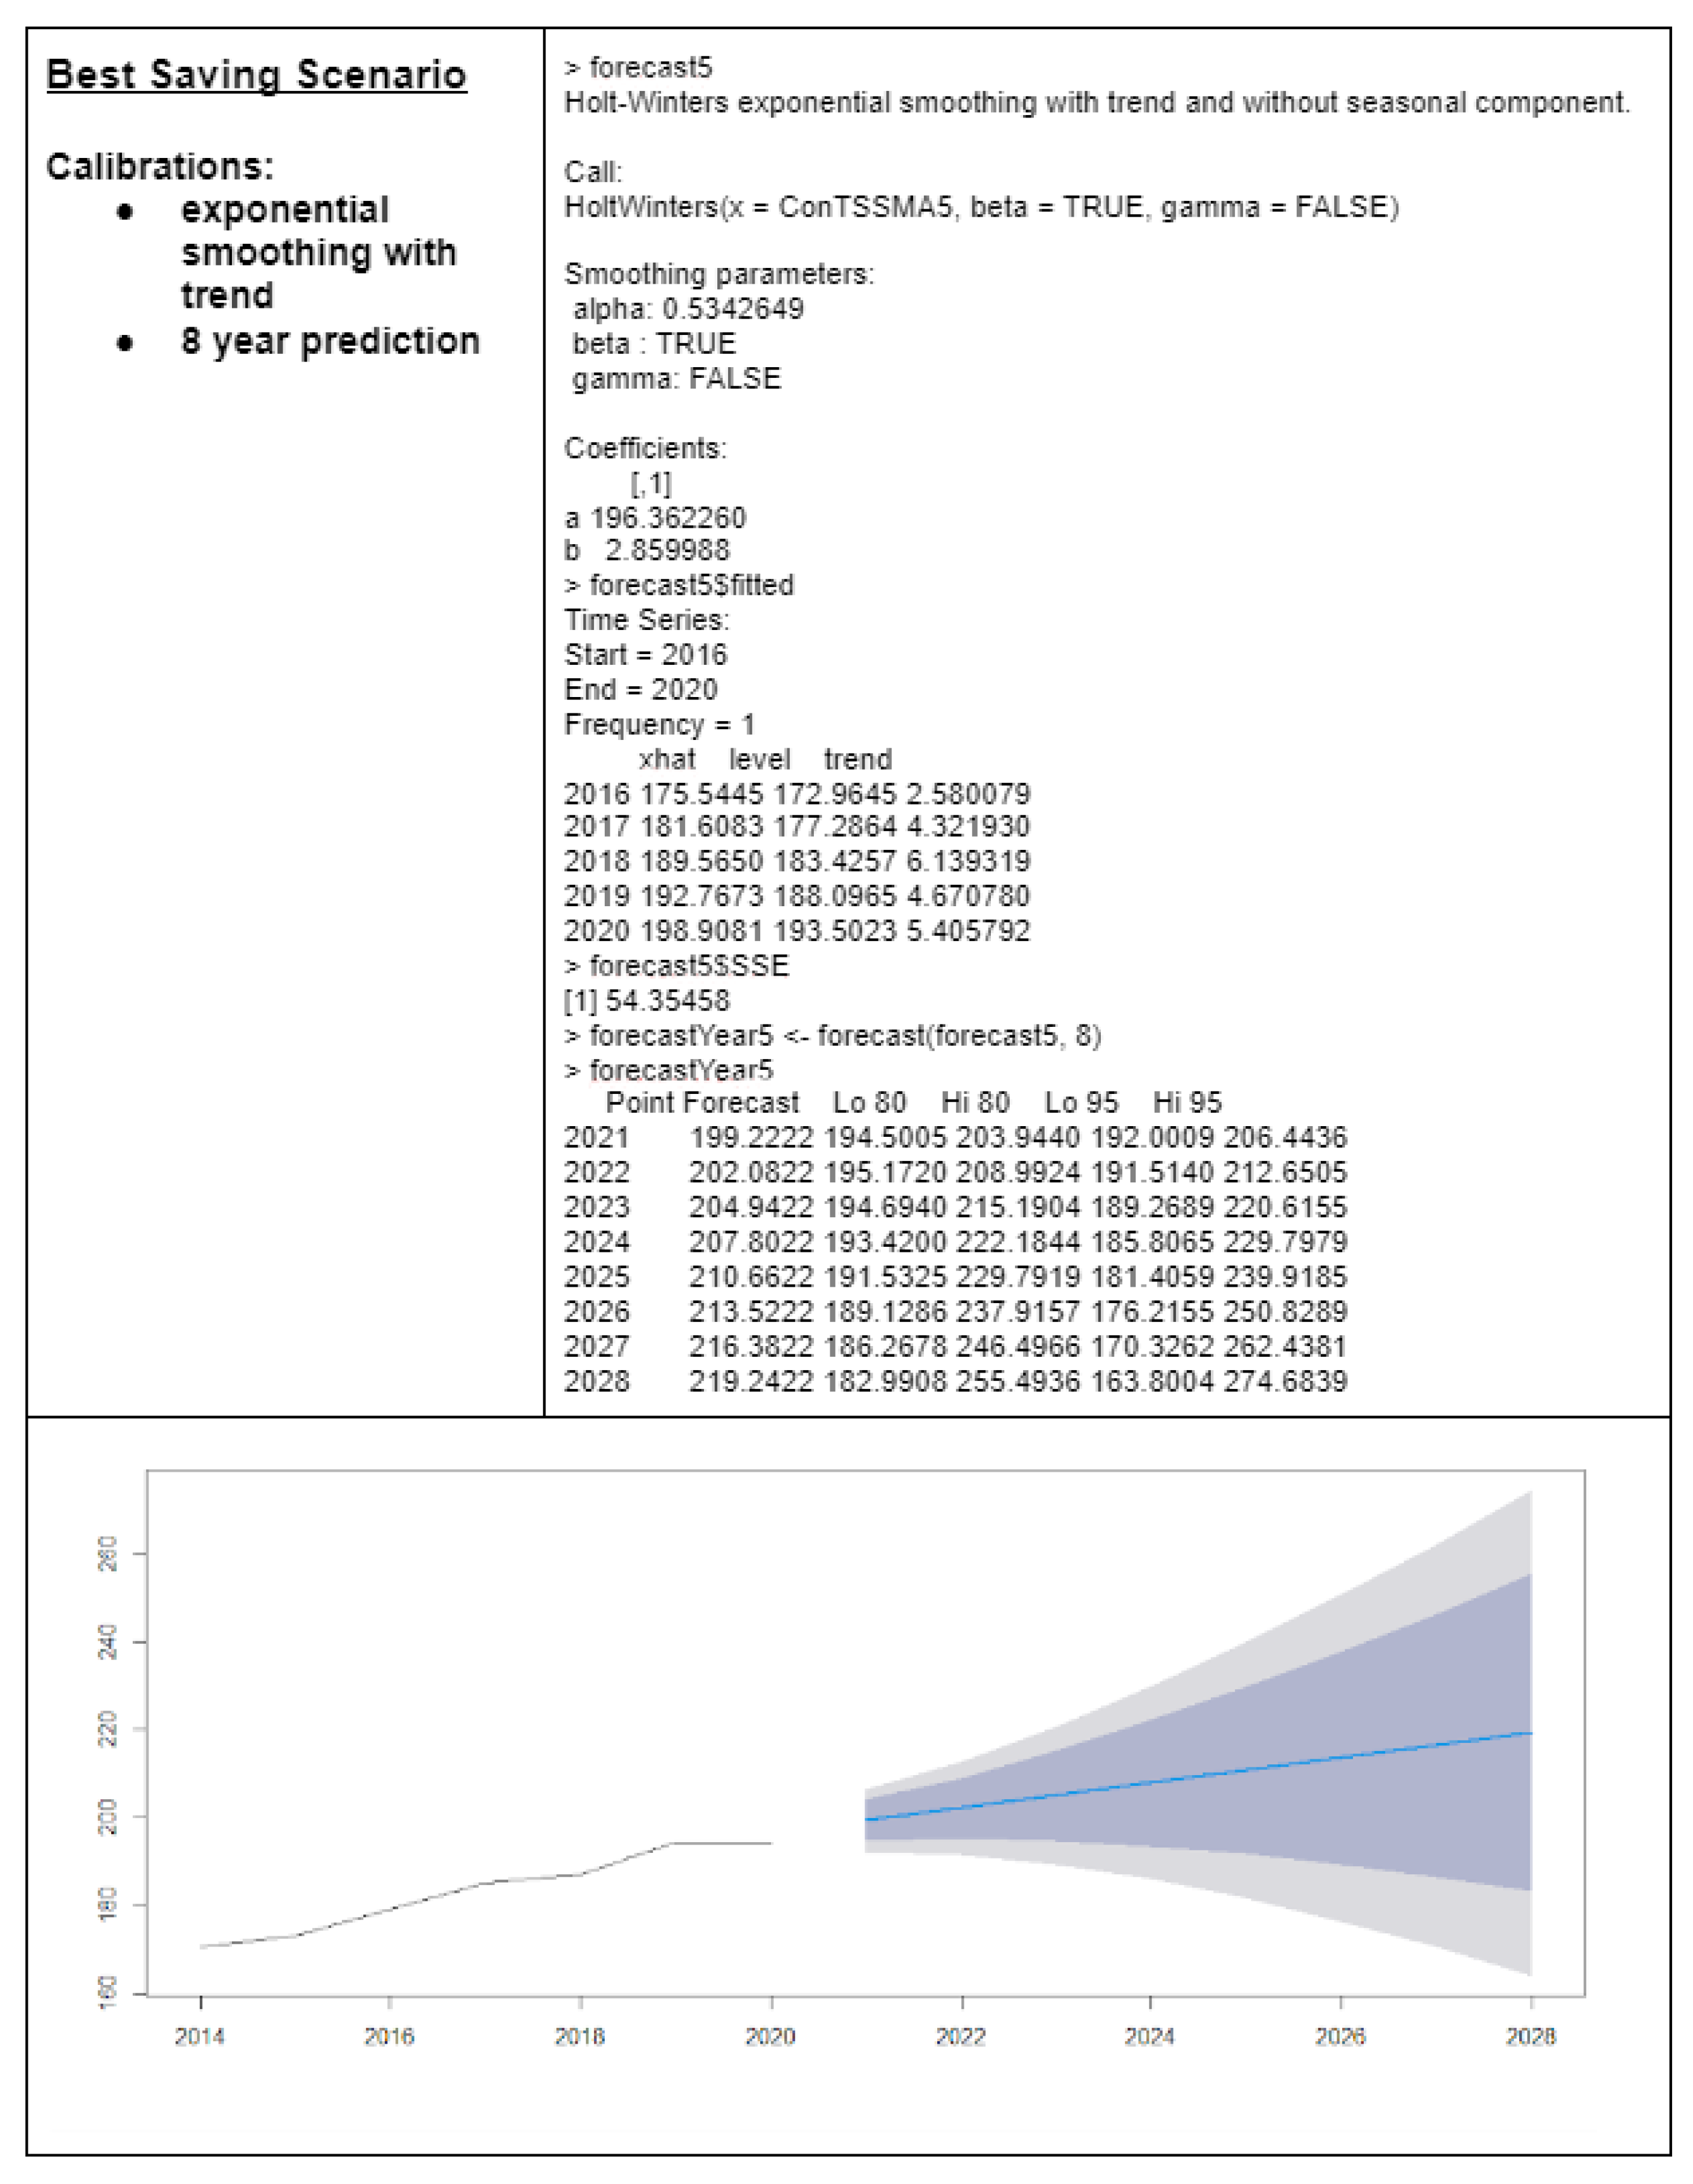
4.5. Model Construction

During the development of the model, two innovative and unconventional methodologies were evaluated. One of the primary methodologies employed in this study was time series analysis, whereas the second methodology covered a range of machine learning approaches, including both supervised and unsupervised learning methods. However, due to the annual resolution of the data, the latter was quickly disregarded. AI modeling techniques are generally more appropriate for conducting detailed studies at a granular level, such as those that involve hourly, minute, or real-time data resolution, as depicted in Figure 16.
On the other hand, the time series technique exhibited greater potential as a result of its effectiveness in forecasting energy patterns, which closely aligns with the goals of the model. The selected time series technique employed was double exponential smoothing, often known as Holt’s Method. This method shows efficacy in analyzing data exhibiting a linear trend and yields the most accurate representation of the data. A comprehensive exposition of this methodology, accompanied by a justification for its adoption, can be found in Figure 17.
Afterward, a prototype model was developed. It integrated specified inputs, outputs, parameters, settings, calibrations, and calculations, as seen in Figure 18.
The model incorporated definitions for the variables employed:
  • Households: the total amount of residential units within a certain nation.
  • Stand-by electricity consumption: it refers to the average energy consumption of a device while it is in standby mode.
  • Saturation of microwave ovens/devices: it references the amount of microwave ovens/devices present in the Mexican market.
  • Saturation percentage: it corresponds to the ratio of devices, such as microwaves, inside a specific age category, such as those less than 10 years old or those that are 10 years old or older.
  • Saturation rate per year: The ratio of new efficient gadgets introduced to the market each year.
The mathematical computations performed by the model can be seen in Figure 19. The code was developed using the R programming language. For the purpose of clarity, only the variables and fundamental operations are presented.
In the BUA scenario, where no technology advancements are foreseen, it is projected that no cost reductions will be realized. Based on the given conditions, there is a 95% likelihood that the annual electricity consumption of microwave ovens in standby mode will fall between the range of 418–557 GWh per annum between the years 2021 and 2028. The implementation of this scenario is illustrated in Figure 20.
The model was calibrated through the adjustment of parameters in the exponential smoothing technique by setting beta to TRUE. This indicates that the data with a trend are being modeled. The aforementioned modification led to a substantial decrease in the Sum of Squared Errors (SSE). Furthermore, the evaluation of electricity savings was conducted within the framework of the Technology Potential Scenario, focusing on devices that exhibit average efficiency. The presented scenario revealed a statistical probability of 95% for the energy savings to fall within the range of 87 to 116 GWh per annum (Figure 21).
In contrast, the previous scenario, when implemented with high-efficiency equipment, demonstrated energy savings ranging from 206 to 274 GWh annually over the identical eight-year time-frame (Figure 22).
Finally, the prototype underwent evaluation using authentic data obtained from the Mexican government, which was made available in the year 2021. The government’s report presented data pertaining to energy conservation resulting from the implementation of regulatory standards. The findings suggest that the scenario using the high-efficiency device demonstrates a stronger alignment with reality compared to the other two scenarios (Figure 23).
This observation can be explained by assuming that manufacturers may be developing devices that exhibit efficiency levels surpassing those mandated by regulatory standards. In light of this circumstance, it would be imperative to conduct a comprehensive evaluation and consider the possibility of revising the existing standards. Additional investigation could be conducted pertaining to this topic to enhance comprehension of the underlying factors and develop suitable strategies in response.

4.6. Model Evaluation

During the final phase, the model was subjected to an evaluation process, as seen in the template presented in Figure 24. The completion of all project objectives was highlighted, accompanied by arguments for the evaluation.
Figure 25 shows an analysis that revealed the strengths, weaknesses, opportunities, and threats of the model. Finally, based on the insights obtained from this study, it is advised to implement an organizational framework that facilitates the execution of processes and ensures the allocation of a dedicated budget for this task.

5. Results and Discussion

Throughout each phase of the framework, activity duration was tracked using the free version of the Process Dashboard application. Simultaneously, the Process Mining technique was employed to extract and analyze the execution of the process. As documented by the authors in [22], this technique has proven to be useful across various fields for discovering processes, validating conformance, and reducing process execution time.
The duration of activities in each phase of the framework was monitored by using the free edition of the Process Dashboard program. At the same time, process mining techniques were employed to extract and analyze the execution of the framework. The authors have provided documentation indicating that this technique has demonstrated utility in a range of disciplines, including process discovery, conformance validation, and process execution time reduction [22].
The experimental design was conducted by following the subsequent steps:
  • Define the process to be analyzed, such as the execution of the framework. Additionally, it was important to maintain a record of the actions involved in the process by using a Time Log.
  • Clearly delineate the specific inquiries that need to be addressed.
  • Develop an Event Log by utilizing the Time Log recorded within the Process Dashboard tool.
  • Analyze the Log using a Process Mining Tool, such as the Disco Application. Disco is a software application that employs event logs for the purpose of analyzing and uncovering process models [54].
  • Conduct a comprehensive analysis and thereafter provide a detailed report on the findings.
The analysis was conducted in two separate settings. Initially, the control group will be examined. This group will perform a process that is conducted without the framework. Subsequently, the experimental group will develop a process that is executed with the framework.

5.1. Control Group Results

The data pertaining to the control group, which implemented the CRISP-DM approach, were acquired from a project conducted in the year 2019 at a Decision-Making Center [17,18,19]. This study involved conducting interviews with a total of five individuals who were modelers, as well as one individual who held a manager position. The data collected included activities from four steps of the CRISP-DM methodology: data interpretation, data preparation, modeling, and assessment. Unfortunately, the data pertaining to the business understanding and implementation phases were not readily available [55]. The collected format included the start and conclusion dates of activities, the average number of h dedicated to each task on a daily basis, and the quantity of resources allocated to each activity for the purpose of constructing a model.
Consequently, the researchers found it imperative to modify the data sources of the control group to ensure comparability with the framework’s procedures. This entailed the process of comparing and aligning the activities of the original methodology, specifically the control group, with the activities of the newly suggested framework. The outcome of this process can be seen in Table 5.
The event log disclosed that the process took 151 days and 8 h to execute and consisted of 248 events. The global statistics of the process can be found in Table 6 and the process execution is visible in Figure 26.
According to the event log, the execution of the procedure spanned a duration of 151 days and 8 h, comprising a total of 248 occurrences. The global statistics pertaining to the process can be observed in Table 6. Additionally, the execution of the process is illustrated in Figure 26.
Two activities were found to have a significantly high frequency of execution: (1) the phase of building and testing the model was observed in 50.4% of the cases, and (2) the process of selecting the modeling technique occurred in 35% of the cases. The remaining tasks, including data gathering, data processing, data definition guidelines, the review process, determining future actions, and model outcomes assessment, constituted a mere 14.6% of the instances. The findings of this study bring attention to possible instances of time delays and congestion in the aforementioned activities. These findings could indicate that there might have been challenges encountered during the selection of an appropriate modeling methodology during the course of the development process.

5.2. Experimental Group Results

The experimental group that implemented the proposed framework successfully completed all phases within a time frame of 17 days and 21 h, demonstrating adherence to the prescribed steps and formats. A comprehensive set of 19 tasks was executed and meticulously documented across a series of 50 events (Table 6).
The frequencies of execution per activity are presented in Table 7. The activities that exhibit the highest frequency of iterations are the construction and evaluation of the model, which accounted 14% of the total repetitions. This is closely followed by the alignment of the model’s requirements and goals, which constituted 10% of the iterations. Lastly, the acquisition of data represented 8% of the total repetitions. Results obtained in the acquisition of data phase element can be justifiable, as the examination of a novel model often necessitates regular data collection, especially when the required information is not readily available, as was observed in this case. In contrast, the iterative nature of the model’s construction and testing process resulted in a significant number of iterations.
The visual representation in Figure 27 illustrates the iterative nature of processes. In this diagram, three distinct execution cycles are specifically identified. The first aspect pertains to the actions conducted during the Business Understanding phase. The second component encompasses tasks derived from the policy alignment phase, whereas the third component encompasses activities derived from the data definition and understanding, scenario definition and design, and model creation phases.
Activities that exhibit a significant reliance on other activities are characterized by higher weights in the arrows. The most significant correlation is observed between the activity of business requirements and restrictions and the formulation of strategies to accomplish objectives. The analysis of a particular cycle involving the activity of data definition guidelines, as well as the definition of requirements and alignment of goals within the model, is of significant interest. It is noteworthy that the model, in theory, should be influenced by prior design decisions. However, the diagram suggests that both the model and the data definition can also have an impact on the goals and requirements of the model.
Furthermore, the performance view depicted in Figure 28 reveals that the data acquisition (5.3 h), the model’s build and testing (5 h), the problem Understanding (6 h), and the model’s requirements and alignment (4.9 h) are the most time-consuming activities within the process execution. This can be attributed to the challenges in obtaining information from many sources, the designers’ limited knowledge, and the extent of the literature studied to comprehend the issue are factors contributing to this phenomenon. the diagram exhibits two clearly distinguishable bold arrows, which symbolize the temporal gaps between various activities. It is imperative to implement monitoring measures for these lines in order to prevent bottlenecks from occurring among activities throughout the execution of the process. Finally, the comprehensive duration of activities can be seen in Table 8.

5.3. Comparison with Another Methodology

This section presents a comparative analysis between the implementation of the proposed framework and the approach employed in DMC [53,55]. The authors have previously examined this methodology in previous research; however, they have not conducted a quantitative and qualitative comparison with other methodologies. This comparative analysis aims to substantiate the efficacy of this framework in facilitating the development of BUEMs that effectively assist in policy formulation for the residential sector and residential structures.

5.4. Model’s Comparison

A comparative analysis was conducted to evaluate the performance of the proposed framework in relation to the activities of the DMC approach. The duration of each activity in the process execution is presented in Table 9, and its visual depiction is illustrated in Figure 29.
Figure 29 shows the decrease in activity duration while implementing the proposed framework. Additionally, the framework demonstrated a decrease in the amplitude of outliers, indicating improved control over process execution.

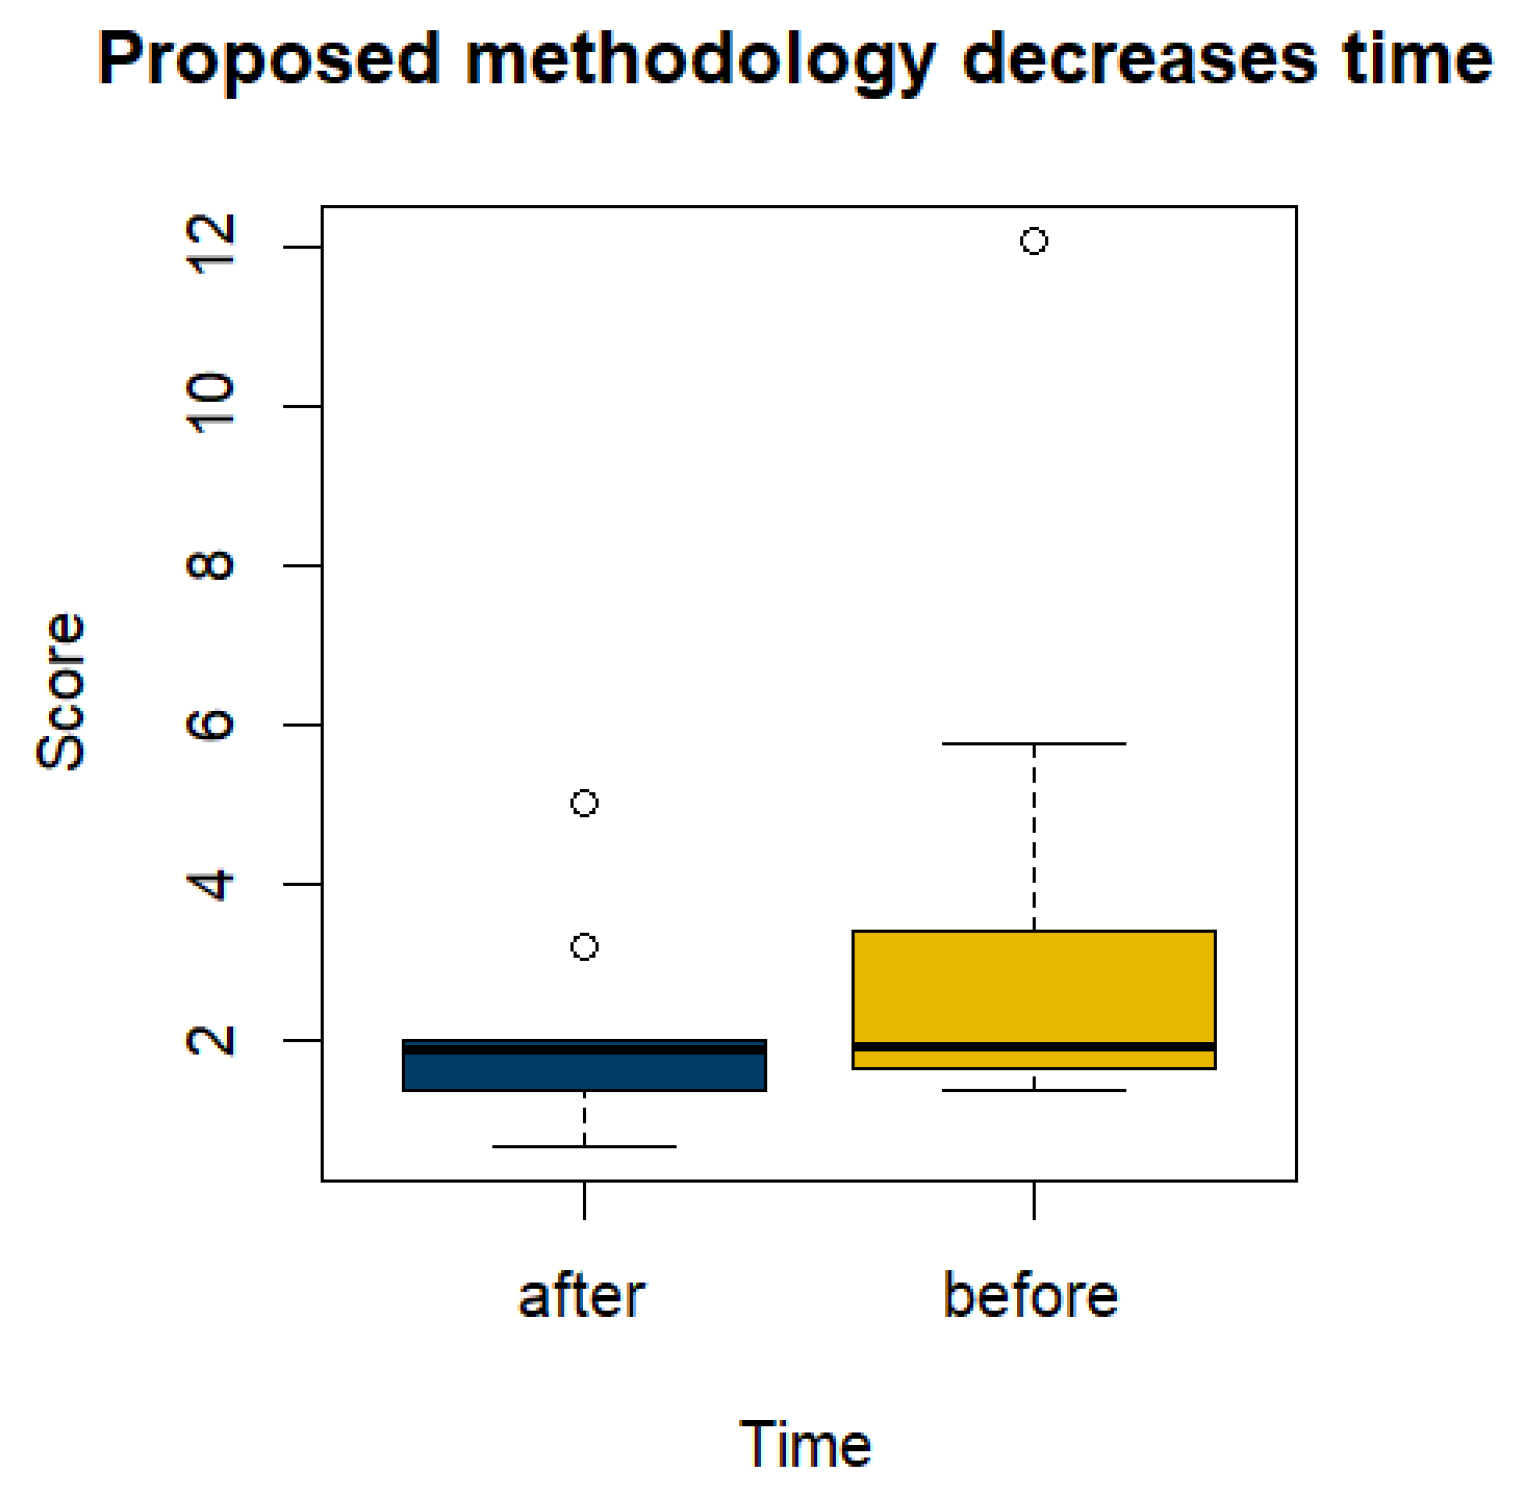
5.5. Significance Test

The following significance test was designed to illustrate the improvement in time efficiency achieved by implementing the proposed framework. A hypothesis test was run on paired data to examine whether there is a statistically significant disparity in time length resulting from the implementation of the suggested framework. The null hypothesis (H0: mwith = mwithout) and alternative hypothesis (H1: mwith < mwithout) were formulated and the test was conducted.
The obtained p-value of the statistical test was determined to be less than 0.05. This indicates substantial evidence to reject the null hypothesis. Moreover, it suggests that, on average, the utilization of the proposed framework demonstrates greater time efficiency compared to alternative techniques. The statistical analysis results can be seen in Table 10.

Discussion

Hypothesis 1.
The process of developing BUEMs can be quantified, monitored, and controlled to ensure adherence to established procedures and alignment with policy objectives.
This study employed a range of instruments to facilitate the examination of the stated hypothesis. The Process Dashboard application was utilized to assess all operations performed during the building of the model. On the other hand, the Process Mining technique was employed to authenticate the execution of the framework and assess its adherence to established standards. The capacity to quantify and oversee processes has provided several advantages:
  • Activities have the potential to be compared, examined, and modified as deemed necessary, utilizing specified metrics.
  • The aforementioned framework facilitates the establishment of policy congruence by means of the framework procedures and templates.
  • Phases have the potential to be enhanced through the utilization of comprehensive quantitative feedback.
  • The measurement of time efficiency can be conducted on a per-process or phase basis to implement specific technical or management strategies.
Hypothesis 2.
The process of developing BUEMs can be modified to guide the formulation of energy efficiency scenarios that facilitate decision-making.
The definition and design of scenarios play a crucial role in the proposed framework, as they aid in delineating the model’s scope and serve as the initial step in constructing a prototype of the model. The implementation of the new Scenario Design phase has yielded numerous benefits:
  • The processes and actions can be carried out regardless of the stakeholder’s level of expertise in the subject matter.
  • Thorough scenario definition and design phase, the framework facilitates the examination of new variables and surroundings within scenarios.
  • The modification of scenarios, as well as the techniques employed in their creation, can be tailored to accommodate the specific requirements of the organization and its stakeholders.
To conclude, it’s essential to note that although there are technical methodologies for creating models in the state of the art, none of them focus on the perspective of decision-makers. This framework aims to disrupt this dynamic by providing a tool that not only gives guidelines but also promotes communication and agreement on important decisions among stakeholders. The framework can be beneficial for energy policymakers, energy model designers, energy efficiency experts, and managers who want to create models using a mature methodology.

6. Conclusions

This present study has introduced a structured framework to enhance the efficiency of developing bottom-up energy models (BUEMs). The primary objective of this framework is to support the formulation of policies that focus on improving electricity end-use efficiency in residential structures and the residential sector. The framework presented consists of six pivotal phases: business understanding, policy alignment, data definition and understanding, scenario definition and design, model construction, and model evaluation.
The framework incorporates key principles of best practices, which include:
  • The implementation of a well-developed, evaluatable, and enhanceable methodology for developing Business-Use-Case Execution Models (BUEMs);
  • Thorough explanation of diverse objectives to be attained;
  • The application of approaches that enable the development of energy efficiency scenarios;
  • The incorporation of crucial metrics to strengthen policy formulation and the thorough documentation of the model’s development for future examination and improvements.
The present set of best practices has been derived from prior research studies that have provided valuable insights into the potentialities within the field of BUEM design [16,55].
The effectiveness of the suggested framework was thoroughly examined and confirmed by its use in constructing a customized model to support the development of electricity regulations for standby devices in the residential sector of Mexico. A comparative analysis reveals that the framework effectively reduces the time needed for model development across many dimensions by 59.43%. Furthermore, it is worth noting that the duration of processes within the experimental group was found to be very brief, spanning a total of 17 days and 21 h. In contrast, the control group exhibited a significantly longer time frame, with cases lasting an average of 151 days and 8 h.
Furthermore, this study revealed that the data acquisition, the model’s build and testing, the problem Understanding, and the model’s requirements and alignment phase are the most time-consuming activities within the process execution. This can be attributed to the challenges in obtaining information from many sources, the designers’ limited knowledge, and the extent of the literature studied to comprehend the issue are factors contributing to this phenomenon. However, obtained results show that activities were executed and meticulously documented across a series of 50 events instead of 248, showcasing the efficiency and precision of the proposed framework.
This study revealed that the activities of data collecting, model construction and testing, problem comprehension, and model requirements and alignment phase are the most time-intensive components in the execution of the process. However, the findings collected indicate that the actions were carried out in a set of 50 events, rather than 248 occurrences. This demonstrates the effectiveness and accuracy of the proposed framework.
Throughout the course of this case study, the utilization of the framework effectively facilitated:
  • The alignment of the model with company objectives, stakeholder demands, and policy goals is a crucial aspect to consider;
  • The documentation provided contains a thorough account of both the model itself and the procedure through which it was constructed;
  • Effective implementation of best practices for BUEMs that assist the policy design of electricity end-use efficiency;
  • Versatility in accommodating various model types, such as bottom-up and top-down models.
Although the framework has demonstrated its benefits, there are numerous important elements that require further research. To assure the precise evaluation of process efficiency, it is imperative to explore creative techniques for collecting event logs of process execution. The absence of robust data-gathering procedures might potentially undermine the reliability and precision of collected data. Additionally, the integration of supplementary best practices for the development of models, such as essential metrics and approaches for model evaluation, and the implementation of quality assurance procedures inside the framework, could produce advantageous outcomes. Moreover, the incorporation of an error-logging mechanism during the execution of processes could prove beneficial in the analysis and prevention of problems in subsequent iterations. Lastly, to optimize the comprehensibility and efficiency of the procedure, additional enhancements could involve the establishment of explicit execution responsibilities and the incorporation of flowchart diagrams. The utilization of swim lanes in process flow diagrams has the potential to enhance process execution efficiency by providing a clear delineation of responsibilities.

Author Contributions

Conceptualization, M.O.S.-E., J.N. and D.E.-C.; data curation, M.O.S.-E. and S.R.-L.; formal analysis, M.O.S.-E. and J.M.M.-E.; funding acquisition, J.M.M.-E.; investigation, M.O.S.-E. and J.N.; methodology, M.O.S.-E., J.N. and J.M.M.-E.; project administration, J.N.; resources, J.N. and J.M.M.-E.; software, M.O.S.-E. and S.R.-L.; supervision, S.R.-L.; validation, J.N. and D.E.-C.; visualization, J.M.M.-E.; writing—original draft, M.O.S.-E., J.N. and D.E.-C.; writing—review & editing, J.N., D.E.-C. and S.R.-L. All authors have read and agreed to the published version of the manuscript.

Funding

The following research was financed by the Energy Sustainability CONACyT-SENER Mexican Fund (Fondo Sectorial CONACyT-Secretaria de Energia-Sustentabilidad Energetica) under Grant 266632 Binational laboratory for the intelligent management of energy sustainability and technological education; by CONACyT under Grant 716985/638515; and by Tecnologico de Monterrey, Campus Ciudad de Mexico for granting the scholarship tuition.

Data Availability Statement

Not applicable.

Acknowledgments

We would like to thank the Vicerrectoría de Investigación y Posgrado, the Research Group of Advanced Artificial Intelligence, the Cyber Learning and Data Science Laboratory, the Interdisciplinary Research Group IRG Scaling complex thinking for everyone, and the Institute for the Future of Education of Tecnologico de Monterrey, Mexico.

Conflicts of Interest

The authors declare no conflict of interest. The funders had no role in the design of the study; in the collection, analyses, or interpretation of data; in the writing of the manuscript, or in the decision to publish the results.

References

  1. Levine, M.D.; Koomey, J.G.; Price, L.; Geller, H.; Nadel, S. Electricity end-use efficiency: Experience with technologies, markets, and policies throughout the world. Energy 1995, 20, 37–61. [Google Scholar] [CrossRef]
  2. International Energy Agency (IEA). World Energy Balances: Overview; IEA: Paris, France, 2020. [Google Scholar]
  3. Schwartz, L.C.; Wei, M.W.R.M., III; Deason, J.; Schiller, S.R.; Leventis, G.; Smith, S.J.; Leow, W.L.; Levin, T.; Plotkin, S.; Zhou, Y. Electricity End Uses, Energy Efficiency, and Distributed Energy Resources Baseline; Technical Report; Berkeley Lab: Berkeley, CA, USA, 2017. [Google Scholar]
  4. Taylor, P.G.; d’Ortigue, O.L.; Francoeur, M.; Trudeau, N. Final energy use in IEA countries: The role of energy efficiency. Energy Policy 2010, 38, 6463–6474. [Google Scholar] [CrossRef]
  5. Doukas, H.; Patlitzianas, K.; Kagiannas, A.; Psarras, J. Energy Policy Making: An Old Concept or a Modern Challenge? Energy Sources Part Econ. Plan. Policy 2008, 3, 362–371. [Google Scholar] [CrossRef]
  6. Kohl, W.L. National Security and Energy. In Encyclopedia of Energy; Cleveland, C.J., Ed.; Elsevier: New York, NY, USA, 2004; pp. 193–206. [Google Scholar] [CrossRef]
  7. Chapman, A.; Mclellan, B.; Tezuka, T. Strengthening the Energy Policy Making Process and Sustainability Outcomes in the OECD through Policy Design. Adm. Sci. 2016, 6, 9. [Google Scholar] [CrossRef]
  8. International Energy Agency (IEA). Energy Efficiency Indicators 2020; IEA: Paris, France, 2020. [Google Scholar]
  9. Zahran, S. The software process-what it is, and how to improve it. WIT Trans. Inf. Commun. Technol. 1970, 8, 17. [Google Scholar]
  10. Mundaca, L.; Neij, L.; Worrell, E.; McNeil, M. Evaluating Energy Efficiency Policies with Energy-Economy Models. Annu. Rev. Environ. Resour. 2010, 35, 305–344. [Google Scholar] [CrossRef]
  11. Abbasabadi, N.; Ashayeri, M.; Azari, R.; Stephens, B.; Heidarinejad, M. An integrated data-driven framework for urban energy use modeling (UEUM). Appl. Energy 2019, 253, 113550. [Google Scholar] [CrossRef]
  12. Fleiter, T.; Rehfeldt, M.; Herbst, A.; Elsland, R.; Klingler, A.L.; Manz, P.; Eidelloth, S. A methodology for bottom-up modelling of energy transitions in the industry sector: The FORECAST model. Energy Strategy Rev. 2018, 22, 237–254. [Google Scholar] [CrossRef]
  13. Schwabeneder, D.; Corinaldesi, C.; Lettner, G.; Auer, H. Business cases of aggregated flexibilities in multiple electricity markets in a European market design. Energy Convers. Manag. 2021, 230, 113783. [Google Scholar] [CrossRef]
  14. Kapitonov, I.A.; Patapas, A. Principles regulation of electricity tariffs for the integrated generation of traditional and alternative energy sources. Renew. Sustain. Energy Rev. 2021, 146, 111183. [Google Scholar] [CrossRef]
  15. Ren, Z.; Grozev, G.; Higgins, A. Modelling impact of PV battery systems on energy consumption and bill savings of Australian houses under alternative tariff structures. Renew. Energy 2016, 89, 317–330. [Google Scholar] [CrossRef]
  16. Sanchez-Escobar, M.O.; Noguez, J.; Molina-Espinosa, J.M.; Lozano-Espinosa, R.; Vargas-Solar, G. The Contribution of Bottom-Up Energy Models to Support Policy Design of Electricity End-Use Efficiency for Residential Buildings and the Residential Sector: A Systematic Review. Energies 2021, 14, 6466. [Google Scholar] [CrossRef]
  17. Ruiz-Loza, S.; Molina Espinosa, J.; Balderas, D. Decision-making laboratory for socio-technological systems. Int. J. Interact. Des. Manuf. 2020, 14, 1557–1568. [Google Scholar] [CrossRef]
  18. Flores Benitez, A.; Molina Espinosa, J.M.; Alvarez Madrigal, M. Una Propuesta Metodológica para el Proceso de Toma de Decisiones aplicada en Centros de Soporte a la Toma de Decisiones. In Aplicaciones de la Computación; Barron Estrada, M.L., Camarena Ibarrola, J.A., Figueroa Mora, K.M., Soto Mendoza, V., Eds.; Universidad Autónoma de Coahuila: Saltillo, Mexico, 2020; Chapter 11; pp. 93–101. [Google Scholar]
  19. Jonassen, D.H. Designing for decision making. Educ. Technol. Res. Dev. 2012, 60, 341–359. [Google Scholar] [CrossRef]
  20. Wang, X.; Feng, W.; Cai, W.; Ren, H.; Ding, C.; Zhou, N. Do residential building energy efficiency standards reduce energy consumption in China? A data-driven method to validate the actual performance of building energy efficiency standards. Energy Policy 2019, 131, 82–98. [Google Scholar] [CrossRef]
  21. Chapman, P. CRISP-DM 1.0: Step-by-Step Data Mining Guide; SPSS: Chicago, IL, USA, 2000. [Google Scholar]
  22. Escobar, M.O.S.; Espinosa, R.L.; Espinosa, J.M.M.; Noguez Monroy, J.J.; Solar, G.V. Applying Process Mining to Support Management of Predictive Analytics/Data Mining Projects in a Decision Making Center. In Proceedings of the 2019 6th International Conference on Systems and Informatics (ICSAI), Shanghai, China, 2–4 November 2019; pp. 1527–1533. [Google Scholar] [CrossRef]
  23. Mahmoud, M.; Liu, Y.; Hartmann, H.; Stewart, S.; Wagener, T.; Semmens, D.; Stewart, R.; Gupta, H.; Dominguez, D.; Dominguez, F.; et al. A formal framework for scenario development in support of environmental decision-making. Environ. Model. Softw. 2009, 24, 798–808. [Google Scholar] [CrossRef]
  24. Cao, K.K.; Cebulla, F.; Gomez Vilchez, J.; Mousavi, B.; Prehofer, S. Raising awareness in model-based energy scenario studies-a transparency checklist. Energy Sustain. Soc. 2016, 6, 1–20. [Google Scholar] [CrossRef]
  25. van Beeck, N.M.J.P. Classification of Energy Models; FEW Research Memorandum; Operations Research: Tilburg, The Netherlands, 1999; Volume 777. [Google Scholar]
  26. Abbasabadi, N.; Mehdi Ashayeri, J. Urban energy use modeling methods and tools: A review and an outlook. Build. Environ. 2019, 161, 106270. [Google Scholar] [CrossRef]
  27. Swan, L.G.; Ugursal, V.I. Modeling of end-use energy consumption in the residential sector: A review of modeling techniques. Renew. Sustain. Energy Rev. 2009, 13, 1819–1835. [Google Scholar] [CrossRef]
  28. Prina, M.G.; Manzolini, G.; Moser, D.; Nastasi, B.; Sparber, W. Classification and challenges of bottom-up energy system models—A review. Renew. Sustain. Energy Rev. 2020, 129, 109917. [Google Scholar] [CrossRef]
  29. Beheshti, Z.; Shamsuddin, S.M.H. A review of population-based meta-heuristic algorithms. Int. J. Adv. Soft. Comput. Appl. 2013, 5, 1–35. [Google Scholar]
  30. Kannan, R.; Turton, H.; Panos, E. Methodological Significance of Temporal Granularity in Energy-Economic Models—Insights from the MARKAL/TIMES Framework. In Informing Energy and Climate Policies Using Energy Systems Models: Insights from Scenario Analysis Increasing the Evidence Base; Springer International Publishing: Cham, Switzerland, 2015; pp. 185–200. [Google Scholar] [CrossRef]
  31. Jridi, O.; Aguir Bargaoui, S.; Nouri, F.Z. Household preferences for energy saving measures: Approach of discrete choice models. Energy Build. 2015, 103, 38–47. [Google Scholar] [CrossRef]
  32. Hara, K.; Uwasu, M.; Kishita, Y.; Takeda, H. Determinant factors of residential consumption and perception of energy conservation: Time-series analysis by large-scale questionnaire in Suita, Japan. Energy Policy 2015, 87, 240–249. [Google Scholar] [CrossRef]
  33. Radpour, S.; Hossain Mondal, M.A.; Kumar, A. Market penetration modeling of high energy efficiency appliances in the residential sector. Energy 2017, 134, 951–961. [Google Scholar] [CrossRef]
  34. Kleebrang, W.; Bunditsakulchai, P.; Wangjiraniran, W. Household electricity demand forecast and energy savings potential for Vientiane, Lao PDR. Int. J. Sustain. Energy 2017, 36, 344–367. [Google Scholar] [CrossRef]
  35. Heidari, M.; Majcen, D.; van der Lans, N.; Floret, I.; Patel, M.K. Analysis of the energy efficiency potential of household lighting in Switzerland using a stock model. Energy Build. 2018, 158, 536–548. [Google Scholar] [CrossRef]
  36. Aghamohamadi, M.; Amjady, N. Modelling and optimisation for costly efficiency improvements on residential appliances considering consumers income level. IET Gener. Transm. Distrib. 2017, 11, 3992–4001. [Google Scholar] [CrossRef]
  37. Pradhan, B.B.; Limmeechokchai, B.; Shrestha, R.M. Implications of biogas and electric cooking technologies in residential sector in Nepal—A long term perspective using AIM/Enduse model. Renew. Energy 2019, 143, 377–389. [Google Scholar] [CrossRef]
  38. Mohseni, A.; Mortazavi, S.S.; Ghasemi, A.; Nahavandi, A.; Talaei abdi, M. The application of household appliances’ flexibility by set of sequential uninterruptible energy phases model in the day-ahead planning of a residential microgrid. Energy 2017, 139, 315–328. [Google Scholar] [CrossRef]
  39. Meangbua, O.; Dhakal, S.; Kuwornu, J.K. Factors influencing energy requirements and CO2 emissions of households in Thailand: A panel data analysis. Energy Policy 2019, 129, 521–531. [Google Scholar] [CrossRef]
  40. Liang, H.; Ma, J.; Sun, R.; Du, Y. A Data-Driven Approach for Targeting Residential Customers for Energy Efficiency Programs. IEEE Trans. Smart Grid 2020, 11, 1229–1238. [Google Scholar] [CrossRef]
  41. Jafary, M.; Shephard, L. Modeling the Determinants of Residential Appliance Electricity Use Single-Family Homes, Homes with Electric Vehicles and Apartments. In Proceedings of the 2018 IEEE Green Technologies Conference (GreenTech), Austin, TX, USA, 4–6 April 2018; pp. 119–126. [Google Scholar] [CrossRef]
  42. Lundgren, B.; Schultzberg, M. Application of the economic theory of self-control to model energy conservation behavioral change in households. Energy 2019, 183, 536–546. [Google Scholar] [CrossRef]
  43. Wen, L.; Cao, Y. A hybrid intelligent predicting model for exploring household CO2 emissions mitigation strategies derived from butterfly optimization algorithm. Sci. Total. Environ. 2020, 727, 138572. [Google Scholar] [CrossRef] [PubMed]
  44. Wen, L.; Cao, Y. Influencing factors analysis and forecasting of residential energy-related CO2 emissions utilizing optimized support vector machine. J. Clean. Prod. 2020, 250, 119492. [Google Scholar] [CrossRef]
  45. Marshall, E.; Steinberger, J.K.; Dupont, V.; Foxon, T.J. Combining energy efficiency measure approaches and occupancy patterns in building modelling in the UK residential context. Energy Build. 2016, 111, 98–108. [Google Scholar] [CrossRef]
  46. Krarti, M.; Aldubyan, M.; Williams, E. Residential building stock model for evaluating energy retrofit programs in Saudi Arabia. Energy 2020, 195, 116980. [Google Scholar] [CrossRef]
  47. Schütz, T.; Schiffer, L.; Harb, H.; Fuchs, M.; Müller, D. Optimal design of energy conversion units and envelopes for residential building retrofits using a comprehensive MILP model. Appl. Energy 2017, 185, 1–15. [Google Scholar] [CrossRef]
  48. Davila, C.C.; Jones, N.; Al-Mumin, A.; Hajiah, A.; Reinhart, C. Implementation of a Calibrated Urban Building Energy Model (UBEM) for the Evaluation of Energy Efficiency Scenarios in a Kuwaiti Residential Neighborhood. In Proceedings of the Building Simulation 2017: 15th Conference of IBPSA, San Francisco, CA, USA, 7–9 August 2017; Volume 15, pp. 745–754. [Google Scholar] [CrossRef]
  49. Braulio-Gonzalo, M.; Juan, P.; Bovea, M.D.; Ruá, M.J. Modelling energy efficiency performance of residential building stocks based on Bayesian statistical inference. Environ. Model. Softw. 2016, 83, 198–211. [Google Scholar] [CrossRef]
  50. Comisión Nacional para el Uso Eficiente de la Energía | Gobierno | gob.mx. Available online: https://www.gob.mx/conuee (accessed on 31 August 2023).
  51. NU. CEPAL. Informe Nacional de Monitoreo de la Eficiencia Energética de México; Technical Report; Economic Commission for Latin America and the Caribbean: Santiago de Chile, Chile, 2018. [Google Scholar]
  52. de Monterrey, T. Reporte del Modelo de Consumo Eléctrico (Proyecto 266632 “Laboratorio Binacional para la Gestión Inteligente de la Sustentabilidad Energética Y la Formación Tecnológica”); Unpublished Confidential Document; Technical Report; Tecnológico de Monterrey: Monterrey, Mexico, 2018. [Google Scholar]
  53. Molina, A.; Mendoza, A.; Lozano, F.J.; Serra-Barragán, L.; Ibarra-Yunez, A. Historical Context and Present Energy Use in the Global Economy. In Energy Issues and Transition to a Low Carbon Economy: Insights from Mexico; Springer International Publishing: Cham, Switzerland, 2022; pp. 1–29. [Google Scholar] [CrossRef]
  54. Drakoulogkonas, P.; Apostolou, D. A Comparative Analysis Methodology for Process Mining Software Tools. In Proceedings of the Knowledge Science, Engineering and Management, Tokyo, Japan, 14–16 August 2019; pp. 751–762. [Google Scholar]
  55. Sanchez-Escobar, M.O.; Noguez, J.; Molina-Espinosa, J.M.; Lozano-Espinosa, R. Supporting the Management of Predictive Analytics Projects in a Decision-Making Center using Process Mining. Adv. Sci. Technol. Eng. Syst. J. 2021, 6, 1084–1090. [Google Scholar] [CrossRef]
Figure 1. Proposed framework.
Energies 16 06765 g001
Figure 2. Processes included in the framework.
Energies 16 06765 g002
Figure 3. Case study: Problem Understanding Phase.
Energies 16 06765 g003
Figure 4. Case study: Goal Definition.
Energies 16 06765 g004
Figure 5. Case study: Business Requirements.
Energies 16 06765 g005
Figure 6. Case study: Strategies to Achieve Objectives.
Energies 16 06765 g006
Figure 7. Case study: Plan to Achieve Objectives.
Energies 16 06765 g007
Figure 8. Case study: Policy Level, Aims, and Means.
Energies 16 06765 g008
Figure 9. Case study: Instruments to Implement.
Energies 16 06765 g009
Figure 10. Case study: Model’s Requirements.
Energies 16 06765 g010
Figure 11. Case study: Data Definition Guidelines.
Energies 16 06765 g011
Figure 12. Case study: Scenario Definition (1).
Energies 16 06765 g012
Figure 13. Case study: Scenario Definition (2).
Energies 16 06765 g013
Figure 14. Case study: Scenario Definition (2) (cont.).
Energies 16 06765 g014
Figure 15. Case study: Scenario Design.
Energies 16 06765 g015
Figure 16. Case study: Rejected Design Technique.
Energies 16 06765 g016
Figure 17. Case study: Accepted Design Technique.
Energies 16 06765 g017
Figure 18. Case study: Model’s Build.
Energies 16 06765 g018
Figure 19. Case study: Model’s Calculation Code.
Energies 16 06765 g019
Figure 20. Case study: No Policy Scenario—Template.
Energies 16 06765 g020
Figure 21. Case study: Normal Saving Scenario.
Energies 16 06765 g021
Figure 22. Case study: Best Saving Scenario.
Energies 16 06765 g022
Figure 23. Case study: Prototype Testing. The highlight values represent that electricity savings range between 192 and 206 GWh and the real metric represents 200.5 GWh. Therefore the forecast accuracy is 95%.
Energies 16 06765 g023
Figure 24. Case study: Model’s Results Assessment.
Energies 16 06765 g024
Figure 25. Case study: Process Review and Next Steps.
Energies 16 06765 g025
Figure 26. Execution map: control group processes.
Energies 16 06765 g026
Figure 27. Execution map: framework processes.
Energies 16 06765 g027
Figure 28. Performance map: framework processes.
Energies 16 06765 g028
Figure 29. Comparison of activities’ duration across the analyzed frameworks.
Energies 16 06765 g029
Table 1. Methods of data acquisition and potential data sources for energy modeling.
Type of DataType of ApproachSub-ApproachPossible Data Sources
Non-Geometric data,
such as occupancy
and appliance habits,
as well as HVAC (Heating,
Ventilation, and Air
Conditioning) systems
PatternsDeterministicSimulation tool templates, standardized codes and guides, as well as open project data.
ProbabilisticStandardized codes and guidelines, as well as the accessibility of open project data.
Non-PatternsOccupancy patternsStochastic models, Extraction techniques of big data, spatial-temporal approaches, and urban factors methods.
Appliance patternsStochastic models, integrated occupancy and environment methodologies, and machine learning techniques.
HVAC SystemsTechniques of machine learning.
Geometric data,
such as building
footprints, building
heights, windows-to-wall
ratios, amount of stories,
and topography data
Direct 3D modeling Existing databases, LiDAR, Oblique photogrammetry
Specific ApproachesBuildings footprintsExisting databases, OpenStreetMap, and methods of image recognition.
Building heightsExisting databases, OpenStreetMap, nDSM, and shadow management.
Windows-to-wall ratiosStandards and codes, recommendations from experts, and methods of image recognition.
Amount of storiesExisting databases and processes of estimation.
TerrainCityGML and DTM.
Meteorological information,
such as outdoor temperature,
solar radiation, humidity, wind
velocity, and wind direction.
The three types of weather data commonly used in meteorological studies are the typical meteorological year (TMY), real weather data, and future weather data.
Table 2. Taxonomy pertaining to bottom-up energy models (BUEMs).
CategorySubcategoryModel Focus
Sector Coverage [25]Single-SectorFocuses on a single sector.
Multi-SectorConsiders interactions between sectors.
Geographical Coverage [25]GlobalCovers the current state of the global economy.
RegionalCovers global geographical areas.
NationalCovers all industries and sectors within a nation.
LocalSeveral geographical areas inside a nation.
ProjectFocuses on a particular energy initiative.
Time Horizon [25]ShortModels that are younger than five years.
MediumModels that range from five to fifteen years.
Long-TermModels that are older than sixteen years.
Methodology [25]EconomicRepresents economic and technical implications associated with alternative economic strategies.
OptimizationOptimizes decision-making regarding investments in the energy sector.
SimulationReplicates system operation in a reduced manner.
SpreadsheetUtilizes versatile instruments to create personalized energy models.
Back-castingEnvisions future scenarios and identifies prevailing trends that need to be disrupted to attain the desired future state.
Multi-criteriaIncorporates further factors into the model, extending beyond the sole consideration of economic efficiency.
OtherOther methodologies.
End-use Energy Modeling
Technique [26,27]
EngineeringCalculates energy consumption based on thermodynamics and heat transfer of all end-uses.
Data-driven statisticalCorrelates end-use features with its energy use using statistical techniques.
Data-driven AI-basedCorrelates end-use features with its energy use using artificial intelligence techniques.
Programming Technique [28]Linear Programming (LP)Discovers arrangement of activities to minimize or maximize a defined criterion.
Mixed Integer LPExtends to LP programming which includes detailed formulation of technical properties and relations in modeling of energy systems.
DynamicDiscovers optimal growth path through division of an original problem and optimization of sub-problems.
HeuristicManages high dimension optimization problems [29].
OtherOther types of programming techniques.
Data Time Split [30]Hourly/MinuteHourly/minute data resolution.
DailyDaily data resolution.
MonthlyMonthly data resolution.
YearlyYearly data resolution.
Metrics and Tools [25]MetricsUses CO 2 emissions and cost as outputs in the model.
ToolsUtilizes scenarios to show model’s results.
Residential Electricity
end-uses [8]
A, SH, SC, L, WH, CIdentifies detailed electricity consumption, energy use, and energy savings by end-use.
[Note:] Electricity end-uses: AL = Appliances and Lighting, SC = Space Cooling, SH = Space Heating, WH = Water Heating, A = Appliances, L = Lighting, C = Cooking.
Table 3. Techniques and methodologies employed in bottom-up energy models (BUEMs) that contribute to the creation of energy efficiency policies in the residential sector.
Modeling TechniqueMethodologyProgramming TechniqueTechniques UsedCitations
Data-driven statisticalEconomicOtherDiscrete choice models and time-series analytic techniques.[31]
Discrete choice models.[32]
Econometric diffusion modeling, specifically focusing on market share functions.[33]
End-use models, linear regression models, and scenario analyses.[34]
Material flow analysis, weibull distribution, techno-economic analysis.[35]
OptimizationOtherProbability density functions, least square approach, and Pearson distribution.[36]
Linear ProgrammingLinear optimization.[37]
Mixed LPSeries of sequential uninterruptible energy stages, Mixed Integer Linear Programming (MILP) framework.[38]
OtherOtherPanel data regression techniques.[39]
Sliding window linear regression models and kernel density estimation techniques.[40]
Data-driven statistical
and data-driven AI-based
(Hybrid)
OtherOtherCluster analysis, regression analysis, two-level time series analysis, mediation model analysis, and principal component analysis.[41,42]
HeuristicBivariate correlation analysis, butterfly optimization algorithm, least square support vector machine, grey relational analysis, chicken swarm optimization, support vector machine.[43,44]
Table 4. Techniques and methodologies used in bottom-up energy models that support energy efficiency policy design—residential buildings.
Modeling TechniqueMethodologyProgramming TechniqueTechniques UsedCitations
Data-driven statisticalOtherOtherPropensity score matching method[20]
EngineeringSimulationOtherTransient thermodynamics equations, mathematical equations[45,46]
OptimizationMixed LPDynamic Building Model, MILP[47]
Engineering—Data-driven
statistical (Hybrid)
SimulationOtherOccupant uncertainty modeling, Bayesian inference, INLA (Integrated Nested Laplace Approximation)[48,49]
Table 5. Comparison of activities across the analyzed frameworks.
Activities (Proposed Framework)Activities (Control Group)
Data acquisitionCollect Initial data, Explore Data, Select data
Data definition guidelinesDescribe Data
Data processingVerify Data Quality, Clean Data, Construct Data, Integrate Data, Format Data
Create, update the portfolio of design techniquesNot Applicable
Model’s build and testingGenerate Test Design, Build Model
Modeling techniques selectionSelect Modeling Technique
Determine next stepsDetermine next steps
Model’s results assessmentAssess Model
Review processReview Process
Scenario definitionBuild Model
Scenario designBuild Model
Table 6. Global statistics pertaining to control and experimental group processes.
Control Group ProcessFramework Group Process
MetricValueValue
Events24850
Activities819
Median case duration151 days and 8 h17 days and 21 h
Start15 January 2019 9:0017 October 2022 19:21
End15 June 2022 19:004 November 2022 15:32
Table 7. Frequencies of execution per activity, when considering the framework.
ActivityRelative Frequency
Model’s build and testing14%
Model’s requirements and goal alignment10%
Data acquisition8%
Scenario definition6%
Problem Understanding6%
Business requirements and constraints6%
Strategies to achieve objectives6%
Instruments to implement6%
Data definition guidelines6%
Create, update portfolio of design techniques6%
Goal definition4%
Policy level, aims, and means4%
Model’s results assessment4%
Review process4%
Plan to achieve objectives2%
Data processing2%
Scenario design2%
Modeling technique selection2%
Determine next steps2%
Table 8. Duration of execution per activity in the control group.
ActivityTotal Duration (h)
Problem Understanding6.0
Data acquisition5.3
Model’s build and testing5
Model’s requirements and goal alignment4.9
Instruments to implement2.9
Scenario definition2.7
Scenario design2
Model’s results assessment1.96
Business requirements and constraints1.83
Data definition guidelines1.83
Review process1.58
Create, update portfolio of design techniques1.45
Modeling technique selection1.4
Policy level, aims, and means1.23
Goal definition1.15
Plan to achieve objectives1.08
Data processing1
Strategies to achieve objectives0.98
Determine next steps0.7
Table 9. Duration of activities.
ActivityTotal Duration (h)—(Before Proposed Framework) 7% ProportionTotal Duration (h)—with Proposed Framework (h)
Data acquisition1.83.2
Data definition guidelines3.41.83
Data processing1.91
Model’s build and testing125
Modeling techniques selection21.4
Determine next steps1.40.7
Model’s results assessment1.681.96
Review process1.41.58
Scenario definition5.82
Scenario design3.42
Table 10. Hypothesis test on the paired samples of reported timings, comparing the use of the proposed framework with and without its implementation.
PhaseAvg. Time without FrameworkAvg. Time with FrameworkDifference in Times (h)Hypotheses Test of Paired
Samples (p-Value)
All the phases in the framework34.7820.6714.110.0488
Disclaimer/Publisher’s Note: The statements, opinions and data contained in all publications are solely those of the individual author(s) and contributor(s) and not of MDPI and/or the editor(s). MDPI and/or the editor(s) disclaim responsibility for any injury to people or property resulting from any ideas, methods, instructions or products referred to in the content.

