Abstract
To enhance the separation efficiency of downhole oil–water hydrocyclones in co-produced wells, an axial center-piercing hydrocyclone structure is proposed. A mathematical relationship model between the structural parameters and separation efficiency of the axial center-piercing hydrocyclone is constructed based on the response surface methodology. The numerical simulation method is employed to analyze both the unoptimized and optimized hydrocyclone structures, and their separation performances are simulated under identical operational conditions. The results indicate that the optimal structural parameter values are as follows: main diameter D = 70.4 mm, large cone angle α1 = 32.4°, small cone angle α2 = 3.9°, bottom flow tube length L3 = 311.7 mm, and inverted cone length L4 = 166.0 mm. The optimal operation parameters of the optimized structure are also obtained. Under the same operating parameter conditions, the separation efficiency of the optimized structure is consistently higher than that of the unoptimized structure. The highest efficiency achieved by the optimized structure is 98.6%, which is a 2% improvement over the unoptimized state. Finally, experiments are conducted with the optimized hydrocyclone separator structure under different split ratios. This study significantly contributes to the field of injection and production in a single well, particularly in promoting the application of hydrocyclones.
1. Introduction
The rise in water content within oil fields has given rise to a spectrum of associated challenges [1]. These include environmental issues stemming from the use of chemical agents for wastewater treatment, as well as economic challenges related to oil field development. As researchers focus their attention on addressing the challenges posed by high water content in oil fields, a pivotal advancement has emerged in the form of single-well injection and production technology [2]. This technology can enable the dual-purpose utilization of a single well, thereby enhancing the efficiency of individual wells. Additionally, it offers a means to significantly curtail ineffective water circulation, consequently reducing the need for extensive surface pipeline infrastructure and yielding substantial production cost savings. Undoubtedly, this technology assumes a vital role in realizing energy conservation strategies and facilitating the provision of oil-based energy. The hydrocyclone, renowned for its simplicity in operation, compact equipment design, and cost effectiveness [3,4,5], plays a pivotal role in the implementation of single-well injection technology. Hence, researchers have extensively investigated hydrocyclones, delving into various aspects such as novel structural design [6,7], heightened separation efficacy [8], internal flow-field attributes [9,10], and expanding application domains [11]. Xing et al. [12] and Zhao et al. [13,14] innovatively employed a double-stage tandem connection for cyclones in downhole working conditions. This approach was combined with the optimization of structural parameters to improve the separation efficiency. Wang et al. [15] conducted numerical simulations of the internal flow field within the downhole liquid–liquid hydrocyclone around its axis. Their findings revealed that the alterations in tangential velocity are not symmetrical in cases of forward and reverse rotation. Consequently, they concluded that a mutually constraining relationship exists among tangential velocity, axial velocity, and radial velocity during rotational conditions. Bai et al. proposed a new type of axial hydrocyclone [16], and its indoor prototype experiments revealed an optimal shunt ratio of 0.45 and an optimal treatment capacity of 1.50 m3/h. Comparative analysis with the traditional tangential hydrocyclone demonstrated the superior separation performance of this device. Ding et al. [17] devised six variations of oil–water separation cyclones for offshore downhole oil–water separation equipment. By assessing the factors of cost and separation efficiency, they initially identified the optimal model. Through laboratory experiments and simulations, they further established the best structural parameters of the model. As a result, the highest achievable separation efficiency reached 97.23%. Gao et al. [18] investigated the oil–water separation process in the downhole working conditions of a pumping unit. They conducted a comparative study on the pressure drop of the oil–water separator, and analyzed its behavior under both pulsating and stable inlet flows. The results indicated that the pressure drop under pulsating flow (1.893 MPa) was higher than that under stable flow (0.142 MPa). Xu et al. [19] devised a novel spiral separator and employed a combination of numerical simulation and particle image velocimetry (PIV) testing to scrutinize its internal flow-field and pressure characteristics. Their results revealed the formation of a stable spiral flow field at the outlet section, and the pressure loss remained within 90 Kpa under the design conditions. Considering the significant challenges involved in downhole working conditions, such as the presence of gas in produced fluids, sand content in produced liquids [20], and the escalating societal demand for oil resources, there has been a notable focus on enhancing the crude oil recovery of downhole hydrocyclones. The separation efficiency of a hydrocyclone is influenced by its structural parameters, operational parameters, and physical properties of the separation medium [21,22,23]. Scholars frequently employ the single-factor method [24], as well as the response surface method, to optimize the structural parameters of hydrocyclones. Xing et al. [25] optimized the structure of a downhole cyclone and a micro-cyclone by the response surface method and carried out comparative experiments on the optimized structures and the initial structures. The experimental results showed that the quality and efficiency of the optimized structures were higher than those of the initial structures under the same parameters. Liu et al. [26] introduced a novel hydrocyclone structure and optimized its structural parameters, including the overflow tube, blade parameters, and cone angle, using the single-factor method. Subsequently, they further refined the optimized hydrocyclone structure through the application of the response surface method. The oil–water hydrocyclone separator finds extensive application in simultaneous well injection and production technology due to its straightforward operation, compact equipment, and cost-effective maintenance. However, within real downhole conditions, a double electric pump is employed, which often necessitates passage through a central shaft in the hydrocyclone. The structural aspects of the hydrocyclone under these conditions have seldom been investigated.
In this paper, we introduce a novel design for an axial center-piercing hydrocyclone and employ the response surface method to optimize its performance. By establishing a mathematical model that correlates structural parameters with separation efficiency, we identify the optimal configuration that ensures highly efficient separation. Simultaneously, utilizing computational fluid dynamics, we investigate the flow-field distribution characteristics and oil–water separation efficiency of the hydrocyclone with the optimal structural parameters under various operating conditions. This analysis aims to tailor the hydrocyclone for effective downhole application in central-shaft-piercing scenarios. Consequently, our study offers crucial support and assurance for the successful implementation of hydrocyclones in downhole applications.
2. Structure and Working Principle
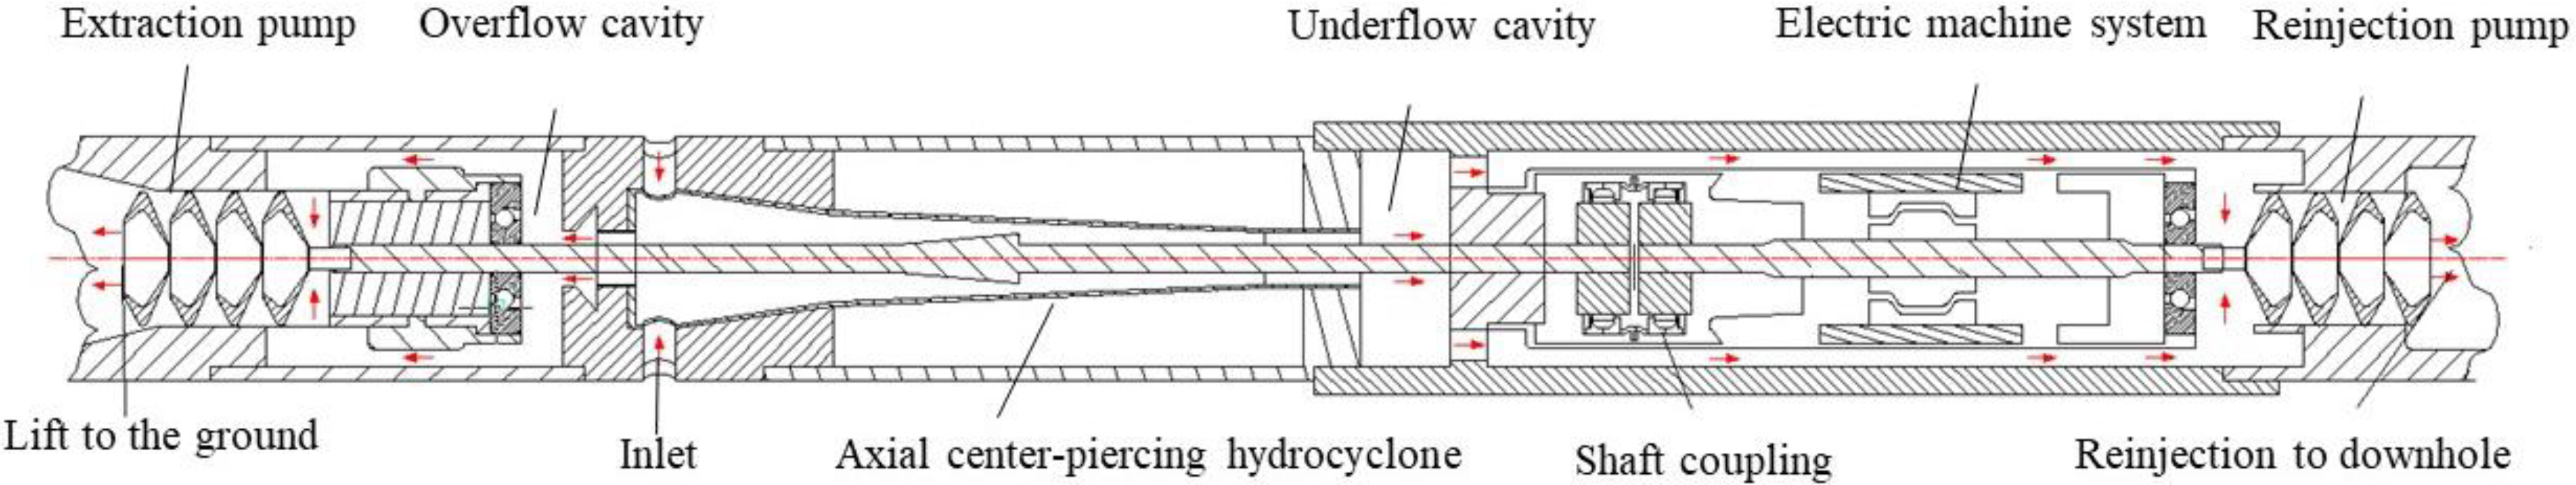
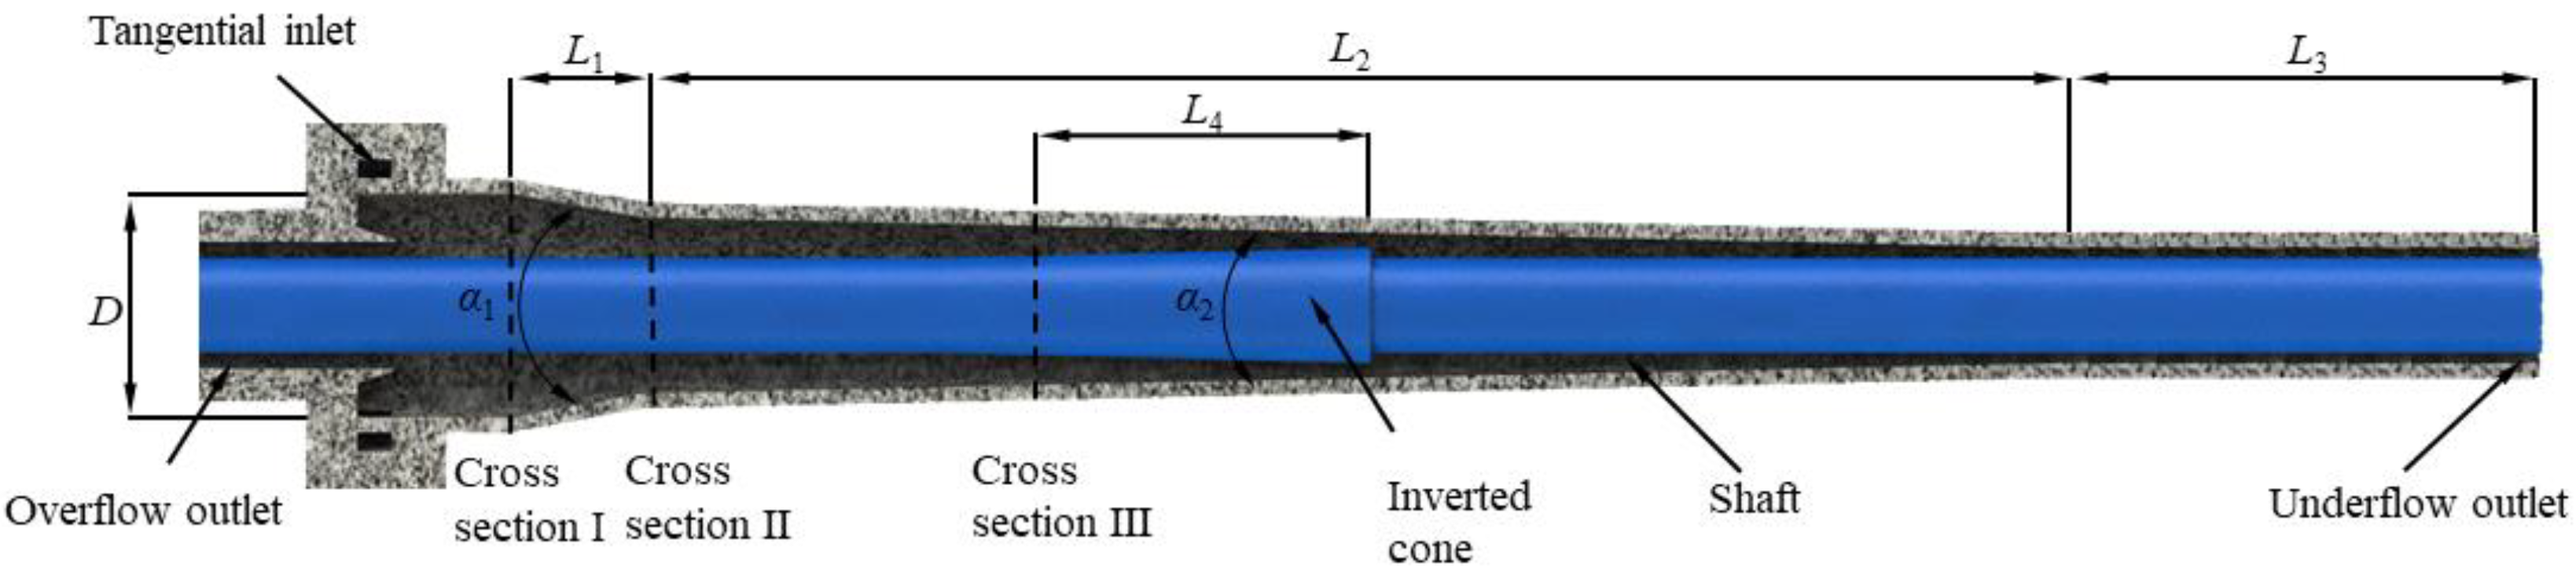
Figure 1 illustrates the utilization of an axial center-piercing hydrocyclone in single-well injection and production technology. This single-well injection and production system includes several key components, namely the electric potential centrifugal production pump, central shaft, axial center-piercing hydrocyclone, and motor (responsible for powering both the production pump and the reinjection pump). The operational principle of the process system can be outlined as follows. The fluid produced is introduced into the hydrocyclone from the inlet, and it undergoes interaction with the high-speed rotating flow field within the hydrocyclone. As a result, the fraction of the produced liquid with a substantial oil content is propelled upward to the surface within the overflow cavity, facilitated by the production pump. Conversely, the portion with a lower oil content travels through the bottom flow chamber and is subsequently reinjected into the water layer through the dedicated reinjection pump. Consequently, the process encompasses the entirety of an injection–production procedure, involving the separation of an oil–water two-phase liquid, the elevation of the oil phase, and the subsequent reinjection of the water phase. The operational mechanism for oil–water separation within the hydrocyclone is delineated as follows. The incoming produced liquid enters the hydrocyclone by a tangential inlet. Here, the lighter oil phase amalgamates to create an oil core at the periphery of the central shaft due to the influence of centrifugal force. Under the initial structure is shown in Figure 2, the specific parameters are shown in Table 1. The main diameter D = 78 mm, the large cone length L1 = 80 mm, the small cone length L2 = 535 mm, the bottom flow tube length L3 = 300 mm, the inverted cone length L4 = 166 mm, the large cone angle α1 = 40°, and α2 = 3°.
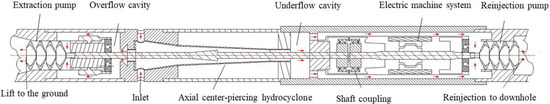
Figure 1.
Application diagram of an axial center-piercing hydrocyclone in single-well injection and production technology.
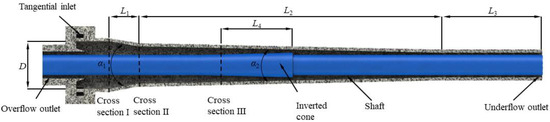
Figure 2.
Schematic diagram of an axial center-piercing hydrocyclone structure.

Table 1.
Main structural parameters of the fluid domain of an axial center-piercing hydrocyclone.
3. Research Methods
3.1. Mathematical Model Method
ANSYS-Fluent 2021R1 software was utilized to conduct numerical simulations and analyses to discern the flow-field characteristics and separation efficiency of the axial center-piercing hydrocyclone. To tackle the intricate flow patterns within the high-speed rotating environment of the axial center-piercing hydrocyclone, the Reynolds stress model (RSM) was employed. This model was chosen for its precise accuracy and its capability to mitigate computational intensity. Moreover, the RSM effectively accounts for fluid swirl and near-wall influences, enabling a more comprehensive representation of fluid turbulent behaviors.
In the process of numerical simulation, the continuity equations of water and oil are as follows:
For incompressible flows, the time-averaged Navier-Stokes equation was employed as per the literature [27].
In the above formula, xi and xj are coordinate components, and are time-averaged velocity components, is the time-averaged pressure in Pa, μ is the hydrodynamic viscosity in (Pa·s)/m2, ρ is the fluid density in kg/m3, and is the Reynolds stress component. The transport equation in the Reynolds stress model is:
In the above formula, Dij is the diffusion term, Pij is the stress generation term, Φij is the stress strain term, and εij is the viscous dissipation term.
In the formula, μt is the turbulent viscosity, C1 and C2 are constants with C1 = 1.8 and C2 = 1.8, k is the turbulent kinetic energy, ε is the dissipation rate, δij is the Kronecker-delta function, Pkk = 2p, and σk is the Prandtl number.
Boundary Conditions and Efficiency
Figure 3 shows the fluid domain and meshing of the hydrocyclone. The multiphase flow mixed model (mixture model) was employed to simulate the interaction between oil and water. In this approach, the inlet for the mixed-phase liquid was designated as a velocity inlet (velocity-int), while the overflow outlet and the bottom outlet were configured as free outlets (out-flow). The density of the oil phase was defined as 880 kg/m³, while the dynamic viscosity of the oil phase was set at 112.2 mPa·s. Additionally, the diameter of the oil droplets was established as 0.35 mm. In this context, the oil phase was designated as the discrete phase. On the other hand, the density of the water phase was established as 998 kg/m³, and the dynamic viscosity of the water phase was set at 1.003 mPa·s. Consequently, the water phase was regarded as the continuous phase. The turbulence calculation was performed utilizing the RSM. For the coupling of velocity and pressure, the SIMPLEC algorithm, known for its robust computational stability and excellent convergence, was employed. Non-slip boundary conditions were assigned to the walls. For discretization, the momentum, turbulent kinetic energy, and turbulent dissipation rate were subjected to a second-order upwind scheme. The set convergence accuracy was 10−6. Impermeable and non-slip boundary conditions were assigned to the walls. The operational parameter range of the simulation was from 40 m³/d to 150 m³/d. The diversion ratio was defined within a range of 15% to 60%, and the moisture content was considered within a range of 92% to 99%.

Figure 3.
Fluid domain and grid division of hydrocyclone.
The oil–water separation efficiency serves as the key parameter in assessing the simulation outcomes of the axial center-piercing hydrocyclone. The separation performance of the hydrocyclone is evaluated based on the mass efficiency. The calculation formula [28] is given as follows:
In the above formula, EZ is the mass efficiency of the hydrocyclone, F is the overflow shunt ratio, φd is the oil concentration at the bottom outlet in mg/L, and φi is the inlet oil concentration in mg/L.
3.2. Optimal Design of Response Surface
3.2.1. Basic Principles of Response Surface
Response surface analysis directly shows the influence of variables on the target value, and also reflects the interaction between variables. Through a reasonable and limited experimental design method, the response surface method constructs the approximate function expression between the objective function and variables, and fits the global approximation instead of the real response surface model. The original implicit objective function is explicit. On this basis, a set of optimal solutions is obtained, which can simplify the analysis process, solve the optimization problem, and improve the optimization efficiency. The basic relationship between the response dependent variable Y and the design independent variable x is as follows:
In the above formula, represents the approximate expression of the unknown mathematical model, x stands for the design independent variable, and δ denotes the error value. The quadratic polynomial expression [29] derived from the fundamental relationship is presented as follows:
In the above formula, y(x) depends on the target value, β0 and βj are polynomial coefficients, xj is the j experimental scalar, βii represents the second order effect of factor xj, βij represents the interaction effect of factor xi and xj, and n is the number of experimental variables. ε represents the response observation error. The parameters of the mathematical model are determined by the least-squares method, and then the response surface analysis is carried out.
3.2.2. Response Surface Optimization Design
The BBD (Box–Behnken design) test of the response surface method was employed to establish the testing scheme for evaluating the influence of structural parameters on the efficiency of the axial center-piercing hydrocyclone. The levels and corresponding coding values for each factor are provided in Table 2. Utilizing the BBD experimental design approach, the five targeted structural parameters were treated as independent variables. The number of factors was defined as 5, and the optimal values obtained from the single-factor method served as the central values for these five factors. Given the absence of interfering factors, such as variations in the experimental environment during the simulation process, the Block factor was set to 1. Additionally, the central test was repeated six times, while the number of dependent variables remained 1.
Table 2.
Horizontal design of CCD (central composite design) test factors.
By considering the distinct levels of structural parameters as presented in Table 2, a total of 46 BBD experimental design groups were configured. For each experimental group, a fluid domain model of the hydrocyclone was established, adhering to the specific structural parameters assigned to that group. The model was then uniformly meshed to facilitate numerical simulation analysis. Subsequently, the efficiency (Ez) of each test group was computed. The outcomes of the response surface test design and the results obtained from numerical simulations are summarized in Table 3.
Table 3.
BBD design and test results.
The quadratic polyphase fitting of the data shown in Table 3 was carried out by using the second-order model. The regression equation between the optimized structure parameter x and the separation efficiency EZ of the axial center-piercing hydrocyclone was obtained by multivariate linear regression analysis, as shown in Equation (13).
4. Results and Discussion
4.1. Model Optimization Result
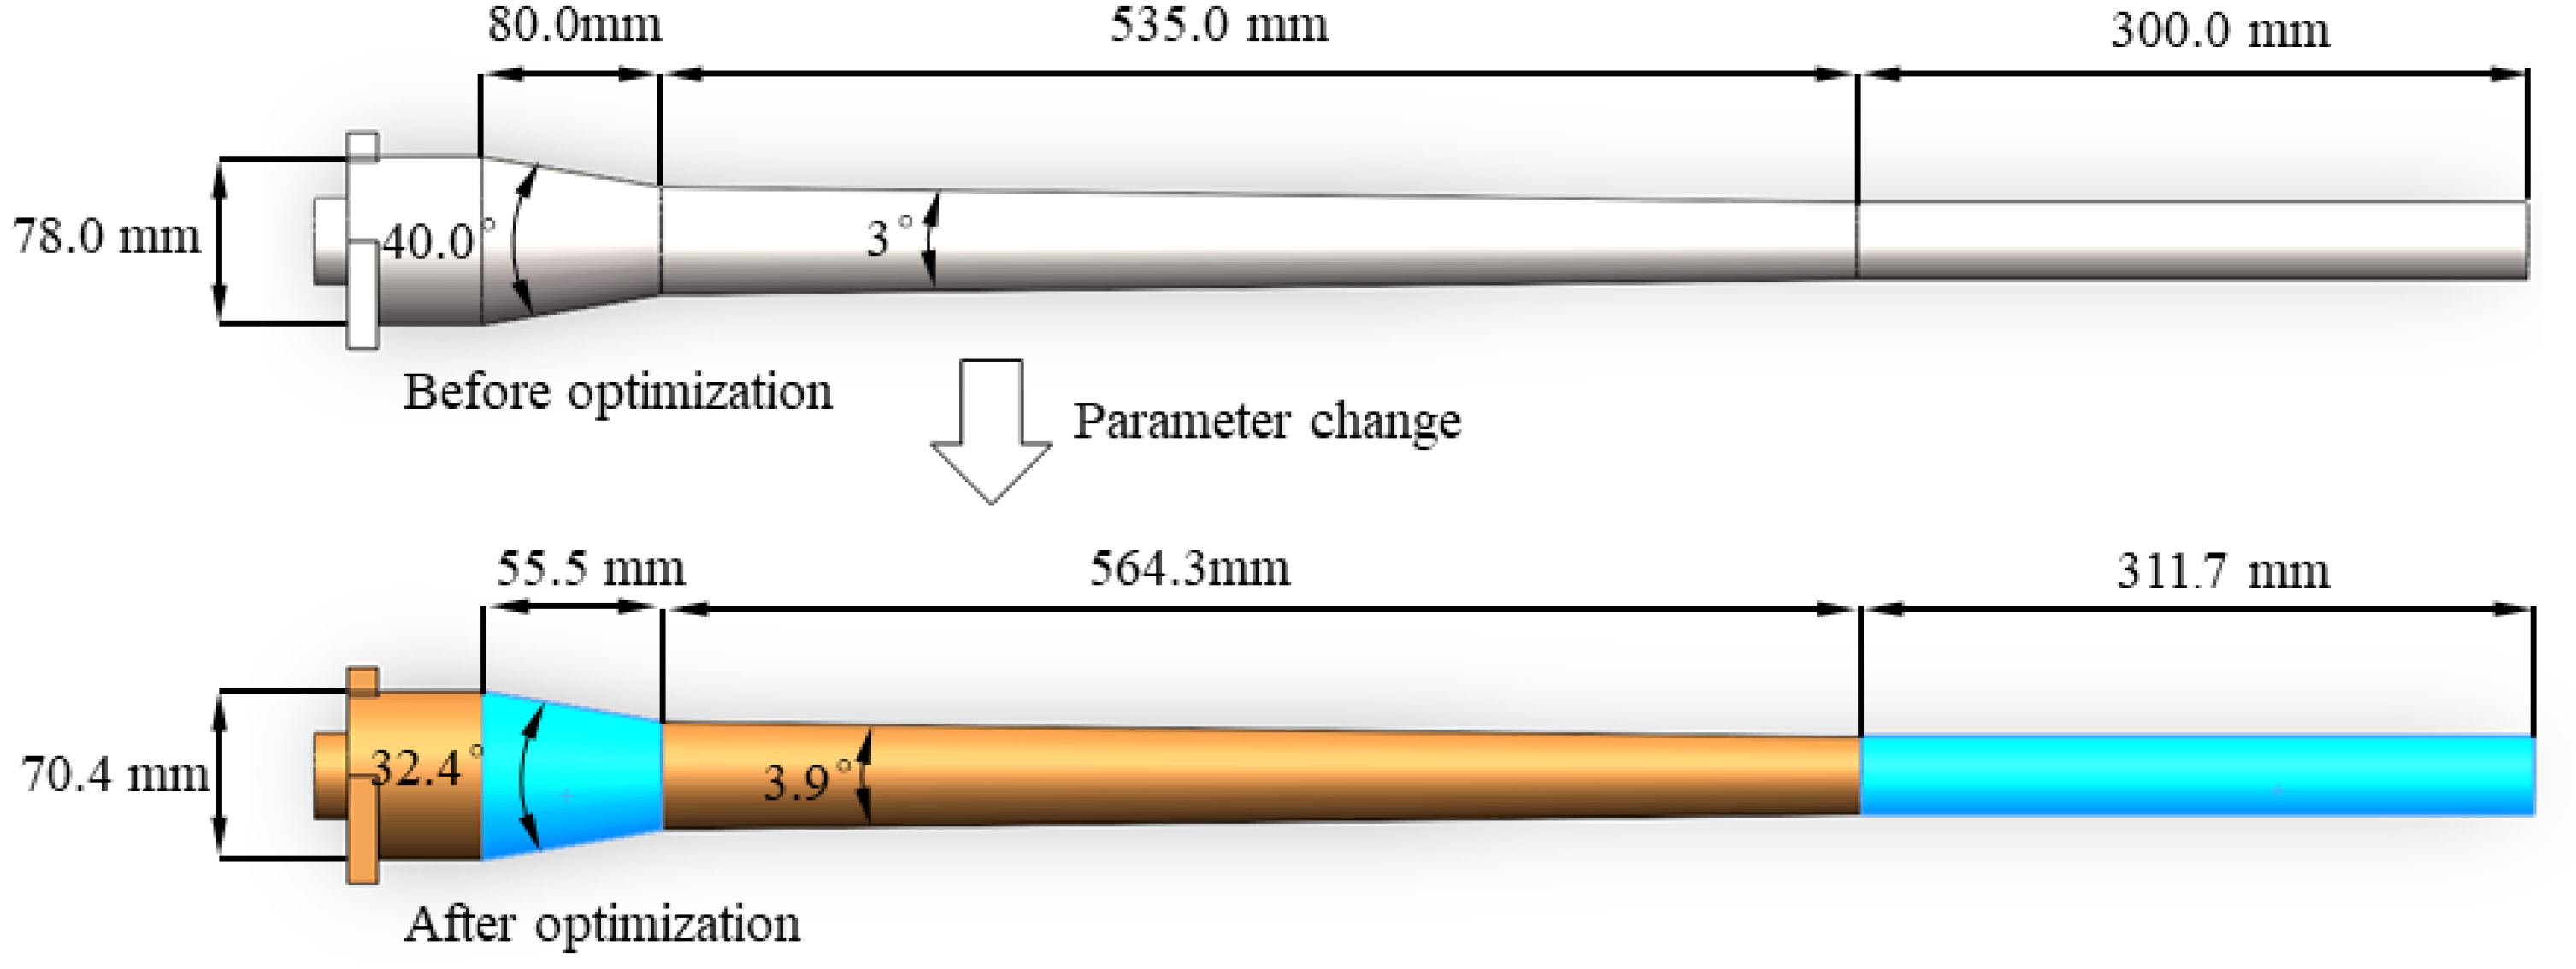
To evaluate the accuracy of the regression equation, the least-squares method was employed to derive the mathematical relationship between the structural parameter (x) and the separation efficiency (EZ). The structural parameter configuration leading to the maximum separation efficiency was determined as the optimization outcome of the response surface design. Upon optimization, it was found that the inverted cone length was 166.0 mm, the large cone angle was 32.4°, the small cone angle was 3.9°, the underflow tube length was 311.7 mm, and the main diameter was 70.4 mm. The comparative representation of the structural parameters of the axial center-piercing hydrocyclone before and after optimization is shown in Figure 4.
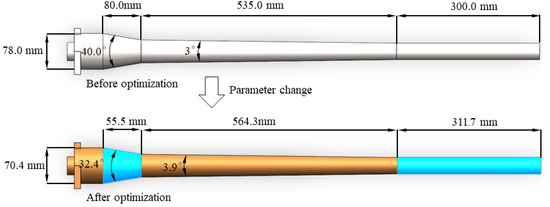
Figure 4.
Changes in structural parameters of an axial center-piercing hydrocyclone before and after optimization.
4.2. Analysis of Variance
The variance analysis method was employed to test the significance of the mathematical model involving the five structural parameters and separation efficiency constructed by the response surface method. The results of the variance analysis are presented in Table 4. It can be seen that the regression equation illustrating the relationship between the structural parameters and separation efficiency (EZ) has a significance level of P < 0.0001 < 0.05. This implies that the functional relationship portrayed by the regression equation is statistically significant. Within the range of the upper and lower limit parameters specified in Table 4, the regression equation, shown in Equation (7), can be utilized to predict the inverted cone length, large cone angle, small cone angle, bottom flow tube length, main diameter, and separation efficiency of the axial center-piercing hydrocyclone under different multi-structural parameter conditions.
Table 4.
Analysis of variance results of the regression equation.
To verify the predictive accuracy of the regression equation, an error statistical analysis of Equation (10) was conducted. The error statistical analysis results are presented in Table 5. The closer the correlation coefficient R-squared (coefficient of determination) is to 1, the stronger the correlation. Higher and more closely aligned values of Adj-Squared (Adjusted R-squared) and Pred-Squared (Prediction Variance Explained) indicate that the regression model effectively captures the relationship between input and output variables. A coefficient of variation (C.V.) < 10% signifies higher accuracy and credibility of the test results. Adeq Precision represents the ratio of effective signal to noise, and a value exceeding 4 indicates that the model is reasonable. The statistical analysis results confirmed that the regression models adhered to the aforementioned testing principles, implying robust applicability for both models.
Table 5.
Statistical analysis of regression model errors.
4.3. Comparison of Structural Shunt Performance before and after Optimization
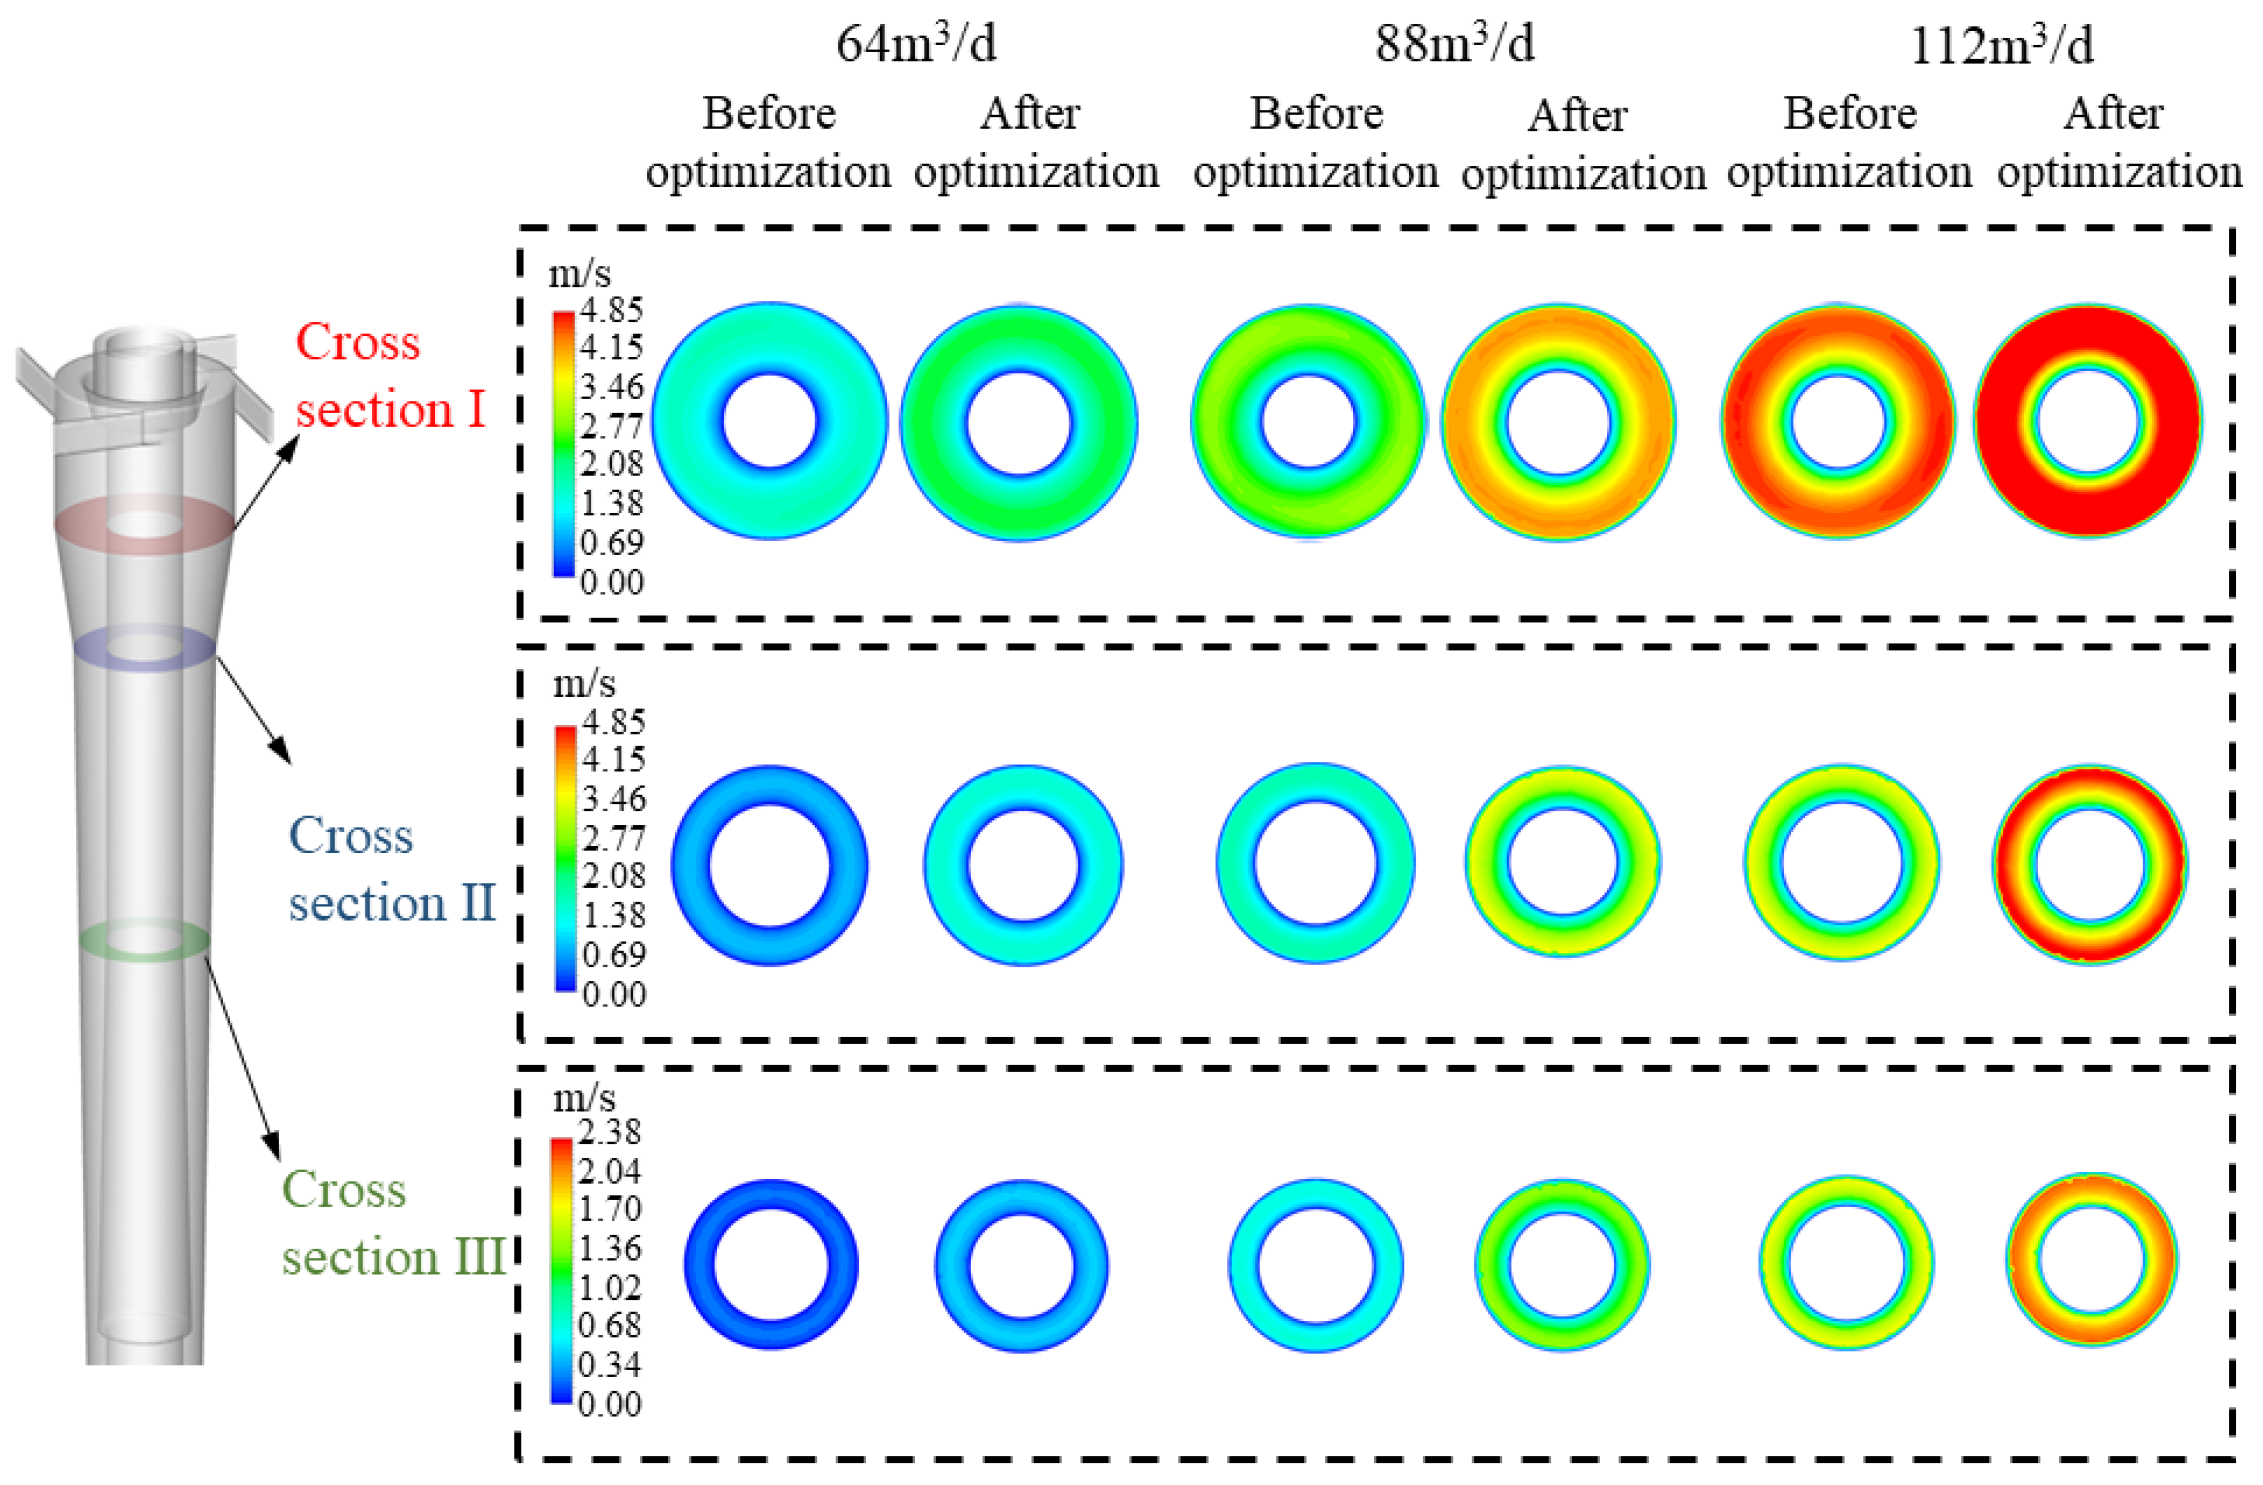
To analyze the variations in the internal tangential velocity of the axial center-piercing hydrocyclone with treatment capacity before and after optimization, the treatment volumes of the mixture were set at 64 m3/d, 88 m3/d, and 112 m3/d, respectively. Subsequently, the tangential velocities were measured at three distinct sections, as depicted in Figure 5. These sections include section I at the entrance of the large cone segment, section II at the interface between the large cone and small cone sections, and section III at the entrance of the inverted cone. The tangential velocity distribution within the hydrocyclone is illustrated in Figure 5. Maintaining consistent operating conditions, the tangential velocity was highest at section I, followed by section II, and then section III with the lowest velocity. With the increase in processing capacity, the tangential velocities at sections I, II, and III exhibited a gradual increase both before and after optimization. Under identical operational parameters, the tangential velocities at sections I, II, and III of the optimized hydrocyclone were greater than those of the axial center-piercing hydrocyclone at the same respective positions before optimization.

Figure 5.
Tangential velocity cloud images of different sections before and after optimization under different processing capacities.
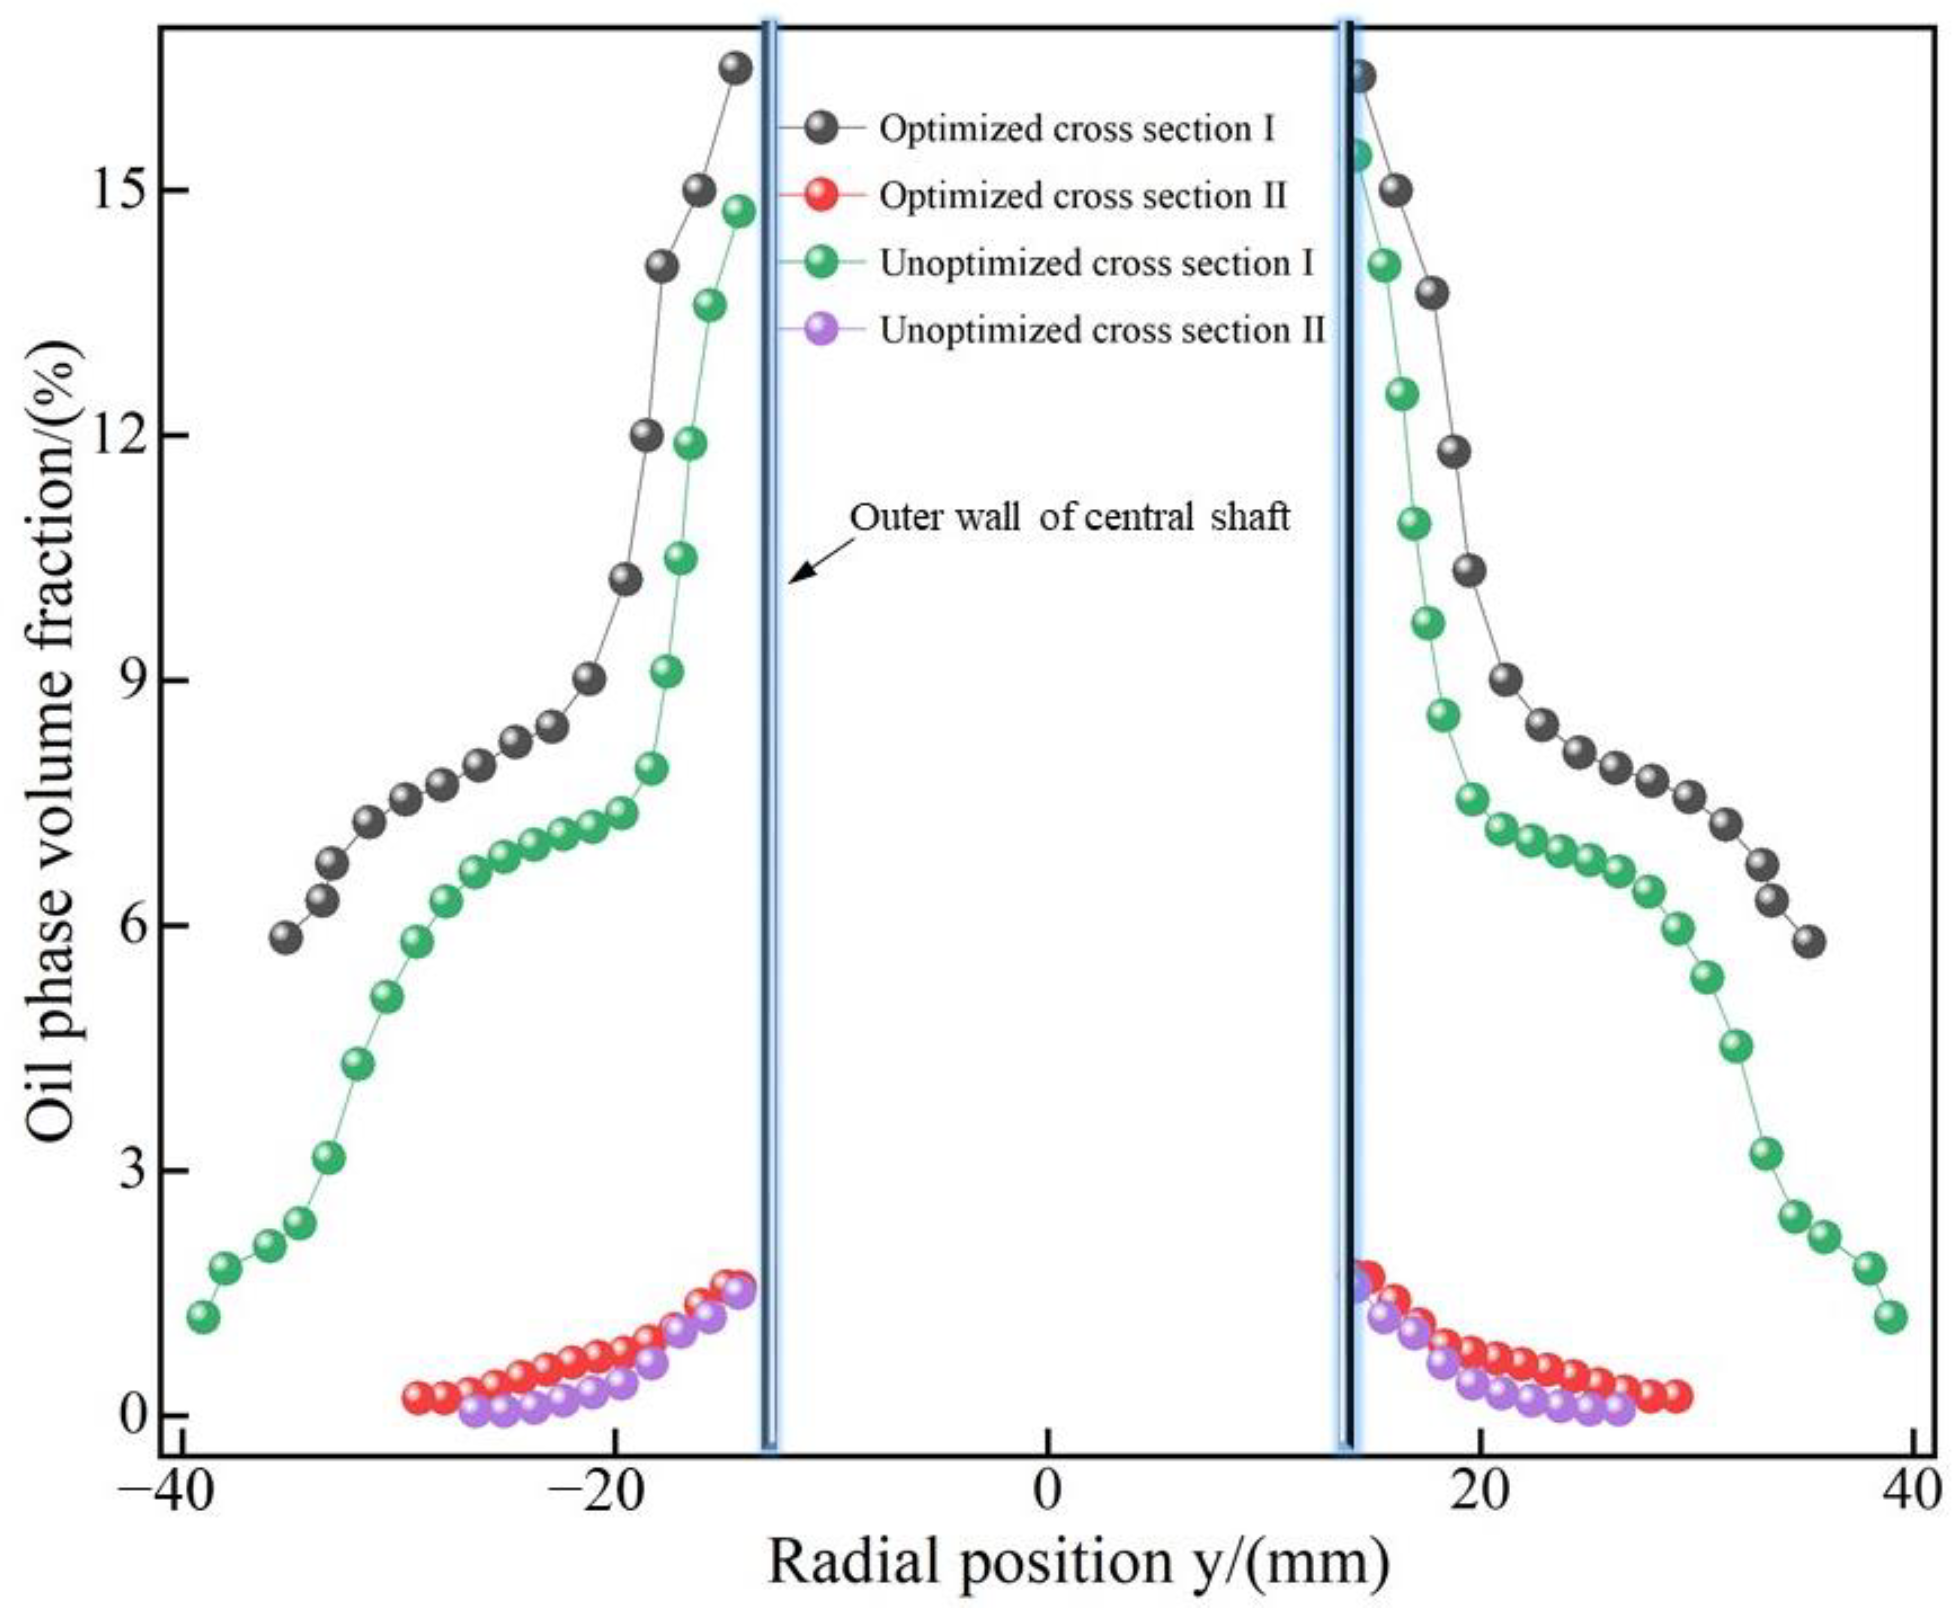
Figure 6 presents a comparison of the oil-phase volume fraction within the hydrocyclone at sections I and II, as depicted in Figure 4, under the same operational parameters. Figure 6 reveals that the oil-phase volume fraction at sections I and II post-optimization was notably superior to that prior to optimization. This outcome can be attributed to the higher tangential velocities at sections I and II following optimization. The tangential velocity governs the centrifugal force within the flow field of the hydrocyclone. Within a specific range, higher tangential velocities are conducive to enrichment of the oil phase. It is evident that the optimized response surface structure can increase the oil-phase volume fraction within the separation chamber by augmenting the tangential velocity within the swirl field. This in turn enhances the separation efficiency of the mixed liquid, demonstrating the superior separation performance of the optimized hydrocyclone structure. This outcome verified the efficacy of the response surface optimization method in enhancing the separation performance of the axial center-piercing hydrocyclone.
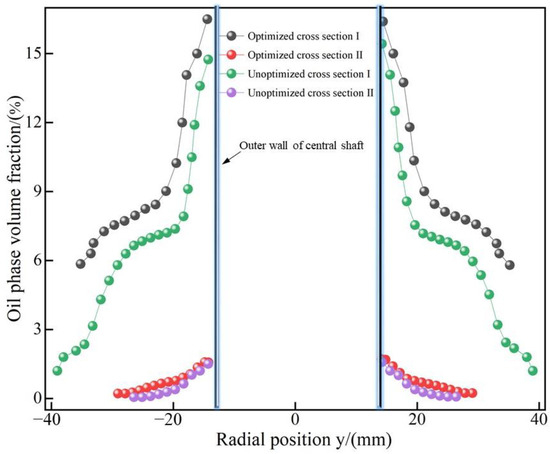
Figure 6.
Comparison of oil-phase volume fractions at cross sections of the hydrocyclone before and after optimization.
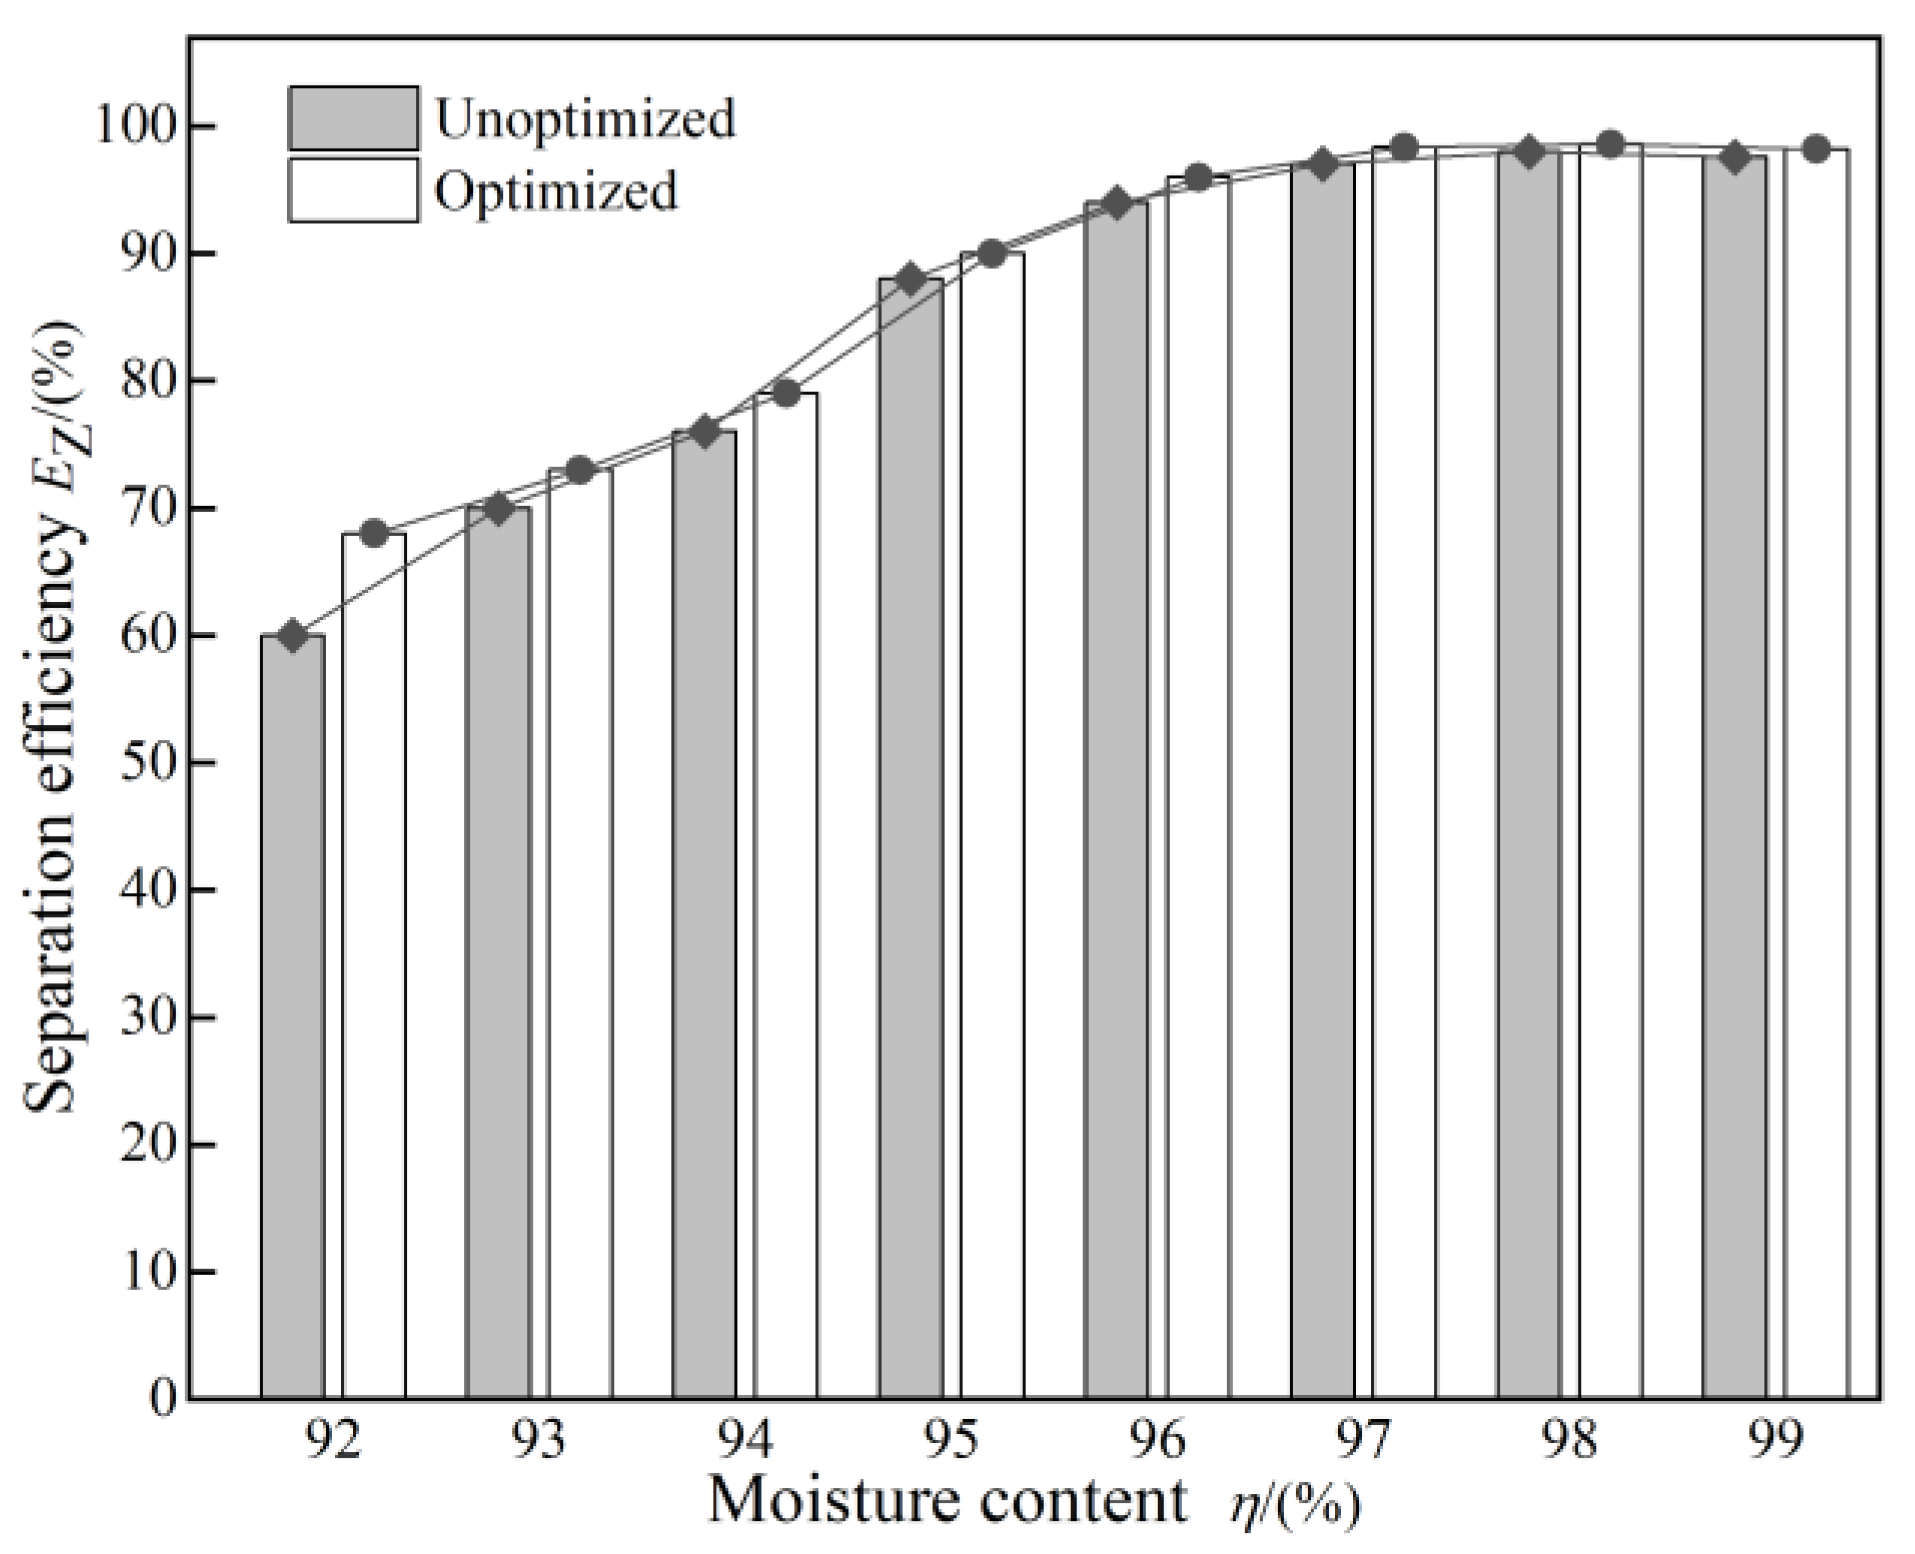
To further validate the impact of the optimized hydrocyclone on separation efficiency, numerical simulations were conducted for various water contents using both the optimized and unoptimized models. The water content of the inlet mixture varied between 92% and 99%, with a treatment capacity of 150 m3/d and a diversion ratio of 30%. The same numerical simulation methodology and boundary conditions as described above were employed for this analysis. Through a comparison of separation efficiency and oil concentration for the unoptimized and optimized hydrocyclone models with different water content conditions, the separation efficiency curve depicted in Figure 7 was obtained. As the water content in the inlet mixture increased, the separation efficiency of the cross-axis cyclone showed a gradual improvement. As the moisture content of the inlet mixture varied from 92% to 99%, the separation efficiency of the unoptimized structure rose from 88.2% to 96.3%, while the separation efficiency of the optimized structure increased from 94.7% to 97.2%. Under identical conditions, the optimized structure consistently exhibited higher separation efficiency compared to the unoptimized structure. The peak separation performance of 97.2% was achieved when the moisture content reached 98%. This indicated that the hydrocyclone structure optimized through the response surface approach exhibited superior separation performance under varying water content conditions.
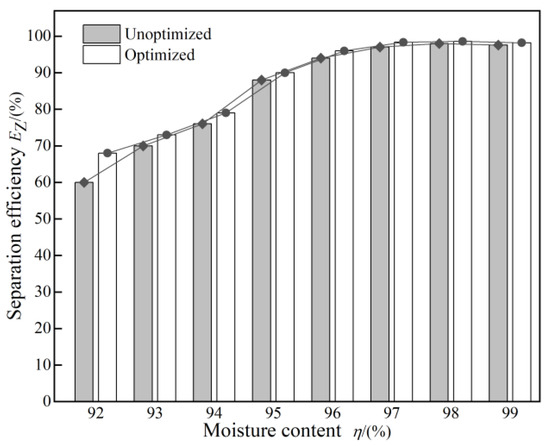
Figure 7.
Comparison of the separation performance of the hydrocyclone before and after optimization under different water content conditions.
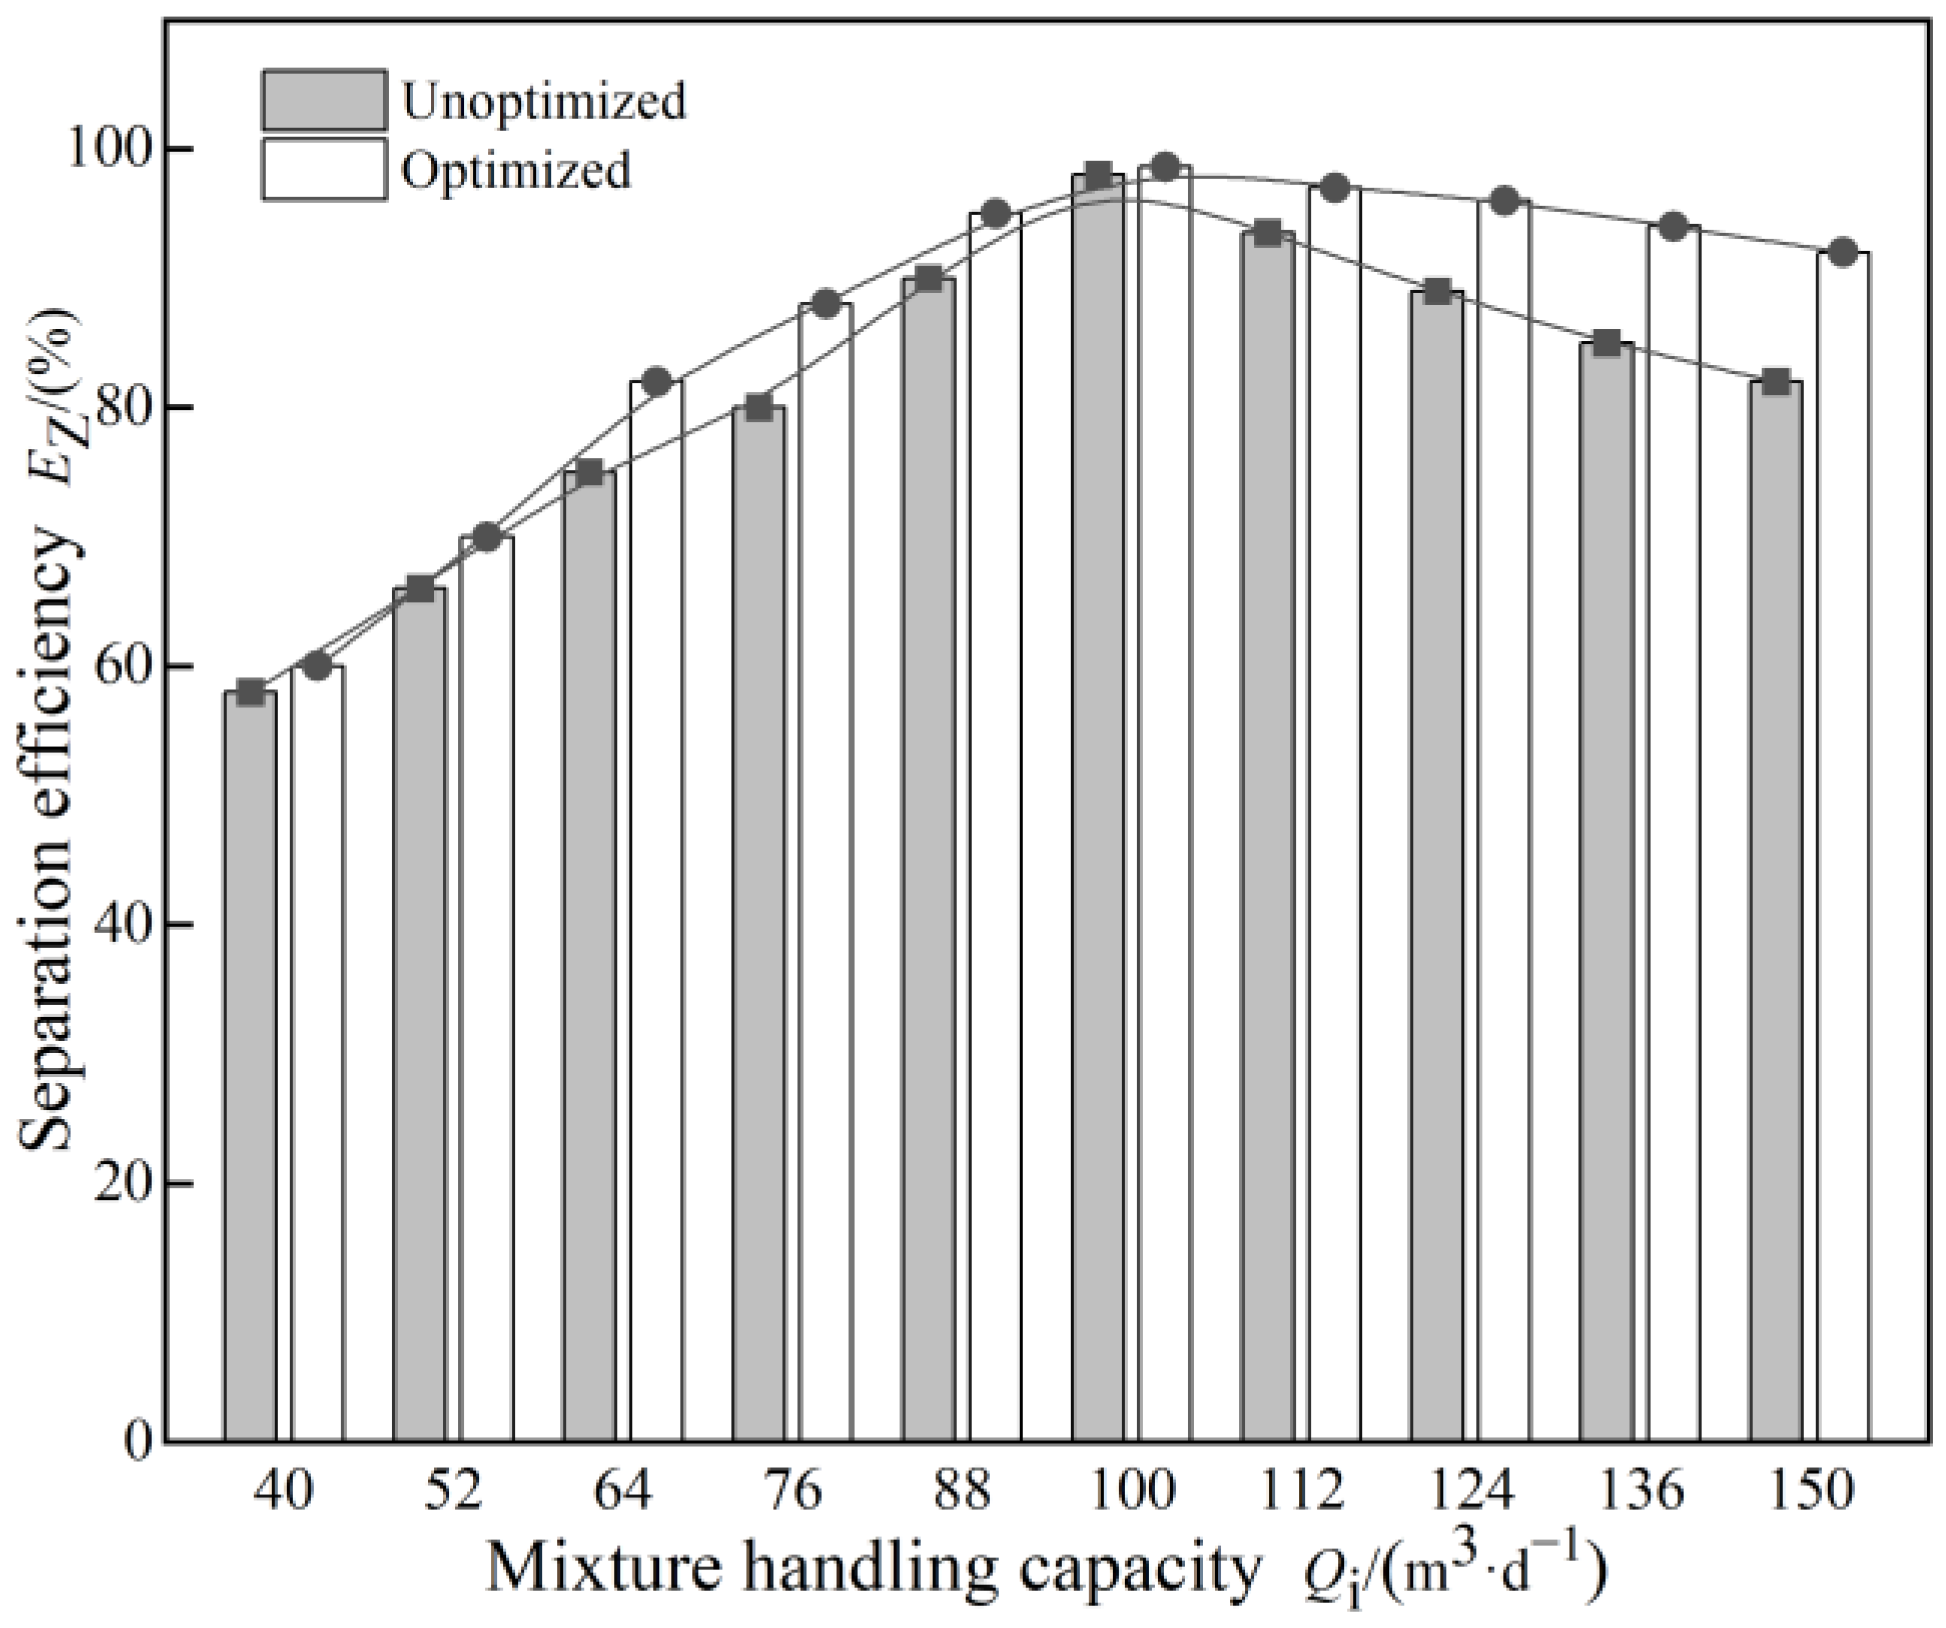
To further evaluate the applicability of the optimized hydrocyclone structure under varying mixture capacities, a comparative study was conducted by numerically simulating the optimized and unoptimized hydrocyclone across different Qi conditions. The mixture treatment capacity was ranged from 40 m3/d to 150 m3/d, the mixture’s water content was set at 98%, and the split ratio was maintained at 30%. A comparative graph illustrating the separation efficiency and oil concentration at the bottom flow outlet of the hydrocyclone before and after optimization with different mixture capacities is depicted in Figure 8. It can be seen that as the mixture capacity increased, the separation efficiency of the hydrocyclone also exhibited a gradual enhancement. Prior to optimization, the structure’s separation efficiency rose from 48.4% to 96.6%, whereas the separation efficiency of the optimized cyclone structure increased from 56.5% to 98.6%. The optimal treatment capacity was observed at 100 m3/d. For the same mixture capacity, the optimized hydrocyclone exhibited superior separation efficiency compared to the unoptimized structure.
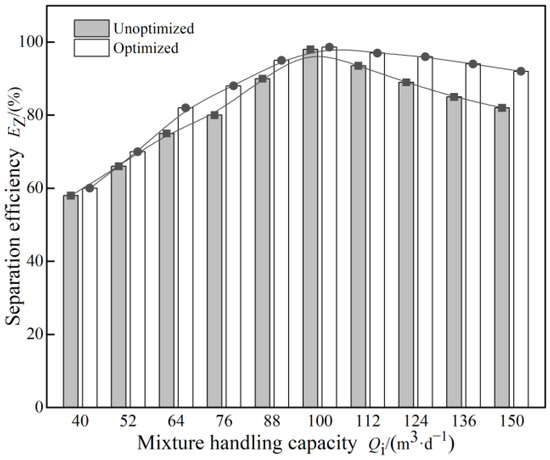
Figure 8.
Comparison of the separation performance of the hydrocyclone before and after optimization under different mixture capacities.
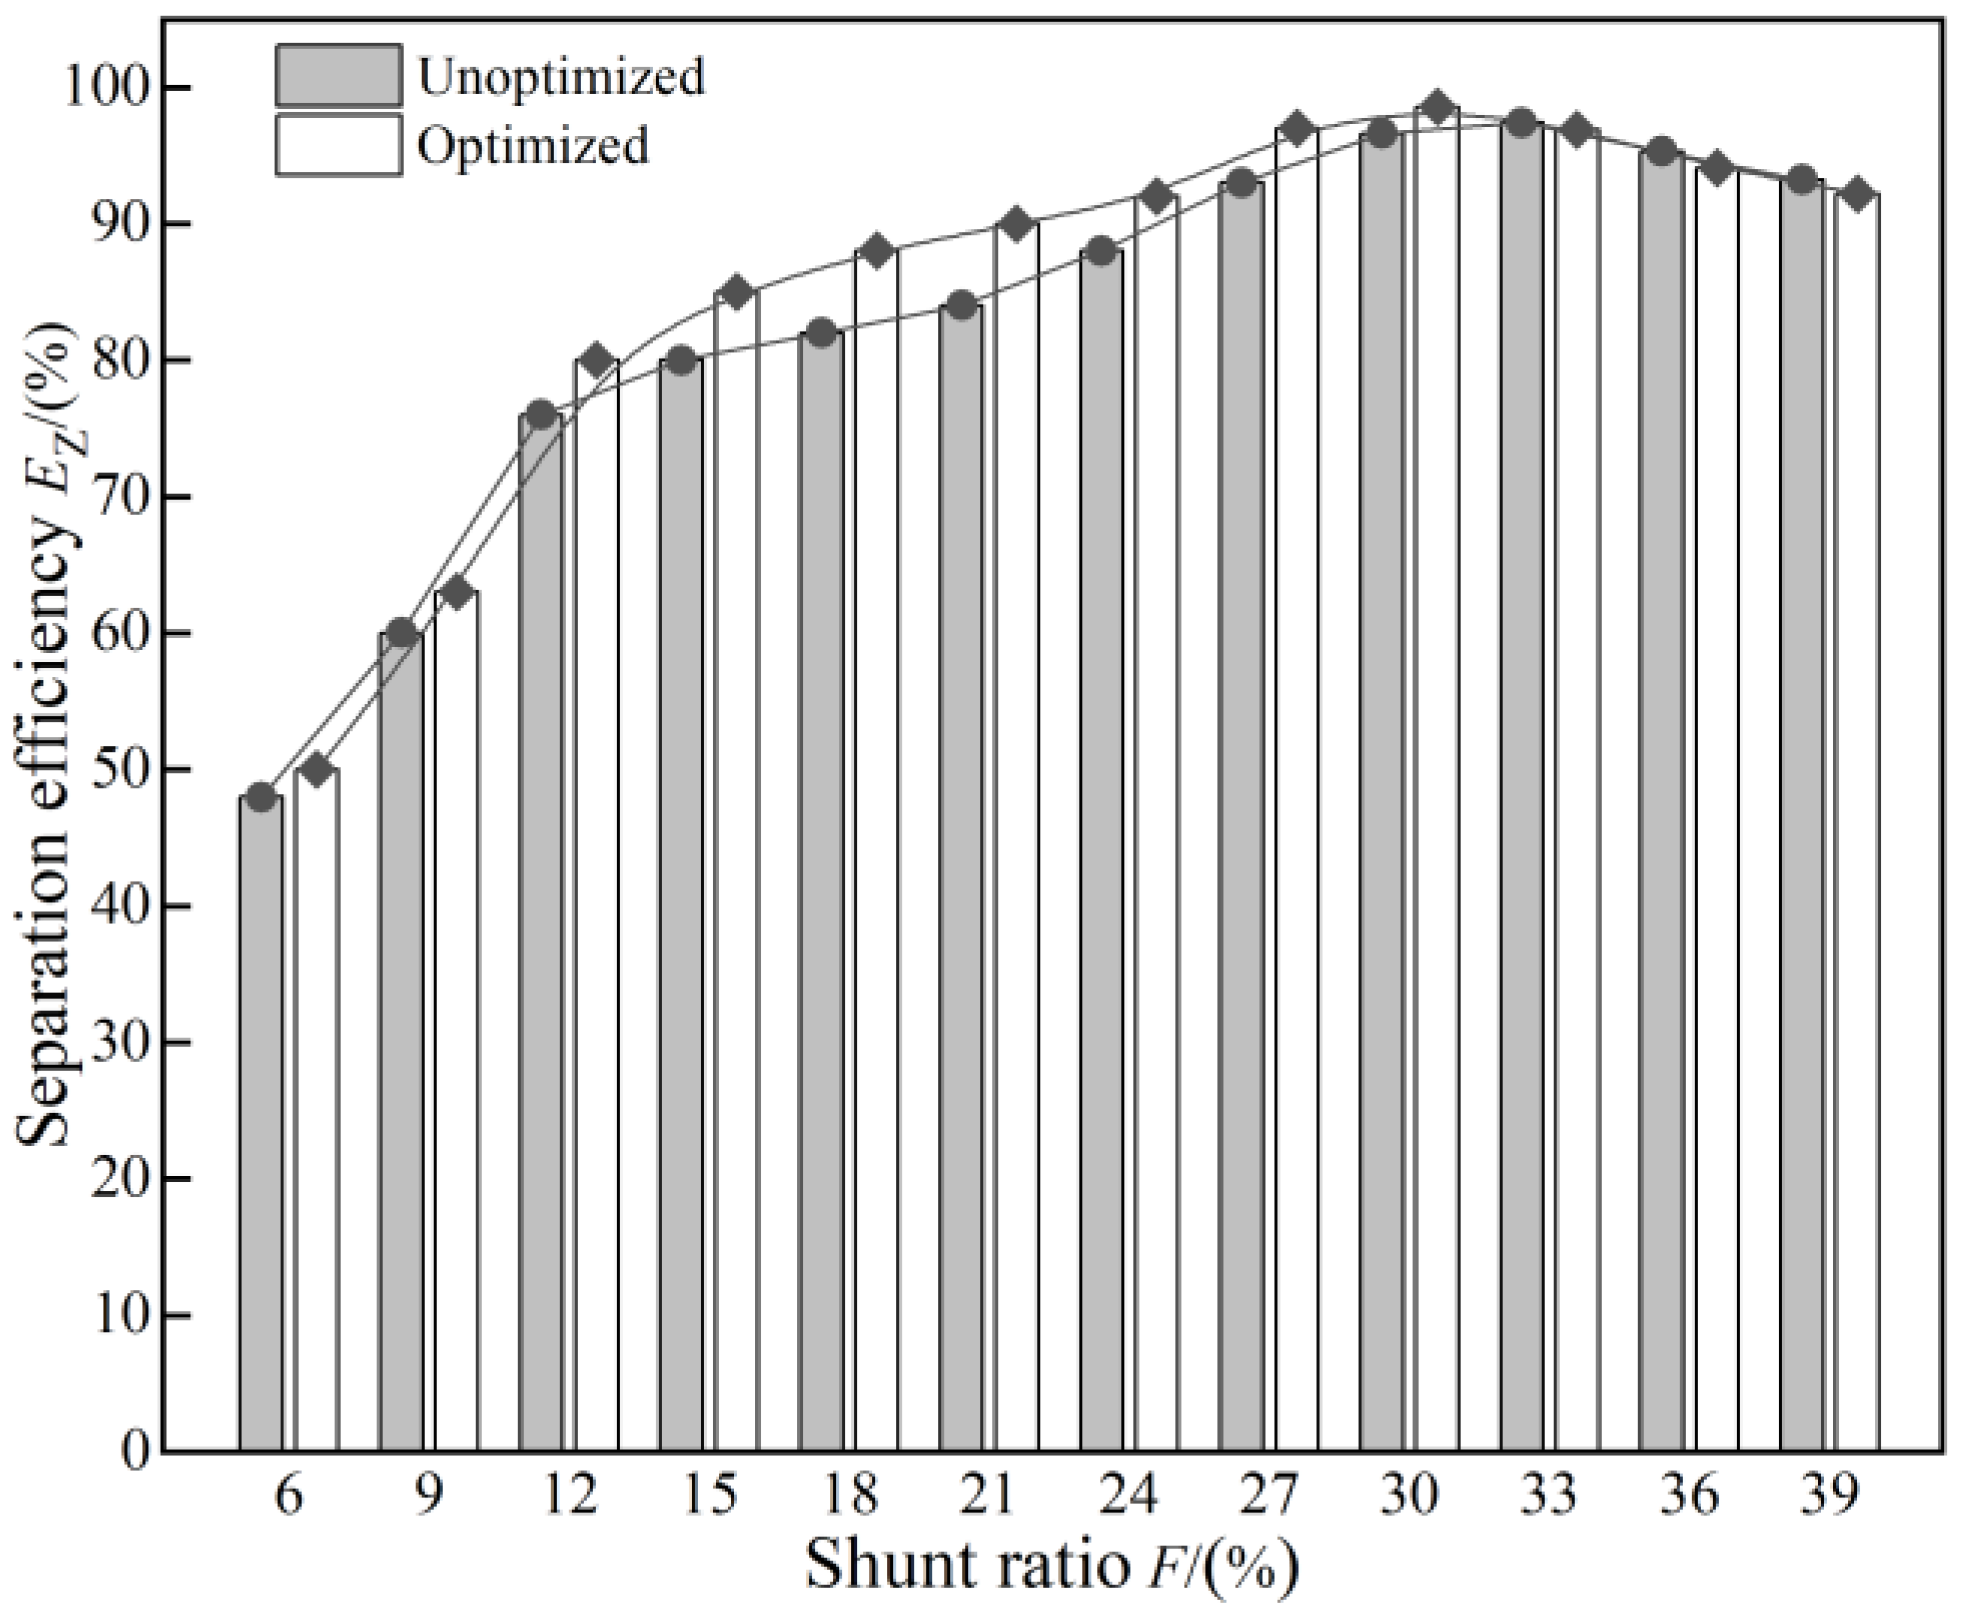
Figure 9 presents a comparison of the separation performance between the hydrocyclone structures before and after optimization with different shunt ratios. The split ratio, denoted as F, was varied within the range of 6% to 39%. The mixture treatment capacity remained fixed at 100 m3/d, and the water content was set at 98%. The separation efficiency of the hydrocyclone exhibited an initial increase followed by a subsequent decrease as the shunt ratio varied. The lowest separation efficiency for both the unoptimized and optimized structures was observed at a shunt ratio of F = 6%, resulting in 48% separation efficiency before optimization and 50% after optimization. However, at a shunt ratio of F = 30%, the separation efficiency reached its peak. Specifically, before optimization, the separation efficiency was 96.6%, while after optimization, it improved to 98.6%. This trend underscores the suitability of the designed hydrocyclone separator for high shunt ratio conditions. Moreover, the improved separation efficiency after optimization, compared to the unoptimized state, for varying shunt ratios validated the enhanced reliability of the optimized structure’s separation performance.
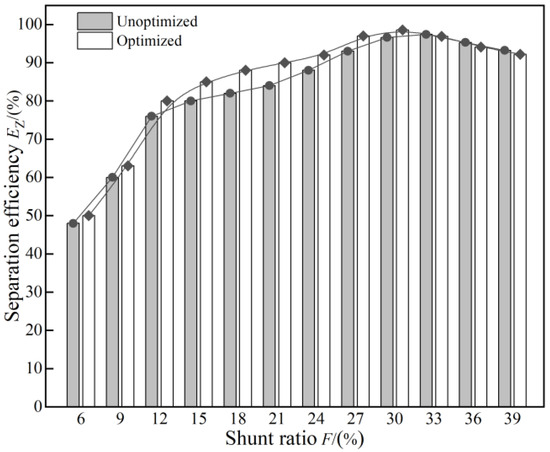
Figure 9.
Comparison of the separation performance of the hydrocyclone before and after optimization under different shunt ratios.
4.4. Experimental Verification
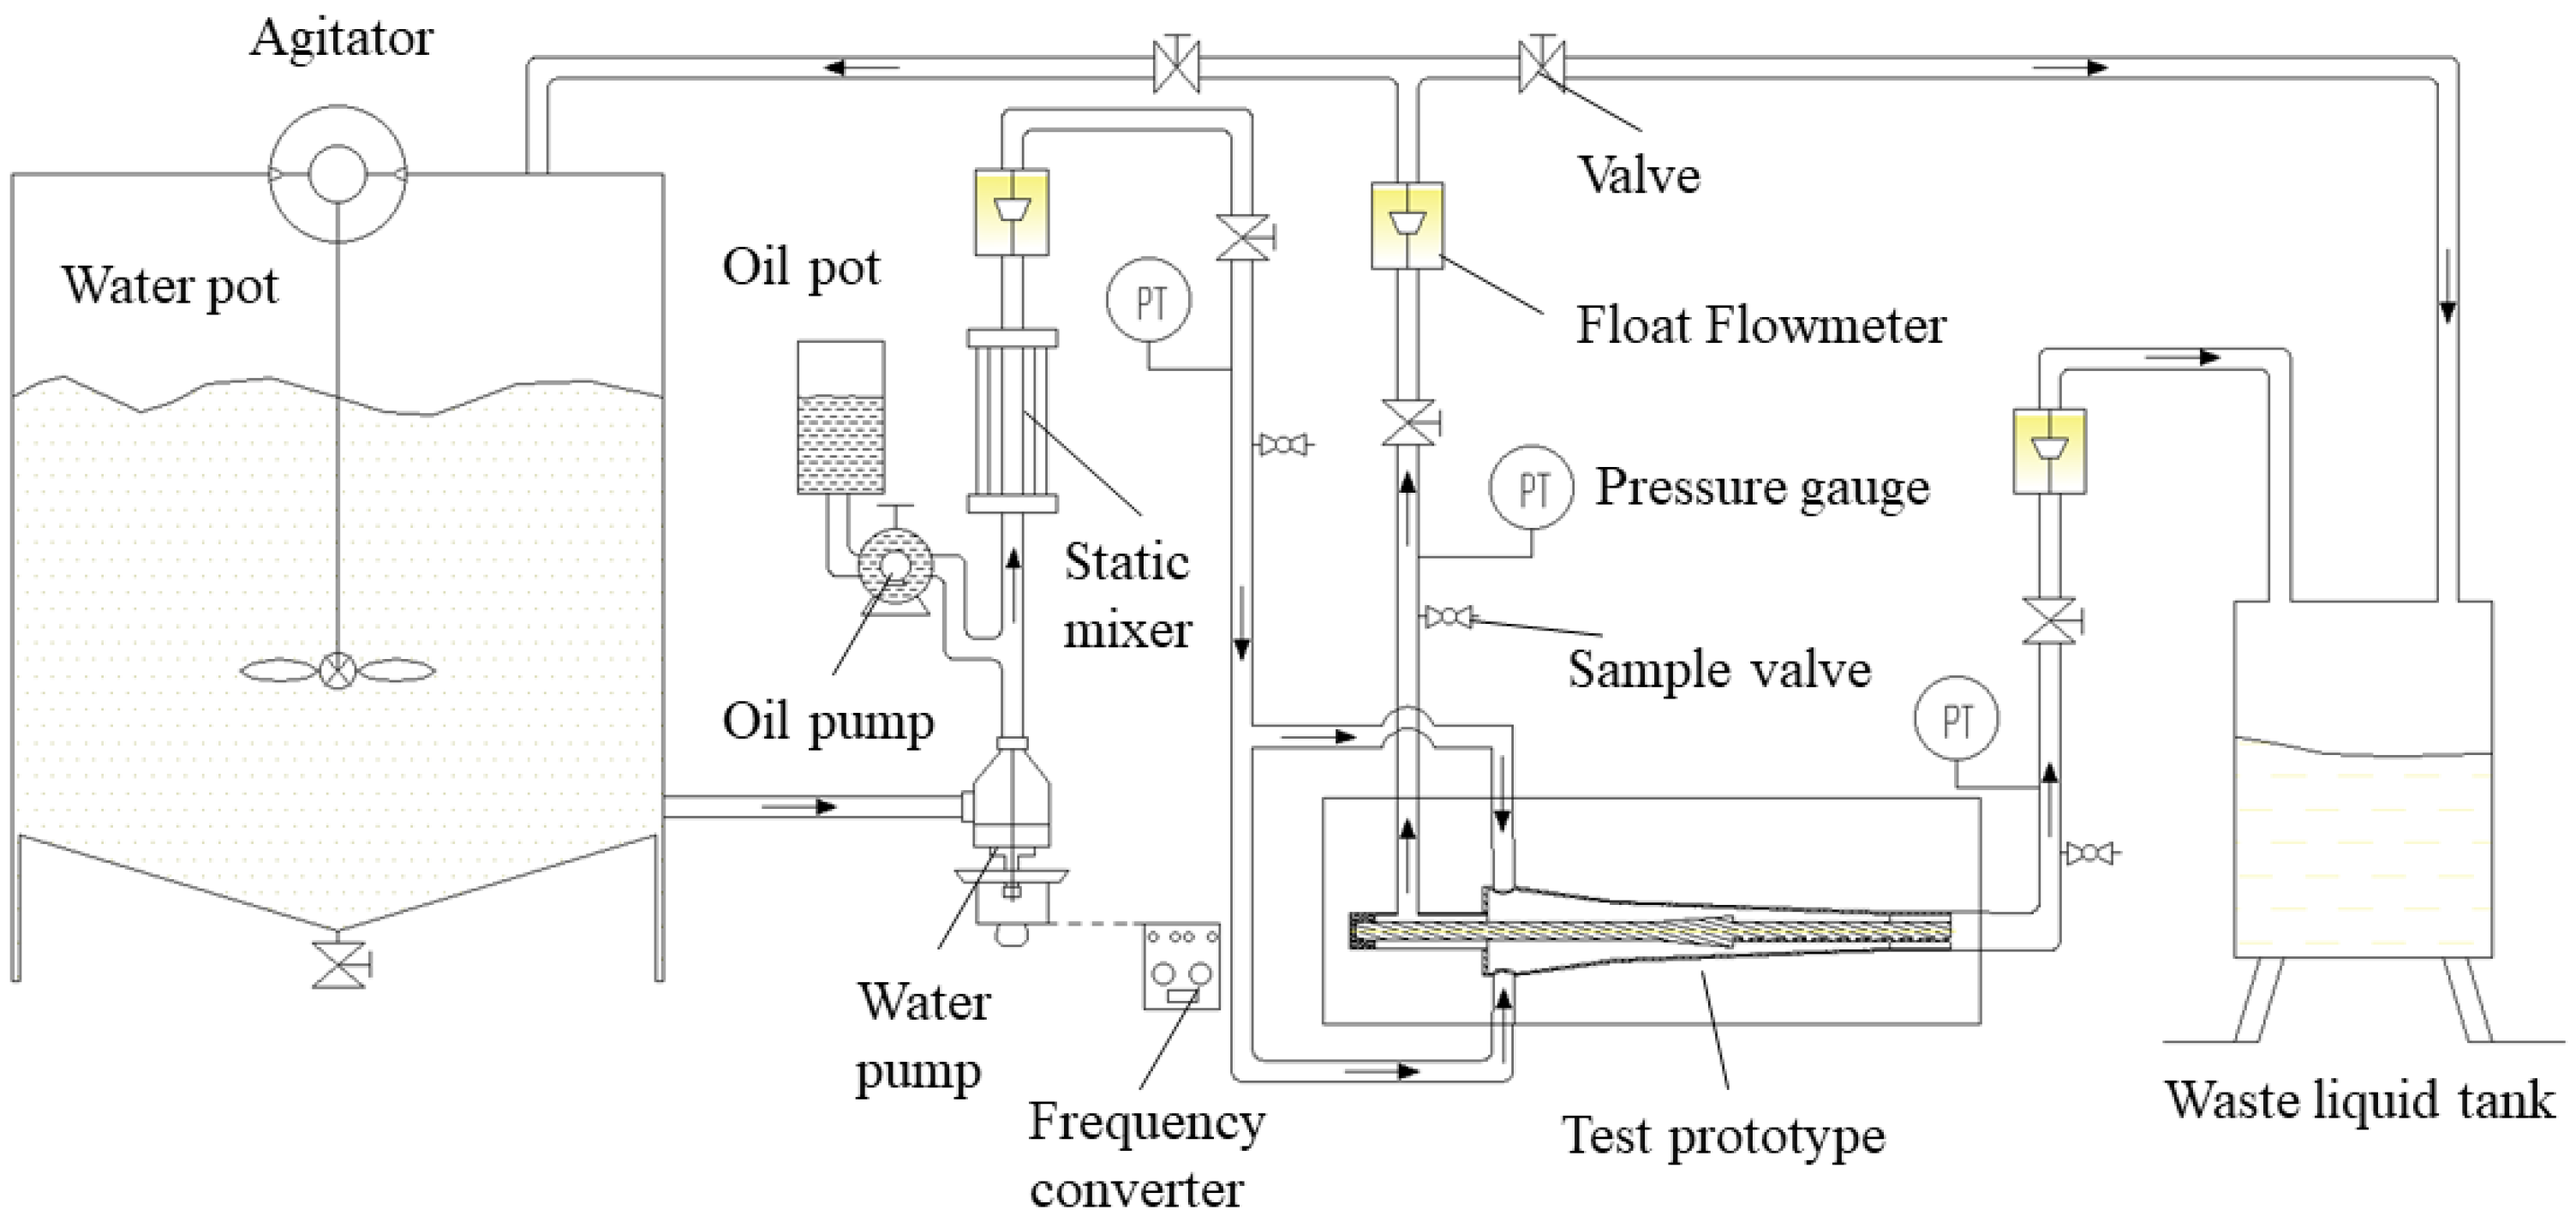
Utilizing the insights gained from the response surface analysis, an optimized prototype of the axial center-piercing hydrocyclone was fabricated. The prototype was constructed using plexiglass material for transparent observation of the internal flow patterns. Focusing on the overflow split ratio of the prototype, experimental investigations were conducted into the separation performance of the optimized rear cyclone under varying shunt ratios. The experimental procedure is illustrated in Figure 10. During the experimentation, a frequency conversion controller was used to regulate the screw pump’s frequency for managing the water intake from the water tank. The liquid supply of the metering plunger pump from the oil tank was controlled by adjusting the measuring scale. The shunt ratio was manipulated by installing cut-off valves on the inlet, overflow, and bottom outlet pipelines. Real-time monitoring of flow and pressure at the entrance was achieved using a float flowmeter and pressure gauge, respectively.
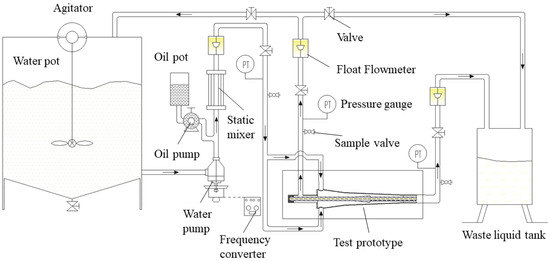
Figure 10.
Experimental process flow chart.
Heavy-duty gear oil with similar viscosity and simulated density was utilized as the experimental oil. The viscosity of the oil phase at 25 °C was 1.03 Pa·s, and the density was 880 kg/m³, as determined by a Malvern rheometer. In the experiment, water and oil were pumped through a screw pump and a metering plunger pump, respectively. After thorough mixing in a static mixer, the oil–water mixture was directed into the hydrocyclone prototype. Following the swirling separation of oil and water, the oil phase exited through the central axis overflow port, while the water phase exited from the sidewall bottom flow port.
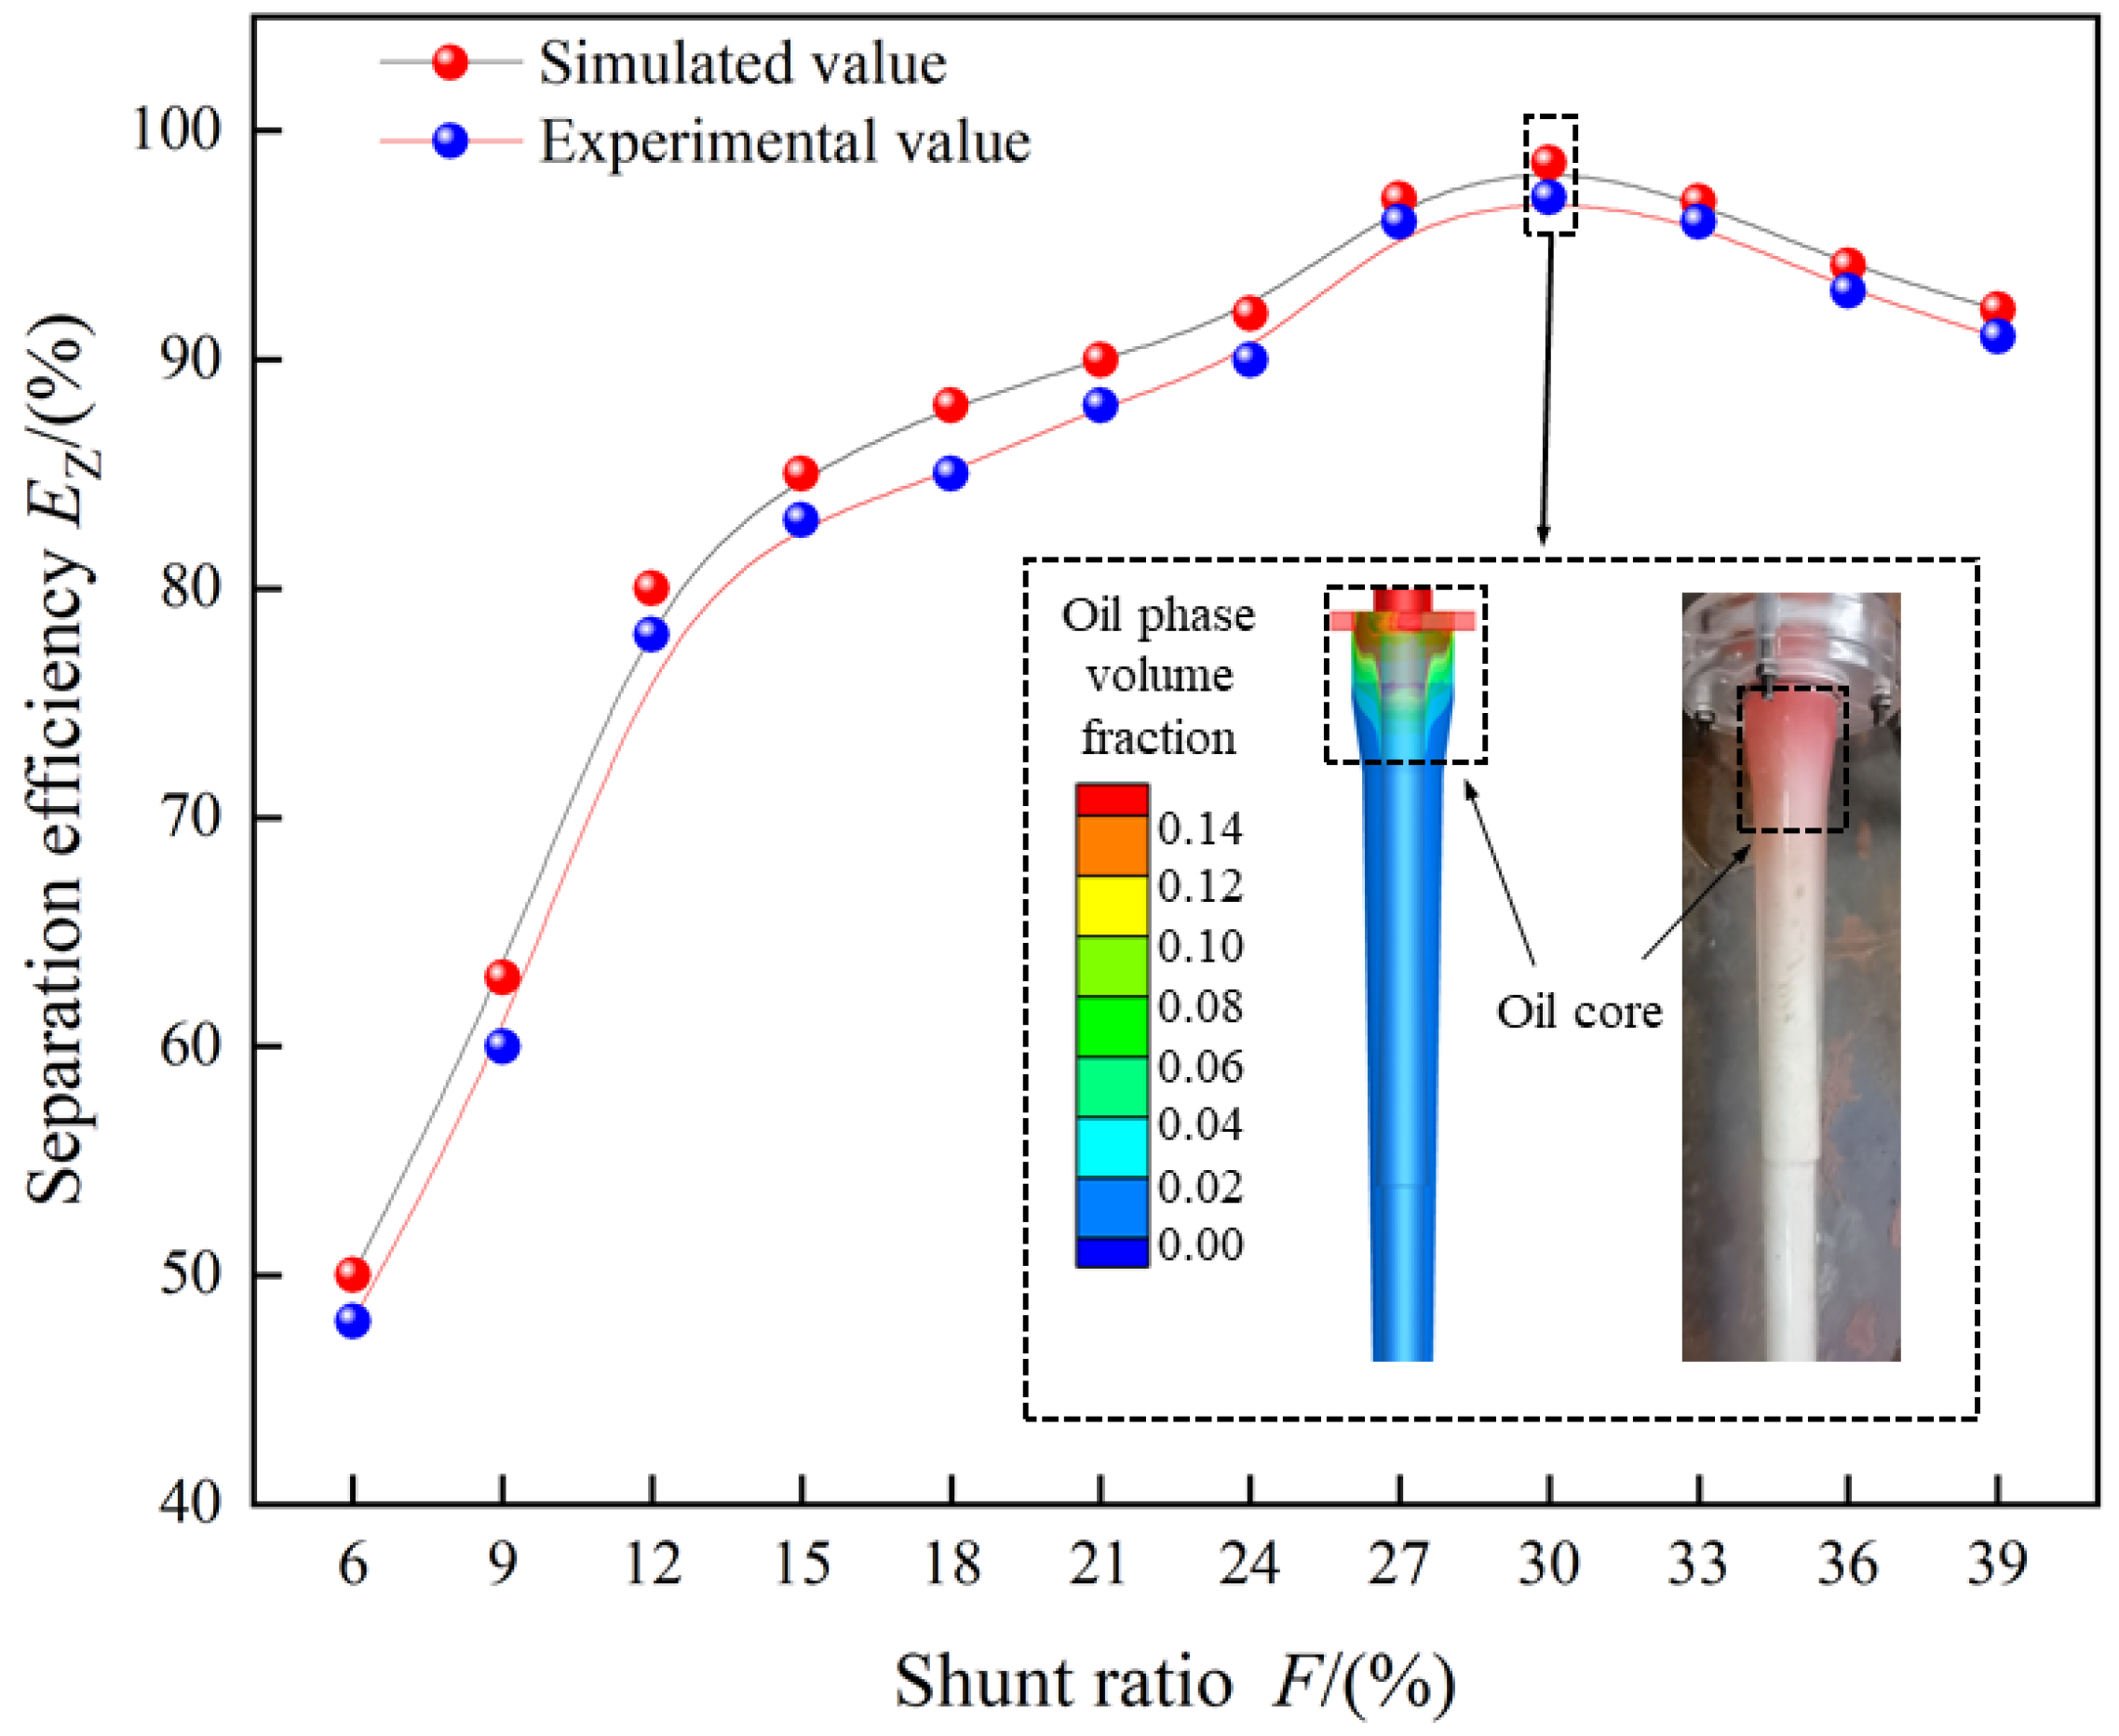
To verify the accuracy of the aforementioned numerical simulation methods and results, the internal oil core state of the flow field was examined at different overflow split ratios, specifically 6%, 18%, and 30%. The distribution of the oil core under different shunt ratios is depicted in Figure 11. As the shunt ratio increased, the lower part of the oil core became shorter, and the simulated position closely resembled the experimental oil core under the same parameters. The comparison of the separation performance between the simulation and experiment under different shunt ratios is illustrated in Figure 10. The same 12 experimental points were replicated in the simulation tests, with the inlet liquid intake adjusted to the optimal treatment capacity of the optimized hydrocyclone (100 m3/d), while maintaining a stable water content of 98%. Once the inlet reached stability, the separation efficiency initially increased and then decreased as the overflow shunt ratio was raised (Figure 12). When the shunt ratio was below 30%, the separation performance of the hydrocyclone improved as the split ratio increased. However, when the split ratio F was less than 15%, the efficiency of the hydrocyclone showed significant changes. Experimentally, the efficiency increased from 48% to 82%, and the optimal separation performance occurred at a shunt ratio of F = 30%. The maximum separation efficiencies observed in the simulation and experiment were 98.6% and 97.1%, respectively.
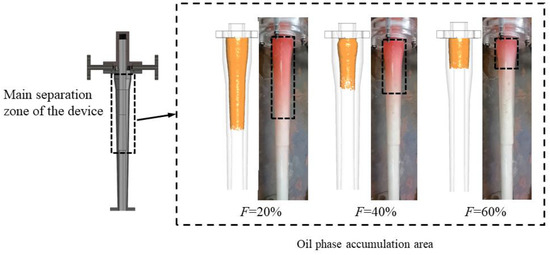
Figure 11.
Oil core distributions under different shunt ratios.

Figure 12.
Comparison of the simulation and the experimental separation performance under different shunt ratios.
As the shunt ratio continued to increase, the separation efficiency declined. The change pattern of the internal oil core and separation efficiency of the hydrocyclone exhibited a more consistent trend between experimental and numerical simulation results with an increase in shunt ratio. This finding confirmed the reliability of the numerical simulation method.
In a similar manner, an experiment was conducted to examine the impact of inlet liquid intake on the separation efficiency of the axial center-piercing hydrocyclone. The inlet flow parameters were adjusted within the range of 40 m3/d to 150 m3/d, covering 10 experimental points identical to those in the simulation tests of the separator. The overflow shunt ratio was maintained at a stable 30%. The comparison between the experimental and simulated separation efficiency values of the axial center-piercing hydrocyclone, as influenced by varying inlet liquid intake, is illustrated in Figure 13. The separation efficiency of the over-axis cyclone rose with the increase in capacity up to 100 m3/d. However, as the liquid intake further increased, the separation efficiency tended to decrease. When the processing capacity was below 100 m3/d, both the experimental and simulation efficiencies showed significant changes. Specifically, the experimental efficiency increased from 58% to 97.1%. The optimal processing capacity for the axial center-piercing hydrocyclone was determined to be 100 m3/d. At this capacity, the experimental separation efficiency reached 97.1%, while the simulation efficiency was 98.6%. Therefore, there was strong alignment between the experimental and numerical simulation results, affirming the validity of the proposed simulation method.
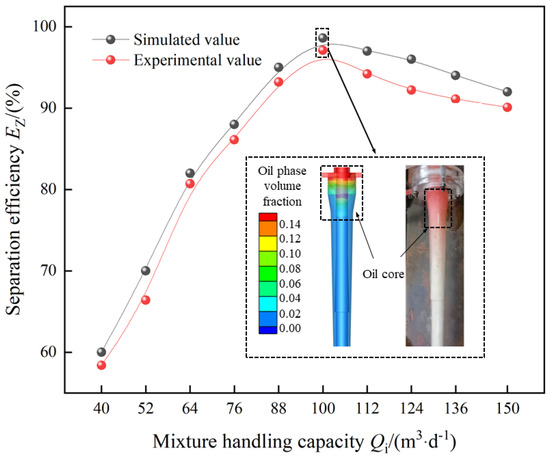
Figure 13.
Comparison of the separation performance between simulation and experiment under different processing capacities.
5. Conclusions
In this paper, we present an innovative design for an axial center-piercing hydrocyclone and improve its performance using the response surface method. By constructing a mathematical model that links structural parameters with separation efficiency, we pinpoint the optimal configuration for achieving efficient separation.
- According to the downhole working conditions of injection and production in the same well, a novel axial center-piercing hydrocyclone structure was proposed. The optimal structural parameters were determined through the response surface method, as follows: main diameter D = 70.4 mm, large cone angle α1 = 32.4°, small cone angle α2 = 3.9°, bottom flow tube length L3 = 311.7 mm, and inverted cone length L4 = 166.0 mm.
- The reliability of the optimized structure was validated through a comparison of internal tangential velocity cloud images and the distribution of the oil-phase volume fraction before and after optimization. Numerical simulations of the optimized structure demonstrated that the separation efficiency after optimization surpassed that before optimization under equivalent parameter conditions, confirming the enhanced efficiency of the optimized structure. The optimal operational parameters for the optimized over-axis cyclone were determined. At a treatment capacity of 100 m3/d, water content of 98%, and a shunt ratio of 30%, the separation efficiency reached its peak at 98.6%, a 2% improvement over the pre-optimized configuration.
- Reliability verification of the experiments was conducted under various shunt ratios and processing capacities. The experimental results showed close agreement with the numerical simulation results.
By optimizing the axial center-piercing hydrocyclone, we enhance its suitability for central piercing conditions, thereby offering crucial technical support and assurance for its utilization in downhole applications. This study constitutes a significant contribution to the broader field of downhole technology, particularly in advancing the application of hydrocyclones.
Author Contributions
Y.G., H.L., J.Y., X.Z., G.C., Q.Y., D.J. and L.Z. contributed to the study and design. All authors have read and agreed to the published version of the manuscript.
Funding
This work was supported by the Regional Innovation and Development Joint Fund of the National Natural Science Foundation of China under grant number U21A20104.
Data Availability Statement
Data are available on request due to restrictions, e.g., privacy or ethical. The data presented in this study are available on request from the corresponding author.
Conflicts of Interest
The authors declare no conflict of interest.
References
- Liu, H.; Gao, Y.; Pei, X.H.; Zheng, G.; Lichen, Z. Progress and prospect of downhole cycloneoil-water separation with single-well injection-production technology. Acta Pet. Sin. 2018, 39, 463–471. [Google Scholar]
- Wang, D.M.; Wang, Y.; Zhang, L.L.; Liu, J.T.; Zhang, H.Y.; He, Z.G.; Zhang, Y. Matching technology and application effect of injection-production in the same well. J. China Univ. Pet. 2023, 47, 64–72. [Google Scholar]
- Liu, H.Y.; Han, T.L.; Wang, Y.; Huang, Q. Influence of new outlet configurations with baffle on hydrocycloneon separation performance. CIESC J. 2018, 69, 2081–2088. [Google Scholar]
- Gao, Y.; Pei, X.; Cao, G.; Yu, J.; Zhao, X.; Li, F. Effect of collision of particles on migration behaviour in hydrocyclone. J. Phys. Conf. Ser. 2023, 2441, 012040. [Google Scholar] [CrossRef]
- Zhang, Y.K.; Ge, J.B.; Liu, P.K.; Yang, X.G. Flow field characteristics and separation performance of multi-inlet hydrocyclone. Chem. Ind. Eng. Prog. 2022, 41, 86–94. [Google Scholar]
- Liu, L.; Zhao, L.; Yang, X.; Wang, Y.; Xu, B.; Liang, B. Innovative design and study of an oil-water coupling separation magnetic hydrocyclone. Sep. Purif. Technol. 2019, 213, 389–400. [Google Scholar] [CrossRef]
- Slot, J.J.; Campen, L.; Hoeijmakers, H.W.M.; Mudde, R.F. In-line oil-water separation in swirling flow. In Proceedings of the 8th International Conference on CFD in Oil & Gas, Metallurgical and Process Industries, Trondheim, Norway, 21–23 June 2011; pp. 21–23. [Google Scholar]
- Tian, J.; Wang, H.; Lv, W.; Huang, Y.; Fu, P.; Li, J.; Liu, Y. Enhancement of pollutants hydrocyclone separation by adjusting back pressure ratio and pressure drop ratio. Sep. Purif. Technol. 2020, 240, 116604. [Google Scholar] [CrossRef]
- Yan, Y.J.; Shang, Y.X.; Wang, Z.C.; Tian, M.; Wang, Y. The Structure Design and Numerical Simulation Research on Downhole Hydrocyclone Desander. Adv. Mater. Res. 2014, 933, 434–438. [Google Scholar] [CrossRef]
- Xing, L.; Guan, S.; Gao, Y.; Jiang, M. Measurement of a Three-Dimensional Rotating Flow Field and Analysis of the Internal Oil Droplet Migration. Energies 2023, 16, 5094. [Google Scholar] [CrossRef]
- Al-Kayiem, H.H.; Osei, H.; Hashim, F.M.; Hamza, J.E. Flow structures and their impact on single and dual inlets hydrocyclone performance for oil–water separation. J. Pet. Explor. Prod. Technol. 2019, 9, 2943–2952. [Google Scholar] [CrossRef]
- Xing, L.; Zhang, Y.; Jiang, M.H.; Gao, Y. Flow Filed Analysis and Performance Evaluationon Axis-in Dual-Stage Tandem Hydrocyclones. China Mech. Eng. 2018, 29, 1927–1935. [Google Scholar]
- Zhao, C.W.; Li, Z.L.; Deng, L.J.; Wu, H.Y. Study on working characteristics of downhole two-stage series oil-water separator. J. Mech. Eng. 2014, 50, 177–185. [Google Scholar] [CrossRef]
- Zhao, C.W.; Li, Z.L.; Dong, X.W.; Zhang, X.L. Numerical simulation and experiment of downhole two-stage tandem hydrocyclone. Acta Pet. Sin. 2014, 35, 551–557. [Google Scholar]
- Wang, Z.C.; Zhang, J.L.; Kong, L.Z.; Xu, Y. Numerical simulation of the flow field in aixial rotating Hydrocyclone. J. Harbin Inst. Technol. 2011, 43, 126–130. [Google Scholar]
- Bai, C.L.; Wang, C.S.; Chen, J.Q.; Shang, C.; Zhang, M.; Liu, M.L.; Zheng, X.P. Experimental study of axial hydrocyclone for pre-dehydration from wellstream. Chem. Ind. Eng. Prog. 2020, 39, 1649–1656. [Google Scholar]
- Ding, W.G.; Liu, L.; Du, X.X.; Zhang, B.L.; Yang, G.W.; Wu, G.; Zhao, L.X. Structure Design and Optimization of Offshore Downhole Oil-Water Separation Hydrocyclone. China Pet. Mach. 2020, 48, 69–76. [Google Scholar]
- Gao, Y.; Han, Q.Q.; Su, J.; Wang, W.C.; Ma, Z.Q. Numerical Simulation of Downhole Axial-flow Oil-Water Separator in Rod-pumped Well. Chem. Eng. Mach. 2021, 48, 683–690+749. [Google Scholar]
- Xu, B.R.; Jiang, M.H.; Zhao, L.X. CFD simulation and PIV test of water flow characteristics in helix separator. Acta Pet. Sin. 2018, 39, 223–231. [Google Scholar]
- Gao, Y.; Liu, H.; Zhang, Y. Effect of separation performance of downhole hydrocyclones in series on different sand content. J. Northeast Pet. Univ. 2018, 42, 112–120+128. [Google Scholar]
- Wang, Z.J.; Li, F.; Zhao, L.X. Numerical simulation and experimental study on the effect of polymer concentration on hydrocyclone performance. Chem. Ind. Eng. Prog. 2019, 38, 5287–5296. [Google Scholar]
- Liu, P.K.; Niu, Z.Y.; Yang, X.H. Separation performance contrastive study of micro hydrocyclone for ultrafine particles. China Powder Sci. Technol. 2016, 22, 1–6. [Google Scholar]
- Zhang, Y.; Xing, L.; Zhang, Y.; Jiang, M.H. Effects of Discrete Phase Entering Positions on Separation Performance of a Hydrocyclone. J. Chem. Eng. Chin. Univ. 2017, 31, 1311–1317. [Google Scholar]
- Hwang, K.J.; Chou, S.P. Designing vortex finder structure for improving the particle separation efficiency of a hydrocyclone. Sep. Purif. Technol. 2017, 172, 76–84. [Google Scholar] [CrossRef]
- Xing, L.; Li, J.Y.; Zhao, L.X.; Jiang, M.G.; Han, G.X. Structural Optimization of Downhole Hydrocyclones Based onResponse Surface Methodology. China Mech. Eng. 2021, 32, 1818–1826. [Google Scholar]
- Liu, M.; Chen, J.; Cai, X.; Han, Y.; Xiong, S. Oil-water pre-separation with a novel axial hydrocyclone. Chin. J. Chem. Eng. 2018, 26, 60–66. [Google Scholar] [CrossRef]
- Li, F.; Liu, H.L.; Xing, L.; Zhu, Y.M.; Gao, J.M. Influence of Gas Intake on the Performance of Gas Lift Cocurrent Outflow Cyclone. China Pet. Mach. 2021, 49, 100–106+141. [Google Scholar]
- Jiang, M.H.; Zhao, L.X.; Li, F.; Zunce, W. Cyclone Separation Technology; Press of Harbin Institute of Technology: Harbin, China, 2000. [Google Scholar]
- Bezerra, M.A.; Santelli, R.E.; Oliveira, E.P.; Villar, L.S.; Escaleira, L.A. Response surface methodology (RSM) as a tool for optimization in analytical chemistry. Talanta 2008, 76, 965–977. [Google Scholar] [CrossRef]


Disclaimer/Publisher’s Note: The statements, opinions and data contained in all publications are solely those of the individual author(s) and contributor(s) and not of MDPI and/or the editor(s). MDPI and/or the editor(s) disclaim responsibility for any injury to people or property resulting from any ideas, methods, instructions or products referred to in the content. |
© 2023 by the authors. Licensee MDPI, Basel, Switzerland. This article is an open access article distributed under the terms and conditions of the Creative Commons Attribution (CC BY) license (https://creativecommons.org/licenses/by/4.0/).