Article

Mechanical Ventilation Heat Recovery Modelling for AccuRate Home—A Benchmark Tool for Whole House Energy Rating in Australia

1
Energy Division, Commonwealth Scientific and Industrial Research Organisation, Melbourne, VIC 3168, Australia
2
Key Lab of Industrial Fluid Energy Conservation and Pollution Control, Qingdao University of Technology, Qingdao 266520, China
3
Shandong Key Laboratory of Waste Heat Utilization and Energy Saving Equipment Technology, Qingdao University of Technology, Qingdao 266520, China
4
College of Environmental and Municipal Engineering, Qingdao University of Technology, Qingdao 266520, China
*
Author to whom correspondence should be addressed.
Energies 2023, 16(19), 6801; https://doi.org/10.3390/en16196801
Submission received: 17 August 2023 / Revised: 15 September 2023 / Accepted: 21 September 2023 / Published: 25 September 2023
(This article belongs to the Section G: Energy and Buildings)

Abstract

:
To manage energy-efficient indoor air quality, mechanical ventilation with a heat recovery system provides an effective measure to remove extra moisture and air contaminants, especially in bathrooms. Previous studies reveal that heat recovery technology can reduce energy consumption, and its calculation needs detailed information on the thermal performance of exhaust air. However, there are few studies on the thermal performance of bathroom exhaust air during and after showers. This study proposed a detailed thermal performance prediction model for bathroom exhaust air based on the coupled heat and mass transfer theory. The proposed model was implemented into the AccuRate Home engine to estimate the thermal performance of residential buildings with heat recovery systems. The time variation of the water film temperature and thickness on the bathroom floor can be estimated by the proposed model, which is helpful in determining whether the water has completely evaporated. Simulation results show that changing the airflow rate in the bathroom has little effect on drying the wet floor without additional heating. The additional air heater installed in the bathroom can improve floor water evaporation efficiency by 24.7% under an airflow rate of 507.6 m3/h. It also demonstrates that heat recovery can significantly decrease the building energy demand with the fresh air load increasing and contribute about 0.6 stars improvement for the houses in Hobart (heating-dominated region). It may be reduced by around 3.3 MJ/(m2·year) for the houses in other regions. With this study, guidelines for optimizing the control strategy of the dehumidification process are put forward.

1. Introduction

Nowadays, air conditioning is widely used for indoor thermal comfort. Although air conditioners work with high efficiency [1] (Coefficient Of Performance > 1.0), they may fail to maintain indoor air quality, especially in hot and humid climate zones. To achieve indoor thermal comfort and good air quality, it is necessary to combine ventilation and air conditioning [2]. With a supply of fresh air, the incoming air load increases energy demand for space heating and cooling [3]. Air conditioning accounts for about 1/3 of the total building energy consumption [4]. Mechanical ventilation may contribute about 68% of the total moisture load in most commercial buildings [5] and up to 50% of the cooling load in hot and humid regions [4]. With increasing awareness of the indoor environment and energy crisis, various energy-saving methods [6] have been used to reduce the building energy consumption of HVAC (heating, ventilating, and air conditioning) systems, including natural ventilation [7,8], ventilative cooling [9], and different sorts of energy recovery devices [10]. Reports present that energy recovery is one of the most cost-effective means to save energy consumption, and the use of heat recovery ventilation in airtight buildings can reduce the annual energy consumption for heating and cooling loads by up to one-third [11,12,13].
To optimize energy recovery design and explore the heat recovery potential in ventilation, in the past decades, there has been a growing interest in heat recovery ventilation by simulation and experiments. A number of studies [6,14,15,16] have focused on simulating heat recovery system components and experimental verification. Various heat recovery components were investigated, specifically with detailed geometric parameters [17] and different control strategies to assess heat transfer efficiency [18].
Some studies have analysed the energy efficiency of different heat recovery systems or heat exchangers under different working conditions, such as tubular heat exchangers [19], plate-type heat exchangers [20], extended (finned) surface heat exchangers [14], and heat pumps [21]. The heat recovery efficiency varied with operating conditions and constructions. Mardiana-Idayu and Riffat [14] reviewed the latest publications and provided a comparative analysis of system type, efficiency range, and potential advantages. Lu et al. [22] performed a study on the plastic film heat recovery ventilator. The experimental results showed that the efficiency of the heat exchanger varies from 0.65 to 0.85 with various airflow rates, and the pressure drop is less than 20.0 Pa. Li et al. [23] simulated the performance of a heat recovery ventilator coupled with an air-to-air heat pump and obtained that the heating energy reduction per unit area with a heat recovery system is approximately 10 kWh/m2 at 850 annual Heating Degree Days (HDDs) and increases to 50 kWh/m2 at 4000 HDDs in Canadian cities. Ribé et al. [24] analysed the energy recovery potential in different climate conditions with constant indoor temperature and humidity and concluded that the northern part of the Spanish geography presents a saving potential of up to 145 GJ/kgda. Pekdogan et al. [18] conducted an experimental study on the effect of the duration of the ventilation period and found that 2 min of operation time allowed the heat recovery system to achieve the best thermal performance. Strand and Kim [25] evaluated the performance of different decentralized ventilation control strategies in the local Norway climate using the tool IDA-ICE. They pointed out that the lower heat recovery efficiency significantly impacted the ventilation energy in the cold climate. Marsik et al. [26] investigated the impact of ducts on recovery efficiency and found that the very long and less insulated intake/exhaust ducts caused the overall heat recovery efficiency to be lower than 30%, despite the utilized heat recovery unit with the heat transfer efficiency of 70%.
The heat recovery system has been studied deeply from the aspect of the component and system levels or the energy-saving potential for the whole building in previous studies. To evaluate the impacts of heat recovery ventilation on whole-building energy performance, a simple heat recovery model with simplified inputs and short simulation time has been incorporated into some building simulation models, such as BSim [17], Energyplus [8,27], Transys [28,29], DOE2.2 [30], ANSYS [8], and AZMA [31,32]. Some commercial energy consumption calculation tools with detailed heat recovery models work as the platform for the user’s secondary development [23,33]. However, few of the mentioned tools have the specified bathroom models rather than a model of heat recovery exchanger. As a benchmark tool for whole-home energy rating, AccuRate Home [34] is a fully accredited software tool that can be used for regulatory purposes for both building shell thermal performance (Nationwide House Energy Star Scheme—NatHERS star rating) and whole-home assessments in Australia (https://www.nathers.gov.au, accessed on 20 Septemper 2023). AccuRate Home includes a simulation engine (named the Chenath engine) for simulating energy requirements for space heating and cooling of the house. AccuRate Home’s Chenath engine was developed by coupling a frequency response multi-zone thermal model described by Walsh and Delsante [35] and a multi-zone airflow model developed by Ren and Chen [36]. Considering the local climate and building fabrics, the engine automatically switches the building operations between mechanical air conditioning and natural ventilation when natural ventilation satisfies thermal comfort, and it calculates hourly heating and cooling (H/C) energy requirements over a period of one year. Based on the annual total H/C energy requirement, AccuRate Home assigns a star rating between 0 and 10 stars to the residential building for the specific climate zone, which is defined by NatHERS. The Chenath engine was tested satisfactorily against BESTest [37] and measurement data [38]. However, heat recovery system modelling has not been covered in the Chenath engine yet. To meet the requirement of low-energy buildings and achieve a higher star rating for a new house in Australia under the NatHERS, heat recovery ventilation can contribute to improvements in energy efficiency [39] and enclosed space condensation management.
With our literature review, our understanding is that current building simulation tools simulate the energy performance of heat recovery systems in the building using simplified methods assuming the efficiency and operation time of the heat recovery systems. No models have been developed for predicting the discharge air parameters of the bathroom during showers and the moisture removal process, which play a critical role in determining the operation time and energy performance of the heat recovery systems. Moreover, to manage indoor air quality, mechanical ventilation is an effective measure to remove extra moisture and air pollutants. Particular attention must be paid to the bathroom and kitchen, where mould growing as a result of condensation can become more serious than in other rooms. The air condition of a bathroom is determined by the airflows from outside, the inlet airflows from other rooms, and how the shower/bath is performed. The heat transfer and mass transfer in the bathroom interact with each other. This coupled process makes it difficult to simulate heat recovery ventilation for bathrooms. The main contributions of this study are as follows:
(1)
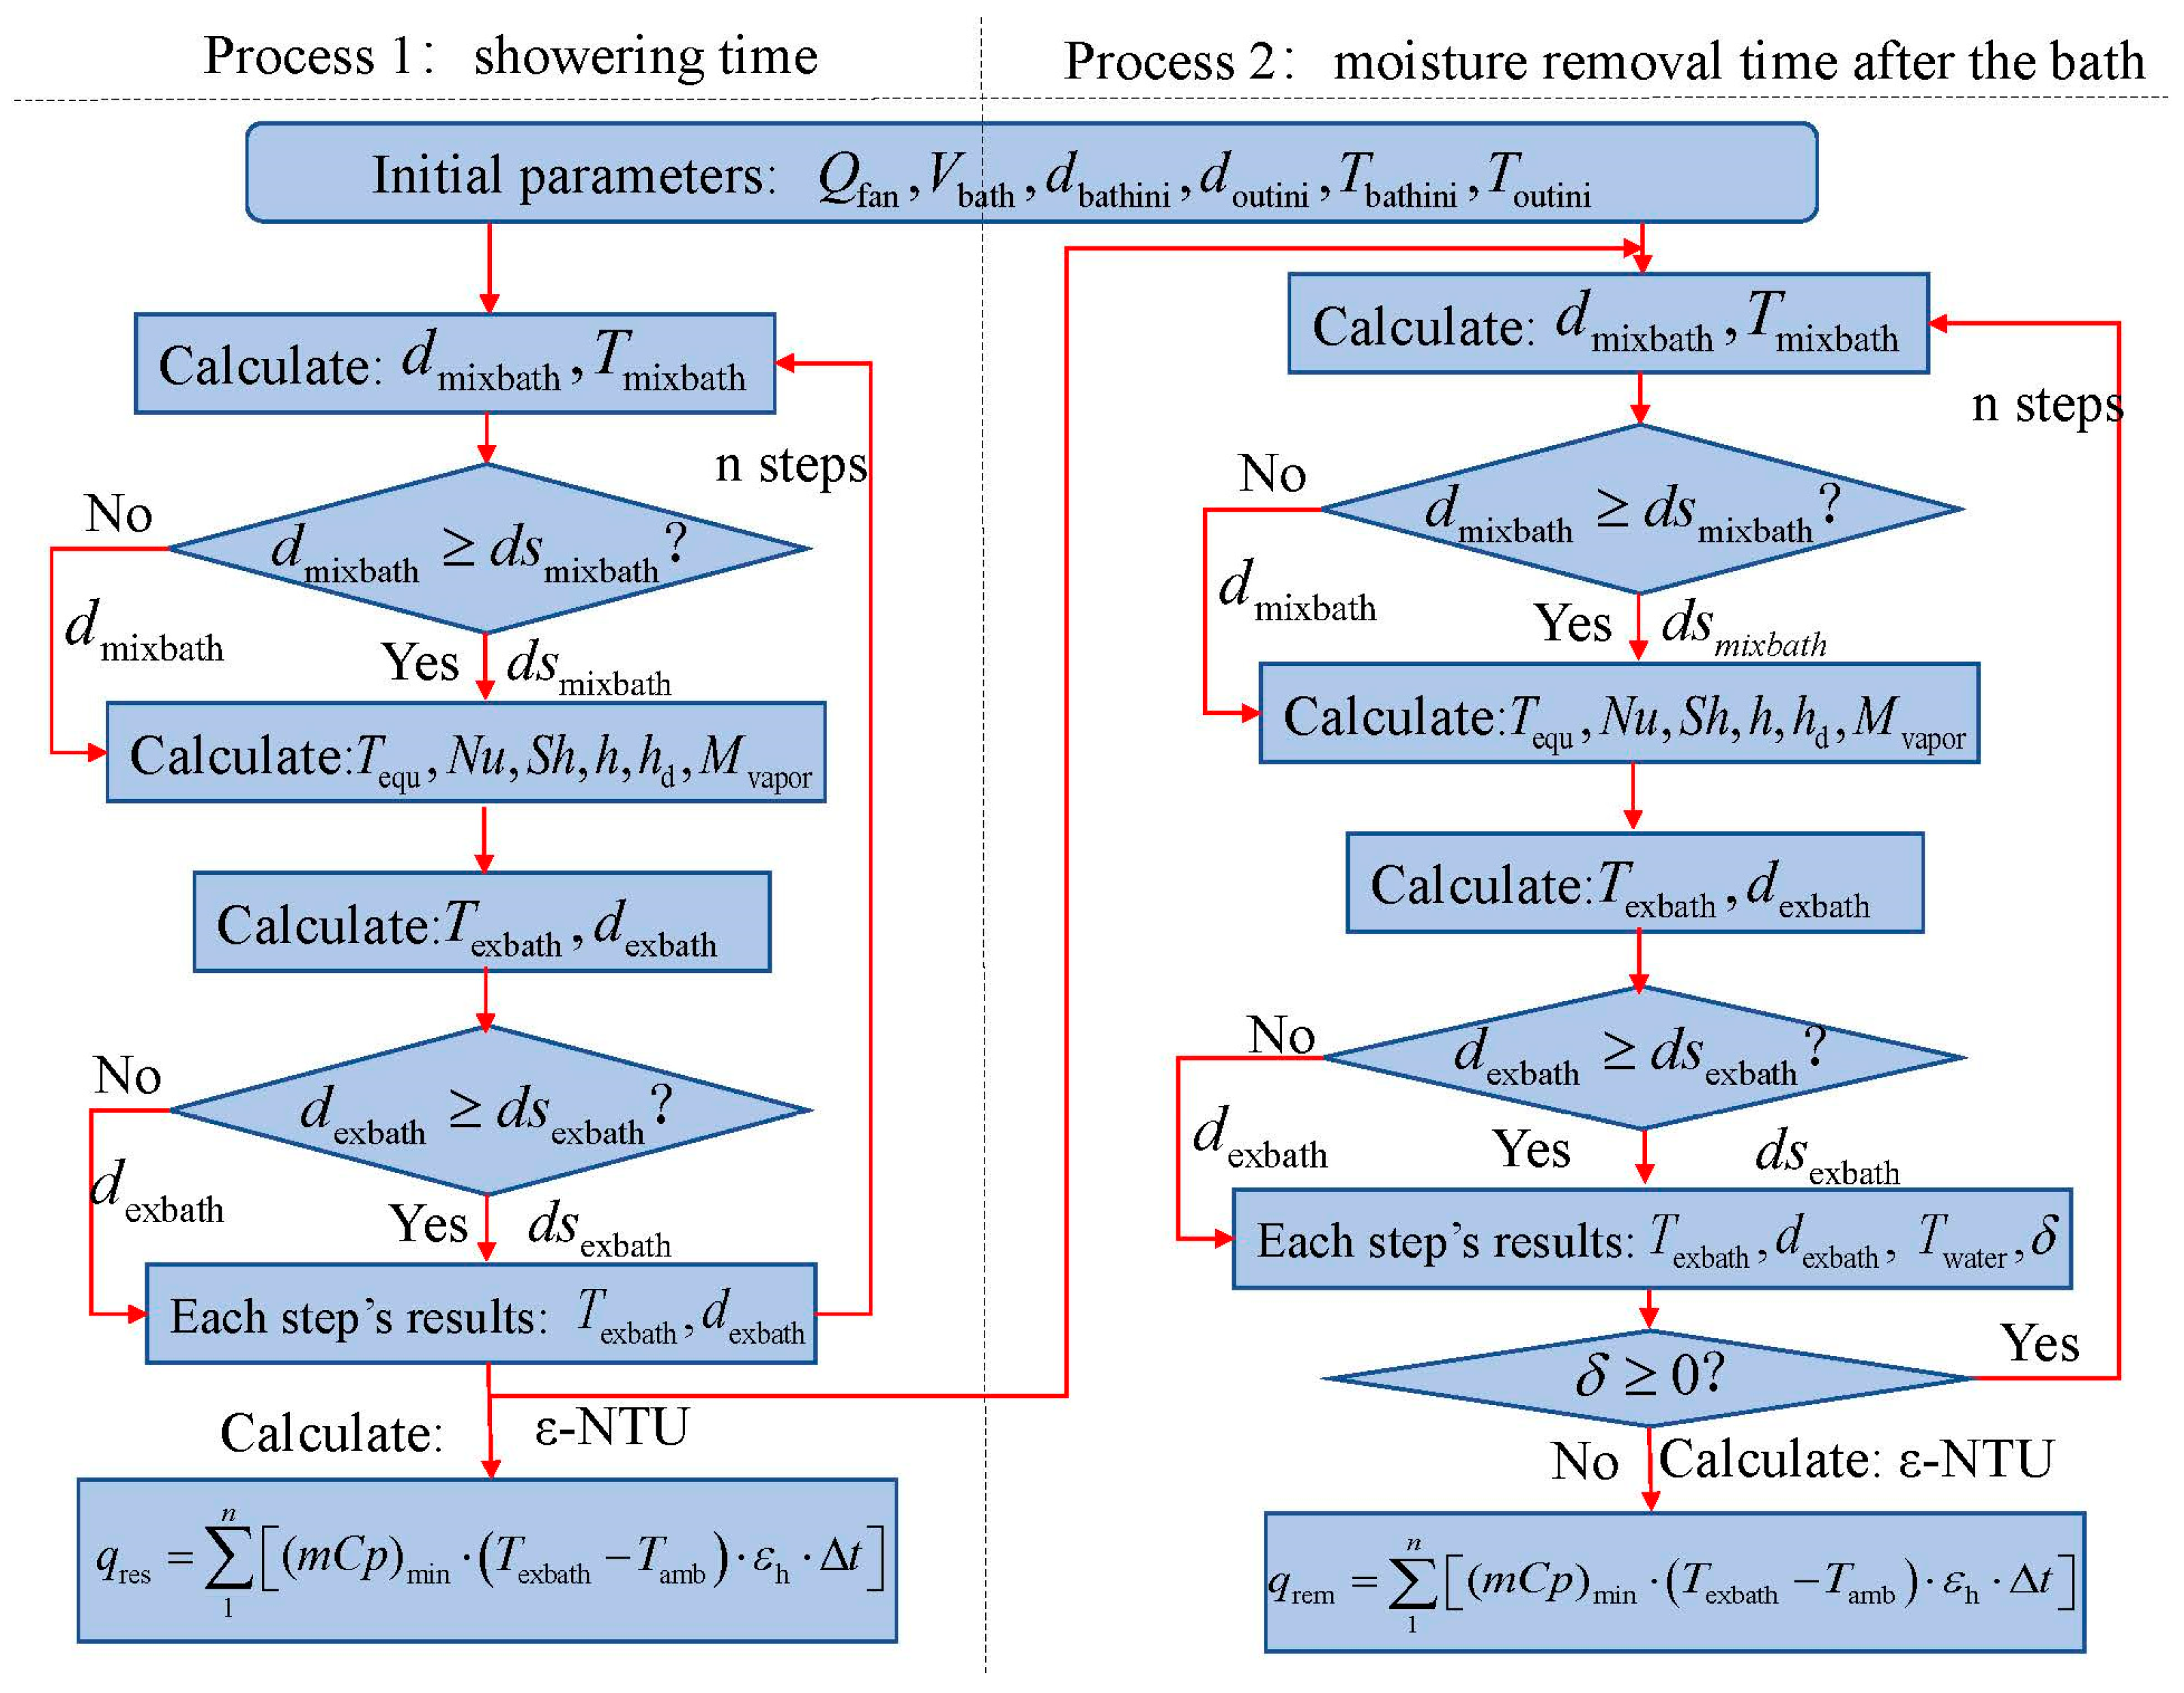
With coupled mass and heat transfer theory, a model is developed to simulate mass and heat transfer of the bathroom ventilation system with heat recovery during and after showers;
(2)
The model is coded and implemented into the Chenath engine to evaluate it under the operation of the bathroom only and for the whole house;
(3)
With the updated Chenath engine, the effects of heat recovery mechanical ventilation on energy star rating are analysed under various operation conditions;
(4)
The maximum potential heat recovery energy is investigated under different climate zones.

2. Heat Recovery Model

The main purpose of mechanical ventilation is to remove indoor air pollution and moisture. Considering the purpose of seasonal mechanical ventilation, the recovered energy can be obtained from three parts: bathroom ventilation, kitchen ventilation, and daily space heating and cooling. For bathroom heat recovery, moisture removal by ventilation is the main measure to dry the humid environment during and after showers. With relatively higher indoor air temperature and hot water vapour, part of the energy can be extracted and recovered from the exhaust air to pre-heat the supplied fresh air. The most important parameters of exhaust air are relative humidity and temperature. Extra attention is needed for the kitchen environment. In this paper, we present a coupled heat and mass transfer model for bathroom ventilation to update the Chenath engine for further development of the AccuRate Home and analyse the energy calculation for the whole house. For a typical building (as shown in Figure 1), there is usually no air conditioning in the bathroom. An exhaust fan is used to remove moist air from the bathroom, and incoming fresh air is drawn from other rooms in the building. This makes the bathroom a negative pressure room. For daily heating recovery, the sensible energy is recovered and calculated according to the thermal state of each conditioned room. The heat recovery models for the bathroom, kitchen, and other rooms are described in the following sections.

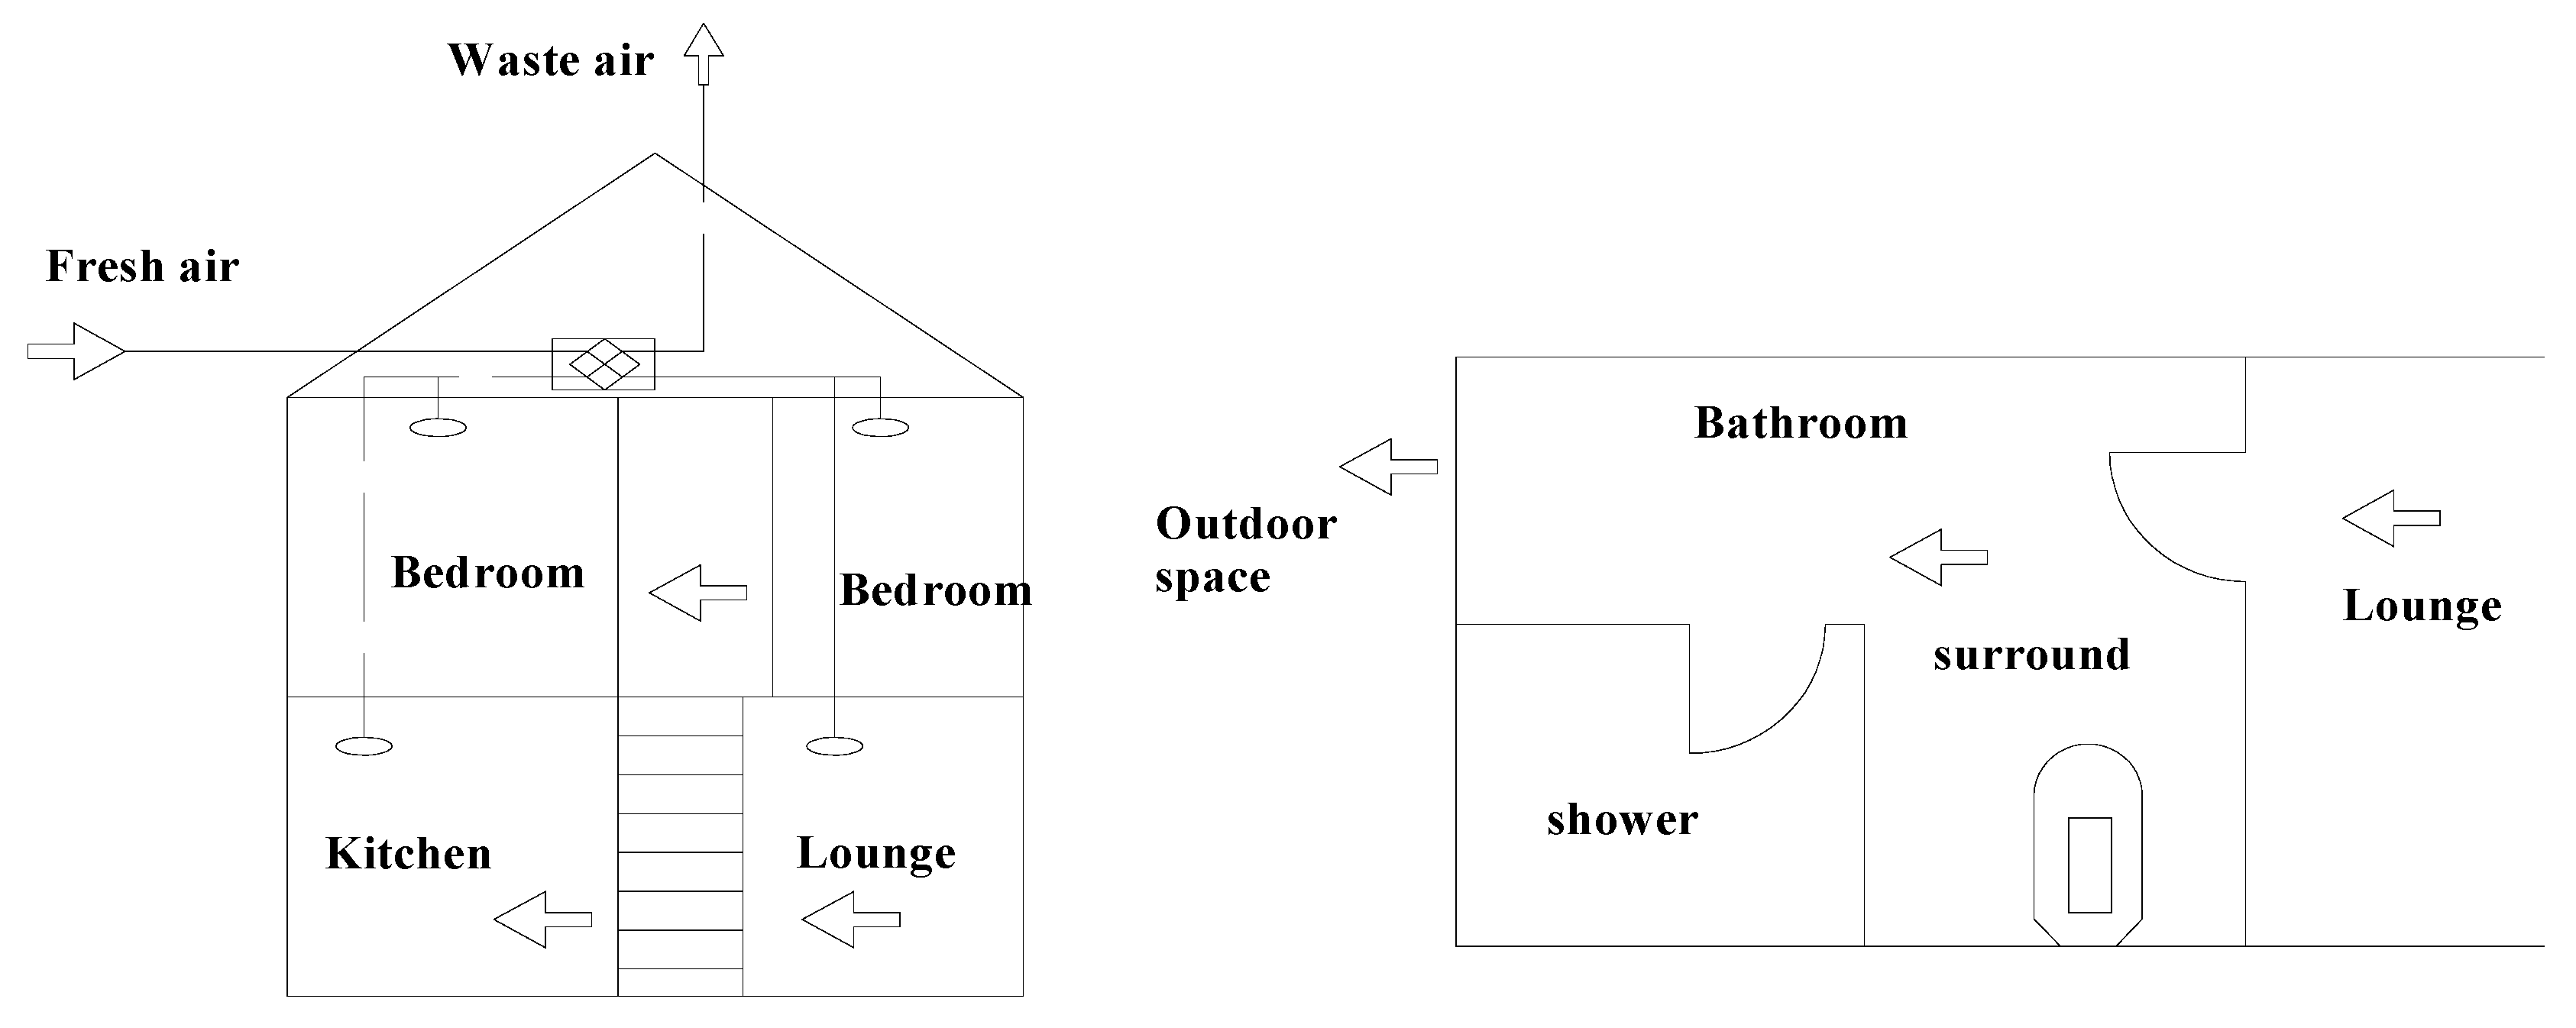
2.1. Bathroom Heat Recovery Model

To accurately calculate the recovered energy of the bathroom ventilation, the ventilation process can be separated into two sections: shower time and moisture removal time after the shower. Each of the ventilation processes has a critical time, which is defined as Equation (1).
t critialpoint = V bath Q fan
where
tcriticalpoint = The critical time used in the calculation, s;
Vbath = The volume of the bathroom, m3;
Qfan = Airflow rate, m3/s.
The exhaust air thermal parameters for each process are not affected by the initial bathroom air thermal state after the critical time. Therefore, the critical time is determined by the volume of the bathroom and the airflow rate. During the shower time, the initial relative humidity and temperature of bathroom air are the same as those of the lounge. As the hot water flushes into the shower space, the space moisture content and temperature increase gradually with time before the critical time. With the change in airflow rate in the bathroom, the variation in bathroom temperature may present an increasing trend, as shown in curve 1 or curve 2 in Figure 2. If the airflow rate is low enough, the air achieves a saturation state quickly and then remains at the saturation state (increase along curve 1). Otherwise, the exhaust air keeps increasing in temperature and relative humidity with time (developing along curve 2). The final thermal parameters in the shower time are adopted as the initial values in the moisture removal time after the shower. In the calculation, the following assumptions are made:
(1)
The bathroom air is mixed perfectly (i.e., incoming air instantly and uniformly mixes with the existing air in the bathroom);
(2)
After heat and mass transfer, the thermal performance of the mixed air can achieve uniformity immediately;
(3)
The temperature of the hot water on the base floor is assumed to be constant during the shower.
Due to the coupled effect of heat and mass transfer, the air moisture content and temperature are calculated at the same time according to the Sherwood rule and Schmidt rule. The mass transfer coefficient and heat transfer coefficient are defined as follows [40]:
h = N u λ L equ
h d = S h D L equ
where
h = Heat transfer coefficient, W/(m2·K);
hd = Mass transfer coefficient, m/s;
Nu = Nusselt number (the ratio of convective-to-conductive heat transfer at a boundary in a fluid);
Sh = The Sherwood number (also named the mass transfer Nusselt number);
D = The mass diffusivity of moisture, m2/s;
λ = Thermal conductivity coefficient, W/(m·K);
Lequ = The qualitative length, m, which is calculated by Equation (4).
L equ = 4 F shower 2 ( L shower + W shower )
where
F shower = Area of shower space, m2;
L shower = Length of the shower space, m;
W shower = Width of shower space, m;
The mixed air is considered to flow along the shower space upward. Nu and Sh can be calculated by Equations (5)–(8) [41]:
If Re ≤ 5 × 10⁵, then
N u = 0.664 R e 1 / 2 P r 1 / 3 S h = 0.664 R e 1 / 2 S c 1 / 3
If Re > 5 × 10⁵, then
N u = ( 0.037 R e 0.8 870 ) P r 1 / 3 S h = ( 0.037 R e 0.8 870 ) S c 1 / 3
where
Re = The Reynolds number
Pr = The Prandtl number
Sc = The Schmidt number, which is defined as
S c = ν D
where ν = the dynamic viscosity, m2/s.
The mass diffusivity of moisture D [41] is calculated by Equation (8).
D = 0.22 × 10 4 P 0 P 1 ( T equ T 0 ) 3 / 2
where
P0 = 101,325 Pa;
T0 = 273 K;
P1 = The working pressure in the bathroom, Pa;
Tequ = The qualitative temperature, K, which is determined by the air thermal performance before and after heat transformation, as follows:
T equ = ( T exbath + T mixbath ) 2
where
T exbath = The exhaust air temperature of the bathroom, K;
T mixbath = The air temperature after the incoming air mixes with the existing air of the bathroom, K.
T mixbath is calculated according to the critical time for each section: shower time and the moisture removal time after the bath based on the conservation of mass and conservation of energy.
For the time t at t t critialpoint , based on the air moisture mass balance and air energy balance, the mixed air moisture content and air temperature are calculated as
d mixbath = ρ wina ( V bath Q fan t )   d bathini + Q fan t d outini ρ wouta ρ wina ( V bath Q fan t ) + Q fan t ρ wouta T mixbath = ρ wina ( V bath Q fan t )   T bathini + Q fan t T outini ρ wouta ρ wina ( V bath Q fan t ) + Q fan t ρ wouta
For the time t at t > t critialpoint ,
d mixbath = d outini T mixbath = T outini
where
d mixbath = The absolute air moisture content after the mixture process, kg/kg;
ρ wina = The density of indoor wet air, kg/m3;
ρ wouta = The density of inlet wet air, kg/m3;
V bath = The volume of the bathroom, m3;
Q fan = The airflow rate, m3/s;
d bathini = The initial absolute air moisture content for the bathroom air, kg/kg;
d outini = The initial absolute air moisture content for the inlet air, kg/kg;
T bathini = The initial temperature for the bathroom air, K;
T outini = The initial temperature for the inlet air, K;
t = Calculating time in each process, s.
After this step, d mixbath should be checked and compared with the saturation value corresponding to the temperature of T mixbath . The final d mixbath is determined by the function of min ( d mixbath , saturation value d s mixbath = f( T mixbath )).
To assess the effect of the mass transfer, the mass diffusion flux M vapor can be defined as follows:
M vapor = h d R vapor T equ ( P s ws P vapbatht )
where
R vapor = The molar gas constant of vapour;
P s ws = The saturation pressure at the shower hot water temperature, Pa:
P vapbatht = The partial pressure of water vapour, Pa.
The thermal performance of the bathroom air changes with time in the two ventilation processes (as shown in Figure 2). The recovered energy and the thickness of the water film on the floor are calculated with the analysis method of the finite element. The variations in exhaust air temperature and absolute moisture content are as follows:
  T exbath = T mixbath h ( T equ T water ) C p equ Q fan ρ wetequ d exbath = d mixbath Q fan ρ drya Δ t + M vapor F shower Δ t Q fan ρ drya Δ t
where
T water = The hot water temperature on the floor, K;
ρ wetequ = The density of the wet air in bathroom after the mixture process, kg/m3;
ρ drya = The density of the dry air in the bathroom, kg/m3;
Δ t = The calculating step or time interval in the finite element analysis (as shown in Figure 2), s;
After this step, d exbath should be checked and compared with the saturation value corresponding to the temperature of T exbath . The final d exbath must be less than or equal to the saturation humidity.
During the moisture removal process, the thickness of the water film on the floor is always checked to make sure that the purpose of ventilation is to dry the extra water on the floor. Due to heat and mass transfer, the water temperature and volume affect each other. In each calculation step, they are presented as follows:
d T water = M vapor γ Δ t h [ ( T exbathold + T mixbath ) 2 T waterold ] C p water ρ water δ old
  T water = T waterold d T water
d δ = M vapor Δ t ρ water   δ = δ old d δ
where
γ = The gasification latent heat of water, J/kg;
T waterold = The temperature of the water on the floor in the last calculation step, K;
δ old = The thickness of the water on the floor in the last calculation step, m;
T water = Hot water temperature on the floor, K;
M vapor = Mass diffusion flux, kg/(m2·s);
Δ t = Time step, s;
C p water = The water’s specific heat at constant pressure, J/(kg·k);
ρ water = The density of the water, kg/m3.
The bathroom ventilation for the moisture removal process is supposed to start at the end of the shower. The initial parameters of the moisture removal time are set to the same as those of the shower ending time. The recovered energy of the bathroom consists of two parts: recovered at shower time q res and recovered at moisture removal time q rem (i.e., q rebath = q res + q rem ). They are all calculated using the ε-NTU model [41] (the calculating steps are summarized in Figure 3). q res and q rem are calculated using Equations (17) and (18):
q res = 1 n [ ( m C p ) min ( T exbath T amb ) ε h Δ t ]
q rem = 1 n [ ( m C p ) min ( T exbath T amb ) ε h Δ t ]
where
ε h = The heat exchange efficiency;
( m C p ) min = The minimum heat capacity, which is defined as Equation (19).
m = The mass flow rate of working air, kg/s.
( m C p ) min = min ( ρ sup Q fan C p sup , ρ exbath Q fan C p exbath )
where
ρ sup = The density of supplied fresh air, kg/m3;
ρ exbath = The density of exhaust air from the bathroom, kg/m3;
C p sup = The specific heat of supplied fresh air, J/(kg·k);
C p exbath = The specific heat of exhaust air from the bathroom, J/(kg·k);

2.2. Kitchen Heat Recovery Model

Considering differences in cooking methods, it is difficult to develop a general model to simulate the thermal process of the exhaust air. To simplify the kitchen heat recovery analysis, based on the study of [42], the temperature of exhaust air in the kitchen with a gas cooker with 5 kw of power varies in the range from 31 to 33.6 °C. We assume that the humidity and temperature of kitchen exhaust air are constant. Moreover, this application scenario in the reference is similar to the real operation condition. The kitchen heat recovery qrek can be estimated as
q rek = 1 n [ ( m C p ) min ( T exkic T amb ) ε h Δ t ]
where
q rek = The recovered energy from kitchen exhaust air, J;
T exkic = The temperature of the kitchen exhaust air, K.

2.3. Daily Space Heating Heat Recovery Model

The energy simulation tool of AccuRate Home can automatically adjust window openings to supply sufficient fresh air to keep the indoor environment thermal comfortable. Although it may be possible to utilize space heating/cooling based on the season variations, an extra heating or cooling supply may not be necessary as natural ventilation may make the indoor environment fall within the comfortable range due to the temperature difference between the indoors and outdoors. This means that not all the air-conditioned zones need mechanical ventilation at the current calculating step. Therefore, we made some assumptions for the daily space heat recovery model:
(1)
The building recovery energy, including the energy recovery from the bathroom and kitchen, is used to pre-heat the supplied fresh air;
(2)
The total fresh airflow rate is assumed to be equal to the total exhaust air at the current calculating step;
(3)
The fresh air requirement for each conditioned zone is calculated based on its volume under the air change rate.
Based on these assumptions, the simplified model of the daily space heating heat recovery is also proposed based on the theory of the ε-NTU model for the multi-zone building. The recovered energy q red is calculated separately for each conditioned zone at each time step:
q red = 1 a 1 n [ ( m C p ) min ( T exza T amb ) ε h Δ t ]
where
a = The total number of condition zones at the current time step;
n = Time steps;
m = Mass flow rate of air, kg/s;
Cp = Specific heat of air, J/(kg·k);
ε h = The heat exchange efficiency;
Δ t = Time step, s;
T exzm = The temperature of zone a ;
T amb = The ambient temperature, K.

3. Case Study

To evaluate the heat recovery model, a typical single-storey house (as shown in Figure 4) was selected for the case study under different climate zones in Australia. The house has three bedrooms, a kitchen/living area, a bathroom, and a toilet. The external brick veneer wall is insulated with R1.5, and the 13 mm plasterboard ceiling is insulated with R3.5. All the windows are awning aluminium windows with single glazing, and three exhaust fans (sealed) are installed in the kitchen, bathroom, and toilet, respectively. To analyse the energy performance, the space heating/cooling load, recovered energy, and other energy consumption are calculated by simulation.
For the case study, some assumptions are made. The hot water on the bathroom base floor is set at a constant 308 K, which is also used as the initial value for the process of moisture removal. The heat and mass transfer occurred at the shower base surface and surfaces of the shower screen and surrounding wall of 1.7 m height above the floor during the shower. Considering the effects of gravity and the diameter of a water drop, the heat and mass transfer is assumed to occur at the shower base surface and the surrounding wall surface 1.0 m above the floor, and the average thickness of the water film is 0.2 mm after the shower. For the kitchen heat recovery model, the exhaust air temperature and relative humidity ψ are set at 305 K and 85%, respectively. The other specifications are listed in Table 1.

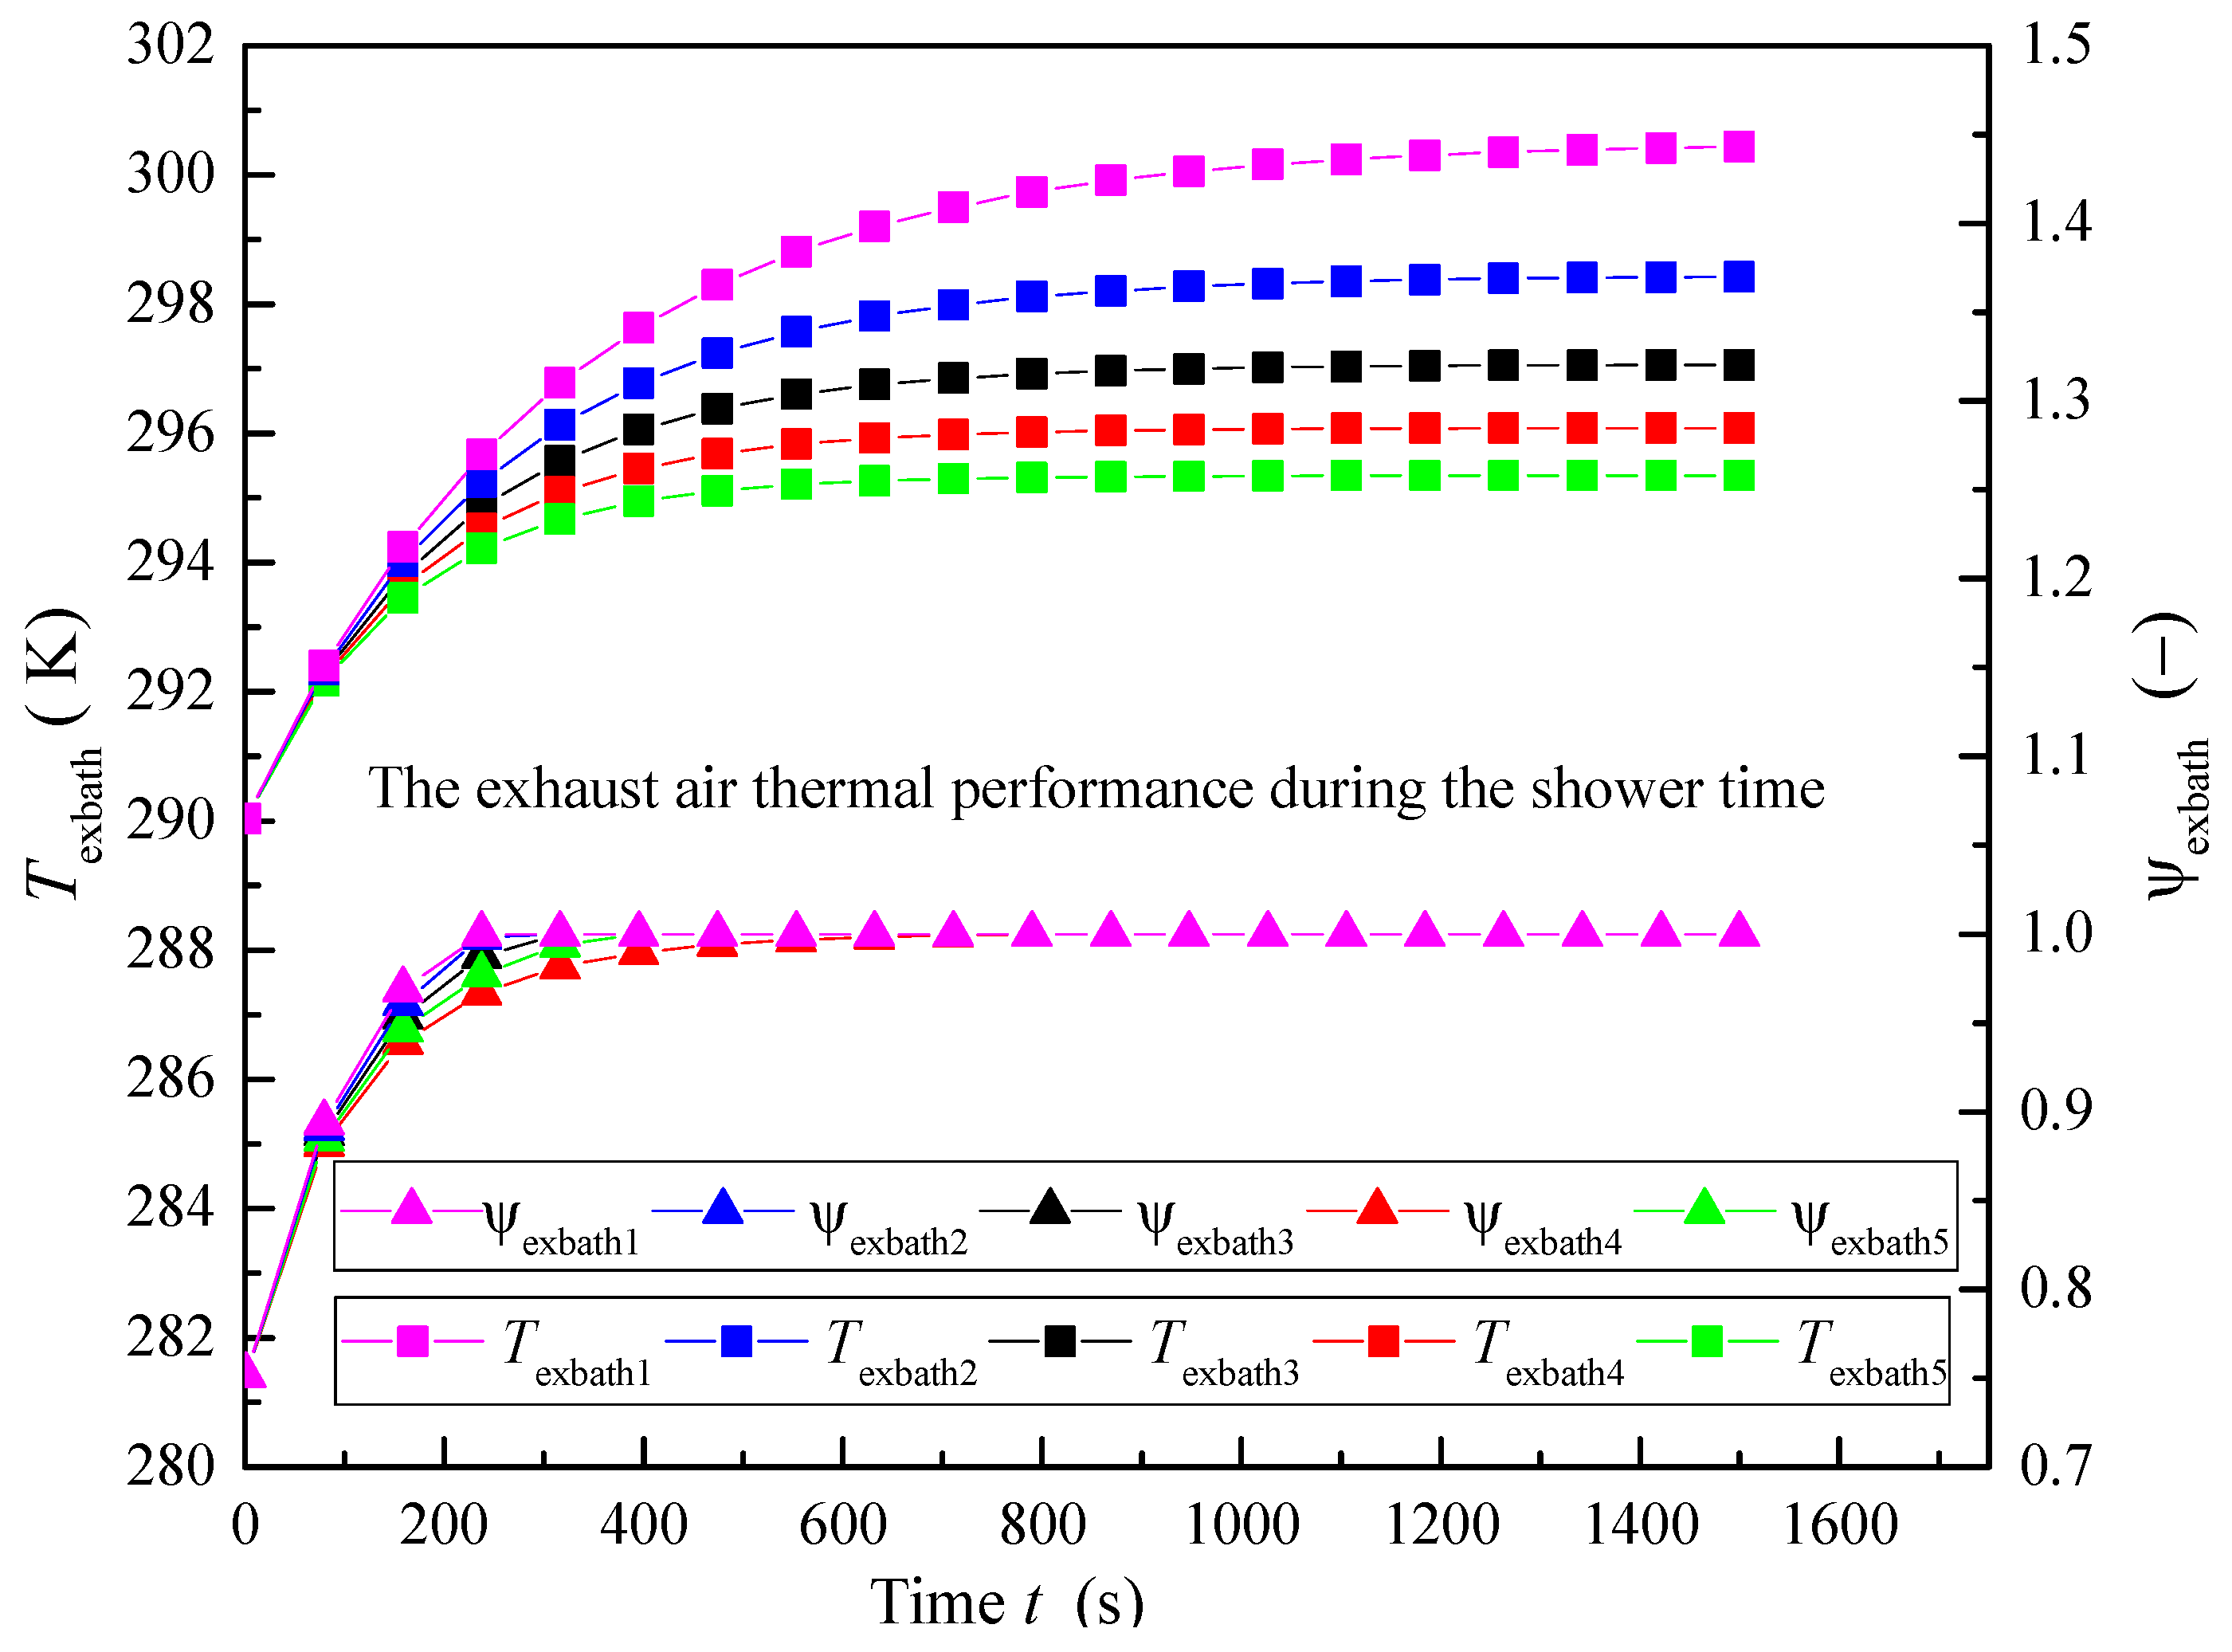
3.1. Evaluation of the Bathroom Exhaust Air Thermal Performance Prediction Model

Heat recovery efficiency varies with the heat exchanger material and airflow parameters [6]. To simplify the heat exchanger’s model, the ε-NTU method [43] is adopted (as described above), and a heat recovery efficiency of 0.7 [10] is applied for the case study. The thermal state of kitchen exhaust air is assumed to remain constant during cooking. Therefore, only the thermal performance of the exhaust air of the bathroom is evaluated by the proposed novel model considering the variation of water film on the bathroom base floor. In this section’s study, the ambient temperature is set as 280 K to verify the proposed model partly without operating in the whole-building energy system.
The bathroom thermal performances during the shower and the moisture removal processes are calculated separately by transferring the final calculation results under different operating conditions. Table 2 lists all the specific parameters corresponding to each operating condition.
For the function rooms, such as the bathroom and kitchen, the temperature of their exhaust air not only affects the recovered energy but also impacts indoor airflow. To verify the proposed heat recovery model and investigate the effect of mechanical airflow rate on the heat and mass transfer, the mechanical airflow rate is changed from 169.2 m3/h to 507.6 m3/h for the bathroom with a certain volume of 29.5 m3. Figure 5 shows the variation of exhaust air thermal performance with time in the shower process. It can be seen that the temperature and relative humidity of the exhaust air all increase with time. With the increase in the airflow rate, the heat transfer at the wet surface of the water film is enhanced, and the exhaust air temperature declines significantly. Meanwhile, the air temperature difference also causes a change in the saturated absolute moisture content. As the mechanical airflow rate is quite low, the bathroom temperature can achieve a comfortable environment range (300~302 K), with the shower water remaining at the temperature of 311.15 K. When the mechanical airflow rate increases from 169.2 m3/h to 507.6 m3/h, the rising rates for exhaust air temperature and relative humidity decrease gradually, and the exhaust air temperature drops from 300.45 K to 295.3 K. The bathroom environment with a low airflow rate can achieve a saturated state faster compared to those with the operating condition of a high airflow rate. Based on the simulation results, it is suggested that the mechanical airflow rate during shower time should be minimized at the lowest level of oxygen demand possible to achieve a comfortable environment temperature.
For the bathroom, the second ventilation process is to remove the extra moisture and dry the water on the floor and walls after the shower. In the proposed model, two options (mechanical ventilation only and mechanical ventilation plus an air heater) are analysed. Mechanical ventilation plus an air heater drives the liquid water to evaporate to moisture quickly and speeds up the moisture removal process. This option is popular in commercial building operations and is also used in residential buildings. The extra energy consumption to power the air heater reduces the recovered energy and can be calculated as follows:
q ahbath = 1 n [ ( m C p ) min ( T ahset T exza ) Δ t ]
where
q ahbath = The extra energy consumption caused by the air heater;
T ahset = The set temperature of outlet air of the air heater, K.
When extra energy is required for the air heater, it is represented as a negative value. The thermal parameter variations of exhaust air and water film on the floor with time under the two options are shown in Figure 6 and Figure 7. With mechanical ventilation only, the exhaust air is always in a saturated state. This also means that the ventilation has little impact on the liquid water evaporation, especially for operating at low mechanical airflow rate conditions. With an increase in the airflow rate, the liquid water evaporates to moisture more quickly. Meanwhile, the exhaust air temperature also decreases more quickly, which can affect the mass transfer efficiency caused by the variation of saturated moisture content. Although the mass transfer efficiency is different, the final thickness of the water film on the floor achieves the same or similar value. The reason for the phenomenon can be explained by the coupled effects of heat and mass transfer. The heat transfer and mass transfer develop in the reverse directions according to the thermodynamic principle when only mechanical ventilation is applied. The enhanced heat transfer efficiency causes a weak mass transfer. Due to the fixed thermal performance of bathroom inlet air, the final exhaust air temperature and water film temperature can only, at most, achieve the inlet air temperature without internal heat sources, and the final thickness of the water film is similar to each other. Based on the analysis, it shows that within 35 min, the ventilation without the air heater can only remove the air moisture, and the thickness of the water film changes from 0.2 mm to 0.1943 mm.
As shown in Figure 7, the exhaust air and water film thermal performance present a different variation tendency when the air heater is applied for the moisture removal ventilation process. Due to the isohumid heating process in the air heater, the relative humidity of the mixture air in each calculation step decreases to quite a low value, which enhances the liquid water evaporation faster than the mechanical ventilation process without the air heater. From the simulation results, the relative humidity may be lower than 1% after the first 60 s of ventilation. The supplied additional heating can be changed with the setting temperature of the air heater exhaust air. Therefore, a large airflow rate means more heating is supplied from the air heater. Because of the continuous heating supply from the air heater, the thickness of the water film declines linearly with time, and the decline rate remains consistent with the outlet air’s relative humidity in the air heater. After about 35 min of ventilation, the final thickness of the water film can drop from 0.2 mm to 0.145 mm as the airflow rate increases to 507.6 m3/h. When reducing the airflow rate, the changing rate of the exhaust air temperature and the thickness of the water film decreases gradually. It is assumed that the final exhaust air temperature at most achieves the set temperature point of the air heater as long as the ventilation time is long enough. With the option of the air heater applied, the heat transfer efficiency and mass transfer efficiency are all enhanced when the airflow rate increases. From Figure 7, we can see there exists a turning point for each tested condition. Before the turning point, the water film temperature is greater than the corresponding wet bulb temperature. The temperature difference between water film and bathroom air cannot supply enough heat to meet the evaporating energy demand, which causes the water film temperature to decrease to enlarge the temperature difference because of the cooling effect of evaporation. As the water film temperature is low enough, the corresponding saturated moisture pressure is equal to the moisture partial pressure of the bathroom. The system achieves the turning point, and there is no liquid evaporation. For the thermodynamic system, the continuous energy transferring to the water also drives the water film temperature to increase to enhance the mass transfer efficiency. Therefore, the liquid water evaporation rate can keep a constant value, while the water film temperature increases with time at the later ventilation process. From the comparison study between the two options, simulation results demonstrate that the proposed model can be used to predict the mechanical ventilation process of the bathroom.
To evaluate the recovered energy with the proposed model, the heat recovery subroutines of the bathroom and kitchen are tested under different operating conditions (as shown in Figure 8). For the bathroom, the recovered energy in the moisture removal process is a negative value due to the large amount of energy used by turning on the air heater. As the airflow rate is increasing, there is little contribution to the improvement in the recovered energy. However, the air heater is a key measure to improve moisture removal efficiency, especially for houses in humid climate zones. By simulation, it can be found that the total recovered energy can reach about 12 MJ/h when only mechanical ventilation is used. Turning on the air heater causes a drop of 2.2~5.0 MJ/h in the total recovered energy under the assumed operation conditions.
To further estimate the importance of the proposed mode, the simulated results are also compared to those of the fixed operating parameters in the shower and moisture removal processes. The temperature of bathroom exhaust air is supposed to be fixed at 25 °C. Nevertheless, the thickness of the water film on the bathroom floor and walls is changed from 0.2 mm to 1.4 mm to analyse the effect on the recovered energy. All the operation conditions and simulated results are listed in Table 3 and Table 4.
It can be found by comparison that the thermal state affects the recovered energy significantly. With an increase in the fresh airflow rate, the proposed thermal model presents relatively steady variations. With the exhaust air temperature in the shower and moisture removal processes being fixed separately, the difference in total recovered energy between these two modes ranges from 18% to 47% (as shown in Figure 9), which is high enough to affect the accuracy of the calculation. Therefore, it is necessary to estimate the exhaust air thermal parameters considering both the heat and mass transfer processes during mechanical ventilation.
Figure 10 shows the effect of water film thickness on the recovered energy of the bathroom. The effect of water film thickness can be ignored during the shower time as the relative humidity rapidly rises to 100%, and the exhaust air reaches a saturated state. The latent heat of vaporization is much larger than the sensible heat, which simultaneously affects the heat and mass processes. Therefore, the recovered heat in the moisture removal time increases with the water film. The recovered energy can be improved by merely 1.7% when the water film thickness changes from 0.0002 m to 0.0014 m. The water film temperature is relative to the efficiency of the surface heat transfer and the rate of water evaporating. In the moisture removal time, the enhanced heat transfer weakens due to the increase in the evaporating rate caused by a steady water film temperature as the water film thickness increases. In the proposed model, the water film thickness can be fixed at some certain value, but it should be made sure that the water on the bathroom floor and walls does not dry out in the limited moisture removal time.

3.2. Comparison between the Existing Engine and New Engine by Case Study

The proposed heat recovery model was coded and implemented into the Chenath engine. To assess the whole building’s energy consumption with the proposed model, the specific operation conditions (without the air heater) of the building are listed in Table 5. Considering the corresponding parameters varied in the reasonable range, the air charge rate for each conditioning room changes from 0.5 to 1.5 ACH (Air Changes per Hour). With the purpose of comprehensively evaluating the impact of heat recovery on the whole building’s energy consumption, four operation modes are considered:
  • No heat recovery and no additional mechanical ventilation (C-EX);
  • No heat recovery with all additional mechanical ventilation (C-N2, 5, 8, 11, 14, 17, 20, 23, and 26);
  • Only the bathroom and kitchen with heat recovery with all additional mechanical ventilation (C-N3, 6, 9, 12, 15, 18, 21, 24, and 27);
  • The whole-time heat recovery with all additional mechanical ventilation (C-N4, 7, 10, 13, 16, 19, 22, 25, and 28).
The case study is conducted for different Australian climate zones (Hobart, Melbourne, Sydney, and Brisbane). With an air change rate of 0.5 ACH, the energy demand for space heating and energy star rating for the four cities are shown in Figure 11. As expected, the energy requirement for space heating varies from city to city as the outdoor winter temperature differs. To maintain indoor thermal comfort, the additional mechanical ventilation causes the total heating demand to increase due to the extra fresh air load, which is about 5.9~43.9 MJ·m−2·year−1. The maximum increase in the heating energy requirement is 89.3% for the house in Brisbane. Meanwhile, the greatest house star rating drop is about 1.0 stars by the fresh air load. With the increase in the average winter temperature from city to city, the impact of the fresh air load becomes weaker for the decrease in the temperature difference between indoors and outdoors. Although the recovered energy from the bathroom and kitchen can save about 0.1~3.1 MJ·m−2·year−1, it has quite little effect on the house rating band. However, for daily time heat recovery, the recovered energy can reach up to 12.9 MJ·m2·year−1 and improve the house star rating by about 0.4 under the conditions of C-N11 and C-N12.
From the above energy demand comparison of different climate zones, the house in Hobart presents a significant variation in the annual heating load due to having the coldest winter. To make the difference in energy demand more clear, Hobart is selected to explore the effects of air charge rate on the heating demand and the house rating band. The comparisons of energy demand with different air change rates of daily time heat recovery and bathroom and kitchen heat recovery are shown in Figure 12 and Figure 13, respectively. The above two variables are relative to the fresh air supply. Therefore, the variation of whole-building energy consumption with the above two variables presents a similar trend. The fresh air load increases the house heating demand, decreases the house star rating, and rises quickly with the high ventilation rate, especially when increasing the air change rate of the daily time heat recovery. When the air change rate in the daily time changes from 0.5 to 1.5 ACH, the fresh air load increases by about 43.9~123.7 MJ·m−2·year−1 and causes the star rating to drop by about 1.7 stars. The heat recovery from the bathroom and kitchen is limited and only improves the star rating by about 0.1 stars. However, due to the long duration of the daily time ventilation, the recovered energy is much larger compared with that from the bathroom and kitchen and increases the house star rating by about 0.4~0.6 stars depending on the ventilation rate. From the above analysis of the variation of the energy demand, it can be seen that the daily time ventilation heat recovery has a more important impact on the building’s energy savings.

4. Conclusions

This study proposed a detailed thermal performance prediction model for bathroom exhaust air based on the coupled heat and mass transfer theory. Following the ε-NTU method, this study also built a whole house energy recovery system model, including the bathroom heat recovery, kitchen heat recovery, and daily time space heating recovery. The proposed model is coded and implemented into the AccuRate Home Chenath engine. In addition, the proposed heat recovery model was evaluated based on the bathroom and the whole building by varying the air charge rates in daily time and in different climate zones. The main conclusions that can be drawn from the study are as follows:
(1)
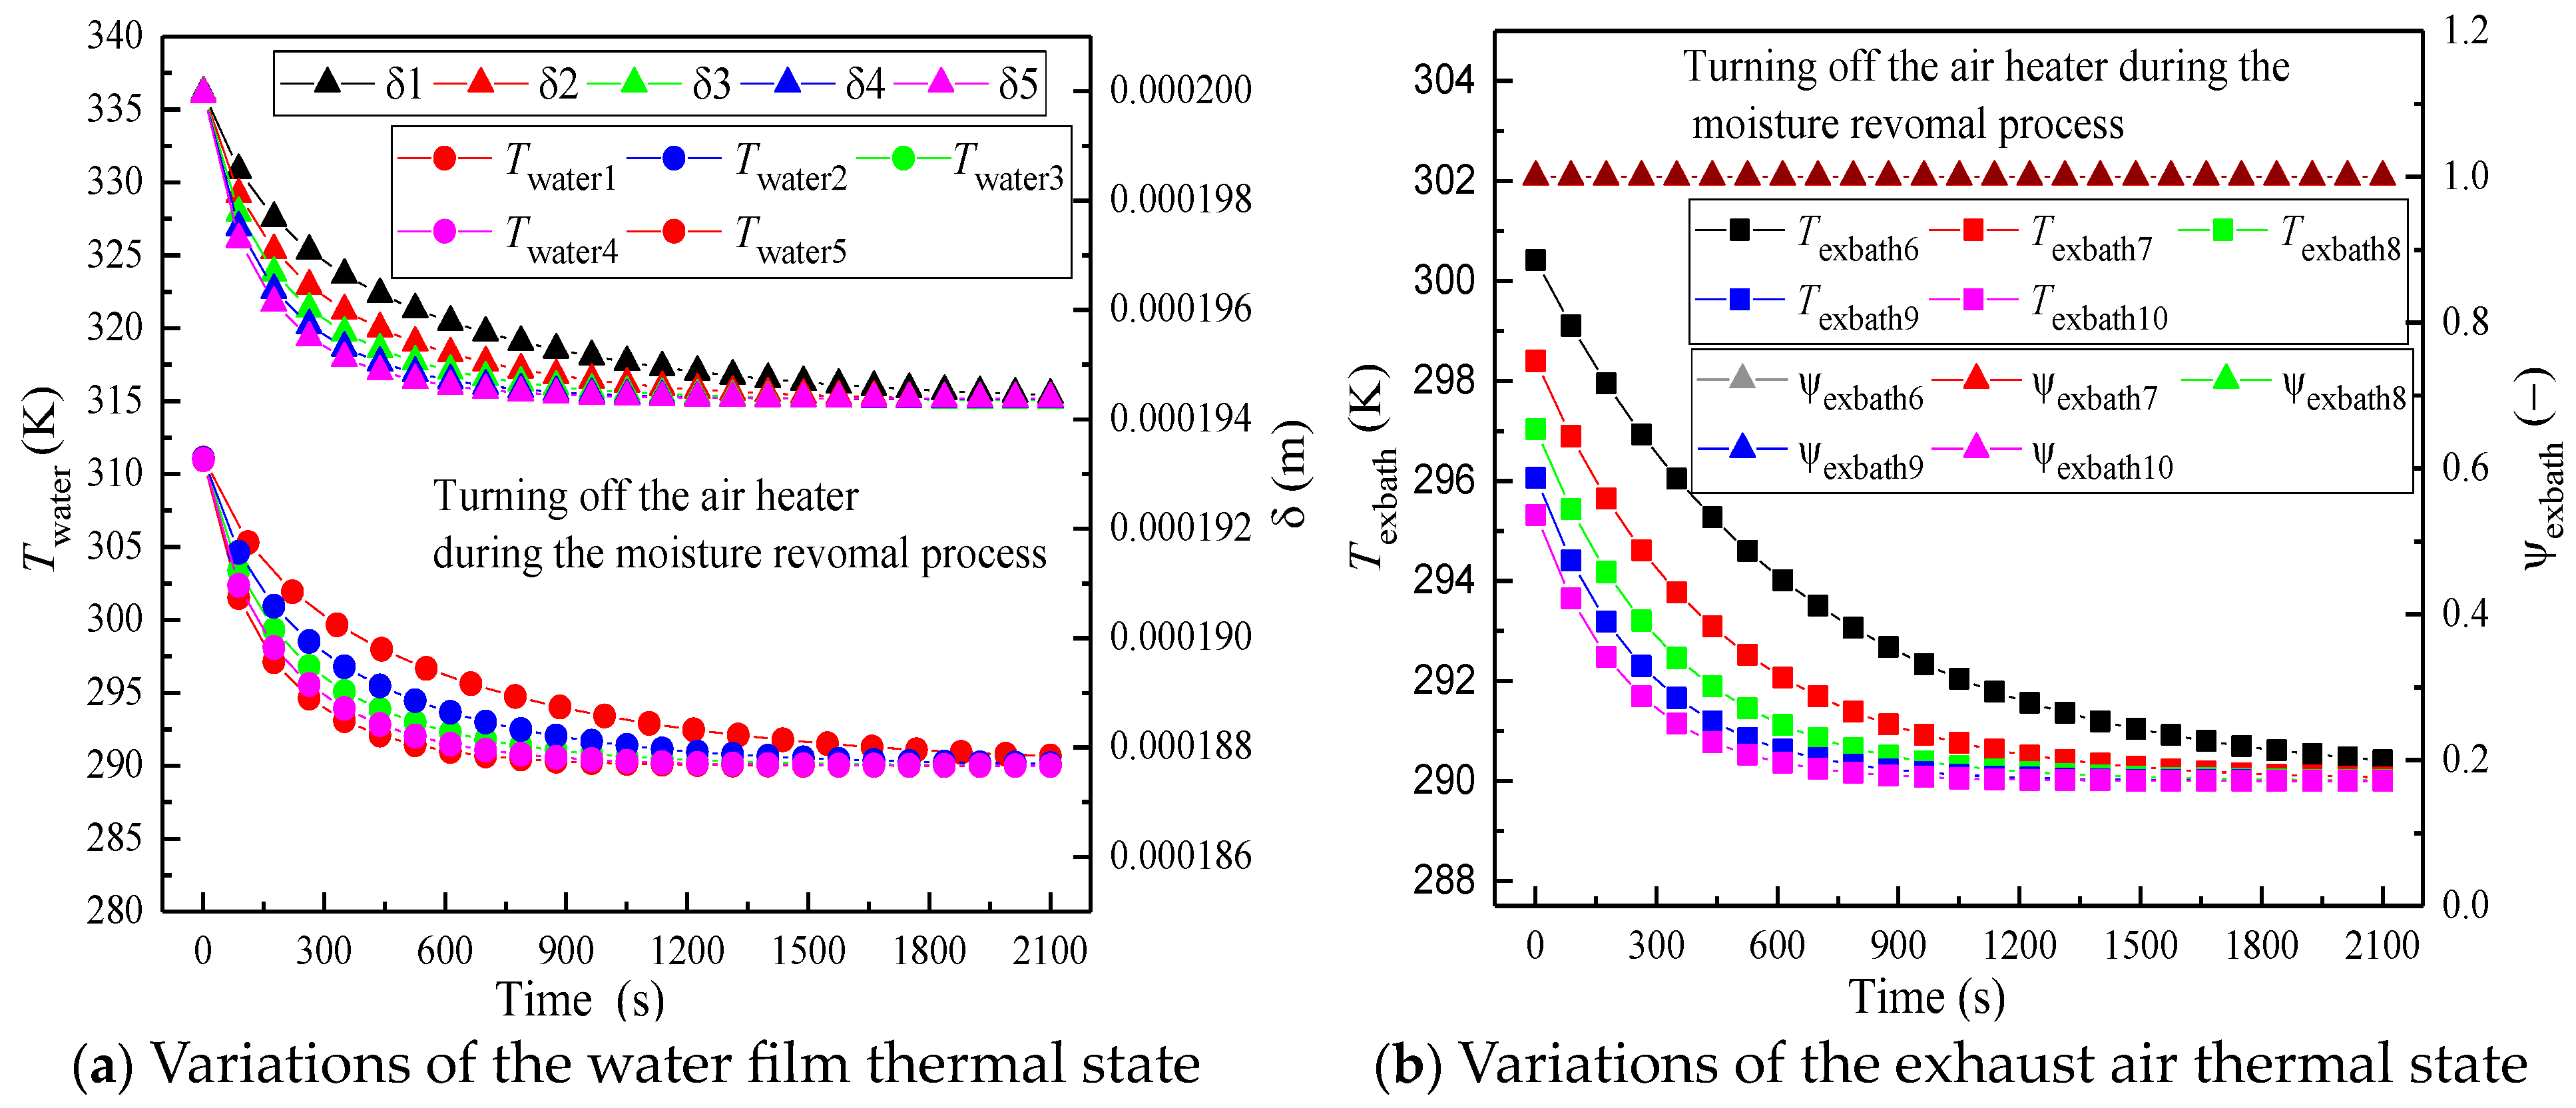
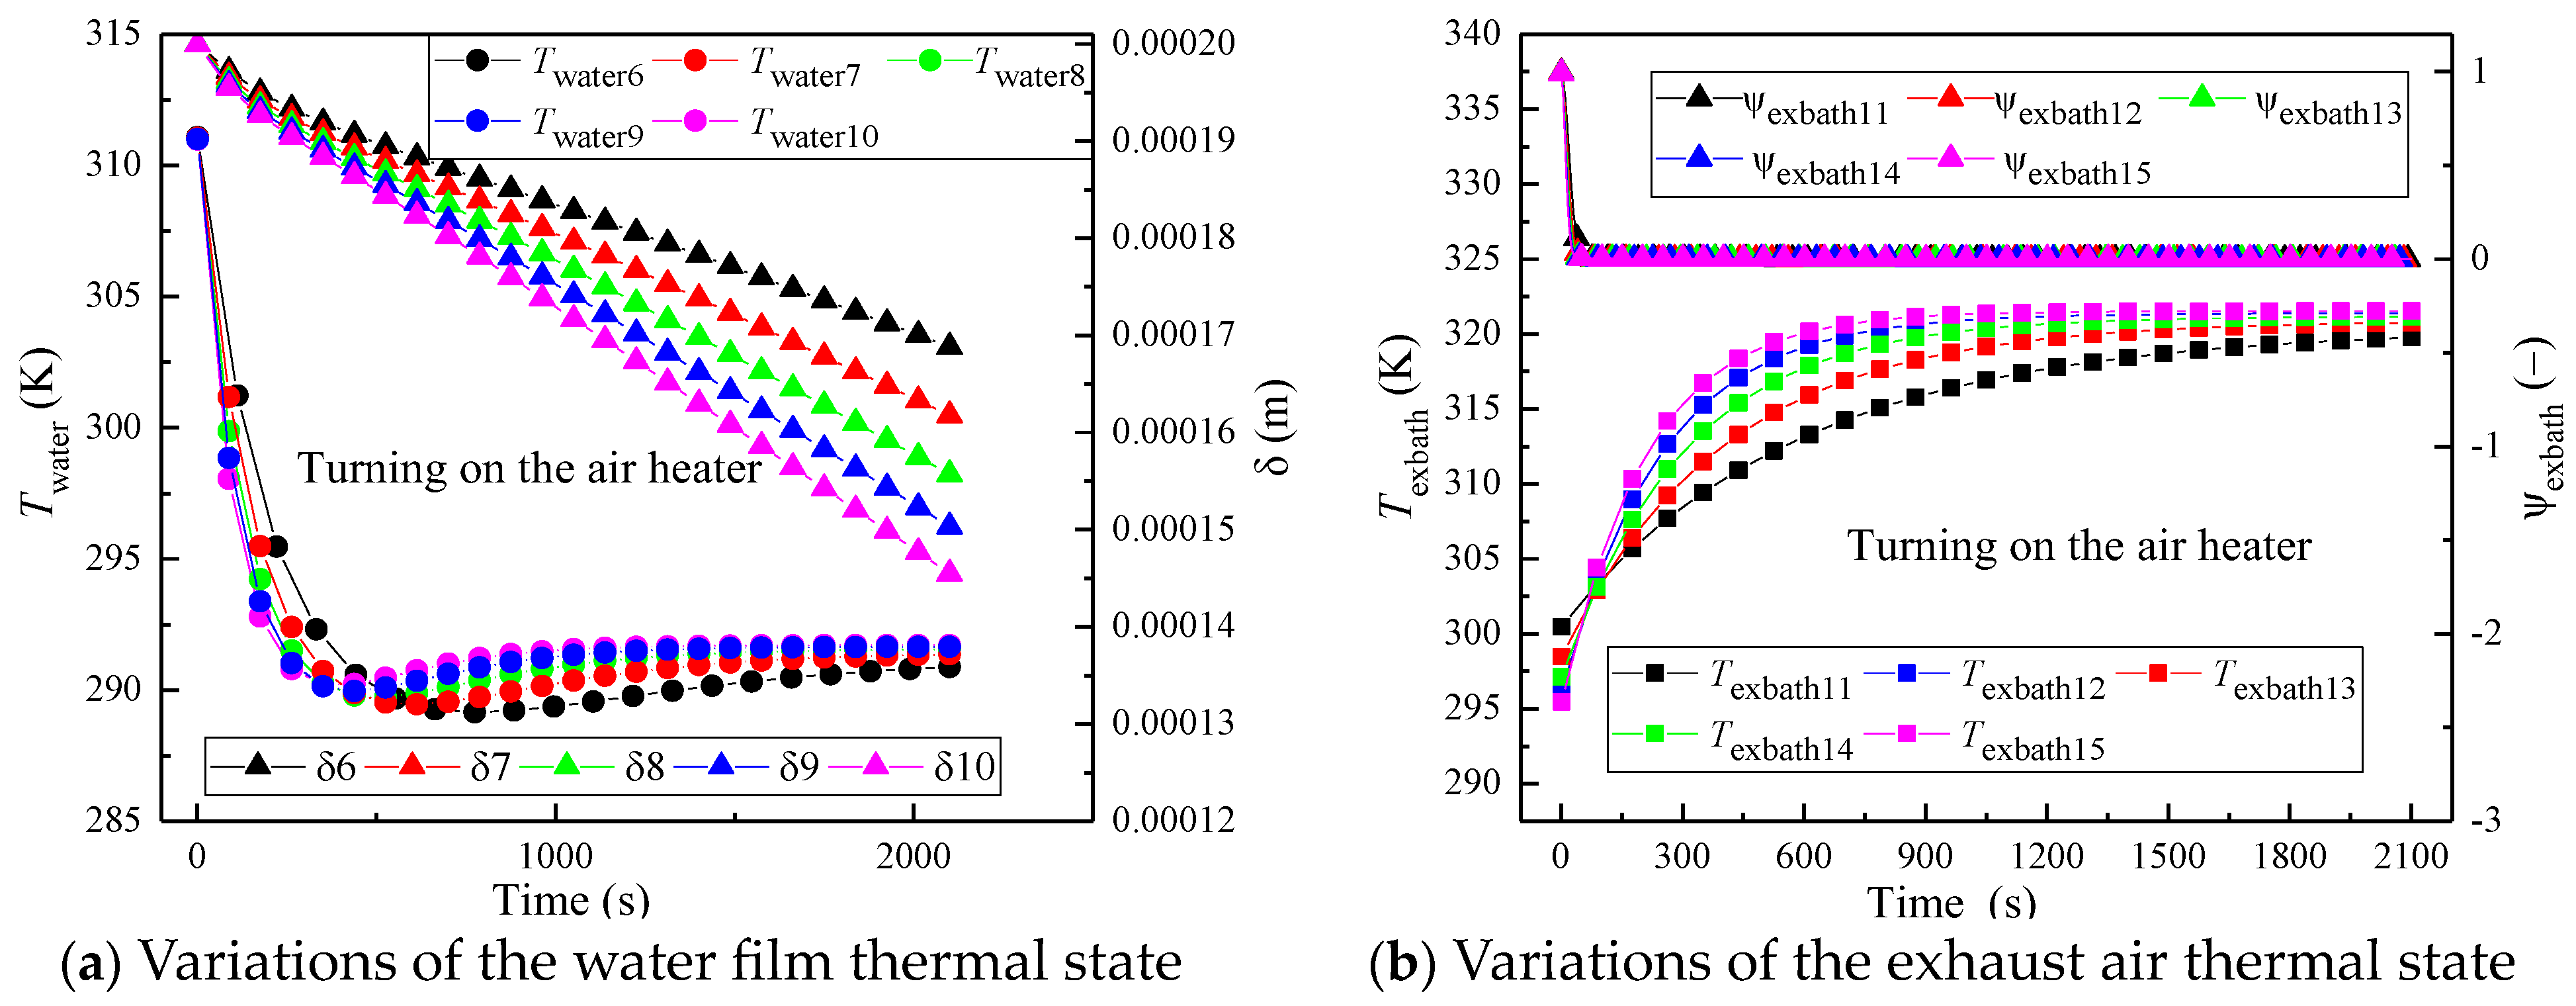
The simulation results show that this new proposed model can be used to estimate critical parameters, such as the turning point of the water film temperature and the final thermal performance of the exhaust air;
(2)
With the bathroom inlet air temperature and humidity given without turning on the air heater, only changing the air charge rate in the bathroom has little effect on drying the wet floor. It is necessary to install the additional air heater to achieve a higher efficiency of the floor water evaporation, which can be improved by about 24.7% under the airflow rate of 507.6 m3/h;
(3)
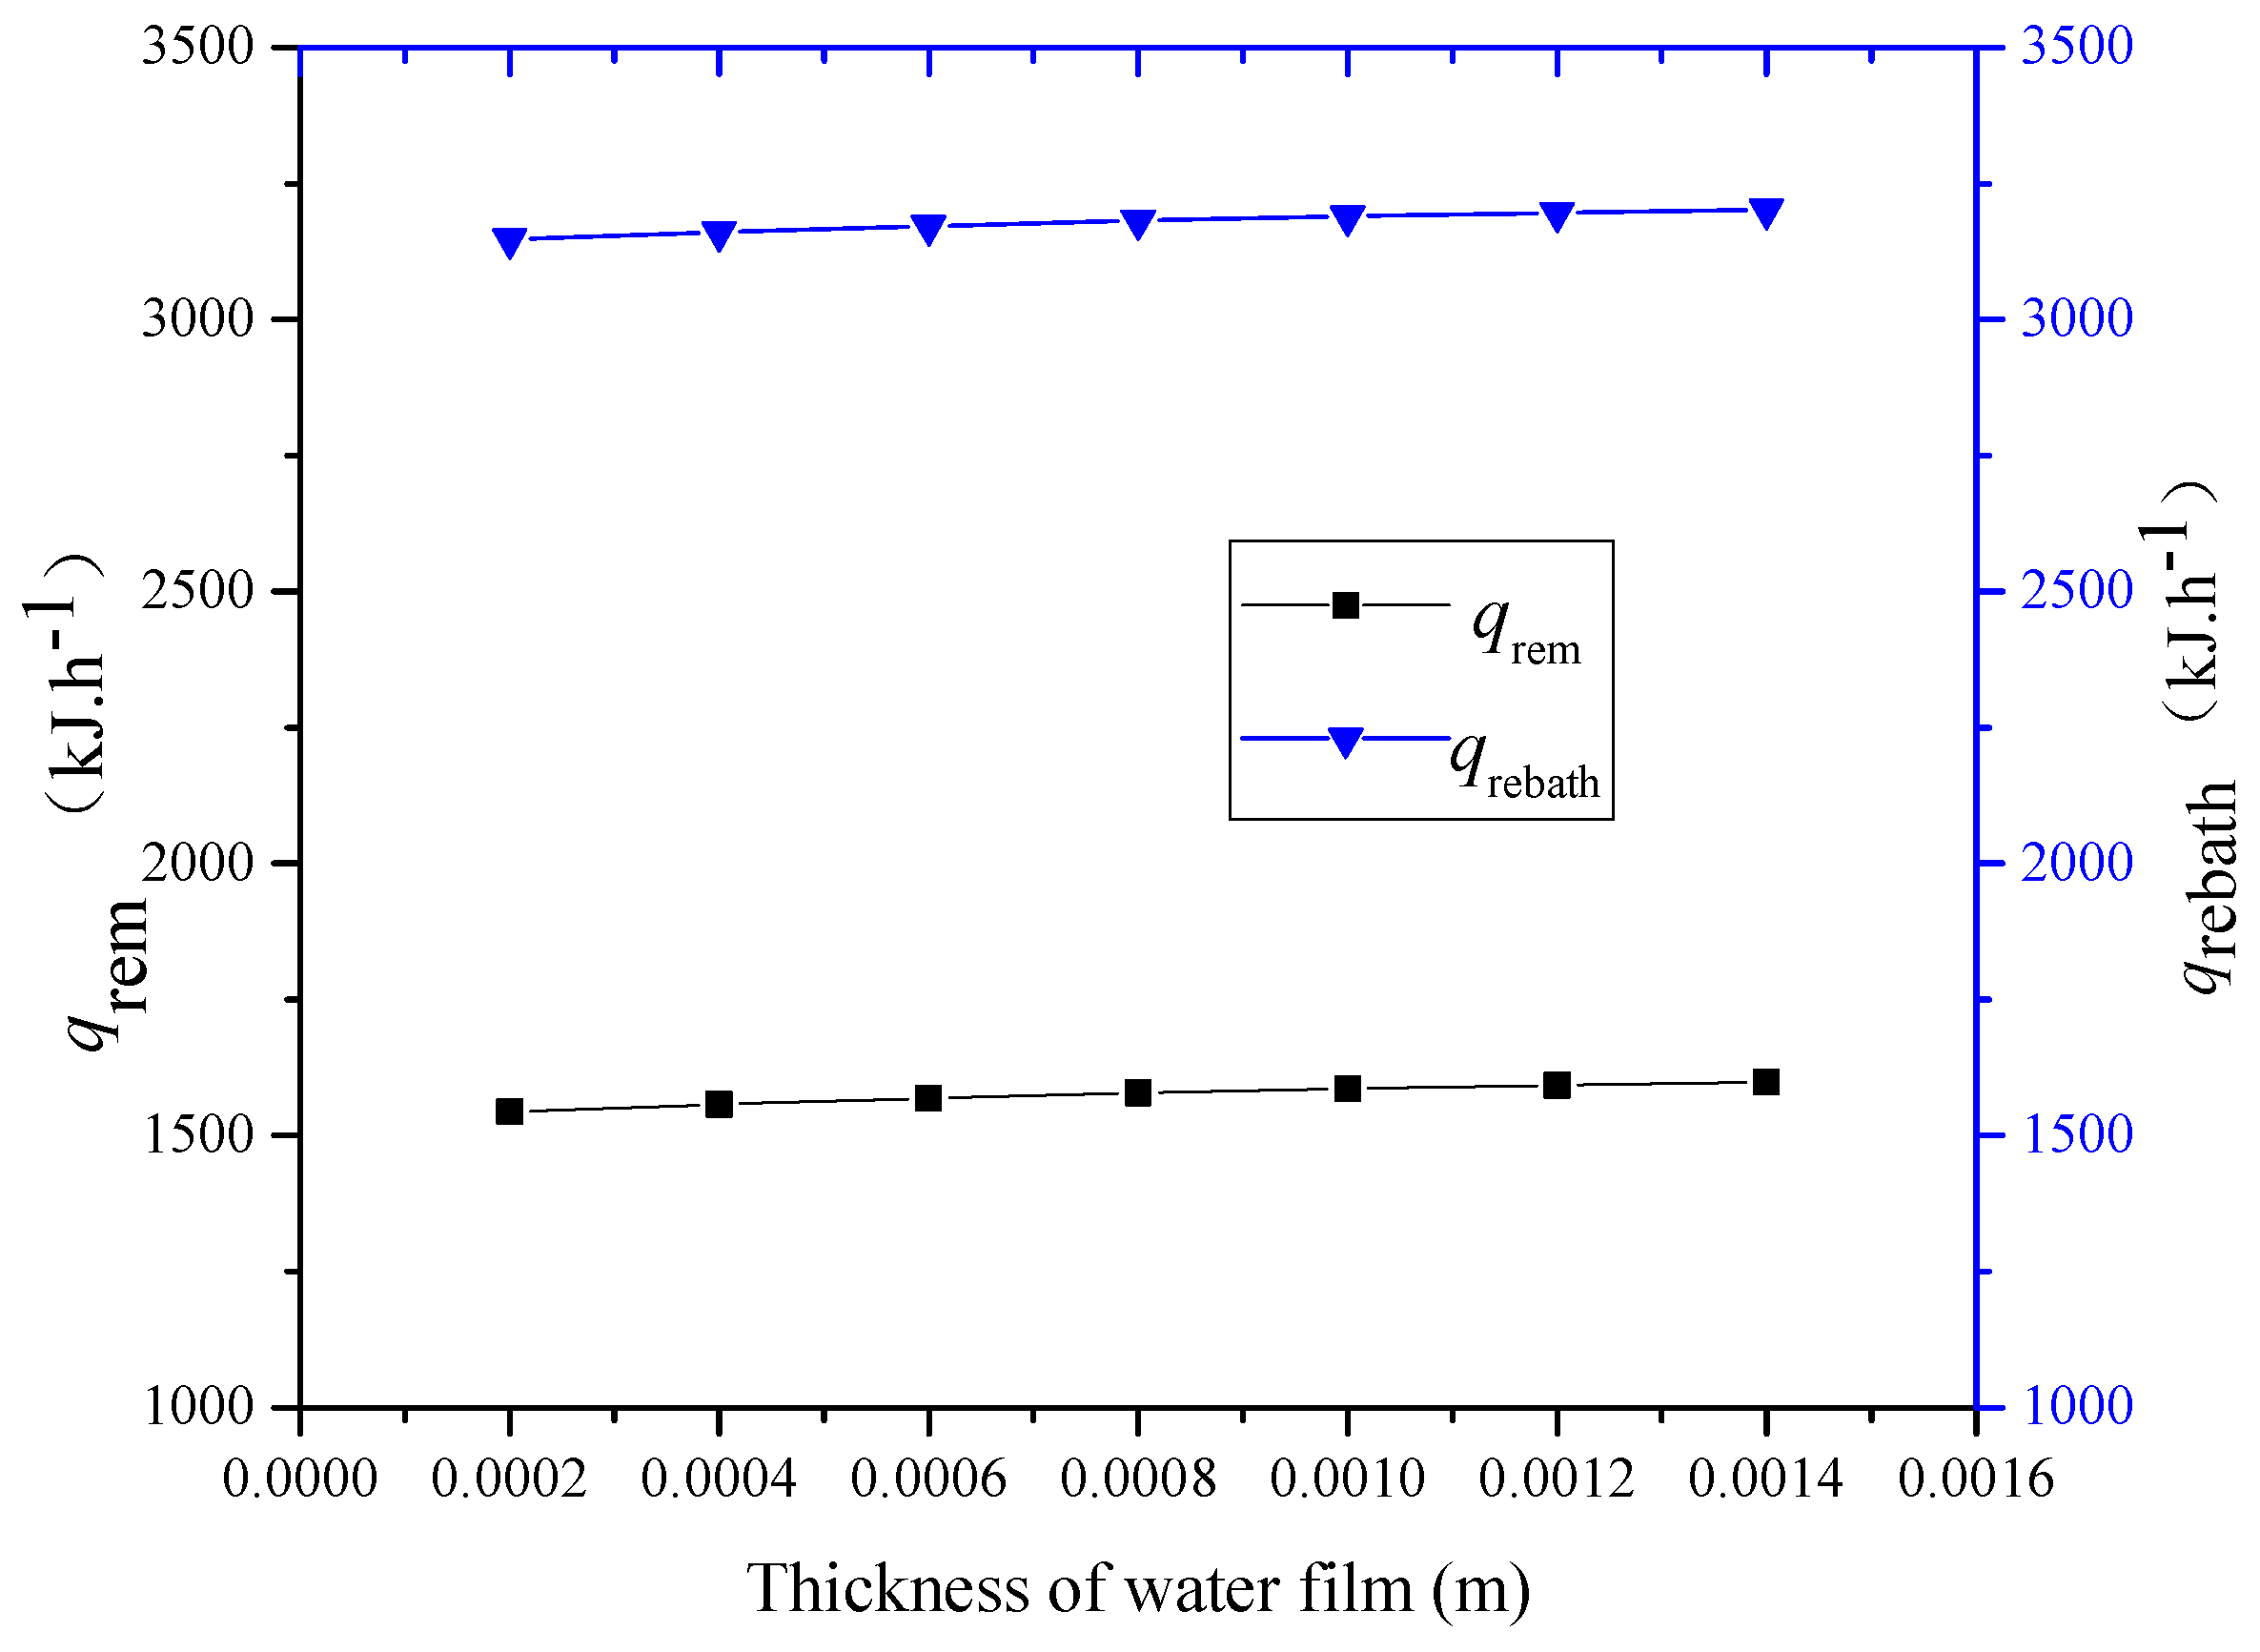
Although the heat recovery from the bathroom and kitchen is not significant due to the short operation time, the variation in the thickness of the water film on the bathroom floor plays a critical role in determining whether the wet floor can be dried and the time to remove all the floor water by ventilation. It is reasonable to suggest that the proposed detailed bathroom exhaust air thermal performance model can be used to determine the dehumidification endpoint;
(4)
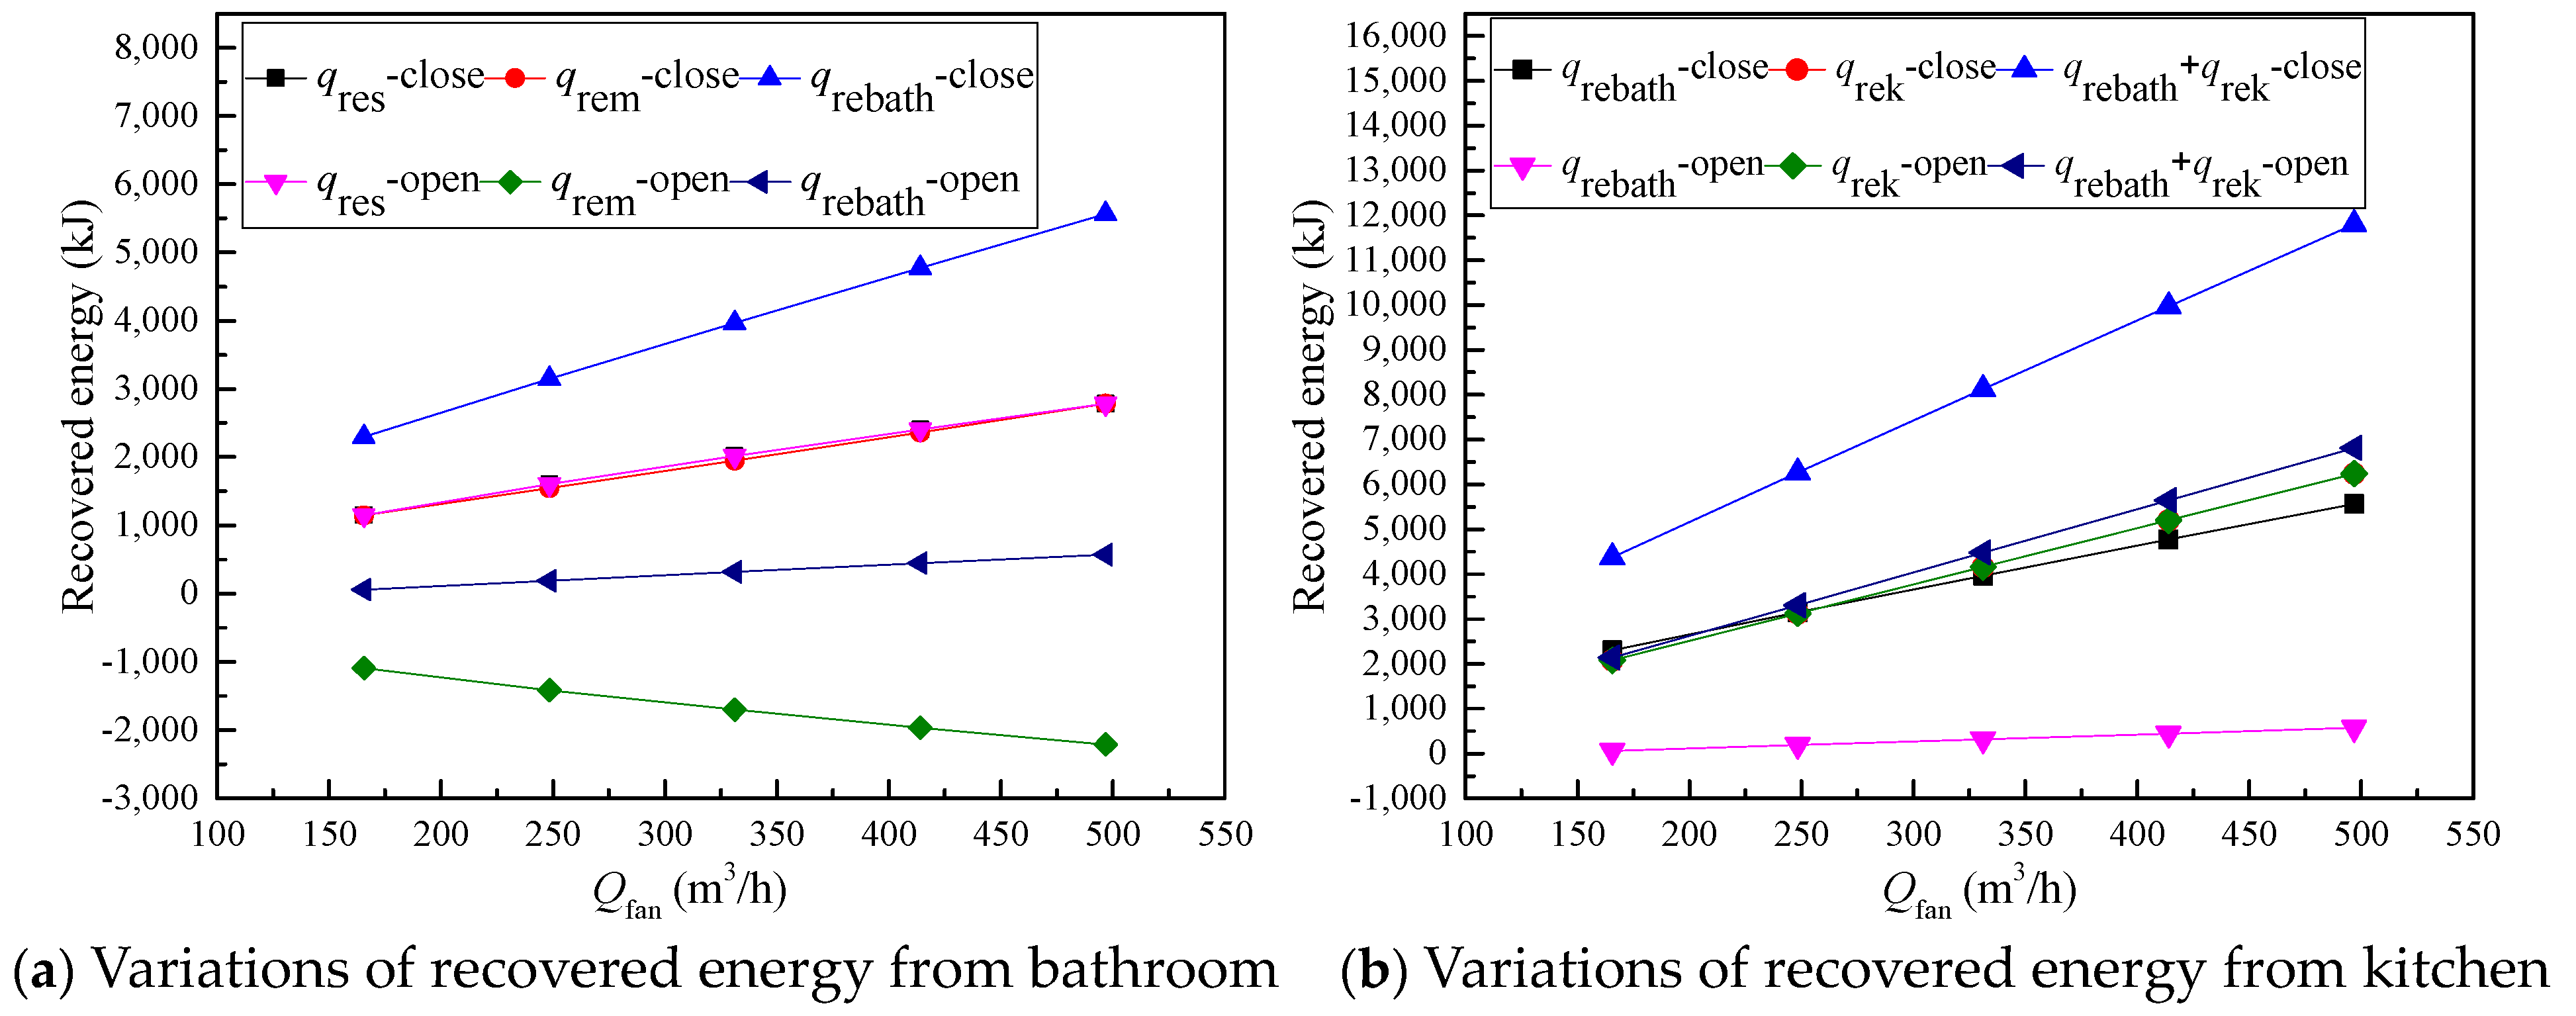
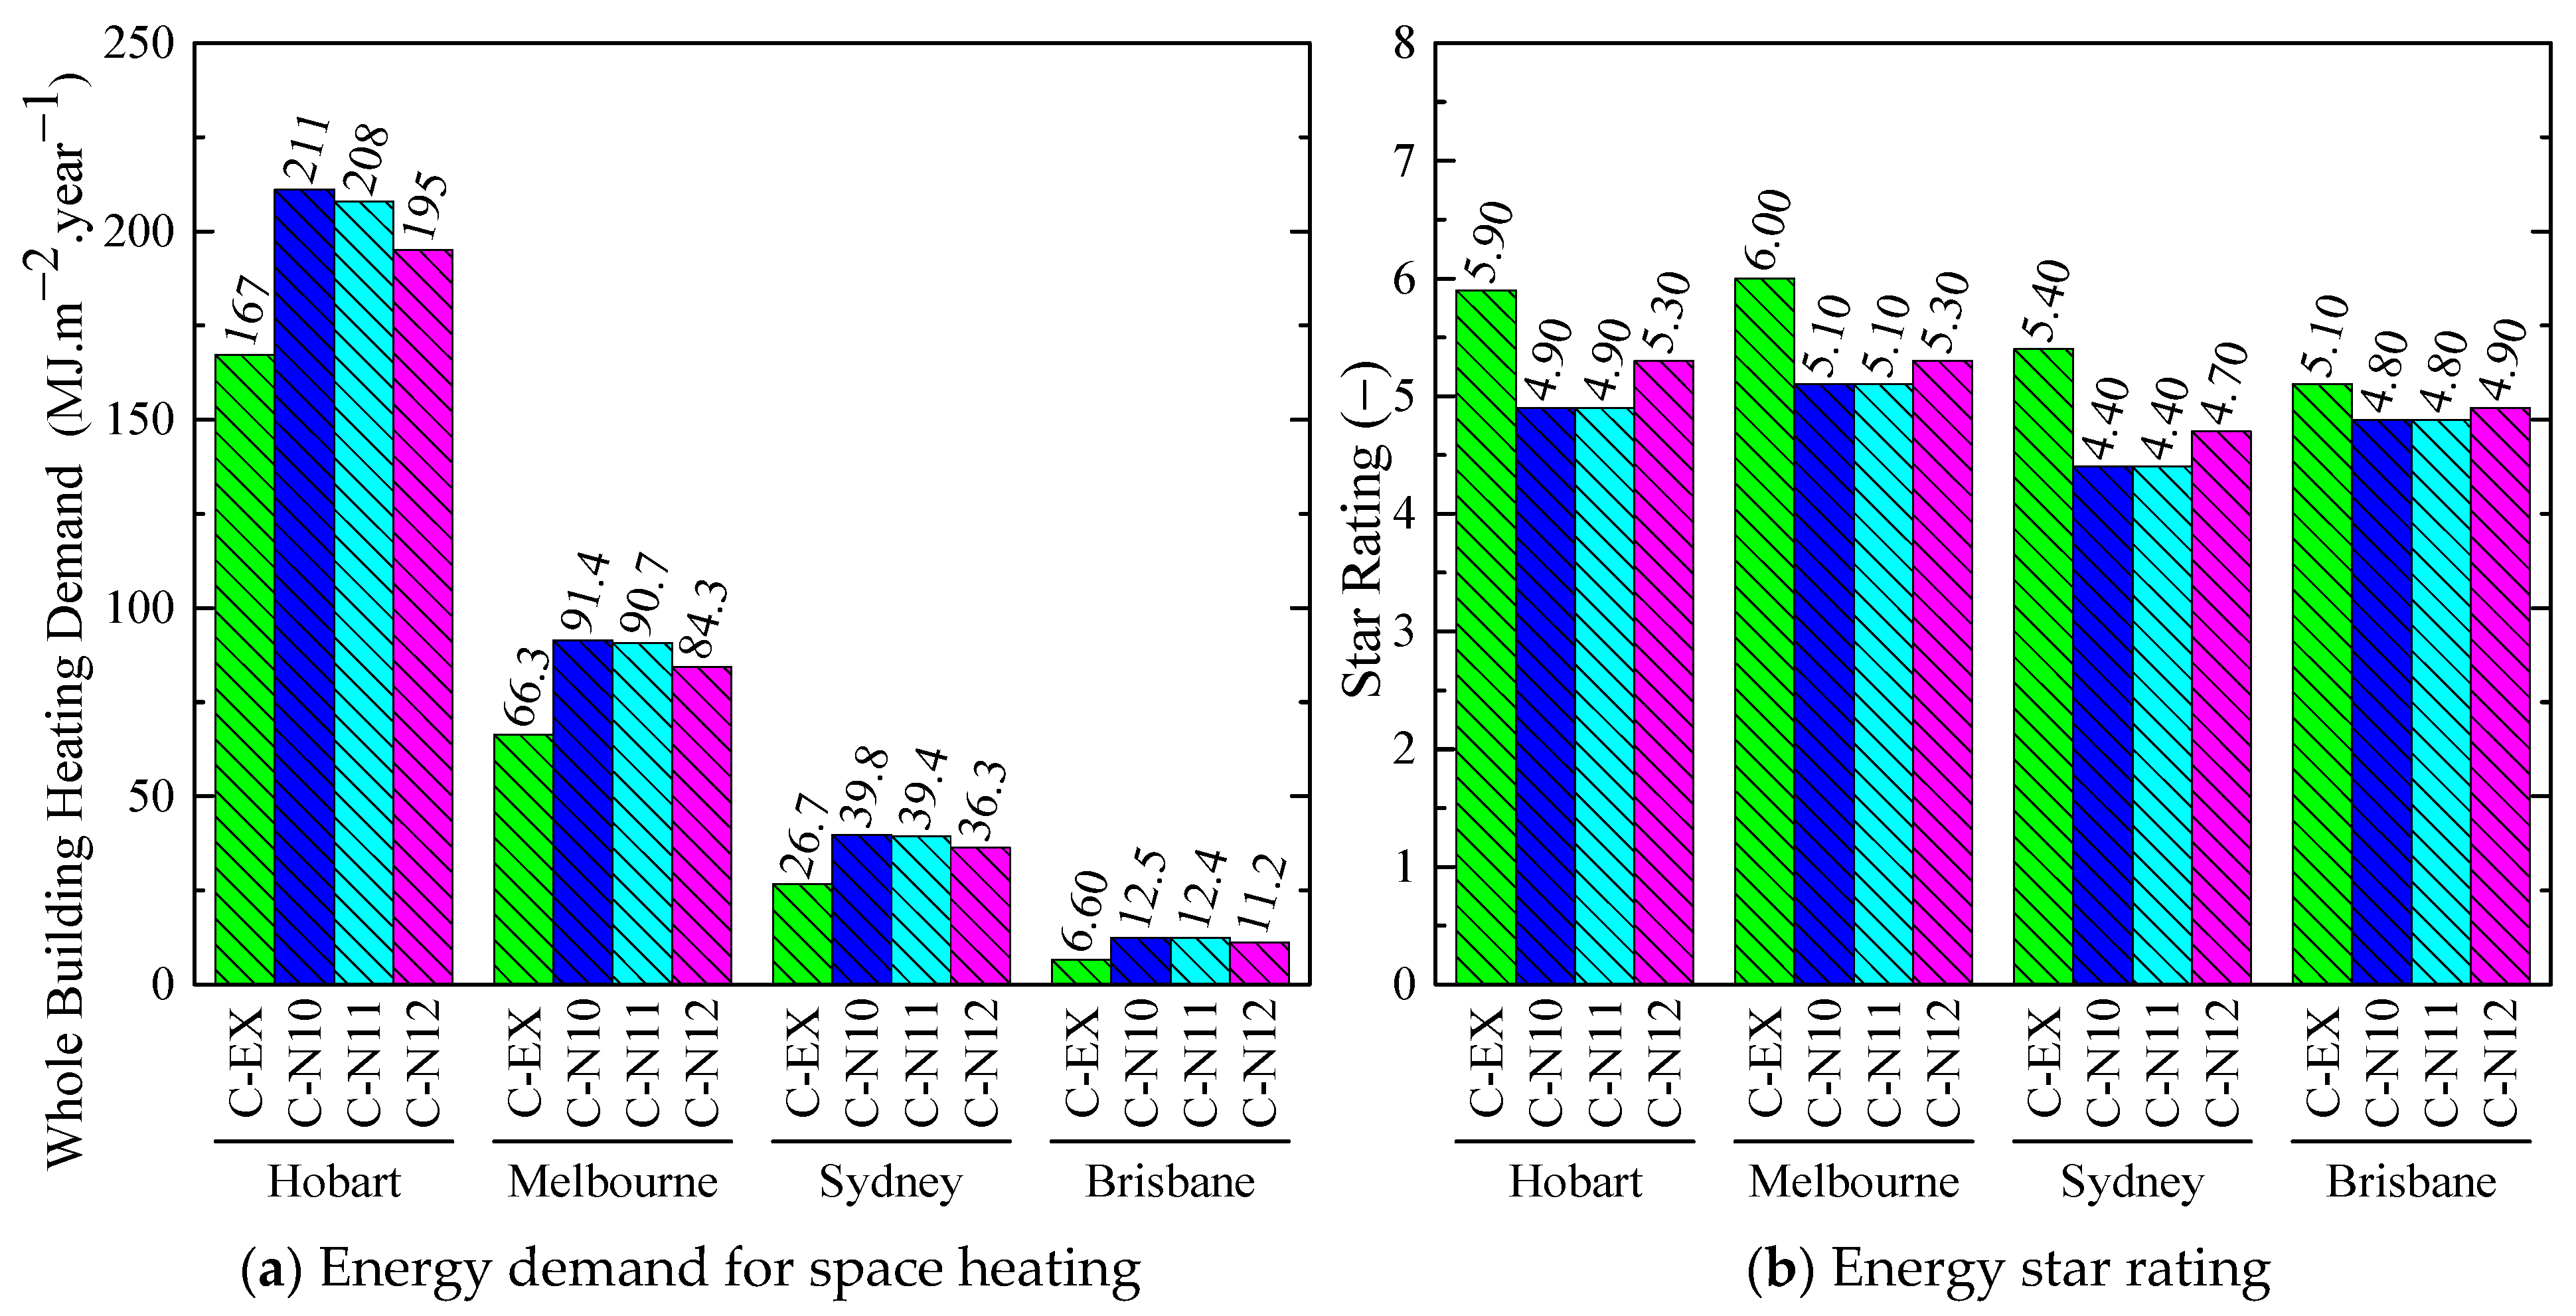
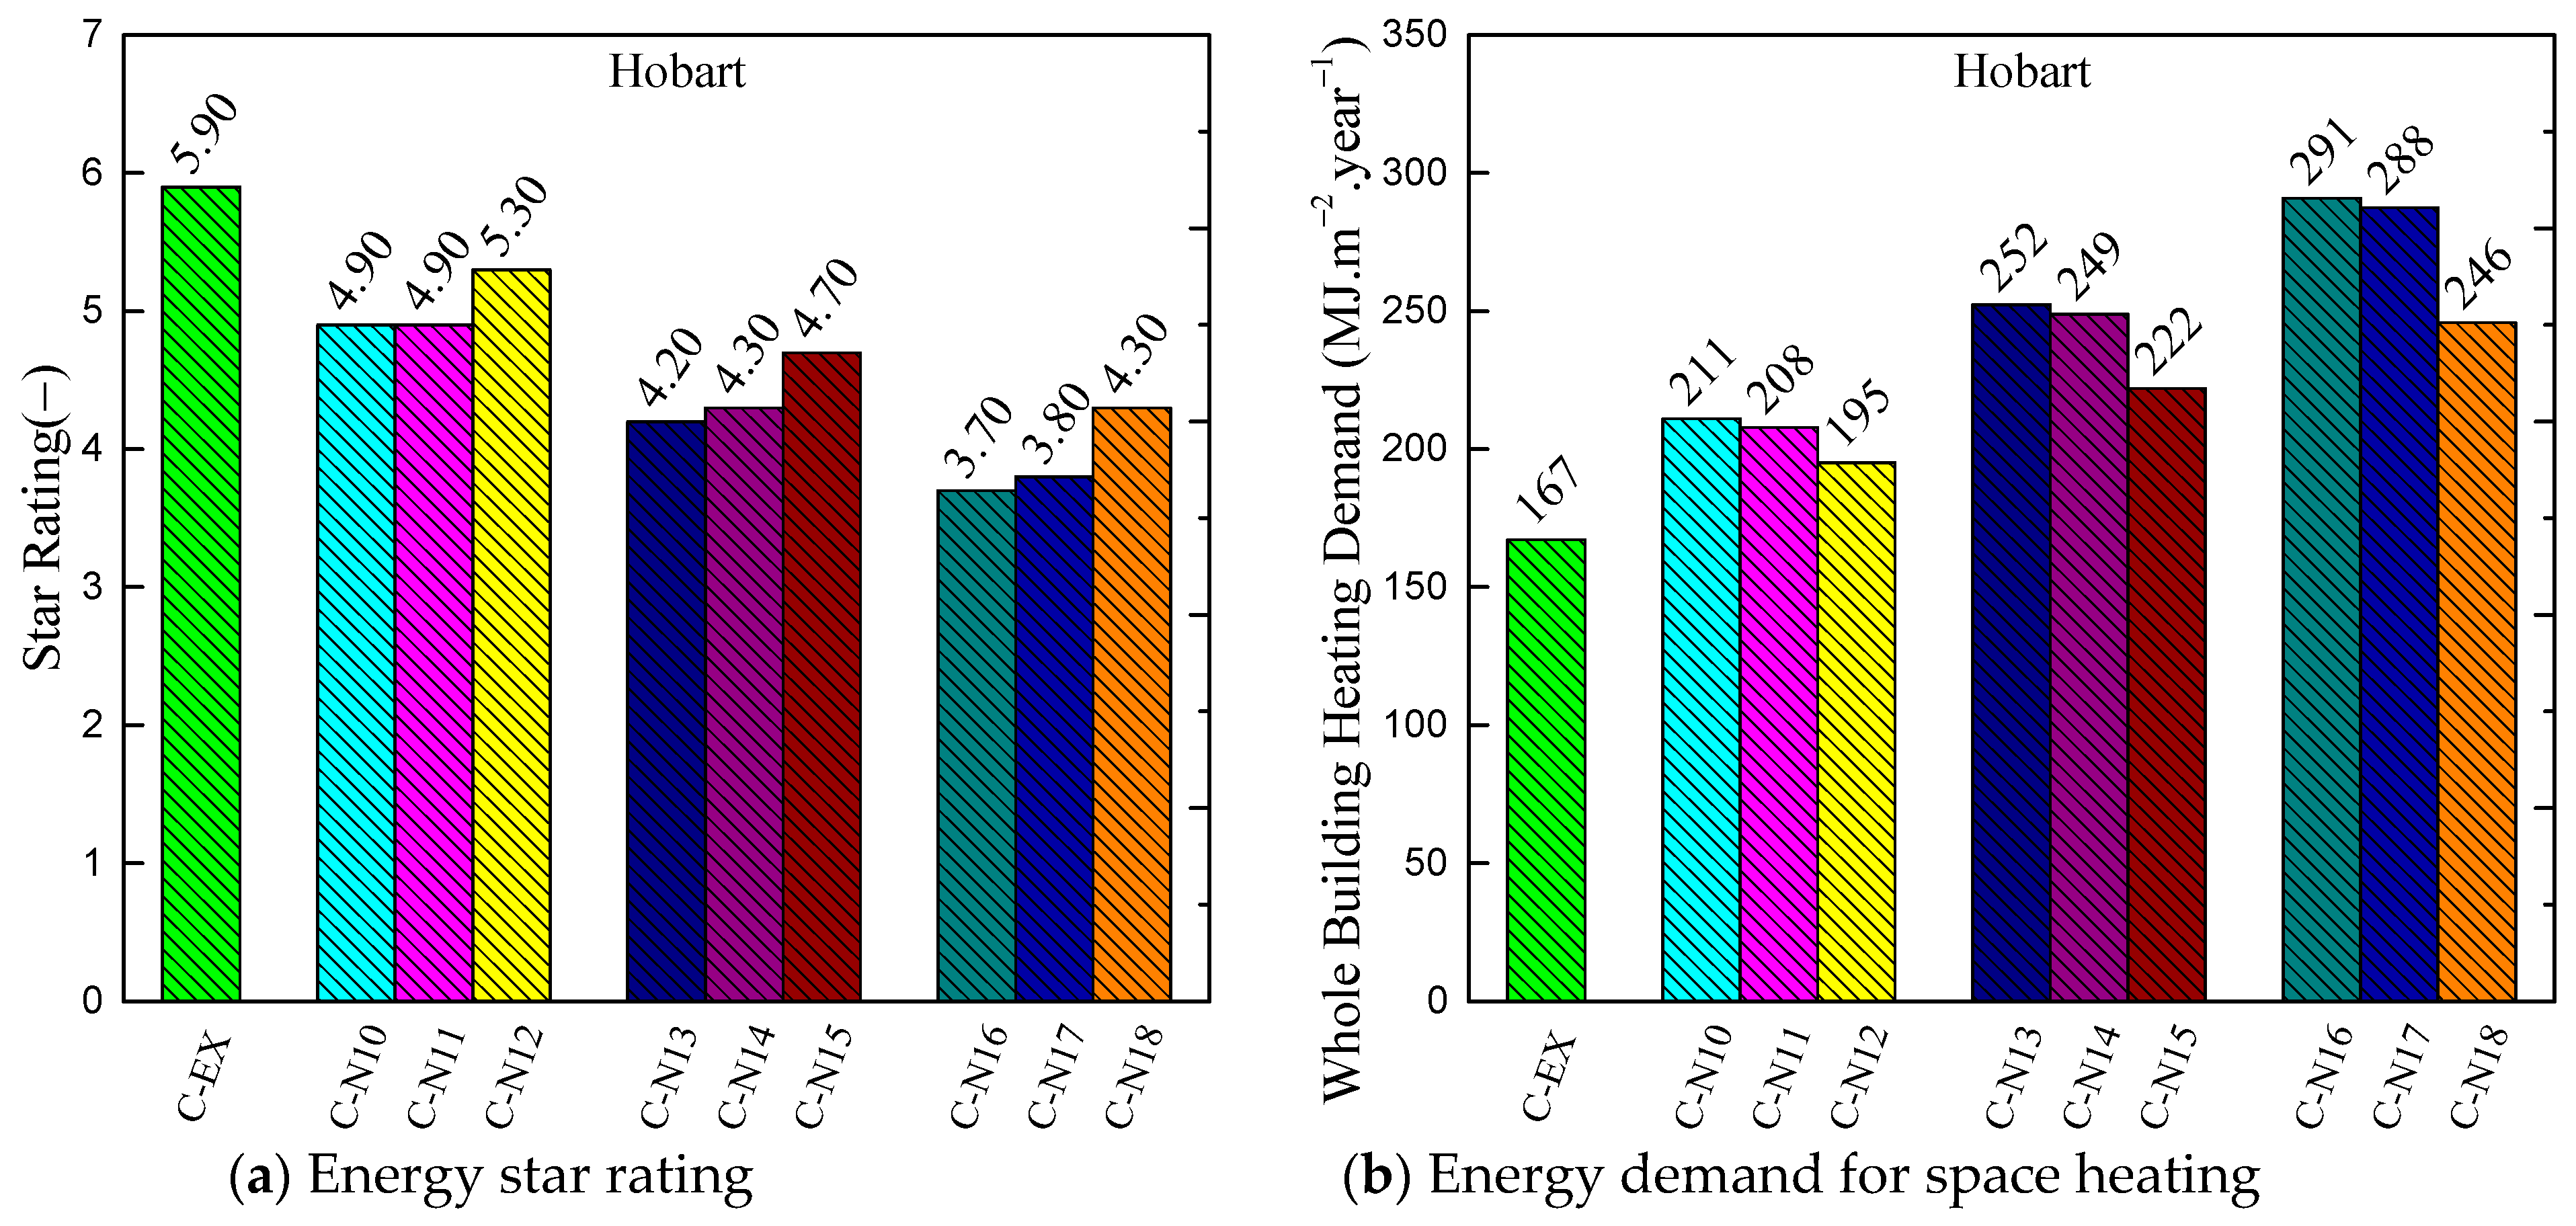
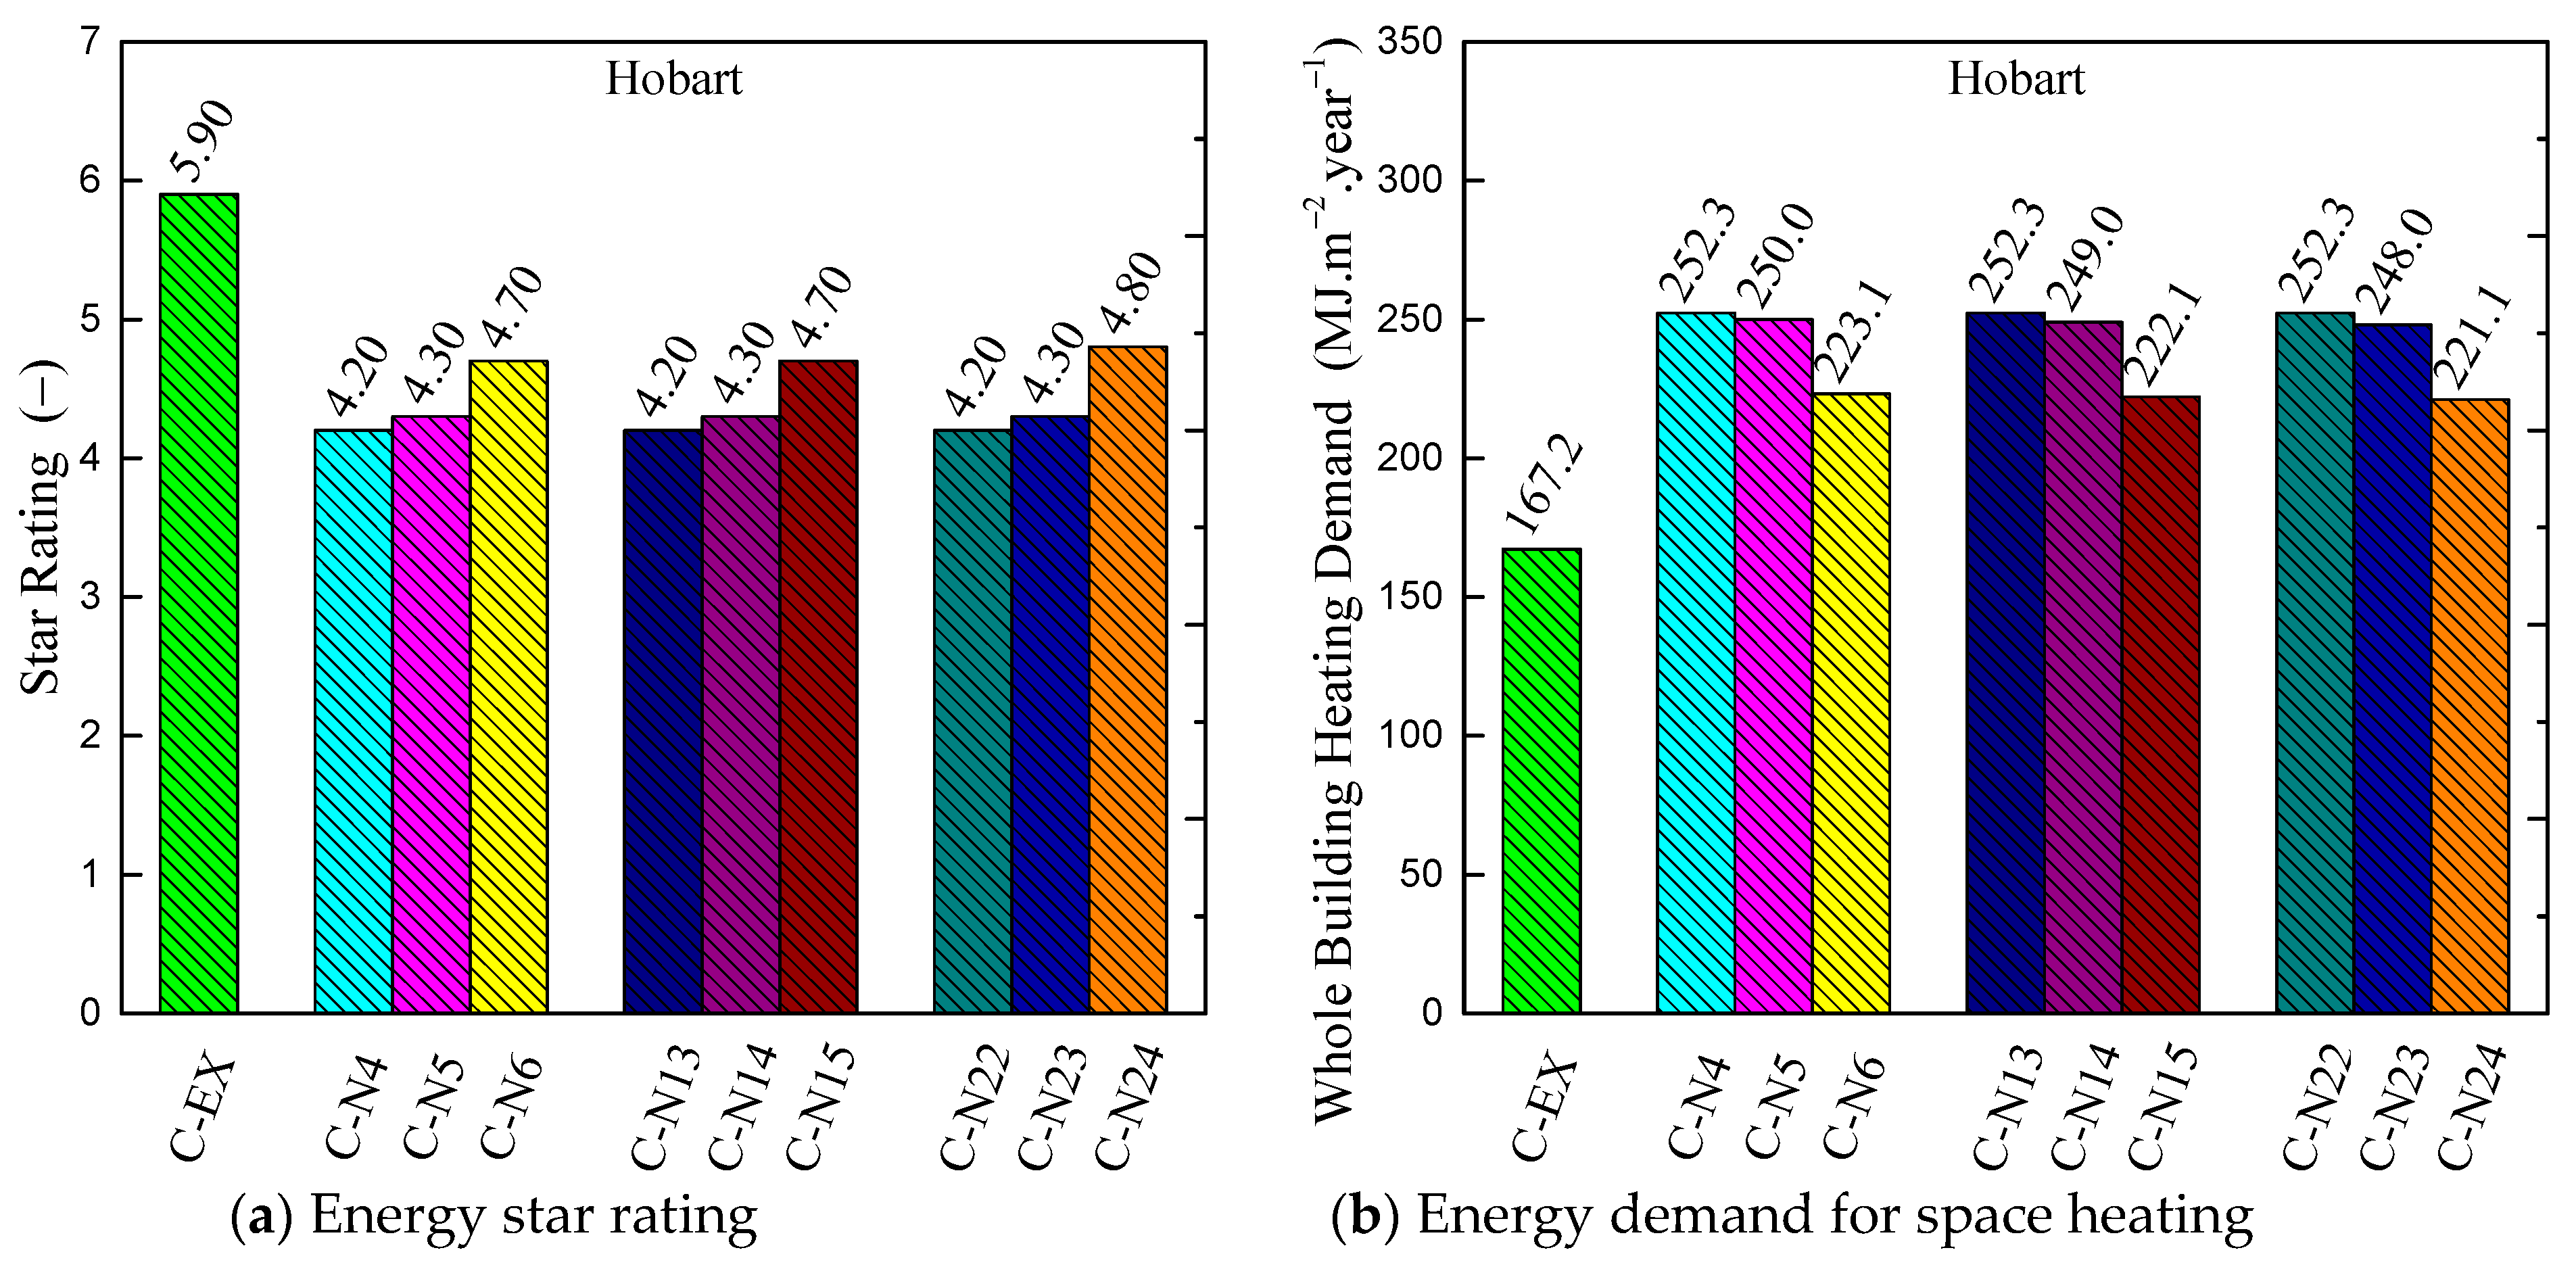
The comparison study of the mechanical ventilation system with and without heat recovery shows the system without heat recovery increases the energy consumption due to the additional fresh air load. With the decrease in the average winter temperature of the city (from Brisbane to Hobart), the fresh air load becomes more and more large, and heat recovery becomes more and more important. The heat recovery can increase the house star rating up to 0.6 stars under the operation condition of C-N24 in Hobart. Compared with heat recovery in daily time, although the recovered energy from the bathroom and kitchen is smaller, it can still save about 3.3 MJ/(m2·year). It indicates the importance of considering the temperature difference between indoor and ambient environments when designing the heat recovery system under different climate zones.
Based on the case studies on the bathroom and whole house, the proposed thermal performance model that considers the variation in floor water film thickness presents a good prediction of the process parameters in the whole-building energy simulation. The proposed model on the variation in water film thickness of the bathroom floor and the effects of an additional air heater on water evaporating efficiency provides a useful reference to model the moisture removal process under a closed environment with high humidity. Meanwhile, it should be noted that in this study, the ε-NTU method is applied to analyse the thermal performance of the heat recovery system based on several simplifying assumptions, such as steady-state conditions, constant fluid properties, and heat transfer coefficients, neglecting heat exchanger geometry, etc. These assumptions may not always hold in practical applications, which may lead to limitations of this model application and potential discrepancies between the model predictions and actual performance. To mitigate the limitations and potential discrepancies, CFD or experimental studies may be required for greater precision analysis.

Author Contributions

Conceptualization, Z.R. and J.S.; methodology, Z.R. and J.S.; code writing, J.S.; writing—original draft preparation, J.S. and J.G.; writing—review and editing, Z.R.; supervision, Z.R. and J.G. All authors have read and agreed to the published version of the manuscript.

Funding

This research was funded by the China Scholarship Council (File No.202000810005), the Natural Science Foundation of Shandong Province of China (Grant No. ZR2020ME169), and the Open Project of Qingdao University of Technology (Grant No. C2019-125).

Data Availability Statement

Data will be made available on request.

Acknowledgments

This research was also supported by the Australia CSIRO (Clayton) Building Energy Efficiency team. We appreciate their instructions in the heat recovery code writing.

Conflicts of Interest

The authors declare no conflict of interest.

Nomenclature

HVACHeating, ventilating, and air conditioningH/Cheating and cooling
HDDsHeating Degree DaysBESTESTBuilding Energy Simulation Test
NatHERSNationwide House Energy Star Schemeε-NTUEffectiveness–number of transfer units (NTU)
Chenath engineA simulation engine for the AccuRate Home platformACHAir Changes per Hour
t critialpoint Critical point time, s ρ wetequ The density of the wet air in the bathroom after the mixture process, kg/m3
V bath The volume of the bathroom, m3 γ Gasification latent heat of water, J/kg
Q fan The airflow rate, m3/s δ old The thickness of the water on the floor in the last calculation step, m
hHeat transfer coefficient, W/(m2·K) T waterold The temperature of the water on the floor in the last calculation step, K
h d Mass transfer coefficient, m/s T exbathold The exhaust air temperature in the last calculation step, K
S h Value of the Sherwood δ The thickness of the water film, m
L equ Qualitative length, m q rem Recovered energy at moisture removal time, J
D Mass diffusivity of moisture, m2/s q res Recovered energy at shower time, J
N u Nuchelt value q rebath Total recovered energy from the bathroom, J
λ Conductive coefficient, W/(m·K) ε h Heat exchange efficiency
F shower Area of shower space, m2 ( m C p ) min Minimum heat capacity, J/k
L shower Length of the shower space, m m Mass flow rate of working air, kg/s
W shower Width of shower space, m T exkic Temperature of the kitchen exhaust air, K
ReReynolds number q rek Recovered energy from kitchen, J
PrThe Prandtl number q red Recovered energy at daily time, J
ScSchmidt value a Total number of condition zones at current time step
ν Dynamic viscosity, m2/s T exzm Temperature of zone a, K
P1Working pressure in bathroom, Pa T amb The ambient temperature, K
TequQualitative temperature, K q ahbath Extra energy consumption caused by the air heater, J
T exbath Exhaust air temperature from the bathroom, K T ahset Set temperature of outlet air of the air heater, K
T mixbath Air temperature after the mixture process between the inlet air and the existing air in the bathroom, K T exza Inlet air temperature, K
d mixbath The absolute air moisture content after the mixture process, kg/kgnTime steps
ρ wina The density of indoor wet air, kg/m3 C p equ Air-specific heat at constant pressure after the mixture process, J/(kg·k)
ρ wouta The density of inlet wet air, kg/m3 T water Hot water temperature on the floor, K
d bathini The initial absolute air moisture content for the bathroom air, kg/kg P vapbatht Partial pressure of water vapour, Pa
d outini The initial absolute air moisture content for the inlet air, kg/kg T exbath Exhaust air temperature, K
T bathini The initial temperature for the bathroom air, K d exbath Exhaust air absolute moisture content, kg/kg
T outini The initial temperature for the inlet air, K Δ t Time step, s
d s mixbath Saturation value, kg/kgψRelative humidity, %
M vapor Mass diffusion flux, kg/(m2·s)Subscripts
R vapor The molar gas constant of vapoursupSupplied fresh air
P s ws The saturation pressure at the base of the water temperature, PaexbathExhaust air from the bathroom
ρ drya The density of the dry air in the bathroom, kg/kgNumber from 1 to 28Corresponding to each operating condition

References

  1. Sun, J.; Zhu, D.; Yin, Y.; Li, X. Experimental investigation of the heating performance of refrigerant injection heat pump with a single-cylinder inverter-driven rotary compressor. J. Therm. Anal. Calorim. 2018, 133, 1579–1588. [Google Scholar] [CrossRef]
  2. Song, G.; Ai, Z.; Liu, Z.; Zhang, G. A systematic literature review on smart and personalized ventilation using CO2 concentration monitoring and control. Energy Rep. 2022, 8, 7523–7536. [Google Scholar] [CrossRef]
  3. Hu, J.; Liu, Z.; Ma, G.; Zhang, G.; Ai, Z. Air infiltration and related building energy consumption: A case study of office buildings in Changsha, China. J. Build. Eng. 2023, 74, 106859. [Google Scholar] [CrossRef]
  4. Zhang, L.Z.; Zelik, E.B. Total Heat Recovery: Heat and Moisture Recovery from Ventilation Air; Nova Science Publishers: Hauppauge, NY, USA, 2008. [Google Scholar]
  5. Zhang, L. Energy performance of independent air dehumidification systems with energy recovery measures. Energy 2006, 31, 1228–1242. [Google Scholar] [CrossRef]
  6. Zender–Świercz, E. A review of heat recovery in ventilation. Energies 2021, 14, 1759. [Google Scholar] [CrossRef]
  7. Tang, L.; Ai, Z.; Song, C.; Zhang, G.; Liu, Z. A strategy to maximally utilize outdoor air for indoor thermal environment. Energies 2021, 14, 3987. [Google Scholar] [CrossRef]
  8. Alhindawi, I.; Jimenez-Bescos, C. Computational Approach to Predict Thermal Comfort Levels at Summer Peak Conditions in Passive House Based on Natural Ventilation. J. Sustain. Dev. Energy Water Environ. Syst. 2022, 10, 1–21. [Google Scholar] [CrossRef]
  9. Hu, Y.; Liu, Z.; Ai, Z.; Zhang, G. Performance evaluation of ventilative cooling systems for buildings under different control parameters and strategies. J. Build. Eng. 2023, 65, 105627. [Google Scholar] [CrossRef]
  10. Cuce, P.M.; Riffat, S. A comprehensive review of heat recovery systems for building applications. Renew. Sustain. Energy Rev. 2015, 47, 665–682. [Google Scholar] [CrossRef]
  11. Besant, R.; Simonson, C. Air-to-air exchangers. ASHRAE J. 2003, 45, 42. [Google Scholar]
  12. Besant, R.W.; Simonson, C.J. Air-to-air energy recovery. ASHRAE J. 2000, 42, 31–43. [Google Scholar]
  13. Dieckmann, J.; Roth, K.W.; Brodrick, J. Air-to-air energy recovery heat exchangers. ASHRAE J. 2003, 45, 57. [Google Scholar]
  14. Mardiana-Idayu, A.; Riffat, S. Review on heat recovery technologies for building applications. Renew. Sustain. Energy Rev. 2012, 16, 1241–1255. [Google Scholar] [CrossRef]
  15. Xu, Q.; Riffat, S.; Zhang, S. Review of heat recovery technologies for building applications. Energies 2019, 12, 1285. [Google Scholar] [CrossRef]
  16. Li, J.; Shao, S.; Wang, Z.; Xie, G.; Wang, Q.; Xu, Z.; Han, L.; Gou, X. A review of air-to-air membrane energy recovery technology for building ventilation. Energy Build. 2022, 265, 112097. [Google Scholar] [CrossRef]
  17. Nielsen, T.R. Simple tool to evaluate energy demand and indoor environment in the early stages of building design. Sol. Energy 2005, 78, 73–83. [Google Scholar] [CrossRef]
  18. Pekdogan, T.; Tokuç, A.; Ezan, M.A.; Başaran, T. Experimental investigation of a decentralized heat recovery ventilation system. J. Build. Eng. 2021, 35, 102009. [Google Scholar] [CrossRef]
  19. Larowski, A.; Taylor, M.A. Systematic Procedure for Selection of Heat Exchangers. Proc. Inst. Mech. Eng. Part A Power Process Eng. 1983, 197, 51–69. [Google Scholar] [CrossRef]
  20. Kuppan, T. Heat Exchanger Design Handbook; Marcel Dekker, Inc.: New York, NY, USA, 2000. [Google Scholar]
  21. Riffat, S.B.; Gillott, M.C. Performance of a novel mechanical ventilation heat recovery heat pump system. Appl. Therm. Eng. 2002, 22, 839–845. [Google Scholar] [CrossRef]
  22. Lu, Y.; Wang, Y.; Zhu, L.; Wang, Q. Enhanced performance of heat recovery ventilator by airflow-induced film vibration (HRV performance enhanced by FIV). Int. J. Therm. Sci. 2010, 49, 2037–2041. [Google Scholar] [CrossRef]
  23. Li, B.; Wild, P.; Rowe, A. Performance of a heat recovery ventilator coupled with an air-to-air heat pump for residential suites in Canadian cities. J. Build. Eng. 2019, 21, 343–354. [Google Scholar] [CrossRef]
  24. Ribé, O.; Ruiz, R.; Quera, M.; Cadafalch, J. Analysis of the sensible and total ventilation energy recovery potential in different climate conditions. Application to the Spanish case. Appl. Therm. Eng. 2019, 149, 854–861. [Google Scholar] [CrossRef]
  25. Strand, A.; Kim, M.K. Comparative numerical energy analysis of decentralized ventilation adapting to local Norway climates. E3S Web Conf. 2022, 362, 11005. [Google Scholar] [CrossRef]
  26. Marsik, T.; Bickford, R.; Dennehy, C.; Garber-Slaght, R.; Kasper, J. Impact of Intake and Exhaust Ducts on the Recovery Efficiency of Heat Recovery Ventilation Systems. Energies 2021, 14, 351. [Google Scholar] [CrossRef]
  27. Crawley, D.B.; Lawrie, L.K.; Winkelmann, F.C.; Pedersen, C.O. EnergyPlus: A New-Generation Building Energy Simulation Program. In Proceedings of the Forum 2001: Solar Energy: The Power to Choose, Washington, DC, USA, 21–25 April 2001. [Google Scholar]
  28. Klein, S.A.; Beckman, W.A.; Duffie, J.A. TRNSYS—A transient simulation program. ASHRAE Trans. 1976, 82, 623–633. [Google Scholar]
  29. Davidsson, H.; Bernardo, R. Heat Loss for a Run-Around Hybrid Ventilation System with Heat Recovery. In Proceedings of the International Solar Energy Society, ISES Solar World Congress 2015, SWC 2015, Daegu, Republic of Korea, 8–12 November 2015; pp. 81–86. [Google Scholar]
  30. Nuernberger, S.; Lau, A. Modeling of ventilation air heat recovery and its impact in high-performance green buildings. In Proceedings of the Proceedings of SimBuild Conference 2004: 1st Conference of IBPSA-USA; Boulder, CO, USA, August 2004, Available online: https://publications.ibpsa.org/conference/paper/?id=simbuild2004_SB04T2C1 (accessed on 16 August 2023).
  31. Bojic, M. Mathematical model of heat recovery in a space-heating and ventilation system. Energy 1993, 18, 49–61. [Google Scholar] [CrossRef]
  32. Bojic, M.; Trnobransky, K. Influence of hot tool parameters on heat recovery in a space-heating and ventilation system. Energy 1995, 20, 1075–1079. [Google Scholar] [CrossRef]
  33. EnergyPlus™. EnergyPlus™ Documentation-Engineering Reference, Version 23.1.0; U.S. Department of Energy: Washington, DC, USA, 2023.
  34. Ren, Z.; Jian, A.; Law, A.; Godhani, A.; Chen, D. Development of a benchmark tool for whole of home energy rating for Australian new housing. Energy Build. 2023, 285, 112921. [Google Scholar] [CrossRef]
  35. Walsh, P.J.; Delsante, A.E. Calculation of the thermal behaviour of multi-zone buildings. Energy Build. 1983, 5, 231–242. [Google Scholar] [CrossRef]
  36. Ren, Z.; Chen, Z. Enhanced air flow modelling for AccuRate–A nationwide house energy rating tool in Australia. Build. Environ. 2010, 45, 1276–1286. [Google Scholar] [CrossRef]
  37. Delsante, A. A Validation of the ‘Accurate’ Simulation Engine Using Bestest; Report for the Australian Greenhouse Office by Commonwealth Scientific and Industrial Research Organisation (CSIRO), Report No. CMIT(C)-2004-152; Melbourne, Australia, April 2004. Available online: https://www.nathers.gov.au/sites/default/files/Validation%2520of%2520the%2520AccuRate%2520Simulation%2520Engine%2520Using%2520BESTEST_0.pdf (accessed on 16 August 2023).
  38. Ren, Z.; Chen, D.; James, M. Evaluation of a whole-house energy simulation tool against measured data. Energy Build. 2018, 171, 116–130. [Google Scholar] [CrossRef]
  39. Bai, H.; Liu, P.; Alonso, M.J.; Mathisen, H.M. A review of heat recovery technologies and their frost control for residential building ventilation in cold climate regions. Renew. Sustain. Energy Rev. 2022, 162, 112417. [Google Scholar] [CrossRef]
  40. Yang, S.-M.; Tao, W.-Q. Heat Transfer Theory, 4th ed.; Higher Education Publishing House: Beijing, China, 2006. [Google Scholar]
  41. Zhang, X. The Fifth Edition of Heat Transfer; China Building Industry Press: Beijing, China, 2007. [Google Scholar]
  42. Chen, G.; Wu, G. Experiment on heat pumps with exhaust heat recovery from kitchens. J. HVAC 2005, 35, 69–71. [Google Scholar]
  43. Eckert, E.R.; Drake, R.M., Jr. Analysis of Heat and Mass Transfer; McGraw-Hill: New York, NY, USA, 1987. [Google Scholar]
Figure 1. Scheme of a typical house (the arrows reprents the airflow directions).
Energies 16 06801 g001
Figure 2. Variation of exhaust air temperature with time in heat recovery procession.
Energies 16 06801 g002
Figure 3. The simulation scheme of the bathroom heat recovery.
Energies 16 06801 g003
Figure 4. The floor plan in the case study.
Energies 16 06801 g004
Figure 5. Variation of exhaust air thermal performance with time in the shower time.
Energies 16 06801 g005
Figure 6. Thermal parameter variation of exhaust air and water film on the floor with time under the condition of the air heater being turned off in the bathroom.
Energies 16 06801 g006
Figure 7. Thermal parameter variation of exhaust air and water film on the floor with time under the condition of the air heater being turned on in the bathroom.
Energies 16 06801 g007
Figure 8. Variation of recovered energy from bathroom and kitchen under the conditions of turning off and turning on the air heater.
Energies 16 06801 g008
Figure 9. Variation of the total recovered energy of bathroom with the fixed exhaust air temperature.
Energies 16 06801 g009
Figure 10. Variation of the recovered energy of the bathroom with the water film thickness.
Energies 16 06801 g010
Figure 11. Comparison of energy demand and star rating with new engines for different climate zones.
Energies 16 06801 g011
Figure 12. Comparison of star rating and energy demand with different air change rates in daily ventilation for the city of Hobart.
Energies 16 06801 g012
Figure 13. Comparison of star rating and energy demand with different airflow rates in bathroom and kitchen for the city of Hobart.
Energies 16 06801 g013
Table 1. Specifications of heat recovery model.
ZoneItemsUnitsSpecification
bathroomTemperature of the hot water on the bathroom base floorK311.15
Initial thickness of the water filmmm0.2
Geometry of shower space (W × L × H)m0.9 × 0.9 × 2.0
Airflow rate of ventilationm³/s0.046
Heat   exchange   efficiency   ε h -0.7 [33]
kitchenExhaust air temperatureK305
Exhaust air relative humidity-85%
Airflow rate of ventilationm³/s0.046
Heat   exchange   efficiency   ε h -0.7
Daily heat recovery Heat   exchange   efficiency   ε h -0.7
Table 2. Specific parameters of bathroom corresponding to each operating condition.
TimeQfan (m³/h)Corresponding Parameters
1Shower169.2Texbath1, ψexbath1qresqrebath
2253.8Texbath2, ψexbath2
3338.4Texbath3, ψexbath3
4423Texbath4, ψexbath4
5507.6Texbath5, ψexbath5
6Moisture removal processTurning off the air heater169.2Texbath6, ψexbath6,Twater1, δ1qrem
7253.8Texbath7, ψexbath7,Twater2, δ2
8338.4Texbath8, ψexbath8,Twater3, δ3
9423Texbath9, ψexbath9,Twater4, δ4
10507.6Texbath10, ψexbath10,Twater5, δ5
11Turning on the air heater169.2Texbath11, ψexbath11,Twater6, δ6qrem
12253.8Texbath12, ψexbath12,Twater7, δ7
13338.4Texbath13, ψexbath13,Twater8, δ8
14423Texbath14, ψexbath14,Twater9, δ9
15507.6Texbath15, ψexbath15,Twater10, δ10
Table 3. Specific operating conditions for the bathroom in the heat recovery processes.
Operating ConditionShower ProcessMoisture Removal ProcessQfan
(m3/s)
q res
(kJ)
q rem
(kJ)
q rebath (kJ)Recovered Energy Per Square Meter (kJ/m2·h)
Proposed ModelFixed TemperatureProposed ModelFixed Temperature
C1-1onoffonoff0.0471151.92 1146.69 2298.62 77.92
C1-2offononoff0.0471136.87 1091.79 2228.66 75.55
C1-3offonoffon0.0471136.87 1590.24 2727.11 92.44
C2-1onoffonoff0.07051603.77 1543.87 3147.64 106.70
C2-2offononoff0.07051704.68 1537.13 3241.81 109.89
C2-3offonoffon0.07051704.68 2384.39 4089.07 138.61
C3-1onoffonoff0.0942017.581949.433967.01134.47
C3-2offononoff0.0942272.081976.744248.83144.03
C3-3offonoffon0.0942272.083177.985450.07184.75
C4-1onoffonoff0.11752407.442363.284770.71161.72
C4-2offononoff0.11752839.072415.165254.23178.11
C4-3offonoffon0.11752839.073970.996810.06230.85
C5-1onoffonoff0.1412781.342783.015564.35188.62
C5-2offononoff0.1413405.652853.336258.97212.17
C5-3offonoffon0.1413405.654763.418169.06276.92
Table 4. The variation in the water film thickness.
Operating ConditionQfan
(m3/s)
Thickness of Water Film
(m)
q res
(kJ)
q rem
(kJ)
q rebath
(kJ)
Recovered Energy Per Square Meter (kJ/m2·h)
T10.07050.00021603.771543.873147.64106.70
CT20.07050.00041603.771557.123160.88107.15
CT30.07050.00061603.771568.503172.27107.53
CT40.07050.00081603.771577.933181.70107.85
CT50.07050.0011603.771585.723189.49108.12
CT60.07050.00121603.771592.213195.97108.34
CT70.07050.00141603.771597.673201.44108.52
Table 5. Specific operation conditions of the building without an air heater.
Operating ConditionVersion of EngineHeat RecoveryAirflow Rate m3/sDaily Time Air Charge Rate (Times Per Hour)
Daily TimeBathroom and KitchenBathroomKitchen
1C-EXExisting engineOffOff---
2C-N1New engineOffOff0.047 × 10.047 × 10.5
3C-N2New engineOffOn0.047 × 10.047 × 10.5
4C-N3New engineOnOn0.047 × 10.047 × 10.5
5C-N4New engineOffOff0.047 × 10.047 × 11
6C-N5New engineOffOn0.047 × 10.047 × 11
7C-N6New engineOnOn0.047 × 10.047 × 11
8C-N7New engineOffOff0.047 × 10.047 × 11.5
9C-N8New engineOffOn0.047 × 10.047 × 11.5
10C-N9New engineOnOn0.047 × 10.047 × 11.5
11C-N10New engineOffOff0.047 × 1.50.047 × 1.50.5
12C-N11New engineOffOn0.047 × 1.50.047 × 1.50.5
13C-N12New engineOnOn0.047 × 1.50.047 × 1.50.5
14C-N13New engineOffOff0.047 × 1.50.047 × 1.51
15C-N14New engineOffOn0.047 × 1.50.047 × 1.51
16C-N15New engineOnOn0.047 × 1.50.047 × 1.51
17C-N16New engineOffOff0.047 × 1.50.047 × 1.51.5
18C-N17New engineOffOn0.047 × 1.50.047 × 1.51.5
19C-N18New engineOnOn0.047 × 1.50.047 × 1.51.5
20C-N19New engineOffOff0.047 × 20.047 × 20.5
21C-N20New engineOffOn0.047 × 20.047 × 20.5
22C-N21New engineOnOn0.047 × 20.047 × 20.5
23C-N22New engineOffOff0.047 × 20.047 × 21
24C-N23New engineOffOn0.047 × 20.047 × 21
25C-N24New engineOnOn0.047 × 20.047 × 21
26C-N25New engineOffOff0.047 × 20.047 × 21.5
27C-N26New engineOffOn0.047 × 20.047 × 21.5
28C-N27New engineOnOn0.047 × 20.047 × 21.5
Disclaimer/Publisher’s Note: The statements, opinions and data contained in all publications are solely those of the individual author(s) and contributor(s) and not of MDPI and/or the editor(s). MDPI and/or the editor(s) disclaim responsibility for any injury to people or property resulting from any ideas, methods, instructions or products referred to in the content.

