Review

A Review on Testing of Electrochemical Cells for Aging Models in BESS

1
Department of Energy, Politecnico di Milano, Piazza Leonardo Da Vinci 32, 20133 Milano, Italy
2
Department of Electronics, Information and Bioengineering, Politecnico di Milano, Piazza Leonardo Da Vinci 32, 20133 Milano, Italy
3
Eni S.p.A., Renewable, New Energies, and Material Science Research Center, via Fauser 4, 28100 Novara, Italy
4
Eni S.p.A., via Maritano 26, 20097 San Donato Milanese, Italy
5
Eni Plenitude S.p.A., via Ripamonti 85, 20141 Milano, Italy
*
Author to whom correspondence should be addressed.
Energies 2023, 16(19), 6887; https://doi.org/10.3390/en16196887
Submission received: 21 July 2023 / Revised: 19 September 2023 / Accepted: 27 September 2023 / Published: 29 September 2023
(This article belongs to the Section D2: Electrochem: Batteries, Fuel Cells, Capacitors)

Abstract

:
The use of electrochemical cells is becoming more widespread, especially in the energy industry and battery energy storage systems (BESSs). As we continue to deploy BESSs, it becomes increasingly important for us to understand how these systems age and accurately predict their performance over time. This knowledge is essential for ensuring that the systems operate optimally and can be properly maintained. Since the structure of a BESS is different from a single electrochemical cell, the existing models at the cell level cannot predict and estimate the life of the BESS with suitable accuracy. Furthermore, the test protocols available at the cell level mostly cannot be executed at the BESS level for many reasons. Therefore, in this paper, a review of test protocols for building aging models for BESSs has been performed. After reviewing the protocols for a single electrochemical cell and addressing the differences between BESSs and cells, a review of the works performed on a larger scale has been carried out, and the possible ways for testing the BESS for aging models were investigated.

1. Introduction

The presence of electrochemical cells can be felt in any part of the industry, from portable devices such as smartphones and laptops to much bigger industries such as energy production. The integration of batteries in electric power systems can lead to a more sustainable energy ecosystem, which is one of the main concerns of today’s societies [1,2].
Among all batteries, lithium-ion cells have attracted the most attention because of their high energy density, high power density, and long expected lifetime [3]. Since BESSs equipped with Li-ion batteries have high efficiency and fast ramp rates, they can solve many challenges correlated with the electric power system operation and control [4]. Nevertheless, lithium-ion cells suffer from degradation based on their usage profile and environmental situations. This could cause several problems correlated to the reliability of the maximum energy and the power that a BESS could provide [5]. Moreover, the battery cost is a big portion of the total cost for many applications. Therefore, it is necessary to properly estimate how aging phenomena affect the BESS’s life [6].
Since measuring the available capacity and power is not directly possible, methods and models based on different approaches have been introduced [5]. The experimental campaigns are generally expensive. Therefore, different approaches, such as laboratory protocols, have been tried to gather data instead of doing a test directly on the BESS. Many studies have tried to extend the cell-level aging models to the BESS level, but this can give rise to many inaccuracies and faults in the models. Based on the experiments, it has been shown that the same cycle aging can have different effects on different cells, as can be seen in Figure 1.
The integration of artificial intelligence (AI) into the estimation of the State of Health (SOH) has significantly advanced this field. AI offers a dual opportunity for leveraging its capabilities: SOH estimation and battery lifetime prediction. Within the literature, numerous studies have explored the application of AI to estimate battery SOH, typically involving a combination of offline training and online estimation [7].
Various statistical data-driven AI techniques, including support vector machines [8], Gaussian process regression (GPR) [9], and Bayesian networks [10], as well as neural network-based approaches like feedforward neural networks [11] and recurrent neural networks [12], have been deployed to estimate SOH. Furthermore, both non-probabilistic and probabilistic AI methodologies can be employed to predict batteries’ remaining useful life (RUL), a crucial aspect for subsequent charge control algorithm strategies [7].
Additionally, transfer learning (TL) techniques have garnered attention for SOH estimation, demonstrating their utility across a spectrum of machine learning algorithms, including neural networks and kernel-based data-driven models such as GPR [13]. Self-adjusted TL approaches, tailored for battery packs and modules with a high cell count, have effectively reduced computational overhead while delivering promising results [14].
Moreover, predicting the overall lifetime of batteries has been explored by monitoring them over their initial cycles, with a strong emphasis on data-driven methods [15]. Extracting extensive features from limited cycle data is pivotal for enhancing predictive models. However, as batteries age, they often exhibit a nonlinear degradation phenomenon known as the “knee point” [16,17]. Accurately predicting this critical transition poses a significant challenge for AI methods with limited monitoring cycles.
Figure 1. Capacity degradation for (a) each cell and (b) the battery pack [18].
Energies 16 06887 g001
To circumvent these limitations, researchers have advocated the integration of AI methods during the manufacturing phase. By doing so, AI can encompass the intricacies of battery production that impact its longevity, offering a comprehensive approach to address these complexities [16].
The technical literature investigating single-cell aging phenomena is very rich; nevertheless, it is pivotal to point out how, in real life, BESS performances are correlated to a much more complex architecture than a single cell. The behavior of cells in a BESS is strongly influenced by the battery management system (BMS), power conversion system (PCS), and control rules. Therefore, it is hard to extend the models, protocols, and data from the cell level to higher levels, such as pack level and utility-scale BESSs. Moreover, the available laboratory tests at the cell level cannot be implemented in real-life BESS analysis [18,19].
Various models are available in the literature for estimating the SOH of a battery (in this paper, the SOH will represent the capacity fade of the battery); among them, physics-based models have a high accuracy in estimating and calculating the cell’s SOH using nonlinear partial differential equations. The main disadvantage of these models is that they are strictly related to the battery’s chemical parameters, which are not available (not with proper accuracy) at the large storage level [1]. Moreover, as mentioned above, a real BESS has different elements and loads, and none of them are properly taken into account in the physics-based models presented in the literature, making them not suitable aging models for BESSs [2].
The significance of battery energy storage system (BESS) aging can be examined from various perspectives. The aging of the battery will introduce nonlinear behavior [20] and uncertainties to the system and can impact the efficiency and performance of the system. Moreover, they can also cause instability for the power converters [21,22]. Also, from the financial point of view, it has been proved that in the aging-aware methods for optimizing and controlling a BESS (which benefit from an aging cost in their objective functions), both the lifetime and profitability of the system will increase dramatically [23].
This paper provides a concise overview of aging mechanisms within electrochemical cells and explores the existing literature proposing tests for modeling electrochemical cells. Subsequently, the investigation shifts toward tests conducted on BESSs, aiming to identify methodologies for quantifying and modeling both performance and aging processes.
The selection of papers for this study was based on recent approaches that introduced test protocols specifically tailored for developing aging models for BESS systems. It is noteworthy that there is a limited number of papers addressing the modeling and aging estimation for BESS equipment, as the prevailing focus has been on single cells. Consequently, this paper also delves into approaches dedicated to scaling up single-cell tests to the level of BESS systems.
Given the principal objective of this manuscript to review test protocols encompassing the entire BESS system, papers explicitly targeting this objective were subjected to a thorough examination. Notably, a comprehensive comparison of these test protocols is provided, encompassing the key steps of the experiments, along with their respective advantages and disadvantages.
This review holds significance as it places a central emphasis on BESSs rather than individual cells. Moreover, within the existing literature, there is a noticeable absence of reviews that concentrate on testing methodologies. Most of the comparable review articles in the literature center around single-cell models, particularly those derived from laboratory data, disregarding two crucial considerations. The first pertains to the lack of available data at the BESS level, data that these models depend on. The second concern is the absence of guidance on the testing procedures within these articles. Thus, this paper takes strides to address this informational gap by providing more pragmatic explanations of these tests.

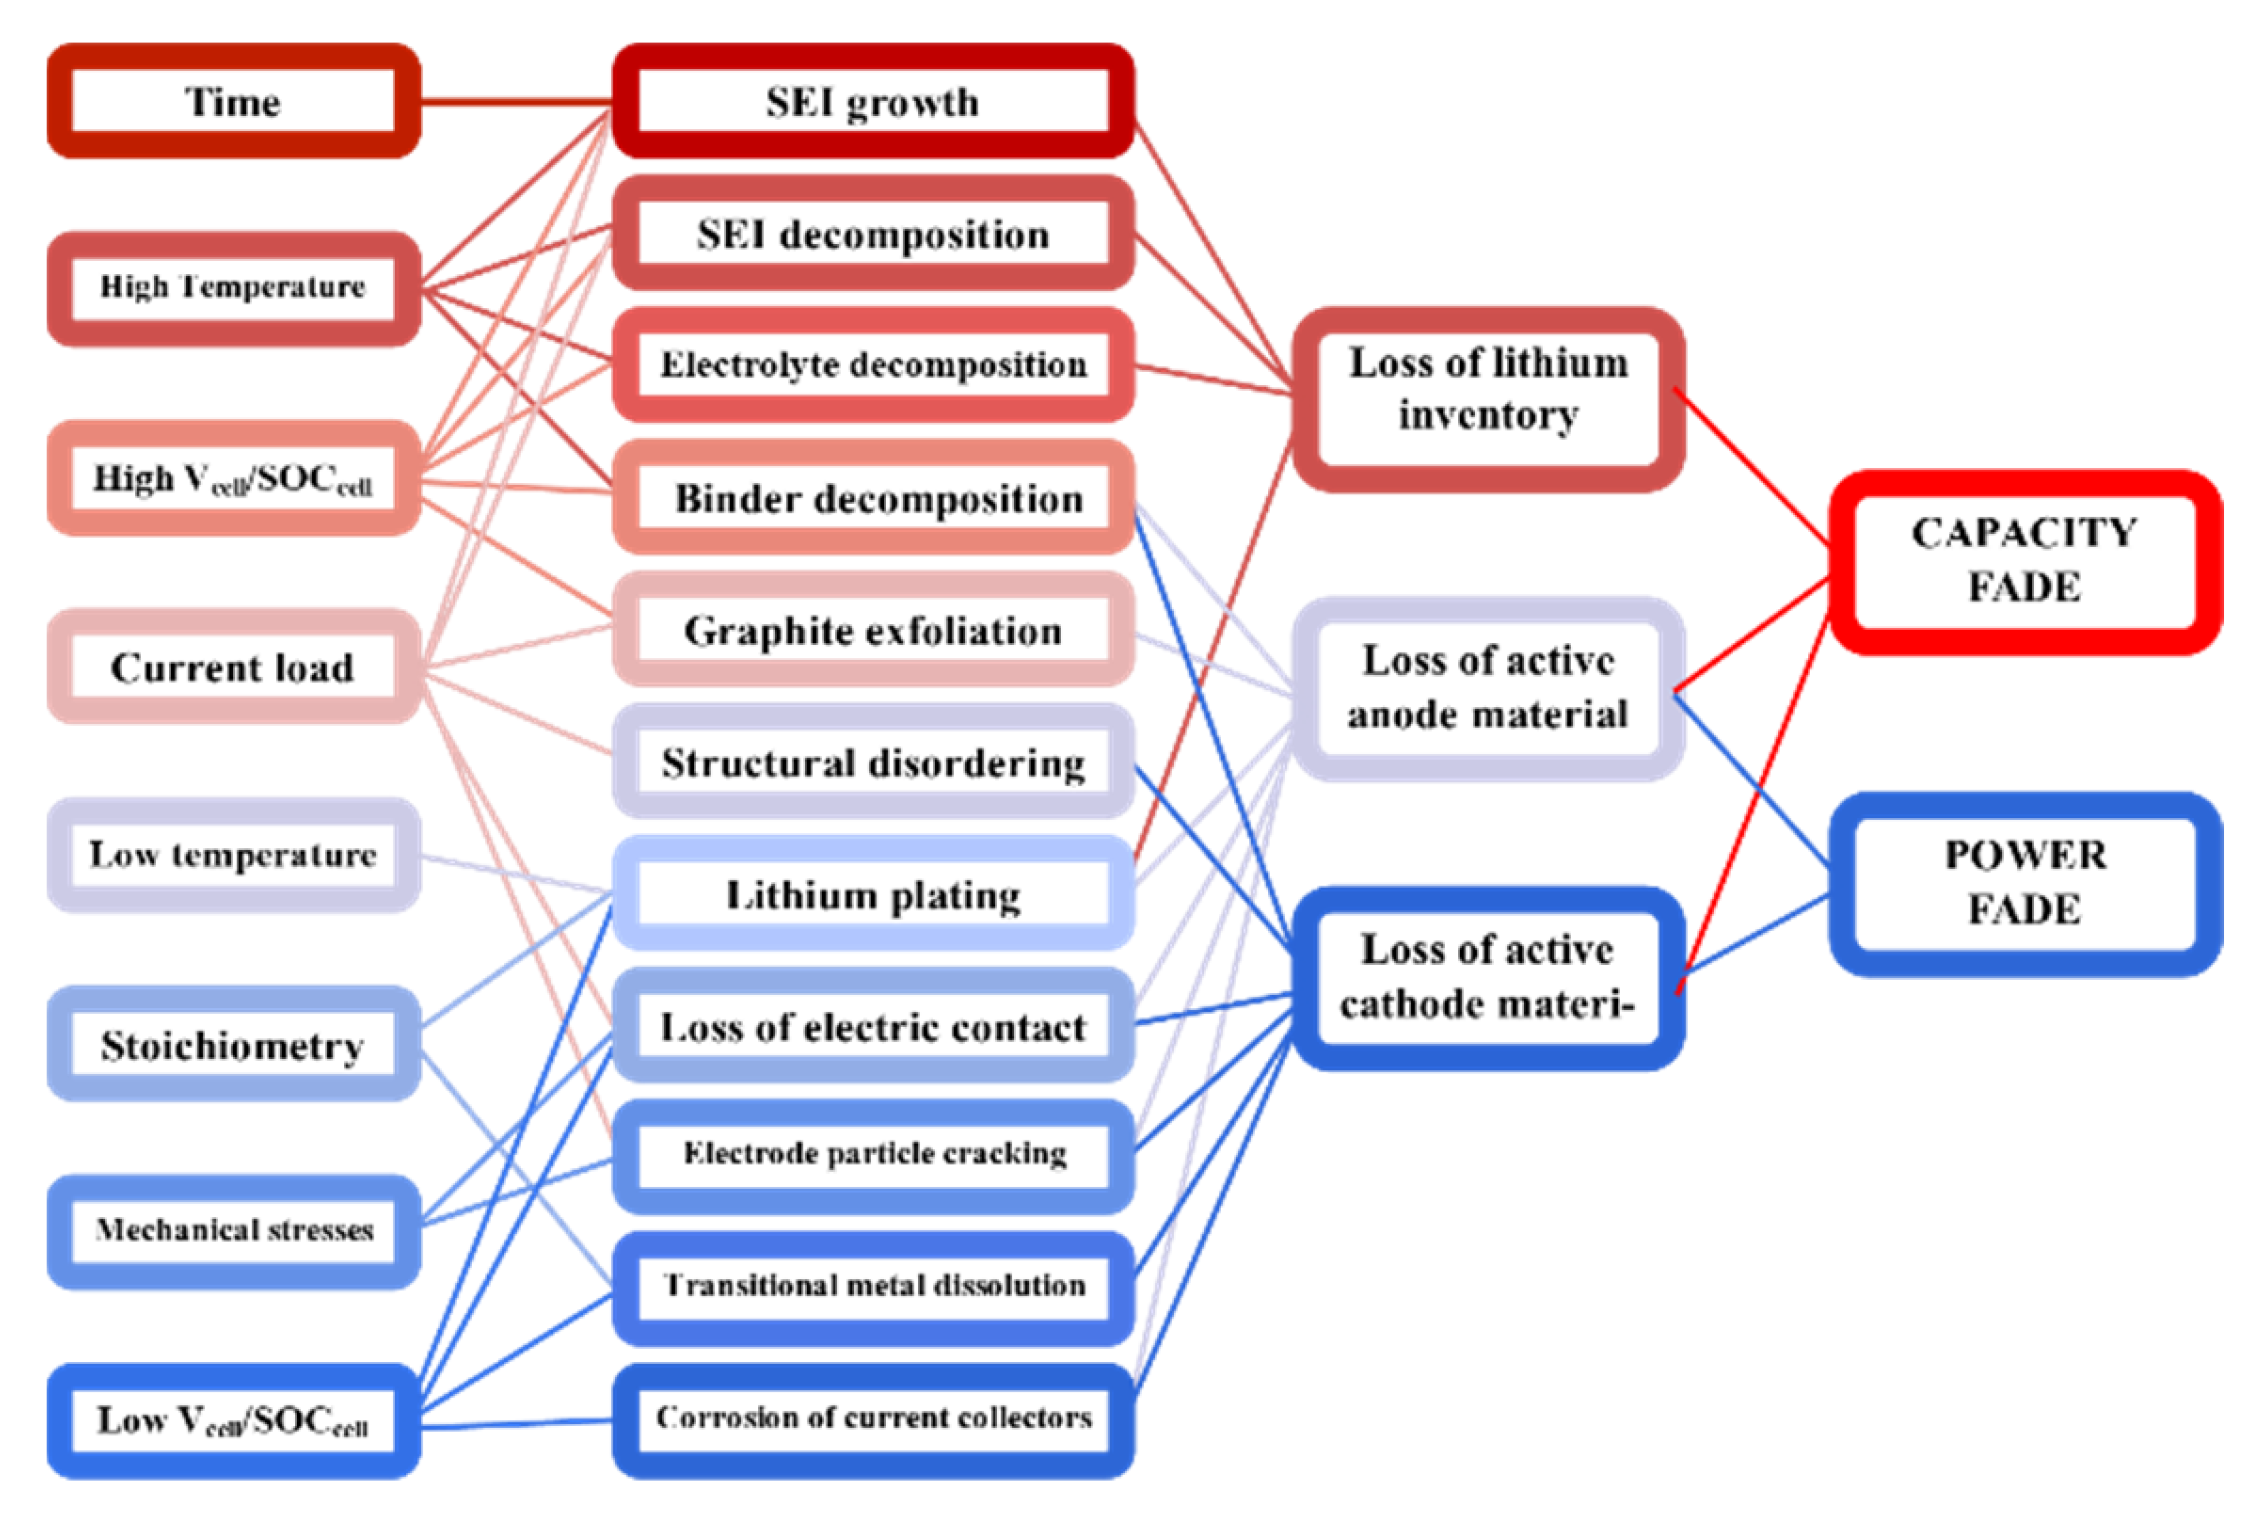
2. Short Recap on Aging Mechanisms

The aging in lithium-ion battery cells occurs because of the side reactions inside the battery. There are different aging mechanisms in a cell, such as loss of active material, active material dissolution, surface cracking, pore clogging, solid electrolyte interphase (SEI) kinetics, diffusion into SEI, electron tunneling, and lithium plating. The effect and the formula of each mechanism can be found using the physical-based models. Because of the complexity of these models, it is not possible to consider all mechanisms together. Therefore, each study focused on some of them. Generally, it is possible to relate all the aging processes to one of the following modes [24].
  • Loss of lithium inventory
Lithium ions are affected by parasitic reactions, which lead to capacity fade. Various reactions are responsible for this mode. The main one is the growth of the SEI layer; it occurs from the reaction of lithium ions and electrons from the electrode [24,25].
  • Loss of active material in anode and cathode
Due to some physical phenomena, such as particle cracking (which occurs because of alternating stresses), the active mass of the anode or cathode may no longer be available for reaction with lithium [24,25].
Also, the cause of each mode and its relation to the degradation modes are shown in Figure 2 [25]. These are only the ones related to the thermodynamics of the battery, which has an effect on its open circuit voltage (OCV).
Generally, it is possible to say that battery aging can be divided into calendar aging and cycle aging. Calendar aging is mainly affected by time, the level of state of charge (SOC), and the temperature (Tc). It means the level of degradation that occurs in batteries during idling. Thus, it is possible to write the calendar aging (Lcal) as [3]:
L c a l = f ( t , S O C ,   T c )
Cycle aging is the degradation that occurs to the battery each time it charges or discharges. According to [26], stress factors are the statistical parameters that relate the aging of the battery to the condition of the battery. To avoid considering effects that could be not significant, stress factors should be defined according to the application. In general, the stress factors that affect the cycle aging can be categorized in Figure 3 [3].

Single-Cell Aging Models

As we discussed earlier, there are clear differences between models used to understand the aging process in individual cells and those applied to BESSs. However, despite these differences, there’s a valuable reason to examine existing aging models designed for individual cells. This examination could potentially inspire the development of models for BESSs. So, in this section, we take a brief and summarized look at the various aging models used for individual cells.
The existing models in the literature can be assigned to one or more than one of the following categories [27].
  • Electrochemical models: Based on the detail of reactions that happen inside of the battery. The main core of these models are the cell’s electrochemical models, such as P2D models, SP models, and extended SP models [20,28,29]. For example, the degradation model in [30] has been developed based on three main assumptions. First, they assumed that no overcharged or undercharged will occur. Secondly, the aging in the cathode has been neglected, and thirdly, aging caused by internal mechanical stresses has been neglected. By solving the equations for the transfer function between the aging representatives (which are capacity loss, SEI resistance, and deposited layer growth). They were able to predict the remaining capacity of the battery with a maximum error of 3%. They used EIS, X-ray diffraction and X-ray photoelectron spectroscopy, and electron microscopy to gather data. To validate the models and obtain the model parameters, they cycled the cells in a temperature chamber at 25 °C with a defined protocol at 1C, 2C, and 3C. According to various research [30,31], the side reactions at the anode are the main cause of degradation in electrochemical cells.
    In [32], based on the extended SP model of the battery, and with the help of cycling aging and EIS test, the correlation of the model factors and cycling of the battery has been obtained. The detail of obtaining each model identification has been explained in the paper. According to their results, it can be said that at 1C, besides three identifications, the correlation of the other identifications with the number of cycles was not that high. But, as they mentioned in their paper, this way can be a suitable approach to finding and building an electrochemical model for the aging of the battery. The same approach has been adopted in the [33]. Indeed, they used particle swarm optimization for the identification of the model parameters. The errors obtained by fitting the model for predicting the remaining capacity were between 2% and 4% based on the data fed to the model. In order to reduce the number of parameters in the electrochemical model, in [34], they used a fractional order of simplified P2D model known as SPM. By doing so, it is possible to estimate the capacity and resistance.
  • Equivalent circuit-based models: Based on the understanding of the physical and chemistry of the cell, it is possible to model the battery as an equivalent circuit model (ECM). An ECM has three major parts. The thermodynamics of the battery has been shown by a static part. The kinetics aspect of the cell has been modeled with a dynamic part and, finally, a load to complete the circuit for charge and discharge [35]. A circuit was developed by [36] to see the effect of aging. The constant phase element (CPE) has been used to model nonideal impedances that occur between the anode and cathode electrodes. Also, for modeling the diffusion process, a Walburg impedance has been used. Then, with the use of the EIS test, the parameter of the ECM was achieved every 30 cycles. Therefore, the relation between every parameter of the circuit and the SOH of the battery was investigated. A more simple approach has been carried out in [37] using the cell’s Thevenin equivalent circuit. The relationship between the circuit parameters and SOC, SOH, and temperature was investigated experimentally by performing HPPC and capacity tests at different temperatures. The results were then used in a look-up table to predict the terminal voltage. In a more complex model, in [38], an ECM has been used along with a minimal electrochemical model (MEM), which is based on the loss of lithium inventory to estimate the SOC and SOH of the battery. A recursive least squares method was obtained to identify the ECM parameters online, then using an unscented Kalman filter (UKF)—which is a state estimation algorithm for nonlinear systems—the SOC(ECM) (this is SOC estimated from ECM) can be calculated. Then, the corrected current can be calculated and fed to the electrochemical model to estimate the SOC and SOH.
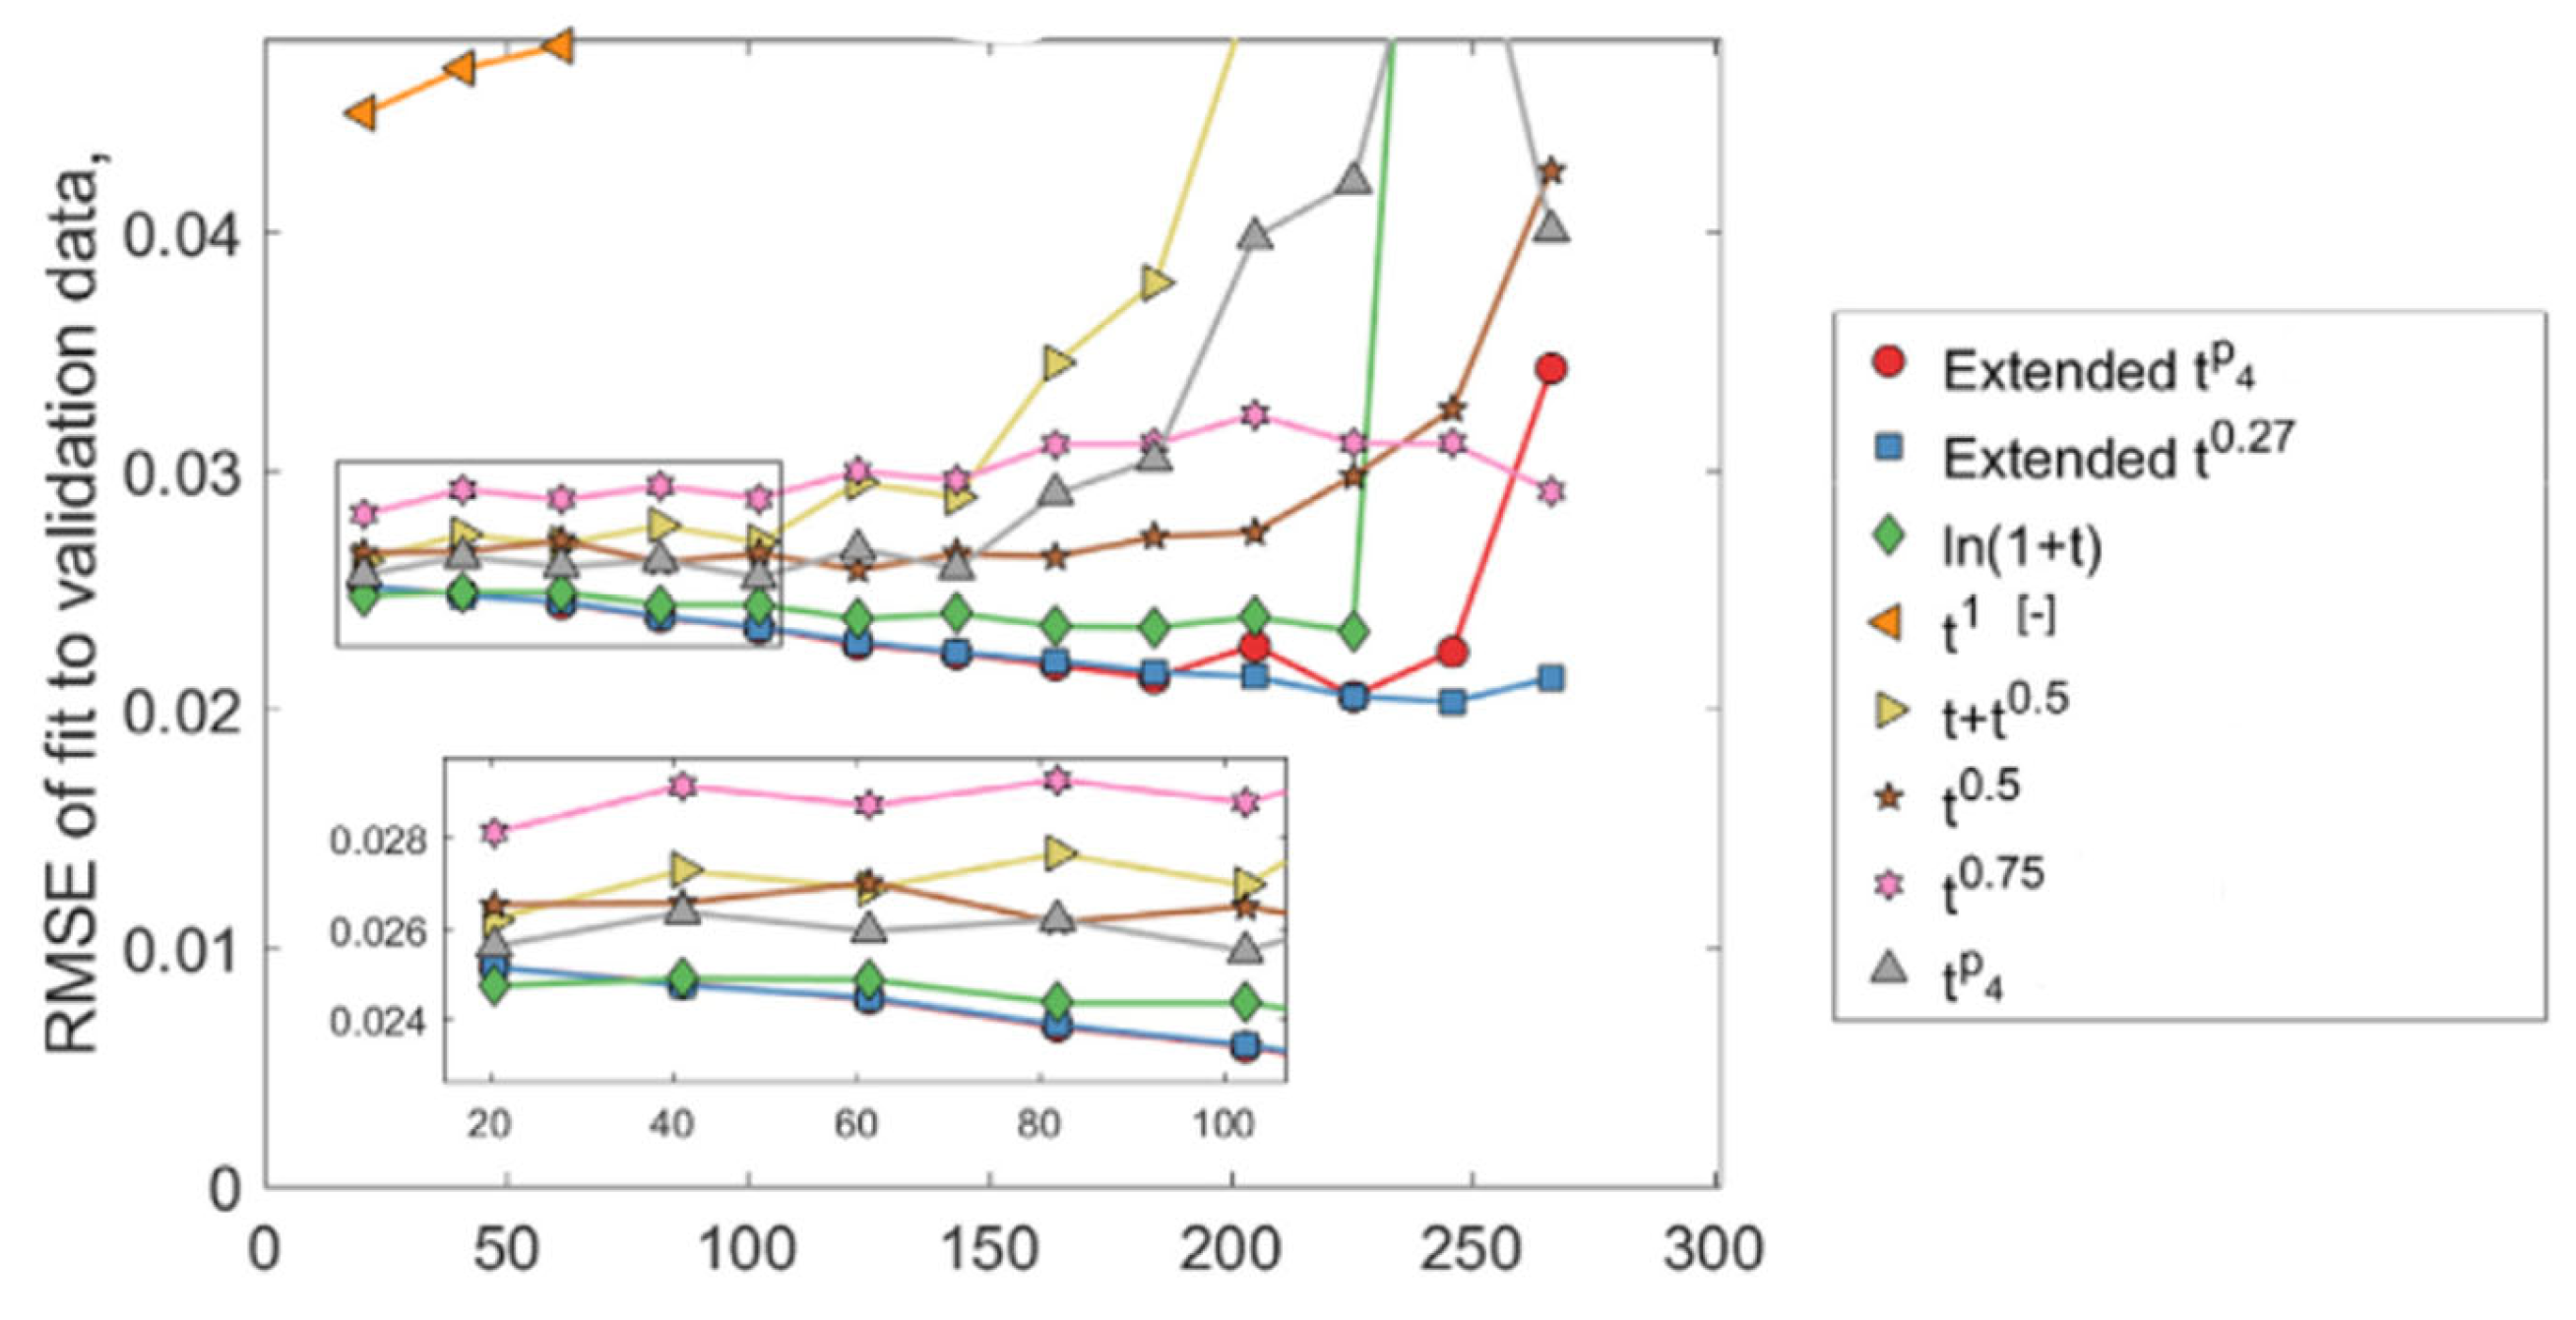
  • Performance-based models: This approach is based on finding the relationship between stress factors and aging parameters of the cell, such as capacity fade or resistance increase, by doing experimental tests. It is possible to divide this method into three categories: cycle aging, calendar aging, and global aging [27]. To provide an example, one of the most famous formulas for calendar aging is to consider the relation of capacity and time as a root square. In [39], they proposed another combination, such as t 0.75 or ln   ( 1 + t ) . Then, by fitting the data in each formula, the results were compared as shown in Figure 4. These models are the most suitable models to use in machine learning. Also, in [40], they use a deep learning architecture called an attention-based long short-term memory network (ALSTM) to model the calendar aging. The ALSTM network is designed to integrate both knowledge-based features, such as the battery chemistry and operating conditions, and data-driven features, such as the battery’s discharge profile and temperature history. Similarly, in [41], a degradation and cycle life prediction model was built based on the Arrhenius equation, which takes into account several factors that contribute to battery degradation, including temperature, state of charge, and the number of charge–discharge cycles. After proposing the model, a particle filter-based data-driven method was introduced to track the model parameters. In a more complex model, in [42], they tried to optimize a support vector regression using the data available about the temperature, SOC, and time effect on the calendar aging. The results showed that using these data improves the prediction of calendar aging by increasing the R-squared by around 0.1 with respect to a classic SVR.
  • Empirical and statistical approaches: The empirical models are the ones that are trying to find the relation between stress factors and the cycle or calendar aging in the batteries, based on the data gathered from the experiments without considering deeply the physical or chemical side of the battery [27,43]. To be exact, empirical models benefit from the machine learning algorithms fitting a curve in experimental data. In [44], different neural networks have been used to fit the data obtained from the cycling and IC experiments. These models are suitable for the prediction of the RUL. For example, in [45]. A neural network (NN) was applied to establish the link between stress factors and SOH. Subsequently, a bat-based particle filter was employed to dynamically adjust the NN-derived model online, enabling the prediction of RUL while aligning with the battery’s SOH pattern. Similarly, in [46], they used the voltage, current, and capacity of the cells to predict the RUL using empirical decomposition and LSTM. A more complicated algorithm has been adopted in [47] by proposing a capacity forecast generative adversarial network-based (CFGAN) model. To obtain the best from the GAN-based network, they use a conditioner so the data that the generator builds would be more accurate. The results show that, compared to other deep learning models, the CFGAN has better accuracy in point and probabilistic forecasting of calendar aging.
    An important fact in using empirical models is the situation of the tests. The more the tests are in a controlled situation, the better the results. As indicated in [43], a proper dataset should use full equivalent cycles (FECs) or equivalent measures such as the number of cycles or Ah throughput. It also should determine the chemistry of the tested LIB reference and keep stress factors such as temperature, depth of discharge, mean state of charge, and charge and discharge rate constant throughout the entire static degradation test. In addition, the magnitude of these stress factors should be determined for each deployed test. After cycling the cells, the measurement tests are playing a very important role. In [48], they used incremental capacity analysis (ICA) and integrated voltage (IV). In [49], they used the low-frequency EIS measurements and Gaussian regression model to fit the data. On the other hand, it is also possible not to use any additional experiments. As in [50], they just used the remaining capacity of the battery in different temperatures and DOD to find the relation between capacity and stress factors. In [51], they combine a support vector regression model and an extreme learning machine model to extract features from the battery signal, which just consists of the cycle number and capacity of the battery.

3. Tests for Single Electrochemical Cells

There are various ways to test an electrochemical cell. It is possible to say that the aging tests mainly consist of two steps. One is how to cycle and age a cell, and the second step is to use an experimental test to characterize the cell and use the obtained data to create a model. Various aging procedures are available in the literature. However, since it takes much time and equipment to check all the aging factors, some studies adopt assumptions in order to limit the research space; for example, many tests are performed at constant temperatures [34] even though the temperature plays the main role in aging of a cell [39].
Aging experiments can be divided into calendar and cycle aging. To measure the calendar aging, different cells with different defined voltages can be bounded at the same temperature. In order to have a precise experiment, the cells should be recharged to their defined voltage daily. Then, during the weekly checkups, measurements should be performed on the cells. Finally, specific tests should be performed in order to evaluate the temperature’s influence on SOH, e.g., storing some cells with the same voltage at different temperatures [39]. To measure the cycle aging, cells can be cycled in different operating conditions (i.e., different current rates (C-rates), depth of discharge (DOD), etc.). In some studies, the effect of the C-rate has been neglected [3], and it has been shown that if the C-rate is low enough (at a constant temperature), it does not have an effect on the aging of the battery [52]. On the other hand, since it is one of the available measurements, in many studies, it has been considered as an input to the model. Additionally, in [41], it has been shown that using a constant current rather than a variable current can provide more accurate information to model the battery or predict its remaining life. This leads to more reliable data, but on the other hand, such an assumption is not realistic with respect to the current profile the storage will be asked to manage. An example of cycle aging has been provided in [48] using constant current for cycling different chemistries with different DOD. It is notable that the amount of the cycling current should be chosen according to the chemistry of the cell.
Moreover, before cycling tests, a characterization should be performed to obtain a clear and reliable picture of the initial status of the battery. As an example, a protocol in [48] suggests that the capacity can be measured after preconditioning the cell. Pulse tests with various C-rates and electrochemical impedance spectroscopy (EIS) measurements could be performed in order to acquire more information.
Generally, to characterize a battery (before and after aging experiments) and set up a detailed cell model, advanced techniques could be adopted: EIS, X-ray diffraction, X-ray photoelectron spectroscopy, and electron microscopy [30]. Moreover, some studies have used hybrid pulse power characterization (HPPC) or low-frequency EIS tests in order to build an equivalent circuit model for the cell [37,49].
Other approaches are based on more straightforward tests: the capacity can be measured with a static discharge method, the resistance can be measured with a dc internal resistance (DC-IR) test [34], various features can be extracted using incremental capacity (IC), derivative voltage (DV) or integrated voltage (IV) curves, which are just based on voltage and currents measurements. The extracted features from these methods can then be used to estimate the SOH directly or indirectly [44]. The IC and IV curves can be obtained online without detaching the battery and the need for any extra instrument, which is a very big advantage. Therefore, they are considered as important methods. The IC analysis (ICA) can be used to map the relationship between the capacity and the voltage of the cell during charging and discharging through a differential equation [44]. It can be calculated from (2) directly from the measurements of current and voltage [48].
I C = d Q d V
where Q is the charge or discharge capacity, and V is the battery’s terminal voltage. The charged or discharged capacity can be easily calculated by integrating the measured current over the time interval. One of the main issues regarding the ICA is that since the measurements are always noisy and there is a differentiation in the method, even very low noises will give rise to high unwanted peaks. Therefore, always using a filtering method for this analysis is suggested in the literature [53]. Several studies used the IC curves along with machine learning methods for estimating the SOH [44,48,53,54]. Moreover, it has been investigated that there is a strong correlation between SOH and IV during the charging phase of the cell. IV can be calculated based on the two predefined voltages as in (3). Where v is the voltage across the terminals of the battery and t0 and t1 are related to the instant that the terminal voltage reaches the two predefined voltages. These voltages play the role of a reference in calculating IV and should be chosen based on the application and chemistry of the battery [55].
I V = t 0 t 1 v d t
Given the large amount of data and experiments required to properly model an electrochemical cell, several papers adopt public (open access) datasets provided by external labs, e.g., the data repository of the National Aeronautics and Space Administration (NASA) [38,51]. NASA dataset is based on the following protocol. First, the cells are cycled with randomly generated profiles (i.e., random walk algorithm). Then, after a certain number of cycles, a reference charge and discharge occur to estimate the capacity fade. Nevertheless, since the cycling profile is random, the charge and discharge capacity may not be equal, and this causes uncertainty in the data. The final output of the test is the profiles of current, voltage, and SOH.

4. Tests for BESS Aging Models
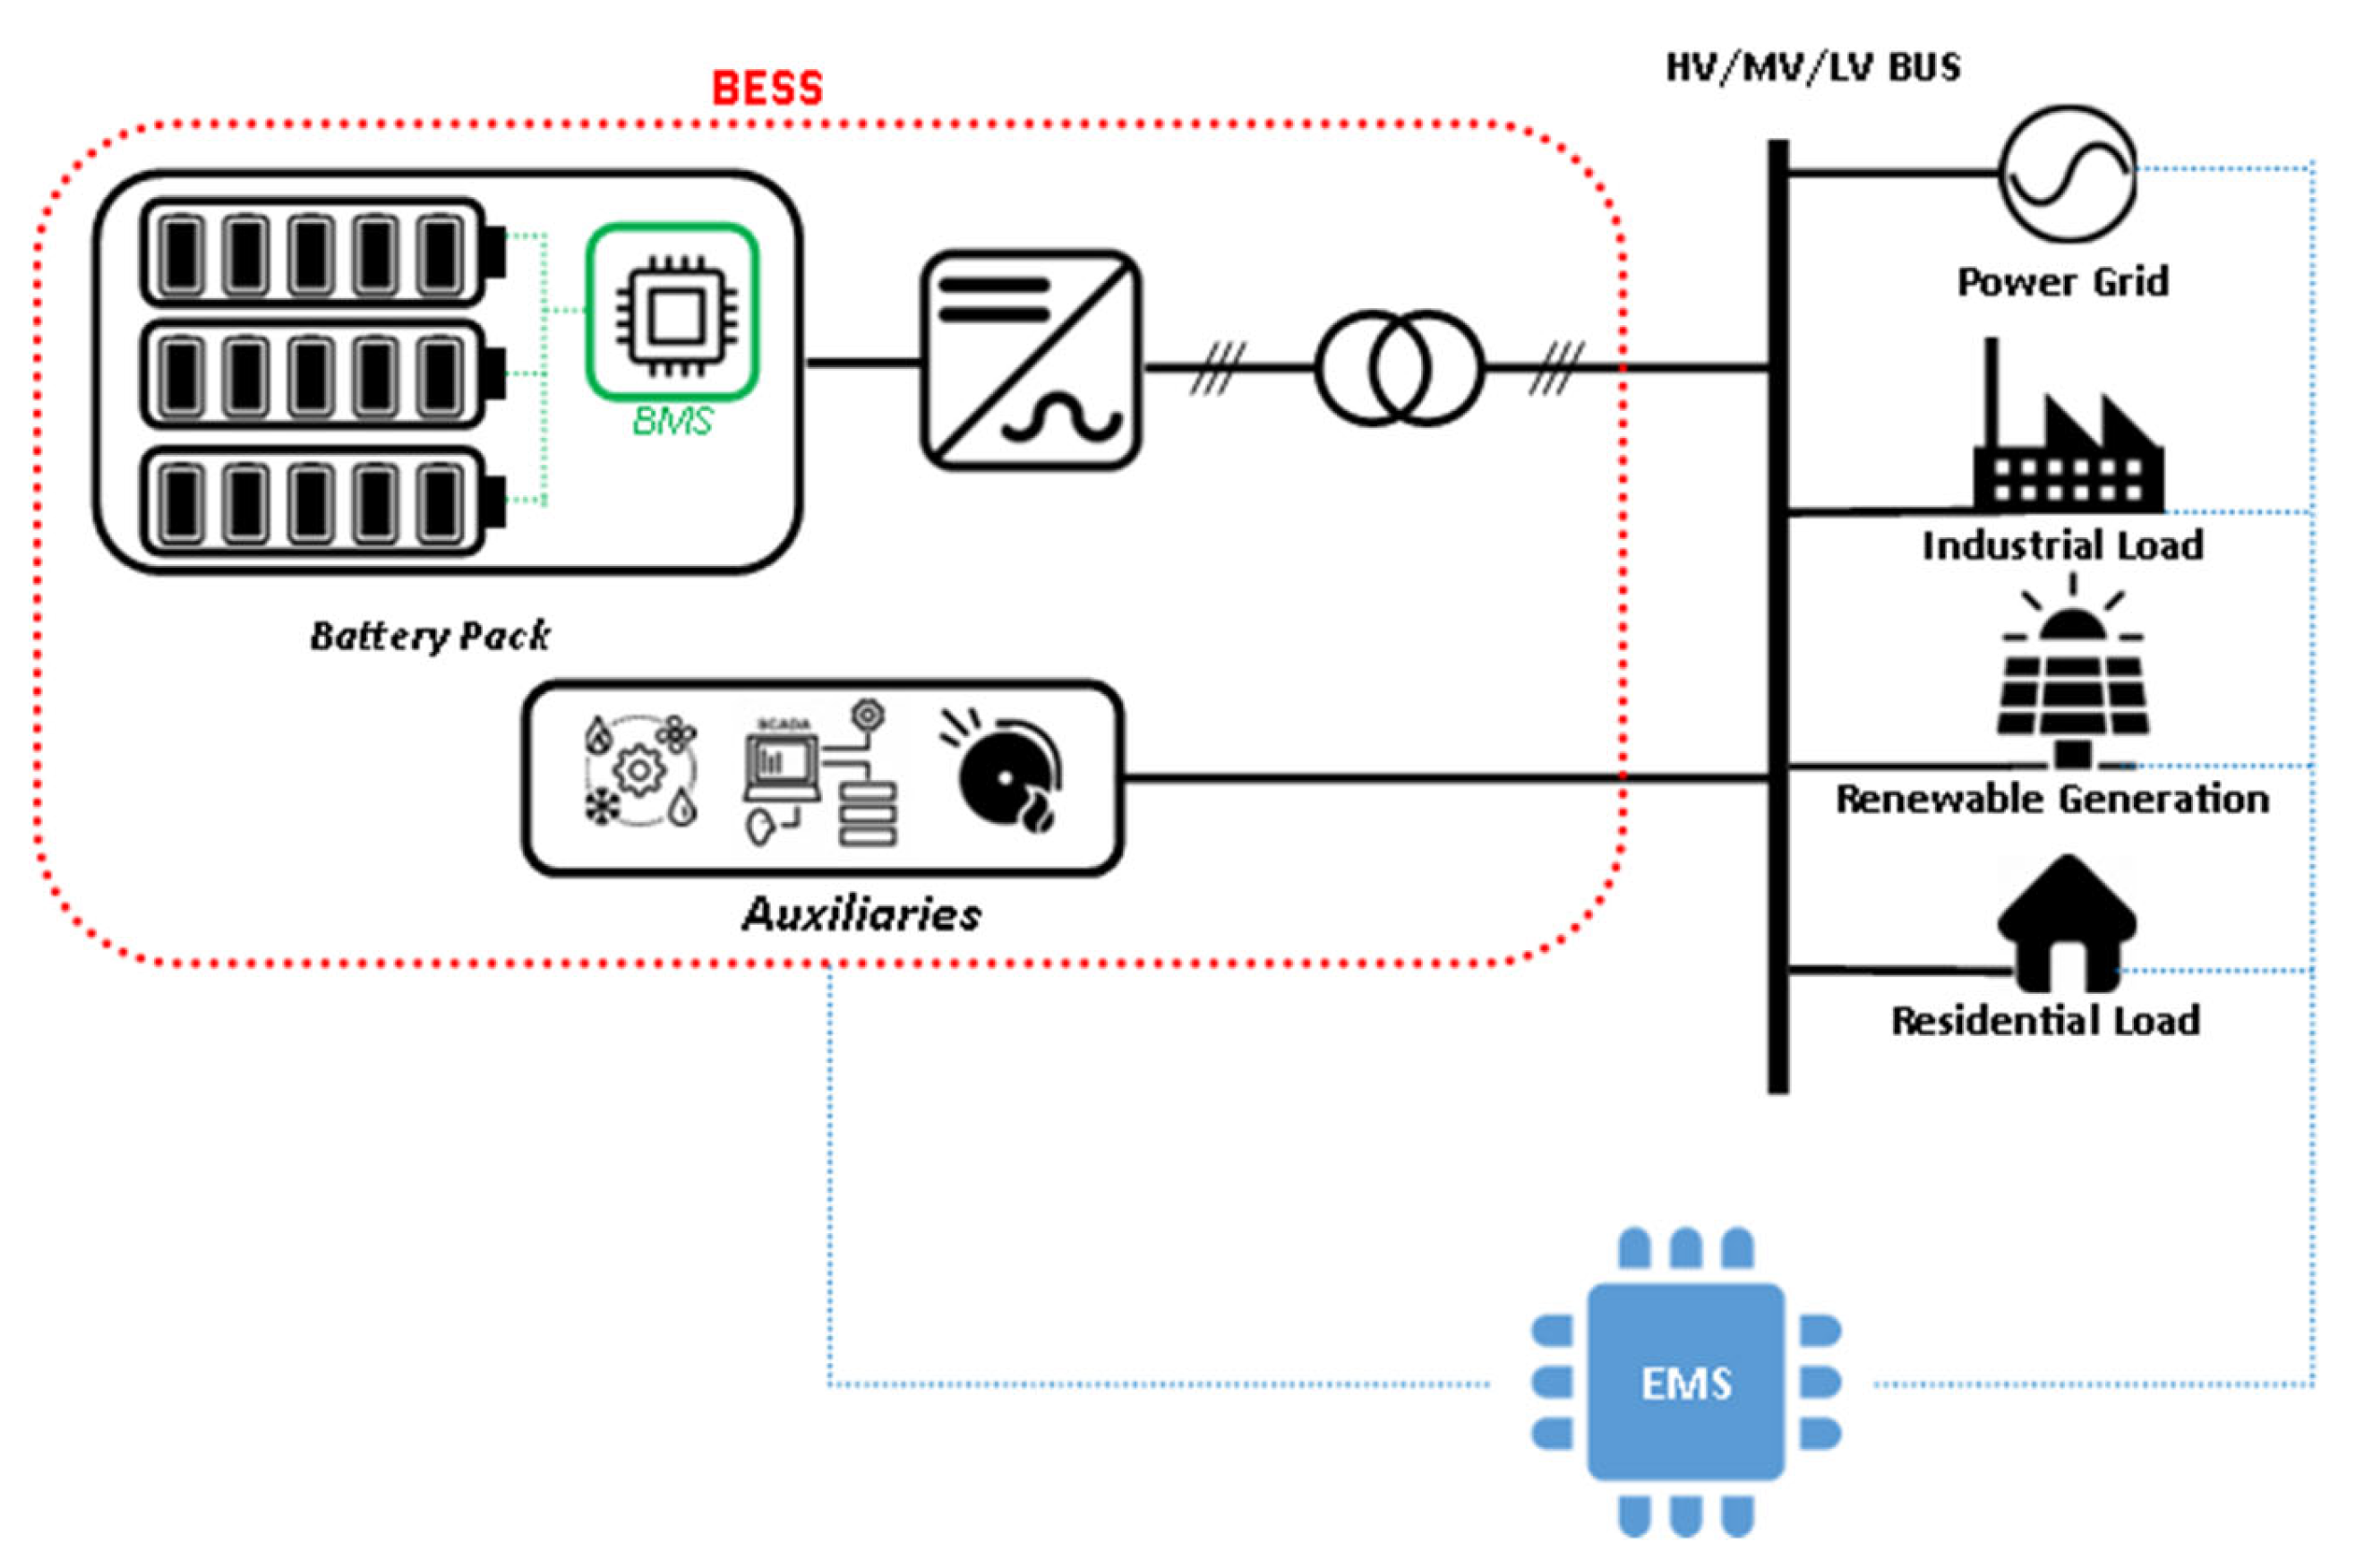
As mentioned earlier in this paper, the focus of the proposed review is on BESSs, a complex architecture that is typically approached with oversimplified models. Therefore, we first have a quick glance at what the BESS is and how it is structured and then move to the tests for aging models.

4.1. BESS Structure

The structure of a BESS is shown in Figure 5. A BESS consists of four major parts: the battery, the PCS, the transformer, and the auxiliaries. Depending on the application, the BESS may connect to HV/, MV, or in some cases (e.g., residential cases) to the LV busbar. Any of the loads and generations that are shown on the right side of the busbar may or may not be present in the system.
One important issue in understanding the BESS structure is that each element within the BESS will vary depending on the specific application. For instance, the battery can be either a lead-acid battery, a lithium-ion battery, or any other available battery type. The selection is always influenced by factors such as cost and technical characteristics, such as capacity or power versus size [56]. The same principles apply to power converters, where different types of inverters are suitable for use in BESSs. Depending on the specific application, factors like reliability, failure rate, cost, and various other considerations should be taken into account during the design phase [57].
In addition to these components, several crucial management systems play a vital role in the operation of a BESS. These systems include the battery management system (BMS) and energy management system (EMS).
The BESS’s battery is constructed by connecting multiple cells in both series and parallel configurations. The BMS plays a pivotal role in maintaining equilibrium among these cells during the charging and discharging processes. Within the existing body of literature, various BMS strategies have been developed, each aimed at estimating the SOC and SOH more accurately. One such strategy involves ensuring that the cell voltages are maintained above a specific threshold, far from their extreme voltages [58]. In general, the BMS could be seen as a necessary monitoring device that also produces the opportunity to not only connect cells but also connect multiple battery racks with separate BMSs to each other to be operated as one.
The EMS plays a pivotal role in overseeing the entire system. To put it more precisely, the EMS is the system in charge of establishing the desired power setpoint for the PCS. In essence, EMS algorithms gather comprehensive data from the system and then configure the PCS power setpoint accordingly. Each unique EMS algorithm is designed for specific purposes, such as load peak shaving, arbitrage, or residential applications [59].
Auxiliary systems play a crucial role in ensuring the proper operation of a system. These auxiliary systems encompass various components such as SCADA, fire alarm systems, and thermal management systems like HVAC. There are two primary reasons for incorporating these auxiliary systems into BESS models. Firstly, their performance directly impacts the effectiveness of the BESS; for example, the performance of the HVAC system directly correlates with cell temperature, a critical factor in BESS performance. Secondly, their overall energy consumption cannot be overlooked within the system, thus influencing the overall efficiency of the entire system [60,61]. Studies showed that neglecting the consumption of an auxiliary system can introduce a 10% error in calculating the efficiency of the BESS. Also, in low powers, where the consumption of the auxiliary systems becomes more noticeable, the efficiency of the BESS can drop to 65% [62].
The preceding discussions highlight the complexity of constructing a precise model to elucidate BESSs. As will become evident in subsequent chapters, integrating an aging model into these existing models presents an even greater challenge. This is because a robust aging model must consider the influence of all constituent elements within the BESS.

4.2. Tests

As mentioned in the last section, the BESS is a complex structure that many models aging models do not take into account. For example, many existing methods and models tend to overlook the significance of these auxiliary components despite their non-negligible impact. The control of the HVAC system has a strong impact on the aging of the battery since the cells will age more under higher temperatures; thus, a suitable aging model should consider this relation [19,63]. Moreover, each of the elements in the BESS has its separate degradation. For example, power inverters can be degraded for reasons such as temperature. The capacitors, metal-oxide-semiconductor field-effect transistors (MOSFETs), and other parts can be degraded, not only affecting the efficiency of the inverter but also causing failures. The same reasoning for every element of the BESS can lead to motivations of needing an aging model that considers more than just a single cell in a BESS [64].
To cover the lack of information, some studies suggest using the models developed for batteries in electric vehicle (EV) applications. However, there are some issues. The storage system in an EV consists of a battery pack, while the storage system in a BESS consists of multiple battery packs that connect to each other [65]. This makes it difficult to expand the temperature-based degradation models for EVs (such as the one in [66]) to the BESS level since, in a BESS system, the dispersion of the heat is different with respect to an EV [67]. Furthermore, the cell chemistries used in EVs are confined by factors like volumetric/specific energy density and the need to provide sufficient capacity for a single charge to achieve the desired driving range. However, in the case of BESSs, there are no fixed requirements or predetermined end-of-life criteria that dictate the choice of cell chemistry [65]. Additionally, from the performance point of view, there are critical differences between BESSs and cells used in EV applications. The load shapes of BESSs and EVs are different. The degradation models in EVs mostly assume a daily charging pattern. This is not true for BESSs since they mostly follow a stochastic charging and discharging pattern [3]. This is important since it has been shown that the difference at the end of life (EOL) of the BESS can vary from around 2 to 18 years based on the services that it provides [32]. Therefore, it can be said that the available models in the literature based on EV applications cannot easily be extended to BESS applications, and a dedicated model is needed [68].
Other than the technical issues indicated in the last paragraphs, it can be said that the cost of experimental campaigns for BESSs is very high, and most of the tests available at the cell level cannot or will not be operated by BESS owners since most of the aging tests consist of rapid charge and discharge of the battery [23,68]. Therefore, in the literature, the tests that use a utility-scale BESS in order to find and build an aging model cannot be found. On the other hand, there are some tests that tend to characterize and identify the parameters of the BESS, such as efficiency, capacity, etc. In the long run, these tests can be used to export data for empirical or semi-empirical aging models. Moreover, there are some alternative methods that use the available data from single-cell tests to prepare a model for BESSs or try to build a model without performing any special test on the BESS and just gathering information from the field.

4.2.1. BESS Characterization Tests

Characterization tests in BESSs are important since they test the whole BESS, not just the batteries. In order to model the behavior of a BESS, different test procedures have been proposed in the literature. These procedures are detailed in the following and summarized and compared in Table 1.
In [69], the authors proposed a relaxation test consisting of 34 unevenly spaced points and 4 h relaxation between each to measure OCV. The capacity was measured with a standard constant current and constant voltage (CCCV) profile after an additional 12 h of relaxation phase, and finally, the impedance was measured with ±0.5C pulses at different temperatures and SOCs. Other than voltage tabs to measure the variation in cell voltages, they also installed thermocouples to monitor the temperature distribution within the module. The obtained data can then be used to characterize the battery module and calculate the module voltage (which was around 42–58 V) with suitable accuracy. The average mean error of module voltage was 81 mV with respect to the predicted one, and the maximum absolute error was 361 mV. The tests were performed at the module level without considering the PCS and the auxiliaries; therefore, the results cannot be used to predict the behavior of a BESS. On the other hand, they provide very suitable details about the differences between the cell and the module, making it easier to model the module. A more complete study has been carried out in [70] on a 48 V/200 Ah BESS. During the experiments for measuring the efficiency, they took into account that the power absorbed by the auxiliaries should not be considered a useful power since it does not contribute to the requested service. Therefore, a comparison between the electrochemical and the whole system efficiency was made, and it was revealed that, based on the required service from the BESS, the actual efficiency of the system can be limited to 60%, while the electrochemical efficiency is more than 90%. Furthermore, The authors in [71] declare that the total efficiency of the BESS can be calculated as the multiplication of battery (ηbat) and inverter efficiency for charge (ηinv.ch) and discharge (ηinv.dis). They evaluated a 10.6 kWh/6.4 kW BESS efficiency through IEC-61427-2005 standard [72] once at 1 kW and once at inverter nominal power (4.6 kW) and it has been shown that the total efficiency of the system (i.e., ηbat* ηinv.ch* ηinv.dis) is different by around 2% at different powers (82.57% and 84.86%, respectively). It is important to mention that the roundtrip efficiency of the battery was around 95%, which shows the importance of considering all the elements of the BESS in characterization tests. The IEC-61427-2005 standard discusses test procedures for storage systems, focusing on the battery packs combined with photovoltaic panels. The test consists of cycles without rest between charge and discharge at 100% DOD (within the limits declared by the manufacturer).
In [4], they declared that, for a 1 MWh BESS under limited operation (the operation of the BESS was limited by the grid control center), after two years, no significant degradation in terms of capacity was observed apart from the initial capacity fades for the cells. The efficiency was calculated based on a 50% DOD cycle at half of the rated power without considering the temperature as a parameter. They obtained 85% as the efficiency of the total system, while they believe that by neglecting the losses at auxiliary systems, the efficiency of the battery can reach more than 90%. Also, they discovered that while the efficiency of the battery will go higher at lower powers, in PCS, the trend is the opposite, and there is a decrease in the efficiency when you get away from the nominal power. From the author’s perspective, the most significant parameter that affects efficiency is power level. Therefore, the efficiency test that they did should be repeated at different powers. Such an approach has been performed in [63]. They proposed two characterization test procedures. First, measuring the SOC-OCV curve. The tests consist of complete discharge at the beginning and then, after a rest time, cycle at different C-rates to build the SOC-OCV and capability curve. The two lowest C-rates were used to measure the SOC-OCV curve so it could be as close to the real curve as much as possible. Another test is for characterizing the relationship between efficiency, SOC, and power. The test consists of charging (with 10 or 5% DOD) and discharging at constant power until reaching the initial SOC. Then, use a low (0.09 p.u.) power to reach the exact initial SOC. In this way, it is possible to measure efficiency for different working points of the BESS. They suggest that the procedure could be repeated at different time intervals in order to investigate the effect of aging on the BESS performance.
The most completed set of tests for characterizing a 1 MWh BESS has been reported in [73]. First, they measure the rated energy after some preconditioning cycles. They recommend repeating the measuring 3 times and accepting the measured capacity if the error was below 2%. Then, by performing a test at different combinations of active power (P) and reactive power (Q) limitations of the inverter, the power accuracy can be measured. The capability curve was measured by 600 s pulses at rated power and 60 s overload pulses. In order to find the capability curve, both the temperatures of the battery and the PCS were measured and monitored. In the end, to measure the efficiency, first, the battery was stabilized at around 5 °C of battery steady-state temperature (which is around 40 °C) by some preconditioning cycles, then the efficiency was measured by three consecutive full cycles at rated power with 100% DOD. Monitoring the auxiliaries and DC/AC conversion system can provide information for calculating the AC roundtrip efficiency. Also, in [74], capacity and resistance measurements were carried out on two storage systems (0.4 MW and 1.2 MW). Since the storage was not current-controlled, a constant power HPPC test was introduced as in Figure 6 to measure the DC resistance of the BESS. Furthermore, the small signal AC resistance was measured by the EIS test at the module level. By comparing the two resistances, although they were different in terms of value, the same aging track was observed. In [75], in addition to measuring usable energy and efficiency with 100% DOD at two different powers (rated power and C/5), they proposed response time and accuracy and a self-discharge test. They proposed to calculate the response time with three different power profiles based on active, reactive, and apparent power. For the self-discharging test, they proposed to keep the BESS on standby for 5 days and record all information at the beginning, during, and end of this time. However, the method has limitations: it only uses two powers, which does not allow the analysis of nonlinear behavior, and the tests are carried out at constant power, making it difficult to extend to non-constant power conditions. Additionally, the method only determines the roundtrip efficiency and not the “instantaneous” efficiency for minor cycles of variable shape, which is a normal operation of the storage system. Also, performing all the tests needs around 203 h, which is a long time just to characterize the system. If the self-discharging test is ignored, the total test time would be around 70 h, which is more acceptable.
Table 1. Summary of tests for BESS characterizations.
Ref.System Under TestTestsTest StepsOutcome of the TestStrong PointsWeak Points
[74]1. 0.4 MW
0.1 MWh (LiFePO4/C)
2. 1.2 MW
0.3 MWh (LMO2/Li4Ti5O12)
Capacity
  • Full charge the system, then 30 min rest to stabilize
  • Discharge with maximum power until it reaches a predefined threshold
  • Capacity fade vs. the total Ah throughput
  • Ability to measure both capacity and power degradation in time, leading to an accurate model
  • Can track the differences in power degradation at module and BESS levels
  • EIS at the module level needs a different module, or a module should detach from the system
  • A long time (169 days) was necessary to perform the 6 tests
DC resistance
  • Power-controlled HPPC test
  • Perform at the system level
  • Charge and discharge at maximum power for 18 s
  • Perform at different SOC (30 min. rest before each pulse)
  • Build an equivalent circuit model of the module
  • Calculate the power degradation
AC resistance
  • EIS Measurement
  • Perform at the module level, @ 90% SOC in the 10 kHz–0.01 Hz range
[4]1 MW
580 MWh
(Li-ion)
Efficiency
  • Using symmetrical cycle
  • Cycle @ 50% DOD
  • Constant power @ half the rated power
  • Obtain efficiency at a specific power
  • By repeating at different powers, the total efficiency vs. power curve can be obtained
  • The obtained efficiency includes losses in all the systems (e.g., HVAC, PCS, etc.)
  • The focus is more on the performance and not on the characterization. No aging information is available
[73]1 MW
1 MWh
(LTO)
Rated
energy
  • Preconditioning with some cycles
  • Cycle three times according to manufacturer’s power profile
  • Three discharge energy should have less than 2% deviation (otherwise, repeat the test)
  • The real energy can be obtained with a suitable reliability
  • The data provided in the paper can be decupled into battery and PCS
  • The characterization of the BESS is complete and provides a variety of information
  • The tests take into account the temperature of PCS and battery, which is ignored in most studies
  • Although the accuracy of the rated energy measurement procedure is quite high, it needs devoting much time just to measure the capacity
  • The temperature of the battery or PCS may not be available in all cases
Power
accuracy
  • Perform at inverter P and Q limitations
  • Measuring P and Q at the PCS to find power accuracy
  • The accuracy of the system (i.e., difference between the setpoint and the measured P and Q)
Capability curve
  • 600 s rated power test
  • 60 s overload power test
  • Temperature of the battery and PCS should be monitored
  • The capability curve obtained depends on the battery and PCS temperature limitations
Efficiency
  • Preconditioning to stabilize the battery temperature around 5 °C of steady-state temperature
  • Three consecutive full cycles at 100% DOD @ rated power
  • Calculating net and gross efficiency using the measured power
  • Measuring the auxiliary power consumptions using meters installed at the point of common coupling
[71]6.4 kW
10.6 kWh
(NMC)
Efficiency
  • Cycle at constant power without rest @ around C/8 and @ DOD 100%
  • Repeat all the procedures at the inverter’s nominal power
  • Efficiency at the capacity declared by manufacturer
  • The efficiency of the inverter can be calculated using the instant values of inverter power, and battery charge and discharge power
  • Possible to calculate the efficiency of the inverter and electrochemical battery separately
  • Using measurements that are available mostly at all BESSs
  • The low C-rates used will decrease the other factors’ effects on the performance
  • No power or any other characterization took place
  • The 100% SOC was defined at nominal capacity declared by manufacturer. The real capacity was not measured
[70]48 V
200 Ah
(FZSoNick)
Efficiency
  • Measuring efficiency based on the residential power profiles
  • The SOC should be restored at the end of the cycle with a low (0.05) C-rate in order not to affect the performance
  • The initial SOC was set to 60%
  • The efficiency for different types of power profiles considering the auxiliary as consumed power
  • Suitable for measuring efficiency with different profiles and situations since it is not complicated
  • Although all electrical variables were measured, only the efficiency was investigated
[63]570 kWh
250 kW
(NMC)
SOC-OCV and capability curve
  • Cycles at different C-rates
  • Steps: CCCV discharging, CC charging, CC discharging, CV discharging
  • The voltage should be measured at 4 points after each step, always after a settling period
  • SOC-OCV curve based on the low C-rates
  • The power capability curve for charge–discharge
  • A well-detailed test step with low computational effort suitable for aging models
  • Suitable for empirical aging models
  • Needs a long time
  • The temperature has been considered constant
  • The tests provide details about the BESS as a black box. No parameter (chemical or electrical) can be obtained for the BESS
Efficiency
  • Three different initial SOC
  • Charge and discharge with different C-rates @ 10% DOD
  • The battery should reach the initial SOC after discharge
  • Efficiency at three different SOC levels and different powers
[19]822 MWh
500 kW
(NMC)
Efficiency
  • Cycles @ different powers
  • Initial SOC:10%
  • @ 80% DOD (They are limited to this number by manufacturer; therefore, it can be said that the experiments consist of full cycles within the system limits. (i.e., it can be considered with initial SOC: 0% and @ 100% DOD)
  • Efficiency at different power rates and auxiliary power profile
  • Within the experiment, they also measured the auxiliaries and provided a usage profile for them
  • The experiment has been repeated over three years to observe the effect of aging
  • The experiment is not complicated and is straightforward to implement
  • The experiment has been only performed for a constant DOD, which may not be the general case for real usage of BESS
  • Only four power points have been used for the first year, which can introduce inaccuracies in the model
  • The auxiliaries profile has been categorized into day and night without considering the difference in the temperature in different seasons
[75]100 kWh
100 kW
Usable energy and efficiency
  • Four cycles (the last three for calculating roundtrip efficiency)
  • 1 h rest between charge and discharge @ nominal power (or C/5) until the limits, then using maximum available power
  • @ 100% DOD
  • Efficiency calculation based on the total energy of three cycles
  • Usable energy of the battery
  • Repeated at two different powers
  • Reliable tests for tracking the health of the BESS in terms of capacity and efficiency
  • All the tests included some rest phases, so all the parameters were calculated at steady state
  • Each set of tests takes 203 h; without self-discharge, it takes 70 h
  • The power capability was not calculated
  • Battery OCV and SOC table assumed known, which is not the case in most cases
  • The temperature was assumed constant without any control and just by doing the test in spring or fall
Response time and accuracy
  • Calculate at three different active, reactive, and apparent power profiles
  • Initial SOC @ 50%
  • 20 s rest before each profile
  • Accuracy of the system (i.e., the difference between the setpoint of the power and the measured one) for different power profiles
Standby losses due to battery self-discharge
  • Initial SOC @ 50%
  • BMS off and rest for 12 h
  • BMS on and record voltages
  • Rest for 5 days and then record information again
  • The amount of self-discharge when the battery is on standby

4.2.2. Alternative Methods

To overcome the lack of information regarding the tests in BESSs, there are other approaches in the literature. Some studies perform tests at the single-cell level with the intention of using the model in BESSs. For example, in [76], based on analyzing the current and temperature along with the distribution of pulses and SOC events of a 1 MW/250 kWh BESS, they proposed that the usage of a BESS in the field can be explained by 5 parameters: pulse duration, pulses C-rate, SOC swing range, SOC swing range ramp rate, and temperature. Then, based on these data in [77], an experiment was designed to investigate the impact of these parameters on the aging of a cell. They assume that for each parameter, at least 3 points should be investigated, leading to 243 (35) experiments in total. To make the experiment more feasible, a computer-generated optimal custom design reduced the experiments to 21 and then to 16. Two parameters were fixed (pulse duration and SOC swing ramp rate), while the others were varied based on usage analysis. The data points have been shown in Figure 7. Then, from the obtained results, an exponential curve as a function of the number of equivalent full SOC swings, temperature, and C-rate was fitted. Using the average values of the field data, the total degradation of BESSs after three years was estimated at 5%, while the real degradation was around 7%. Then, to move to a better prediction, the idea was to sum the degradation of cells based on each SOC event. Since the voltage and current of each cell were not available, all the cells of a module were assumed to be identical; thus, the calculation could be carried out using the module’s information. The total degradation was carried on based on the hottest and coolest module temperatures. The limit of this method is that all the cell-to-cell variations have been neglected. Also, since the model needs temperature, by assuming an average or coolest or hottest temperature, the variation in the capacity fade of modules after 10 years can be from 15% to 30%, which is a high tolerance. Moreover, from the experiments and field data, no model could be obtained for the calendar aging.
In a more general way in [78], in order to evaluate the performance of batteries as storage systems, the cells cycled using a typical BESS profile. Although many parameters of the BESS are missing in this test (i.e., PCS, BMS, etc.), this test can help to verify which chemistry can be more useful for use in a BESS structure. They propose a six-step test to evaluate the performance of batteries as energy storage systems. The six steps can be summarized as this. Evaluate the cell’s specific power (W/kg) and specific energy (Wh/kg) by identifying and weighing them, calculate battery capacity with CCCV cycles at different C-rates, calculate impedance using DC pulse method, calculate roundtrip efficiency with high current charge and discharge and identify the Peukert constant using constant power charging, again calculate the roundtrip
Efficiency with fast charge and discharge at standard current, and the last test is to evaluate the performance of the battery using typical BESS network load profiles. The battery testing procedure is comprehensive and thoroughly evaluates battery efficiency under various operating conditions. However, implementing the different types of required tests may not always be easy, and the accuracy of the results may vary depending on the length of current pulses and working frequencies. In contrast, using data from the lab is not always the best option. Lab data are limited because of the time available for testing and the number of tests that can be carried out. Additionally, there are certain differences between the data from the lab and the data from the field. Firstly, lab tests often assume accelerated and extreme situations that are different from real-world usage. Secondly, the field data have low cost since there would be no need to cycle any battery intentionally. Third, there is always the possibility of missing a factor in the lab [18]. Therefore, an alternative is to directly use the data from the field to predict and build an aging model.
Such an approach has been implemented in [79]. First, the aging features from the field data were obtained. Then, some unmeasured points were recovered (the SOH was only measured at 0, 50%, and 100%). Then, the model that was built from the lab data was updated with the field data. The main disadvantage of this method is that the proposal is mainly for electrical vehicle batteries. In the EV industry, since the number of deployed batteries is by far more than the number of BESSs, it is easier to obtain a big and sustainable database for model verification. On the other hand, in BESSs, not only the number of them is lower, but also each of them belongs to different companies that do not share their data and information publicly. Therefore, it is more complicated to expand this procedure to the BESS. To cover that, a recent study has used only the field data of a 500 kWh BESS and some data provided by the manufacturer to build a semi-empirical model for BESS aging. First, using the Rainflow algorithm on the SOC timeseries, the stress factors (DOD, average SOC, duration of cycles, number of full equivalent cycles) were extracted. Then, using the manufacturer’s experimental data on the BESS, a model can be defined. The disadvantage of this method is that most of the BESS producers do not share such information with the clients [19].

4.2.3. Comparison

Table 1 compiles various tests documented in the literature. Diverse tests have been proposed across different papers. Notably, the efficiency test and the rated energy test have been the most frequently repeated among these. Consequently, Table 2 presents a comparative analysis of the methodologies used in these two tests. It is worth noting that the remaining tests have been exclusively conducted in individual papers, making it impractical to draw comparisons among their respective approaches.
For papers evaluating both the performance of electrochemical cells and PCS, a comparison of BESS efficiency models has been conducted. To properly evaluate the different models, performances (i.e., efficiency) have been reported as a function of SOC and power rate (P-rate), as proposed in [63]. Only four papers from Table 1 have been used since only their data were completely declared and were available for comparison. The results, depicted in Figure 8, clearly demonstrate how different models yield different levels of accuracy. In [63], the efficiency correctly varies with P-rate and SOC. In [19], the efficiency is merely a parameter, while in [74], a constant efficiency model is proposed, sampling it only at the nominal power [73] and potentially also at a low power setpoint. It is important to note that the efficiency maps reported in Figure 8 are associated with different BESS configurations. Therefore, a direct comparison between them is not feasible. The objective of this comparison is to identify the scenarios where each model proposed in the literature is likely to be accurate or not.
As previously discussed, the model presented in [63] aims to capture efficiency variations related to both P-rate and SOC. Furthermore, the efficiency is evaluated through small charge–discharge cycles around various operating points, i.e., by adopting partial charge–discharge cycles. The data provided in the paper reveal a significant efficiency change at a low P-rate, while the impact of SOC is minor (only noticeable when a high P-rate is demanded at low SOC).
The model proposed in [19] does not consider the impact of SOC. Moreover, only full charge–discharge cycles are employed to evaluate the efficiency. The final model results in smoother efficiency curves, but it is worth noting that significant efficiency changes are detected (as previously mentioned, the efficiency deteriorates at low SOC).
The approach proposed in [73] relies on a constant efficiency model based on a single charge–discharge cycle at nominal power (depicted by a purple line in Figure 8). Such an approach may be considered adequate for medium-high P-rates, but its accuracy is insufficient for small power setpoints. Finally, the model proposed in [75] attempts to overcome this limitation by testing the BESS at the nominal power and at a low P-rate. Unfortunately, the protocol proposed does not utilize a small enough P-rate, compromising the accuracy.
In comparing the different models, it is evident that higher nominal capacity and power of the tested BESS lead to higher sampled efficiencies. This highlights the significant scaling factor affecting the overall efficiency. A summary of all 4 approaches has been provided in Table 3. It is worth noting that this is the approach declared by the authors. The real experiment that results from the data in Figure 8 can be obtained using not exactly these approaches. (e.g., in [19], although they declared 11 power setpoints for the experiment, the results have been obtained with only 4 power setpoints)
A more detailed analysis would require an extensive laboratory campaign using a real-life BESS, testing the same BESS under different protocols/models and ultimately providing a quantitative comparison of each model’s accuracy.
Furthermore, specific protocols and tests would be necessary to evaluate BESS aging. A clear research gap in the literature has been identified in this area.

4.3. Solutions

While there has not been a dedicated model designed exclusively for addressing BESS aging up to today, there have been various suggestions to solve this issue in various domains. It is important to acknowledge that the aging of a BESS is an unavoidable reality. Consequently, finding a solution in this field typically involves determining how to manage a BESS, accounting for aging during the design phase, or incorporating aging considerations into the optimization process. In the following, some example of each method has been provided.
Benefiting from the aging model in control systems is an important field since it can increase the performance and reliability of the control system as the BESS age and physical properties of the system change. In [80], they proposed three different scenarios where, in each of them, the aging model has been considered differently. For example, in one of the scenarios, they suggest controlling the different batteries of the BESS according to their SOH. It is notable that the degradation model adopted had been developed for a single cell. Their results showed that the profit gain from the system is in conflict with the lifetime of the system. Moreover, in [81], they showed that not only did using an aging cost function affect the performance of the BESS, but they also proved that using a linearized calendar and cycle aging model can increase the lifetime profit by around 25% compared to the model that only considers energy throughput for the aging. Once more, this proves that using a more complicated model can provide more realistic and better answers, but it always carries the barrier of heavy calculations.
In energy management systems (EMC), which are in charge of controlling the BESS, the aging models can play a crucial role. Implementing these models in EMCs can not only decrease the aging of the BESS but also, in some situations, increase the stability and prevent some faults. For example, in [82], they leverage an aging model to craft a P-control strategy for the energy management system. This involved selecting an ECM model for the battery and implementing a logic to adjust circuit parameters based on cell aging and SOC. The findings indicate that integrating such an aging model into the energy management system provides enhanced control over the grid and ensures a more stable profile. This aspect carries notable significance, particularly as the BESS undergoes aging, causing a gradual reduction in its power capacity. This reduction could potentially lead to issues related to undervoltage within the system. A similar approach has been proposed in [83] for islanded grids. Their analysis proves that even on a small and islanded grid, it is important to benefit from the aging models. The presence of the aging model will affect the usage of other generation units.
All the proposals mentioned aimed to reduce and minimize the degradation of the BESS. It is crucial to emphasize that all these studies relied on models developed from tests conducted on individual cells. As discussed throughout this article, the inaccuracies in these aging models can be magnified when they are applied to larger systems and become pivotal decision-making factors. This challenge can be considered the most significant hurdle and research gap within this field.
In spite of the numerous challenges detailed within this article, the significance of electrochemical cells has consistently driven research efforts toward the exploration of novel models and theories. The augmentation of sensor technology within these cells promises to yield richer, high-precision data, thereby enabling the development of more precise models for BESSs based on cell-level data. This expanded dataset holds the potential to bolster the efficacy of AI algorithms, rendering them more robust and dependable in the prediction and estimation of SOH for BESSs.
Furthermore, an increase in the deployment of BESSs leads to a wealth of data, including genuine aging patterns, which can be harnessed to refine estimation models. This facilitates rigorous characterization and aging tests by companies and mitigates concerns regarding profit loss during extended testing periods. In line with this trajectory, the possibility emerges to design more intricate tests that demand additional time and equipment. Nonetheless, these investments promise to yield outcomes of superior accuracy, further enhancing the industry’s overall benefit and asset management.

5. Conclusions

In this paper, different test protocols for modeling the BESS aging were reviewed. Some protocols used randomly generated profiles, such as the NASA procedure, while others tried to plan a test protocol for testing each feature separately, along with using some data analysis techniques, such as IC or IV, to extract features and build an aging model. On the other hand, as discussed in the literature, the number of available tests on large or utility-scale BESSs is limited. Additionally, it has been discussed that because of different subjects, it is often hard and not possible to expand the test protocols from the cell level to the storage level. It has been shown that one of the ways to counter this problem is by using the characterization test at different time intervals. This approach is expensive and also needs a long time to gather data. Therefore, another approach was to use the data gathered from single-cell laboratories but with tests that were designed with the purpose of using batteries in an energy storage system. Also, a review of models that try to use the field data for building the aging model has been carried out. Studies have demonstrated the potential of combining field data with laboratory data, acknowledging that the latter is often deemed more accurate. However, it is important to recognize that certain real-world data may be overshadowed due to the controlled and idealized nature of laboratory environments. Also, it has been shown that gathering and using BESS field data can be a harder task than in the EV industry since the number of EVs is far greater than BESSs, which leads to more limited data in the hands of each company.

Author Contributions

Conceptualization, M.P. and M.M.; methodology, M.P., M.M. and L.P.; software, M.P.; validation, M.P., M.M. and L.P.; formal analysis, M.P. and M.M.; investigation, M.P.; resources, M.P.; data curation, M.P. and M.M; writing—original draft preparation, M.P.; writing—review and editing, M.M., L.P., G.R., S.C., J.E.M., F.B., G.G. and S.M.; visualization, M.P.; supervision, M.M. and L.P.; project administration, M.M., L.P. and J.E.M.; funding acquisition, M.M. and J.E.M. All authors have read and agreed to the published version of the manuscript.

Funding

This research was funded by ENI within the B3M project.

Data Availability Statement

No new data were created or analyzed in this study. Data sharing is not applicable to this article.

Conflicts of Interest

The authors declare no conflict of interest.

Abbreviations

AIartificial intelligence
ALSTMattention-based long short-term memory
BESSsbattery energy storage systems
BMSbattery management system
CCconstant current
CCCVconstant current-constant voltage
CPEconstant phase element
C-ratescharge/discharge rate
CVconstant voltage
DC-IRdc internal resistance
DODdepth of discharge
DVderivative voltage
ECMequivalent circuit model
EISelectrochemical impedance spectroscopy
EOLend of life
EVelectric vehicle
FECfull equivalent cycles
GPRGaussian process regression
HPPChybrid pulse power characterization
HVACheating ventilation air conditioning
ICincremental capacity
ICAincremental capacity analysis
IVintegrated voltage
MEMminimal electrochemical model
MOSFETmetal-oxide-semiconductor field-effect transistor
NASAnational aeronautics and space administration
NNneural network
OCVopen circuit voltage
Pactive power
PCSpower conversion system
P-ratepower rate
Qreactive power
RULremaining useful life
SEIsolid electrolyte interphase
SOCstate of charge
SOHstate of health
TLtransfer learning
UKFunscented Kalman filter

References

  1. Zubi, G.; Dufo-López, R.; Carvalho, M.; Pasaoglu, G. The lithium-ion battery: State of the art and future perspectives. Renew. Sustain. Energy Rev. 2018, 89, 292–308. [Google Scholar] [CrossRef]
  2. Preger, Y.; Barkholtz, H.M.; Fresquez, A.; Campbell, D.L.; Juba, B.W.; Romàn-Kustas, J.; Ferreira, S.R.; Chalamala, B.R. Degradation of Commercial Lithium-Ion Cells as a Function of Chemistry and Cycling Conditions. J. Electrochem. Soc. 2020, 167, 120532. [Google Scholar] [CrossRef]
  3. Xu, B.; Oudalov, A.; Ulbig, A.; Andersson, G.; Kirschen, D.S. Modeling of lithium-ion battery degradation for cell life assessment. IEEE Trans Smart Grid 2018, 9, 1131–1140. [Google Scholar] [CrossRef]
  4. Koller, M.; Borsche, T.; Ulbig, A.; Andersson, G. Review of grid applications with the Zurich 1 MW battery energy storage system. Electr. Power Syst. Res. 2015, 120, 128–135. [Google Scholar] [CrossRef]
  5. Xiong, R.; Pan, Y.; Shen, W.; Li, H.; Sun, F. Lithium-ion battery aging mechanisms and diagnosis method for automotive applications: Recent advances and perspectives. Renew. Sustain. Energy Rev. 2020, 131, 110048. [Google Scholar] [CrossRef]
  6. Schmalstieg, J.; Käbitz, S.; Ecker, M.; Sauer, D.U. A holistic aging model for Li(NiMnCo)O2 based 18650 lithium-ion batteries. J. Power Sources 2014, 257, 325–334. [Google Scholar] [CrossRef]
  7. Liu, K.; Wei, Z.; Zhang, C.; Shang, Y.; Teodorescu, R.; Han, Q.L. Towards Long Lifetime Battery: AI-Based Manufacturing and Management. IEEE/CAA J. Autom. Sin. 2022, 9, 1139–1165. [Google Scholar] [CrossRef]
  8. Li, X.; Yuan, C.; Wang, Z. State of health estimation for Li-ion battery via partial incremental capacity analysis based on support vector regression. Energy 2020, 203, 117852. [Google Scholar] [CrossRef]
  9. Son, S.; Jeong, S.; Kwak, E.; Kim, J.H.; Oh, K.Y. Integrated framework for SOH estimation of lithium-ion batteries using multiphysics features. Energy 2022, 238, 121712. [Google Scholar] [CrossRef]
  10. He, Z.; Gao, M.; Ma, G.; Liu, Y.; Chen, S. Online state-of-health estimation of lithium-ion batteries using Dynamic Bayesian Networks. J Power Sources 2014, 267, 576–583. [Google Scholar] [CrossRef]
  11. Yang, D.; Wang, Y.; Pan, R.; Chen, R.; Chen, Z. A Neural Network Based State-of-Health Estimation of Lithium-ion Battery in Electric Vehicles. Energy Procedia 2017, 105, 2059–2064. [Google Scholar] [CrossRef]
  12. Wu, X.; Li, M.; Du, J.; Hu, F. SOC prediction method based on battery pack aging and consistency deviation of thermoelectric characteristics. Energy Rep. 2022, 8, 2262–2272. [Google Scholar] [CrossRef]
  13. Che, Y.; Stroe, D.I.; Hu, X.; Teodorescu, R. Semi-Supervised Self-Learning-Based Lifetime Prediction for Batteries. IEEE Trans Ind. Inf. 2023, 19, 6471–6481. [Google Scholar] [CrossRef]
  14. Liu, K.; Peng, Q.; Che, Y.; Zheng, Y.; Li, K.; Teodorescu, R.; Widanage, D.; Barai, A. Transfer learning for battery smarter state estimation and ageing prognostics: Recent progress, challenges, and prospects. Adv. Appl. Energy 2023, 9, 100117. [Google Scholar] [CrossRef]
  15. Severson, K.A.; Attia, P.M.; Jin, N.; Perkins, N.; Jiang, B.; Yang, Z.; Chen, M.H.; Aykol, M.; Herring, P.K.; Fraggedakis, D.; et al. Data-driven prediction of battery cycle life before capacity degradation. Nat. Energy 2019, 4, 383–391. [Google Scholar] [CrossRef]
  16. Wei, Z.; Liu, K.; Liu, X.; Li, Y.; Du, L.; Gao, F. Multi-level Data-driven Battery Management: From Internal Sensing to Big Data Utilization. IEEE Trans. Transp. Electrif. 2023. early access. [Google Scholar] [CrossRef]
  17. Liu, K.; Tang, X.; Teodorescu, R.; Gao, F.; Meng, J. Future Ageing Trajectory Prediction for Lithium-Ion Battery Considering the Knee Point Effect. IEEE Trans. Energy Convers. 2022, 37, 1282–1291. [Google Scholar] [CrossRef]
  18. Che, Y.; Deng, Z.; Tang, X.; Lin, X.; Nie, X.; Hu, X. Lifetime and Aging Degradation Prognostics for Lithium-ion Battery Packs Based on a Cell to Pack Method. Chin. J. Mech. Eng. Engl. Ed. 2022, 35, 1–16. [Google Scholar] [CrossRef]
  19. Grimaldi, A.; Minuto, F.D.; Perol, A.; Casagrande, S.; Lanzini, A. Ageing and energy performance analysis of a utility-scale lithium-ion battery for power grid applications through a data-driven empirical modelling approach. J. Energy Storage 2023, 65, 107232. [Google Scholar] [CrossRef]
  20. Turković, A.; Pavlović, M.; Dubček, P.; Lučić-Lavčević, M.; Etlinger, B.; Bernstorff, S. You may also like SAXS/DSC Study of Polymer Electrolyte for Zn Rechargeable Nanostructured Galvanic Cells Nano or Microclustering as an Explanation for the Unusual Thermal Behavior of Nickel Polymer Electrolytes. J. Electrochem. Soc. 1993, 140, A554. [Google Scholar]
  21. Reza, M.; Hannan, M.; Ker, P.J.; Mansor, M.; Lipu, M.H.; Hossain, M.; Mahlia, T.I. Uncertainty parameters of battery energy storage integrated grid and their modeling approaches: A review and future research directions. J. Energy Storage 2023, 68, 107698. [Google Scholar] [CrossRef]
  22. Bazargan, D.; Filizadeh, S.; Gole, A.M. Stability analysis of converter-connected battery energy storage systems in the grid. IEEE Trans. Sustain. Energy 2014, 5, 1204–1212. [Google Scholar] [CrossRef]
  23. Collath, N.; Tepe, B.; Englberger, S.; Jossen, A.; Hesse, H. Aging aware operation of lithium-ion battery energy storage systems: A review. J. Energy Storage 2022, 55, 105634. [Google Scholar] [CrossRef]
  24. Reniers, J.M.; Mulder, G.; Howey, D.A. Review and Performance Comparison of Mechanical-Chemical Degradation Models for Lithium-Ion Batteries. J. Electrochem Soc. 2019, 166, A3189–A3200. [Google Scholar] [CrossRef]
  25. Birkl, C.R.; Roberts, M.R.; McTurk, E.; Bruce, P.G.; Howey, D.A. Degradation diagnostics for lithium ion cells. J. Power Sources 2017, 341, 373–386. [Google Scholar] [CrossRef]
  26. Wenzl, H.; Baring-Gould, I.; Kaiser, R.; Liaw, B.Y.; Lundsager, P.; Manwell, J.; Ruddell, A.; Svoboda, V. Life prediction of batteries for selecting the technically most suitable and cost effective battery. J. Power Sources 2005, 144, 373–384. [Google Scholar] [CrossRef]
  27. Barré, A.; Deguilhem, B.; Grolleau, S.; Gérard, M.; Suard, F.; Riu, D. A review on lithium-ion battery ageing mechanisms and estimations for automotive applications. J. Power Sources 2013, 241, 680–689. [Google Scholar] [CrossRef]
  28. Zhou, J.; Xing, B.; Wang, C. A review of lithium ion batteries electrochemical models for electric vehicles. E3S Web Conf. 2020, 185, 04001. [Google Scholar] [CrossRef]
  29. Haran, B.S.; Popov, B.N.; White, R.E. Determination of the hydrogen diffusion coefficient in metal hydrides by impedance spectroscopy. J. Power Sources 1998, 75, 56–63. [Google Scholar] [CrossRef]
  30. Zhang, X.; Gao, Y.; Guo, B.; Zhu, C.; Zhou, X.; Wang, L.; Cao, J. A novel quantitative electrochemical aging model considering side reactions for lithium-ion batteries. Electrochim. Acta 2020, 343, 136070. [Google Scholar] [CrossRef]
  31. Fu, R.; Choe, S.Y.; Agubra, V.; Fergus, J. Modeling of degradation effects considering side reactions for a pouch type Li-ion polymer battery with carbon anode. J. Power Sources 2014, 261, 120–135. [Google Scholar] [CrossRef]
  32. Li, J.; Wang, D.; Deng, L.; Cui, Z.; Lyu, C.; Wang, L.; Pecht, M. Aging modes analysis and physical parameter identification based on a simplified electrochemical model for lithium-ion batteries. J. Energy Storage 2020, 31, 101538. [Google Scholar] [CrossRef]
  33. Shao, J.; Li, J.; Yuan, W.; Dai, C.; Wang, Z.; Zhao, M.; Pecht, M. A novel method of discharge capacity prediction based on simplified electrochemical model-aging mechanism for lithium-ion batteries. J. Energy Storage 2023, 61, 106788. [Google Scholar] [CrossRef]
  34. Hosseininasab, S.; Lin, C.; Pischinger, S.; Stapelbroek, M.; Vagnoni, G. State-of-health estimation of lithium-ion batteries for electrified vehicles using a reduced-order electrochemical model. J. Energy Storage 2022, 52, 104684. [Google Scholar] [CrossRef]
  35. Liaw, B.Y.; Nagasubramanian, G.; Jungst, R.G.; Doughty, D.H. Modeling of lithium ion cells-A simple equivalent-circuit model approach. Solid State Ion. 2004, 175, 835–839. [Google Scholar] [CrossRef]
  36. Xia, Z.; Qahouq, J.A.A. Evaluation of Parameter Variations of Equivalent Circuit Model of Lithium-ion Battery under Different SOH Conditions. In Proceedings of the ECCE 2020-IEEE Energy Conversion Congress and Exposition, Detroit, MI, USA, 11–15 October 2020; pp. 1519–1523. [Google Scholar] [CrossRef]
  37. Tran, M.-K.; Mathew, M.; Janhunen, S.; Panchal, S.; Raahemifar, K.; Fraser, R.; Fowler, M. A comprehensive equivalent circuit model for lithium-ion batteries, incorporating the effects of state of health, state of charge, and temperature on model parameters. J. Energy Storage 2021, 43, 103252. [Google Scholar] [CrossRef]
  38. Xu, Z.; Wang, J.; Lund, P.D.; Zhang, Y. Co-estimating the state of charge and health of lithium batteries through combining a minimalist electrochemical model and an equivalent circuit model. Energy 2022, 240, 122815. [Google Scholar] [CrossRef]
  39. Hahn, S.L.; Storch, M.; Swaminathan, R.; Obry, B.; Bandlow, J.; Birke, K.P. Quantitative validation of calendar aging models for lithium-ion batteries. J. Power Sources 2018, 400, 402–414. [Google Scholar] [CrossRef]
  40. Hu, T.; Ma, H.; Liu, K.; Sun, H. Lithium-Ion Battery Calendar Health Prognostics Based on Knowledge-Data-Driven Attention. IEEE Trans. Ind. Electron. 2023, 70, 407–417. [Google Scholar] [CrossRef]
  41. Liu, C.; Wang, Y.; Chen, Z. Degradation model and cycle life prediction for lithium-ion battery used in hybrid energy storage system. Energy 2019, 166, 796–806. [Google Scholar] [CrossRef]
  42. Liu, K.; Peng, Q.; Teodorescu, R.; Foley, A.M. Knowledge-Guided Data-Driven Model With Transfer Concept for Battery Calendar Ageing Trajectory Prediction. IEEE/CAA J. Autom. Sin. 2023, 10, 272–274. [Google Scholar] [CrossRef]
  43. Olmos, J.; Gandiaga, I.; Saez-de-Ibarra, A.; Larrea, X.; Nieva, T.; Aizpuru, I. Modelling the cycling degradation of Li-ion batteries: Chemistry influenced stress factors. J. Energy Storage 2021, 40, 102765. [Google Scholar] [CrossRef]
  44. Sun, H.; Yang, D.; Wang, L.; Wang, K. A method for estimating the aging state of lithium-ion batteries based on a multi-linear integrated model. Int. J. Energy Res. 2022, 46, 24091–24104. [Google Scholar] [CrossRef]
  45. Wu, Y.; Li, W.; Wang, Y.; Zhang, K. Remaining useful life prediction of lithium-ion batteries using neural network and bat-based particle filter. IEEE Access 2019, 7, 54843–54854. [Google Scholar] [CrossRef]
  46. Cheng, G.; Wang, X.; He, Y. Remaining useful life and state of health prediction for lithium batteries based on empirical mode decomposition and a long and short memory neural network. Energy 2021, 232, 121022. [Google Scholar] [CrossRef]
  47. Hu, T.; Ma, H.; Sun, H.; Liu, K. Electrochemical-Theory-Guided Modeling of the Conditional Generative Adversarial Network for Battery Calendar Aging Forecast. IEEE J. Emerg Sel. Top Power Electron 2023, 11, 67–77. [Google Scholar] [CrossRef]
  48. Jenu, S.; Hentunen, A.; Haavisto, J.; Pihlatie, M. State of health estimation of cycle aged large format lithium-ion cells based on partial charging. J. Energy Storage 2022, 46, 103855. [Google Scholar] [CrossRef]
  49. Su, X.; Sun, B.; Wang, J.; Zhang, W.; Ma, S.; He, X.; Ruan, H. Fast capacity estimation for lithium-ion battery based on online identification of low-frequency electrochemical impedance spectroscopy and Gaussian process regression. Appl. Energy 2022, 322, 119516. [Google Scholar] [CrossRef]
  50. Liu, K.; Hu, X.; Wei, Z.; Li, Y.; Jiang, Y. Modified Gaussian Process Regression Models for Cyclic Capacity Prediction of Lithium-Ion Batteries. IEEE Trans. Transp. Electrif. 2019, 5, 1225–1236. [Google Scholar] [CrossRef]
  51. Yan, L.; Peng, J.; Gao, D.; Wu, Y.; Liu, Y.; Li, H.; Liu, W.; Huang, Z. A hybrid method with cascaded structure for early-stage remaining useful life prediction of lithium-ion battery. Energy 2022, 243, 123038. [Google Scholar] [CrossRef]
  52. Barcellona, S.; Piegari, L. Effect of current on cycle aging of lithium ion batteries. J. Energy Storage 2020, 29, 101310. [Google Scholar] [CrossRef]
  53. She, C.; Wang, Z.; Sun, F.; Liu, P.; Zhang, L. Battery Aging Assessment for Real-World Electric Buses Based on Incremental Capacity Analysis and Radial Basis Function Neural Network. IEEE Trans Industr. Inform. 2020, 16, 3345–3354. [Google Scholar] [CrossRef]
  54. Weng, C.; Feng, X.; Sun, J.; Peng, H. State-of-health monitoring of lithium-ion battery modules and packs via incremental capacity peak tracking. Appl. Energy 2016, 180, 360–368. [Google Scholar] [CrossRef]
  55. Zhou, Y.; Huang, M.; Pecht, M. An Online State of Health Estimation Method for Lithium-ion Batteries Based on Integrated Voltage. In Proceedings of the 2018 IEEE International Conference on Prognostics and Health Management, ICPHM 2018, Seattle, WA, USA, 11–13 August 2018. [Google Scholar] [CrossRef]
  56. Oudalov, A.; Chartouni, D.; Ohler, C. Optimizing a battery energy storage system for primary frequency control. IEEE Trans. Power Syst. 2007, 22, 1259–1266. [Google Scholar] [CrossRef]
  57. Delavari, A.; Kamwa, I.; Zabihinejad, A. A comparative study of different multilevel converter topologies for Battery Energy Storage application. In Proceedings of the Canadian Conference on Electrical and Computer Engineering, Windsor, ON, Canada, 30 April–3 May 2017. [Google Scholar] [CrossRef]
  58. Chatrung, N. Battery Energy Storage System (BESS) and Development of Grid Scale BESS in EGAT. In Proceedings of the 2019 IEEE PES GTD Grand International Conference and Exposition Asia, GTD Asia 2019, Bangkok, Thailand, 19–23 March 2019; pp. 589–593. [Google Scholar] [CrossRef]
  59. Shafique, H.; Tjernberg, L.B.; Archer, D.E.; Wingstedt, S. Energy Management System (EMS) of Battery Energy Storage System (BESS)-Providing Ancillary Services. In Proceedings of the 2021 IEEE Madrid PowerTech, PowerTech 2021-Conference Proceedings, Madrid, Spain, 28 June–2 July 2021. [Google Scholar] [CrossRef]
  60. Gatta, F.M.; Geri, A.; Lauria, S.; Maccioni, M.; Palone, F. Battery energy storage efficiency calculation including auxiliary losses: Technology comparison and operating strategies. In Proceedings of the 2015 IEEE Eindhoven PowerTech, PowerTech 2015, Eindhoven, Netherlands, 29 June–2 July 2015. [Google Scholar] [CrossRef]
  61. Bovera, F.; Spiller, M.; Zatti, M.; Rancilio, G.; Merlo, M. Development, validation, and testing of advanced mathematical models for the optimization of BESS operation. Sustain. Energy Grids Netw. 2023, 36, 101152. [Google Scholar] [CrossRef]
  62. Rancilio, G.; Merlo, M.; Lucas, A.; Kotsakis, E.; Delfanti, M. BESS modeling: Investigating the role of auxiliary system consumption in efficiency derating. In Proceedings of the 2020 International Symposium on Power Electronics, Electrical Drives, Automation and Motion, SPEEDAM 2020, Sorrento, Italy, 24–26 June 2020; pp. 189–194. [Google Scholar] [CrossRef]
  63. Rancilio, G.; Lucas, A.; Kotsakis, E.; Fulli, G.; Merlo, M.; Delfanti, M.; Masera, M. Modeling a Large-Scale Battery Energy Storage System for Power Grid Application Analysis. Energies 2019, 12, 3312. [Google Scholar] [CrossRef]
  64. Ketjoy, N.; Chamsa-ard, W.; Mensin, P. Analysis of factors affecting efficiency of inverters: Case study grid-connected PV systems in lower northern region of Thailand. Energy Rep. 2021, 7, 3857–3868. [Google Scholar] [CrossRef]
  65. Choi, D.; Shamim, N.; Crawford, A.; Huang, Q.; Vartanian, C.K.; Viswanathan, V.V.; Paiss, M.D.; Alam, M.J.E.; Reed, D.M.; Sprenkle, V.L. Li-ion battery technology for grid application. J. Power Sources 2021, 511, 230419. [Google Scholar] [CrossRef]
  66. Wei, Z.; Li, Y.; Cai, L. Electric vehicle charging scheme for a park-and-charge system considering battery degradation costs. IEEE Trans. Intell. Veh. 2018, 3, 361–373. [Google Scholar] [CrossRef]
  67. Zhao, C.; Li, X. Microgrid Optimal Energy Scheduling Considering Neural Network based Battery Degradation. IEEE Trans. Power Syst. 2023, 1–12. [Google Scholar] [CrossRef]
  68. Woody, M.; Arbabzadeh, M.; Lewis, G.M.; Keoleian, G.A.; Stefanopoulou, A. Strategies to limit degradation and maximize Li-ion battery service lifetime-Critical review and guidance for stakeholders. J. Energy Storage 2020, 28, 101231. [Google Scholar] [CrossRef]
  69. Reiter, A.; Lehner, S.; Bohlen, O.; Sauer, D.U. Electrical cell-to-cell variations within large-scale battery systems—A novel characterization and modeling approach. J. Energy Storage 2023, 57, 106152. [Google Scholar] [CrossRef]
  70. Moncecchi, M.; Borselli, A.; Falabretti, D.; Corghi, L.; Merlo, M. Numerical and Experimental Efficiency Estimation in Household Battery Energy Storage Equipment. Energies 2020, 13, 2719. [Google Scholar] [CrossRef]
  71. Characterisation and Efficiency Test of a Li-Ion Energy Storage System for PV Systems-Archivo Digital UPM. Available online: https://oa.upm.es/41946/ (accessed on 3 May 2023).
  72. IEC 61427:2005(E); Secondary Cells and Batteries for Photovoltaic Energy Systems (PVES) - General Requirements and Methods of Test. International Electrotechnical Commission (IEC): Geneva, Switzerland, 2005.
  73. Palone, F.; Gemelli, G.; Rebolini, M.; Mocci, E.; Necci, A.; Pietrucci, M.; Tortora, A. Commissioning and testing of the first Lithium-Titanate BESS for the Italian transmission grid. In Proceedings of the 2015 IEEE 15th International Conference on Environment and Electrical Engineering, EEEIC 2015-Conference Proceedings, Rome, Italy, 10–13 June 2015; pp. 1025–1030. [Google Scholar] [CrossRef]
  74. Swierczynski, M.; Stroe, D.I.; Stan, A.I.; Teodorescu, R.; Laerke, R.; Kjær, P.C. Field tests experience from 1.6MW/400kWh Li-ion battery energy storage system providing primary frequency regulation service. In Proceedings of the 2013 4th IEEE/PES Innovative Smart Grid Technologies Europe, ISGT Europe 2013, Lyngby, Denmark, 6–9 October 2013. [Google Scholar] [CrossRef]
  75. Smith, K.; Baggu, M.; Friedl, A.; Bialek, T.; Schimpe, M.R. Performance and health test procedure for grid energy storage systems. In Proceedings of the IEEE Power and Energy Society General Meeting, Chicago, IL, USA, 16–20 July 2018. [Google Scholar] [CrossRef]
  76. Dubarry, M.; Devie, A.; Stein, K.; Tun, M.; Matsuura, M.; Rocheleau, R. Battery Energy Storage System battery durability and reliability under electric utility grid operations: Analysis of 3 years of real usage. J. Power Sources 2017, 338, 65–73. [Google Scholar] [CrossRef]
  77. Dubarry, M.; Devie, A. Battery durability and reliability under electric utility grid operations: Representative usage aging and calendar aging. J. Energy Storage 2018, 18, 185–195. [Google Scholar] [CrossRef]
  78. Del Valle, J.A.; Ansean, D.; Viera, J.C.; Antuna, J.L.; Gonzalez, M.; Garcia, V. Analysis of Advanced Lithium-Ion Batteries for Battery Energy Storage Systems. In Proceedings of the Proceedings-2018 IEEE International Conference on Environment and Electrical Engineering and 2018 IEEE Industrial and Commercial Power Systems Europe, EEEIC/I and CPS Europe 2018, Palermo, Italy, 12–15 June 2018. [Google Scholar] [CrossRef]
  79. Tang, X.; Liu, K.; Li, K.; Widanage, W.D.; Kendrick, E.; Gao, F. Recovering large-scale battery aging dataset with machine learning. Patterns 2021, 2, 100302. [Google Scholar] [CrossRef] [PubMed]
  80. Nebuloni, R.; Meraldi, L.; Bovo, C.; Ilea, V.; Berizzi, A.; Sinha, S.; Tamirisakandala, R.B.; Raboni, P. A hierarchical two-level MILP optimization model for the management of grid-connected BESS considering accurate physical model. Appl. Energy 2023, 334, 120697. [Google Scholar] [CrossRef]
  81. Collath, N.; Cornejo, M.; Engwerth, V.; Hesse, H.; Jossen, A. Increasing the lifetime profitability of battery energy storage systems through aging aware operation. Appl. Energy 2023, 348, 121531. [Google Scholar] [CrossRef]
  82. Parthasarathy, C.; Laaksonen, H.; Redondo-Iglesias, E.; Pelissier, S. Aging aware adaptive control of Li-ion battery energy storage system for flexibility services provision. J. Energy Storage 2023, 57, 106268. [Google Scholar] [CrossRef]
  83. Kumtepeli, V.; Zhao, Y.; Naumann, M.; Tripathi, A.; Wang, Y.; Jossen, A.; Hesse, H. Design and analysis of an aging-aware energy management system for islanded grids using mixed-integer quadratic programming. Int. J. Energy Res. 2019, 43, 4127–4147. [Google Scholar] [CrossRef]
Figure 2. Degradation modes and their causes [25].
Energies 16 06887 g002
Figure 3. Cycle aging stress factors [3].
Energies 16 06887 g003
Figure 4. The RMSE of validation data for each approach [39].
Energies 16 06887 g004
Figure 5. Architecture of a BESS.
Energies 16 06887 g005
Figure 6. Standard (left) and modified (right) HPPC test [74].
Energies 16 06887 g006
Figure 7. Parameters usage and their selected data points [77].
Energies 16 06887 g007
Figure 8. Efficiency comparison.
Energies 16 06887 g008
Table 2. Comparison of test approaches.
TestRef.CommentsSimilarities
Efficiency test[4,19,63,70,71,72,74]
  • [4]: The easiest to perform in a short time.
  • [73]: Only test that considers preconditioning according to temperature.
  • [71]: Measure at low power, which is different than most of the proposed tests. Also, measure the inverter nominal power, which can also provide information about the inverter accuracy performance.
  • [70]: Only test that uses a power profile instead of a constant power during charge and discharge.
  • [63]: The most completed test so far since they measure at different C-rates and initial SOCs. The only test that is used rests in the test but requires much time.
  • [63,70]: Only tests that try to use accurate SOCs for the initial and ending of the charge.
  • [19,63]: Only tests that measure at different powers.
  • The tests have been performed at different DODs, but in all of them, it was fixed.
  • None of the tests have explored the effect of temperature on efficiency.
Rated energy[72,73,74]
  • [73]: The only test that does not indicate any rest between charge and discharge.
  • [74]: Propose using a predefined threshold instead of minimum and maximum SOCs.
  • Not a very popular test in the literature.
  • Repetition of the test is an important factor.
Table 3. Summary of compared approaches for calculating efficiency.
Ref.ChemistryCapacity (kWh)/Power (kW)Approach/Model Specifications
Initial SOC (%)DOD (%)Total Measured PointsPower Setpoints (Psetpoint/Pnominal) (p.u)Estimated Time (min)Repetition
[63]NMC570/25010, 45, 8010210.05, 0.09, 0.18, 0.36, 0.54, 0.72, 0.902856No
[19]NMC822/5001080110.1, 0.15, 0.2, 0.3, 0.4, 0.6, 0.7, 0.8, 0.9, 15721No
[73]LTO1000/10000100111803 times
[74]--100/100010020.2, 17203 times
Disclaimer/Publisher’s Note: The statements, opinions and data contained in all publications are solely those of the individual author(s) and contributor(s) and not of MDPI and/or the editor(s). MDPI and/or the editor(s) disclaim responsibility for any injury to people or property resulting from any ideas, methods, instructions or products referred to in the content.

