1. Introduction
Hydropower is an important RES (Renewable Energy Source) [
1,
2,
3,
4] that must take into account both environmental [
5,
6], socio-economic [
7,
8,
9] and day-to-day operational aspects [
10,
11,
12]. Small hydro power plants (SHPPs) are characterized by high controllability, cause an increase in water retention, and have great adaptation capacity in the scope of use of the existing damming [
13,
14]. Poland, due to its lay of the land, climatic location and land characteristics, has limited possibilities for obtaining energy from this source [
15]. Poland’s theoretical resources amount to 23 TWh, with technically usable resources of about 12 TWh [
16]. Currently, hydroelectric power plants provide only about 2% of electricity production—2.9 TWh [
15,
17].
Poland’s commercial hydropower sector has observed a slowdown, but the development of small, often privately owned SHPPs, continues [
16]. There are more than 770 hydroelectric power plants of less than 10 MW in Poland. In 2021, hydroelectric power generation is expected to enhanced by 8%, helped by the development of SHPPs, among other factors. Small hydropower is also steadily growing in importance worldwide. The globally installed SHP capacity for plants of ≤10 MW is estimated at approximately 79.0 GW (WSHPDR 2022). The largest increase in the installed capacity is reported for Europe at 734 MW, the Americas with 698 MW and Africa with 134 MW. However, it must be remembered that SHPPs are characterized by specific problems related to operating conditions [
18,
19,
20]. The problems of operating SHPPs are related to both the material carried by the water, overgrowth of riverbeds with vegetation, water quality, range of operation of the hydropower turbines and water level at the downstream position of the SHPPs, as well as the technical condition of the structures [
8,
21]. It is also necessary to take into account the variability of water flow conditions, which affects the formation of the bottom below the hydroelectric power plant [
22]. The important problems of damming structures within SHPPs are the issues related to the interruption of sediment transportation. River sediments are deposited at the upper structure [
23,
24,
25], while below it, erosion phenomena are observed [
26,
27]. Changes in the levels of the river bed above and below the lateral damming of the river lead to the need for maintenance work. This can cause temporary shutdowns of hydroelectric power plants and also damage to the turbines themselves as a result of carrying accumulated sand in the reservoir [
28,
29]. Currently, the impact of climate change that changes hydrological conditions in rivers and affects the stable operation of power plants is also becoming an increasingly important issue [
30,
31].
Operating conditions of small hydro power plants should be analyzed comprehensively, taking into account hydraulic, economic and environmental aspects [
32,
33,
34]. It must be taken into account that energy generation should take place while maintaining the environmental flow requirements relevant to downstream ecosystems [
35,
36,
37], including the preservation of migration opportunities for ichthyofauna [
38,
39]. A medium-term forecast of water inflow (taking into account its seasonal variability) can be used to analyze the stable operation of the SHPP [
40]. Another solution to the risk of water scarcity at a certain level is to optimize the technical infrastructure of the components that make up the SHPP (turbine, generator and gearbox) through precise flow modeling [
41,
42,
43]. Other advanced optimization tools can also be used for the dynamic regulation of the upper water level [
18,
44]. With the optimization tools, it can generally be expected to increase the average head available over an operating year [
18]. Hydroelectric power plant owners are looking for simpler tools and solutions to determine optimal operating conditions [
45]. These include hydrological analyses based on a hydrodynamic modeling determination of the impact of conditions on the lower station on power generation. The lower station of power plants, especially on lowland rivers, in many cases is either influenced by damming at the next barrage [
46] or by the confluence of the estuary section. It determines the height of damming which significantly affects the amount of energy produced [
29,
47]. One solution may be to change the damming elevation. This was confirmed, among other things, by analyses for the Pankou and Xiaoxuan power plants, where it was indicated that raising the water surface between the reservoirs is beneficial in terms of electricity production despite the reduction in production at Pankou’s reservoir [
45].
Mathematical models, e.g., HEC-RAS [
48], are used for analyses of the water surface system, e.g., backwash. They enable analysis and simulation of flow conditions [
46,
49,
50]. The use of mathematical modeling also makes it possible to assess the impact of current and potential climate change on the operation of small hydro power plants (SHPP). Such processes are increasingly being observed in small catchments and are beginning to reflect negatively on small hydro power plant-based electricity production [
31,
51].
Of the various operational problems that can significantly affect the power production of SHPPs, this article focuses mainly on assessing the influence of hydrological and hydraulic requirement on the operation of the plants. As an example, an analysis of the impact of Gwda river’s backwater on the level of the water surface at the lower position of the Stary Młyn hydroelectric power plant in Dobrzyca located on Głomia river (Poland) is presented. The scope of the paper covered field studies of the water surface system, channel geometry, and hydrological analysis for the entire catchment. In addition, using the HEC-RAS 6.4 software, analyses of water surface levels at different flows were carried out and the effect of water rises on power plant operating conditions was studied. A verification of the mathematical model was conducted by comparing results of field measurements and results of calculations using the mathematical model. The result of the paper was to determine the possibility of electricity production depending on water levels on Gwda river and flows on Głomia river. The presented facility is a typical example of an SHPP located on a lowland river. The analysis was conducted for different flow options on both the Gwda and Głomia rivers. The results show the importance of basic assumptions and current hydrological conditions related to the use of the barrage on the operation and production of energy. Trends on the impact of changes in hydrological conditions associated with climate change on electricity production were also analyzed. The results obtained indicate the possibility of improving the operation of this type of small hydro power plants by even slightly increasing the elevation of the upper level (increasing the slope and water retention capacity), which may allow one to ensure more stable operating conditions for run-of-river power plants with very small reservoirs.
Of the various operational problems that can significantly affect the power production of SHPPs, this article focuses mainly on assessing the influence of hydrological and hydraulic conditions on the operation of the plants. As an example, an analysis of the impact of Gwda river’s backwater on the level of the water surface at the lower position of the Stary Młyn hydroelectric power plant in Dobrzyca located on Głomia river (Poland) is presented. The objectives in the work can be formulated as follows: determine the impact of river water levels on the operation of a hydroelectric plant located on a tributary, determine the impact of climate change on river water surface levels and the amount of electricity produced and find solutions to increase the operating time of the hydropower plant. The scope of this paper covered field studies of the water surface system, channel geometry and hydrological analysis for the entire catchment. In addition, using the HEC-RAS software, analyses of water surface levels at different flows were carried out and the effect of water surface rises on power plant operating conditions was studied. Verification of the mathematical model was conducted by comparing the results of field measurements and the results of calculations using the mathematical model. The result of the paper was to determine the possibility of electricity production depending on water surface levels on Gwda river and flows on Głomia river. The presented facility is a typical example of an SHPP, located on a lowland river. The analysis was conducted for different flow options on both the Gwda and Głomia rivers. The results show the importance basic assumptions and current hydrological conditions connected to the use of the barrage on the operation and production of energy. Trends on the impact of changes in hydrological conditions associated with climate change on electricity production were also analyzed. A novelty at work is the use of an increased upstream water elevations to increase the number of days on which the hydroelectric power plant works. An in-depth analysis of determining the damming height in conditions of a lack of free drainage at the lower position of the damming structure was introduced. It was shown that only the use of numerical modeling allows one to take into account a whole range of factors affecting the damming height. This ultimately translates into the number of days of possible electricity production. The results obtained indicate the possibility of improving the operation of these types of small hydro power plants by even slightly increasing the elevation of the upper level (increasing the slope and water retention capacity), which may allow one to ensure more stable operating conditions for run-of-river power plants with very small reservoirs.
2. Materials and Methods
The study site is located in Dobrzyca, Wielkopolskie Voivodeship, Poland. Gwda river is a right inflow of Noteć river located on the border of the Wałeckie and Krajeńskie lake districts and its total length is 145.1 km. The basin covers an area of 4933 km2 Wyrzuciliśmy. Głomia river, which is a left inflow of Gwda river, is 58.1 km long and its basin covers an area of 570 km2. The river is characterized by a steep gradient of approximately 0.9‰. Głomia river has its source near the village of Głomsk and flows south through the Złotowskie Lake located in Złotów.
The Stary Młyn barrage in Dobrzyca consists of a fish ladder, a weir and a small hydropower plant, whose building was constructed in 1913 and was originally a water mill. The 45 kW hydropower plant has two turbines, a siphon turbine and a Francis turbine. Another element of the barrage is a movable weir made of reinforced concrete. The span widths are b1 = 1.7 m, b2 = 2.7 m and b3 = 2.86 m, respectively, while the widths of the pillars are 0.5 m and 0.9 m, respectively. The fish ladder on the barrage is a chamber fish ladder, consisting of nine chambers from 1.2 m to 1.7 m long, with a divider width of 0.15 m and an average chamber width of 1 m.
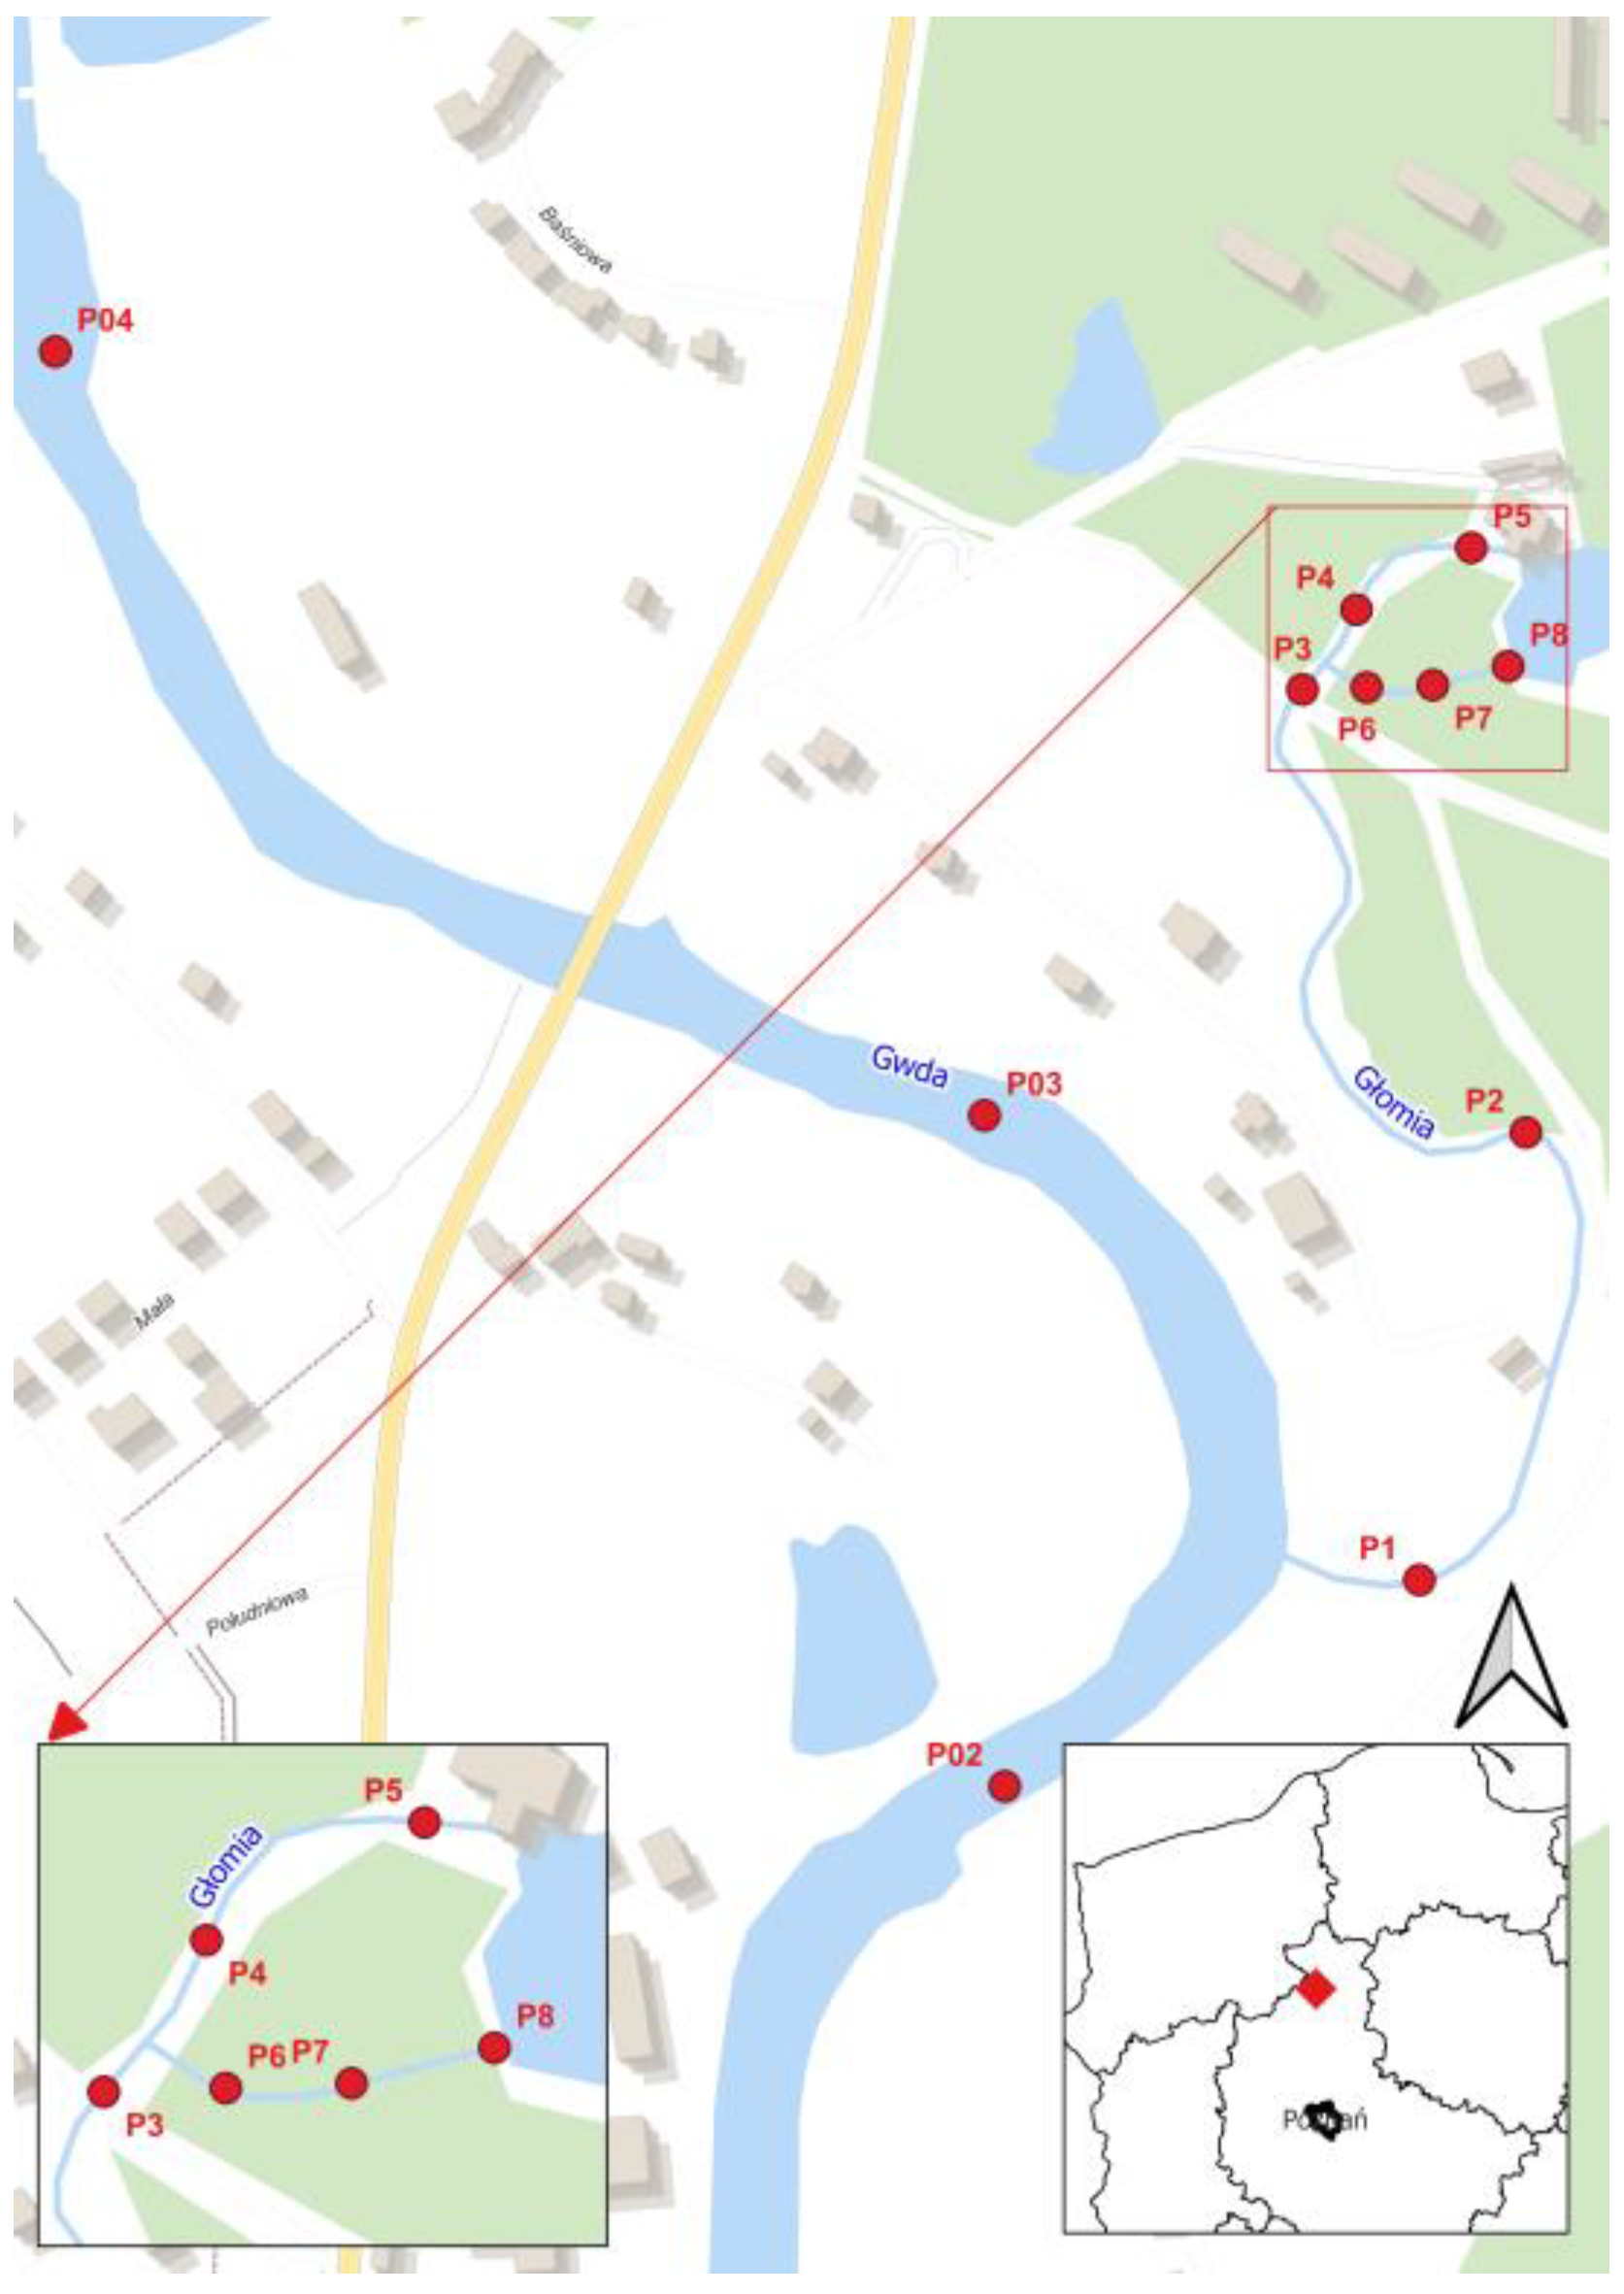
The field studies were carried out on Gwda river and Głomia river within the Stary Młyn barrage in Dobrzyca (GPS 16.783611, 53.220278). Measurements of individual barrage elements, water surface levelling and hydrometric measurements were carried out at designated cross-sections. The following equipment was used for the field studies: an electromagnetic flow meter, a rod probe, a leveler and an ADCP StreamPro probe. The cross-sections labelled P01, P02, P03 and P04 were made on Gwda river, and cross-sections P1, P2, P3, P4, P5, P6, P7, P8 were made on Głomia river and at the Stary Młyn barrage in Dobrzyca. The position of each cross-section is shown in
Figure 1.
The first- and second-degree characteristic flows for Głomia river were determined on the basis of every day flows from a thirty-year period (1982–2012). For Gwda river, the characteristic flows at the Piła water-gauge profile were determined using the direct method. This is applied to rivers and profiles which underwent water level surveys and hydrometric measurements of high, mean and low water levels. Based on these data, the characteristic flows for the multi-year period of 1982–2012 were calculated [
52]. An extrapolation method was used to transfer the hydrological information to the cross-section of the structure.
where:
Qo—value of the characteristic flow in the structure cross-section (m3∙s−1);
Qw—value of the characteristic flow at the water gauge cross-section (m3∙s−1);
AO—size of the catchment area bounded by the structure cross-section (m2);
Aw—size of the catchment area bounded by the water gauge cross-section (m2);
n—empirical parameter, the value of which is determined for a specific section of the river and for a specific characteristic flow [-];
n = 1 when extrapolating low and mean flows;
n = 2/3 when extrapolating high flows higher than SWQ.
The calculations of the hydraulic head were made for the following scheme of assumptions (
Figure 2).
where:
H1—drop height (current scheme);
h1—water depth in the downstream position of the hydroelectric power plant, taking into account water sub-storage;
h2—the difference between the normal level of damming and the level of the bed.
p1—water depth in the downstream position of the hydroelectric power plant, taking into account backwater;
Q1—inflow flow discharge m3·s−1;
s—length of the analyzing section;
i—slope -;
n—coefficient of roughness m−1/3 s.
p2—water depth in the downstream position of the hydroelectric power plant, taking into account backwater;
Q2—outflow flow discharge m3·s−1;
Δh—raised water elevation m.
Figure 2 shows a diagram of the barrage. The dashed line indicates the water table level without the influence of damming at the downstream site or backwater from another river. The blue line from the lower water shows the water level resulting from the sub-basin at the upper site by another river. Hydraulic conditions at the downstream position of the damming structure are shaped over the length of the section (s), by damming conditions including damming, water table drop and roughness coefficient. The upper position shows the normal damming level and the raised damming level. The damming level is also affected by the flow rate. Taking into account so many factors that additionally depend on each other requires the use of numerical models. Only on this basis can the best efficiency of a hydropower station, including a hydroelectric power station, be determined. In this study, the effect of raising the damming level on the number of days of operation of a hydropower station was examined.
The HEC-RAS software (Hydrologic Engineering Centre—River Analysis System) version 5.0.3 was used to simulate the water flow. The software used is based on a one-dimensional model for calculating the elevation of the water surface level in open channels. Calculations were performed for steady and unsteady flows.
The mathematical model used for the simulation was prepared on the basis of data obtained from field measurements and data received from the company operating the hydropower plant, as well as hydrological data made available by the Institute of Meteorology and Water Management—National Research Institute. The parameters necessary for the proper operation of any program are the boundary and initial conditions. The boundary conditions entered into the HEC-RAS computer program were the flow rate values on Gwda river and Głomia river, and the water surface gradient on Gwda river.
A hydrological analysis was carried out on the basis of hydrological data from the multi-year period of 1982–2012. Calculations of monthly first-degree characteristic flows for each year have been made. The high, mean and low flows were then used to draw up a table of first- and second-degree flows from the multi-year period analyzed.
For Głomia river, the results of the calculations are summarized in
Table 1, while for Gwda river they are summarized in
Table 2.
The model analyzed was divided into sections depending on the study variant. Six variants labelled A–F were prepared. Variant A only examined the impact of the confluence of the Głomia and Gwda rivers without considering the section flowing from the weir on Głomia river (
Figure 3).
Section 1—Gwda river from the P0 cross-section to the confluence with Głomia river;
Section 2—Gwda river below the confluence with Głomia river;
Section 3—Głomia river from the hydropower plant to the confluence with Gwda river.
The calculations also included a diagram taking into account the confluence of the two river channels of Głomia river (Section 3 from the HPP and Section 4 from the weir) resulting in another connection and division of the river into 2 further sections (
Figure 4).
Section 1—Gwda river from the P0 cross-section to the confluence with Głomia river;
Section 2—Gwda river below the confluence with Głomia river;
Section 3—Głomia river from the hydropower plant to the confluence with Section 4;
Section 4—Głomia river from the weir to the confluence with Section 3;
Section 5—Głomia river from the confluence of sections 3 and 4 to the confluence with Gwda river.
In order to carry out the simulations that enabled the model parameters to be identified, it was necessary to provide flow values for each river section. For Gwda river, based on data provided by the company operating the hydropower plant for the measurement day, a value of 17.16 m3·s−1 was adopted. For Głomia river, the flow values were specified using hydrometric measurements from the P5 and P8 cross-sections. They were amounted to 0.85 m3·s−1 for Section 3, 0.03 m3·s−1 for Section 4 and 0.88 m3·s−1 for Section 5. On the basis of the premise adopted above, the model parameters were identified, which allowed the roughness coefficients of the bottom and banks of the channel to be tared. Its value has been determined as 0.045 m−1/3·s for Gwda river and 0.03 m−1/3·s for Głomia river. The coefficient value for Gwda river is higher due to the dense vegetation present in the riverbed. A verification of the validity of the results from the mathematical model was carried out using the measured water surface system.
In the following part of the article, the water surface system was simulated for six variants (
Table 3) on different sections of the Gwda and Głomia rivers in a steady motion. The variants contain a study of the impact of Gwda river on the operating conditions of the hydropower plant for different flows. The analysis resulted in graphs of changes in the water surface elevations of Głomia river from the Stary Młyn hydropower plant in Dobrzyca to the confluence with Gwda river for the adopted variants.
Based on hydrological data for the 1982–2012 period and using hydrological analysis, 1992 was identified as a dry year, 1988 as a wet year, and 1995, 2000 and 2007 as average years (with flow values corresponding to the multi-year mean value).
Hydrological data for average years and dry and wet years were used to determine the number of days the SHPP was in operation. The analysis was based on the results of the water surface system modelled using the HEC-RAS model. The results were used to determine the loss in electricity production caused by the shutdown. An analysis of the impact of changes in the damming level at the upper position of the hydroelectric plant, was also carried out. On this basis, the effect of additional damming on the operating time of the hydroelectric power station and the range of flows at which the power station operates was determined.
3. Results
In order to check the validity of the results obtained using the mathematical model, a verification of the model parameters was carried out. The water surface system results obtained from the mathematical model were compared with the actual water surface elevations at selected measurement cross-sections. The water surface elevations obtained during simulation in the HEC-RAS software differ slightly from the elevations measured in the field.
For the variants described above, simulations were carried out to determine relationships showing the impact of water surface levels in Gwda river on the water surface system in the section of Głomia river from the mouth to the barrage. The results for the variants that adopted characteristic flows for Gwda river (A, B and E) are shown in
Figure 5, while the results for the other variants (C, D), taking into account the characteristic flows for Głomia river, are shown in
Figure 6.
The vertical axes of the graphs show the water surface elevations read in HEC-RAS at the lower station in cross-section P5 located immediately below the hydropower plant. The horizontal axes of the graphs represent the characteristic flows. The graphs also indicate the level which, if exceeded, results in the suspension of electricity production by the Stary Młyn SHPP. This elevation for current operating conditions is 61.90 m a.s.l. and corresponds to a gradient of 2 m, for which the flow on Głomia river is 7.21 m3·s−1.
The shape of the curves for the different variants shown in
Figure 5 is similar. Above the SWQ flow of 51.9 m
3·s
−1, the courses become parallel. The significant similarity of the results for Variants A and E is due to the similar values of the flows adopted for the simulations on Głomia river (2.44 m
3·s
−1 and 3.3 m
3·s
−1). Increasing the flow from the value of 2.44 m
3·s
−1 (Variant A) to 3.3 m
3·s
−1 (Variant E) has little effect on water surface levels in the P5 cross-section located downstream of the HPP on Głomia river. Increasing the flow to 7.21 m
3·s
−1 (Variant B) results in an increase in the water surface level depending on the characteristic flow on Gwda river from about 0.35 m for NNQ to about 0.15 m for WWQ (the difference in the water surface levels decreases as the flow increases). The increase in characteristic flows on Gwda river has a very strong impact on the water surface levels at the P5 cross-section. The difference in levels at the analyzed cross-section for the WWQ and NNQ flows on Gwda river and steady flow on Głomia river is approximately 1.9 m.
An analysis of
Figure 5 shows that there is little effect of increasing the flow of water on Głomia river on the elevation values of the lower position of the SHPP. A significant influence on the bottom water elevations is the typical flows on the River Gwda. The hydroelectric power plant is shut down above the SSQ flow on the River Gwda. It can be said that the lower position of the SHPP on Głomia river in Dobrzyca is significantly influenced by the backwater of Gwda river.
The situation changes significantly when we begin to analyze a case in which we increase the level of damming at the hydroelectric power plant being studied. Raising the damming level raises the hydroelectric power plant’s shutdown level. Analyses show that a possible increase in the water surface level by, for example, 0.5 m, can cause a significant increase in the values of flows that will not cause the hydroelectric power plant to shut down. Depending on the variant, it is an increase of about 18 m3/s. Having analyzed the characteristic flows, it can be said that raising the level of damming by 0.5 m increases the values of flows on Gwda river, causing the shutdown of the power plant (from SSQ to SWQ). This is very beneficial for the scope of operation of the SHPP. Based on the field inspection and analysis of local conditions, raising the water surface should not cause flooding in the areas above the hydroelectric power plant.
When analyzing the effect of the flows on the water surface ordinate in cross-section P5 in relation to the flows on Glomia river (
Figure 6), one can observe a clear influence of the characteristic flows of Gwda river on the water surface level in the vicinity of the power plant water surface (Variant D). The increasing characteristic flows of Gwda river have a strong influence on the rise in the water surface elevation at the analyzed P5 cross-section. This has a direct bearing on the operation of the SHPP, with the shutdown of the HPP occurring between the SSQ and WWQ flows on Gwda river and Głomia river. Comparing the influence of flows on water surface elevations, it was found that the occurrence of flows higher than SSQ on Gwda river causes a significant rise in water level elevations at the P5 cross-section. In the case of Variant C, the study noted a minor effect of increasing flows on Głomia river (from NNQ to WWQ), with a constant SQ flow of 27.1 m
3·s
−1 on Gwda river, on the operation of the hydropower plant. It is only at the WWQ flow on Gwda river that the HPP is shut down.
Based on the results obtained for variant C, it was shown that for the SSQ flow on Gwda river and various typical flows on Głomia river, there will be no shutdown of the hydroelectric power plant. On the other hand, based on variant D, it is evident that flows higher than SSQ on Gwda river significantly affect the lower water level, which may cause the hydroelectric power plant to shut down.
It has also been shown that a rise in the water level by 0.5 m at the Stary Młyn water barrage will cause, as in the previous scenarios, significant changes regarding the power plant’s ability to operate. Over the entire range of flows for variant C, the water surface level limit that triggers the shutdown of the hydroelectric power plant will not be exceeded. In contrast, for variant D, there will be a significant increase in flow rate by approximately 1.8 m3·s−1 for Głomia river. In other words, in scenario D, as a result of increasing the damming level, conditions of undisturbed operation of the power plant may arise for flows on the Gwda and Głomia rivers at almost SWQ levels.
In order to investigate the impact of Gwda river flows on the Głomia River flows, an additional Variant F was prepared and compared with variant D. For Variant F, it was assumed that the flows on the Gwda river are equal to the lowest and the flows on Głomia river are equal to different characteristic flows. The comparison made it possible to check the difference in water surface levels on Głomia river as a result of being raised by the waters of Gwda river. The study resulted in a layout of water surface elevations and differences between water surface levels for different characteristic flows of the Głomia and Gwda rivers at the P1, and P5 cross-sections for the adopted variants.
Figure 7 shows an analysis of the changes in water surface levels between variants D and F for the P1 cross-section.
The P1 cross-section is located closest to the confluence of the Gwda and Głomia rivers; therefore, the differences in the water surface are the greatest. For low flows, they are around 0.49 m, for mean flow—0.89 m, and for high flows—between 1.68 m and 2.35.
Figure 8 shows the effect of Gwda river backwater on the water surface level at the P5 cross-section, depending on the characteristic flow on Gwda river.
The difference between the variants D and F at the P5 cross-section was, respectively, 0.5 m for the SNQ flows, 0.24 m for the SSQ flow, 0.95 m for the SWQ flow and 1.62 m for the WWQ flow (
Figure 8).
At the lower position of the hydroelectric power plant, the difference between the variants for WWQ flow decreased by 0.73 m compared to the cross-section located near the mouth. The distance between the connection and the lower position of the hydropower structure is about 585 m. For the other typical flows, there was also noted a significant reduction in the influence of Gwda river as it moves away from the estuary section.
Analyzing the graphs above, it is possible to observe the significant influence of Gwda river on flow conditions in Głomia river. The high characteristic flows in Gwda river result in a meaning rise in the water surface on Głomia river near the confluent water surface. The further away from the confluence of the two rivers, the smaller the influence of Gwda river on Głomia river, but it is clear even near the lower station of the hydropower plant (P5 cross-section). In the case of variant D, the increase in water surface elevations is due to the rise resulting from high flows on Gwda river. The results indicate the need for continuous monitoring related to the operation of the studied barrage, so that appropriate measures can be carried out to realize the potential of the power plant.
Increased water surface levels have a direct impact on the operating conditions of the HPP, which is associated with a reduced efficiency due to more frequent downtime.
4. Discussion
The factors that most influence the production of electricity are the hydrological conditions of the barrage operation, including the flow rate.
For the analyses of flow conditions, as in the work of Moldoveanu and Popescu [
53], a dry year, a wet year and an average year were selected. The hydrographs (
Figure 9 and
Figure 10) show the variation pattern of the water surface levels at the lower station of the hydropower plant (P5 cross-section) on Głomia river in a dry and wet year, taking into account the variability of flows in Gwda river. The figures also indicate the water surface level which, if exceeded, results in the shutdown of the hydropower plant.
Analyzing
Figure 9, it can be observed that the best conditions for power plant operation occurred in the dry year of 1992. At that time, the average water surface level was approximately 61.34 m a.s.l. Back then, the duration of the power plant shutdown did not exceed 15 days per year. In a dry year, due to the occurrence of low flows, the shutdown time of the hydropower plant was low.
For the wet year of 1988 (
Figure 10), the power plant shutdown lasted a total of 188 days, with the operating time falling mainly between mid-July and mid-November. The highest water surface level at the lower station of the hydropower plant was recorded in early March 1988 and it amounted to 62.97 m a.s.l. In a wet year, there was a long-term shutdown of the hydropower plant due to the long duration of high water flows.
Using the graphs in
Figure 9 and
Figure 10 for each year, a table was drawn up showing the total operating time and downtime of the hydropower plant, and losses in electricity production were calculated (
Table 4). For the calculation of losses associated with the HPP shutdown, a power plant capacity of 45 kW was adopted.
Table 4 shows that the highest losses in energy production occurred in the wet year (approximately 203 MWh); this is mainly due to the fact that the hydropower plant, as a result of the exceeded water surface level in the lower station, did not operate for as many as 188 days during that year. In the dry year, paradoxically, the plant operated more stably and its loss was estimated at approximately 16 MWh. Similar findings, taking into account different climate scenarios, were presented by [
51] in his study of the operation of two small hydropower plants in Greece.
For the average years of 1995, 2000 and 2007 (
Figure 11), the period when the plant was not operating due to the exceeded water surface level was 61, 61 and 69 days, respectively. For the average years, the vast majority of the HPP shutdown periods fall between February and the end of April (during the spring surge). During the rest of the period, there were no interruptions to the operation of the power plant with the exception of a 3-day downtime in December 2000. For the average years, the mean values of water levels varied in the range of 61.60–61.64 m a.s.l.
Using the graphs in
Figure 11 for each year with average flows, a table was drawn up showing the total operating time and downtime of the hydropower plant, and the potential losses in electricity production were calculated (
Table 5). For the calculation of losses associated with the HPP shutdown, a potential power plant capacity of 45 kW was adopted.
Based on
Table 5, it can be assumed that the potential losses in energy production in an average year resulted from power plant downtimes ranging from 61 to 69 days. The average loss in electricity production is around 69 MWh, although in 2007 the loss was over 74 MWh.
The analyses carried out examined the impact of a possible increase in the damming level at the Dobrzyca barrage on Glomi river on the operation of the hydroelectric power station. The number of days of operation of the HPP depending on the level of damming at the upper position of the Dobrzyca barrage was analyzed (
Table 6).
Raising the damming level by 0.2 m results in an important increase in the number of days during which the hydroelectric power plant operates—for a wet year by 63 days, for an average year by about 40 and for a dry year—by 15 days. In contrast, increasing the damming by 0.5 m increases the number of days the hydroelectric power plant operates in a wet year by 142 days, while for the other years analyzed, the plant operates almost all year round. An analysis of the table indicates that the possibility of raising the water surface at the upper site would significantly increase the number of days of operation of the SHPP and the volume of electricity production.
Information on electricity production in recent years was obtained from the unit supervising the operation of the Stary Młyn SHPP on Dobrzyca river. Quarterly data concerning electricity production in the period of 2018–2022 was analyzed (
Figure 12).
The lowest electricity production was observed in Q
3, which may be related to the low flows on Dobrzyca river observed at that time. In 2022, it was only 13.5 MWh. The highest production occurred in Q
1 which was due to the relatively stable, high flows during this period. The highest production was recorded in Q
1 in 2020, at 78.8 MWh. However, an analysis of the annual electricity production over the years shows a decrease in production in subsequent years (
Figure 13).
As far as hydrological conditions are concerned, the years analyzed in
Figure 14 were rather average years (water levels did not exceed alarm levels)—alarm level exceedance and the fairly high surge (the second highest in the entire 40-year-period) were recorded only in February 2018. The year 2021, on the other hand, was described as dry. However, the observed reduction in electricity production can be linked to the declining flows trend observed during this period (
Figure 15). However, the earlier period of 1982–2012 was characterized by a lack of clear trends in flow value changes. The emerging changes can be directly linked to the consequences of climate change. Research of this kind has been widely discussed and presented in many publications [
54,
55,
56,
57]. In this context, it is anticipated that renewable energy sources, due to their direct (e.g., wind turbines) or indirect (e.g., hydropower) dependence on hydro–meteorological conditions, will be dependent on climate change. Such research, among other things, was conducted by Skoulikaris [
51], who analyzed the operation of two small hydropower plants in Greece in terms of future energy production under climate change conditions. Taking into account the three regional climate models, hydrological models were built and included in the simulation of electricity production. The study confirmed that in the case of a significant projected reduction in flows (~25–30%), a significant reduction in future energy production is anticipated (~20–25%). On the other hand, it turned out that in the decline projections of smaller flows (up to ~15%), the context of energy production would depend on the monthly fluctuations of the flows.
A similar phenomenon was observed at the studied site. When analyzing the trends in the dependence of electricity production on monthly average flow values from 2018 to 2022 for Głomia river at the Stary Młyn cross-section, it is worth noting a fairly close linear relationship (
Figure 14), as indicated by the high value of the coefficient of determination,
R2 = 0.782. On the other hand, attention should also be paid to the outlier marked with a red border. Here, unfortunately, despite the high flow rate, the quarterly electricity production is quite average. This is a direct result of the hydrological conditions prevailing in February 2018, when flooding was reported in the catchment areas of the Gwda and Głomia rivers, which caused a temporary shutdown of the power plant.
Detailed analyses by a number of another researchers [
58,
59], such as Gaudard et al. and Ludwig et al., show that there is no analogous pattern between river flows and reductions in energy production, as there are cases where fairly large reductions in flows translate into small reductions in energy production or where small declines in annual flows result in large reductions in energy production. For example, on Kalamas river, a 13.4% reduction in flows resulted in a 2.84% reduction in production energy, in contrast to Axios river, where a 5.12% reduction in flows resulted in a 15.81% reduction in energy production [
51]. This lack of correlation comparing river flows and energy produced is due to the design of run-of-river SHPPs, where even a small reservoir for water retention allowing the use of water from the reservoir during low-water periods proves to be important, as well as the possibility of an upper position of the water level in reservoirs [
35]. Another important factor in the operation of small, lowland hydropower plants is the unpredictable seasonality of river flows [
58] on a monthly basis.
Similar studies have been conducted for Polish rivers [
60], including Vistula river in Warsaw and Ner river for the Dąbie water gauge [
61]. The latter studies were concerned with assessing the changes that took place within the average annual flow hydrograph, derived based on mean flows calculated for identical days of the year. It is clear from the course of the average hydrographs, as well as from the trend lines obtained for them, that in the later series, covering the years 1983–2014, and compared to the earlier series (1951–1982), the flows were clearly lower in autumn and winter, very similar in spring and slightly higher in early summer.
Similar analyses were carried out for the study site. On the basis of hydrological data from the Piła water gauge and the Krajenka precipitation station, a graph was drawn up comparing the values of total precipitation in each year and the mean flows from each year (
Figure 15).
Based on an analysis of the changes in total precipitation in the years 1982–2022, it is possible to observe two trends which indicate an increase in precipitation between 1982 and 2012 and a decrease between 2013 and 2022. On the other hand, the trend analysis of the multi-year mean flows shows no clear trend of changes in flow values in the first period and a weak downward trend in flows in the period 2013–2022. Similar changes were observed in other catchments including Flinta river catchment. This is confirmed by one of the climate change variants for Poland, where precipitation trends may change; at the same time, taking into account the increase in evapotranspiration, flows are subject to little change or will even decrease. This may, of course, affect the electricity production of the SHPP. In this context, the European Environment Agency reports that precipitation variability can create uncertainty when investing in hydropower [
62]. On the other hand, run-of-river power plants are considered to be facilities with minimal dependence on changes in head [
63] as well as installations that can generate power even at low flows. They are also indicated as facilities that are more friendly and have less of an environmental impact [
64] than hydropower based on large reservoir facilities.
5. Conclusions
This paper analyzes the problems of operating small hydro power plants by taking into account primarily hydraulic and hydrological aspects. This issue is extremely important from the point of view of small damming in lowland catchments where low gradients prevail. The lower position of the power plant, in many such cases, is either under the influence of damming at the next barrage or under the influence of confluence and water levels in the riverbed, where the river the power plant is built on enters. The variability of flows, and also currently the impact of climate change, contribute to a reduction in power generation opportunities. This is due to the optimal value of the damming height, below which it is uneconomical or even impossible to operate the power plant.
This paper examined the impact of the extent of Gwda river’s backwater on the operating conditions of the Stary Młyn hydroelectric power plant in Dobrzyca on Głomia river (Poland). Using hydrological data and the results of field measurements, simulations of hydraulic conditions at the lower position of the hydroelectric power plant were carried out. Calculations were performed using HEC-RAS software, taking into account several flow variants that are relevant to the operation of the power plant and water surface. The result of this research was determining using the possibility of electricity production depending on water levels on Gwda river and flows on Głomia river.
Based on the analysis, the following conclusions can be detailed:
It is shown that for the current operating conditions of the water depending on the variant of the hydroelectric power plant’s operation, at flows on Gwda river of the order of even 30–28 m3/s (i.e., a flow only slightly higher than the average flow from the multi-year SSQ), the operation of the hydroelectric power plant stops.
For flows on Głomia river, which shut down the hydroelectric power plant, these are values that, in extreme cases (variant D), will be greater than the flow of 4.1 m3/s (i.e., slightly higher than the SSQ multi-year average flow).
Analyses of power plant shutdowns show, for example, that the wet year of 1988 amounted to 188 days, and resulted in a loss of electricity production of 203 MWh. In dry years, on the other hand, the situation is seemingly better; for example, in 1992, outages covered only 15 days and amounted to losses of 16 MWh. It should be remembered, however, that in situations of drastically low flows, the hydroelectric power plant will also be shut down.
As shown in the studies, a recent trend of declining flow values is emerging as a result of climate change. This is true of many lowland rivers with small catchments, and is a trend that will significantly affect the potential for small hydro power plants.
A certain solution, which has also been analyzed in the studied case, may be to rise the upper position of the weir. A damming of 0.2–0.5 m allows the power plant to significantly increase its operating range.
When the elevation is raised by 0.2 m in a wet year, the power plant’s operating time is extended from 177 to 249 days, and when the damming is increased by 0.5 m, the operating time is extended up to 319 days. In addition, it should also be remembered that each additional damming of even a few dozens of centimeters is an increase in the amount of water retention, which is so necessary in current and projected climate change scenarios.
A detailed analysis of the operation of the small Stary Młyn barrage allowed us to determine the sensitivity of the operation of a small hydro power plant depending on the changing hydrological conditions throughout the rather complex hydrographic system, which consists of the Gwda and Głomia rivers. On top of all this, as shown in this paper, factors related to climate change are also beginning to add up, which can contribute to reductions in electricity production. This may be related to the forecasted, and partly already observed, high variability of extreme events (floods and lows), which threaten the stable operation of small hydro power plants.


