Article

Potential Business Models of Carbon Capture and Storage (CCS) for the Oil Refining Industry in Thailand

by
Waranya Thepsaskul
1,
Wongkot Wongsapai
2,3,*,
Jirakom Sirisrisakulchai
4,*,
Tassawan Jaitiang
3,
Sopit Daroon
1,
Varoon Raksakulkan
1,
Phitsinee Muangjai
2,5,
Chaichan Ritkrerkkrai
2,5,
Pana Suttakul
2 and
Gengwit Wattakawigran
6
1
Program in Energy Engineering, Department of Mechanical Engineering, Faculty of Engineering, Chiang Mai University, Chiang Mai 50200, Thailand
2
Faculty of Engineering, Chiang Mai University, Chiang Mai 50200, Thailand
3
Multidisciplinary Research Institute, Chiangmai University, Chiang Mai 50200, Thailand
4
Faculty of Economics, Chiang Mai University, Chiang Mai 50200, Thailand
5
Office of Research Administration, Chiang Mai University, Chiang Mai 50200, Thailand
6
Energy Technology for Environment Research Center, Chiang Mai University, Chiang Mai 50200, Thailand
*
Authors to whom correspondence should be addressed.
Energies 2023, 16(19), 6955; https://doi.org/10.3390/en16196955
Submission received: 9 September 2023 / Revised: 1 October 2023 / Accepted: 3 October 2023 / Published: 5 October 2023
(This article belongs to the Special Issue Design and Implementation of Renewable Energy Systems)

Abstract

:
The escalating concerns over climate change have propelled industries worldwide to seek innovative strategies for mitigating greenhouse gas emissions. Within the energy sector, Carbon Capture and Storage (CCS) technology emerges as a promising solution to curtail emissions and foster sustainable development aims for the net zero approach. This research delves into the role of government support in expediting CCS adoption for the maximum potential of 9.79 MtCO2 storage from six major refinery plants. The refineries mentioned above are anticipated to necessitate an initial capital investment of approximately 18,307 million THB. This research focuses on potential business model proposals appropriate for a country’s context, specifically, applying CCS technology to the Thai oil refining sector. To achieve the realization of CCS within the context of this study, a combination of three essential measures will be required: tax incentives, carbon credits, and grants. This process will commence with the implementation of tax incentives, followed by an increase in the carbon price within the country. Finally, the establishment of a dedicated fund, funded through deductions from oil excise tax revenue, will play a pivotal role in facilitating the necessary financial support for the emergence of CCS.

1. Introduction

The energy landscape in Thailand is poised for significant transformation. From 2015 to 2036, the energy demand in the country is projected to surge to approximately 172.29 million tons of oil equivalent (Mtoe), marking a substantial increase of 103.24% over this period [1]. This heightened demand for energy is intrinsically linked to an increase in greenhouse gas (GHG) emissions. According to the Intergovernmental Panel on Climate Change (IPCC), the recommended goal is to reduce global carbon dioxide (CO2) emission by 50–80% relative to 1990 levels by the year 2050 [2]. As a result of the 26th UN climate change conference (COP 26) in Glasgow [3], Thailand is actively seeking effective strategies to accomplish specific objectives within three separate timeframes: short-term, medium-term, and long-term. Thailand has established a Nationally Determined Contribution (NDC) with the objective of reducing GHG emissions by 40% by the year 2030 [4]. This objective is aimed at increasing capacity to ten million tons of CO2 equivalents per year (MtCO2e/y). Furthermore, Thailand has revised its Long-Term Low Greenhouse Gas Emission Development Strategy (LT−LEDS) with the goal of achieving 40 MtCO2e/y to promote Carbon Neutrality by 2050 and reaching 60 MtCO2e/y in addition, to achieve Net Zero emissions by 2065 [5] as shown in Figure 1.
The latest CO2 emissions data from Thailand, as reported in the Fourth Biennial Update Report (BUR4) [6], indicates that in 2019, the country’s total CO2 emissions reached 279.04 MtCO2. Notably, the energy and transportation sector accounted for the highest proportion of CO2 emissions at 87.80%, which is equivalent to 244.99 MtCO2. In terms of proportions within the energy and transportation sectors, the fuel combustion industry on the producer side (1A1) stands out. This includes the combustion for main activities such as electricity and heat production (1A1a), as well as fuel refining combustion (petroleum refining: 1A1b). This industry holds the largest share of CO2 emissions within the energy sector, accounting for 36.71%, which is equivalent to 102.44 MtCO2, shown in Figure 2.
In general, natural processes have inherent mechanisms that enable them to partially mitigate the accumulation of atmospheric CO2. These processes have existed for extensive periods of time, contributing to the maintenance of a balanced carbon cycle. However, due to the significant release of CO2 emissions caused by human activities, it has become necessary for engineering solutions to intervene, with the purpose of restoring the natural balance of the carbon cycle [7]. Technology with high investment value is necessary to achieve the reduction targets that have already been set, especially through the utilization of Carbon Capture Utilization and Storage (CCUS) [8]. CCUS technologies serve a dual purpose in achieving the goal of carbon neutral and net zero objectives; both the mitigation of emissions and the capture of CO2 from the atmosphere [9]. The cornerstone of CCUS technology implementation is the process of CO2 capture [10]. The captured CO2 can then be used for a diverse range of purposes. There are two possibilities, utilizing the benefits of mineralization in cement synthesis and storing it over time in the ground. Therefore, it is highly suitable for businesses characterized by significant CO2 emissions and substantial point sources [11]. Moreover, it is worth noting the concept of Bioenergy with Carbon Capture and Storage (BECCS) [12].
The IEA has compiled policies to support CCUS in foreign industries across three main sectors: fuel transformation, power generation, and industry. The groups encompass numerous sub-industries with high CO2 emissions, thus offering potential for CCUS implementation. The IEA has identified sources of CO2 emissions from power and heat generation, chemicals, iron and steel, cement, and fuel refining industries [13]. The selection of industrial groups with the potential to adopt CCS technology is intended to identify industries capable of reducing CO2 emissions. This process allows for prioritizing the suitability of industrial groups for appropriate CCS technology implementation. The pilot industry group was chosen based on two main criteria: impact and readiness. The impact criteria consist of two impact sub-criteria. The first one pertains to the intensity of CO2 emissions while the second one concerns the source of CO2 emissions, which is a stationary source. The readiness criteria consist of four sub-criteria. The first sub-criterion focuses on industries with a sufficient technological readiness level for the business or commercial application of CO2 capture technology. The second sub-criterion considers industries with geological storage potential or those that show promise as CO2 utilization targets. The third sub-criterion considers industries that have analyzed their CO2 emission data and have published their findings using reliable resources. The fourth sub-criterion focuses on industries that have access to comprehensive data concerning domestic and global GHG mitigation costs [14].
The refining industry holds the position of being the third-largest stationary emitter of GHG emissions globally [15,16], accounting for approximately 6% of total industrial GHG emissions [17,18]. Refineries are often not considered as candidates for deploying CCS due to the diverse nature of refining facilities, which would necessitate the development of customized CCS systems [19]. According to one study, the contribution of global oil refining to GHG emissions increased from 1.38 GtCO2e in 2000 to 1.59 Gt CO2 in 2021 [20], which represents an increase of around 15% over the span of two decades. Thailand is one of the top 20 countries for GHG emissions and has a growing proportion of the total with emissions from the global oil refining sector, accounting for 83.9% of the total in 2021 [20]. Thailand currently has a total of six oil refineries, and the country’s refining statistics tend to show an average growth rate of 5% [21]. This growth rate can be categorized into three periods: (1) 1986–1997, with the highest average growth rate of 15%; (2) 1998–2018, with an average growth rate of 2%; and (3) 2019 (COVID period)–2022, with an average growth rate of −2%, as shown in Figure 3.
The purpose of this study is to evaluate various business models for CO2 capture in the oil refining sector. This article is divided into five parts. Section 2 elaborates on the potential of oil refining, discussing the application of amine technology in six Thai refineries. In Section 3, the business model potential is examined in depth. The results are summarized and discussed in Section 4. Finally, Section 5 concludes the study with a brief overview.

2. Oil Refining Industry CCS Potential

Despite significant research and development efforts aimed at improving the effectiveness and cost-efficiency of CCS technologies, the implementation of such projects has been marked by uneven progress and has encountered various challenges in terms of investment and deployment on a global scale [22]. There are several technical approaches for CO2 capture, including industrial separation, post-combustion, pre-combustion, and oxyfuel combustion. Post-combustion capture systems are widely used across a broad range of technology readiness levels (TRL) from 1 to 9 [23]. Especially in the oil refining sector, there are advantages including that the technology in question has reached a higher level of maturity compared to other available options. Furthermore, it offers the advantage of easy adaptation to existing industrial facilities. However, post-combustion methods have disadvantages. They include low CO2 partial pressure and concentration, which reduces the efficiency of capture, necessitates more energy, and leads to increased capital and operational expenses [24,25]. The amine method is frequently used for capture, and its application has been shown to achieve a 98% capture rate efficiency [26].

2.1. Evaluation of the Capture Potential of the Oil Refining Sector

The study of the capture potential of the oil refining sector will utilize data on petroleum refining obtained from the EPPO [21] for the period spanning from 2000 to 2017. Additionally, the reported CO2 emissions will be sourced from the Energy Sector Greenhouse Gas Accounting Report for the same years. The oil refining production from six refinery plants’ data over an 18-year period has been utilized for plotting purposes. Therefore, a linear regression model was developed to establish a relationship between the transformed total operable refining capacity (X) and transformed CO2 emissions (Y). The resulting equation was Y = 0.0325X − 0.9383, for the correlation between oil refining volume and CO2 emissions [27] as shown in Figure 4, where a strong linear relationship is evident (R2 = 0.9640). This leads to a potential capture volume estimated at around 9.79 MtCO2/y, as demonstrated in the evaluation of the capture potential of all six refineries in Table 1.

2.2. Evaluation Source to Sink Matching for the Refining Sector

According to a reservoir potential assessment study conducted by CCS experts at OGCI [28] and data from the Global CCS Institute [29], the Asia–Pacific region is recognized as one of the world’s geological areas suitable for carbon sequestration. Furthermore, the Global CCS Institute [29] presented a recent analysis of areas suitable for CO2 storage. This analysis revealed that many regions of Thailand possess storage potential, particularly numerous areas in the Gulf region that are classified as ‘suitable’ or ‘very suitable’ for CO2 capture. Thailand demonstrates a significant correlation between its primary sources and sinks, offering promising opportunities for the implementation of CCS technology. Within the Thai context, certain locations, particularly those situated in the North Gulf of Thailand, have gained recognition due to their considerable CO2 storage capacity [30]. The Gulf of Thailand contains several offshore sinks that can be reached by emission sources along the coast [31]. Notably, six refineries emitting GHGs are situated closely along the upper coast of the Gulf of Thailand as shown in Figure 5. This area is considered a prime candidate for the implementation of CCS due to its substantial CO2 storage potential. The proximity of these six refineries to the upper Gulf of Thailand coastline, which can serve as a reservoir for CO2, positions it favorably for CCS initiatives. Hence, evaluating the CO2 capture potential of the oil refining sector aligns with the objectives of this study in the context of the source–sink relationship. As such, the process of matching sources and sinks holds significant importance in this study’s framework. Formative assessment of source–sink is essential and will be key for an investment business model.

3. Potential of a CCS Business Model

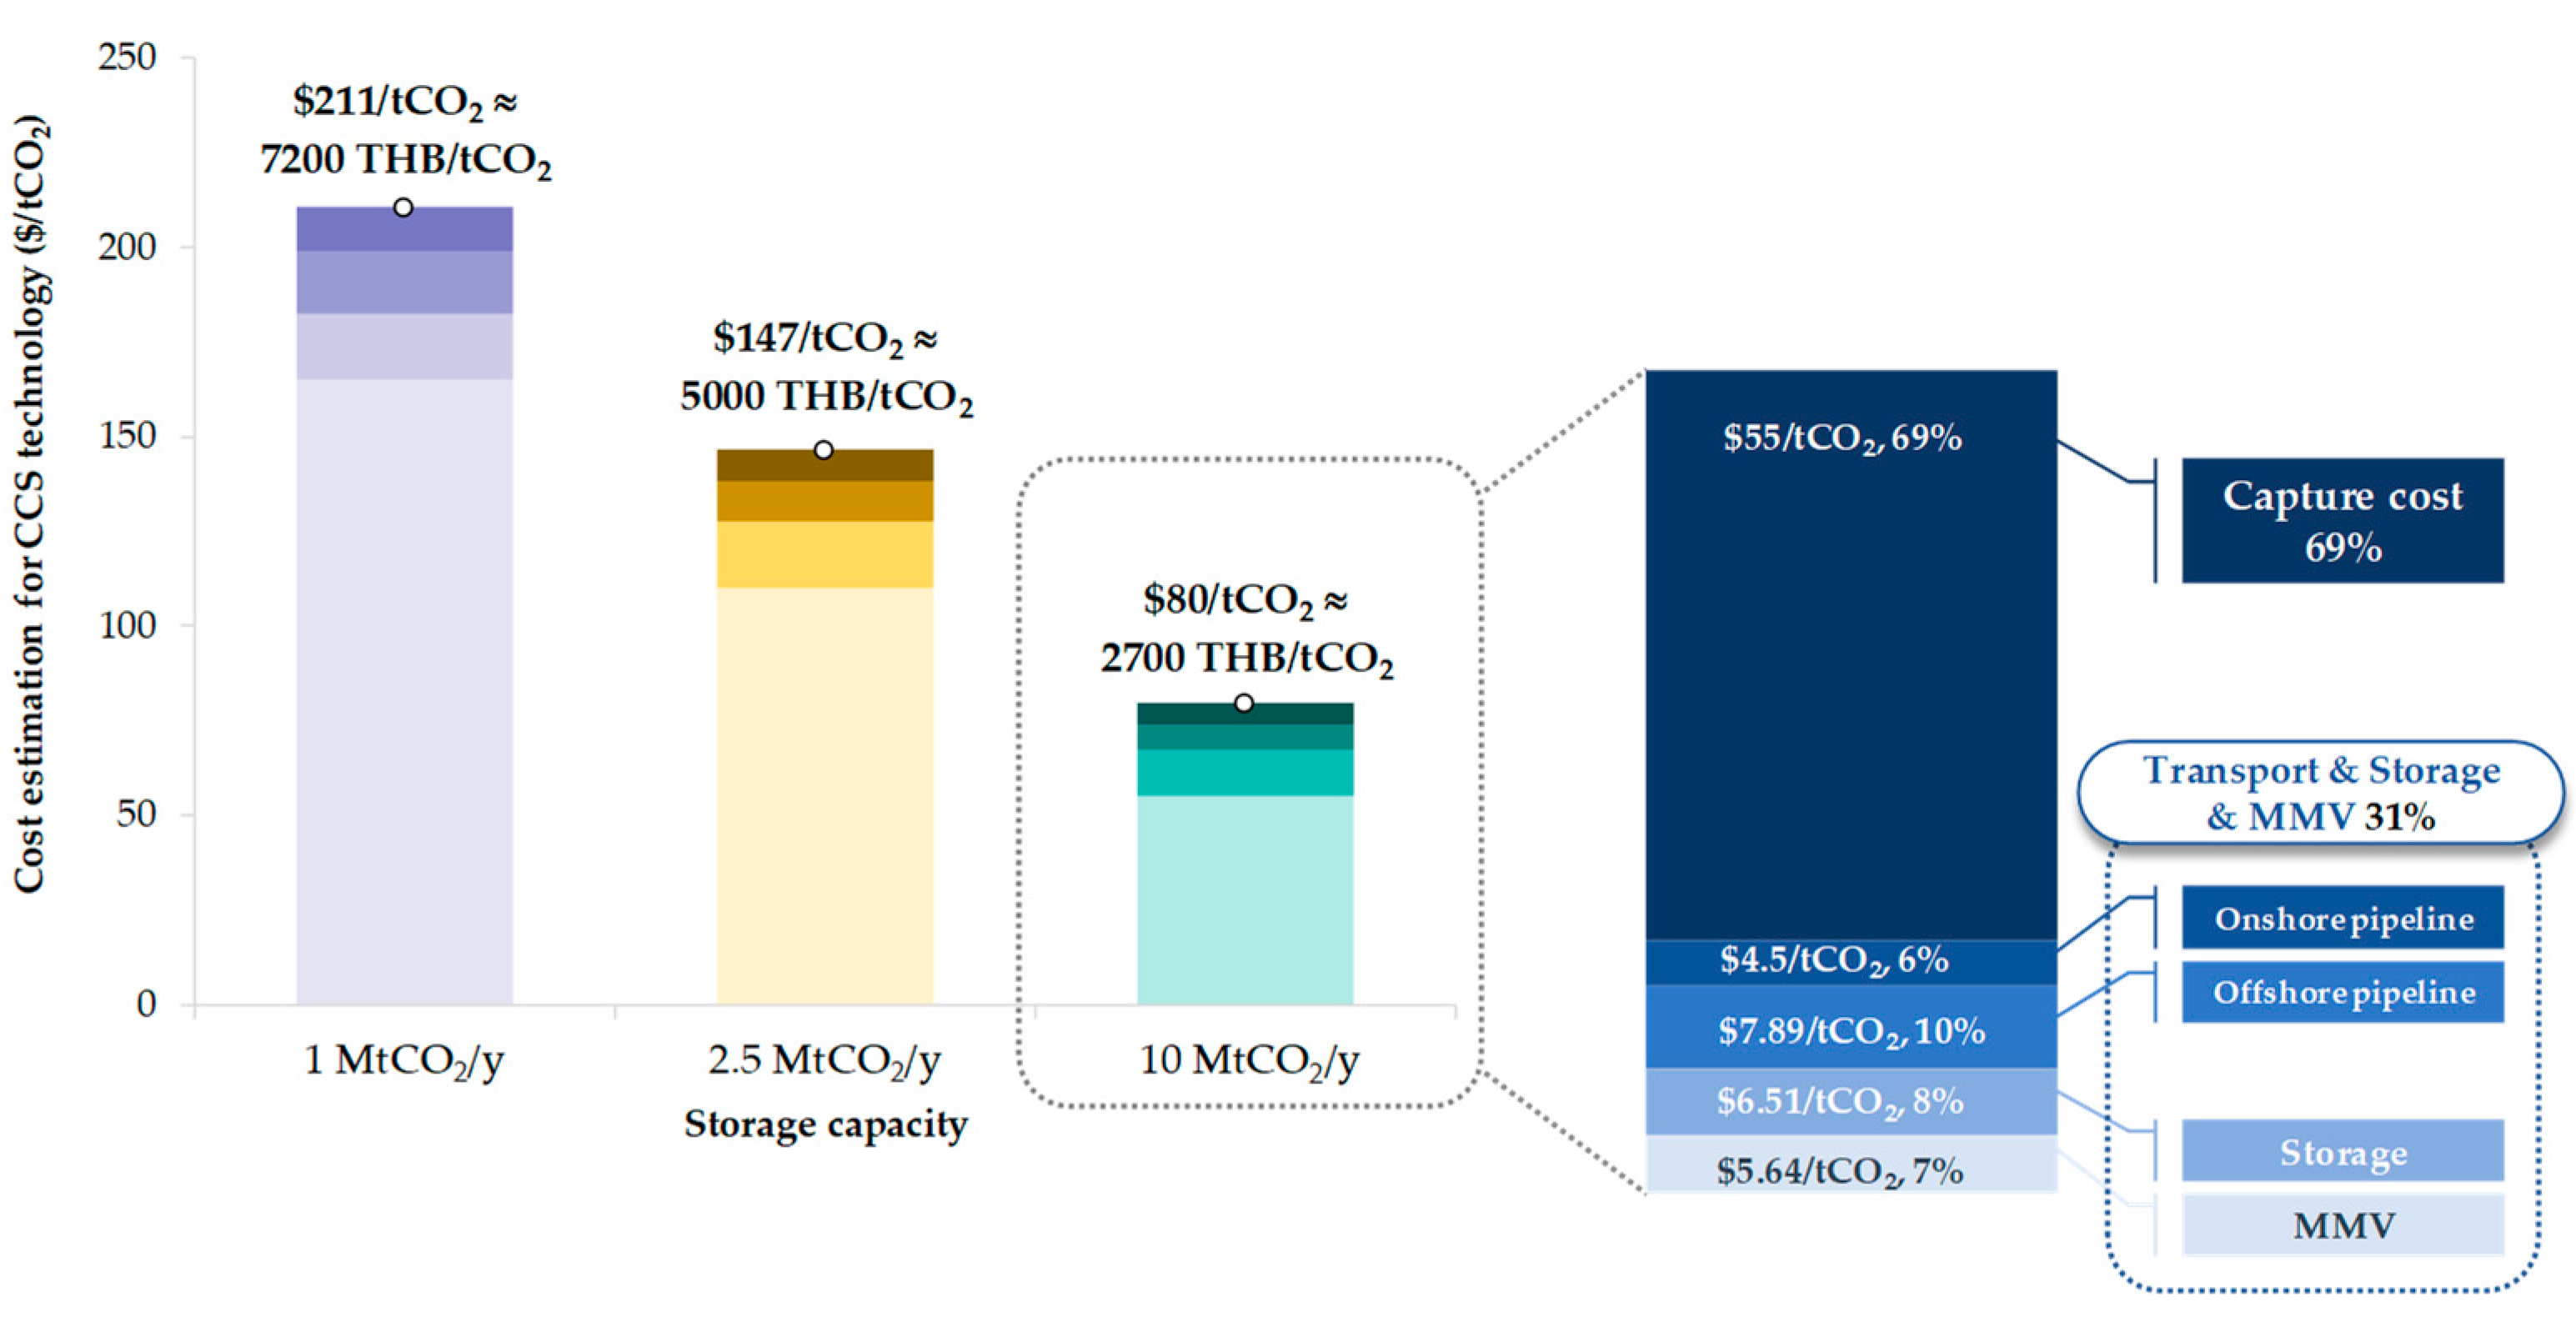
3.1. Cost Estimation for CCS Technology Investment at Various Scales

The most expensive component of CCS is the process of capturing CO2, which accounts for 50% or more of the overall expenses and can increase to 90% when compression is included [33]. The investment costs for adopting CCS technology are derived from international research data encompassing the costs of CO2 capture, onshore and offshore transportation costs at various distances, and Measurement, Monitoring, and Verification (MMV) for different capture sizes: 1, 2.5, and 10 MtCO2/y to illustrate the cost variations resulting from improved economies of scale, the capture cost is determined by considering the low, high, and average capture ranges within a specific refinery, as shown in Table 2.
For transportation, the pipeline distance is categorized into three segments, specifically 100–300 km from the CO2 source. However, the transportation cost is calculated for onshore pipelines at 200 km and for an offshore pipeline extending another 200 km. This results in a total pipeline transportation distance of 400 km, as detailed in Table 3.
Regarding storage and MMV costs, as presented in Table 4, the values are indicated up to 15 MtCO2/y. However, in this study, the costs are extrapolated to three capture sizes, which resulted from the overall cost assessment.

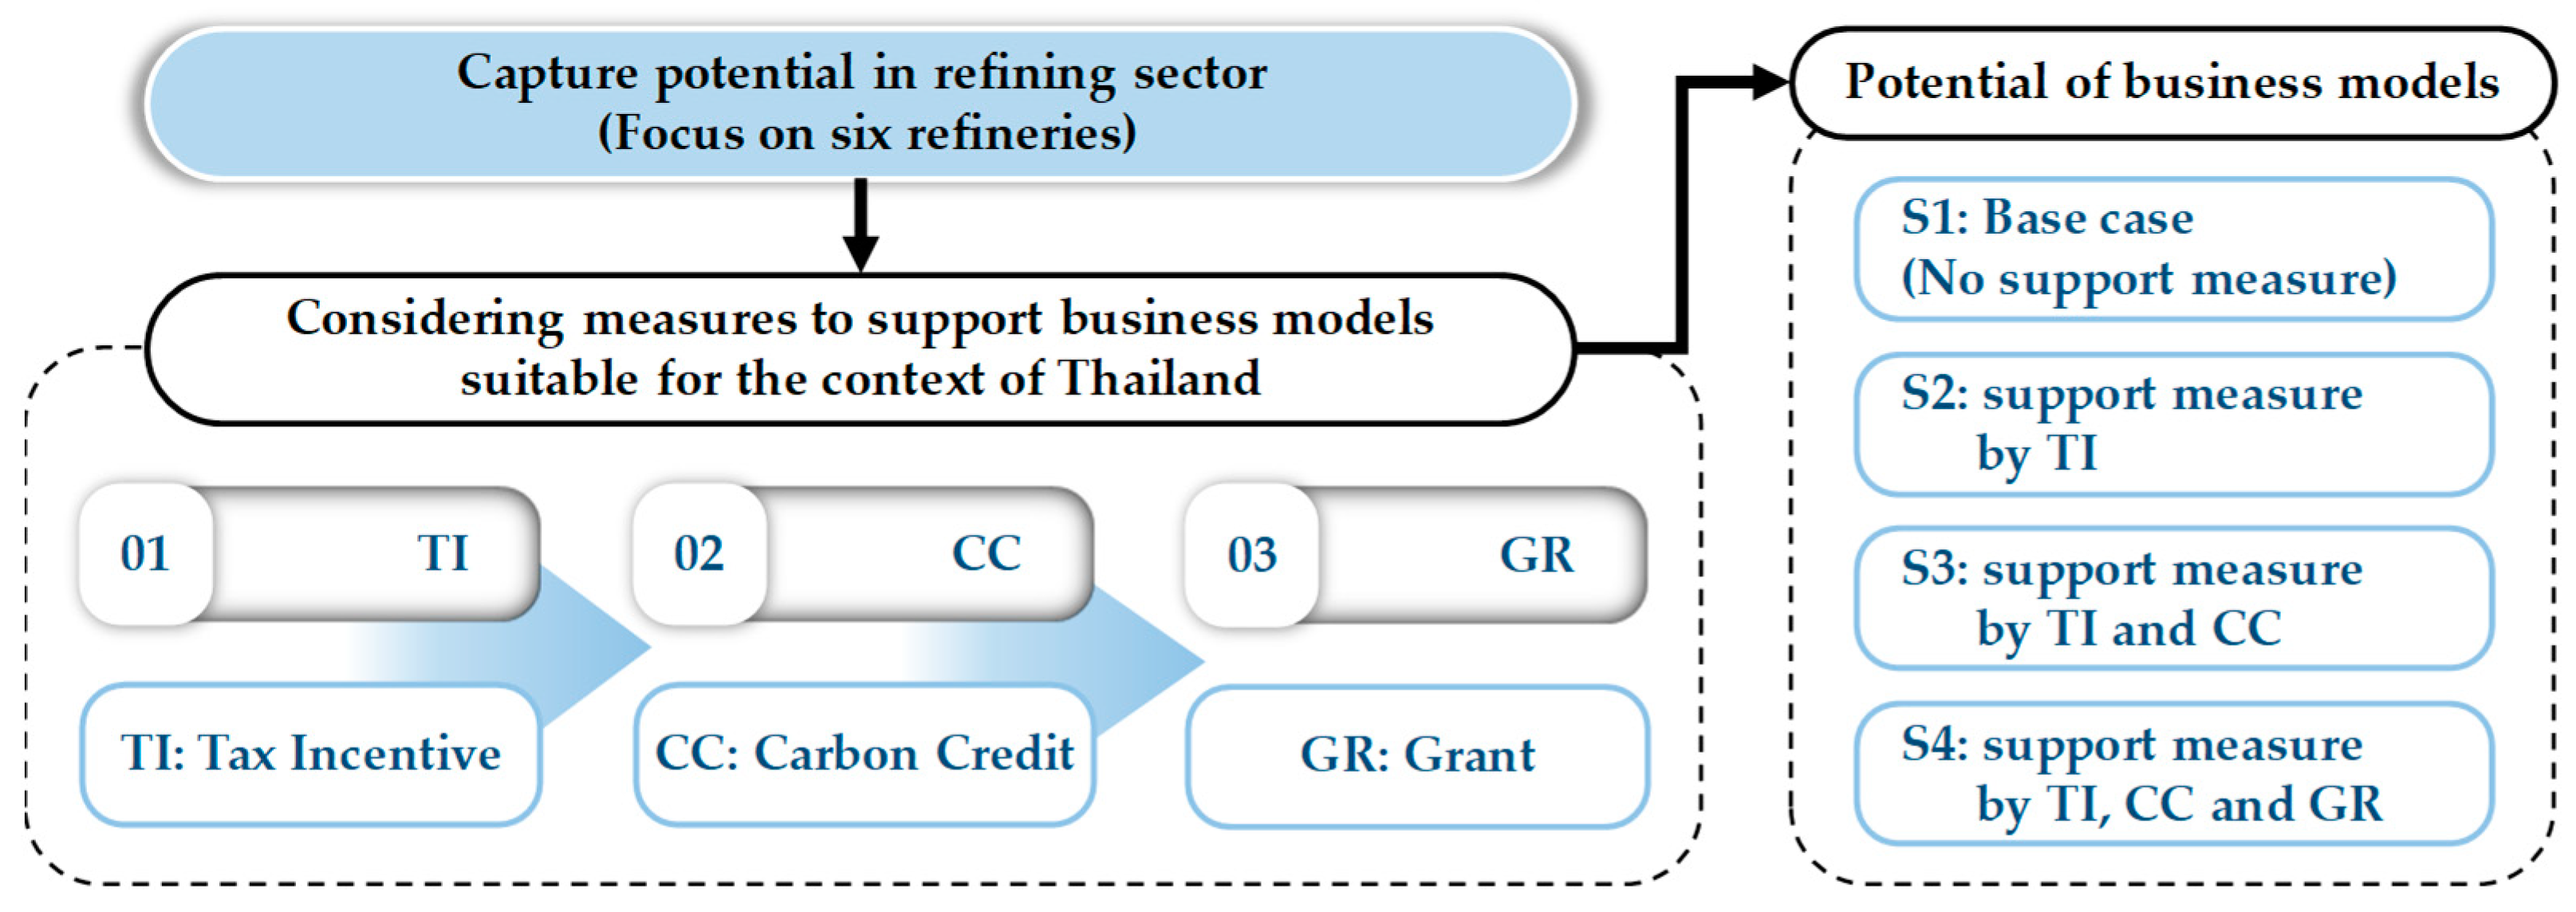
3.2. Business Model Options for Supporting CCS in the Refining Sector in Thailand

The comprehensive cost estimation results indicate that for capture sizes of 1, 2.5, and 10 MtCO2/y, the corresponding total costs were approximately 7200, 5000, and 2700 THB/tCO2, with larger capture volumes yielding greater cost savings. The cost breakdown for each size is illustrated in Figure 6. Notably, the high cost associated with obtaining CCS is primarily attributed to its substantial contribution, accounting for 69% of the overall cost. Refinery statistics from the year 2022 indicate that six refineries have the potential to capture around 9.79 MtCO2/y. To evaluate the viability of potential business models, a cost estimate of $55/tCO2 has been implemented. This assessment results in an initial investment cost of approximately 18,307 million THB. Business model analysis entails isolating capture costs from other expenditures, simplifying the implementation of support measures. The government’s focus is solely on the refinery sector, while activities such as transportation, storage, and MMV have been segregated into distinct operations overseen by state-owned enterprises.
In the evaluation of business models, the government assumes a pivotal role by offering assistance through the establishment of pertinent policies in the early stages to attract investments and provide incentives. Within the scope of this study, three primary measures have been identified to support financial business models. Commencing with the measure receiving the least government support, which includes tax incentives and carbon credits, the study reveals that Grant support, as illustrated in Figure 7, ultimately emerges as the government measure with the most significant impact.

3.2.1. Potential of Private Investment Model: Capturing Technology

This study proposes three capture technology financial support scenarios: (1) Tax Incentives (TI); (2) Carbon Credits (CC); and (3) Grants (GR). The tax incentive scenario is based on government support measures which have the following assumptions: the initial investment required for the implementation of CCS, specifically for the capture technology alone, amounts to $55/tCO2, which, at the exchange rate of 1 USD to 34 THB, equals 18,307 million THB. This assessment of the initial investment cost gains particular significance when contemplating the potential capture of 9.79 MtCO2/y. In the context of taxation, corporate income tax is levied based on the applicable tax rate for each refinery. Moreover, there is a tax incentive that allows a 200% deduction on the capital investment made in the same fiscal year.
The aforementioned refineries are projected to require an initial capital investment of approximately 18,307 million THB. Therefore, it is essential for the government to participate and play a role in the early phases of technology adoption, by providing support and assistance measures that are suitable and compatible with the specific circumstances of the refinery sector in Thailand, as shown in the details of tax incentive scenarios in Table 5.
From Table 5, it was found that six refineries received 8076 million THB of a total tax margin, calculated from tax in normal circumstance minus tax after CCS implementation, which resulted in a total net virtual cost of 10,231 million THB. The difference between tax and net virtual investment of each refinery will have different proportions depending on two major factors: the proportion of CO2 capture potential and the proportion of normal tax of each refinery.

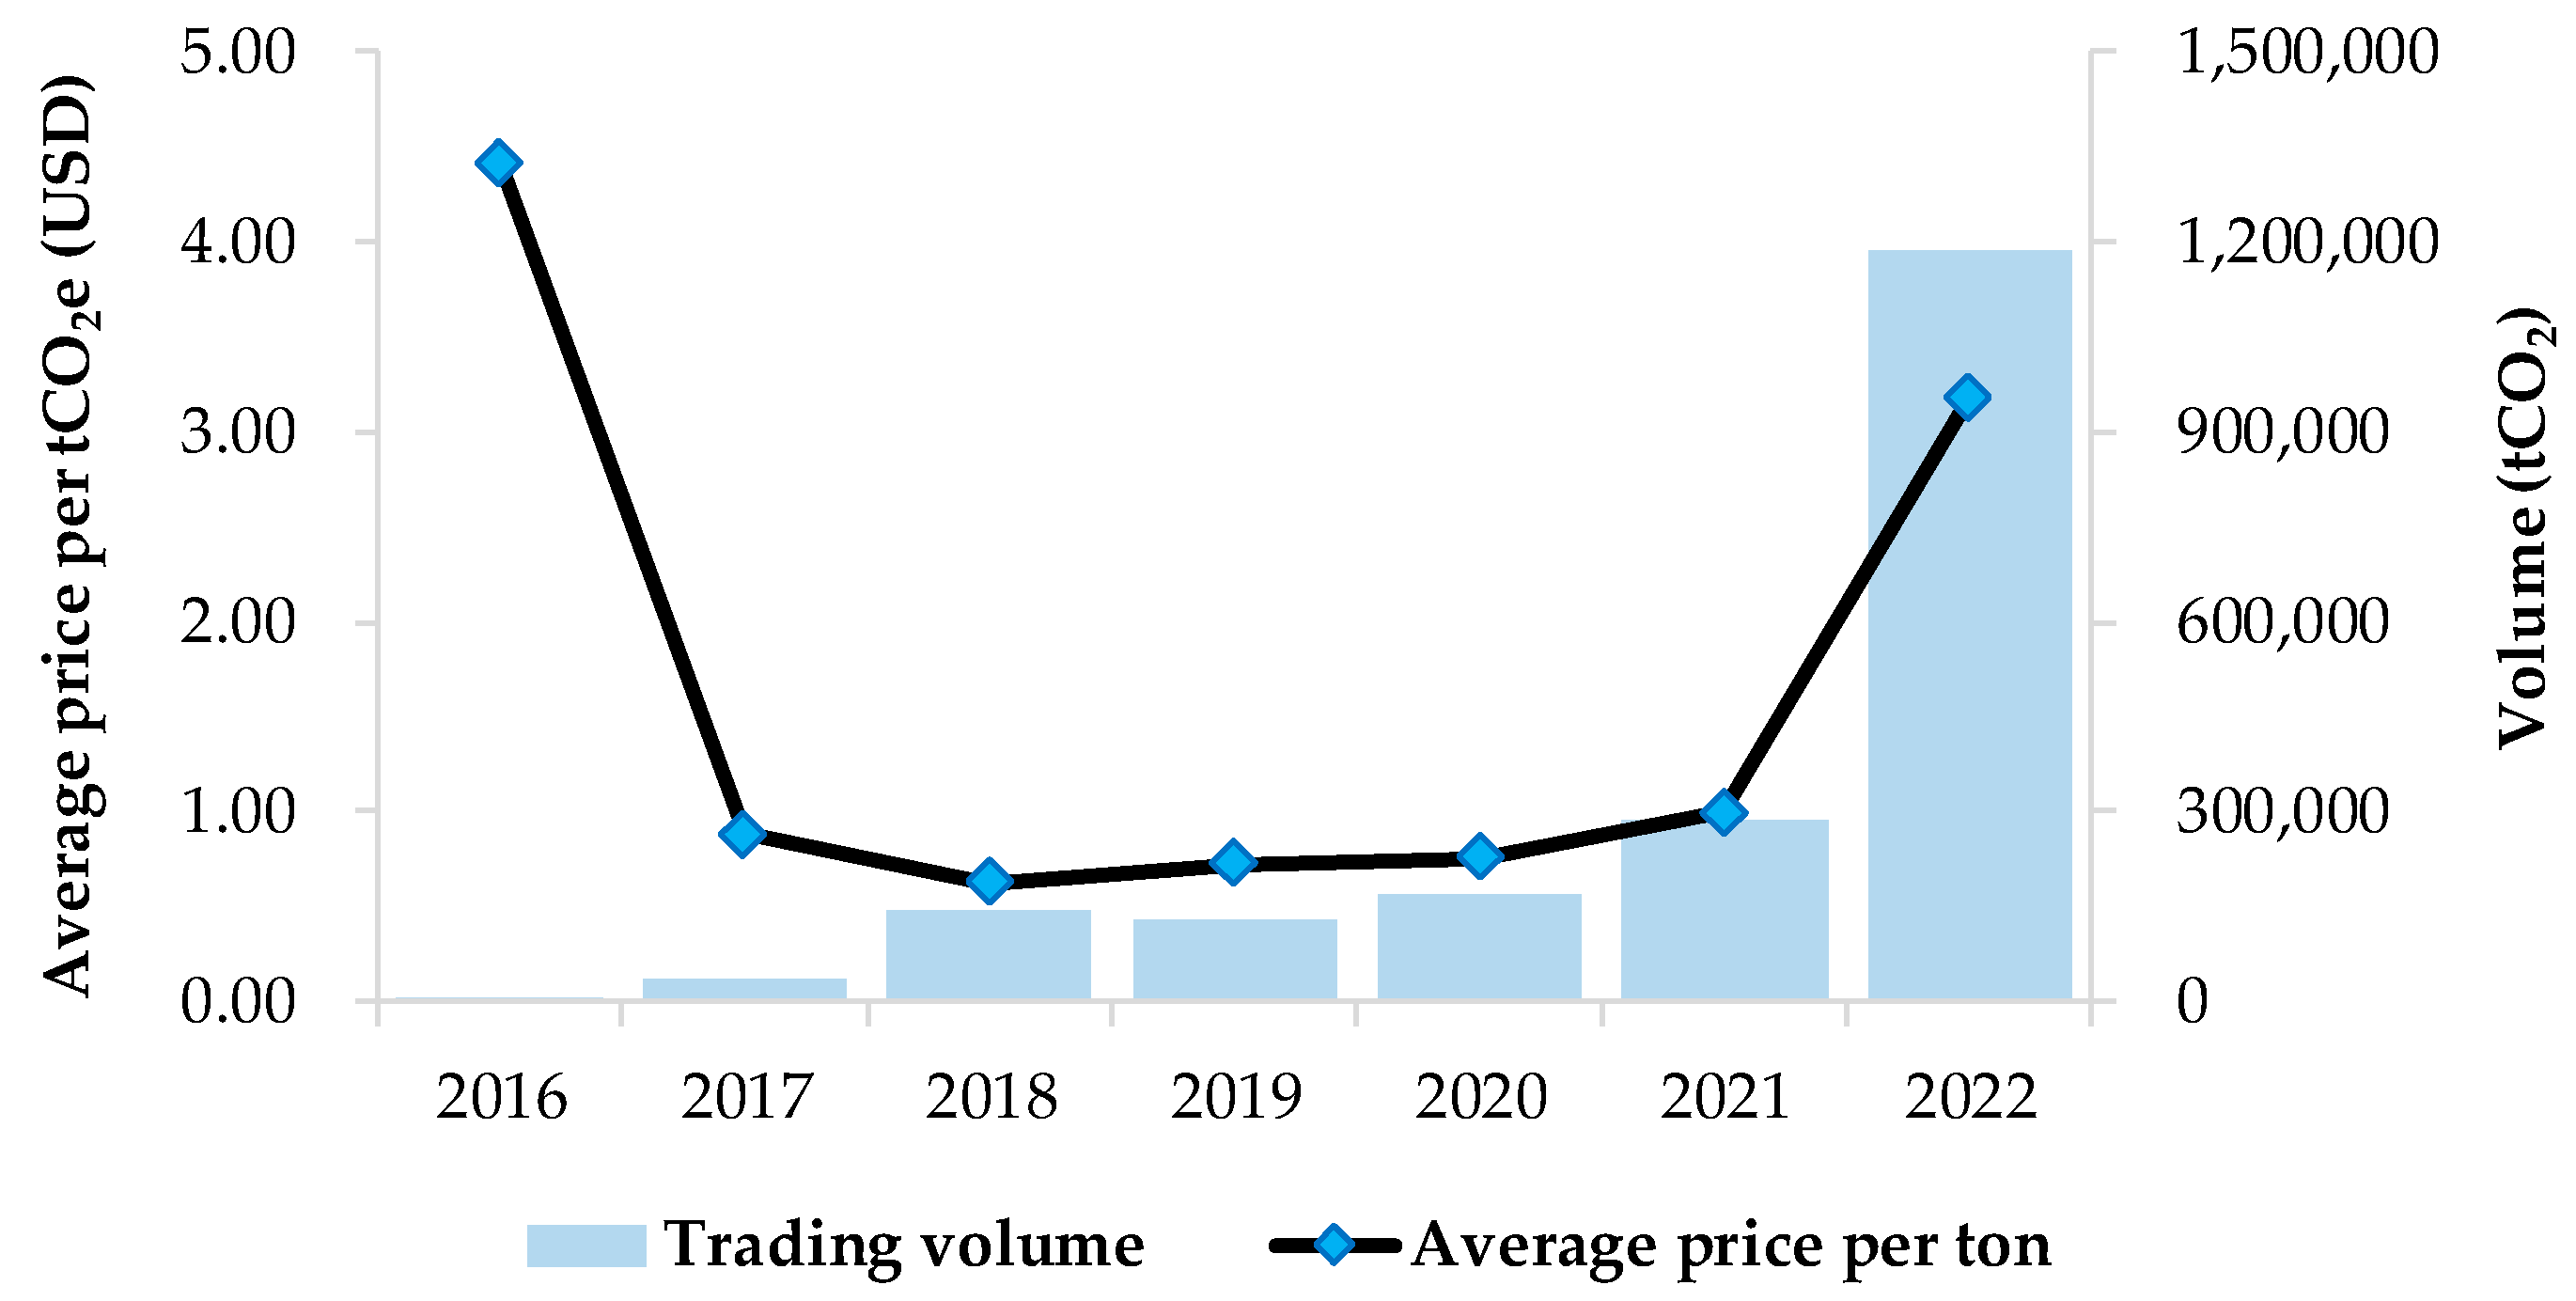
3.2.2. Carbon Credit Scenario (CC: S3)

The average price of carbon credits in Thailand from 2016 to 2022 [38] exhibited an upward trend. Nevertheless, the average price in 2022 remains fairly affordable, as shown in Figure 8. Hence, the study employs a carbon pricing mechanism with three distinct price levels: (S3.1) $5/tCO2, (S3.2) $10/tCO2, and (S3.3) $20/tCO2. These prices serve the purpose of motivating refineries to invest in carbon capture and storage (CCS) technologies, enabling them to sell carbon credits at a premium rate. Even though there are scenarios of a tax incentive and $5–20/tCO2 of carbon credit trading, refineries have approximately 8567–3574 million THB of net virtual cost as shown in detail in the results and discussion.

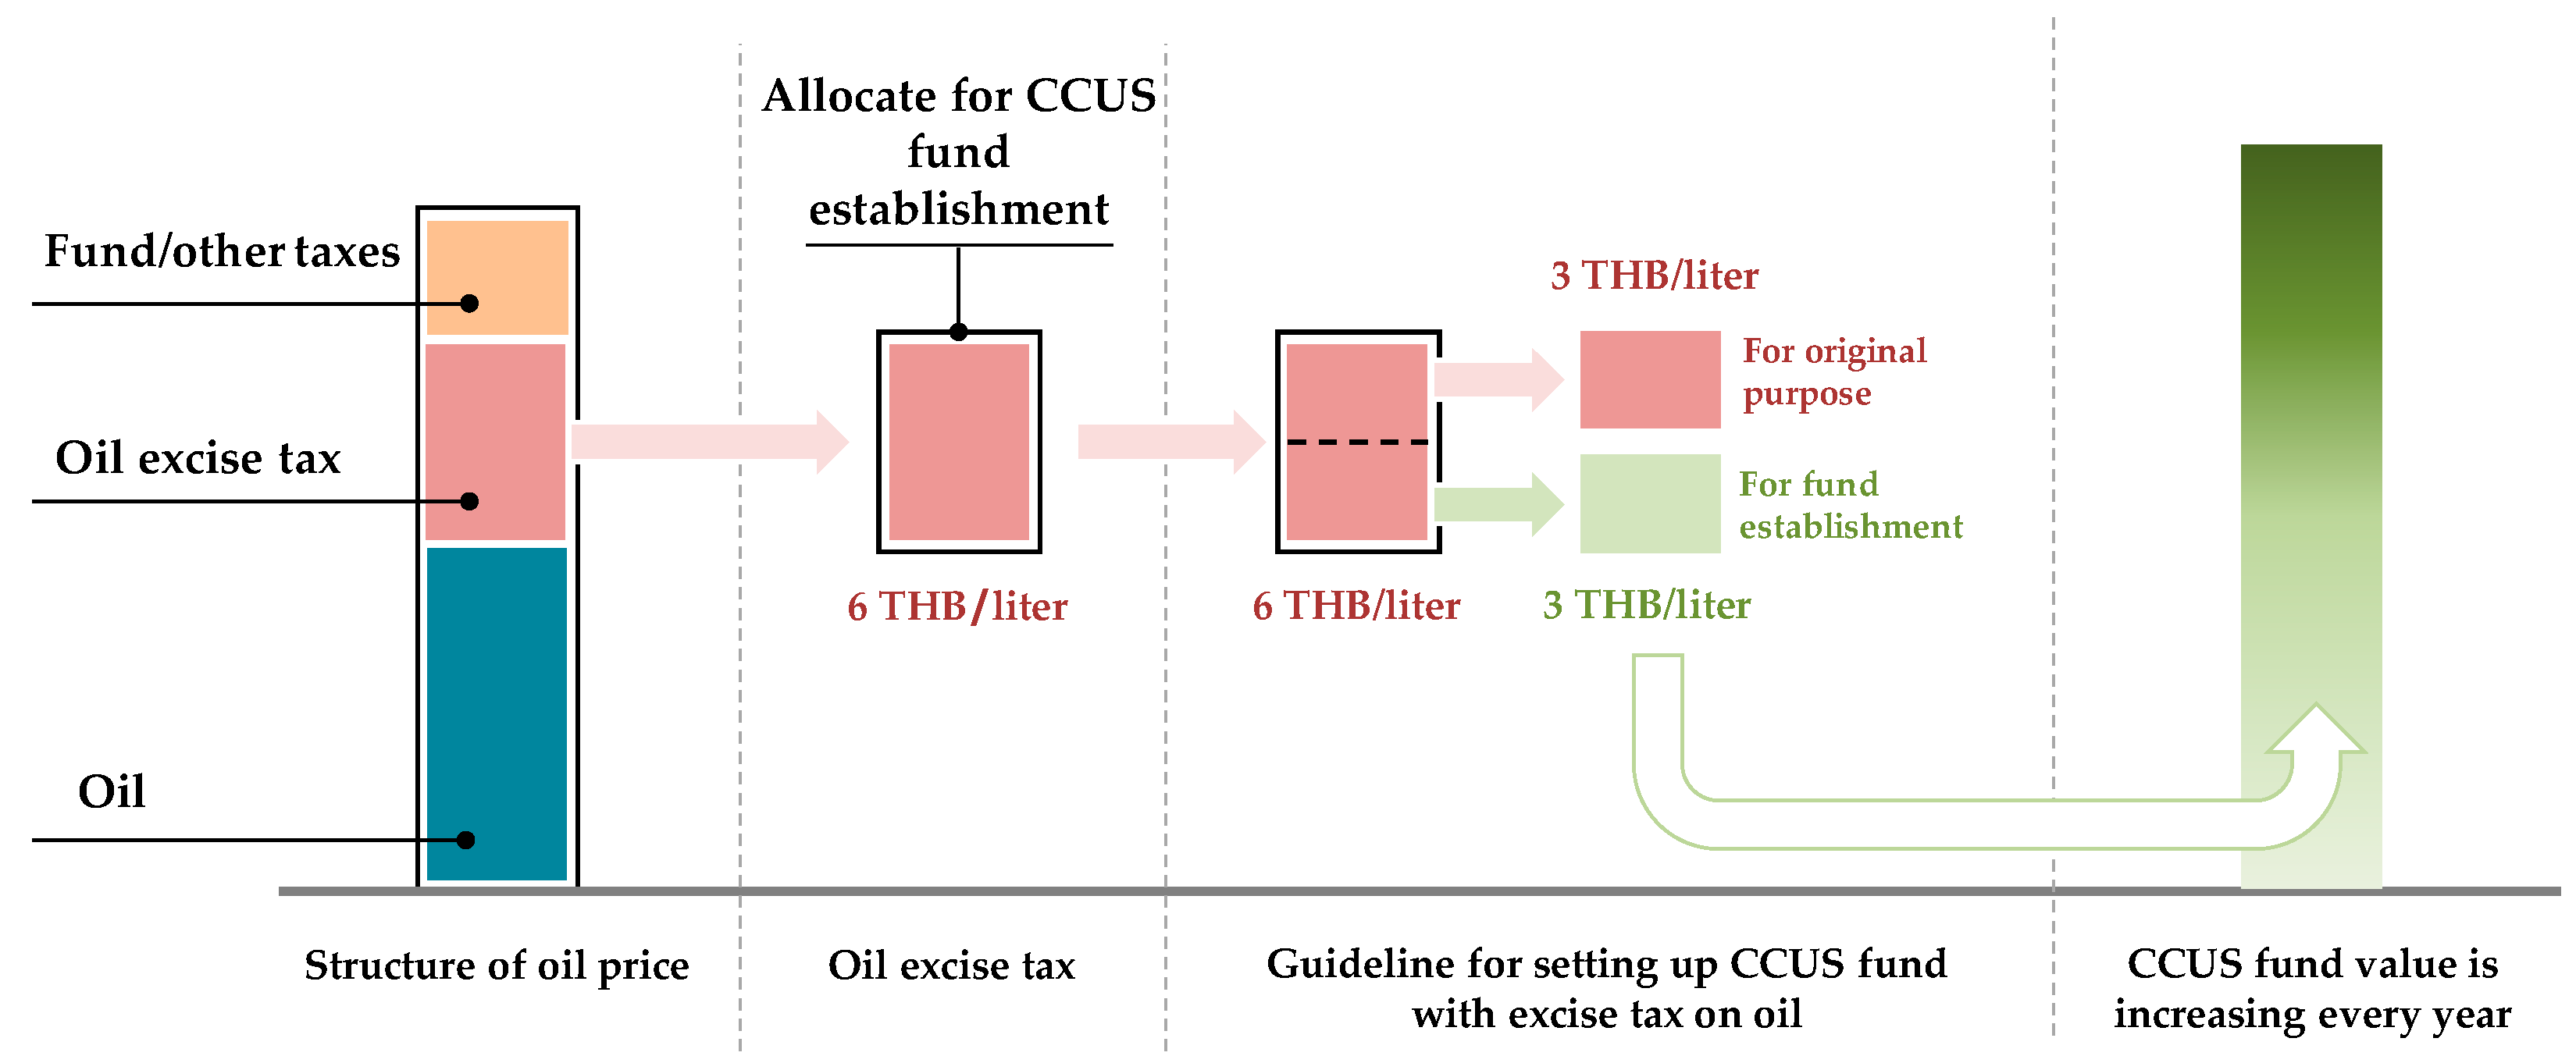
3.2.3. Grant Support (GR: S4)

The concept of investment grants (GR) is applying excise tax mechanisms in fuel trading, especially the excise tax of oil that is normally collected and recycles some revenue to support CCS based on the polluter pays principle (PPP). The concept is that one liter of oil will be taxed approximately 6 THB, the cost deducted for 50%, or accounted as 3 THB, to be transferred to the CCS fund (it may be in the form of a fund or direct budgeting specifically), and the remaining three THB is for the Excise Department to use for the original purpose, to be kept in the Comptroller General’s Department. In this study, the tax deduction ratio is considered based on the amount of virtual investment that the refinery actually pays as data for S1, S2, and S3.1–S3.3, to be a model and guideline for primary support from public sector. The concept of an excise tax on oil to support CCS is shown in Figure 9.
Considering the provided data, and despite the implementation of tax incentives and carbon credit measures ranging from $5 to $20/tCO2, the refinery is anticipated to face net virtual costs ranging from approximately 8567 to 3574 million THB. Therefore, it is crucial for the government to adopt strategies focused on enhancing investment through the provision of grants, referred to as Grants or GR.

3.3. Potential of a Public Investment Model: Transportation, Storage and MMV

Assumptions for a public investment model: transport and storage (T and S) and monitoring and verification (MMV) has been set as follows: (1) A total cost of transportation, storage and MMV is $24.54/tCO2 (used exchange rate: 1 USD = 34 THB), or 8168 million THB; (2) Weighted Average Cost of Capital: WACC is assumed to be 10%, similar to other GHG projects; (3) Return on Investment (ROI) to investor is averaged at 3%; (4) Tariff rate with average ROI of 3% for 10 and 15 years of operation.
Derived from the data on infrastructure investment within the government sector concerning transport, storage, and MMV, as presented in Table 6 and Table 7, the pertinent details can be succinctly encapsulated as follows:
  • In scenarios where the government undertakes management and investment across the entirety of the transport, storage, and MMV sectors, while stipulating a 3% average ROI to be achieved within a 10-year timeframe, a charge amounting to 242 THB/tCO2 becomes imperative.
  • The government sector assumes responsibility for oversight and investment spanning all facets of transportation, storage, and MMV, with an objective of attaining an average ROI of 3% over a 15-year duration, a collection of 211 THB/tCO2 becomes a requisite.
  • The ambit of transportation and storage fees encapsulates the expenses associated with the complete spectrum of operational and subsequent entities that follow the capture phase.

4. Results and Discussion

The petroleum refining industry, as a downstream sector, is a critical component of the oil industry. When considering the application of CCS technology, particularly CO2 capture using amine, with an impressive capture potential of approximately 98%, it is evident that there exists a substantial CO2 mitigation potential of 9.79 MtCO2/y. Different regions exhibit unique characteristics in terms of source–sink matching. Among them, the eastern region stands out with the highest potential, emphasizing an onshore CO2 source to offshore CO2 sink arrangement. The concept of modeling is instrumental in validating the feasibility of achieving effective source–sink matching, which, in turn, contributes to cost-efficiency. To realize this objective, the establishment of a CCS hub, serving as a dedicated CO2 collection station, plays a central role. This CCS hub is meticulously designed and equipped with a primary gas treatment unit, gas separation systems, compression infrastructure, storage tanks, as well as advanced control and management equipment. Its primary function is to efficiently process and condition CO2 to meet the required specifications. Furthermore, it enables the temporary storage of CO2 before it is transported, via pipelines, to designated offshore reservoirs for permanent storage. Even though there are scenarios of tax incentive and carbon credit trading at $5–20/tCO2, refineries have approximately 8567–3574 million THB of net virtual cost. Thus, the government must support an investment grant (Grant or GR) as shown in detail in Table 8 and Table 9 and Figure 10.
Considering the initial investment cost of CCS in the refining industry in Thailand, it is evident that the investment requirement is notably high, approximately 18,307 million baht. In the absence of government assistance measures (S1: Base case/no support), it is anticipated that CCS implementation would be unfeasible if the entirety of this funding burden were to fall on the private sector alone. This scenario presents a significant challenge to achieving the carbon neutrality target by 2050. Hence, the government must carefully evaluate and implement suitable support measures. One such measure is the double tax reduction for refineries interested in pursuing CCS (S2: TI). This initiative would reduce the remaining cost for the refinery to approximately 10,231 million units, which, without such support, might render CCS unattainable due to the limitation of support through a single measure. The government must explore additional support measures, including the continuation of tax incentives. Another measure deserving further consideration and support is the elevation of carbon pricing (S3: CC).
Currently, Thailand’s carbon price stands at less than $5/tCO2. Hence, an alternative strategy to incentivize private sector investment in CCS is by raising the carbon price. Three distinct price points have been analyzed: $5/tCO2 (S3.1), $10/tCO2 (S3.2), and $20/tCO2. These price adjustments would result in respective reductions of the remaining cost to the refinery to approximately 8567, 6902, and 3574 million THB in accordance with the ascending carbon price. As previously mentioned, despite the reduction in the remaining cost price, the refinery still requires government support. Among the suitable measures for providing support to the refinery is the deduction from oil excise tax revenue (S4: GR), which is the final measure under consideration. In light of the earlier scenarios discussed as follows:
  • S4.1: In the event that the government does not implement any assistance measures, it is imperative for the government to allocate a portion of the oil excise tax revenue, approximately 20%, as part of the revenue-sharing mechanism.
  • S4.2: If the government has implemented only one assistance measure, namely a Tax Incentive (S2), the public sector should allocate a minimum of 10% of the oil excise tax revenue for the share deduction under the GR scenario.
  • S4.3: In the scenario where the government has implemented only two additional assistance measures, namely a Tax Incentive (S2) and Carbon Credit at $5/tCO2 (S3.1), the government will decrease the share deduction from the oil excise tax revenue to approximately 9% under the GR scenario.
  • S4.4: In the scenario where the government has implemented only two additional measures, specifically, the Tax Incentive (S2) and Carbon Credit at $10/tCO2 (S3.2), the government sector will decrease the share deduction from oil excise tax revenue to approximately 7% under the GR scenario.
  • S4.5: In the event that the government has implemented only two additional assistance measures, specifically the Tax Incentive (S2) and Carbon Credit at $20/tCO2 (S3.3), the government will decrease the share deduction from the oil excise tax revenue to approximately 4% under the GR scenario.

5. Conclusions

In this study, an investigation was conducted to explore potential business models for CCS in the oil refining industry in Thailand. The research involved evaluating the capture potential, which subsequently informed the selection of an appropriate source-to-sink matching strategy, considering existing geological conditions, associated costs, and model considerations. The implementation of appropriate policies from the outset to attract investments and provide incentives plays a pivotal role in the government’s evaluation of business models, as it facilitates support allocation. Within this study, three key measures have been identified for bolstering financial business models. Beginning with government initiatives that receive relatively limited backing, such as tax incentives and carbon credits, the analysis reveals that grant assistance ultimately emerges as the government policy with the most significant impact. The present investigation resulted in some interesting findings:
  • The estimated potential capture volume is approximately 9.79 MtCO2/y, as determined through the evaluation of the capture potential across all six refineries.
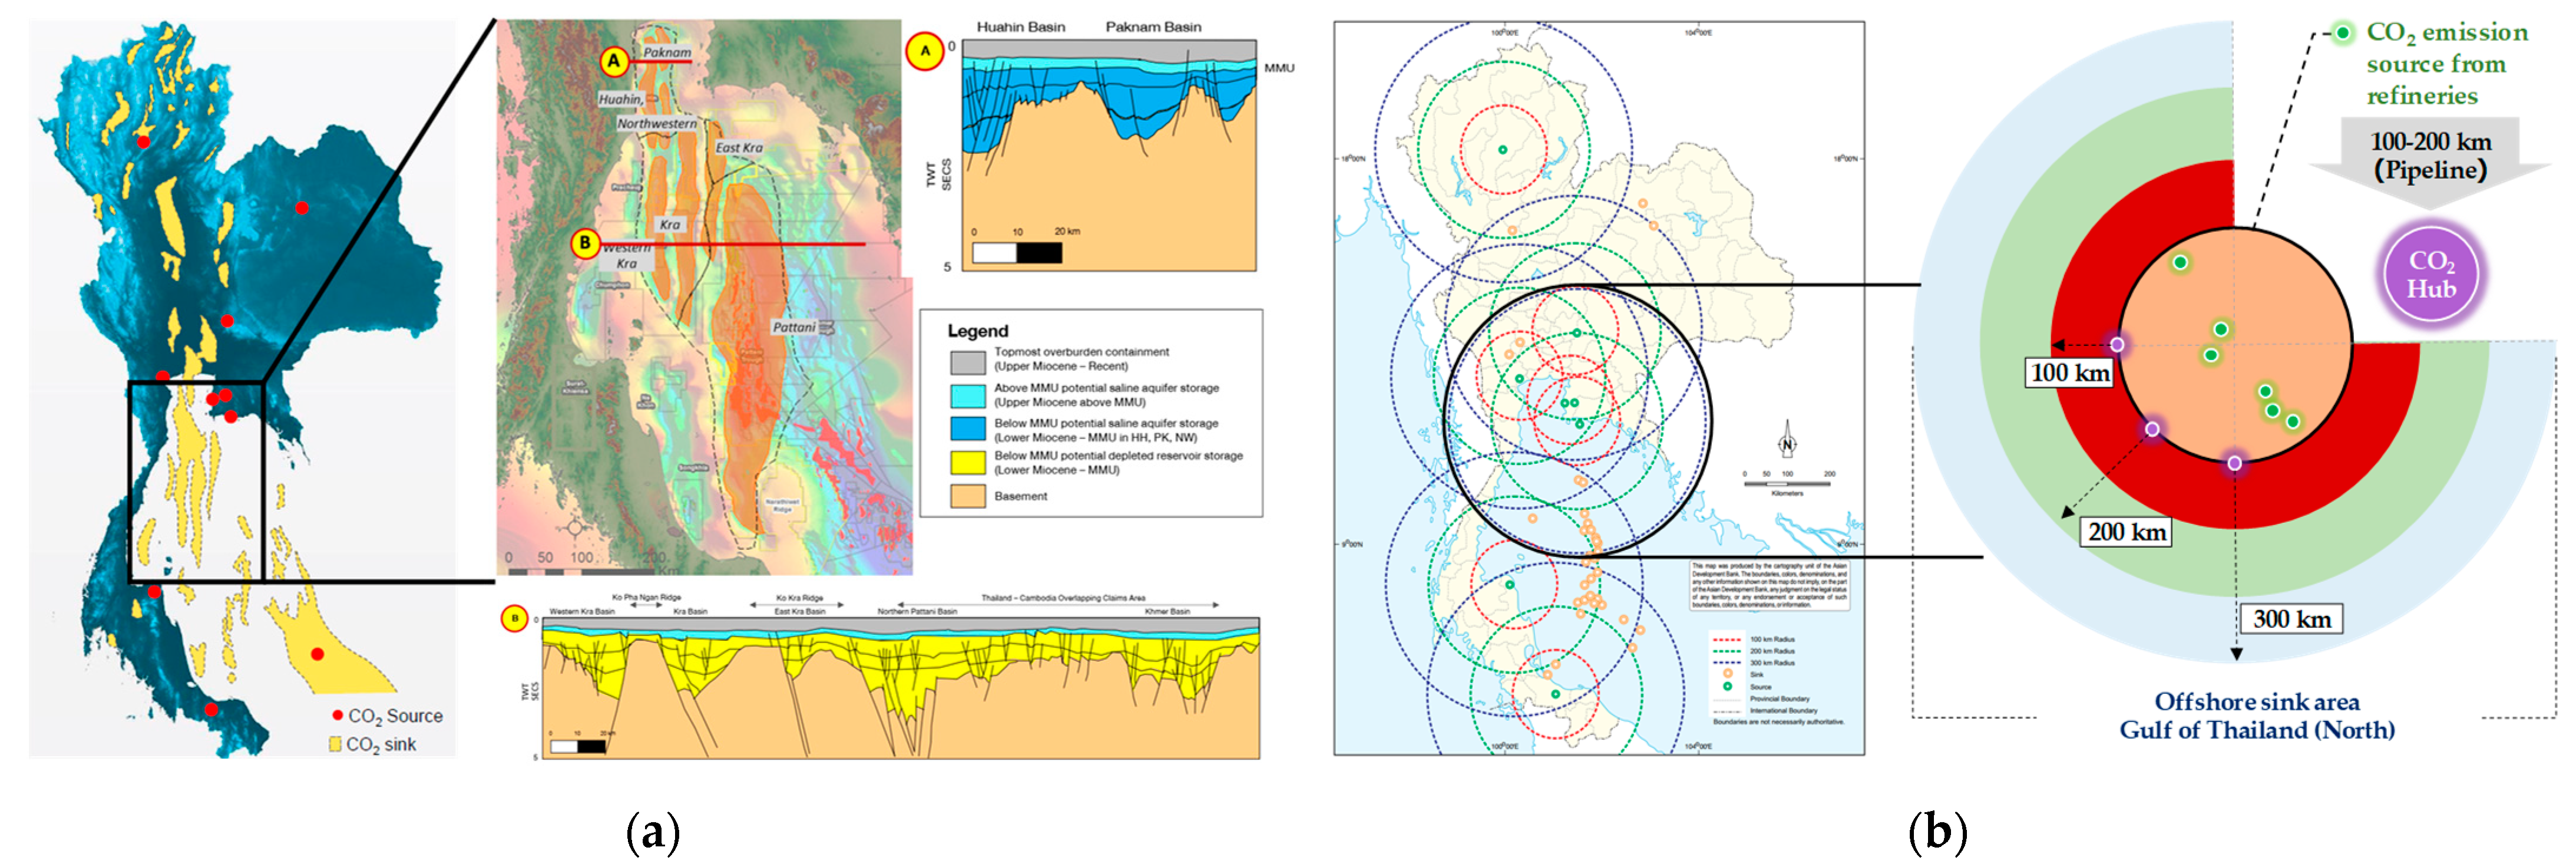
  • The study identified a viable CO2 source within the refining sector and a compatible CO2 sink located in the northern Gulf of Thailand.
  • The government is required to establish a new legal entity tasked with managing and developing investment infrastructure. This entity will generate government revenue by collecting service fees associated with pipeline usage, CO2 storage, and long-term monitoring of CO2 emissions through MMV processes.
  • In the case where the government takes on the responsibility of managing and investing in transportation, storage and MMV processes, and aims for an average ROI of 3% over a 15-year period, the tariff rate would be set at 211 THB/tCO2.
  • Providing crucial support through the allocation of initial funding in the form of grants, would thereby make the adoption of CCS technology within the refinery industry a viable prospect. In instances where specific incentive policies have not been established, the government should consider earmarking a minimum of 20% of the revenue generated from oil excise taxes to facilitate the initial implementation of CCS.
  • In the future, the development of effective CCS policies should encompass measures such as tax incentives and the sale of carbon credits at prices higher than the current rates. This strategic approach would lead to a reduction of 4–10% in the government’s expenditure for funds derived from oil excise taxes, particularly when carbon credits are valued at more than $20/tCO2.
  • Nevertheless, it is imperative for the government sector to actively address this challenge by establishing a dedicated fund, funded through oil excise taxes. This fund serves the critical purpose of creating incentives for entrepreneurs to invest in CCS initiatives, thereby generating revenue essential for fully supporting the development and implementation of the CCS system.

Author Contributions

Conceptualization, W.T., W.W. and J.S.; methodology, W.T., W.W. and J.S.; formal analysis, T.J., S.D., V.R., P.M. and C.R.; investigation, P.S. and G.W.; resources, W.W., J.S. and S.D.; data curation, W.T., W.W., J.S., V.R. and P.S.; writing—original draft preparation, W.T., J.S., P.M. and G.W.; writing—review and editing, W.T., W.W., J.S., T.J. and G.W.; visualization, S.D., V.R., P.M., C.R., P.S. and G.W.; supervision, W.T., W.W., J.S. and G.W.; project administration, W.T. and W.W.; funding acquisition, W.W. All authors have read and agreed to the published version of the manuscript.

Funding

This research was supported by the Thailand Greenhouse Gas Management Organization (TGO) grant no. 6/2566 and NSRF via the Program Management Unit for Human Resources and Institutional Development, Research and Innovation (PMU-B) (grant no B40G660032), Thailand.

Data Availability Statement

The data presented in this study are available on request from the corresponding author.

Conflicts of Interest

The authors declare no conflict of interest.

References

  1. Wongsapai, W.; Ritkrerkkrai, C.; Pongthanaisawan, J. Integrated model for energy and CO2 emissions analysis from Thailand’s long-term low carbon energy efficiency and renewable energy plan. Energy Procedia 2016, 100, 492–495. [Google Scholar] [CrossRef]
  2. Fischedick, M.; Roy, J. Climate Change 2014: Mitigation of Climate Change. Contribution of Working Group III to the Fifth Assessment Report of the Intergovernmental Panel on Climate Change. Intergov. Panel Clim. Change 2014, 1454, 147. [Google Scholar]
  3. Lennan, M.; Morgera, E. The Glasgow Climate Conference (COP26). Int. J. Mar. Coast. Law 2022, 37, 137–151. [Google Scholar] [CrossRef]
  4. Climate Action Tracker (CAT). Thailand—Main Climate Target (2030 Conditional NDC Target). 2022. Available online: https://climateactiontracker.org/countries/thailand/targets/ (accessed on 15 August 2023).
  5. Natural Resources and Environmental Policy and Planning, ONEP. Thailand’s Long-Term Low Emission Development Strategy (Revised). 2022. Available online: https://unfccc.int/sites/default/files/resource/ThailandLT-LEDS%28RevisedVersion%29_08Nov2022.pdf (accessed on 15 August 2023).
  6. The UNFCCC Secretariat (UN Climate Change). Thailand. Biennial Update Report (BUR4). 2022. Available online: https://unfccc.int/documents/624750 (accessed on 15 August 2023).
  7. Quang, D.V.; Milani, D.; Zahra, M.A. A review of potential routes to zero and negative emission technologies via the integration of renewable energies with CO2 capture processes. Int. J. Greenh. Gas Control. 2023, 124, 103862. [Google Scholar] [CrossRef]
  8. Gerbelová, H.; Versteeg, P.; Ioakimidis, C.S.; Ferrão, P. The effect of retrofitting Portuguese fossil fuel power plants with CCS. Appl. Energy 2013, 101, 280–287. [Google Scholar] [CrossRef]
  9. Tramme, E. Carbon Removal with CCS Technologies; Global CCS Institute: Melbourne, Australia, 2021. [Google Scholar]
  10. Global CCS Institute. Fact Sheet: Capturing CO2. Available online: https://www.globalccsinstitute.com/wp-content/uploads/2018/12/Global-CCS-Institute-Fact-Sheet_Capturing-CO2.pdf (accessed on 15 August 2023).
  11. The London School of Economics and Political Science (LSE). What is Carbon Capture, Usage and Storage (CCUS) and What Role Can It Play in Tackling Climate Change? 2023. Available online: https://www.lse.ac.uk/granthaminstitute/explainers/what-is-carbon-capture-and-storage-and-what-role-can-it-play-in-tackling-climate-change/ (accessed on 15 August 2023).
  12. Ahlstrom, J.M.; Walter, V.; Goransson, L.; Papadokonstantakis, S. The role of biomass gasification in the future flexible power system—BECCS or CCU? Renew. Energy 2022, 190, 596–605. [Google Scholar] [CrossRef]
  13. International Energy Agency (IEA). Energy Technology Perspectives 2020: Special Report on Carbon Capture Utilisation and Storage CCUS in Clean Energy Transitions; IEA: Paris, France, 2020. [Google Scholar]
  14. Thepsaskul, W.; Wongsapai, W.; Jaitieng, T.; Daroon, S.; Raksakulkarn, V.; Muangjai, P.; Ritkrerkkrai, C. Gap Analysis and Key Enabling Factors for Carbon Capture Utilization and Storage development in Thailand Oil and Gas Industry to Achieve Carbon Neutrality Target. Chem. Eng. Trans. 2023, 106. in proof. [Google Scholar]
  15. Tianyang, L.; Guan, D.; Shan, Y.; Zheng, B.; Liang, X.; Meng, J.; Qiang, Z.; Tao, S. Adaptive CO2 emissions mitigation strategies of global oil refineries in all age groups. One Earth 2021, 4, 1114–1126. [Google Scholar]
  16. Abella, J.P.; Bergerson, J.A. Model to investigate energy and greenhouse gas emissions implications of refining petroleum: Impacts of crude quality and refinery configuration. Environ. Sci. Technol. 2012, 46, 13037–13047. [Google Scholar] [CrossRef]
  17. Jing, L.; El-Houjeiri, H.M.; Monfort, J.C.; Brandt, A.R.; Masnadi, M.S.; Gordon, D.; Bergerson, J.A. Carbon intensity of global crude oil refining and mitigation potential. Nat. Clim. Change 2020, 10, 526–532. [Google Scholar] [CrossRef]
  18. International Energy Agency (IEA). World Energy Outlook; IEA: Paris, France, 2018. [Google Scholar]
  19. Leeson, D.; Mac Dowell, N.; Shah, N.; Petit, C.; Fennell, P.S. A Techno-economic analysis and systematic review of carbon capture and storage (CCS) applied to the iron and steel, cement, oil refining and pulp and paper industries, as well as other high purity sources. Int. J. Greenh. Gas Control. 2017, 61, 71–84. [Google Scholar] [CrossRef]
  20. Shijun, M.; Lei, T.; Meng, J.; Liang, X.; Guan, D. Global oil refining’s contribution to greenhouse gas emissions from 2000 to 2021. Innovation 2023, 4, 100361. [Google Scholar]
  21. Energy Policy and Planning Office (EPPO). Historical Statistics of Crude Oil, Natural Gas, and Oil Refining 1986–2022. Available online: https://www.eppo.go.th/index.php/th/energy-information/static-energy/static-petroleum (accessed on 15 August 2023).
  22. Martin-Roberts, E.; Scott, V.; Flude, S.; Johnson, G.; Haszeldine, R.S.; Gilfillan, S. Carbon capture and storage at the end of a lost decade. One Earth 2021, 4, 1569–1584. [Google Scholar] [CrossRef]
  23. Hong, W.Y. A techno-economic review on carbon capture, utilisation and storage systems for achieving a net-zero CO2 emissions future. Carbon Capture Sci. Technol. 2022, 3, 100044. [Google Scholar] [CrossRef]
  24. Wang, X.; Song, C. Carbon capture from flue gas and the atmosphere: A perspective. Front. Energy Res. 2020, 8, 560849. [Google Scholar] [CrossRef]
  25. Leung, D.Y.C.; Caramanna, G.; Maroto-Valer, M.M. A overview of current status of carbon dioxide capture and storage technologies. Renew. Sustain. Energy Rev. 2014, 39, 426–443. [Google Scholar] [CrossRef]
  26. Lee, Y.; Kim, J.; Kim, H.; Park, T.; Jin, H.; Kim, H.; Park, S.; Lee, K.S. Operation of a Pilot-Scale CO2 Capture Process with a New Energy-Efficient Polyamine Solvent. Appl. Sci. 2020, 10, 7669. [Google Scholar] [CrossRef]
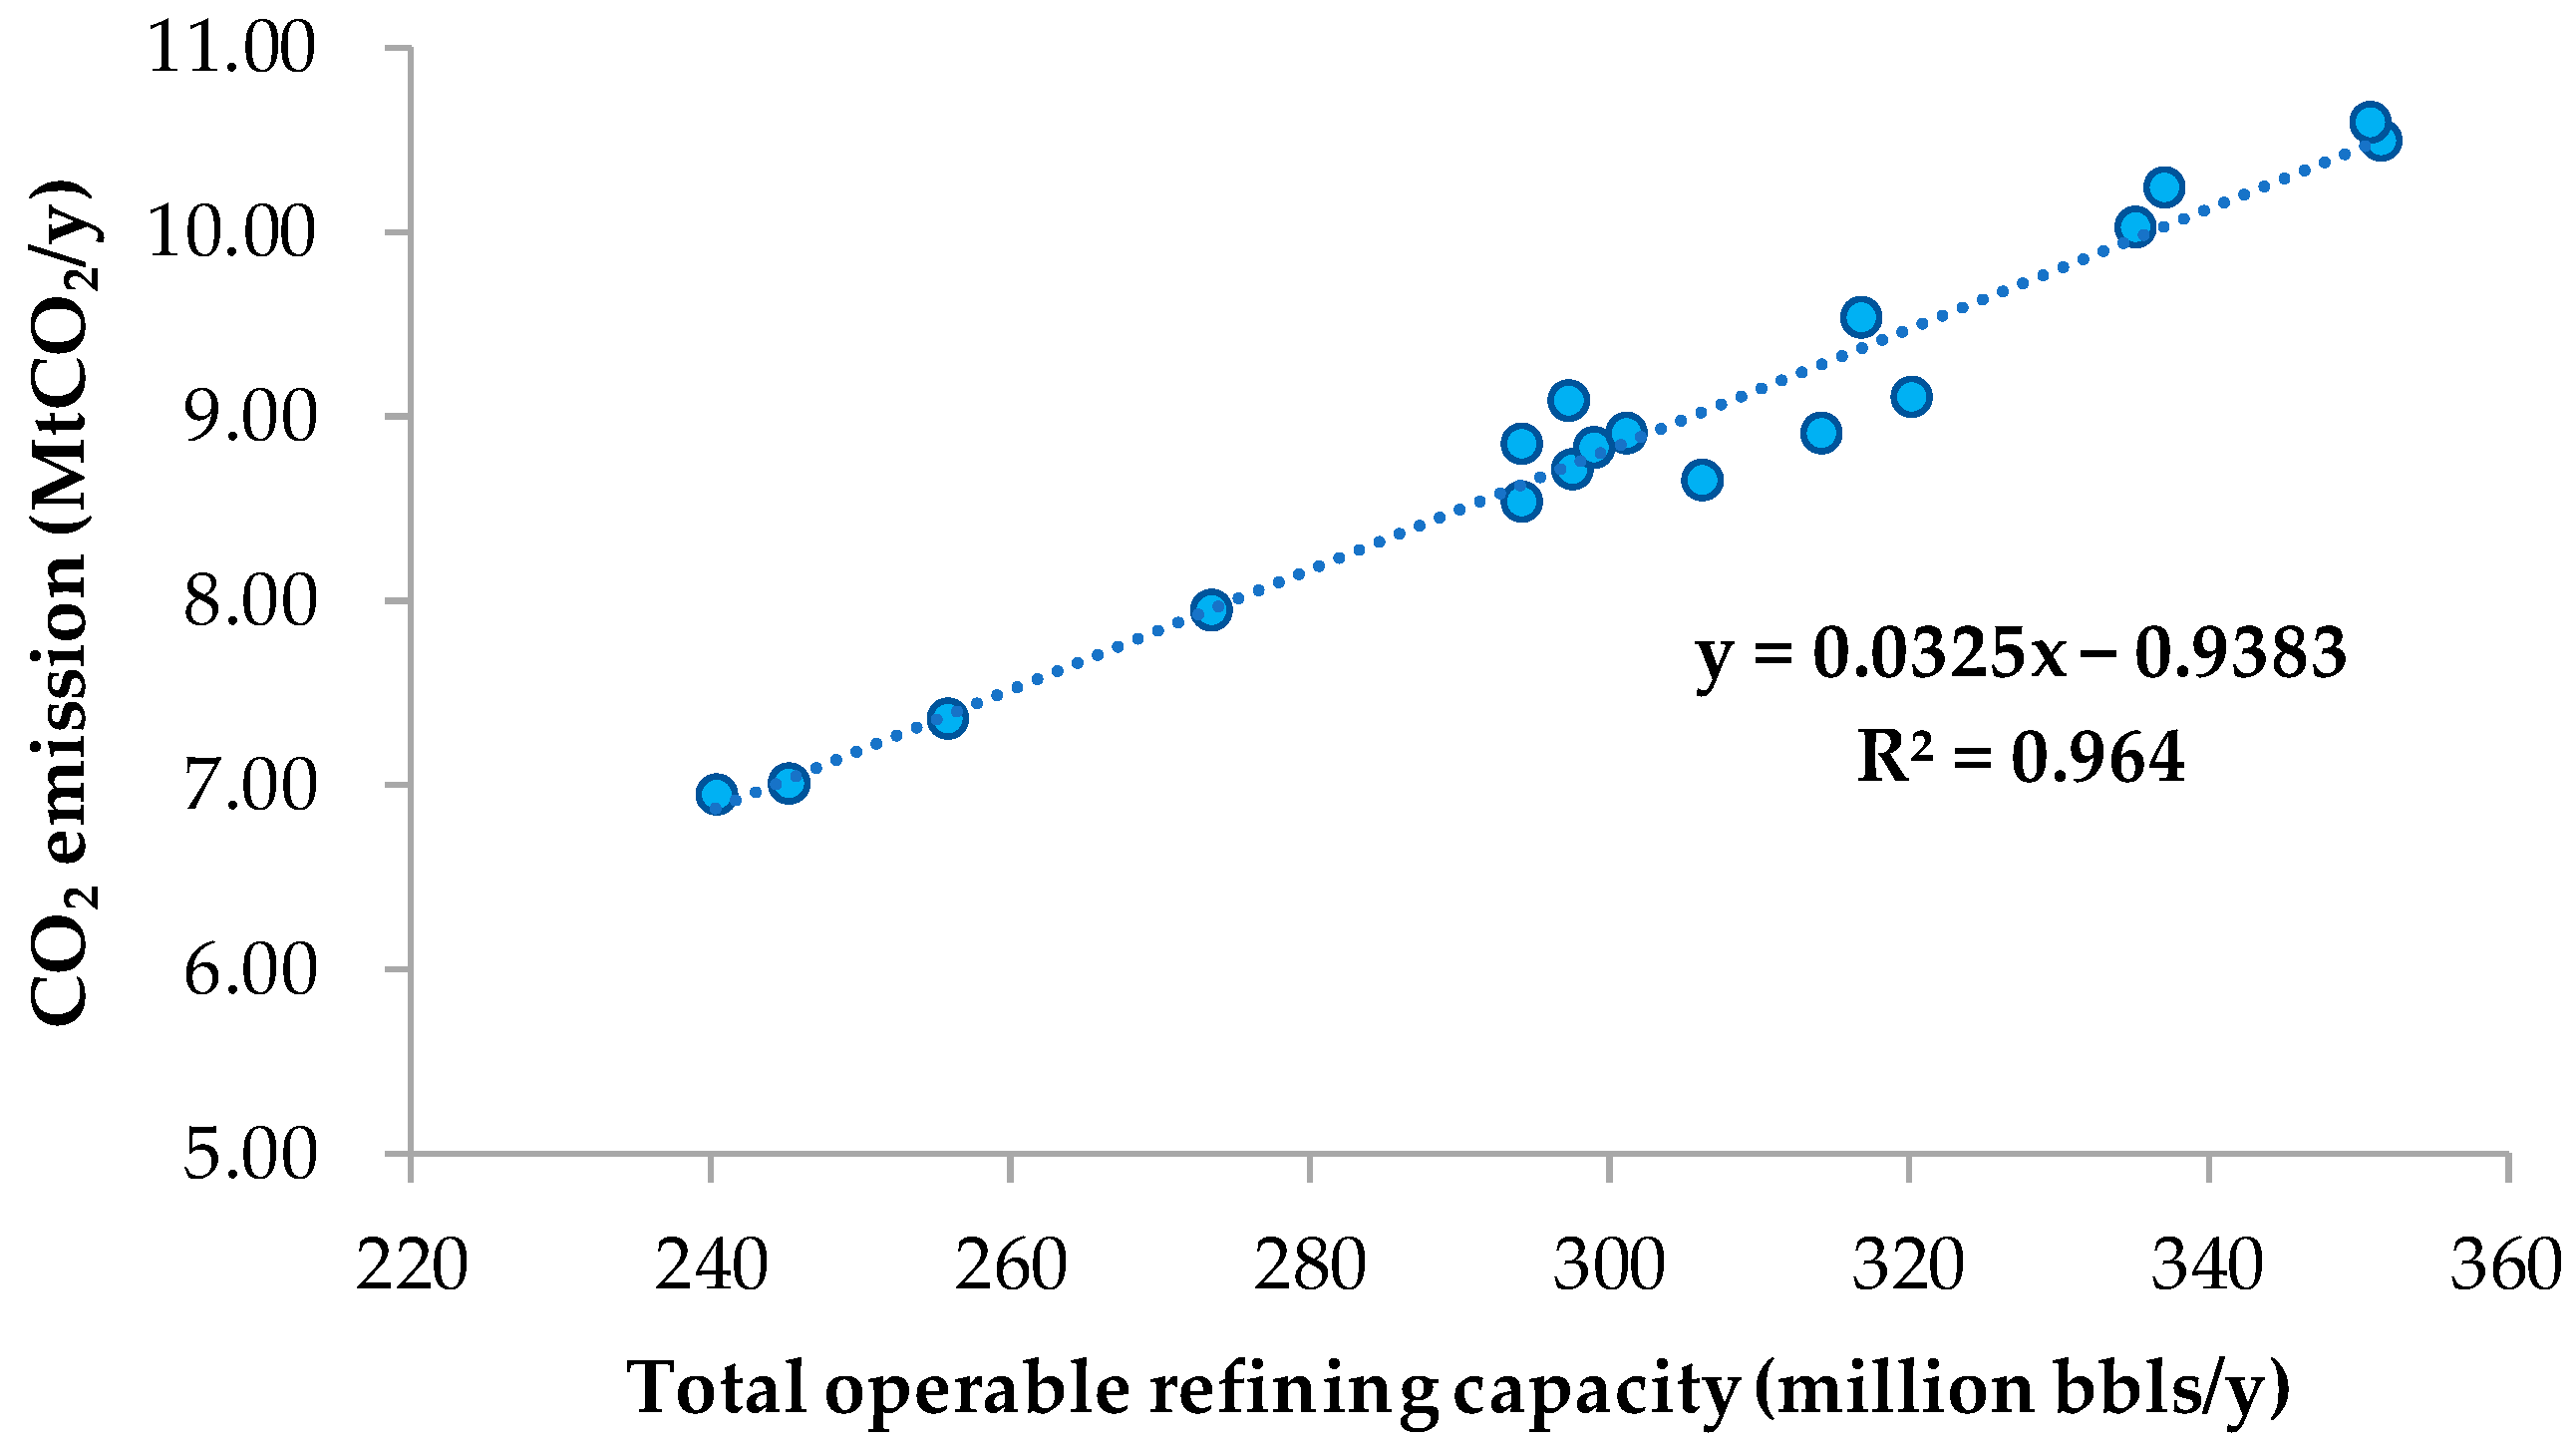
  27. Madugula, A.C.S.; Sachde, D.; Hovorka, S.D.; Meckel, T.A. Estimation of CO₂ emissions from petroleum refineries based on the total operable capacity for carbon capture applications. Chem. Eng. J. Adv. 2021, 8, 100162. [Google Scholar] [CrossRef]
  28. Oil and Gas Climate Initiative (OGCI). CO2 Storage Resource Catalogue Cycle 3 Report. 2022. Available online: https://www.ogci.com/wp-content/uploads/2023/04/CSRC_Cycle_3_Main_Report_Final.pdf (accessed on 30 August 2023).
  29. Global CCS Institute (GCCSI). Global Status of CCS. 2022. Available online: https://www.globalccsinstitute.com/resources/global-status-report/download/ (accessed on 30 August 2023).
  30. Asian Development Bank (ADB). Prospects for Carbon Capture and Storage in Southeast Asia. 2013. Available online: https://www.adb.org/sites/default/files/publication/31122/carbon-capture-storage-southeast-asia.pdf (accessed on 30 August 2023).
  31. Choomkong, A.; Sirikunpitak, S.; Darnsawasdi, R.; Yordkayhun, S. A study of CO2 emissions sources and sinks in Thailand. Energy Procedia 2017, 138, 452–457. [Google Scholar] [CrossRef]
  32. PTT Exploration and Production Public Company Limited. Available online: https://www.thailand-energy-academy.org/assets/upload/coursedocument/file/E205%20EP%20The%20National%20Energy%20Security%20and%20the%20Ways%20Forward.pdf (accessed on 30 August 2023).
  33. Kheirinik, M.; Ahmed, S.; Rahmanian, N. Comparative techno-economic analysis of carbon capture processes: Pre-combustion, post-combustion, and oxy-fuel combustion operations. Sustainability 2021, 13, 13567. [Google Scholar] [CrossRef]
  34. Energy Transitions Commission (ETC). Carbon Capture, Utilisation & Storage in the Energy Transition: Vital but Limited. Available online: https://www.energy-transitions.org/wp-content/uploads/2022/08/ETC-CCUS-Report-V1.9.pdf (accessed on 30 August 2023).
  35. Budinis, S.; Krevor, S.; Dowell, N.M.; Brandon, N.; Hawkes, A. An assessment of CCS costs, barriers, and potential. Energy Strategy Rev. 2018, 22, 61–81. [Google Scholar] [CrossRef]
  36. Zero Emissions Platform (ZEP). The Costs of CO2 Capture, Transport and Storage: Post-Demonstration CCS in EU. 2011. Available online: https://zeroemissionsplatform.eu/document/the-costs-of-co2-capture-transport-and-storage/ (accessed on 30 August 2023).
  37. Smith, E.; Morris, J.; Kheshgi, H.; Teletzke, G.; Herzog, H. The cost of CO2 transport and storage in global integrated assessment modeling. Int. J. Greenh. Gas Control. 2021, 109, 103367. [Google Scholar] [CrossRef]
  38. Thailand Greenhouse Gas Management Organization (TGO). Carbon Credit Price, Volume and Turnover of Carbon Credits from the T-VER Project. 2023. Available online: http://carbonmarket.tgo.or.th/#vmenu_1 (accessed on 30 August 2023).
Figure 1. The role of CCUS in Thailand’s roadmap (Modified from Thailand LT-LEDS).
Energies 16 06955 g001
Figure 2. The proportion and amount of CO2 emissions in Thailand in 2019.
Energies 16 06955 g002
Figure 3. Oil refining volume in Thailand, 1986–2022.
Energies 16 06955 g003
Figure 4. Linear regression equation for the period spanning from 2000 to 2017.
Energies 16 06955 g004
Figure 5. Source–sink matching for refining sector: (a) Offshore sink area in the gulf of Thailand [32]; (b) Optimal distance of petroleum refinery emissions and CO2 reservoir locations.
Energies 16 06955 g005
Figure 6. Cost estimation for CCS technology investment at various scales.
Energies 16 06955 g006
Figure 7. Measures to support business models suitable in the context of Thailand.
Energies 16 06955 g007
Figure 8. Trends in the average price and volume of carbon pricing in Thailand (2016–2022).
Energies 16 06955 g008
Figure 9. The concept of an excise tax on oil to support CCUS.
Energies 16 06955 g009
Figure 10. Potential of business models: (a) Base case (S1), Tax incentive (S2) and Carbon credit scenarios (S3.1–3.3); (b) Share of deduction from oil excise tax revenue to support S1, S2 and S3.1–3.3.
Energies 16 06955 g010
Table 1. Evaluation of carbon capture potential from six oil refinery plants in 2022.
Oil
Refinery Plant
Crude Oil Refining Volume
in 2022
GHG Emission *CO2 Capture
Efficiency by Amine
Capture Potential with Capture Technology by Amine Technic
Barrel/DayBarrel/YeartCO2/Year%MtCO2/Year
Refinery1 (R1)287,41494,846,6202,815,048982.76
Refinery2 (R2)175,29857,848,3401,716,939981.68
Refinery3 (R3)152,72350,398,5901,495,830981.47
Refinery4 (R4)152,37250,282,7601,492,392981.46
Refinery5 (R5)132,77243,814,7601,300,422981.27
Refinery6 (R6)119,84839,549,8401,173,839981.15
Total (R1 to R6)1,020,427336,740,9109,994,470 9.79
* Utilizes the CO2 emission value determined through linear regression analysis in 2022, which is calculated to be 29.68 kgCO2/barrel.
Table 2. Cost of CO2 capture [34,35].
CO2 Capture of Refining SectorLowHighMean
CO2 Capture Range of refining($/tCO2)55165110
Post (amine-based) combustion638775
Pre-combustion4711380
Oxyfuel-combustion489973.5
Table 3. Transportation costs at 1, 2.5 and 10 MtCO2/y [36].
Transportation Distance (km) 100180200300500
For 1 to2.5 MtCO2/y ($/tCO2)
Onshore pipeline3.275.896.54 *9.81Not applicable
Offshore pipeline5.6310.1410.89 *14.6722.24
Ship4.978.949.039.4710.36
Liquefaction (for ship transport)5.785.785.785.785.78
Ship (include liquefaction)10.7414.7214.8015.2516.13
For 10 MtCO2/y ($/tCO2)
Onshore pipeline2.264.074.506.69Not applicable
Offshore pipeline4.107.387.8910.4315.51
Ship (include liquefaction)9.0213.5913.6814.0914.92
* Transportation cost for 1 and 2.5 Mt/y evaluated with the same cost.
Table 4. Transportation costs 1, 2.5, and 10 MtCO2/y [37].
Storage and MMV (Mt/y)122.53.261015
Storage($/tCO2)16.4712.6210.708.006.736.516.24
MMV11.679.618.587.145.955.645.25
Table 5. Analysis of tax incentive scenarios.
DetailsRefineriesTotalUnit
R1R2 1R3 1R4R5R6
No.A. Base case: no CCS implementation
(1)Profit (including income tax)Ref. 242,02416,88452,778959411,82928,004161,114million
THB
(2)Income taxRef. 289182351722823772,32012,85236,046
(3)Proportion of income tax payment(2)/(1)21.2213.9313.7024.7719.6145.89 %
B. CCS implementation through tax incentive scenario
(4)GHG reduction potentialEst. 32.761.681.471.461.271.159.79MtCO2/y
(5)Share of GHG reduction potential% of (4)28.1917.1615.0214.9112.9711.75100%
(6)Initial investment (5) × 18,30751613142274927302375215118,307million
THB
(7)Total of tax deduction ratio (2 times)(6) × 210,3226283549854604750430136,615
(8)Before tax deduction(1)–(7)31,70210,60147,2814134707923,703124,500
(9)Tax payment
(in case of CCS implementation)
(8) × (3)6727147664751024138810,87827,969
(10)Tax margin (2)–(9)2190875753135393219748076
(11)Net virtual cost(6)–(10)2971226719961378144317710,231
1 Data of Refineries 2 and 3 in 2021 (since the data of 2022 is negative), 2 Ref. refers to information based on the annual financial report of each refinery. 3 Est. refers to evaluation result of CO2 capture potential of each refinery.
Table 6. Governmental infrastructure investment model: T and S and MMV for 10 years.
Year012345678910
Capex8168
O and M 10% 817817817817817817817817817817
MMV cost 5% 408408408408408408408408408408
WACC through 10 years 82828282828282828282
ROI 3% 245245245245245245245245245245
Cumulative expense8168972011,27212,82414,37615,92817,48019,03120,58322,13523,687
T and S fee: 10 Years 242 THB/tCO2
Table 7. Governmental infrastructure investment model: T and S and MMV for 15 years.
Year0123456789101112131415
Capex8168
O and M 10% 817817817817817817817817817817817817817817817
MMV cost 5% 408408408408408408408408408408408408408408408
WACC through 15 years 545454545454545454545454545454
ROI 3% 245245245245245245245245245245245245245245245
Cumulative
expense
8168969311,21712,74214,26715,79117,31618,84120,36621,89023,41524,94026,46427,98929,51431,038
T and S fee: 15 Years211 THB/tCO2
Table 8. A proportion of public subsidization of the deduction from excise tax revenue on petroleum products.
Share of Excise Tax on Oil (% Deduction)4%7%9%12%20%Unit
Subsidy per literGasoline0.230.410.530.701.17THB/liter
Diesel0.050.090.120.160.27
Subsidy per liter (gasoline + diesel)0.290.500.650.861.44
Subsidy per yearGasoline264846335957794313,239Million THB/year
Diesel14672568330144027337
Subsidy per year (gasoline + diesel)41157201925912,34520,575
Table 9. Analysis of the overall business model for the oil refining industry with 9.79 MtCO2/y.
CO2 Capture Initial
Investment
TI
(Tax Incentive)
CC
(Carbon Credit)
Remaining
Investment
GR: Deduction from
Oil Excise Tax Revenue
Capture Cost $55/tCO2(Million THB)(%)
S1: Base case (no measure)18,307Not applicable18,307S4.1: 20
S2: Tax Incentive18,3078076Not applicable10,231S4.2: 10
S3.1 Carbon Credit $5/tCO218,307807616648567S4.3: 9
S3.2 Carbon Credit $10/tCO218,307807633296902S4.4: 7
S3.3 Carbon Credit $20/tCO218,307807666573574S4.5: 4
Disclaimer/Publisher’s Note: The statements, opinions and data contained in all publications are solely those of the individual author(s) and contributor(s) and not of MDPI and/or the editor(s). MDPI and/or the editor(s) disclaim responsibility for any injury to people or property resulting from any ideas, methods, instructions or products referred to in the content.

