Abstract
In this study, a controller method for window opening was developed to naturally ventilate a classroom with 30 occupants. The aim was to improve indoor environment quality and limit the probability of COVID infection risk simultaneously. The study was based on a building performance simulation using combined EnergyPlus, CONTAM, and Python programs. Seven cases with automatically opening windows were considered. Opening window parameters were optimized by genetic algorithms. It was shown that the optimized controller with indoor environment functions improved classroom ventilation and considerably decreased CO2 concentration compared to a reference case where the windows were opened only during breaks, and the controller also improved occupants’ thermal comfort. However, there was a noticeable increase in energy demand, caused by the increased air change rate. Introducing the probability of infection risk function to the controller did not reduce the transmission risk substantially, and the probability of infection transmission was high for 80% of the classroom occupancy time. The risk of infection changed only when additional actions were taken, such as introducing face masks, indoor air cleaners, or reducing the number of students present in the classroom. In these cases, it was possible to prevent the infection transmission for more than 90% of the lecture time (R0 < 1).
1. Introduction
Substantial research efforts have been made in recent decades to amend indoor air quality (IAQ) and thermal comfort to prepare healthful indoor environments for residents []. Based on the previous research findings, several standards determine thermal conditions and set adequate outdoor air supply rates to fulfill the hygienic requirements for acceptable air quality. Different indoor environment quality categories have been introduced in the standards based on the expectations of the residents [,]. The medium category is defined as the normal condition, and the high level of expectations is considered for special groups such as children and the elderly. After the advent of COVID-19 caused by the SARS-CoV-2 virus, keeping the building environment comfortable (by recommended standards) and healthy simultaneously has become challenging. Despite the availability of pharmaceutical treatments and vaccinations, debarment from virus transmission is the main way to cope with this issue []. It has been confirmed that COVID-19 is spread in the world through exhalation of infected persons and breathing in susceptible individuals. Consequently, viral transmission via aerosols that remain infective in the air has been considered [,]. Aerosols from exhalation can be distributed in different ways such as ordinary exhalation, talking, sneezing, coughing, or evaporation of respiratory droplets (microscopic aerosols). Accordingly, a susceptible individual has an infection risk if aerosols possess an adequate virus amount [,]. Facemasks can be used to protect healthy people from preventing virus transmission [,]. However, wearing masks for many hours may frequently cause the breathing of air of poor quality []. The supply air change rate is a parameter to control viral concentration in the air inhaled by susceptible individuals, and it can diminish viral concentration in spaces with high occupancy density. Ventilation systems remove exhaled virus-laden air by lowering the overall indoor viral concentration. However, mechanical ventilation systems with a controlled air supply rate are not available in some relatively cold climates []. Hence, natural ventilation is considered as an energy-efficient and available resource to decrease infection probability via air subscription with susceptible individuals [,,]. The air change rate in buildings with natural ventilation is unstable, often insufficient, and difficult to control []. Therefore, some recommendations of the World Health Organization, such as face masks and air purifiers, should be considered to cover the deficiencies of natural ventilation [].
Continuing to address the importance of adequate ventilation, schools and classrooms are of major concern. Students remain most of their time in classrooms characterized by a high occupant density and often by insufficient air quality [,,]. IAQ in classrooms is a universal subject in which disparate research and projects have been performed worldwide [,]. The principal aim in classrooms should be to maintain the comfort, health, and knowledge acquisition efficiency of students during lectures, which can be obtained by reaching acceptable levels of thermal comfort, air quality, and low infection risk. Students’ activity and clothing thermal insulation do not change widely in classrooms []; thus, thermal comfort depends mainly on thermal parameters set by heating and ventilation systems. Previous studies have indicated that low ventilation rates negatively affect students’ performance and increase absence [,]. A high concentration of the bioeffluent, indicated by CO2 concentration, is the main reason for low perceived air quality in densely occupied places []. The problem is particularly evident in rooms with natural ventilation systems that cannot benefit from a constant air change rate to maintain good IAQ at any time students are present in the classroom. Due to the significant role window opening plays in increasing the air change rate, implementing automatic window control systems has been considered a promising IAQ control strategy []. Various studies have investigated smart windows to improve natural ventilation systems, indoor air quality, or thermal comfort. For example, Stazi et al. [] analyzed the automatic window control system in a classroom by taking into account PMV and PPD comfort indicators and indoor air quality in a Mediterranean climate. Grygierek and Sarna [] compared manually opening windows with automatic ones in a typical Polish single-family house. Research has shown that increasing the air change rate can significantly improve thermal comfort but has a significant effect on heating demand. Sorgato et al. [] assessed the impact of occupant behavior in terms of the ventilation control of opening windows on thermal comfort and energy consumption related to the HVAC system in residential buildings in Brazil. The combined use of HVAC and natural ventilation (opening windows) was implemented using the Energy Management System, which enables advanced control during simulation in EnergyPlus. Psomas et al. [] demonstrated that automated window control systems with integrated ventilation cooling strategies can significantly reduce thermal discomfort and the risk of overheating of dwellings during cooling periods in temperate climates. Tan and Deng [] proposed and evaluated a natural ventilation strategy with optimized window control in a typical Australian residential building. By using flexible degrees of opening of the windows, the proposed strategy showed better performance in terms of maintaining the operative temperature in the room compared to the original open–close control. A large part of the research focuses on the analysis of the use of window opening as a passive building cooling technique, and only a few studies of window control systems considered the occupant health in buildings. Recently, Wang. et al. [] showed that the simultaneous use of smart windows and air cleaners improved thermal comfort and decreased PM2.5 significantly, which created a healthier environment for people. Nevertheless, the focus has been on the pollutant particulate matter, while the transmission of infection is of greater importance these days.
Successful school design is quite complex as it requires balancing various interrelated factors. In recent years, significant improvements have been made in the methods of optimizing school buildings with different ventilation systems, and genetic algorithms used to find high-performance design solutions have proven their effectiveness in solving complex classroom problems. For example, a study by Lakhdari et al. [] showed how this approach can be used to optimize the thermal, lighting, and energy performance of a classroom in a hot and dry climate. Deblois and Ndiaye [] implemented a multi-variable model to optimize the design of the hybrid ventilation system in four elementary classrooms by maximizing their occupied hours that utilize natural ventilation. Research by Acosta-Acosta and El-Rayes [] developed a novel optimization model that provides the capability of optimizing the design in order to maximize occupant satisfaction in a classroom space in terms of the perception of human bioeffluent odor while minimizing construction cost. In turn, in a study by Arjmandi et al. [], the performance of five different ventilation systems was tested to control the spread of airborne particles in a classroom, and then the best case was selected for the least likelihood of spreading infection. A multi-criteria optimization process was performed to assess the impact of design variables (air inlet width, air change rate, and supply air temperature) on thermal comfort.
Previous studies [] have shown that natural ventilation is generally inadequate to obtain desirable IAQ conditions in classrooms, but installing a new centralized mechanical ventilation system is not always feasible. Therefore, the main objective of this study is to analyze the ability of natural ventilation enhanced by an automatic window-operating system driven by various control algorithms to guarantee a healthy and thermally comfortable environment in classrooms in a moderate climate. The analyses are based on numerical simulations of a multi-zone model of a fragment of a typical Polish school building. A co-simulation between EnergyPlus, CONTAM, and Python was used to control window opening and calculate the heat and mass flow in the building.
This study, in addition to considering IAQ and thermal comfort, deals with the possibility of reducing the concentration of airborne infections by controlling the opening of smart windows. Additionally, energy demand for the studied conditions was compared. The effect of additional actions, such as the introduction of portable air cleaners and wearing face masks, was also studied. The analyzed scenarios were compared based on their ability to reduce the number of hours with thermal discomfort, low indoor air quality, and high infection risk in an existing naturally ventilated classroom. Moreover, the effect of the analyzed scenarios on energy demand for the studied conditions was also presented.
2. Materials and Methods
2.1. Research Object
A typical Polish classroom with dimensions of 9 × 6 m and a height of 3.3 m was selected for the study. The building meets Polish requirements for the thermal insulation of walls and floors, the external brick walls are insulated with polystyrene (heat transfer coefficient U = 0.23 W/(m2∙K)), and beam and block floors are insulated with polystyrene insulation (U = 0.17 W/(m2∙K)) and double-glazed windows (U = 1.1 W/(m2∙K), solar heat gain coefficient is 0.64). The building has natural ventilation through leaks in windows and gravitational chimneys. In each classroom, there is one large window of 7.8 × 2.1 m (Figure 1a) consisting of twelve window sashes. The length of the window cracks is 42.6 m per window.
During classes (each lesson lasts 45 min, each break 15 min), there are 30 occupants present in the classroom every day (from Monday to Friday) from 8 am to 2 pm.
2.2. Software and Simulation Algorithm
A building performance simulation (BPS) was carried out under dynamic conditions using the EnergyPlus 9.4 (US Department of Energy, Washington, DC, USA) [] and CONTAM (National Institute of Standards and Technology, Gaithersburg, MD, USA) [] programs, which are among the world’s leading simulation software. EnergyPlus (EP) was used for thermal simulation and CONTAM was needed for inter-zone airflows calculations (this software has a model of a gravity chimney applied in this research). The programs were coupled, which allowed the transfer of data between them at each step of the simulation. This coupling was performed using CONTAM’s developed inter-process communication application programming interface (API) and was accomplished via co-simulation based on the Functional Mock-up Interface (FMI). The process is described in detail in Ref. []. Each case was simulated with a 5 min time step for the whole school year (from September to June) using the TMY (typical meteorological year) climate data for Warsaw [] (tmin = −12.2 °C, tmax = 33.1 °C, and tavg = 8.2 °C).
Three options for opening the window were assumed (Figure 1): O1—one window sash tilted, O2—one window sash opened, and O3—one window sash tilted and one window sash opened (as a combination of the first two options). Opening more windows was not considered, to avoid too many air changes and outside noise. The opening and tilting of the window were carried out automatically by means of actuators and were adjusted by the controller. The controller consisted of two parts:

Figure 1.
Scheme of window opening: (a) window construction, (b) open window, and (c) tilt window (sum of areas 1 to 3 was changed to two average openings 140 cm × 7 cm according to Pinto et al. []).
- Part I (connected with CO2 concentration in classroom): the window was opened if the limit value of CO2 concentration in the room was exceeded (PPM_o—optimized value). The type of window opening depended on the outside temperature (Tout). At low external temperatures, the window was only tilted (O1), and at high temperatures, one window was tilted and the other was opened (O3); for temperatures between low and high, option 2 was used. The external temperature range for window openings was optimized (TOut_o1, dTOut_o1). The summary of controller operation in part 1 is shown in Table 1.
 Table 1. Controller part I work algorithm.
 - Part II (connected with indoor temperature). This part was used to limit overheating of the classroom. The setting of the windows depended on the indoor temperature in the classroom (Tin) and the outdoor temperature (Tout). The operation diagram is shown in Table 2 (optimized values are the ranges of outdoor temperatures (TOut_o2, dTOut_o2) and the corresponding indoor temperature limits (Tin2_o, Tin2_o, Tin2_o) at which the window is opened).
Table 2. Controller part II work algorithm.
The window was opened if at least one part of the controller gave a signal to open the window. O2 and O3 settings were possible only from 7 am to 5 pm for safety reasons. At night, it was possible to tilt the window (O1) if the indoor temperature exceeded the limit value (Tin2_nigh—optimized value). The controller settings were obtained in the optimization process. It was carried out in the Python program [] using the pymoo library [], in which a single-criterion version of the genetic algorithms (GA) method [] was selected for optimization. This method is based on natural selection, adaptation, and imitating biological evolution. As in genetics, they can cross information (genes) and combine and mutate them to provide a variety of solutions. In this study, design variables were represented by natural numbers (for discrete values). Values of design variables were initialized randomly from the allowable sets of variables:
PPM_o∈{450, 500:100:1000}, TOut_o1∈{–6:2:10}, dTOut_o1∈{1:1:10};
TOut_o2∈{22:1:30}, dTOut_o2∈{1:1:10}, Tin1_o, Tin2_o, Tin3_o ∈{21:1:30};
Tin2_night ∈{25:1:30}.
Random selection, simulated binary crossover (SBX), and polynomial mutation (PM) were used in the evolution process. The objective function (Equation (1)) aimed to minimize the number of hours with poor conditions during lessons:
where the functions in square bracket are connected with:
min H(x) = min [Hcomfort(x) + HCO2(x) + HR0(x)]
- (1)
- Thermal comfort (Hcomfort):
- If the adaptive model of thermal comfort was used []—number of hours with thermal conditions within category IV.
- If the PMV-PPD model was used []—number of hours out of category III, i.e., PMV > 0.7 or PMV < −0.7.
- (2)
- CO2 concentration (HCO2)—number of hours with conditions within category IV: PPM > 1200, i.e., indoor concentration increased by 800 ppm above outdoor CO2 concentration of 400 ppm.
- (3)
- Infection risk (HR0)—number of hours with bad conditions: Reproduction number R0 > 1 (see Section 2.6).
x is a vector of design variables. In the article, these are the parameters of the controller for opening windows (described above). These values were changed in the optimization process. During the duration of the year-round simulations in the EP program, they were constant.
The scheme of the simulation programs coupling is presented in Figure 2.
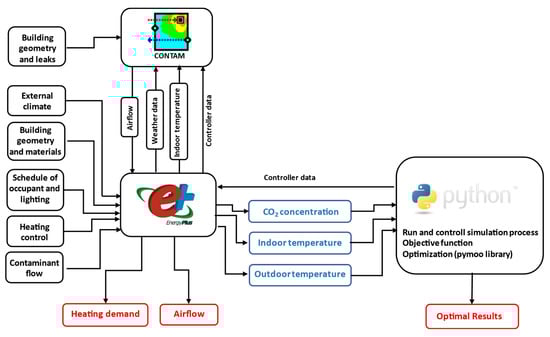
Figure 2.
Co-simulation diagram.
2.3. Thermal Model
A fragment of the school building on the top floor with two classrooms (windows facing east and west) and part of the corridor between them were modeled to calculate inter-zone heat and air flows, as shown in Figure 3. The partitions were built in accordance with the construction described in Section 2.1. The Window 7.8 program [] was used to determine the detailed data that describe the optical properties of the window panes (Pilkington OptifloatClear 4 mm, air 10% and argon 90%, Pilkington Optitherm S3 4 mm []).
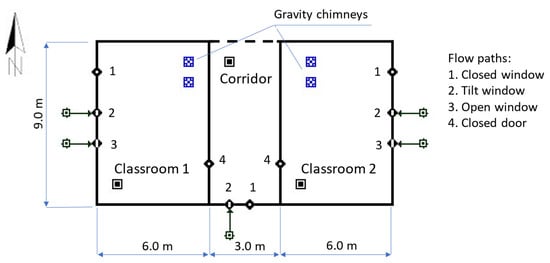
Figure 3.
View of CONTAM model with marked airflow paths.
The following internal heat gains were taken into account: occupants: 95 W/occupant (including sensible heat 65%), lights (calculated using daylighting control system: artificial lighting was switched on depending on the intensity of natural lighting: only during the occupied hours and if the natural illuminance was lower than 250 lux).
An ideal controller for the heating system was assumed. The heating set-point was 21 °C (from 7 am to 4 pm) and 18 °C (in the rest of the day). In classrooms, the heating power was limited by a maximum heating capacity at the level of 3.0 kW.
2.4. Air and Contaminant Flows Model
The ventilation model took into account airflow through leaks in the building envelope and ventilation achieved through opening windows. In each classroom, two gravity chimneys were modeled (Figure 3). The airflow was calculated by taking into account the variable indoor temperature calculated in the EP program. The following airflow element types was taken into account:
- Powerlaw Model—One-Way Flow model [] was adopted for closed windows. The tightness of windows and doors is described by Equation (2):
According to [], the following values of a and n were adopted:
- −
- For windows, a = 0.1 m3/(m∙h∙Pa0.67), n = 0.67;
- −
- For doors, a = 2.8 m3/(m∙h∙Pa0.5), n = 0.5; the door was closed all the time.
- Tilt Windows and Half-open Doors: Single Opening–Two-Way Flow model [] was adopted for tilt and open windows. Contrary to the Powerlaw model, this takes into account the flow in two directions in one simulation time step. For the tilt window, the equivalent area of the opening was calculated from the equations given in the article by Pinto et al. [].
- Gravitational Chimney: Darcy-Colebrook Resistance Model was assumed for chimneys []. The gravity chimneys were assumed as brick ones with dimensions of 27 × 14 cm, a roughness of 3 mm, and the sum of local loss coefficients of 3.4. The chimneys were extended above the roof to a height of 1.5 m. According to ASHRAE [], it was assumed that each person staying at school emits 3.82 × 10⁻⁸ m3/(s∙W) of carbon dioxide. The concentration of carbon dioxide in the outdoor air was set constant at 400 ppm.
2.5. Air Cleaner
The air cleaner chosen for this study was a Winix Zero Pro, which is designed with HEPA filters that remove 99.97% of the particles with 0.3 μm size. The device is appropriate for large rooms as the selected volume flow (CADR) is 330 m3/h in “High” mode, which generates tolerable noise during school lectures (40 dB) [].
2.6. Infection Risk Calculation
The probability of infection risk was calculated for students in the classroom based on their various activities by the Wells–Riley model []. In the Wells–Riley model, the viral load released is introduced by the quantum emission rate (E). This study assumed this for each student sitting, light moving, and speaking during lectures. Therefore, weighted averages of E were equal to 58 quanta/h. The quanta concentration was 0 at beginning of the first class (QC0) and increased with time until the end of the student’s presence in the classroom. The time development of the average quanta concentration QC(t) (quanta/m3) in the classroom can be obtained from Equation (3).
where , , and represent the volume of the room (m3), number of infected individuals, facial mask efficiency for the infected person, and first-order loss rate coefficient, respectively. The quanta is reduced not only by facial mask efficiency, but also due to ventilation (, filtration (, deposition (, and airborne virus decay (k). Hence, is defined as summed effects of these values (Equation (4)).
As this study considers natural ventilation, changes according to actual window opening and outdoor weather conditions. Based on previous studies, the surface deposition loss rate was estimated as equal to 0.31 h−1 [] and airborne virus decay was evaluated as equal to 0.63 h−1 []. Filtration removal rate can be calculated as . The CADR (m3/h) is the clean air delivery rate achieved by portable air cleaners with HEPA filters defined in Section 2.5. The filtration removal rate for one air cleaner assumed in this study was equal to 330 m3/h and kf = 1.85 when two air cleaners were used. The infection risk R(t) is the probability of infection in a closed space of susceptible individuals at a specific time (t). It can be obtained from Equation (5), which is based on the Wells–Riley model [] and was improved by Gammaitoni–Nucci []. Infection risk depends on the inhalation rate () of susceptible persons, which was estimated as 0.71 m3/h for each student based on their activities in the classroom. If all susceptible students wear masks, the facial mask efficiency () reduces the quanta inhaled. A perfect mixing of indoor air with a constant source was assumed to use the calculated average, QC(t), which increases with time.
A plausible probability level for the classroom can be defined based on the reproduction number R0, which is calculated from the ratio of new infections to the initial infectious individuals. To control the epidemic, keeping the basic reproduction number lower than 1 (R0 < 1) has been recommended.
2.7. Selected Cases
Seven cases, summarized in Table 3, were analyzed. A base case, Case 1, assumes fully opening one window only during break time, which is a common situation in classrooms. Case 2 considers that one window can be tilted and/or the second one fully opened automatically according to indoor environment quality functions (CO2 concentration and thermal comfort). In Case 3, one window is able to tilt, fully open, or both tilt one and open the other window simultaneously, while the controller considers all objective functions (thermal comfort, CO2 concentration, and infection risk). Case 4 is a repetition of Case 3 with the students wearing 50% filtration masks. Cases 5 and 6 also repeat Case 4 while the classroom is equipped with one and two air cleaners, respectively. The air cleaners provide 330 m3/h of clean air, which adds to the loss rate coefficient () in Equation (4). As the last case, Case 7 also repeats Case 4 while only half of the students attend the class in person.
Table 3.
Test cases conducted in the study.
3. Results
The result is divided into four primary segments to indicate the operation of the optimal controller of the window and various objective functions in seven selected cases. First, optimized controller performance was investigated. The second part refers to indoor air quality during the lecture, which includes CO2 concentration and air change rate data. The third part presents the indoor operative temperature, which is the main parameter that affects thermal comfort in this study. The last part, which was dedicated to the infection risk, presents the distribution of reproduction number (R0).
3.1. Optimal Controller Operation
The designed controller, which optimized the window opening by considering indoor environment objective functions and using the genetic algorithm, made significant changes in the window opening and, consequently, CO2 concentration and indoor temperature. The changes were displayed for window status, air change rate, CO2 concentration, and indoor operative temperature on a special day (March 6). March 6 was selected as the coldest day that the controller could open the window in all options (tilt, open, tilt and open). Figure 4 shows that by using the optimized controller (Case 2), the window opened for a longer time than in Case 1. In addition, the window opening increased as the end of lecture time approached. Thus, in some hours, windows were both tilted and fully opened, while in Case 1, the controller opened the window (fully open) for 15 min constantly until the end of the students’ presence in the classroom.
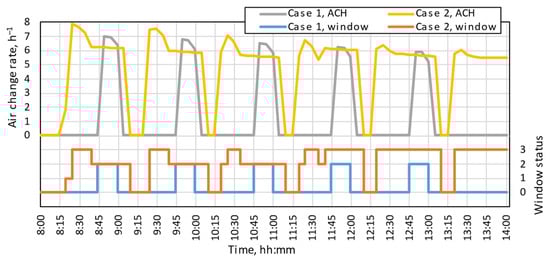
Figure 4.
Air change rate and window opening status during 6 March; 0, 1, 2, and 3 represent closed, tilted, fully opened, and tilted and fully opened together, respectively.
According to Figure 5, the outdoor temperature on March 6 varied between 3 and 10 °C. Therefore, window opening resulted in a decrease in indoor temperature. In case 1, despite temperature fluctuations with a larger range than in Case 2, the indoor operative temperature was higher than in Case 2 at all hours.
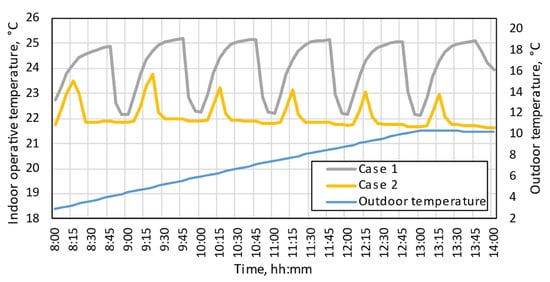
Figure 5.
Indoor operative temperature and outdoor temperature during 6 March.
The effect of the optimized controller on the reduction in CO2 concentration on 6th March was investigated. Figure 6 shows that in case 1, the CO2 concentration at the end of each class, before the break time, reached the peak value and passed 2500 ppm. Meanwhile, after optimizing the controller with indoor environment quality functions, the CO2 concentration varied between 600 ppm and 1200 ppm. Therefore, using the optimized controller was very effective in reducing CO2 concentration.
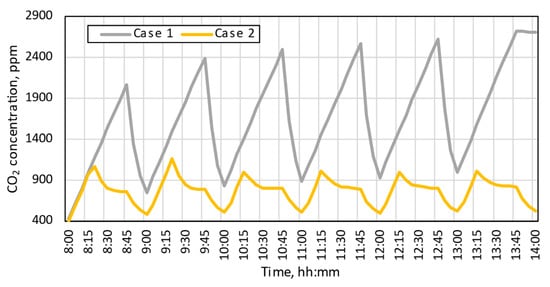
Figure 6.
CO2 concentration during 6 March.
The window status for one year is briefly shown in Table 4 for different cases. The window was opened only 3% of the time (break times) before optimization (case 1). After optimization, windows were opened or tilted for approximately 40% of the time, and also the time when students were not present. Tilting is the dominant opening area and an important factor to control objective functions. Despite adding masks and air cleaners in cases 4 to 6, and reducing the number of students in case 7, the performance of the controller in window opening was almost the same.
Table 4.
Percentage of time with different window status in all cases.
3.2. Air Quality
Figure 7 presents the cumulative distribution of CO2 concentration in the classroom (only occupied time). Considering that in Case 1, the window was opened only during breaks without considering the optimization of objective functions, the CO2 concentration increased to 2900 ppm. Solutions applied in Cases 2 to 6 performed relatively similar, but substantially better than Case 1. In these cases, for 80% of the time when students were in the classroom, the CO2 concentration was between 400 ppm and 950 ppm. In Case 7, as the number of students was reduced to 15, more than 90% of the students’ attendance time had a concentration of less than 900 ppm.
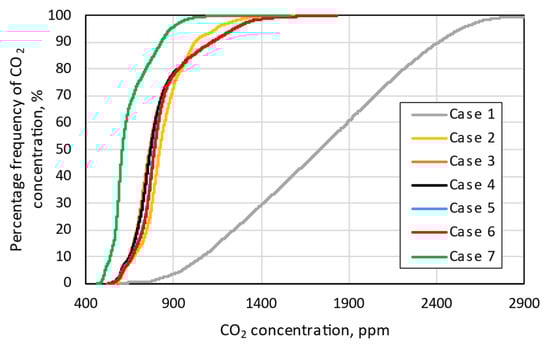
Figure 7.
Cumulative distribution of CO2 concentration frequency during the occupied classroom.
The air change rate (ACH) is the second investigated parameter that affects CO2 concentration and the indoor air quality. Figure 8 shows the distribution of ACH values based on time (only occupied time). As for CO2 concentration, except for Case 1, other cases had similar performance. In Case 1, at all the times when students were in the classroom, the ACH value was less than 1 h−1. In contrast, the air change rate in Cases 2 to 7 had significant fluctuations, reaching up to 12 h−1 in some hours.
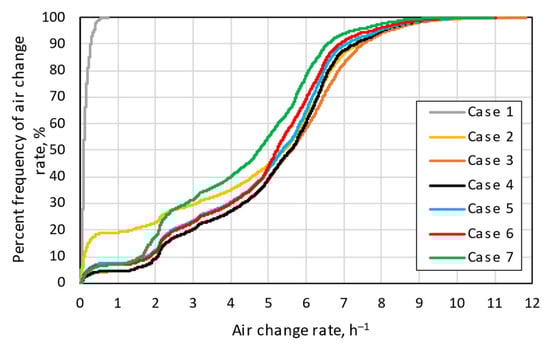
Figure 8.
Cumulative distribution of air change rate during the occupied classroom.
3.3. Thermal Environment
According to Figure 9, the indoor operative temperature in the classroom in Case 1 for 30% of the time was above 30 °C. This was due to the fact that the windows stayed closed during the classes and were opened only during breaks, even in September and June, when it was warm outside. In practice, during these periods in classrooms, windows are usually also open during lessons, which significantly reduces the indoor temperature. In the theoretical case, when there are 30 occupants in the room and the windows are closed, the temperature due to internal heat gains and solar gains may even exceed 40 °C. In Cases 2 to 7 (windows can be opened during lessons), for approximately 70% of the time when students were in the classroom, the temperature was between 20 and 25 °C.
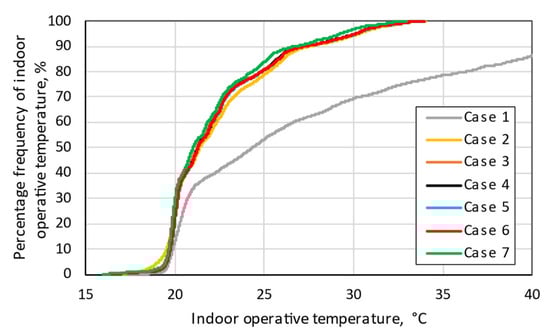
Figure 9.
Cumulative distribution of indoor operative temperature during the occupied classroom.
3.4. Infection Risk
To evaluate if the proposed controller reduces the infection risk in addition to improving the indoor environment, it was necessary to investigate the reproduction number (R0) distribution during classes, i.e., in the students’ presence time. According to Figure 10, the use of the window opening controller reduced the probability of infection risk to some extent. In Case 1, the distribution of R0 was close to linear from 0 to 11. The reproduction values also reached 11 in Case 2, but for 90% of the time, R0 was less than 5. In Case 3, despite the optimization of the window controller considering the probability of infection transmission, no specific change in the R0 distribution was observed. In Cases 4 to 7, the improvements were clearly obvious. The reproduction number did not exceed 2 and, most of the time, it was smaller than 1 in Cases 5 to 7.
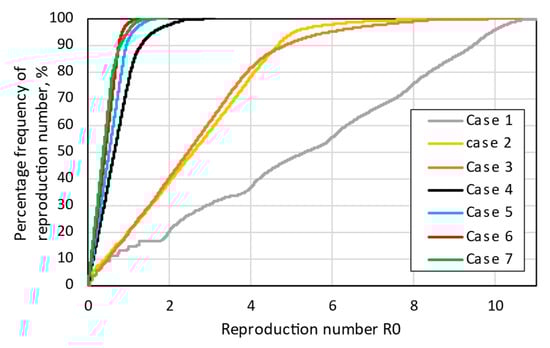
Figure 10.
Cumulative distribution of reproduction number (R0).
4. Discussion
In this study, a new controller method for the window opening was developed and optimized to improve the natural ventilation of the classroom. The ultimate aim was to maintain good indoor air quality and thermal comfort, as well as to limit the probability of infection risk for the time when students were present in the classroom. The optimized controller by indoor environment functions compared to the base case, in which the windows were opened only during breaks, showed a noticeable improvement in indoor air quality. The results for thermal comfort, CO2 concentration, and air change rate all improved. On the other hand, there was a noticeable increase in energy demand, caused by increasing ACH.
4.1. Indoor Environment Quality Optimization
Previous studies suggested that the use of controllers is effective on thermal comfort, and their proper usage makes a substantial improvement in the overall thermal comfort of occupants []. Based on European standards [], there are different expectation levels of the building’s occupants from the indoor air environment including “High”, “Medium”, and “Moderate”, which are placed in three categories []. A normal level could be medium, and a high level may be used for special occupants such as children or old persons. As a lower level will not provide any health risk, this study used the moderate level of expectation (category III) for controller optimization to be able to cover all the objective functions. Case 1, in which one window sash was fully opened during each break, did not provide thermal comfort conditions in the classroom. Figure 11 demonstrates that annually, 44% of the time when students were in the classroom are out of the recommended thermal comfort categories range (IV), including 39% of the time when the room was overheated due to high operative temperature in warmer periods, as described in Section 3.2. In Case 2 where the window opening was controlled by indoor environment quality functions (thermal comfort and CO2 concentration), only 18% of the total time occupants were present in the classroom was outside the recommended categories of thermal comfort. During the lesson (i.e., during the time when internal heat gains occurred), the classroom was passively cooled by the outside air supplied through the open window. The window was opened for 25% of the time of the school season, in contrast to Case 1 where it was only 3% (always during breaks). In addition, 26% of the occupied time was placed in the highest level of expectation (category I), while in Case 1, only 10% of the time fell in the first category. As Cases 3 to 7 had a very similar performance to Case 2, they were omitted in Figure 11.
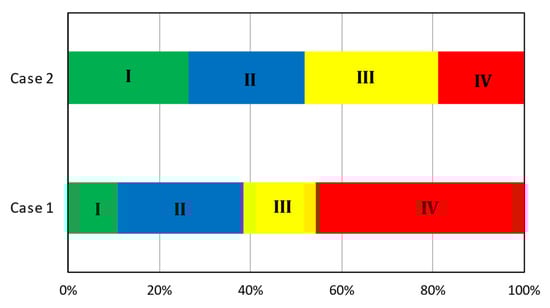
Figure 11.
Percentage of thermal comfort index in different categories.
On the other hand, the influx of a large amount of outside air into the room (sometimes over 10 h−1), during periods of low external temperatures, significantly decreased the indoor air temperature, even below 10 °C in the case of ventilation during breaks (Case 1) and to 14 °C in Case 2, which was a source of great discomfort during the lessons. There were 56 “too cold” hours in Case 1 and 96 “too cold” hours in Case 2, which accounted for 5% and 10% of occupancy time, respectively. In Case 1, the windows were closed immediately after the break, but it took several minutes to warm up the room due to the limited maximum power of the heating system.
Using the automatic window opener to reduce the CO2 concentration is a relatively common approach that has been experimentally and numerically investigated already. Heebøll et al. [] investigated that, in the case of using an automatic window along with mechanical ventilation, a significant reduction in CO2 concentration occurred compared to manually opening the window and using the heat recovery system. In this study, the automatic window was the only available way to naturally ventilate the classroom. The European standard referring to the equilibrium concentration and CO2 emission introduces three categories, which suggest maintaining the CO2 concentration maximum at 550 ppm, 800 ppm, and 1350 ppm above the outdoor CO2 level (in this study, 400 ppm was assumed) []. As an important objective function, this study considered category II for the controller setting in the optimization process. Figure 12 displays that the changes after optimization were significant in terms of CO2 concentration. For 49% of time in Case 1, it was placed out of defined categories (IV). Meanwhile, for almost all hours of Case 2, the CO2 concentration was maintained within the defined standard categories. In addition, for 80% of the time, the CO2 concentration was in category I (400–950 ppm), while in Case 1, requirements for category I were fulfilled for only 5% of the time.
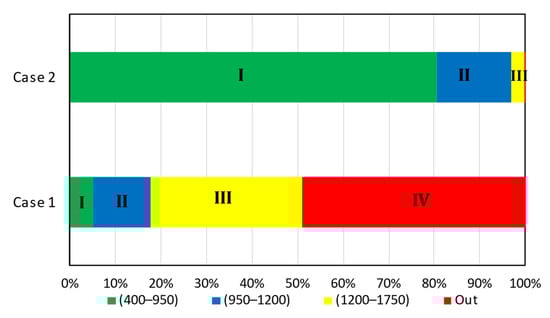
Figure 12.
Percentage of carbon dioxide concentration in different categories.
Although the air change rate is not one of the objective functions, this value significantly changes after optimization of thermal comfort and CO2 concentration. On the other hand, it is necessary to have a sufficient air change rate in the room to comply with hygiene issues. Considering 30 people in the classroom, the ventilation airflow rate should be 600 m3/h according to the Polish standard [], 482 m3/h according to [] (assuming category III and low emission from building), and 524 m3/h according to [], which corresponds to 3.4 h−1, 2.7 h−1, and 2.9 h−1, respectively. As shown in Figure 8, ACH was less than 1 h−1 in all hours in Case 1, which is not proper hygienically. Case 2 experienced entirely different conditions. ACH was higher than 3.4 h−1 for approximately 70% of the time when students were in the classroom. Although the window opening control approach based on indoor environment led to a significant improvement in air change rate, still considerable fluctuations of ACH value were observed. In some hours, the ACH reached even 12 h−1. In addition, for approximately 20% of the students’ presence time in the classroom, ACH was lower than 1 h−1. Hence, mechanical ventilation is necessary to ensure a steady, constant exchange of air.
4.2. Infection Risk Optimization
Unlike CO2 concentration, the use of the controller did not have much effect on reducing the probability of infection risk in the classroom. Case 3, where the infection risk objective was added to the controller optimization, had a similar performance to Case 2 (without considering COVID in the controller) in reducing the probability of infection risk. Figure 10 indicates that only for 14% of the lecture time, the reproduction number was lower than 1 when the window was opened during breaks (Case 1). In Case 3, the controller slightly increased this amount to 20.2%. However, for 79.8% of lecture time, R0 was still higher than 1, which does not provide a safe condition for infection risk inside the room. Therefore, it is necessary to take other actions, in addition to optimization of smart windows performance, to limit the probability of infection risk.
Many studies have investigated the effect of masks on reducing the possibility of virus transmission []. However, the sufficiency of this solution depends also on other parameters than only mask characteristics. This includes ventilation rate, exposure time, number of susceptible people, and number of infected persons []. In this study, masks with 50% filtration efficiency were intended for students in Cases 4 to 7. Using masks (Case 4) significantly reduced hours with a high probability of infection. However, for 23% of the lecture time, R0 was still higher than 1. Therefore, in classrooms with controlled natural ventilation, wearing masks with 50% efficiency alone is not enough.
Air cleaners are effective in the elimination of particles and aerosols from the air in closed spaces []. Hence, for Case 5 and Case 6, one and two air purifiers were assumed in the classroom, respectively. The air cleaners were especially effective when used along with occupants wearing face masks; the time when reproduction number R0 was above 1 was reduced to less than 10%, which is desirable. The best performance in terms of limiting virus transmission was observed in Case 6, where two air purifiers with 330 m3/h CADR were in operation. For this case, only 1.6% of the time included a higher probability of infection risk (R0 > 1). Although air cleaners were effective for reducing the risk of infection in classes, they should be applied carefully as they generate noise (40 dB). The location of the air cleaner in the classroom should also be considered [].
After the emergence of COVID-19, holding online classes became especially prevalent. However, over time, due to the reduction in the pandemic and the low efficiency of students’ learning, they returned to classes, and classes were held with the maximum number. This study probes hybrid classes to control the probability of infection transmission as well as students’ learning efficiency. Case 7 assumes that the class is held with only 15 students present in the class. Therefore, half of the students participate in the class virtually. In this case, where the students were considered with 50% filtration masks, they experienced high infection risk (R0 > 1) for only 4% of the lecture class.
4.3. Energy Analyses
This study also examined energy demand for heating as a consequence of window opening. Figure 13 shows a summary of the unfavorable indoor environment conditions observed for each studied case together with the heat demand. The lowest demand was noted for the reference case (Case 1) in which the controller opened the window only during break times. This case, however, had the most undesirable conditions in terms of low air quality and high probability of infection transmission, which is discussed in previous sections. The introduction of the smart windows with optimized indoor air parameters (Case 2) improved air quality conditions in the classroom, but a substantial increase in heating demand was indicated (about 190%).
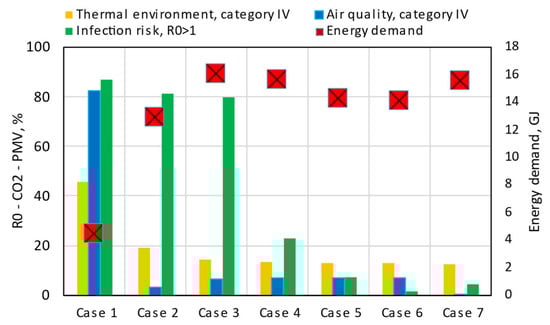
Figure 13.
Summary of all objective functions performed in the cases: the percentage of hours that each function is out of acceptable range (left axis) and annual energy demand (right axis).
Introducing infection risk to the optimization process in the controller (Case 3) increased even more the heat demand (about 260% compared to Case 1), which was caused by the further increase in air change rates. This had some positive but only small effect on lowering the probability of infection transmission and CO2 concentration.
Introducing face masks for the students and especially air cleaners significantly decreased the risk of infection. The energy demand in these cases also decreased slightly. In the case when students used masks (Case 4), heating demand fell only slightly by 0.5 GJ, which is 3%. Air cleaners in Cases 5 and 6 partially reduced the risk of infection; therefore, the optimized system opened the window less often, which reduced the heat demand by 1.5 GJ, which was 10% of the value in Case 4. To sum up, the energy demand for heating, CO2 concentration, and thermal comfort in Cases 5 and 6 that used different numbers of air cleaners had a similar performance, and the only variable function was the probability of infection risk. Case 6, with an R0 lower than 1 for 98% of the time, had the best performance in reducing infection risk. In Case 7, as the number of people in the classroom decreased, it not only reduced the probability of infection risk desirably but also the number of hours to 0 when the CO2 concentration was outside the standard category. However, in the absence of air cleaners, the energy demand slightly increased.
It should be noted the heat demand output obtained in simulations covered only the demand for heating. Air cleaners need electricity for operation. The power of a single air cleaner applied in this study was 21 W; thus, one air cleaner operating constantly during occupancy hours will consume approximately 20 kWh and should be added to the total energy demand. Nevertheless, indoor air cleaning strategies are necessary to reduce the risk of infection in classrooms, especially with natural ventilation.
Electrical energy for the automatic window opening system was not included in the analysis. The window actuators require relatively little electrical power, but nevertheless, this energy can influence the optimal solution.
5. Conclusions
Clean air is a basic requirement for human health and well-being. The key to protecting occupants against the negative impact of air pollution is improving ventilation. Schools are usually low-rise buildings (2 to 3 floors) and most of the classrooms are on the top floor, where the length of gravitational ventilation ducts is very short. Therefore, the natural ventilation systems used in school rooms (especially in windless periods) are unable to provide the required airflow, and the CO2 concentration can periodically reach even 10,000 ppm [], if the windows are not opened all day. The situation can be improved by the regular airing of classrooms, which can be supported by a smart window opening system that was developed in this study.
The analysis of the simulation results showed that for the typical classroom in Poland the following conclusions can be drawn:
- The regular opening of windows only during breaks does not ensure acceptable environment quality in the classroom—the thermal environment is low for more than 45% of time and air quality for more than 80%.
- Smart windows with controllers substantially improve thermal comfort and increase air change rate; thus, air quality is also improved, but the risk of infection is reduced only slightly. The introduction of the “infection risk” objective to controller optimization (Case 3) has very little effect on reducing the probability of infection risk.
- The inflow of cool air through an open window causes a significant increase in the heating power in the rooms, and in periods of low external temperature, it can cause a local decrease in the indoor temperature in the rooms (in this study, even below 14 °C).
- The frequent opening of windows during a day significantly increases heating demand (in this study, heating demand increased 3 times compared to the case when windows are only opened during school breaks). Therefore, mechanical ventilation is necessary to ensure a constant air exchange, which, at the same time, allows the use of heat recovery from the air removed from the room; however, the introduction of such a system is problematic in existing schools and requires large investments.
- In order to reduce infection risk substantially, wearing masks and operating effective air cleaners are necessary (these applications can decrease the time with high infection risk to 1.6%).
- Decreasing the number of students in the classroom, as it was expected, helps to further decrease the risk of infection (in this study, the time with high infection risk decreases to 4.2%).
- The results show that classrooms that possess windows with optimized controllers by indoor environment and infection risk functions, along with air cleaners and masks for students, are able to control air quality, thermal comfort, and infection risk.
6. Limitations and Future Works
- Considering that the present study was limited to only one climate and one typical school, it will be interesting to study the controller performance in different climates and compare the results.
- The expansion of controller parameters and the optimization of functions, especially those that would be affected by window opening, can be advantageous in the future. Energy demand and other indoor air pollutants such as particulate matter (PM) are the major influential issues involved with opening windows.
- The presented analysis concerned the effect of controller operation on energy demand, but the economic issues were not addressed.
- As the model considered the classroom with fully mixed indoor air to use the calculation for quanta concentration, an experimental study with local measurement is recommended to investigate conditions in the real state.
Author Contributions
Conceptualization, J.K. and S.N.; methodology, K.G., J.F.-G., J.K. and S.N.; software, K.G.; formal analysis, S.N. and J.K.; writing—original draft preparation, S.N., J.K. and J.F.-G.; writing—review and editing, K.G. All authors have read and agreed to the published version of the manuscript.
Funding
This research received no external funding.
Institutional Review Board Statement
Not applicable.
Informed Consent Statement
Not applicable.
Data Availability Statement
Not applicable.
Acknowledgments
The work was supported by the Polish Ministry of Education and Science within the research subsidy.
Conflicts of Interest
The authors declare no conflict of interest.
References
- Šujanová, P.; Rychtáriková, M.; Sotto Mayor, T.; Hyder, A. A Healthy, Energy-Efficient and Comfortable Indoor Environment, a Review. Energies 2019, 12, 1414. [Google Scholar] [CrossRef]
- EU Standard EN 16798-1:2019; Energy Performance of Buildings—Ventilation for Buildings—Part 1: Indoor Environmental Input Parameters for Design and Assessment of Energy Performance of Buildings Addressing Indoor Air Quality, Thermal Environment, Lighting and Acoustics—Module M1-6. European Committee for Standardization: Brussels, Belgium, 2019.
- ASHRAE. ASHRAE Standard 62-2001; Ventilation for Acceptable Indoor Air Quality Atlanta. American Society of Heating, Refrigerating, and Air Conditioning Engineers, Inc.: Atlanta, Ga, USA, 2001. [Google Scholar]
- Srivastava, S.; Khokhar, F.; Madhav, A.; Pembroke, B.; Shetty, V.; Mutreja, A. COVID-19 Lessons for Climate Change and Sustainable Health. Energies 2021, 14, 5938. [Google Scholar] [CrossRef]
- Allam, M.; Cai, S.; Ganesh, S.; Venkatesan, M.; Doodhwala, S.; Song, Z.; Hu, T.; Kumar, A.; Heit, J.; Study Group, C.; et al. COVID-19 Diagnostics, Tools, and Prevention. Diagnostics 2020, 10, 409. [Google Scholar] [CrossRef]
- Lewis, D. Is the Coronavirus Airborne? Experts Can’t Agree. Nature 2020, 580, 175. [Google Scholar] [CrossRef] [PubMed]
- Gralton, J.; Tovey, E.R.; McLaws, M.-L.; Rawlinson, W.D. Respiratory Virus RNA Is Detectable in Airborne and Droplet Particles: Viral RNA in Airborne and Droplet Particles. J. Med. Virol. 2013, 85, 2151–2159. [Google Scholar] [CrossRef]
- Santarpia, J.L.; Herrera, V.L.; Rivera, D.N.; Ratnesar-Shumate, S.; Reid, S.P.; Ackerman, D.N.; Denton, P.W.; Martens, J.W.S.; Fang, Y.; Conoan, N.; et al. The size and culturability of patient-generated SARS-CoV-2 aerosol. J. Expo. Sci. Environ. Epidemiol. 2022, 32, 706–711. [Google Scholar] [CrossRef] [PubMed]
- Makison Booth, C.; Clayton, M.; Crook, B.; Gawn, J.M. Effectiveness of Surgical Masks against Influenza Bioaerosols. J. Hosp. Infect. 2013, 84, 22–26. [Google Scholar] [CrossRef]
- O’Dowd, K.; Nair, K.M.; Forouzandeh, P.; Mathew, S.; Grant, J.; Moran, R.; Bartlett, J.; Bird, J.; Pillai, S.C. Face Masks and Respirators in the Fight Against the COVID-19 Pandemic: A Review of Current Materials, Advances and Future Perspectives. Materials 2020, 13, 3363. [Google Scholar] [CrossRef]
- Domínguez-Amarillo, S.; Fernández-Agüera, J.; Cesteros-García, S.; González-Lezcano, R.A. Bad Air Can Also Kill: Residential Indoor Air Quality and Pollutant Exposure Risk during the COVID-19 Crisis. Int. J. Environ. Res. Public. Health 2020, 17, 7183. [Google Scholar] [CrossRef]
- Zhao, Y.; Sun, H.; Tu, D. Effect of Mechanical Ventilation and Natural Ventilation on Indoor Climates in Urumqi Residential Buildings. Build. Environ. 2018, 144, 108–118. [Google Scholar] [CrossRef]
- Jo, S.; Hong, J.; Lee, S.-E.; Ki, M.; Choi, B.Y.; Sung, M. Airflow Analysis of Pyeongtaek St Mary’s Hospital during Hospitalization of the First Middle East Respiratory Syndrome Patient in Korea. R. Soc. Open Sci. 2019, 6, 181164. [Google Scholar] [CrossRef] [PubMed]
- Kulkarni, H.; Smith, C.M.; Lee, D.D.H.; Hirst, R.A.; Easton, A.J.; O’Callaghan, C. Evidence of Respiratory Syncytial Virus Spread by Aerosol. Time to Revisit Infection Control Strategies? Am. J. Respir. Crit. Care Med. 2016, 194, 308–316. [Google Scholar] [CrossRef] [PubMed]
- Rule, A.M.; Apau, O.; Ahrenholz, S.H.; Brueck, S.E.; Lindsley, W.G.; de Perio, M.A.; Noti, J.D.; Shaffer, R.E.; Rothman, R.; Grigorovitch, A.; et al. Healthcare Personnel Exposure in an Emergency Department during Influenza Season. PLoS ONE 2018, 13, E0203223. [Google Scholar] [CrossRef] [PubMed]
- Zhang, H.; Yang, D.; Tam, V.W.Y.; Tao, Y.; Zhang, G.; Setunge, S.; Shi, L. A Critical Review of Combined Natural Ventilation Techniques in Sustainable Buildings. Renew. Sustain. Energy Rev. 2021, 141, 110795. [Google Scholar] [CrossRef]
- World Health Organization. Roadmap to Improve and Ensure Good Indoor Ventilation in the Context of COVID-19; World Health Organization: Geneva, Switzerland, 2021; ISBN 978-92-4-002128-0. [Google Scholar]
- Schibuola, L.; Scarpa, M.; Tambani, C. Natural Ventilation Level Assessment in a School Building by CO2 Concentration Measures. Energy Procedia 2016, 101, 257–264. [Google Scholar] [CrossRef]
- Schibuola, L.; Tambani, C. Indoor Environmental Quality Classification of School Environments by Monitoring PM and CO2 Concentration Levels. Atmos. Pollut. Res. 2020, 11, 332–342. [Google Scholar] [CrossRef]
- Santamouris, M.; Synnefa, A.; Asssimakopoulos, M.; Livada, I.; Pavlou, K.; Papaglastra, M.; Gaitani, N.; Kolokotsa, D.; As-Simakopoulos, V. Experimental Investigation of the Air Flow and Indoor Carbon Dioxide Concentration in Classrooms with Intermittent Natural Ventilation. Energy Build. 2008, 40, 1833–1843. [Google Scholar] [CrossRef]
- European Commission Joint Research Centre; Institute for Health and Consumer Protection.; European Commission; Di-Rectorate General for Health and Consumers; Regional Environmental Centre for Central and Eastern Europe. SINPHONIE: Guidelines for Healthy Environments within European Schools; Publications Office: Luxembourg, 2014. [Google Scholar]
- Seppanen, O.A.; Fisk, W.J.; Mendell, M.J. Association of Ventilation Rates and CO2 Concentrations with Health And Other Responses in Commercial and Institutional Buildings. Indoor Air 1999, 9, 226–252. [Google Scholar] [CrossRef]
- Daum, D.; Haldi, F.; Morel, N. A Personalized Measure of Thermal Comfort for Building Controls. Build. Environ. 2011, 46, 3–11. [Google Scholar] [CrossRef]
- Clements-Croome, D.J.; Awbi, H.B.; Bakó-Biró, Z.; Kochhar, N.; Williams, M. Ventilation Rates in Schools. Build. Environ. 2008, 43, 362–367. [Google Scholar] [CrossRef]
- Coley, D.A.; Greeves, R.; Saxby, B.K. The Effect of Low Ventilation Rates on the Cognitive Function of a Primary School Class. Int. J. Vent. 2007, 6, 107–112. [Google Scholar] [CrossRef]
- Lu, X.; Pang, Z.; Fu, Y.; O’Neill, Z. The Nexus of the Indoor CO2 Concentration and Ventilation Demands Underlying CO2-Based Demand-Controlled Ventilation in Commercial Buildings: A Critical Review. Build. Environ. 2022, 218, 109116. [Google Scholar] [CrossRef]
- Cho, H.; Cabrera, D.; Sardy, S.; Kilchherr, R.; Yilmaz, S.; Patel, M.K. Evaluation of Performance of Energy Efficient Hybrid Ventilation System and Analysis of Occupants’ Behavior to Control Windows. Build. Environ. 2021, 188, 107434. [Google Scholar] [CrossRef]
- Stazi, F.; Naspi, F.; Ulpiani, G.; Di Perna, C. Indoor Air Quality and Thermal Comfort Optimization in Classrooms Developing an Automatic System for Windows Opening and Closing. Energy Build. 2017, 139, 732–746. [Google Scholar] [CrossRef]
- Grygierek, K.; Sarna, I. Impact of Passive Cooling on Thermal Comfort in a Single-Family Building for Current and Future Climate Conditions. Energies 2020, 13, 5332. [Google Scholar] [CrossRef]
- Sorgato, M.J.; Melo, A.P.; Lamberts, R. The Effect of Window Opening Ventilation Control on Residential Building Energy Consumption. Energy Build. 2016, 133, 1–13. [Google Scholar] [CrossRef]
- Psomas, T.; Fiorentini, M.; Kokogiannakis, G.; Heiselberg, P. Ventilative Cooling through Automated Window Opening Control Systems to Address Thermal Discomfort Risk during the Summer Period: Framework, Simulation and Parametric Analysis. Energy Build. 2017, 153, 18–30. [Google Scholar] [CrossRef]
- Tan, Z.; Deng, X. An Optimised Window Control Strategy for Naturally Ventilated Residential Buildings in Warm Climates. Sustain. Cities Soc. 2020, 57, 102118. [Google Scholar] [CrossRef]
- Wang, Y.; Cooper, E.; Tahmasebi, F.; Taylor, J.; Stamp, S.; Symonds, P.; Burman, E.; Mumovic, D. Improving Indoor Air Quality and Occupant Health through Smart Control of Windows and Portable Air Purifiers in Residential Buildings. Build. Serv. Eng. Res. Technol. 2022, 43, 571–588. [Google Scholar] [CrossRef]
- Lakhdari, K.; Sriti, L. Birgit Painter Parametric Optimization of Daylight, Thermal and Energy Performance of Middle School Classrooms, Case of Hot and Dry Regions. Build. Environ. 2021, 204, 108173. [Google Scholar] [CrossRef]
- Deblois, J.C.; Ndiaye, D. CFD-Assisted Design and Optimization of Solar Chimneys for Elementary School Classrooms. In Proceedings of the 14th Conference of International Building Performance Simulation Association, Hyderabad, India, 7–9 December 2015; pp. 818–825. [Google Scholar]
- Acosta-Acosta, D.F.; El-Rayes, K. Optimal Design of Classroom Spaces in Naturally-Ventilated Buildings to Maximize Occupant Satisfaction with Human Bioeffluents/Body Odor Levels. Build. Environ. 2020, 169, 106543. [Google Scholar] [CrossRef]
- Arjmandi, H.; Amini, R.; Khani, F.; Fallahpour, M. Minimizing the Respiratory Pathogen Transmission: Numerical Study and Multi-Objective Optimization of Ventilation Systems in a Classroom. Therm. Sci. Eng. Prog. 2022, 28, 101052. [Google Scholar] [CrossRef]
- Schibuola, L.; Tambani, C. High Energy Efficiency Ventilation to Limit COVID-19 Contagion in School Environments. Energy Build. 2021, 240, 110882. [Google Scholar] [CrossRef] [PubMed]
- Engineering Reference. EnergyPlusTM; Version 9.4.0; Documentation; US Department of Energy: Washington, DC, USA, 2020. [Google Scholar]
- Dols, W.S.; Polidoro, B.J. CONTAM User Guide and Program Documentation Version 3.4; National Institute of Standards and Technology: Gaithersburg, MD, USA, 2020. [Google Scholar]
- Typical Meteorological Years and Statistical Climatic Data for the Area of Poland for Energy Calculations of Buildings—Open Data. Available online: https://Dane.Gov.Pl/Pl/Dataset/797,Typowe-Lata-Meteorologiczne-i-Statystyczne-Dane-Klimatyczne-Dla-Obszaru-Polski-Do-Obliczen-Energetycznych-Budynkow (accessed on 28 November 2022).
- Pinto, M.; Viegas, J.; Freitas, V. Summer Cross Ventilation in Residential Buildings. In Proceedings of the Energy for Sustainability International Conference 2017 Designing Cities & Communities for the Future, Funchal, Portugal, 8–10 February 2017. [Google Scholar]
- EnergyPlus Python API 0.1 Documentation. Available online: https://nrel.github.io/EnergyPlus/api/python/ (accessed on 28 November 2022).
- Blank, J.; Deb, K. Pymoo: Multi-Objective Optimization in Python. IEEE Access 2020, 8, 89497–89509. [Google Scholar] [CrossRef]
- Goldberg, D. Genetic Algorithms in Search, Optimization and Machine Learning; Addison-Wesley Publishing Company, Inc.: Boston, MA, USA, 1989; ISBN 978-0201157673. [Google Scholar]
- Mitchell, R.; Kohler, C.; Curcija, D.; Zhu, L.; Vidanovic, S.; Czarnecki, S.; Arasteh, D. WINDOW 7 User Manual. Lawrence Berkeley National Laboratory, March 2019. Available online: https://Windows.Lbl.Gov/Tools/Window/Documentation (accessed on 14 December 2021).
- Pilkington. Available online: https://www.Pilkington.Com/Pl-Pl/Pl/Produkty/Funkcje-Szkla/Izolacja-Cieplna/Pilkington-Insulight-Therm (accessed on 15 December 2021).
- Dols, W.S.; Emmerich, S.J.; Polidoro, B.J. Coupling the Multizone Airflow and Contaminant Transport Software CONTAM with EnergyPlus Using Co-Simulation. Build. Simul. 2016, 9, 469–479. [Google Scholar] [CrossRef]
- Polish Ministry of Infrastructure. Regulation of the Minister of Infrastructure of 12 April 2002 on the Technical Conditions That Should Be Met by Buildings and Their Location; Journal of Laws of the Republic of Poland No 75, Item. 690, (with Recast); Polish Ministry of Infrastructure: Warsaw, Poland, 2002. (In Polish) [Google Scholar]
- Fernández de Mera, I.G.; Granda, C.; Villanueva, F.; Sánchez-Sánchez, M.; Moraga-Fernández, A.; Gortázar, C.; de la Fuente, J. HEPA Filters of Portable Air Cleaners as a Tool for the Surveillance of SARS-CoV-2. Indoor Air 2022, 32, e13109. [Google Scholar] [CrossRef]
- Sze To, G.N.; Chao, C.Y.H. Review and Comparison between the Wells–Riley and Dose-Response Approaches to Risk Assessment of Infectious Respiratory Diseases. Indoor Air 2010, 20, 2–16. [Google Scholar] [CrossRef]
- Diapouli, E.; Chaloulakou, A.; Koutrakis, P. Estimating the Concentration of Indoor Particles of Outdoor Origin: A Review. J. Air Waste Manag. Assoc. 2013, 63, 1113–1129. [Google Scholar] [CrossRef]
- van Doremalen, N.; Bushmaker, T.; Morris, D.H.; Holbrook, M.G.; Gamble, A.; Williamson, B.N.; Tamin, A.; Harcourt, J.L.; Thornburg, N.J.; Gerber, S.I.; et al. Aerosol and Surface Stability of SARS-CoV-2 as Compared with SARS-CoV-1. N. Engl. J. Med. 2020, 382, 1564–1567. [Google Scholar] [CrossRef]
- Riley, E.C.; Murphy, G.; Riley, R.L. Airborne Spread of Measles In A Suburban Elementary School. Am. J. Epidemiol. 1978, 107, 421–432. [Google Scholar] [CrossRef]
- Gammaitoni, L. Using a Mathematical Model to Evaluate the Efficacy of TB Control Measures. Emerg. Infect. Dis. 1997, 3, 335–342. [Google Scholar] [CrossRef]
- Raja, I.A.; Nicol, J.F.; McCartney, K.J.; Humphreys, M.A. Thermal Comfort: Use of Controls in Naturally Ventilated Buildings. Energy Build. 2001, 33, 235–244. [Google Scholar] [CrossRef]
- Heebøll, A.; Wargocki, P.; Toftum, J. Window and Door Opening Behavior, Carbon Dioxide Concentration, Temperature, and Energy Use during the Heating Season in Classrooms with Different Ventilation Retrofits—ASHRAE RP1624. Sci. Technol. Built Environ. 2018, 24, 626–637. [Google Scholar] [CrossRef]
- Polish Standard PN-83/B-03430/Az3 2000; Ventilation in Dwellings and Public Utility Buildings. Polish Committee for Standardization: Warsaw, Poland, 2000. (In Polish)
- Howard, J.; Huang, A.; Li, Z.; Tufekci, Z.; Zdimal, V.; van der Westhuizen, H.-M.; von Delft, A.; Price, A.; Fridman, L.; Tang, L.-H.; et al. An Evidence Review of Face Masks against COVID-19. Proc. Natl. Acad. Sci. USA 2021, 118, e2014564118. [Google Scholar] [CrossRef]
- Morawska, L.; Allen, J.; Bahnfleth, W.; Bluyssen, P.M.; Boerstra, A.; Buonanno, G.; Cao, J.; Dancer, S.J.; Floto, A.; Franchimon, F.; et al. A Paradigm Shift to Combat Indoor Respiratory Infection. Science 2021, 372, 689–691. [Google Scholar] [CrossRef] [PubMed]
- Buising, K.L.; Schofield, R.; Irving, L.; Keywood, M.; Stevens, A.; Keogh, N.; Skidmore, G.; Wadlow, I.; Kevin, K.; Rismanchi, B.; et al. Use of Portable Air Cleaners to Reduce Aerosol Transmission on a Hospital Coronavirus Disease 2019 (COVID-19) Ward. Infect. Control Hosp. Epidemiol. 2022, 43, 987–992. [Google Scholar] [CrossRef] [PubMed]
- Duill, F.F.; Schulz, F.; Jain, A.; Krieger, L.; van Wachem, B.; Beyrau, F. The Impact of Large Mobile Air Purifiers on Aerosol Concentration in Classrooms and the Reduction of Airborne Transmission of SARS-CoV-2. Int. J. Environ. Res. Public. Health 2021, 18, 11523. [Google Scholar] [CrossRef] [PubMed]
- Popiołek, Z.; Ferdyn-Grygierek, J. Efficiency of Heating and Ventilation in School Buildings before and after Retrofitting. In Proceedings of the 3rd International Seminar Healthy Buildings, Sofia, Bulgaria, 18 November 2005. [Google Scholar]
Disclaimer/Publisher’s Note: The statements, opinions and data contained in all publications are solely those of the individual author(s) and contributor(s) and not of MDPI and/or the editor(s). MDPI and/or the editor(s) disclaim responsibility for any injury to people or property resulting from any ideas, methods, instructions or products referred to in the content. |
© 2023 by the authors. Licensee MDPI, Basel, Switzerland. This article is an open access article distributed under the terms and conditions of the Creative Commons Attribution (CC BY) license (https://creativecommons.org/licenses/by/4.0/).