Abstract
Plastic waste has a high energy content and can be utilized as an energy source. This study aims to assess the economic feasibility of polypropylene plastic waste (PP) pyrolysis. A literature review was carried out to determine the optimal pyrolysis conditions for oil production. The preferred pyrolysis temperature ranges from 450 °C to 550 °C, where the oil yields vary from 82 wt.% to 92.3 wt.%. Two scenarios were studied. In the first scenario, pyrolysis gas is used for the pyrolysis heating needs, whereas in the second scenario, natural gas is used. An overview of the economic performance of a pyrolysis plant with a capacity of 200,000 t/year is presented. Based on the results, the plant is economically viable, as it presents high profits and a short payback time for both scenarios considered. Although the annual revenues are smaller in scenario 1, the significant reduction in operating costs makes this scenario preferable. The annual profits amount to 37.3 M€, while the return on investment is 81% and the payback time is 1.16 years. In scenario 2, although the plant is still feasible and shows high profitability, the annual profits are lower by about 1.5 M€, while the payback time is 1.2 years.
1. Introduction
The production of plastics on a global scale is on an upward trajectory, due to their extensive use in agriculture, construction, packaging, the automobile industry, and electrical equipment manufacturing. In 2020, global production reached 367 million t, displaying a 25% increase compared to 2010. It is estimated that by 2050, the production could potentially exceed 1 billion t if the current production and consumption trends persist [1]. The improper disposal of plastic waste leads to soil and groundwater pollution, and thus poses a serious threat to the environment and human health. Presently, approximately only 10% of plastic waste is recycled properly, while the bulk of it is either landfilled, incinerated, or generally left untreated and mismanaged [2].
In Greece, approximately 700 thousand t of plastic waste, or 68 kg per capita, is generated annually. Currently, the majority (i.e., 84%) is landfilled and only 8% is recycled [3]. The improper management of plastic waste is mostly attributed to low collection rates, highly mixed waste streams and limited recycling infrastructure [4]. The accumulation of plastic waste poses an important issue for the country, as more than 40 thousand t of plastic leaks into nature and local ecosystems each year. Additionally, there are negative implications on the national economy, with annual losses amassing to 26 M€, affecting the tourism, shipping, and fishing sectors [3,5].
There is still significant room for improvement in terms of the diversion of plastic waste from landfills and incineration plants and managing them in an efficient and environmentally sound manner [6]. The potential of utilizing plastic waste and feeding it into a forward supply chain, within the model of circular economy, is significant. A circular economy model focuses on waste management and resource recovery, through reuse, recycling, and energy utilization. Additionally, it aids in the development of new industries and jobs, reducing emissions, and promoting the efficient use of resources [7].
There are several pathways for the proper management and utilization of plastic waste within a circular economy concept. Plastic waste can be recycled and converted into other useful products. Mechanical recycling, which is also referred to as secondary recycling, involves a plastic waste recovery process based on mechanical means. Moreover, plastic waste has a high energy content and can, therefore, be utilized as an energy source.
An efficient method of utilizing these materials is through the process of pyrolysis, which involves indirect energy recovery from the feedstock. During pyrolysis, the feedstock is heated in the absence of oxygen, and the molecular chains are deconstructed. There are three main products of this process, which are pyrolysis oil, gas, and char. Pyrolysis oil can be used as a fuel, and it has properties that are similar to those of conventional fuels. The gas can be used to partially cover the energy demands of the process, while the solid product (char) can either be sold or used to produce activated carbon and other useful products. The conversion of plastic waste into valuable products and energy carriers through the pyrolysis process contributes to the reduction in the negative environmental impacts of the waste and to the reduction in fossil fuel use [6,7,8].
The utilization of plastic waste through pyrolysis can promote the transition to a circular economy that emphasizes industrial symbiosis. Industrial symbiosis is a part of industrial ecology, and it aims to foster cooperation between enterprises through the physical exchange of materials, energy, and/or by-products by using neighboring geographical advantages. Material symbiosis includes the use of by-products or waste generated by upstream production units as raw materials for downstream production. Energy symbiosis promotes the improvement of energy efficiency in industry, through the optimization of energy exchange networks in line with the overall supply–demand relationship. In the concept of energy symbiosis, industrial plants are urged to adopt the model of energy cascading and cogeneration, and thus improve their energy utilization efficiency [8,9].
A graphical conceptual representation of plastic waste treatment via pyrolysis in a circular economy and industrial symbiosis is presented in Figure 1. Several industrial plants that produce plastic waste can offer their waste as feedstock to a pyrolysis plant, ensuring an efficient and environmentally safe utilization route for their waste. The pyrolysis oil can be sold, providing a source of revenue for the pyrolysis plant. As mentioned, it can be used to generate heat and electricity, or it can be upgraded to produce fuels. Apart from the oil, a pyrolysis plant can generate two additional products, which can be used efficiently within the concept of industrial symbiosis. The gaseous product can be utilized to cover the energy demands of the pyrolysis plant. It can potentially also be used by neighboring industrial plants as a source of thermal energy, thus reducing their operating costs and dependence on fossil fuels, such as natural gas. Lastly, the char can be offered to neighboring plants and used as fuel. It can also be used as feedstock in a plant that produces activated carbon.
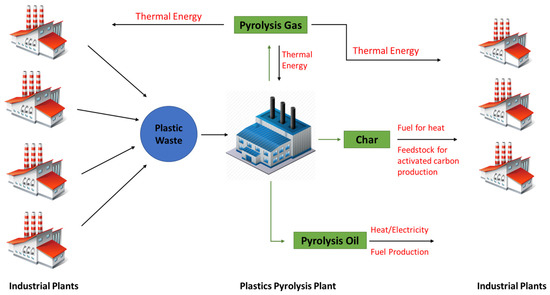
Figure 1.
Conceptual representation of plastic waste pyrolysis in a circular economy and industrial symbiosis model.
Countries (governments and companies) must implement circular economy pathways to reduce waste, conserve biodiversity, maintain environmental quality, and achieve economic sustainability. Investment in alternative energy sources including bioenergy, must be prioritized [10].
Different approaches can be used to mitigate and reduce the global environmental impacts of plastic waste. These include taxes on plastic products, especially plastic packaging, incentives to reuse and repair, target values for recycled products, extended producer responsibility, improved waste management infrastructure and schemes, and increased litter collection rates [11]. However, the successful implementation of such policies on a larger scale is still a significant challenge. Furthermore, the lack of plastic waste treatment infrastructure is an important issue, as efficient large-scale plastic waste recycling pathways are still scarce [12].
In the European context, the EU has proposed several policies and actions towards the more sustainable management of plastic waste, where the focus is plastic reuse and recycling. The Action Plan for a Circular Economy, which was adopted in December 2015, identified the management of plastic waste as an area of high priority and focused on combating the potential challenges that arise from plastics throughout their value chain and their entire life cycle. The Plastics Strategy of 2018 outlined the transition to a circular plastics economy, made commitments for action at the EU level and recommended measures to national authorities and industry, to make plastic waste recycling profitable for businesses. The Revised Waste Framework Directive, which was passed in May 2018, updated the rules for waste management in the EU, including the management of plastic waste. The European Green Deal was presented in December 2019 and set out a roadmap for no net emissions of greenhouse gases by 2050. The Plastics Strategy aims at implementing new legislation, as well as specific targets and measures for tackling over-packaging and waste generation. Moreover, it promotes the strengthening of legal requirements to boost the market for secondary raw materials with mandatory recycled content, as well as guarantee that all packaging in the EU market is reusable or recyclable in an economically viable manner by 2030 [13,14].
In Greece, there are efforts underway to minimize the generation of plastic waste and promote its proper management and utilization. The Extended Producer Responsibility (EPR) Law 2939/01 obliges producers to finance the collection and recycling of waste through EPR schemes. The New Recycling Law 4496/2017 introduced a national plan for a four-stream collection system, including paper, glass, metals, and plastics. It also sets new targets, as 74% of the waste produced must be diverted from landfills. Moreover, the Landfill tax 4042/2012 proposed a 35 €/t tax for landfilling untreated waste, aiming to reach up to 60 €/t, but it was never rolled out. The government has also made active efforts to cease operations of illegal dump sites or convert them [3]. However, despite the introduction of such initiatives, there are still several challenges that hinder their proper implementation, such as low capacity and stakeholder pushback [4,5]. Additionally, the country still has limited infrastructure for recycling or utilizing plastic waste to generate useful products.
In order to promote the establishment of pyrolysis and other installations for the treatment of plastic waste, it is vital to determine the optimal conditions for their operation and assess the feasibility of such systems [4].
The aim of this study is to estimate the economic feasibility of polypropylene (PP) plastic waste utilization using pyrolysis for closing loops in energy and materials. PP is a thermoplastic polymer with properties such as fire resistance, simplicity, high heat distortion temperature, and dimensional solidity and accounts for 16% of the worldwide plastics market [1]. Petrochemical companies have generated an increasing demand for PP products and have raised environmental concerns related to PP waste.
This study is part of a Greek project entitled “Utilization of plastic and rubber waste for the production of alternative liquid fuels and adsorbent materials with innovative processes within the framework of the circular economy and industrial symbiosis model - ACTOIL”. It is, therefore, focused on the development of a PP waste pyrolysis plant in Greece, within the context of circular economy and industrial symbiosis, by utilizing the industrial sector’s plastic waste, such as PP waste from HELLENIC OILS, which is a Greek company responsible for the refining, supply and sales of petroleum and petrochemical products. The company produces considerable PP waste, which could be used as feedstock for a pyrolysis plant in Greece. Through economic assessment, it is possible to evaluate whether such installations can be profitable, to identify potential areas of improvement and to outline the optimal plant capacities. Overall, the aim of this study is to contribute to supporting developers and investors in the establishment of plastic waste pyrolysis plants. The findings of the study stress the potential of the pyrolysis of plastic waste and can, thus, play a pivotal role in the promotion of circular economies of plastic waste in the Greek context and in other countries.
In this paper, comprehensive information on the study’s data, theoretical background, and methodology is provided. A literature review is provided in Section 2 to help position the paper. In Section 4, the economic analysis provides detailed insights and useful data for decision-makers and investors and in Section 5, the main findings derived from the economic evaluation are depicted.
2. Literature Review
Through a literature review, this paper identifies the most important parameters that affect the quality and yields of pyrolysis products. It also provides a critical overview on the optimal pyrolysis conditions required to produce oil. Thus, the results of the literature review were used as guidelines for the selection of pyrolysis operating parameters for different types of plastic waste feedstocks. Furthermore, the feasibility of a PP pyrolysis plant is examined through a preliminary techno-economic assessment.
The selection of relevant papers for the literature review was made (Chapter 2). In Chapter 3 of the report, the effect of the different parameters that affect pyrolysis product yields is presented, as well as an overview of the optimal conditions for oil production based on the literature review. Chapter 4 includes a feasibility assessment of a polypropylene pyrolysis plant located in Greece, while Chapter 5 provides conclusions and suggestions.
The feedstocks that were considered were as follows: polypropylene (PP), polystyrene (PS), polyethylene terephthalate (PET), poly-vinyl chloride (PVC), high-density polyethylene (HDPE), low-density polyethylene (LDPE) and mixed plastic waste, but the focus was on PP.
Internet search engines and electronic libraries were used for the review of relevant articles and journals. Scopus, ScienceDirect and Google Scholar were used to research plastic waste pyrolysis, focusing on publications between 2012 and 2022. The following keywords were used: ‘plastic waste’ AND ‘pyrolysis’, ‘polypropylene’ AND ‘pyrolysis’, ‘polystyrene’ AND ‘pyrolysis’, ‘polyethylene terephthalate’ AND ‘pyrolysis’, ‘poly-vinyl chloride’ AND ‘pyrolysis’, ‘high-density polyethylene’ AND ‘pyrolysis’, ‘low-density polyethylene’ AND ‘pyrolysis’, ‘mixed plastics’ AND ‘pyrolysis’. The contribution of the published articles for each search term is presented in Figure 2. An increasing trend in the number of articles can be observed, with the highest number of articles of interest published in 2021 and 2022. Mixed plastic waste was the most common type of feedstock encountered in the articles, followed by polypropylene and polystyrene.
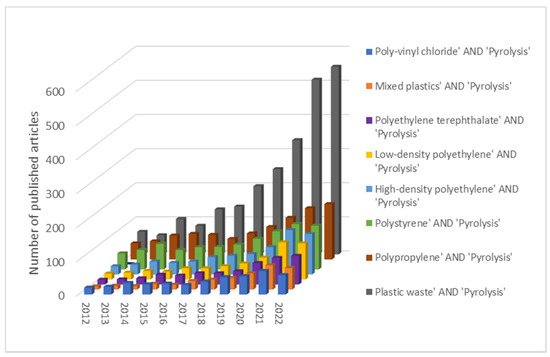
Figure 2.
Annual contribution of the published articles of interest in the period 2012–2022.
The number of articles was 7656 and after an initial screening process based on the titles and abstracts, the number decreased to 295. A second screening process was carried out, in order to define the most relevant articles related to the effect of pyrolysis parameters on product yields and properties. Eventually, 44 articles were chosen for the plastic waste pyrolysis literature review. The distribution of the selected articles per year of publication and per type of feedstock is presented in Figure 3 and Table 1, respectively.
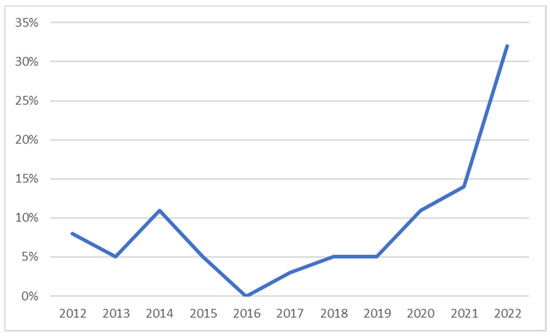
Figure 3.
Share of the articles used in the study per year of publication.

Table 1.
Share of the articles used in the study per type of feedstock.
Most of the articles considered within this study were published in 2022 (32%), followed by 2021 (14%), 2020 and 2014 (11% each). Polypropylene (PP) and low-density polyethylene (LDPE) were the most common feedstocks in the relevant articles.
3. Literature Review Findings on Plastic Pyrolysis Maximizing the Oil’s Yield
Pyrolysis is a thermochemical process that involves the deconstruction of molecular chains of materials by heating them in an oxygen-free environment. Typically, the temperature of pyrolysis varies between 300 °C and 800 °C. The products of pyrolysis are a liquid product, called pyrolysis oil, a solid product called char and a gaseous product. Pyrolysis oil can be used for the production of electricity or thermal energy. It can also undergo further processing to produce a fuel with similar properties to conventional fuels, i.e., diesel, gasoline or kerosene [15,16]. The gaseous product, which consists mainly of carbon monoxide and carbon dioxide, hydrogen, and hydrocarbons, has a relatively high calorific value and can, therefore, be exploited to meet part of the energy needs of the process [17]. The solid product of pyrolysis can be used as a fuel or as raw material for the production of activated carbon and other useful products [18]. In the pyrolysis process, an inert gas is always used, which does not participate in the reaction and in most cases, this gas is nitrogen [15].
The type of raw material, the conditions of pyrolysis (i.e., temperature, heating rate, duration and pressure), the type of reactor and the use of a catalyst are parameters that affect the yield and properties of the products, as well as their final composition [19,20].
3.1. Temperature and Heating Rate Effect on Pyrolysis
The temperature of pyrolysis significantly affects the product yields. Temperatures between 300 °C and 600 °C are preferred if the desired product is pyrolysis oil, while temperatures above 600 °C favor the formation of gaseous products. In addition, the heating rate and the duration also affect the pyrolysis process. In general, oil production is favored by intermediate temperatures, short residence times and relatively high heating rates, while the optimal yields of liquid products can be observed at temperatures between 450 °C and 600 °C [21]. On the contrary, gaseous products are favored by very high temperatures and long residence times [22], while low heating rates at low temperature with long residence times lead to char production [18]. Temperature, residence time and heating rate determine the type of pyrolysis (Table 2).
Table 2.
Types of pyrolysis [15,20,21].
3.2. Impact of the Type of Plastic Waste on Pyrolysis Process
The type of feedstock, as well as its characteristics and composition, have a significant impact on the pyrolysis process. It affects the yields, as well as the properties of the products. In the context of this study, different types of plastic waste were examined as feedstocks in the pyrolysis process.
A significant advantage of pyrolysis compared to other methods of plastic waste management is that no sorting process is required, and different types of plastics can be used simultaneously as feedstocks of the process [23]. Nevertheless, the type of plastic that is used can affect product yields, as well as their properties and quality. A high volatile content in the raw material favors the formation of pyrolysis oil, while on the contrary, a high content of ash leads to an increased yield of gas and solid products [15]. The list of plastics used in pyrolysis processes, as well as some of their applications, are presented in Table 3. The proximate analysis of the different types of plastic is presented in Table 4.
Table 3.
Types of plastic and their applications [19,24,25].
Table 4.
Proximate analysis of different types of plastic [19,21].
PET and PVC have the lowest volatile content; therefore, it is expected that their pyrolysis will favor the formation of gaseous and solid products. In addition, the pyrolysis of PVC results in the release of harmful products, such as HCl, as well as the formation of chlorobenzene in pyrolysis oil, which is toxic to the environment. The use of PVC pyrolysis oil requires further processing, adding further costs to the process [26]. PP, PS, HDPE and LDPE have a high volatile content, reaching up to 99.8 wt. %, indicating their suitability for the production of pyrolysis oil.
As mentioned, the properties of pyrolysis oil are significantly influenced by the type of plastic used as feedstock, as shown in Table 5. The higher heating value (HHV) of the pyrolysis oil from HDPE, LDPE, PS and PP is usually within the range of 39–43 MJ/kg, which is similar to conventional fuels, such as gasoline and diesel. In contrast, the thermal content of PVC and PET pyrolysis oil is significantly lower (21.8 MJ/kg and 28.2 MJ/kg, respectively).
Table 5.
Properties of plastic pyrolysis-derived oil and comparison with conventional fuel-derived oil [15,20,21].
3.3. Pyrolysis Reactor’s Effect on Pyrolysis
The type of reactor used for pyrolysis significantly affects the performance and duration of the process, as well as the properties of the final products. Based on the conditions, the scale of production and the desired end products, the selection of the appropriate type of reactor can be made.
Batch reactors are closed systems where there is no flow of reactants or products during the reaction. Semi-batch reactors allow the addition of reagents and the removal of products during operation, giving them greater flexibility. An important advantage of these types of reactors is the ease of controlling the parameters of pyrolysis, leading to high yields and conversion rates. However, the high operating costs make this type of reactor better for small- and laboratory-scale applications [19].
Fixed-bed reactors are used extensively, especially in the case of catalytic pyrolysis. Despite their simple design, they have some disadvantages since the available surface of the catalyst during the reaction is limited. Fluidized-bed reactors use a fluidizing gas that ensures better mixing of the catalyst with the raw material, and thus a more efficient reaction. This type of reactor ensures good temperature control and is more flexible than batch and semi-batch reactors. In general, fluidized-bed reactors are preferred for large-scale applications, mainly from an economic point of view [17,19].
Rotary kiln reactors present several advantages, such as simple construction, low purchase costs, simple operation, and feedstock flexibility. These reactors are heated using solid heat carriers. In addition, the rotational movement of the furnace improves the mixing between materials and heat dissipation, while at the same time preventing the formation of agglomerates. It should be noted that the filling rate of this type of reactor significantly affects the performance and quality of the finished products. The ideal filling rate for oil production is about 15–20%, ensuring optimal heat transfer [27].
3.4. Catalyst’s Effects on Pyrolysis
Pyrolysis is an energy-intensive process and catalysts contribute significantly to its optimization, as they limit the energy requirements. For example, optimal yields in pyrolysis oil can be achieved even at temperatures below 450 °C using the appropriate catalyst [17,28].
Catalysts are used in the pyrolysis of plastic waste to accelerate the rate of reactions. Their presence significantly enhances the efficiency of the process and reduces the required reaction time and degradation temperature of the raw material, while at the same time improving the quality of the fuel.
Several studies have reported that the ratio of raw material to catalyst significantly affects both the yield and the composition of pyrolysis products. The increase in the amount of catalyst is not linearly related to process efficiency. Usually, an increase in efficiency is observed up to a certain amount of catalyst, while further addition does not affect the reaction [20]. Various catalysts, such as natural zeolite (NZ), FCC, Cu-Al2O3, Fe2O3, MCM-41, ZSM5, HZSM-5 and Al(OH)3Ca(OH)2, have been used in plastic waste pyrolysis processes [15,17,19,28].
3.5. Pyrolysis Oil
The results of the literature review on plastic waste pyrolysis are disaggregated based on the type of plastic used. The parameters studied are the type of reactor, the use of catalyst, and the temperature of the pyrolysis process.
3.5.1. Polypropylene (PP) Pyrolysis Oil Yields
Polypropylene is used extensively as feedstock for pyrolysis, as typically very high yields in pyrolysis oil are achieved. Optimal oil production can usually be achieved at temperatures ranging from 450 °C to 550 °C.
Generally, very low pyrolysis temperatures are not preferable, since in these cases, the formation of gaseous products is favored. Ahmadis et al. [29] performed PP pyrolysis at 300 °C, with a heating rate of 20 °C/min, and the process yield of oil reached 69.9 wt.%. The increase in temperature resulted in the improved production of oil, as at 380 °C, the yield reached 80.1 wt.% [30]. Similarly, Kusenberg et al. [31] reported an oil yield of 87 wt.% at 450 °C, using a CSTR reactor. Pyrolysis at 500 °C [32] and 550 °C [33] resulted in oil yields of 82.1 wt.% and 92 wt.%, respectively. It should be noted that excessively high temperatures can negatively affect the process. As demonstrated by Demirbas [34], the oil yield fell to only 48.8 wt.% at 740 °C, as gas production was favored (49.9 wt.%).
Catalytic pyrolysis of PP has several advantages since optimal yields are achieved at lower temperatures. In a semi-batch reactor, an FCC catalyst was used, achieving the optimal oil yield (85 wt.%) at 400 °C [35]. Abbas-Abadi et al [36], by using the same type of catalyst and reactor, achieved improved oil production (92.3 wt.%), due to the higher operating temperature (450 °C). The use of natural zeolite for catalytic pyrolysis at 430 °C resulted in an oil yield of 72.2 wt.% in a semi-batch reactor [37].
3.5.2. Polyvinyl Chloride (PVC) Pyrolysis Oil Yields
PVC is not generally used as feedstock for pyrolysis, due to its relatively low oil yield and the production of toxic by-products. Thermal degradation of polyvinyl chloride is estimated to take place at temperatures between 220 °C and 520 °C [19]. During PVC pyrolysis at 500 °C and in a fixed-bed reactor, very low oil production was observed, with a yield of 12.3 wt.%, while the main product of the process was gas (87.8 wt.%) [24]. Marino et al. [38] used a fixed-bed reactor with a ZSM-5 catalyst at 450 °C with significantly improved results. The process yield of oil was 60 wt.% and the yield of gas was 35 wt.%, in which a high HCl content was observed.
3.5.3. Polystyrene (PS) Pyrolysis Oil Yields
Unlike PET and PVC, polystyrene pyrolysis displays very high yields of oil. For its thermal breakdown, temperatures between 350 °C and 500 °C are required, while it is estimated that the pyrolysis temperature should not exceed 550–600 °C to achieve maximum oil yields [19]. Generally, PS pyrolysis oil yields vary between 90 wt.% and 99 wt.%. In a batch reactor, an oil yield of 89.5 wt.% was observed at 580 °C [34], while at a lower temperature (450 °C), the yield of liquid products was 56 wt.% [39].
The use of a catalyst during the pyrolysis of PS reduces the required reaction time, but there is a slight improvement in the oil yields of the process. Terapalli et al. [40] used PS as feedstock for pyrolysis at 600 °C in a microwave reactor, using KOH as a catalyst. The oil yield reached 95.2 wt.%, using a heating rate of 31 °C/min and 7.5 gr of KOH for 27.5 gr of PS. In these conditions, the gas and char yields were 3.5 wt.% and 1.3 wt.%, respectively. Adnan, Shah and Jan [41] used a Zn catalyst in a batch reactor at 500 °C. The yields of the oil and gas products were 96.7 wt.% and 3.3 wt.%, respectively. A similarly high oil yield was observed with the use of an MgO catalyst in a fixed-bed reactor. PS pyrolysis took place at 400 °C and 500 °C. The final yield of oil was 93 wt.% in both cases, while gas production increased from 2 wt. % to 5 wt.% [35]. Finally, Miandad et al. [28] studied PS pyrolysis at 450 °C using the following two different catalysts: (i) natural zeolite with heat treatment at 500 °C for 5 h (TA-NZ) and (ii) natural zeolite with treatment with 0.1 m HNO3 for 48 h (AA-NZ). The highest oil yield observed was 70 wt.% and this was achieved using the TA-NZ catalyst. However, while the yield of the liquid product with the AA-NZ catalyst was lower (60 wt.%), the HHV of the oil produced (42.1 MJ/kg) was higher.
3.5.4. Polyethylene Terephthalate (PET) Pyrolysis Oil Yields
As mentioned, the use of PET as a pyrolysis feedstock is not preferred, mainly due to its low content of volatile components and its generally low oil yield compared to other plastics. However, there have been some studies that have examined the utilization of PET via pyrolysis.
It has been observed that the thermal breakdown of PET takes place in a temperature range between 350 °C and 520 °C [19]. Çepelioğullar and Pütün [17] used a fixed-bed reactor at a temperature of 500 °C with a heating rate of 10 °C/min. The main product was gas, with a yield of 76.9 wt.%, while the yield for oil was found to be 23.1 wt.%. Furthermore, a high content of benzoic acid was observed in the oil produced (49.93 wt.%), giving it a strongly acidic character. Additionally, Shahbaz et al. [42] studied PET pyrolysis at 450 °C, with a heating rate of 10 °C/min, achieving an oil yield of 18 wt.%. Finally, PET pyrolysis, using a fixed-bed reactor at 500 °C and at a heating rate of 6 °C/min, resulted in oil production of 39.89 wt.%, while at the same time, yields for the gas and solid products were 52.13 wt.% and 7.98 wt.% [32], respectively.
3.5.5. Low Density Polyethylene (LDPE) Pyrolysis Oil Yields
The use of low-density polyethylene as feedstock for pyrolysis has been studied extensively. In general, it is estimated that the thermal breakdown of LDPE takes place from 360 °C up to 550 °C [19] and optimal yields of oil are achieved between 500 °C and 550 °C. Based on the study by Bagri and Williams [43], LDPE pyrolysis at 500 °C and in a fixed-bed reactor produces 95 wt.% oil and 5 wt.% gas. In addition, FakhrHoseini and Dastanian [30] observed an oil yield of 80.4 wt.% at 500 °C, while in another study in a fluidized-bed reactor, it was observed that a very high temperature (600 °C) led to a significant decrease in oil yields to 51 wt.% [44]. It should also be noted that the pressure of the process affects the quantity of the products. Odejobi et al. [33], while performing pyrolysis at 450 °C, managed to achieve oil yields of approximately 41 wt.%, with gas production reaching 57 wt.%.
According to Wu et al. [45], the use of HZSM5 as a catalyst helped to increase the process oil yields in a fixed-bed reactor. At a temperature of 550 °C and a heating rate of 20 °C/min, oil production reached 93.42 wt.%. Similarly, in another study, the combination of an HZSM5 catalyst with a relatively high temperature (550 °C) again resulted in a very high oil yield of 93.1 wt.% [46].
3.5.6. High-Density Polyethylene (HDPE) Pyrolysis Oil Yields
Like LDPE, HDPE is used extensively for pyrolysis oil production. In the absence of a catalyst, Dzol et al. [46] achieved an oil yield of 90 wt.% at 500 °C in a fixed-bed reactor. On the other hand, when using HZSM5 or waste chicken eggshells (WCE) as catalysts, optimal results were obtained with WCE, providing an oil yield of 80 wt.% [47]. According to Mastral et al. [48], oil production dropped to 68.5 wt.% when the process was performed at 650 °C and with a duration of 20 min. Using an MIL-53 (Cu)-derived zeolite Y catalyst at 500 °C [49], the oil yield reached 95.3 wt.%, while with the HZSM5 catalyst at 550 °C [46], oil production was 85 wt.%. Abbas-Abadi et al. [41] studied HDPE pyrolysis, where the process took place in a semi-batch reactor at 450 °C and with an FCC catalyst. In this case oil, the gas and solid product yields were 91.2 wt.%, 4.1 wt.% and 4.7 wt.%, respectively.
3.5.7. Mixed Plastic Waste Pyrolysis Oil Yields
In many cases, a mixture of plastics can be used as the feedstock of pyrolysis. For example, Donaj et al. [50] performed pyrolysis of an LDPE/HDPE/PP mixture in a fluidized-bed reactor. Without the use of catalyst, the optimal oil yield, 48.4 wt.%, was reached at 650 °C, while using a Ziegler–Natta catalyst, oil production increased to 89 wt.% at the same temperature. It should also be noted that the same series of experiments were carried out at 730 °C with lower yields.
Moreover, the PE/PP/PS mixture has been extensively studied, showing generally low yields of oil. With the PE-PP/PS mixture (75 wt.%/25 wt.%), Kaminsky, Schlesselmann and Simon [51] achieved a yield of 48.4 wt.% of oil, performing pyrolysis in a 730 °C fluidized-bed reactor. Similar results, with an oil yield of 46.6 wt.%, were reported by Demirbas [32] in a batch reactor. Based on the findings of the literature review, the use of a catalyst does not significantly affect the oil yields of the process in this case. In a batch reactor, at 450–500 °C and using natural zeolite as a catalyst, Nugroho, Pratama and Saptoadi [52] reported that oil production reached 45.1 wt.%, as the gaseous product was favored (50 wt.%). Miandad et al. [28] used the PS/PE/PP mixture (50 wt.%/25 wt.%/25 wt.%) at 450 °C with a natural zeolite catalyst. The yields of oil, gas and solid products were 44 wt.%, 37 wt.% and 19 wt.%, respectively.
3.5.8. Selection of Pyrolysis Operating Conditions for Maximizing Oil Production
Based on the results of the literature review, pyrolysis parameters were selected on the basis of maximizing oil yields. An overview of all the results with the optimal conditions for oil production are depicted in Table 6.
Table 6.
Literature review results of catalytic and non-catalytic plastics pyrolysis.
In the study of Miandad et al. [28], where various mixtures of plastics were examined, oil yields of less than 55 wt.% were obtained. Optimal results were reported for the following two cases of pyrolysis at 450 °C: (i) a PS/PE mixture (50 wt.%/50 wt.%) with a catalyst of natural zeolite treated with HNO3, producing an oil yield of 52 wt.%, and (ii) a PS/PP mixture (50 wt.%/50 wt.%) with a natural zeolite catalyst and heat treatment, resulting in an oil yield of 54 wt.%.
Polypropylene (PP) pyrolysis displays very high yields of pyrolysis oil. The properties of the oil are similar to those of conventional fuels. The optimal temperature range for PP pyrolysis is from 450 °C to 550 °C, where oil yields from 82 wt.% to 92.3 wt.% were reported. For temperatures below 450 °C, lower yields were observed (<80 wt.%), while at much higher temperatures (740 °C), the gas production increases significantly, limiting the formation of oil. The use of an FCC catalyst significantly affects the process, achieving an oil production value of 92 wt.% at 450 °C.
The pyrolysis of PVC and PET favors the production of gaseous products, with yields ranging between 55 wt.% and 88 wt.%. Oil production is limited to the range of 12-40 wt.%. The process is carried out at 450–500 °C. During the pyrolysis of PVC, harmful by-products are released, such as HCl in the gas product and chlorobenzene in the oil. Their removal is vital and significantly adds to the overall cost of the process.
The pyrolysis of PS, regardless of the type of reactor and the presence of a catalyst, typically has oil yields ranging from 60 wt.% up to 98.7 wt.% for temperatures of 450–600 °C. Optimal oil yields are reported at temperatures from 550 °C up to 600 °C, while the use of catalysts such as FCC and Zn allows the process to be carried out at lower temperatures with high oil production. In general, polystyrene showed the highest oil yields compared to other plastics.
Both LDPE and HDPE pyrolysis result in high oil yields, typically exceeding 80 wt.% for temperatures of 450 °C to 550 °C. In the case of LDPE, the increase in pressure and the presence of a catalyst has a positive effect on the oil yield; oil production of 93.1 wt.% can be achieved at 550 °C, using an HZSM5 catalyst. The use of an FCC, Si-Al or HZSM5 catalyst during HDPE pyrolysis resulted in oil yields higher than 85 wt.% for temperatures ranging from 450 °C to 550 °C. The yields of oil for LDPE pyrolysis (73.6 wt.%) are higher than PP (73 wt.%) and HDPE (71.5 wt.%).
Compared to the pyrolysis of a single type of plastic, the use of a mixture of plastics shows much lower oil yields, which are usually in the range of 30–50 wt.%. Optimal pyrolysis temperatures are in the range of 450 °C–650 °C. When using a Ziegler–Natta catalyst at 650 °C, the oil yields are 90 wt.%. The properties of the final product show many similarities with those of conventional fuels.
4. Feasibility Study for a PP Pyrolysis Plant in Greece
A preliminary economic assessment was carried out for a PP pyrolysis plant. The assessment was conducted for different plant capacities. The economic performance of the plant was evaluated based on the following economic indicators: the initial investment, the operating costs, annual cash inflows, gross and net profits, return on investment (R.O.I) and pay-out time (P.O.T).
R.O.I is an indicator used to measure the profitability of a particular investment and is used to express the percentage of the initial investment that can be recovered over one year. Generally, a positive R.O.I denotes an investment that is profitable. However, if similar investments occur with a higher R.O.I, these are preferable [55].
P.O.T is an indicator used to measure the period required for the profit or other benefits of an investment to equal the cost of the investment. A smaller P.O.T is a sign of a more attractive investment opportunity [55].
By studying the effect of the plant’s capacity on the two indicators, it was possible to determine a range for the preferred capacity of the pyrolysis plant. The present study examines the following two scenarios:
- Scenario 1: Pyrolysis gas is used to meet the energy requirements of the process. If there is further availability, then the remaining amount of gas is sold.
- Scenario 2: the entire amount of pyrolysis gas is sold.
4.1. Hypotheses of the Study
The pyrolysis plant utilizes PP waste from HELLENIC OILS, which is a Greek company responsible for the refining, supply and sales of petroleum and petrochemical products. The company produces considerable PP waste, which could be used as feedstock for a pyrolysis plant in Greece. In the context of circular economy and industrial symbiosis models, the pyrolysis plant receives the waste from HELLENIC OILS and utilizes it to generate the following three main products: pyrolysis oil, pyrolysis gas and char. Liquid and solid products are sold and are an important source of revenue for the unit. Pyrolysis gas can either be sold or used to meet the energy requirements of the process either partially or completely.
The hypotheses of the study are as follows:
- ❖
- The capacity selected for the PP pyrolysis plant is 200,000 t/year; the process followed to make this selection is shown in Chapter 4.3.7.
- ❖
- Based on the literature review, the optimal pyrolysis temperature for oil production is 500 °C; the process takes place at atmospheric pressure.
- ❖
- According to the literature review findings, the oil yield is to be considered equal to 86 wt.%, the gas yield is equal to 13.9 wt.% and the char yield is equal to 0.1 wt.%.
- ❖
- A rotary kiln reactor was chosen, due to its extensive use and advantages, such as simple construction, low purchase costs and simple operation.
- ❖
- It was assumed that product yields are not affected by the increase in plant capacity.
- ❖
- The unit operates for 330 days and 24 h/day.
- ❖
- The facility is in Greece.
- ❖
- PP waste transportation costs are negligible, assuming that this cost is integrated into the price of the PP waste.
A general overview of the characteristics of the studied plant is given in Table 7.
Table 7.
Characteristics of PP pyrolysis plant under study.
4.2. Description of the PP Pyrolysis Plant
Figure 4 shows the generalized flowchart for a PP pyrolysis unit. A brief description of the devices used, as well as the process currents, is also presented.
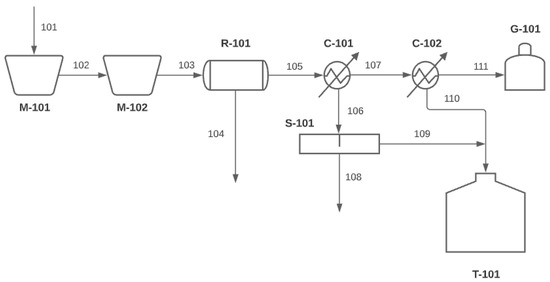
Figure 4.
Generalized flowchart of the pyrolysis process [56,57,58].
The main types of equipment used in the process are as follows:
- M-101: shredder—used to shred the feedstock and facilitate its energy utilization.
- M-102: feed hopper.
- R-101: rotary kiln reactor where the pyrolysis process takes place.
- C-101: Condenser—the gases produced in the reactor are fed into C-101. The resulting condensate contains a percentage of water and is, therefore, led to a separator to be removed.
- C-102: Condenser—the gaseous product that was not condensed in C-101 is fed into C-102. The condensate does not contain water and is driven into an oil collection container.
- S-101: oil/water separator—used to remove the water from the pyrolysis oil.
- T-101: pyrolysis oil collection container.
- G-101: gas storage container—the gas can either be sold or used to meet the reactor’s energy requirements.
The main process streams, as depicted in the flowchart, are as follows:
- 101: feedstock (industrial PP).
- 102: shredded feedstock.
- 103: feed stream of the pyrolysis reactor.
- 104: solid residue of pyrolysis (char), which can either be stored for further processing or sold directly.
- 105: main product of pyrolysis, which contains the products of the process in gaseous form and is led to the condensers.
- 106: contains water and pyrolysis oil and is led to a separation device.
- 107: contains gases and pyrolysis oil in gaseous form and is led to the second condenser for further separation.
- 108: contains water that is removed.
- 109: contains pyrolysis oil for storage.
- 110: contains pyrolysis oil resulting from the condenser; the product is fed to the storage tank.
- 111: contains the gaseous product of pyrolysis that is either stored or used to meet the energy requirements of the process.
4.3. Preliminary Economic Assessment
A preliminary economic assessment was carried out, considering the initial investment, the operating costs, annual cash inflows and gross and net profits, as well as two economic indicators, which are R.O.I (return on investment) and P.O.T (pay-out time). Moreover, the effect of plant capacity on the economic performance was also considered.
4.3.1. Initial Investment (CAPEX)
The Chemical Engineering Plant Cost Index (CEPCI) was used to calculate the investment requirements for the PP pyrolysis plant. The initial investment of one unit for 2022 can be calculated from the following equation:
where IF,2022 is the investment for the year 2022 and IF,X the investment for the year X, for which bibliographic data were found. As no values are available for the CEPCI index for 2022, it is possible to make an estimate based on the data presented in Figure 5, showing that CEPCI2022 = 651.4.
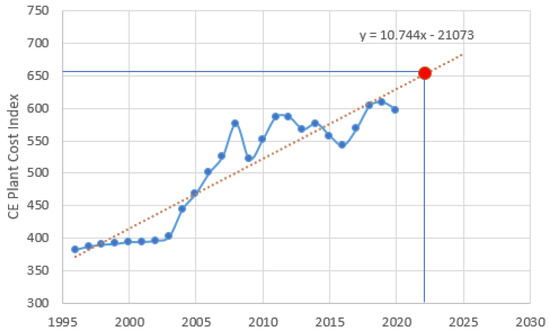
Figure 5.
CEPCI indicators for 1996–2020 [59].
The initial investment is directly related to the capacity of the pyrolysis plant. Table 8 shows the investment requirement for units of different capacities, based on the literature review. Using the CEPCI indicators, all values are transposed and refer to 2022.
Table 8.
Initial investment for pyrolysis units of different capacities.
Using the data in Table 8, it is possible to make an estimate of the relationship between capacity and the investment requirement for a plastics pyrolysis plant. This can be achieved based on the equation obtained from Figure 6, which is as follows:
where IF,2022 is the initial investment for 2022 and Q is the plant capacity (t/day). Consequently, the initial investment for the PP pyrolysis plant with the selected capacity of 200,000 t per year is IF = 45.9 M€. It should be noted that the investment is the same for both PP pyrolysis scenarios considered.
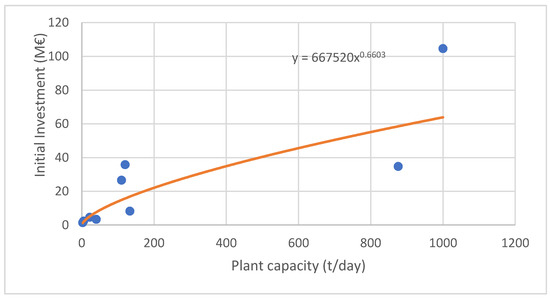
Figure 6.
Relation of plant capacity and initial investment.
4.3.2. Operating Costs (OPEX)
The next step in the economic assessment of the pyrolysis plant is to determine the operating costs. This category of expenses includes labor, raw materials, and the cost of utilities, as well as some additional costs.
Operating expenses differ between the two scenarios, due to the difference in costs for utilities. In scenario 1, where pyrolysis gas is used to meet the energy requirements of the process, natural gas is not used, thus reducing costs by approximately 3 M€. The overall operating costs for the two scenarios are presented in Table 9 [67]. The detailed calculation methodology is presented below.
Table 9.
Overview of PP pyrolysis operating costs.
Labor Costs
The man-hours are calculated using the Wessels method with the following equation [67]:
The days of operation were considered to be 330, the stages to be 3, the parameter α equal to 11, and the capacity of the unit to be 606 t/day. Using the man-hour price for Greece [68], the total labor costs were defined, as observed in Table 10.
Table 10.
Labor costs calculation.
Feedstock Costs
To determine the cost of the raw material, the price of PP scraps was taken as 175 €/t [69]. Based on the capacity of the unit and the feedstock price, it was calculated that the total annual feedstock costs amount to 35 M€.
Utilities Cost
The utilities required for the operation of the pyrolysis plant are electricity, cooling water and natural gas for heating the reactor.
It is estimated that a pyrolysis plant requires 28 kWh of electricity and 13 m3 of cooling water per t of feedstock [63]. Considering the cost of electricity of 0.13 €/kWh [70] and the cost of water of 0.98 €/m3 [71], the annual costs were 728,000 €/year and 2.55 M€/year respectively. The electricity requirements (28 kWh/t) do not include the cost of operating the shredder. It is estimated that this expenditure amounts to approximately 15 €/t of raw material [72], adding 3 M€ to the annual costs of utilities.
In addition, for the calculation of the annual cost of natural gas, it is required to determine the energy requirements of the process. For this, the following equation was used:
All the required data for this calculation are presented in Table 11.
Table 11.
Calculation of PP pyrolysis energy requirements.
The energy requirements for the pyrolysis reactor (Q = 6.67 MW) can be met either using pyrolysis gas (scenario 1) or by natural gas (scenario 2).
Based on bibliographic data, it is estimated that the calorific value of pyrolysis gas is 26 MJ/kg [76,77,78]. Given that the amount of pyrolysis gas produced is 84 t/day, the gas can provide about 25 MW, thus fully meeting the energy requirements of the reactor. Consequently, the cost to heat the pyrolysis reactor is zero for scenario 1.
In scenario 2, natural gas is used. The calorific value of natural gas is 31.7 MJ/m3 [79], while its price is 0.53 EUR/m3 [80]. The total cost of the PP pyrolysis plant utilities is shown in Table 12. The utilities costs are significantly lower for scenario 1.
Table 12.
Utility costs for PP pyrolysis unit for scenarios 1 and 2.
4.3.3. Cash Inflow
The revenue of the PP pyrolysis plant originates from the sale of the three products. Based on the quantities produced and their respective selling prices, it is possible to calculate the annual cash inflow of the installation, as shown in Table 13.
Table 13.
Total cash inflows of the PP pyrolysis unit.
In scenario 1, part of the pyrolysis gas is used to meet the energy requirements of the processes and the remaining amount is sold. In scenario 2, the entire amount of pyrolysis gas is sold, leading to higher cash inflows for the plant.
4.3.4. Net Profits
Based on the total cash inflows (S) and operating costs (C), it is possible to calculate the annual gross profit of the PP pyrolysis plant for both scenarios, as shown by the equations below:
The net annual profit of the installation is calculated with the following equation:
The following assumptions were made for this calculation:
- The economic life of the plant is N = 15 years.
- Depreciation is linear.
- The uniform tax rate is t = 0.4.
- The depreciation rate for tax purposes is d = 1/N = 0.06.
- The depreciation rate of the fixed investment is e = d.
4.3.5. Financial Indicators
To assess the viability of the PP pyrolysis plant, two economic indicators were also examined, namely the return based on the initial investment (R.O.I) and payback time (P.O.T). These indicators are calculated as follows:
Initially, the return based on the initial investment (R.O.I) is calculated as follows for the two scenarios:
In addition, the payback time (P.O.T) is as follows:
4.3.6. Overview of Feasibility
An overview of the economic performance of the PP pyrolysis plant with a capacity of 200,000 t/year is presented in Table 14. Based on the results of the analysis, it appears that the plant is economically viable, as it presents high profits and a short payback time for both scenarios considered.
Table 14.
Overview of the feasibility of the PP pyrolysis plant.
More specifically, the use of pyrolysis gas to supply heat to the reactor (scenario 1) has a positive effect on the feasibility of the plant. Although the annual revenues are smaller in scenario 1, the significant reduction in the operating costs makes this scenario preferable. The annual profits amount to 37.3 M€, while the return on investment is quite high at 81%. Finally, the payback time of the unit is only 1.16 years. In contrast, in scenario 2, although the plant is still feasible and shows high profitability, the annual profits are lower by about 1.5 M€, while the payback time is a little higher at 1.2 years.
Pyrolysis oil is the most important product of the process, as more than 95% of the annual revenue of the plant is due to its sale. The solid product (char) is produced in very small quantities; therefore, it does not contribute significantly to the profitability of the plant.
The annual operating costs amount to 51.3 and 54.8 M€, respectively, for the two scenarios, 1 and 2. The cost of purchasing the raw material constitutes about 60% of the total. The cost of utilities is a significant part of the total operating costs, with shredding costs amounting to 3 M€. Some additional operating costs, such as supervision, maintenance, local taxes, administration, and distribution costs, make up about 15% of the unit’s total annual operating costs.
4.3.7. Sensitivity Analysis Effect of Plant Capacity on Economic Indicators
Based on the process described in the previous sections, the economic performance of the PP pyrolysis plant can be examined for a range of capacities. The impact of plant capacity on the initial investment is depicted in Figure 7. The investment increases with the plant’s capacity, from 4.02 M€ for 5000 t/year to 59.98 M€ for 300,000 t/year.
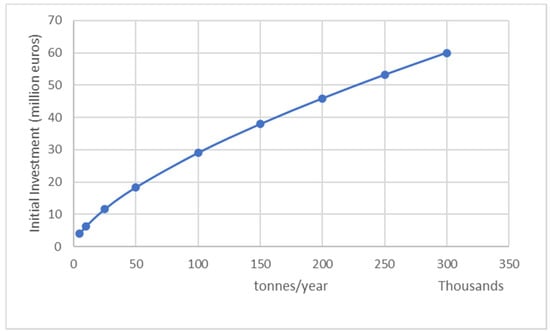
Figure 7.
Effect of PP pyrolysis plant capacity on the initial investment (scenario 1).
Nevertheless, this is not a sufficient criterion for comparing the economic viability of facilities of different scales; therefore, the indicators R.O.I and P.O.T are preferred, as shown in Figure 8, to assess optimal capacity.
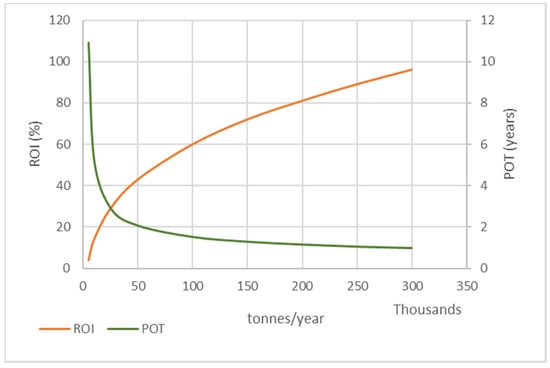
Figure 8.
Effect of PP pyrolysis plant capacity on R.O.I and P.O.T (scenario 1).
For small capacities (<50,000 t/year), the PP pyrolysis plant seems profitable, but does not appear to be a very viable or attractive investment. The payback period is between 2 and 10 years, which means that it takes a very long time to recover the initial investment. However, the R.O.I index is less than 45%, which is significantly lower compared to higher capacity installations.
In plants with a capacity of >100,000 t per year, the investment is much more advantageous. It seems that the initial investment can be recovered in less than two years, as the time decreases with increasing capacity. Accordingly, the higher the capacity of the unit, the more efficient the investment.
Nevertheless, the initial investment increases significantly. For example, for a pyrolysis plant with a capacity of 300,000 t/year, the R.O.I index is at its maximum (96%) and the payback time is at its minimum (1 year), which means that it presents the optimal financial performance. However, due to the size of the facility, the initial investment amounts to 60 M€, which can be a deterrent. Accordingly, to determine the optimal capacity, a profitable investment with a reasonably high initial investment must be found.
As shown in Figure 8, the P.O.T index decreases with increasing capacity. When the capacity has significantly increased, there is a very small reduction in payback time. Especially for capacities >200,000 t/year, the payback time is insignificantly reduced, meaning that while the initial investment significantly increases, the economic performance of the plant is only improved slightly. The R.O.I index is constantly increasing, but its increase is less significant for capacities >200,000 t/year.
Based on these observations, it can be assumed that while the unit is viable for all the capacities that were considered, optimal economic efficiency can be achieved for capacities in the range of 150,000–200,000 t per year.
5. Conclusions
Pyrolysis is an effective method of managing plastic waste mainly for oil production, which exhibits similar properties to conventional fuels, such as gasoline or diesel. Many factors affect the yields of the process, as well as the properties and quality of the final products. The temperature, the type of feedstock and the presence of a catalyst are the most important parameters to consider, although the type of reactor, the pressure and the heating rate are also important.
Polypropylene (PP) is very often used as feedstock for pyrolysis, as very high yields of pyrolysis oil are observed. The properties of the oil are similar to those of conventional fuels. The preferred temperature for PP pyrolysis ranges from 450 °C to 550 °C, where oil yields vary from 82 wt.% to 92.3 wt.%. For temperatures below 450 °C, lower oil yields can be observed (<80 wt.%), while at higher temperatures (740 °C), the gas yield increases significantly, limiting oil production.
Based on the results of the feasibility assessment, a PP-based pyrolysis plant can be economically viable, with its optimal capacity being in the range of 150,000 to 200,000 t per year. Pyrolysis oil is the main product of the plant, and it is responsible for generating a significant part of the total revenue, while the gaseous product also contributes to the economic viability. The pyrolysis plant shows significant profits both when the pyrolysis gas is used to cover the energy requirements of the process (scenario 1) and when the gas is sold as a final product (scenario 2). The solid (char), despite its relatively high selling price, constitutes a very low percentage of the annual profits, due to its low yields.
For scenario 1, the pyrolysis plant with a capacity of 200,000 t PP/year is estimated to have annual profits of 37.3 M€, while the payback time of the initial investment is very low, at 1.16 years. Using part of the gas to meet the energy needs of the pyrolysis reactor significantly reduces the operating costs, as the use of natural gas is not required. However, the remaining amount of gas is sold and contributes to the annual revenue. In the case where the entire amount of gas is sold (scenario 2), the profitability of the plant remains, but this option is less preferable, due to the higher operating costs associated with the use of natural gas.
The results of this study show that the PP pyrolysis unit is economically viable for a wide range of capacities. However, this is an approximate analysis based on certain assumptions; thus, a detailed feasibility study is proposed to produce more accurate results.
Author Contributions
Conceptualization, A.Z.; methodology, A.Z. and I.V.; formal analysis, I.V.; investigation, A.Z. and I.V.; resources, I.V. and A.Z.; data curation, I.V.; writing—original draft preparation, I.V.; writing—review and editing, A.Z.; visualization, I.V. and A.Z.; supervision, A.Z.; project administration, A.Z.; funding acquisition. All authors have read and agreed to the published version of the manuscript.
Funding
This research was funded by the action «Investment Plans for Innovation’ of the region of Central Macedonia, Greece; grant number KMP6-0283869.
Institutional Review Board Statement
Not applicable.
Informed Consent Statement
Not applicable.
Data Availability Statement
Not applicable.
Acknowledgments
We acknowledge the administrative support provided by CAO HELLAS.
Conflicts of Interest
The authors declare no conflict of interest.
References
- Xayachak, T.; Haque, N.; Parthasarathy, R.; King, S.; Emami, N.; Lau, D.; Pramanik, B.K. Pyrolysis for Plastic Waste Management: An Engineering Perspective. J. Environ. Chem. Eng. 2022, 10, 108865. [Google Scholar] [CrossRef]
- Zhu, H.; He, D.; Duan, H.; Yin, H.; Chen, Y.; Chao, X.; Zhang, X.; Gong, H. Study on coupled combustion behaviors and kinetics of plastic pyrolysis by-product for oil. Energy 2023, 262A, 125452. [Google Scholar] [CrossRef]
- WWF. Plastic Pollution in Greece: How to Stop It—A Practical Guide for Policy Makers; Worldwide Fund for Nature: Vaud, Switzerland, 2019. [Google Scholar]
- Elliott, T.; Xirou, H.; Stergiou, V.; Bapasola, A.; Gillie, H. Policy Measures on Plastics in Greece; Eunomia Research & Consulting: London, UK, 2020. [Google Scholar]
- YPEKA; EOAN; GIZ. Citizens Leaflet—Practical Tips for a More Sustainable and Cleaner Greece. Available online: https://ypen.gov.gr/wp-content/uploads/2021/09/Guidelines_Citizens_FINAL_EN.pdf (accessed on 19 December 2022).
- Babaremu, K.O.; Okoya, S.A.; Hughes, E.; Tijani, B.; Teidi, D.; Akpan, A.; Igwe, J.; Karera, S.; Oyinlola, M.; Akinlabi, E.T. Sustainable plastic waste management in a circular economy. Heliyon 2022, 8, e09984. [Google Scholar] [CrossRef] [PubMed]
- Hossain, R.; Islam, M.T.; Ghose, A.; Sahajwalla, V. Full circle: Challenges and prospects for plastic waste management in Australia to achieve circular economy. J. Clean. Prod. 2022, 368, 133127. [Google Scholar] [CrossRef]
- Mirkarimi, S.M.R.; Bensaid, S.; Chiaramonti, D. Conversion of mixed waste plastic into fuel for diesel engines through pyrolysis process: A review. Appl. Energy 2022, 327, 120040. [Google Scholar] [CrossRef]
- Chen, X.; Dong, M.; Zhang, L.; Luan, X.; Cui, X.; Cui, Z. Comprehensive evaluation of environmental and economic benefits of industrial symbiosis in industrial parks. J. Clean. Prod. 2022, 354, 131635. [Google Scholar] [CrossRef]
- Hassan, S.T.; Wang, P.; Khan, I.; Zhu, B. The impact of economic complexity, technology advancements, and nuclear energy consumption on the ecological footprint of the USA: Towards circular economy initiatives. Gondwana Res. 2023, 113, 237–246. [Google Scholar] [CrossRef]
- OECD. Global Plastics Outlook: Policy Scenarios to 2060; OECD: Paris, France, 2022. [Google Scholar]
- Kusenberg, M.; Eschenbacher, A.; Delva, L.; De Meester, S.; Delikonstantis, E.; Stefanidis, G.D.; Ragaert, K.; Van Geem, K.M. Towards high-quality petrochemical feedstocks from mixed plastic packaging waste via advanced recycling: The past, present and future. Fuel Process. Technol. 2022, 238, 107474. [Google Scholar] [CrossRef]
- European Commission. Circular Economy: Commission Takes Action to Reduce waste from Single-Use Plastics. (Online) European Commission. 2022. Available online: https://ec.europa.eu/commission/presscorner/detail/en/ip_22_5731 (accessed on 19 October 2022).
- CMS. Plastics and Packaging Laws in the European Union. (Online) CMS. 2021. Available online: https://cms.law/en/int/expert-guides/plastics-and-packaging-laws/european-union (accessed on 20 November 2022).
- Eze, W.; Umunakwe, R.; Obasi, H.; Ugbaja, M.; Uche, C.; Madufor, I. Plastics waste management: A review of pyrolysis technology. Clean Technol. Recycl. 2021, 1, 50–69. [Google Scholar] [CrossRef]
- Rehan, M.; Miandad, R.; Barakat, M.A.; Ismail, I.M.I.; Almeelbi, T.; Gardy, J. Effect of zeolite catalysts on pyrolysis liquid oil. Int. Biodeterior. Biodegrad 2017, 119, 162–175. [Google Scholar] [CrossRef]
- Armenise, S.; SyieLuing, W.; Ramírez-Velásquez, J.; Launay, F.; Wuebben, D.; Ngadi, N.; Rams, J.; Muñoz, M. Plastic waste recycling via pyrolysis: A bibliometric survey and literature review. J. Anal. Appl. Pyrolysis 2021, 158, 105265. [Google Scholar] [CrossRef]
- Jamradloedluk, J.; Lertsatitthanakorn, C. Characterization and Utilization of Char Derived from Fast Pyrolysis of Plastic Wastes. Procedia Eng. 2014, 69, 1437–1442. [Google Scholar] [CrossRef]
- Anuar Sharuddin, S.; Abnisa, F.; Wan Daud, W.; Aroua, M. A review on pyrolysis of plastic wastes. Energy Convers. Manag. 2016, 115, 308–326. [Google Scholar] [CrossRef]
- Maqsood, T.; Dai, J.; Zhang, Y.; Guang, M.; Li, B. Pyrolysis of plastic species: A review of resources and products. J. Anal. Appl. Pyrolysis 2021, 159, 105295. [Google Scholar] [CrossRef]
- Erdogan, S. Recycling of Waste Plastics into Pyrolytic Fuels and Their Use in IC Engines. Sustain. Mobil. 2020. [Google Scholar] [CrossRef]
- Basu, P. Biomass Gasification and Pyrolysis; Academic Press: Amsterdam, The Netherlands, 2010. [Google Scholar]
- Abnisa, F.; Wan Daud, W. A review on co-pyrolysis of biomass: An optional technique to obtain a high-grade pyrolysis oil. Energy Convers. Manag. 2014, 87, 71–85. [Google Scholar] [CrossRef]
- Çepelioğullar, Ö.; Pütün, A. Thermal and kinetic behaviors of biomass and plastic wastes in co-pyrolysis. Energy Convers. Manag. 2013, 75, 263–270. [Google Scholar] [CrossRef]
- Pandey, U.; Stormyr, J.; Hassani, A.; Jaiswal, R.; Haugen, H.; Moldestad, B. Pyrolysis of plastic waste to environmentally friendly products. Energy Prod. Manag. 21st Century IV 2020, 246, 61–74. [Google Scholar]
- López, A.; de Marco, I.; Caballero, B.; Laresgoiti, M.; Adrados, A. Dechlorination of fuels in pyrolysis of PVC containing plastic wastes. Fuel Process. Technol. 2011, 92, 253–260. [Google Scholar] [CrossRef]
- Wang, H.; Hu, H.; Yang, Y.; Liu, H.; Tang, H.; Xu, S.; Li, A.; Yao, H. Effect of high heating rates on products distribution and sulfur transformation during the pyrolysis of waste tires. Waste Manag. 2020, 118, 9–17. [Google Scholar] [CrossRef]
- Miandad, R.; Rehan, M.; Barakat, M.A.; Aburiazaiza, A.S.; Khan, H.; Ismail, I.M.I.; Dhavamani, J.; Gardy, J.; Hassanpour, A.; Nizami, A.S. Catalytic Pyrolysis of Plastic Waste: Moving Toward Pyrolysis Based Biorefineries. Front. Energy Res 2019, 7, 27. [Google Scholar] [CrossRef]
- Ahmad, I.; Khan, M.; Khan, H.; Ishaq, M.; Tariq, R.; Gul, K.; Ahmad, W. Pyrolysis Study of Polypropylene and Polyethylene Into Premium Oil Products. Int. J. Green Energy 2014, 12, 663–671. [Google Scholar] [CrossRef]
- Sakata, Y.; Uddin, M.; Muto, A. Degradation of polyethylene and polypropylene into fuel oil by using solid acid and non-acid catalysts. J. Anal. Appl. Pyrolysis 1999, 51, 135–155. [Google Scholar] [CrossRef]
- Kusenberg, M.; Zayoud, A.; Roosen, M.; Thi, H.; Abbas-Abadi, M.; Eschenbacher, A.; Kresovic, U.; De Meester, S.; Van Geem, K. A comprehensive experimental investigation of plastic waste pyrolysis oil quality and its dependence on the plastic waste composition. Fuel Process. Technol. 2021, 227, 107090. [Google Scholar] [CrossRef]
- FakhrHoseini, S.; Dastanian, M. Predicting Pyrolysis Products of PE, PP, and PET Using NRTL Activity Coefficient Model. J. Chem. 2013, 2013, 487676. [Google Scholar] [CrossRef]
- Paraschiv, M.; Kuncser, R.; Tazerout, M.; Prisecaru, T. New energy value chain through pyrolysis of hospital plastic waste. Appl. Therm. Eng. 2015, 87, 424–433. [Google Scholar] [CrossRef]
- Demirbas, A. Pyrolysis of municipal plastic wastes for recovery of gasoline-range hydrocarbons. J. Anal. Appl. Pyrolysis 2014, 72, 97–102. [Google Scholar] [CrossRef]
- Inayat, A.; Fasolini, A.; Basile, F.; Fridrichova, D.; Lestinsky, P. Chemical recycling of waste polystyrene by thermo-catalytic pyrolysis: A description for different feedstocks, catalysts and operation modes. Polym. Degrad. Stab. 2022, 201, 109981. [Google Scholar] [CrossRef]
- Abbas-Abadi, M.; Haghighi, M.; Yeganeh, H.; McDonald, A. Evaluation of pyrolysis process parameters on polypropylene degradation products. J. Anal. Appl. Pyrolysis 2014, 109, 272–277. [Google Scholar] [CrossRef]
- Erawati, E.; Hamid and Permatasari, R. Pyrolysis of polypropylene waste with natural zeolite as catalyst. Exploring resources, process and design for sustainable urban development. In Proceedings of the 5th International Conference on Engineering, Technology, and Industrial Application (ICETIA), Surakarta, Indonesia, 12–13 December 2018. [Google Scholar]
- Marino, A.; Aloise, A.; Hernando, H.; Fermoso, J.; Cozza, D.; Giglio, E.; Migliori, M.; Pizzaro, P.; Giordano, G.; Serrano, D.P. ZSM-5 zeolites performance assessment in catalytic pyrolysis of PVC-containing real WEEE plastic wastes. Catal. Today 2022, 390–391, 210–220. [Google Scholar] [CrossRef]
- Odejobi, O.J.; Oladunni, A.A.; Sonibare, J.A.; Abegunrin, I.O. Oil yield optimization from co-pyrolysis of low-density polyethylene (LDPE), polystyrene (PS) and polyethylene terephthalate (PET) using simplex lattice mixture design. Fuel Commun. 2020, 2–5, 100006. [Google Scholar] [CrossRef]
- Terapalli, A.; Kamireddi, D.; Srivedi, V.; Tukarambai, M.; Suriapparao, D.V.; Rao, C.S.; Gautam, R.; Modi, P.R. Microwave-assisted in-situ catalytic pyrolysis of polystyrene: Analysis of product formation and energy consumption using machine learning approach. Process Saf. Environ. Prot. 2022, 166, 57–67. [Google Scholar] [CrossRef]
- Adnan; Shah, J.; Jan, M. Thermo-catalytic pyrolysis of polystyrene in the presence of zinc bulk catalysts. J. Taiwan Inst. Chem. Eng. 2014, 45, 2494–2500. [Google Scholar] [CrossRef]
- Shahbaz, M.; AlNouss, A.; Mckay, G.; Mackey, H.; Ansari, T.A. Techno-economic and environmental analysis of pyrolysis process simulation for plastic (PET) waste. Comput. Aided Chem. Eng. 2022, 51, 115–120. [Google Scholar]
- Bagri, R.; Williams, P. Catalytic pyrolysis of polyethylene. J. Anal. Appl. Pyrolysis 2022, 63, 29–41. [Google Scholar] [CrossRef]
- Williams, P.T.; Williams, E.A. Fluidized bed pyrolysis of low density polyethylene to produce petrochemical feedstock. J. Anal. Appl. Pyrolysis 1999, 51, 107–126. [Google Scholar] [CrossRef]
- Wu, Y.; Wang, K.; Wei, B.; Yang, H.; Jin, L.; Hu, H. Pyrolysis behavior of low-density polyethylene over HZSM-5 via rapid infrared heating. Sci. Total Environ. 2021, 806, 151287. [Google Scholar] [CrossRef]
- Marcilla, A.; Beltrán, M.; Navarro, R. Thermal and catalytic pyrolysis of polyethylene over HZSM5 and HUSY zeolites in a batch reactor under dynamic conditions. Appl. Catal. B Environ. 2009, 86, 78–86. [Google Scholar] [CrossRef]
- Dzol, M.A.A.M.; Balasundram, V.; Shameli, K.; Ibrahim, N.; Manan, Z.A.; Isha, R. Catalytic pyrolysis of high-density polyethylene over nickel-waste chicken eggshell/HZSM-5. J. Environ. Manag. 2022, 324, 116392. [Google Scholar] [CrossRef]
- Mastral, F.; Esperanza, E.; García, P.; Juste, M. Pyrolysis of high-density polyethylene in a fluidised bed reactor. Influence of the temperature and residence time. J. Anal. Appl. Pyrolysis 2012, 63, 1–15. [Google Scholar] [CrossRef]
- Mousavi, S.A.H.S.; Sadrameli, S.M.; Dehaghani, A.H.S. Energy recovery from high density polyethylene plastic via pyrolysis with upgrading of the product by a novel nano MIL-53 (Cu) derived@Y zeolite catalyst using response surface methodology. Fuel Process. Technol. 2022, 231, 107257. [Google Scholar] [CrossRef]
- Donaj, P.; Kaminsky, W.; Buzeto, F.; Yang, W. Pyrolysis of polyolefins for increasing the yield of monomers’ recovery. Waste Manag. 2012, 32, 840–846. [Google Scholar] [CrossRef] [PubMed]
- Kaminsky, W.; Schlesselmann, B.; Simon, C. Thermal degradation of mixed plastic waste to aromatics and gas. Polym. Degrad. Stab. 1996, 53, 189–197. [Google Scholar] [CrossRef]
- Nugroho Pratama, N.; Saptoadi, H. Characteristics of Waste Plastics Pyrolytic Oil and Its Applications as Alternative Fuel on Four Cylinder Diesel Engines. Int. J. Renew. Energy Dev. (IJRED) 2014, 3, 13–20. [Google Scholar] [CrossRef]
- Tian, X.; Zeng, Z.; Liu, Z.; Dai, L.; Xu, J.; Yang, X.; Yue, L.; Liu, Y.; Ruan, R.; Wang, Y. Conversion of low-density polyethylene into monocyclic aromatic hydrocarbons by catalytic pyrolysis: Comparison of HZSM-5, Hβ, HY and MCM-41. J. Clean. Prod. 2022, 358, 131989. [Google Scholar] [CrossRef]
- Artetxe, M.; Lopez, G.; Elordi, G.; Amutio, M.; Bilbao, J.; Olazar, M. Production of Light Olefins from Polyethylene in a Two-Step Process: Pyrolysis in a Conical Spouted Bed and Downstream High-Temperature Thermal Cracking. Ind. Eng. Chem. Res. 2012, 51, 13915–13923. [Google Scholar] [CrossRef]
- Kagan, J.; Drury, A. Payback Period Definition. (Online) Investopedia. Available online: https://www.investopedia.com/terms/p/paybackperiod.asp (accessed on 10 September 2022).
- Bezergianni, S.; Dimitriadis, A.; Faussone, G.; Karonis, D. Alternative Diesel from Waste Plastics. Energies 2017, 10, 1750. [Google Scholar] [CrossRef]
- Kodera, Y.; Yamamoto, T.; Ishikawa, E. Energy- and economic-balance estimation of pyrolysis plant for fuel-gas production from plastic waste based on bench-scale plant operations. Fuel Commun 2021, 7, 100016. [Google Scholar] [CrossRef]
- Mathieson, J.; Somerville, M.A.; Deev, A.; Jahanshahi, S. Utilization of Biomass as an Alternative Fuel in Ironmaking; Woodhead Publishing: Soston, UK, 2015; pp. 581–613. [Google Scholar]
- Turton, R.; Shaeiwitz, J.; Bhattacharyya, D.; Whiting, W. Analysis, Synthesis and Design of Chemical Processes, 5th ed.; Prentice Hall: Boston, MA, USA, 2018. [Google Scholar]
- Fivga, A.; Dimitriou, I. Pyrolysis of plastic waste for production of heavy fuel substitute: A techno-economic assessment. Energy 2018, 149, 865–874. [Google Scholar] [CrossRef]
- Ghodrat, M.; Abascall Alonso, J.; Hagare, D.; Yang, R.; Samali, B. Economic feasibility of energy recovery from waste plastic using pyrolysis technology: An Australian perspective. Int. J. Environ. Sci. Technol. 2019, 16, 3721–3734. [Google Scholar] [CrossRef]
- Riedewald, F.; Patel, Y.; Wilson, E.; Santos, S.; Sousa-Gallagher, M. Economic assessment of a 40,000 t/y mixed plastic waste pyrolysis plant using direct heat treatment with molten metal: A case study of a plant located in Belgium. Waste Manag. 2021, 120, 698–707. [Google Scholar] [CrossRef] [PubMed]
- Yang, Y.; Wang, J.; Chong, K.; Bridgwater, A. A techno-economic analysis of energy recovery from organic fraction of municipal solid waste (MSW) by an integrated intermediate pyrolysis and combined heat and power (CHP) plant. Energy Convers. Manag. 2018, 174, 406–416. [Google Scholar] [CrossRef]
- Rogers, C.; Means, P.; Gonzalez, R.; Sheets, K.; Townsend, H. Economic Feasibility of Mixed Plastic Waste Pyrolysis Using Twin Reactor System in Northwest Arkansas. Bachelor’s Thesis, University of Arkansas, Fayetteville, AR, USA, 2021. [Google Scholar]
- Petersson, I.; Svensson, A. Regional Plastic Waste Recycling through Pyrolysis—A Technoeconomic Evaluation. Ph.D. Thesis, Chalmers University of Technology, Department of Space, Earth and Environment, Gothenburg, Sweden, 2019. [Google Scholar]
- Almohamadi, H.; Alamoudi, M.; Ahmed, U.; Shamsuddin, R.; Smith, K. Producing hydrocarbon fuel from the plastic waste: Techno-economic analysis. Korean J. Chem. Eng. 2021, 38, 2208–2216. [Google Scholar] [CrossRef]
- Peters, S.M.; Timmerhaus, D.C. Plant Design and Economics for Chemical Engineers; McGraw Hill International Editions; McGraw Hill: New York, NY, USA, 2003. [Google Scholar]
- Eurostat. Hourly Labour Costs—Statistics Explained. (Online) Ec.europa.eu. Available online: https://ec.europa.eu/eurostat/statistics-explained/index.php?title=Hourly_labour_costs#Hourly_labour_costs_ranged_between_.E2.82.AC6.5_and_.E2.82.AC45.8_in_2020 (accessed on 25 September 2022).
- Bora, R.; Wang, R.; You, F. Waste Polypropylene Plastic Recycling toward Climate Change Mitigation and Circular Economy: Energy, Environmental, and Technoeconomic Perspectives. ACS Sustain. Chem. Eng. 2020, 8, 16350–16363. [Google Scholar] [CrossRef]
- DEI. Electricity Selling Price. (Online) Dei.gr. 2021. Available online: https://www.dei.gr/Documents/xt.tim.1.7.08.pdf (accessed on 14 September 2022).
- EYDAP. Pricing EYDAP. (Online) Eydap.gr. 2022. Available online: https://www.eydap.gr/userfiles/47614413-661a-4fba-ba7c-a14f00cfa261/Timologio_EYDAP_2.pdf (accessed on 25 September 2022).
- REC. Shredding. (Online) Recyclingequipment.com. 2020. Available online: https://recyclingequipment.com/shredders/398-tire-shredding (accessed on 15 September 2022).
- Engineering Toolbox. Specific Heat of Common Substances. (Online). 2003. Available online: https://www.engineeringtoolbox.com/specific-heat-capacity-d_391.html (accessed on 20 August 2022).
- EngineeringToolbox. Water—Heat of Vaporization. (Online) Engineeringtoolbox.com. 2021. Available online: https://www.engineeringtoolbox.com/water-properties-d_1573.html (accessed on 2 September 2022).
- NIST. Compressed Water and Superheated Steam. (Online) Nist.gov. Available online: https://www.nist.gov/system/files/documents/srd/NISTIR5078-Tab3.pdf (accessed on 25 August 2022).
- Abdallah, R.; Juaidi, A.; Assad, M.; Salameh, T.; Manzano-Agugliaro, F. Energy recovery from waste tires using pyrolysis: Palestine as a case study. Energies 2020, 13, 1817. [Google Scholar] [CrossRef]
- Chavando, J.A.M.; de Matos, E.C.J.; Silva, V.B.; Tarelho, L.A.C.; Cardoso, J.S. Pyrolysis characteristics of RDF and HPDE blends with biomass. Int. J. Hydrog. Energy 2021, 47, 19901–19915. [Google Scholar] [CrossRef]
- Jaafar, Y.; Abdelouahed, L.; El Hage, R.; El Samrani, A.; Taouk, B. Pyrolysis of common plastics and their mixtures to produce valuable petroleum-like products. Polym. Degrad. Stab. 2022, 195, 109770. [Google Scholar] [CrossRef]
- EngineeringToolbox. Fuel Gases Heating Values. (Online) Engineeringtoolbox.com. 2021. Available online: https://www.engineeringtoolbox.com/heating-values-fuel-gases-d_823.html (accessed on 12 September 2022).
- Aerio Attikis. Natural Gas Price and Savings. (Online) Aerioattikis.blob.core.windows.net. 2021. Available online: https://aerioattikis.blob.core.windows.net/wp-uploads/2021/07/%CE%A4%CE%B9%CE%BC%CE%AD%CF%82_%CE%99%CE%B4%CE%B9%CF%8E%CF%84%CE%B5%CF%82_%CE%99%CE%BF%CF%8D%CE%BB%CE%B9%CE%BF%CF%82_2021-60f1866822637.pdf (accessed on 26 August 2022).
- Desai, S.B.; Galage, C.K. Production and Analysis of pyrolysis oil from waste plastic in Kolhapur city. Int. J. Eng. Res. Gen. Sci. 2015, 3, 590–595. [Google Scholar]
- Hamid, K.; Sabir, R.; Hameed, K.; Waheed, A.; Ansari, M.U. Economic Analysis of Fuel Oil Production from Pyrolysis of Waste Plastic. Austin Environ Sci. 2021, 6, 1053. [Google Scholar] [CrossRef]
- Yahya, S.; Iqbal, T.; Omar, M.; Ahmad, M. Techno-Economic Analysis of Fast Pyrolysis of Date Palm Waste for Adoption in Saudi Arabia. Energies 2021, 14, 6048. [Google Scholar] [CrossRef]
- GVR. Recovered Carbon Black Market Size, Share & Trends Analysis Report by Application (Tires, Rubber, High Performance Coatings, Plastics), by Region (North America, Europe, APAC, CSA, MEA), and Segment Forecasts, 2020—2027. (ebook) Grand View Research. 2020. Available online: https://www.grandviewresearch.com/industry-analysis/recovered-carbon-black-market/toc (accessed on 26 January 2022).
Disclaimer/Publisher’s Note: The statements, opinions and data contained in all publications are solely those of the individual author(s) and contributor(s) and not of MDPI and/or the editor(s). MDPI and/or the editor(s) disclaim responsibility for any injury to people or property resulting from any ideas, methods, instructions or products referred to in the content. |
© 2023 by the authors. Licensee MDPI, Basel, Switzerland. This article is an open access article distributed under the terms and conditions of the Creative Commons Attribution (CC BY) license (https://creativecommons.org/licenses/by/4.0/).