Abstract
Here, laboratory tests were conducted to examine the effects of natural fracture density (NFD) on the propagation of hydraulic fracture (HF), HF and natural fracture (NF) interaction, and the formation of the stimulated reservoir volume (SRV). Laboratory methods were proposed to prepare samples with dense, medium and spare discrete orthogonal fracture networks. After conducting a true triaxial hydraulic fracturing experiment on the synthetic blocks, the experimental results were analyzed by qualitative failure morphology descriptions, and the quantitative analysis used two proposed new indices. On the pump pressure profiles, it reflected the non-linear interactions between HFs and NFs well. For rock blocks with a dense DFN density, pump pressure curves present fluctuation shape and the degree of interaction between HF and NF is strong; however, for model blocks with a sparse DFN density, the pump pressure curves present a sudden drop shape. In addition, different propagation behaviors of NFs—offset, divert, branch, and cross NF—can be observed from the fractured model blocks. By using a proposed index of “P-SRV”, the relationship between NFD and the fracturing effectiveness was further confirmed. Furthermore, the most striking finding is that mixed mode I–II and I–III fracture types can be formed in the naturally fractured model blocks. The experimental results are beneficial for grasping the influential mechanism of NFD on the propagation of HF and for developing more accurate and full 3D-coupled simulation models for unconventional oil and gas development.
1. Introduction
In unconventional reservoirs (shale gas, coalbed methane, tight gas, etc.), the formation of a complex hydraulic fracturing network is crucial to gas productivity. The hydraulic fracturing effectiveness is attributed to the pronounced develop of natural fractures. From shale core measurement and outcrop observations, plenty of natural fractures exist in shale formation; in addition, geophysical methods of image logs and microseismic event monitoring also prove the existing of natural fractures. Owing to the reactivation of natural fractures, it provides the possibility that the “stimulated reservoir volume” (SRV) can be realized through creating a complex fracturing network in the naturally fractured reservoirs. Many reservoirs have been identified as being naturally fracture controlled (e.g., Barnett shale, Baxter shale, Marcellus shale and New Albany shale in the United States; Longmaxi shale, Cambrian Niutitang shale, and Yanchang shale in China, etc.) [1,2,3,4,5], and great strides have been made in the aspect of natural fracture characteristics. Recently, interest has increased regarding the studies of natural fractures on the surface (outcrop of reservoir) and the subsurface (e.g., microseismic event, core measurement, image logs, etc.). These have been proven by greater industry knowledge of the influence of natural fractures on subsurface fluid flow and by a significant and ever-increasing proportion of oil and gas discoveries where natural fractures play a crucial role in production [1,2,5,6,7].
Geological density is an important factor reflecting the connectivity of natural fractures. Generally, high natural fracture density is commonly desirable to hydraulic fracturing [1,3,8,9]. By using numerical simulators, some scholars have deeply investigated the influence of natural fracture density on the formation of fracturing networks [10,11,12,13]. Currently, it is very popular to use numerical methods in the study of the interactions between HFs and NFs. To study the formation of complex fracturing networks, Riahi and Damjanac [12] used the UDEC software to explore the interactions between HFs and the pre-existing discrete fracture network (DFN). Furthermore, to investigate the effect of DFN connectivity on the leak-off ratio and the net pressure, Savitski et al. [10] used the 3DEC software to perform a series of numerical simulations. Results shows that leak-off of shale formation becomes much more obvious for a dense DFN connective simulator. However, for a sparsely connected DFN stimulator, the leak-off phenomenon is not so obvious with the increase in fluid injection. From a prospective of damage mechanics, Wang et al. [12] used a flow–stress–damage approach to investigate the effect of NFD on fracture network propagation. A total of nine simulators were established including three kinds of DFN models (i.e., a dense DFN, a sparse DFN, and a medium DFN model) at three fluid pump rates. The numerical results show that the connectivity of the fracturing network has a crucial effect on the interactions between HF and DFN and the associate hydraulic fracturing effectiveness; furthermore, due to the differential fracture connectivity in the simulation models, the results are very different under the same injection rate. For models with low pump rate, with the increasing DFN density, the stimulated area between HF and DFN decreased; however, at a high pump rate, the stimulated area increased with the increase in DFN density. As is known, the numerical method has its unique advantage to study the issues of hydraulic fracturing; there is no need to limit the experimental conditions compared to laboratory methods. In addition, numerical methods can provide an alternative and feasible solution for certain complex issues. Using this method, we can easily and quantitatively control the mechanical process. Nevertheless, no matter how perfect the results are via the numerical simulation, to ensure their credibility and reliability, we must eventually test the numerical results against physical testing.
Laboratory tests are an important and practical method to study the propagation of hydraulic fractures. The control of stress boundary conditions is effective, and the experimental results are easy to observe and interpret. To conduct laboratory testing design, determination and selection of specimens are very important [14,15,16,17,18]. During hydraulic fracturing, the target reservoir is often thousands of meters deep. This method is sometimes costly and makes it impossible to recover drilling cores underground. In addition, for testing requirements, due to the limitation of drilling technology, it is not suitable if the size of the tested sample is too small. As a result, artificially prepared samples become very necessary and practical. Using similar material model blocks, Fan and Zhang [15] performed six laboratory tests to discuss the influence of NFD on the formation and evolution of fracturing networks during fluid injection; their model blocks include two groups of orthogonal natural fracture. For their cement blocks, they do not consider the paste strength of natural fractures, and the natural fracture is continuous in the model blocks. Wang et al. [16] revealed the evolution behavior of fracture networks in random natural fracture blocks. For model blocks with different natural fracture densities, three types of fracture network geometries, namely radial random network, partial vertical random branch and vertical main multi-branch fracture, were observed. For their study, the natural fractures are randomly distributed non-tectonic micro-fractures, to mimic the natural fracture characteristics in the Upper Triassic Yanchang Formation, Ordos Basin, China. Wang and Li [18] conducted triaxial hydraulic fracturing experiments to study the effect of cemented fractures on fracturing networks propagation; natural fractures with different paste cement strengths were considered in the model blocks. However, the influences of NFD on the propagation behaviors of hydraulic fractures were not deeply studied.
This work emphatically focuses on revealing the effects of natural fracture density on hydraulic fracture propagation. In this work, following our previous studies on fracturing network propagation, a method to generate discrete orthogonal fractures was proposed during the model block preparation. Cubic cement block units with three sizes were produced, and they were pasted together to form a big block, and the big model block was used to conduct a hydraulic fracturing experiment. By doing so, model blocks with different DFNs can be realized. Among the small unit model block, cement paste was used to bond them together to mimic the “mineralized” or healed NFs. Using the method proposed, model blocks with three kinds of natural fracture densities can be realized. During the hydraulic fracturing test, the dyed water was injected into the rock models using a true triaxial hydraulic fracturing apparatus. The fracturing network propagation and the associated fracturing effect were analyzed for the designed modeling tests.
2. Experimental Methods
2.1. Synthetic Shale Blocks Preparation
In naturally fractured shale reservoirs, most of the natural fractures in the Longmaxi shale are observed to be discrete orthogonally. Shale formations in Pengshui play a crucial role in China; for example, after shale outcrop survey, three groups of nearly orthogonal natural fracture were observed, as shown in Figure 1. The open-mode natural fractures are generally mineralized and sealed with quartz or calcite, they can be reactivated during stimulation. Therefore, here, we produce the model blocks with three sets of orthogonal natural fractures. In addition, the fill-sealed characteristics of natural fractures are considered. The types of cement minerals in nature fractures are various, and studying the effects of cement properties of the fill-sealed mineral is very difficult. Although the mechanical properties of the filled material in NF are hard to be tested, important results can be drawn when using experimental simulations to investigate the influence of cement materials on hydraulic fracturing treatment. The differences in material properties between the artificial and actual shale rock are difficult to understand; however, the differential effects of filled material on the hydraulic fracturing results can be analogous to using artificial materials with different mechanical properties.
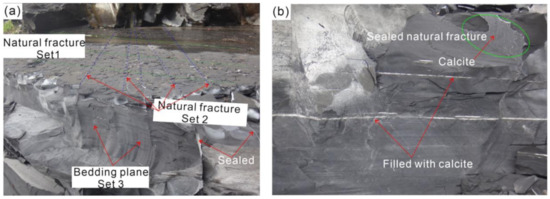
Figure 1.
Natural fracture in Longmaxi fresh shale outcrop, China. (a) Three groups of NFs can be observed from shale outcrop; (b) natural fracture is sealed and filled with calcite.
The hydraulic fracturing experiments were conducted on six cubic samples with a 300 mm side length, and they were prepared with a mixture of 20–40 mesh siliceous sand and no. 425 specification Chinese Portland Cement. The mix ratio was 2:1. To well reflect the nonuniformity of the sand material, a sieve test was used to determine the uniformity coefficient (D60/D10) of 4.6, as shown in Figure 2a. The ratio of the mixture for cement and sand to water was 1:1. Cement, water, and sand were mixed for 15 min. During this period, it can ensure the uniform distribution of sand particles in the cement. Three kinds of cubic block units (i.e., 30, 40, and 70 mm) were made with the mixture material. All the small model blocks were allowed to cure for two weeks at a condition of room humidity and temperature. Then, to simulate model blocks with different natural fracture densities, the block units were pasted to each other to form a big cubic block, and the paste material was used to mimic the natural fracture with a special mix ratio (Figure 3a). The average thickness of the paste interface was about 2–3 mm. Then, the “big cubic block” was allowed to cure for two weeks to allow the cubic blocks to form a firm adhesion state. Next, a metal mold with an internal side length of 300 × 300 × 300 mm was used to lay the “big cubic block” in its center position (Figure 3b), and the other parts of the metal mold were filled with cement mixture; to do so, the tested model block with its volume of 300 mm3 was finished (Figure 3c). According to the preparation process, it can be seen that three groups of orthogonal discrete fracture networks can be realized in the central part of the model block. The detailed experimental projects are listed in Table 1. To facilitate the description, here, the small cubic block is defined as “block units”, and many of those block units comprise a group [18]. The big cubic block is the core part of the tested model blocks, of which we call the model blocks composed of block units of 30, 40, and 70 mm as the dense DFN model block, medium DFN model block, and sparse DFN model block, respectively. The plot of those mechanical properties of different sizes of unit blocks is shown in Figure 2b. The mechanical and physical parameters of the paste cement mimicking natural fractures are shown in Table 2.
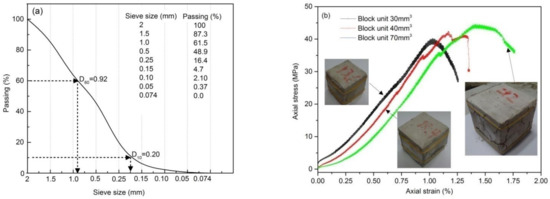
Figure 2.
(a) Particle grading curve for sand material used for producing the cement blocks and paste interface [19]. (b) Uniaxial compressive strength (UCS) of the cubic blocks with sizes of 30, 40, and 70 mm, respectively.
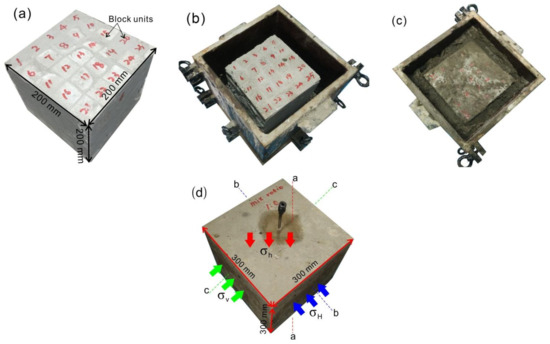
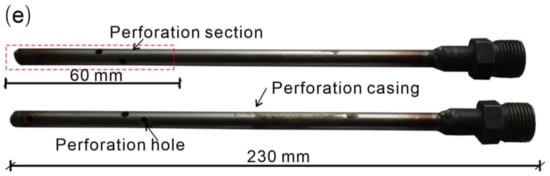
Figure 3.
Model block preparation for hydraulic fracture test. (a) Unit blocks were pasted to each other to form a big cubic block. (b) Big cubic block layered in the center of a metal mold; (c) Model blocks filled with paste cement to form an ensemble; (d) Metal perforation casing installed into the model block. (e) Structure of the perforation casing used in the experiment.

Table 1.
The experimental design for the hydraulic fracturing tests.
Table 2.
Strength properties of interface between block units.
After the preparation of the model blocks were cured in molds after 28 days, a wellbore with a diameter of 10 mm was drilled at the center position of the model block. Its depth was 10 cm, and it was parallel to the direction of σh (the minimum principal stress). After drilling the borehole, the borehole was flushed by water to clear away the cement power, and a metal perforation with an inside diameter of 8 mm was inserted into the wellbores. For the specially designed perforation casing, perforation holes were spirally distributed with a phase angle of 60° and spacing of 10 mm, as shown in Figure 3e. To effectively fracture the model block, here, we set the perforation interval as 60 mm. The structure of the perforation casing is shown in Figure 3e. Sketches of the dense, medium, and sparse model blocks are shown in Figure 4.
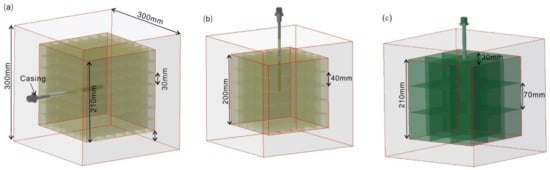
Figure 4.
Schematic of model blocks with different natural fracture densities: (a) dense natural fracture model, (b) medium natural fracture model, and (c) sparse natural fracture model.
2.2. Experimental System and Design
In order to establish the relationship between in situ hydraulic fracturing treatment and laboratory experiments, the scaling law is often used to scale fracturing parameters, such as stress conditions, injection rate, fracturing fluid viscosity, etc. [18,19,20,21,22,23,24]. A true triaxial hydraulic fracturing experimental system was used to conduct the tests in this work, as shown in Figure 5. In order to simulate the field stress conditions, hydraulic jacks were used to impose vertical stress σV, horizontal maximum σH, and horizontal minimum σh, and hydraulic pumps with servo control function were used to inject fracturing fluid (water-fracturing mode was used in the test). During the test, in order to ensure equal pressure distribution, the pressure platens were equipped with spherical sheets. A thin Teflon sheet covered with Vaseline was inserted between the pressure platens and the sample to eliminate possible shear stress. For the laboratory experiments, the minimum horizontal stress (σh), maximum horizontal stress (σH), and vertical stress (σv) were applied at 1.42, 2.13, and 4.28 MPa, respectively, according to stress characteristics of the Longmaxi formation shale in Pengshi play, Shizhu town, China [18,24,25]. During the test, the confining pressure applied to the model block in the three directions grew simultaneously to equal σh, and then, σH and σV were increased to predetermined values (see Table 3). When the confining pressure in the three directions reached the desired values, we kept the stress for a duration of 15 min to achieve stress equilibrium in the model blocks before injecting the hydraulic fluid [15,18].
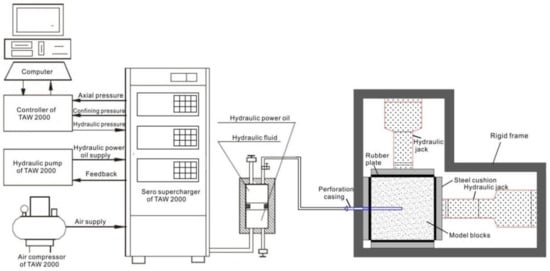
Figure 5.
The triaxial hydraulic fracturing test system used in this work.
Table 3.
Testing conditions in this work for model blocks with different natural fracture densities.
We monitored the change in the injection pressure with a central computer. The injection rate was at a constant value of 50 mL/min until failure of the model block. In addition, it ensured that the injected fluid leaked into the sample to a large extent. The changes in the injection volume and the pressure were always recorded during injection of the fluid. When the model block was fractured, a sudden drop occurred along the curve of the pump pressure. Before the end of the test and the shutdown of the pump, the fracturing fluid should fully leak into the sample to ensure the entire interaction between NFs and HFs. When the test was finished, we first depressurized the hydraulic pressure and took the model block out from the cell of the apparatus. Then, we removed the paste cement covering the big cubic block and pulled out the metal perforation casing. Third, the big cubic block was opened using a static expansion method by a kind of static cracking agent embedded inside the borehole. Subjected to the natural expansive force, we can remove the unit blocks and observe the propagation path of the hydraulic fractures.
3. Results and Analysis
3.1. Pump Pressure Curve Profile
Figure 6 and Figure 7 shows the curves of pump pressure against injection time. From the curve profiles, we can see that the pump pressure curve profile is different for model blocks with different NFD. In addition, the profile of the pump pressure curve is influenced by the paste cement, which acts as a natural fracture in shale formations. From the post-test curve profile, we can divide the pump pressure curve into two main types: (1) rapid drop type and (2) fluctuation type. As shown in Figure 6, the mixing proportion of paste cement is 1:0 (i.e., no sand is mixed, it is pure paste cement), the pump pressure corresponds to model blocks composed of unit blocks sized at 30, 40, and 70 mm, respectively. For sample #1 (unit size is 30 mm) and #2 (unit size is 40 mm), after breakdown pressure, the pump pressure curves display a fluctuating drop trend with the increasing injection time, and the fluctuation degree is more obvious for sample #1 than for sample #2. For sample #3, the density of the natural fracture is smaller than sample #1 and #2. After breakdown pressure, the curve drops sharply and the residual pump pressure is the lowest. Figure 7 also presents the fracturing pressure curves for the model blocks of differently sized unit blocks, and the UCS of the cement natural fractures is lower than in samples #1–#4. For samples #4 and #5, as the fluid is injected, the pump pressure curves drop after breakdown pressure; however, the fluctuation degree is stronger for sample #4 than for #5. For sample #6, the curve drops suddenly and then ascends slowly after the initial short-duration decline after breakdown pressure. In addition, the peak pump pressure increases with the increase in unit size (sample #1 < #2 < #3; sample #4 < #5 < #6), regardless of the strength of the paste interface. Furthermore, cement characteristics of NF influence the pattern of pump pressure profiles. For the model block with the same NF density but with a different mix ratio, the pump pressure presents a different profile. For samples with NF having a high mix ratio, the fluctuation degree is greater than those samples with a lower mix ratio. It can also be seen that the paste cement of the natural fracture affects the magnitude of the fluid pressure during fracture propagation. Generally, the breakdown pressure is larger for the model blocks with the paste cement, and they have high strength regardless of the natural fracture density.
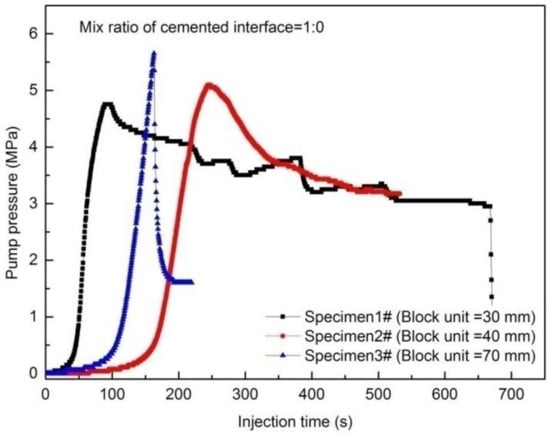
Figure 6.
Plots of pump pressure against injection time for model blocks with dense, medium, and sparse DFN (the mix ratio of the cement interface is 1:0).
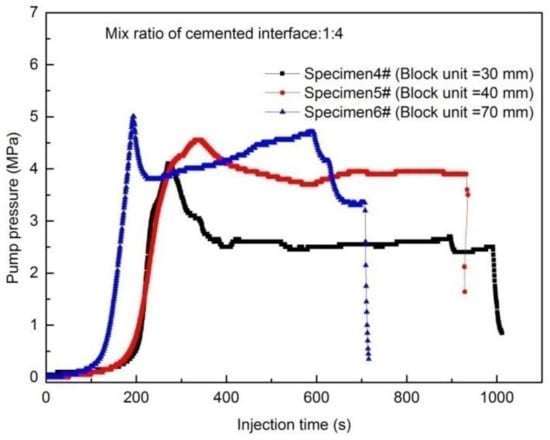
Figure 7.
Plots of pump pressure against injection time for model blocks with dense, medium, and sparse DFN (the mix ratio of cemented interface is 1:4).
As shown in the pump pressure curves, the fluctuation degree of the pump pressure is related to the fracture density in the shale formations. Many complex geomechanical behaviors occur during hydraulic fracturing treatment, including outward pressure, initiation and propagation of the hydraulic fracture, interactions between hydraulic fractures and natural fractures (e.g., offset, branching, crossing, arrest), leak-off of fracturing fluid, etc. [8]. Fluctuation morphology on the pump pressure curves indicates complicated interactions between NFs and HFs not only in laboratory testing but also in field treatment. For model blocks with dense NFD, the interaction between the NFs and HFs is stronger than that of the model block with sparse NFD, which can reflect on the morphology of pump pressure curves. Moreover, it can help us to understand the developmental characteristics of the natural fracture subsurface from the pump pressure profiles.
3.2. HF and NF Interaction Behaviors
As shown in Figure 8, complex behaviors can be observed for the interactions between NFs and HFs. With the decrease in natural fracture density, interactions between HF and NF become weaker, and the stimulated reservoir volume (SRV) decreases accordingly. For samples with a high fracture density, the interaction is the most obvious, and for samples with a low fracture density, the interaction is the weakest. For samples made of unit blocks of 30 mm, mixed branch and diversion behaviors occur frequently among the cement natural fractures; however, for samples made of unit blocks of 70 mm, most of the HFs propagate along NF, and the behavior of arrest occurs frequently. From the results, we can also see that cement characteristics of natural fractures also have a significant influence on the HF and NF interaction. We also count the situations of the interactions between HF and NF, as shown in Figure 9. For the sample with dense natural fracture density, the branch behavior is at dominant; for the sample with sparse natural fracture density, the arrest behavior is dominant; for the sample with medium natural fracture density, the behaviors of branch and diversion co-exist. The statistical result further indicates that it is prone to forming a fracturing network during formation, with a high fracture density.
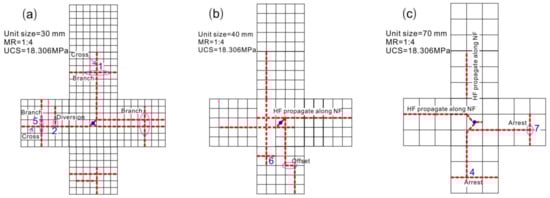
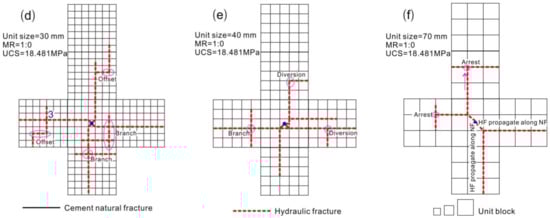
Figure 8.
Sketch of the interaction between NFs and HFs. (a–c) Unit block size is 30, 40, and 70 mm, respectively; the mix ratio of paste cement fracture is 1:4. (d–f) Unit block size is 30, 40, and 70 mm, respectively; the mix ratio of paste cement fracture is 1:0.
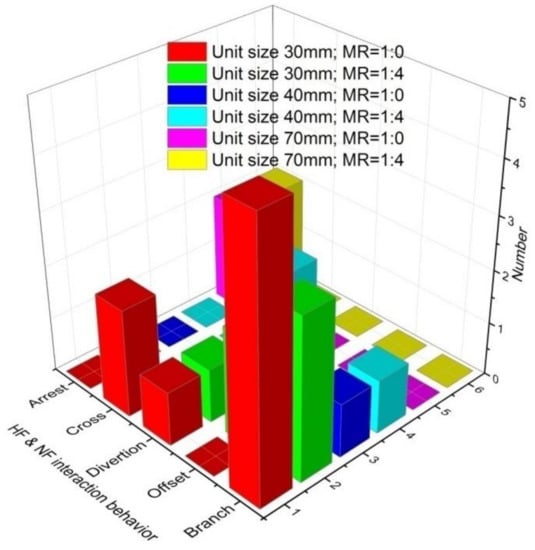
Figure 9.
Statistical result of the interactions between NFs and HFs (main mechanical behaviors include cross, branch, diversion, offset and arrest).
The fractures from the horizontally perforated natural fracture tips have very different geometric characteristics, exemplifying mixed mode I-II (tensile and shear fracture) (typical points of 1, 2, 3, 4) and mixed mode I-III (tensile and tearing fracture) (typical points of 5, 6, 7, 8), as shown in Figure 8. This observation is in agreement with the results of Bahorich et al. [14], which further prove the existence of the mixed mode I-II and mixed mode I-III fracture modes during hydraulic fracturing. In Figure 10a, the red arrows represent the shear state on the natural fracture surface after the vertical hydraulic fracture opens. Hydraulic fractures are shown in yellow, and their widths are greatly exaggerated for visual purposes. The enlarged section shows how shear forces are applied to the leading edge of the crack perpendicular to the right edge of the cement crack; it shows a mixed mode I-II. Figure 10b depicts an idealized sketch of the fracture intersection in unit blocks (point 5~8, in Figure 8). The red arrows indicate the shear applied to the fracture plane parallel to the leading edge of the fracture. It shows a front view of the actual hydraulic fracture intersecting the natural fracture. The zoomed-in section shows the goose train crack propagating in the mixed I-III mode. From Figure 8, the mixed fracture mode is different from the samples with various fracture densities. Mixed modes I-II and I-III are much more obvious for the dense natural fracture situation and vice versa.
Figure 10.
Sketches of the mixed I-II and mixed I-III modes for the fractured model blocks (revised from the literature of [14]). The red arrows show shear on the natural fracture surface due to the opening in vertical HF. Hydraulic fractures are shown in yellow. (a) Mixed mode I-II mode. (b) Appears as a trapezoidal crack of mixed mode I-III. The enlarged portion of (a) shows shear action perpendicular to the fracture leading edge. The enlarged portion of (b) shows a stepped crack propagating in a mixed I-III mode.
3.3. Failure Morphology Analysis
To observe the morphology of the failure plane and to assess the effectiveness of hydraulic fracturing, we need to first remove the cement mixture that is filled around the big cubic block. Under the action of natural expansive force by the static cracking agent, the cubic big block can be opened along the already existing HFs. Figure 11 shows the failure morphology of the big cubic blocks composed of different sizes of unit blocks (i.e., 30, 40, and 70 mm). As shown in Figure 11a–c, the mix ratio of the paste cement natural fracture is 1:0, the number of hydraulic fractures on the main fracture surface decreases with the decrease in natural fracture density; and the non-linear mechanical behaviors are simplified with the decrease in natural fracture density. For a block model with a dense fracturing network (i.e., unit block size is 30 mm), along the propagation path, hydraulic fractures offset, divert and branch, and the model block is fractured into small block units. For a block model with a medium fracture network (i.e., unit block size is 40 mm), hydraulic fractures offset, branch, and propagate along the pre-existing natural fractures. For a block model with a sparse fracture network (i.e., unit block size is 70 mm), the communication degree of HF and NF is weaker than those of dense and medium cases, and the total contact area between HFs and NFs is the lowest. From Figure 11e–f, the mix ratio of the paste cement of the natural fracture is 1:4. The failure morphology is obviously different from the results in Figure 11a–c. This result indicates that the strength characteristics of the natural fracture have some influences on the interaction between HFs and NFs and the associated hydraulic fracturing effectiveness.
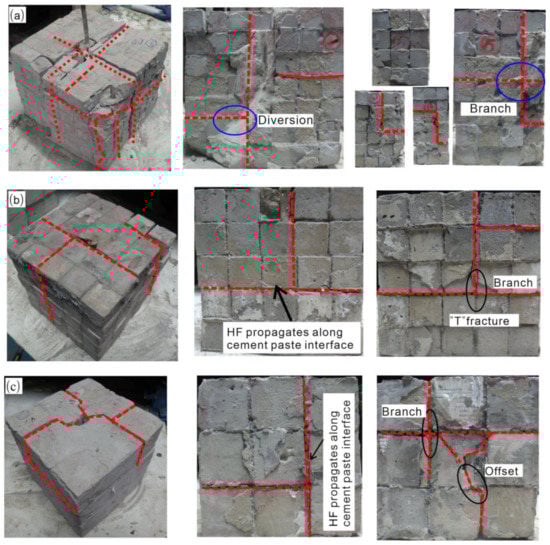
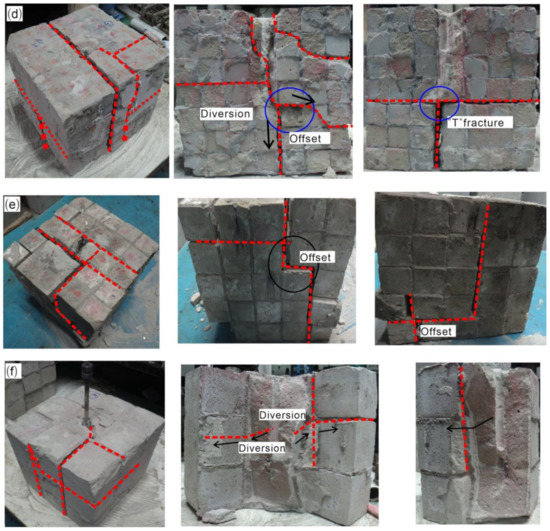
Figure 11.
Sketch of the failure morphology fracturing planes with different NFD. (a–c) Model blocks with dense, medium, and sparse DFN connectivity, and the mix ratio of the cement paste interface is 1:0. (d–f) Model blocks with dense, medium and sparse DFN connectivity, and the mix ratio of cement paste interface is 1:4.
From the failure morphology of the model blocks, it also can be seen that samples with weaker cemented fractures can allow the hydraulic fracture to more easily break the cement and create a crossing geometry. The geometry of the fracturing network is simple. This indicates that the interaction of HF vs. NF is also controlled by natural fracture strength, leak-off of the injected fluid alters the net pressure on natural fractures, and shear slippage occurs during the propagation of HF, which are strongly influenced by the mechanical properties of the filled cement characteristics in NF [18].
3.4. Hydraulic Fracturing Effectiveness Evaluation
The fracture surface morphology gives deep insight into the effects of NFD on hydraulic fracture propagation. Many scholars have proposed some indices to assess the effectiveness of fracturing treatment, such as leak-off ratio [10], stimulated formation area [12,25], and the stimulated natural fracture length [18]. These indices are all based on two-dimensional laboratory and numerical experiments. As is known, the stimulated reservoir volume is the three-dimensional reflection of the interactions between HFs and NFs [26,27,28,29,30,31]. To consider the spatial configuration of the fracturing network, and to well describe the interaction between HF and NF, an index of “P-SRV” was proposed to investigate the effectiveness of fracturing treatment for the experiments. It is an index to reflect the fracture volumetric intensity, and it is expressed as below:
where Vblock is the model block volume, and Ai is the surface area of NFs and HFs.
In this section, the “P-SRV” value was calculated using the total area of hydraulic fractures, and the physical meaning of Equation (1) reflects the probability of fractability for a naturally fractured reservoir. It considers the spatial distribution of fracturing surface compared to the indices defined by others. We obtain the area of fracture surface by calculating the total surface area of the unit blocks. For the three kinds of unit blocks, the side lengths are 30, 40, and 50 mm, respectively. Each area of the three-unit blocks can be known. Then, the total fracture surface area in the model block can be obtained by counting the number of unit blocks. For the three model blocks with different NFD in Figure 11a–c, the total area of the fracture surface is about 96,300, 57,400 and 50,400 mm2, respectively; and for the cases in Figure 11e–f, the total area of the fracture surface is about 85,300; 51,400; and 49,600 mm2, respectively. The relationship between NFD and P-SRV and fracture density is shown in Figure 12. The results indicate that the sample with dense fracture connectivity is better at forming a complex fracturing network. However, the fracturing effectiveness is the poorest for samples with a sparse fracture network. This result is consistent with the analysis in Section 3.2. The sample with complex interactions between HFs and NFs is good at forming a complex fracturing network, and the fracturing effectiveness is good, accordingly.
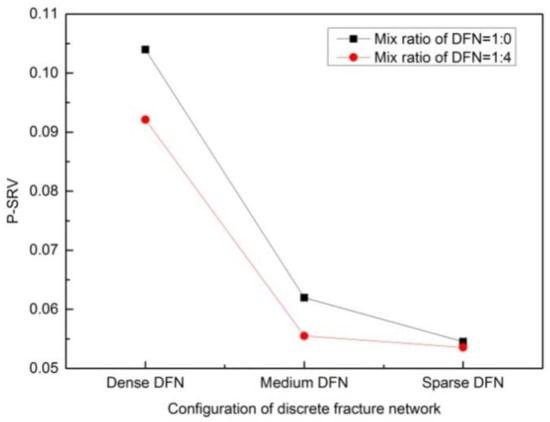
Figure 12.
The plot of the index of P-SRV against dense, medium, and sparse DFN connectivity models.
Another index used to analyze the hydraulic fracturing effectiveness is the ratio of the ultrasonic pulse velocity (UPV) after and before hydraulic fracturing tests. The expression is as below:
where UPVF is the velocity of the ultrasonic wave of samples after the hydraulic fracturing test; UPVO is the velocity of the ultrasonic wave of samples before the hydraulic fracturing test. After the hydraulic fracturing test, the samples were kept in the air for seven days to measure the UPV and in order to ignore the influence of water on UPV.
As shown in Figure 3d, three profiles, “a-a”, “b-b”, and “c-c”, were selected to measure the UPV. The p wave transmission method of the ZBL-525 tester consists of two piezoelectric transducers (a transmitter and a receiver) with a resonant frequency of 130 kHz, which are located on the relative and parallel sides of the sample. For the same profile, the value of RF decreases with the increasing DFN density; in addition, for the sample with the same DFN density, RF is different. These results indicate that the propagation path of the hydraulic fractures is very complex, and it further implies the complicated interactions between the HFs and the NFs. The plots of the index RF against the natural fracture density are displayed in Figure 13.
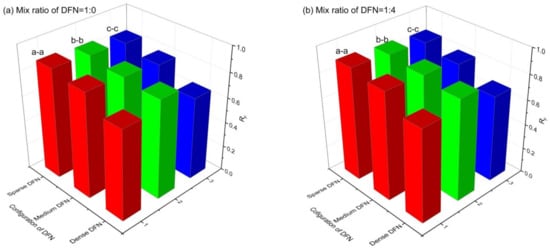
Figure 13.
The plot of the index RF against natural fracture density. The terms “a-a”, “b-b”, and “c-c” indicate that three profile were selected to measure the velocity. (a) Model blocks with 1:0 mixed cement paste interface; (b) Model blocks with 1:4 mixed cement paste interface.
4. Discussion
In this work, using a laboratory experiment, we demonstrated the impact of NF density on the propagation characteristics of hydraulic fractures in naturally fractured formations. Although many studies have reported that NFs have a significant effect on hydraulic fracturing by using numerical and laboratory experiments, studies on the influence of fracture density on hydraulic fracture propagation are relatively less. Through numerical simulations by Savitski et al. [10] and Wang et al. [12], it was concluded that NF connectivity plays a crucial role in the evaluation of fracturing performance in unconventional shale reservoirs, and natural fracture density plays a crucial role in optimizing on-site hydraulic fracturing treatment. However, the effects of natural fracture density on non-linear behaviors (cross, offset, diversion, etc.,) of the propagation of hydraulic fractures were not detailed in their works. Fan and Zhang [15] carried out model experiments with two sets of continuous orthogonal cemented fracture model blocks and considered two fracture densities. However, the physical models were composed of continuous natural fractures, and detailed descriptions about the HF and NF interaction behaviors were not studied; moreover, the response of fracture propagation to cement strength of natural fractures was not studied. It has been shown that natural fracture density affects the propagation path of hydraulic fractures and thus forms a complex fracture network. Experiments on different cemented fractures reflect the influence of different natural fracture permeabilities on the geometry of fracture networks. Fluid can pass through cemented natural fractures. An adjacent hydraulic fracture may still be able to restart growth at the distal end via the fluid pressure.
In this work, a new index considering the spatial contact area of HFs and NFs is proposed to evaluate the overall response of block models subjected to fluid pressure. The defined index of “P-SRV” and RF can reflect the interaction degree between HFs and NFs; the results imply that the “P-SRV” value increases with increasing natural fracture density. The experimental results also show that fracture intersection geometries are complex: bypass, across, offset, diversion, cracking of weakly bonded interfaces, and a mixed propagation mode may occur during the interactions between hydraulic fractures and the cemented natural fractures. The experimental results imply that there is an urgent need to develop fully coupled 3D computer models. Using the model, we can account for the complex interactions between NFs and HFs, including mixed I-II and I-III fracture modes, and we can realistically simulate fracturing network morphology in shale formations. The limitation of the methods help to obtain the index of P-SRV and the total area of the fracture surface. In model blocks, the hydraulic fracturing network may be complex, and the fractures propagate into the sample; thus, it is difficult to obtain information of the entire fracture surface. However, X-ray computed tomography can be employed to reconstruct the fractured model by identifying, extracting, the analyzing the fracture surface.
In this work, the tested rock blocks were prepared with different natural fracture densities under the same experimental conditions, i.e., stress ratio and pumping rate. The influence of testing conditions on hydraulic fracturing network propagation is not involved in this work. In future studies, many more effects should be attempted to reveal the interactions between the rock structure and experimental conditions. In addition, the static and monotonous hydraulic fracturing tests were performed on rock blocks, and the dynamic loading conditions were not considered herein. However, the repeat fracturing treatment and multiple stage fracturing treatment are essentially cyclic. Although cyclic or fatigue loading tests have been performed extensively, most of the studies focused on rock fracturing caused by mechanical loading [32,33,34,35]. The cyclic injection action on rock fracturing is not well understood; therefore, deep investigations should be performed on shale formations exposed to cyclic or fatigue fracturing conditions.
5. Conclusions
In this work, large-scaled true triaxial hydraulic fracturing tests for model blocks with dense, medium, and sparse DFN connectivity were performed to investigate the effects of density of the pre-existing natural fracture on the propagation of hydraulic fractures. Using the designed experimental projects here, it is not a substitute model for fracturing design, but rather, it can assist us in realizing the influences of fracture density on hydraulic fracture propagation. Some main conclusions can be drawn from this work:
- (1)
- Natural fracture density is critical to the propagation behaviors of hydraulic fractures during fluid injection. The experimental results indicate that the natural fracture density plays a crucial role in the initiation and propagation of hydraulic fractures, and fracture density will play a significant role in making decisions for gas well production, treating pressures, and the corresponding stimulated reservoir volumes.
- (2)
- A new index that can reflect the fracturing effectiveness is proposed to consider the spatial evolution of the fracturing network. The fracturing effectiveness increases with the increase in natural fracture density, and the non-linear behaviors of HF and NF interactions can be well reflected by an index of “P-SRV”.
- (3)
- The dense fracture network is prone to changing the propagation paths of hydraulic fractures, and the resulting branching, offsetting, and diverting behaviors can easily occur. In addition, evidence of mixed mode I-II and I-III propagation modes can be observed from the experimental results. It is suggested that we should develop fully 3D simulation models to account for the mixed mode fracture propagation behaviors and to perfect the existing simulation models.
Author Contributions
Methodology, Y.W.; Formal analysis, J.W.; Writing—original draft, X.L. All authors have read and agreed to the published version of the manuscript.
Funding
This research was funded by the Geological Survey Project of CGS (DD20221730) and by the National Natural Science Foundation of China (52174069).
Institutional Review Board Statement
Not applicable.
Informed Consent Statement
Informed consent was obtained from all subjects involved in the study.
Data Availability Statement
All the data required to evaluate the conclusions of this study are present in the paper. The authors will provide additional data related to this paper upon request.
Conflicts of Interest
The authors declare no conflict of interest.
References
- Gale, J.F.W.; Laubach, S.E.; Olson, J.E. Natural fractures in shale: A review and new observations. AAPG Bull. 2014, 98, 2165–2216. [Google Scholar] [CrossRef]
- Ding, W.; Li, C.; Li, C.; Xu, C.; Jiu, K.; Zeng, W.; Wu, L. Fracture development in shale and its relationship to gas accumulation. Geosci. Front. 2012, 3, 97–105. [Google Scholar] [CrossRef]
- Khan, J.A.; Padmanabhan, E.; Haq, I.U.; Yekeen, N.; Mumtaz, M.; Prajapati, S. Experimental assessment of fracture initiation and wettability in low and high brittle shales by CO2 foam fracturing fluids. Energy Fuels 2022, 36, 8288–8300. [Google Scholar] [CrossRef]
- Zou, J.; Jiao, Y.Y.; Tan, F.; Lv, J.; Zhang, Q. Complex hydraulic-fracture-network propagation in a naturally fractured reservoir. Comput. Geotech. 2021, 135, 104165. [Google Scholar] [CrossRef]
- Lei, Y.; Luo, X.; Wang, X. Characteristics of silty laminae in Zhangjiatan Shale of southeastern Ordos Basin, China: Implications for shale gas formation. AAPG Bull. 2015, 99, 661–687. [Google Scholar] [CrossRef]
- De Sousa Junior, L.C.; dos Santos, L.O.S.; de Souza Rios, V.; Araújo, C.; Celes, W.; Sepehrnoori, K. Methodology for geomechanically controlled transmissibility through active natural fractures in reservoir simulation. J. Pet. Sci. Eng. 2016, 147, 7–14. [Google Scholar] [CrossRef]
- Yang, K.; Gao, D. Numerical simulation of hydraulic fracturing process with consideration of fluid–solid interaction in shale rock. J. Nat. Gas Sci. Eng. 2022, 102, 104580. [Google Scholar] [CrossRef]
- King, G.E. Thirty years of gas shale fracturing: What have we learned? Paper SPE 133456. In Proceedings of the SPE Annual Technical Conference and Exhibition, Florence, Italy, 19–22 September 2010. [Google Scholar]
- Gale, J.F.W.; Reed, R.M.; Holder, J. Natural fractures in the Barnett Shale and their importance for hydraulic fracture treatments. AAPG Bull. 2007, 91, 603–622. [Google Scholar] [CrossRef]
- Zhang, J.; Yu, Q.; Li, Y.; Pan, Z.; Liu, B. Hydraulic fracture vertical propagation mechanism in interlayered brittle shale formations: An experimental investigation. Rock Mech. Rock Eng. 2022, 1–22. [Google Scholar] [CrossRef]
- Wang, Y.; Yi, X.F.; Li, P.; Cai, M.F.; Sun, T. Macro-meso damage cracking and volumetric dilatancy of fault block-in-matrix rocks induced by freeze–thaw-multistage constant amplitude cyclic (F-T-MSCAC) loads. Fatigue Fract. Eng. Mater. Struct. 2022, 45, 2990–3008. [Google Scholar] [CrossRef]
- Wang, Y.; Li, X.; Zhou, R.Q.; Tang, C.A. Numerical evaluation of the shear stimulation effect in naturally fractured formations. Sci. China Earth Sci. 2015, 58, 371–383. [Google Scholar] [CrossRef]
- Zhai, M.; Wang, D.; Zhang, Z.; Zhang, L.; Yang, F.; Huang, B.; Zhong, A.; Li, L. Numerical simulation and multi-factor optimization of hydraulic fracturing in deep naturally fractured sandstones based on response surface method. Eng. Fract. Mech. 2022, 259, 108110. [Google Scholar] [CrossRef]
- Bahorich, B.; Olson, J.E.; Holder, J. Examining the effect of cemented natural fractures on hydraulic fracture propagation in hydrostone block experiments. In Proceedings of the SPE Annual Technical Conference and Exhibition, San Antonio, TX, USA, 8–10 October 2012. [Google Scholar]
- Fan, T.; Zhang, G. Laboratory investigation of hydraulic fracture networks in formations with continuous orthogonal fractures. Energy 2014, 74, 164–173. [Google Scholar] [CrossRef]
- Wang, Y.; Li, X.; Zhang, B. Analysis of fracturing network evolution behaviors in random naturally fractured rock blocks. Rock Mech. Rock Eng. 2016, 49, 4339–4347. [Google Scholar] [CrossRef]
- Dehghan, A.N.; Goshtasbi, K.; Ahangari, K. The effect of natural fracture dip and strike on hydraulic fracture propagation. Int. J. Rock Mech. Min. Sci. 2015, 75, 210–215. [Google Scholar] [CrossRef]
- Wang, Y.; Li, C.H. Investigation of the effect of cemented fractures on fracturing network propagation in model block with discrete orthogonal fractures. Rock Mech. Rock Eng. 2017, 50, 1851. [Google Scholar] [CrossRef]
- Wang, Y.; Li, X.; He, J.; Zhao, Z.; Zheng, B. Investigation of fracturing network propagation in random naturally fractured and laminated block experiments. Energies 2016, 9, 588. [Google Scholar] [CrossRef]
- Berchenko, I.; Detournay, E.; Chandler, N.; Martino, J. An in-situ thermo-hydraulic experiment in a saturated granite I: Design and results. Int. J. Rock Mech. Min. Sci. 2004, 41, 1377–1394. [Google Scholar] [CrossRef]
- Casas, L.; Miskimins, J.L.; Black, A.; Green, S. Laboratory hydraulic fracturing test on a rock with artificial discontinuities; SPE paper no. 103617-MS. In Proceedings of the PE Annual Technical Conference and Exhibition, San Antonio, TX, USA, 24–27 September 2006. [Google Scholar]
- Sarmadivaleh, M.; Rasouli, V. Test design and sample preparation procedure for experimental investigation of hydraulic fracturing interaction modes. Rock Mech. Rock Eng. 2015, 48, 93–105. [Google Scholar] [CrossRef]
- Bandis, S.C.; Barton, N.R.; Christianson, M. Application of a new numerical model of joint behaviour to rock mechanics problems. In Proceedings of the International Conference on Rock Joints, Lulea, Sweden, 15–20 September 1985; pp. 345–356. [Google Scholar]
- Guo, T.; Zhang, S.; Qu, Z.; Zhou, T.; Xiao, Y.; Gao, J. Experimental study of hydraulic fracturing for shale by stimulated reservoir volume. Fuel 2014, 128, 373–380. [Google Scholar] [CrossRef]
- Hou, B.; Chen, M.; Li, Z.M.; Wang, Y.H.; Diao, C. Propagation area evaluation of hydraulic fracture networks in shale gas reservoirs. Pet. Explor. Dev. 2014, 41, 833–838. [Google Scholar] [CrossRef]
- Mayerhofer, M.J.; Lolon, E.P.; Warpinski, N.R.; Cipolla, C.L.; Walser, D.; Rightmire, C.M. What is stimulated rock volume (SRV)? In Proceedings of the 2008 SPE Shale Gas Production Conference, Fort Worth, TX, USA, 16–18 November 2008; SPE 119890.
- Kresse, O.; Cohen, C.; Weng, X.; Gu, H.G.; Wu, R.T. Numerical modeling of hydraulic fracturing in naturally fractured formations. In Proceedings of the 45th US Rock Mechanics Symposium, San Francisco, CA, USA, 26–29 June 2011. Paper ARMA 11-363. [Google Scholar]
- Cooke, M.L.; Pollard, D.D. Fracture propagation paths under mixed mode loading within rectangular blocks of polymethyl methacrylate. J. Geophys. Res. 1996, 101, 3387–3400. [Google Scholar] [CrossRef]
- Wang, Y.; Li, X.; Zhang, B.; Zhao, Z.H. Optimization of multiple hydraulically fractured factors to maximize the stimulated reservoir volume in silty laminated shale formation, Southeastern Ordos Basin, China. J. Pet. Sci. Eng. 2016, 145, 370–381. [Google Scholar] [CrossRef]
- Nagel, N.B.; Sanchez-Nagel, M.A.; Zhang, F.; Garica, B.L. Coupled numerical evaluations of the geomechanical interactions between a hydraulic fracture stimulation and a natural fracture system in shale formations. Rock Mech. Rock Eng. 2013, 46, 581–609. [Google Scholar] [CrossRef]
- Kim, C.M.; Abass, H.H. Hydraulic fracture initiation from horizontal wellbores: Laboratory experiments. In Proceedings of the 32nd US Symposium, Rotterdam, Balkema; Balkema, A.A., Ed.; American Rock Mechanics Association: Alexandria, VA, USA, 1991; pp. 231–240. [Google Scholar]
- Wang, Y.; Tan, P.F.; Han, J.; Li, P. Energy-driven fracture and instability of deeply buried rock under triaxial alternative fatigue loads and multistage unloading conditions: Prior fatigue damage effect. Int. J. Fatigue 2023, 168, 107410. [Google Scholar] [CrossRef]
- Wang, Y.; Su, Y.; Xia, Y.; Wang, H.; Yi, X. On the effect of confining pressure on fatigue failure of block-in-matrix soils exposed to multistage cyclic triaxial loads. Fatigue Fract. Eng. Mater. Struct. 2022, 45, 2481–2498. [Google Scholar] [CrossRef]
- Cerfontaine, B.; Collin, F. Cyclic and fatigue behaviour of rock materials: Review, interpretation and research perspectives. Rock Mech. Rock Eng. 2018, 51, 391–414. [Google Scholar] [CrossRef]
- Wang, Y.; Mao, T.; Xia, Y.; Li, X.; Yi, X. Macro-meso fatigue failure of bimrocks with various block content subjected to multistage fatigue triaxial loads. Int. J. Fatigue 2022, 163, 107014. [Google Scholar] [CrossRef]


Disclaimer/Publisher’s Note: The statements, opinions and data contained in all publications are solely those of the individual author(s) and contributor(s) and not of MDPI and/or the editor(s). MDPI and/or the editor(s) disclaim responsibility for any injury to people or property resulting from any ideas, methods, instructions or products referred to in the content. |
© 2023 by the authors. Licensee MDPI, Basel, Switzerland. This article is an open access article distributed under the terms and conditions of the Creative Commons Attribution (CC BY) license (https://creativecommons.org/licenses/by/4.0/).