1. Introduction
Wind energy is one of the environmentally friendly renewable energy sources that is being harvested around the world using turbines from tens of watts to megawatts [
1,
2,
3]. The energy potential has been measured in several places and environments using different approaches incorporating geospatial data, direct measurements, geographic data, estimations, etc. [
4,
5,
6,
7,
8], in order to assess and harvest the wind energy. Currently, there is an increase in the harnessing of small wind turbines (SWTs), which are being used in several ways and applications. Wind turbines are considered small when the swept area is equal to or lower than 200 m
, when generating voltages lower than 1000 V AC or 1500 V DC, and when producing rated power equal or less than 50 kW [
9]. SWTs are used as standalone devices for milling, pumping and producing electricity in rural areas; and for feeding telecommunications towers, offshore platforms and other marine applications [
1].
SWTs are considered as one of the most promising renewable energy sources (RESs) that can be used in urban areas, where the SWTs must be grid-connected. SWTs are integrated in small wind generation systems (SWGS), which are commonly composed of a wind turbine, a permanent magnet synchronous generator (PMSG), a power converter, and control systems [
1,
4,
10]. There are a lot of challenges that need to be faced and solved in the deployment of SWGS: the maximum power extraction of the wind turbine–generator system [
11,
12,
13,
14,
15,
16,
17], the selection of power converters [
18,
19,
20,
21], the rejection of perturbations produced by the grid [
22], and the technology adaptation, which are some of the most significant ones [
19,
23,
24,
25].
As, inherently, SWTs working with PMSGs produce low power, the main focus of researchers has been achieving the maximum power extraction of small wind generation systems [
11,
12,
13,
14,
15,
16,
17]. In this way, the authors of [
11] proposed a distributed maximum-power-point tracking algorithm that reduces the numbers of current sensors, and consequently the cost of the control solution. Additionally, the study highlighted the presence of the maximum power point in PMSGs through laboratory experiments. Another contribution to the power extraction of SWT and a PMSG is presented in [
12]; the authors developed a model-based maximum power point tracking (MPPT) solution for wind generation systems. The presented solution includes the concept of a loss-free resistor, which interconnects the PMSG and the load to perform optimal impedance matching—i.e., set the impedance of the generator to provide the maximum power to the load. There is no detail on rejecting the voltage oscillation produced by the AC load. As the last two MPPT solutions were applied to SWGSs, both could be used in the control of modern SWGS; however, it is necessary to consider the challenges raised when the SWGS is grid-connected, as oscillation with the double of the AC grid frequency occurs.
Similarly, the authors of [
26] focused on developing a modified MPPT algorithm for SWTs using a PMSG. Their paper reports simulation results demonstrating that a modified incremental conductance technique, based on measuring the speed shaft and estimating the torque, can enhance the power extraction. Nevertheless, the work does not report experimental tests, the measure of mechanical variables make the control slower, and there is no control design for the generation system. Another study is presented in [
27]. The authors focused on enhancing the MPPT by developing a constant current control scheme for the DC/DC converter. The results demonstrate better performance than other solutions reported in the literature. However, the control system does not consider the perturbations caused by a grid connection; therefore, the solution is available only for DC loads.
Other contributions, such as those presented in [
13,
14,
15,
17], are devoted to MPPT solutions, control of DC/DC converters, and simulations using Matlab/Simulink. The authors of [
13,
14] presented a MPPT algorithm applied to a SWT-PMSG connected to a DC microgrid, where the PMSG is interfaced with the DC microgrid through a boost converter. That effective solution was shown only using simulations in Matlab/Simulink. The authors of [
17] presented a power extraction method based on rules controlling a classical boost converter. That solution is compared with a perturb-and-observe MPPT and was simulated using Simulink. The results are significant but limited to simulations results. The contribution presented in [
15] is focused on a MPPT algorithm to extract the maximum output power of the turbine using a current controller. The paper presents the Simulink SWT implementation, and the controllers, both the rectifier and the DC/DC boost, were implemented in real hardware. An interesting topic covered in that paper is the size of the small turbine (300 W), which can be considered as a pico-turbine, and it was the focus of recent investigations aiming to develop grid-connected pico-generators.
The solutions in [
28,
29] focused on control design for an SWT with a PMSG, a rectifier, and an inverter for grid connection; both solutions use control loops to extract the maximum available power based on the reference provided by an MPPT algorithm. The solutions report the control loops for AC current injection into the grid. The main difference among those works concerns the converter adopted for extracting the power. For example, Ref. [
28] proposes a controlled rectifier with an MPPT based on measuring shaft torque and speed. Instead, Ref. [
29] presents an uncontrolled three-phase rectifier and a boost converter. The solutions exhibited satisfactory performance in a simulation environment; however, no experimental verification was provided. Moreover, none of the solutions consider the perturbations caused by the grid connection; thus, the rejection of such a perturbation was not analyzed.
Another current topic in the development of SWGSs is the selection of the power converters. When a PMSG is connected to an AC grid, three stages are required. The first one is a rectifier or AC/DC converter; in the middle, a DC/DC converter; and in the output stage, an inverter or DC/AC converter. The solutions recently presented in [
18,
19,
20,
21] are devoted to the analysis and selection of those converters. In [
21], a deep review of the AC/DC converter is presented. The authors identified several topologies that offer similar results but are different in economic cost, and the analysis includes the control complexity and the use of sensors. However, a very simple three-phase rectifier without additional inductance more than the PMSG impedance was not analyzed. This kind of rectifier reduces the economic cost of the whole converter and offers adequate rectification. Additionally, the authors of [
18] proposed a low-cost converter for the first stage devoted to obtain the maximum power per ampere of the PMSG. The converter corresponds to a DCM SEPIC with a single power electronic switch. The controller proposed in that solution is aimed at achieving the maximum power per ampere while reducing the size of the converter’s inductive filter by considering the PMSG internal reactance as part of the filter. An experimental platform to emulate the SWT and the PMSG is presented; however, the use of commercial elements specifically designed to extract the power of SWT needs to be investigated. A modified version of the conventional passive rectifier and a boost converter are investigated in [
20]. The authors replaced those elements through generator-phase inductance and returning the boost-current controller found in systems equipped with boost inductance. Modifications to traditional converters are welcome in order to use available mature technology; however, it is required to consider perturbations that come from the DC/AC stage, e.g., the oscillation at double the AC frequency. The DC/AC stage is covered in [
19], where the authors analyze the requirements of those converters, but the detailed design of the control system is not present on the paper.
Another topic in SWT-PMSGs connected to AC systems faced by researchers is the control of the power converter. In this way, the authors of [
22] presented three classical PI controllers applied to the SWGS, and the block diagrams of the controllers are also presented. One controller is applied to the speed, and the other two are applied to the direct and quadrature currents of the PMSG models. The control actions are applied through the AC/DC and the DC/AC stages of the converter. The validity of the control solution is supported through simulations in SimPowerSystems of Simulink version 5.1. The detailed design of controllers is still required, and mainly, it is necessary to design the rejection of the oscillations introduced by the inverter or DC/AC stage.
Technological adaptation is an attractive and significant challenge that has been faced in recent research activities [
19,
23,
24,
25]. As some technologies have been widely addressed, they have reached maturity and can be used in conjunction with other equipment. That is the case for converters used with photovoltaic sources that have been adapted to SWT. Particularly, the authors in [
19] identified a low number of commercial power converters for wind turbines of low power < 1 kW. That situation was faced using photovoltaic power converters because they are available at a reasonable cost. The authors used experiments to validate the operation of the proposed hardware adaptation with promising results. This experience can be replicated in order to integrate devices allowing to connect SWT-PMSG to the AC grid in the consumption level. For example, the work presented in [
23] highlights the importance of using micro-wind turbines in urban areas to promote distributed generation of power, to reduce the emission of greenhouse gases and to support the transition to transport-system electrification.
To contribute in the spread of micro-wind turbines, it is possible to integrate technology that allows one to connect those small sources to the AC grid in the urban areas. In a similar way, contributions presented in [
24,
25] are focused in providing useful information for the spread of small wind turbines. The authors of [
24,
25] presented a low-cost safety system for a small wind turbine, by performing an extensive number of performance tests on a small wind turbine, by which the height of its tower was reduced.
The main objective of this paper is to propose a grid-connected small wind generation system, which is composed of a commercial small wind turbine (140 W), a PMSG with an uncontrolled rectifier, a flyback converter with a high-voltage transformation ratio, an inverter, and control systems to damp the oscillation transferred by the inverter. Thus, the proposed system is able to extract the maximum power of the PMSG, and it rejects the grid perturbations. In fact, a new control system was developed to regulate the flyback converter, which ensures a reduction of 90% in the current oscillations caused by the grid connection. In addition, the settling time of the generator current was set to 0.315 ms, which is 25 times smaller than the period of the sinusoidal perturbation, hence providing fast compensation. This wind generation system is a solution to harvest the wind energy with small wind turbines and deliver the power to a distribution system or an AC microgrid. It also provides modularity to distributed units. To validate the proposed solution, an experimental setup was implemented using commercial devices, where a permanent magnet DC motor was used to emulate the mechanical torque of a turbine facing the wind; a commercial PMSG in conjunction with an uncontrolled rectifier, a filter, and a Texas Instruments development kit were integrated into the experimental setup. Finally, the experiments confirmed the extraction of the maximum available power from the commercial small wind generation system under all the operation conditions.
In
Section 2, the characterization of the wind-turbine generation system is presented. Through experiments, the existence of an MPP for each speed is demonstrated; in addition, the experimental curves show that the wind-turbine generation system (WTGS) is nearly represented with a Thevenin equivalent; and the need for an MPPT algorithm is highlighted.
Section 3 is dedicated to the mathematical modeling of the flyback converter, the current controller’s design, and the mitigation of the oscillation at double the grid frequency that can be transmitted to the current of the PMSG. In
Section 4, the WTGS is integrated with the flyback converter, the inverter, and the designed current controller. Additionally, the system is connected to the AC grid, and its integration is validated through several experiments. Finally, the conclusions are presented in
Section 5.
2. Characterization of the Small-Wind-Turbine Generation System
A small generation set formed by an SWT and a PMSG is called a WTGS; this system can be used in urban areas to inject energy into the grid or in rural areas to feed isolated loads.
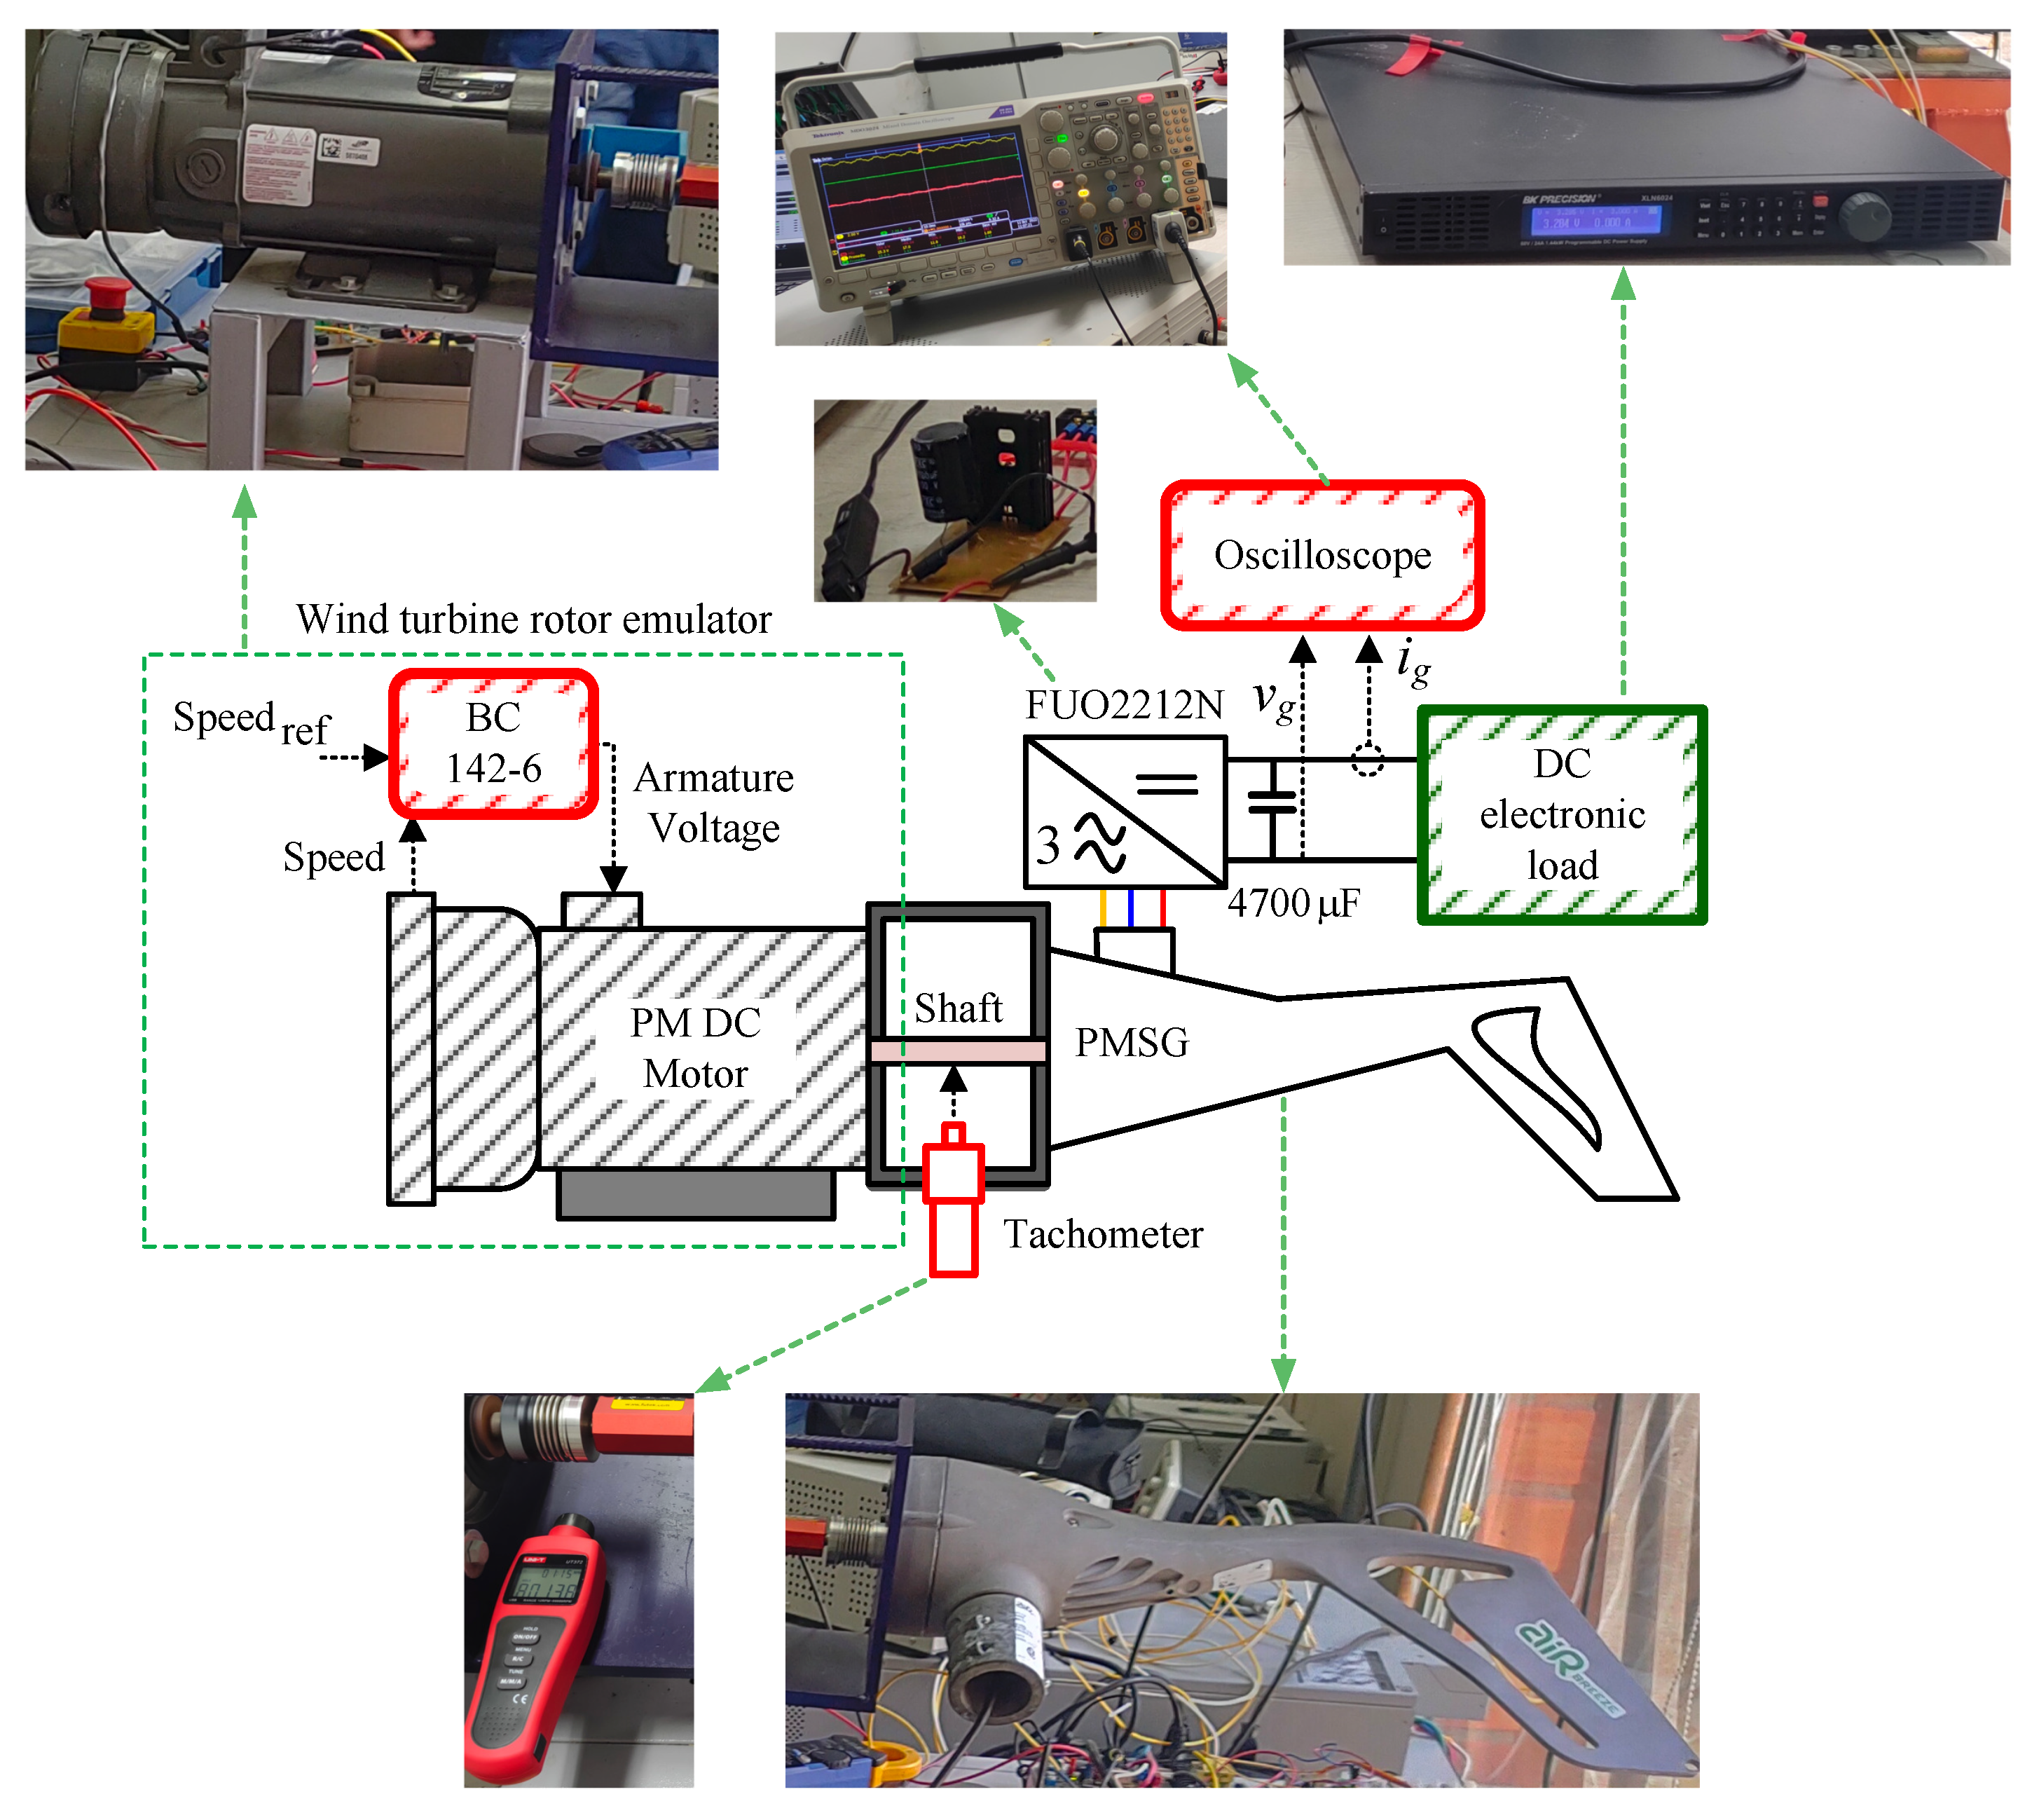
Figure 1 shows a WTGS scheme in a laboratory environment, which enables one to reproduce any wind profile. In that scheme, a permanent magnet (PM) DC motor emulates the wind and the turbine rotor that delivers the power to the PMSG through the shaft. The PM DC motor has speed control to guarantee a stable speed at all operating points. The figure shows the experimental platform constructed with an Air Breeze wind turbine with a PMSG, the Baldor PM DC motor, and the motor-speed control card Baldor BC142-6 (Baldor Electric Company, Fort Smith, AR, USA). To give the speed reference for the motor controller, a DC power source BK Precision XLN6024 (Ainuo Instrument Co., Ltd., Jinan, China) is used. The DC source gives the necessary voltage to the speed-control card.
Carrying out several tests at different operating points will characterize the WTGS; therefore, a three-phase rectifier FUO2212N (Digi-Key, Thief River Falls, MN, USA) and a 4700
F capacitor allow one to connect a DC electronic load to the WTGS, as shown in
Figure 1. An oscilloscope and a tachometer also allow for registering the generator voltage
, current
, and the speed shaft.
Figure 1 shows the Tektronix MDO3024 oscilloscope (Keysight Technologies, Santa Rosa, CA, USA) measuring the voltage, current, and power given by the rectifier to the BK precision 8514 DC load (Tektronix, Inc., Beaverton, OR, USA). Registering the variables also requires the use of a current probe, Tektronix TCP0020; a voltage probe, Tektronix TPP0250; and a Tachometer UNI-T UT372 (Tektronix, Inc., Beaverton, OR, USA). Finally,
Figure A1 shows a detailed description of the physical structure.
The test platform reported in
Figure 1 allows the identification of the system consisting of the commercial wind generator, the three-phase rectifier, and the capacitor. For the identification, the experiment defines a speed shaft and introduces a current sweep using the electronic load while recording both the voltage
and the current
. In the experiments, the generator’s current grew from 0 to 12 A in 40 s, and the speed was kept constant. Those experiments were performed for speeds between 500 and 580 RPM with increments of 20 RPM. The lower limit of the speed was defined by the low voltage provided by the generator at such a speed, which corresponds to the lower input voltage accepted by the flyback converter; the higher speed limit was defined by the maximum current supported by the flyback converter (8.83 A), so increasing the speed could destroy the converter.
Figure 2a,b show the experimental voltage curves in yellow, current in green, and power in red for both 500 and 580 RPM, respectively. Those figures highlight the existence of the maximum power for each speed (
) and its corresponding current (
) and voltage (
); MPP stands for maximum power point. It should be noted that the higher the angular velocity, the more power the WTGS can deliver to the load.
Figure 2c shows the experimental power vs. current curves for the different speeds previously defined, highlighting the
for each speed. Those experiments confirm that the current delivered by the WTGS (which is imposed by the DC/DC converter) must be modified to reach the MPP in each speed condition. Additionally, the
vs.
curves are approximately parabolic, as usually happens in a Thevenin equivalent circuit. Similarly,
Figure 2d shows the experimental
vs.
curves for speeds between 500 and 580 RPM with increments of 20 RPM, indicating the
for each speed. Those experiments show that each curve is approximately linear with a negative slope; hence, such behavior could be accurately modeled with Thevenin’s equivalent circuit.
The data shown in
Figure 2 allows obtaining a model of the WTGS; in this sense, in specialized literature, several models of WTGS have been widely discussed from the mechanical and electrical points of view, including mechanical parameters of the wind turbine and electrical parameters of the PMSG [
30,
31,
32]. Nevertheless, for control purposes, those models require the identification of each parameter and sensing of the mechanical and electrical variables, which requires complex and costly hardware.
Instead, this paper proposes the design of a classical control system for the flyback converter, which is used to follow the MPP with a classical MPPT algorithm. In this sense, the focus of the control system is to regulate the current given by the WTGS (
), which is the input current of the flyback converter. Therefore, this paper considers a simpler model of the WTGS based on the experimental results reported in
Figure 2.
Based on the previous discussion,
Figure 3a shows the wind turbine, PMSG, rectifier, and capacitor as a unified system, which can be modeled with its Thevenin equivalent shown in
Figure 3b. Equation (
1) represents the equivalent model of the WTGS, where
is the open circuit voltage of the WTGS for each speed shaft.
is the equivalent resistance representing the slope magnitude of the
vs.
curve shown in
Figure 2d. Then, there are unique
and
values for each speed shaft.
The Thevenin parameters for the experimental platform (
and
) were obtaining by using the data from
Figure 2 and the curve-fitting toolbox of Matlab, which allows estimating the parameters for each speed.
Table 1 shows a summary of the resulting parameters of the Thevenin equivalent model, which can be used for control and simulation purposes. In fact, those parameters are used in the next section to design the current controller of the system.
As previously discussed, this paper proposes a control method for the DC/DC converter interfacing the WTGS, which must to follow the current reference given by the MPPT algorithm. Therefore, one of the goals is to operate the WTGS in the MPP regardless of the speed shaft. In this way,
Figure 4a shows the voltage
(yellow), the current
(blue), and the power
(red) of the WTGS operating at MPP for five different speed values. Thus, this experiment confirms that is necessary to change the operating current of the WTGS to track the MPP conditions.
Figure 4b corresponds to a similar experiment, but considering a constant current
A, which is the
for 580 RPM; the figure shows that such a constant current does not ensure the extraction of the maximum power. Similarly,
Figure 4c shows the experimental behavior of the WTGS operating with a constant voltage
V, which is the
for 580 RPM; in this case, the constant voltage also does not ensure the extraction of the maximum power. These two experiments show that it is impossible to operate at the MPP maintaining constant the voltage or current of the generator. This condition is confirmed in
Figure 4d, which shows the operating points of the WTGS over the
vs.
curves for constant voltage, constant current and MPP operation. The experimental data shows that for any scenario, the power extracted with the MPP profile is higher than the power extracted with constant current or constant voltage. Moreover, selection of the constant voltage or constant current will require the characterization of the WTGS, similar to the one performed in this section; instead, a dynamic MPPT algorithm will find the optimal operation condition online.
This section highlights the existence of an MPP for each speed, confirms that the WTGS can be represented with a Thevenin equivalent and shows the need for an MPPT algorithm that changes the current or voltage reference looking for the MPP. Additionally, it is necessary to design a control system to follow the MPPT reference and guarantee a stable operation. Those goals will be addressed in the next section.
3. Modeling and Control of the Flyback Converter
The proposed power system uses a flyback converter to interface the WTGS with the grid-connection stage. This power converter was selected due to the high-voltage conversion ratio and the galvanic isolation. In fact, classical grid-connected inverters require high input voltages; thus, the flyback converter is a suitable alternative.
The circuital representation of the first stage in the grid-connected wind system, based on the flyback converter, is presented in
Figure 5. This circuit models the second stage of the power system (grid-connected inverter) using a voltage source, which includes the closed-loop behavior of the inverter: the average value of the bus voltage is regulated by the inverter control system (DC component of
), but the grid-connection causes a voltage oscillation of the DC bus at double the grid frequency (AC component of
) due to the power difference between the AC injection and DC input in the inverter. Moreover, the circuit also takes into account both the magnetizing (
) and leakage (
) inductances of the flyback transformer, which has a turn ratio of
. The activation of the flyback MOSFET is triggered with the binary signal
u, where
close the MOSFET (open the diode) and
far from the MOSFET (and close to the diode).
The triggering signal u is generated by a PWM circuit, which imposes the desired duty cycle d. In some cases, such a duty cycle is set to be constant or defined by a low-frequency MPPT algorithm, but this will enable any perturbation to be transferred into the generator current (), thereby perturbing the generator operation. This is particularly important for grid-connected systems, in which the bus voltage exhibits an oscillation at double the grid frequency; this problem will be illustrated using the mathematical model, simulations and experiments.
3.1. Mathematical Model
The mathematical model is obtained from the two operation topologies generated by
and
. The fist topology occurs when
, which forces the magnetizing current
to flow through the MOSFET connected to the primary side of the transformer, and the voltage at the primary side of the transformer (
) is defined by the generator voltage
. Finally, the leakage inductance (and the secondary side of the transformer) is in open loop, since the diode is open; thus, the leakage current (
) is zero. The previous analyses are formalized as follows:
The second topology occurs when
; thus, the current of the transformer’s primary side is equal to zero. Moreover, the magnetizing current
is forced to flow through the transformer into the secondary side, and hence the voltage of the primary side of the transformer is defined by
, where
is the voltage at the secondary side:
In addition, the leakage inductance current is defined by Equation (
7) due to the transformer operation. Then, based on Equation (
7), the leakage inductance voltage is given by Equation (
8). Therefore, taking into account that
is the sum of the bus voltage
and the voltage at the leakage inductor, the differential equation for the magnetizing current is given in Equation (
9) for
.
Combining the equations for
given in Equations (
2)–(
4) and
given in Equations (
5)–(
9) leads to the switched model reported in Equations (
10)–(
12), where
u is the binary control signal of the MOSFET and
is the equivalent inductance defined in Equation (
9).
Taking into account that averaging the binary signal
u in the switching period
results in the duty cycle, as given in Equation (
13), the averaged model is obtained by performing the same procedure for the switched model, Equations (
10)–(
12), as follows:
The steady-state behavior of the flyback converter is obtained by equating to zero the differential Equation (
14), which results in the following steady-state duty cycle value:
Similarly, considering that the bus voltage
is regulated by the grid-connected inverter, the steady-state voltage imposed on the generator is given in Equation (
18). Moreover, for a given generator power
, the steady-state generator current is given in Equation (
19).
From Equation (
19), it is observed that the sinusoidal oscillation at double the grid-frequency present in
, and produced by the grid-connected inverter, will be transferred to the generator current if the duty cycle is not properly compensated. This problem will be illustrated with the electrical parameters reported in
Table 2, which are also used to construct the experimental platform.
Figure 6a reports a simulation of the first stage with a constant duty cycle, where the sinusoidal voltage in
is transferred to the generator current. Similarly,
Figure 6b shows the same behavior in the experimental platform: the sinusoidal voltage oscillation in
produces a sinusoidal voltage oscillation in
. Therefore, without a proper duty cycle compensation, it is not possible to impose the optimal generator current discussed in
Section 2. This problem must be addressed by introducing a current controller to adapt the duty cycle, as depicted in
Figure 5, with the aim of compensating for the bus-voltage perturbations.
3.2. Current Controller
The compensation of the duty cycle is performed by introducing a current controller into the flyback power system. The design of the controller is performed by using the averaged model previously reported in Equations (
14) to (
16). The first step in the design process is to transform the differential Equation (
14) to the Laplace domain, as given in Equation (
20).
This solution considers a proportional-integral (PI) structure to regulate the duty cycle:
In the previous expression,
is the reference imposed to the magnetizing current. Combining Equations (
20) and (
21) leads to the following closed loop equation:
Contrasting the denominator of Equation (
22) with the canonical second order equation, i.e.,
, results in the following expressions:
Taking into account that the settling time of the canonical second-order equation is
[
33], where
is the most widely adopted band to measure the settling time, which results in the following expression for
to impose the desired settling time
:
The
parameter, instead, is designed to impose a desired damping factor
:
Finally, using Equation (
15), we calculate the magnetizing current from the generator current as
; thus, the reference is calculated as
. The complete block-diagram of the current controller is presented in
Figure 7.
Defining a desired settling time
ms, which is more than 25 times smaller than the period of the sinusoidal perturbation (
Hz), and a damping factor
, results in the parameters
and
.
Figure 8a shows the simulation of the first stage, including the current controller, where the sinusoidal perturbation in
was modulated into the duty cycle, which avoided the oscillation being transferred to the generator current. Similarly,
Figure 8b shows the controller performance on the experimental platform: the first part of the experiment shows the satisfactory compensation provided by the current controller, where the voltage oscillation in the bus voltage is compensated; instead, the second part shows the current control deactivated (with a constant duty cycle), where the same bus voltage oscillation produces a very large oscillation in the generator current (oscillation equal to 60% of the steady-state value). Therefore, this experiment shows that the proposed controller provides stable operation of the generator, even in presence of the voltage perturbation caused by the grid-connected inverter. Such a stable current value must be defined as discussed in
Section 2.
4. Complete Experimental Setup and Results
The complete experimental setup for the small wind generation system based on commercial devices is presented in
Figure 9. The platform was designed to ensure repeatability in the current controller test, the maximum power extraction of a PMSG and the injection of its power into the AC grid. Some of the components presented in
Section 2 remained for this platform, such as the PM DC motor and its speed-control card Baldor BC142-6 to impose the desired wind profile; the DC power source BK Precision XLN6024 to define the speed reference to the speed control-card; the three-phase rectifier FUO2212N; and the 4700
F capacitor. In addition, the figure shows the oscilloscope Tektronix MDO3024 to measure the voltage, current and power provided by the rectifier; the DC-bus voltage; and the grid’s voltage and current.
Figure 9 shows the experimental platform scheme, where the interaction of the measure and control variables of the power converter are associated with the WTGS and the AC grid.
In this final platform, the Texas Instruments microinverter TMDSSOLARUINVKIT is connected to the capacitor terminals. Such a microinverter is formed by a flyback converter and an inverter, which drives the WTGS. The flyback converter allows both the extraction of the maximum power of the PMSG and the boosting of the generator voltage to the dc-link voltage.
Figure A2 shows a detailed description of the experimental test bench, and
Table A1 reports the electrical characteristics of both the platform and measurement devices. Finally, the inverter has two main tasks:
The TMDSSOLARUINVKIT has a C2000 microcontroller, which was used to implement the controller of the first stage described in
Figure 9 and designed in
Section 3.2. In addition, such a microcontroller was used to implement the inverter controllers; both control systems were programmed using the Code Composer Studio, which allowed coding, compiling and debugging the control algorithms. Finally, a resistor was connected in parallel with the inverter output to enable power dissipation before the inverter synchronized with the grid, and the ammeter HIOKI CM4371 was used to verify that the maximum DC motor current was not exceeded (emulating the wind profile).
To ensure the extraction of the most power possible, a classical perturb and observe (P&O) algorithm was implemented. Such an MPPT algorithm [
34] perturbs the active variable (generator current) in the direction that increases the variable to be optimized (generator power). Therefore, the P&O implemented in the C2000 microcontroller measures the generator current and voltage for power calculation, and defines the reference to the current controller designed in
Section 3.2, as is illustrated in
Figure 9. Then, the current controller regulates the generator current at the MPPT reference, and at the same time, mitigates the oscillations produced by the grid connection. Finally, the MOSFET activation signal is produced using the PWM module available in the C2000 microcontroller.
The inverter control requires the measurement of the DC bus voltage (
), the grid voltage and the injected current. The control structure used two-pole–two-zero compensators, three-pole–three-zeros compensators, and a feedback linearization technique, as explained in [
35].
To program the control in the microcontroller, it is necessary to discretize the PI controller and find the difference equation using the bi-linear transformation, where
T is the sampling time:
Then, the difference equation is expressed in Equation (
28), where
and
are the actual current control action and the action in the previous sample time, respectively;
and
are actual current error and the error in the previous sample time, respectively.
and
are coefficients calculated from
,
and
T, as presented in Equations (
29) and (
30).
A first test was used to evaluate the performance of the designed current controller: the speed was set to a constant value with an MPP current of 7.78 A, and changes were applied to the reference current.
Figure 10 shows the changes in six different current references, where the voltages in the PMSG terminals also change. The generated power varied between
and
W, thereby demonstrating that a higher current does not mean a higher level of power; instead the current reference must be set to the optimal value defined by the P&O algorithm.
Figure 11 shows a change in the reference of
current from
to
A in the presence of a 120 Hz perturbation in the DC bus voltage. This experiment shows the correct tracking of the reference and the simultaneous mitigation of bus voltage perturbation caused by the operation of the grid-connected inverter. It is observed that a change in
also changes the bus voltage perturbation, which is understandable, since the inverter must inject a different power level into the grid. In conclusion, this first test put into evidence the correct operation of the current controller designed for the flyback converter interacting with the grid-connected inverter.
The final test included the action of the P&O algorithm to define the current reference for the flyback converter under various wind profiles, i.e., the complete small wind generation system with a grid-connection. In this experiment, the speed of the WTGS started at 580 RPM, followed by a sequence of steps at 540, 500 and 540. Then, there was a return to the initial condition of 580 RPM. The changes in the PMSG speed force the P&O algorithm to track the optimal current
to reach the MPP in each of the three operation points, which is observed in
Figure 12a: the current imposed by the MPPT algorithm forces the generator to operate at the conditions with maximum power, which have been previously characterized in
Figure 2; however, the P&O algorithm does not need such a characterization. Therefore, this experiment confirms the capability of the system to extract the maximum available power in any wind condition.
Figure 12b shows the experimental data of this test in the power vs. current plane, where the path followed by the WTGS is observed (purple data). The data confirm the operation at the MPP of each speed condition, but also shows a path almost straight from one MPP to the other, thereby providing an optimal trajectory to reach the new MPP in the least time possible.
On the grid side, the voltage is defined by the grid, while the current depends on the power provided by the WTGS.
Figure 13 shows voltage and current behavior for the speed change from 500 to 580 RPM (third change in
Figure 12a). The synchronization between the injected current phase and the grid voltage is managed by the inverter control system, and the figure shows that the voltage peak-to-peak amplitude remained constant and equal to
V (
) during the test. Instead, the peak-to-peak amplitude of the injected current changed from 750 mA (
) to
A (
) due to the increment in the generated power (from
to 69 W); thus, the power injected into the grid is also increased. It must be noted that the small wind system injects power with a unitary power factor; thus, only active power is provided.
Finally, the previous experiments have demonstrated the correct operation of the proposed system: in the small wind generator, the most power possible is extracted, the perturbations caused by the grid-connection are mitigated and the generated power is injected into the grid.
5. Conclusions
The successful integration of a commercial small wind turbine (Air breeze) with a Texas Instruments Solar Micro Inverter Kit was presented in this paper. To achieve the integration, both systems had to be characterized. A test bench was implemented to obtain the power–current curves of the PMSG. A maximum of W was extracted, which corresponds to the maximum power achievable with a speed of 580 RPM. The rotor turbine was replaced with a DC permanent magnet motor to provide predictable and repeatable speed to the generator during the power curve’s extraction. The solar micro-inverter was tested in its several operation modes to identify the most adequate conditions to connect the small wind turbine to the AC grid. An SWT-PMSG model obtained from the experiments and a detailed mathematical model of the flyback converter were used to design a new current controller, and the results demonstrate the better performance of the new integrated system.
Three of the most significant challenges in the integration of commercial devices are: The matching of the variables—e.g., when using the commercial devices in this work, the low voltage of the PMSG was close to one of the voltage limit values of the flyback input, which limited the minimum speed to 500 RPM; similarly, the maximum speed (580 RPM) was limited by the maximum current supported by the flyback converter ( A). For that reason, the selection of the commercial devices is a critical issue to be addressed. The second challenge in the integration of commercial devices is the economic balance when devices with particular purposes are selected because they can be too expensive; this can be mitigated by classifying several power converters and several SWT and integrating the most affordable pair that can work together. The last one is the necessity of using open platforms to program the designed controllers. A lot of commercial devices are not able to be programmed.
The successful design, control and operation of the proposed solution contributes to the spread of small wind generation systems that can provide energy to distribution systems, thereby reducing the emission of greenhouse gases. In particular, this solution can be used to introduce distributed generators into tall buildings, parking lots and other urban environments, thereby improving the generation with renewable sources. Finally, the improved controller, which is designed to regulate the flyback input current, provides stability and satisfactory performance, which ensures the extraction of the most power possible in the generation process. In addition, the control-oriented model developed in this work can be used to design new controllers for other applications, e.g., input voltage control.
In the future, there are several contributions that will be addressed using the integration presented in this work. Now, the improvement of the power quality in a household AC electric system designing the control of the output variables of the microinverter is being realized. Another planed development is the control of the reactive power that could be injected into the grid, which could be used to compensate for power-factor problems in small urban microgrids (buildings, parking lots, etc.). This will require us to design new controllers for the grid-connected section of the Texas Instruments Micro Inverter Kit, since the default regulator ensures a unitary power factor.

 ,
, 

