Abstract
Green hydrogen production is essential to meeting the conference of the parties’ (COP) decarbonization goals; however, this method of producing hydrogen is not as cost-effective as hydrogen production from fossil fuels. This study analyses an off-grid photovoltaic energy system designed to feed a proton-exchange membrane water electrolyzer for hydrogen production to evaluate the optimal electrolyzer size. The system has been analyzed in Baghdad, the capital of Iraq, using experimental meteorological data. The 12 kWp photovoltaic array is positioned at the optimal annual tilt angle for the selected site. The temperature effect on photovoltaic modules is taken into consideration. Several electrolyzers with capacities in the range of 2–14 kW were investigated to assess the efficiency and effectiveness of the system. The simulation process was conducted using MATLAB and considering the project life span from 2021 to 2035. The results indicate that various potentially cost-competitive alternatives exist for systems with market combinations resembling renewable hydrogen wholesale. It has been found that the annual energy generated by the analyzed photovoltaic system is 18,892 kWh at 4313 operating hours, and the obtained hydrogen production cost ranges from USD 5.39/kg to USD 3.23/kg. The optimal electrolyzer capacity matches a 12 kWp PV system equal to 8 kW, producing 37.5 kg/year/kWp of hydrogen for USD 3.23/kg.
1. Introduction
For more than a century, fossil fuels have fueled industry and societal needs [1]. Today, various factors stimulate the decrease in fossil fuel consumption [2]. The growth in the world population resulted in high energy demand, which led to more use of fossil fuels and fueled a price increase [3]. Therefore, it is crucial to focus on renewable sources to mitigate the consequences of climate change [4].
It is projected that, by 2050, hydrogen base system consumption will account for 12% of global energy consumption [5]. This increase emphasizes the significance of low-carbon hydrogen since it is estimated that two-thirds of the total hydrogen will be generated from renewable energy resources and one-third from natural gas combined with CCS. To achieve the targets outlined in the Paris Agreement [5], experts worldwide believe that green hydrogen will play an essential role.
Hydrogen energy is recognized as the most promising energy carrier of the 21st century because it can be produced using sustainable renewable energy systems. Sustainable development using hydrogen can be characterized as an energy vector sufficient to meet the diverse demands of multiple sectors, including the industrial, transportation, energy conservation, and domestic sector. Meanwhile, most of the raw materials for producing hydrogen come from the chemical reformation of existing energy sources. Unlike the production of hydrogen from fossil fuels, hydrogen production by water electrolysis does not create carbon dioxide. However, the sustainable use of water is important since fresh water can be a finite resource [6]. It has to be noticed that electrolyzers require high-quality fresh water, and most water or seawater still cannot be accepted directly by a typical electrolyzer. Currently, new types of electrolyzers are being investigated using seawater, which is a promising way to produce hydrogen and also alleviates the use of highly demanding fresh water; however, there are still many issues to be solved with that solution. The consumption of water in order to generate hydrogen comes from two main processes: (i) hydrogen production and (ii) the production of the upstream energy carrier. Water electrolysis can consume approximately 9 kg of water per 1 kg of hydrogen. However, including the process of water preparation (for example, demineralization), hydrogen production may require at least two times that, i.e., 18 kg of water per kg of hydrogen. Although most of the cost per kilogram of hydrogen generated by electrolysis is due to the cost of power, it is also significant that the cost per kilogram depends on the amount to which electrolyzers are used [7]. Therefore, in this research study, this issue is being investigated to account for the size of the electrolyzer (EL) about the amount of photovoltaic (PV) energy produced.
Simoes et al. [8] found that the water from the public tap water system is a good source of water for electrolysis. Low costs, avoidance of complicated permitting processes and low supply risk are parameters that play an essential role. Other possible sources of water (wastewater, seawater) are characterized by high costs of water transport, waste disposal or water treatment. Hydrogen production using water electrolysis is now hampered by several factors, notably among them, being the drawback of high cost. Most of the cost of water-electrolytic hydrogen production comes from investments in fixed assets, power expenses, production, and operating expenses (water consumption, water preparation). Approximately 80% of the overall cost is electricity, indicating that the high energy cost is the primary reason for the high cost of water electrolysis [9]. There are two approaches to minimizing the hydrogen production cost by water electrolysis: reducing energy consumption by the electrolysis process and the electricity cost. Consequently, the second kind of approach is the most successful nowadays. However, given the inequitable distribution of new energy sources are disadvantaged [10]. The development of solar energy generation for hydrogen production does not relieve the matter of the high cost of water electrolysis since water sourcing dramatically affects the project’s total cost and sometimes covers around 10% of the total installed cost of hydrogen projects. Therefore, the design and development of solar hydrogen production facilities must be increased in these regions.
1.1. Hydrogen Production from Water
Water is a naturally abundant chemical famous as a substantial source of hydrogen. At Standard Temperature and Pressure (STP), the thermodynamic of a water molecule is approximately 285.83 kJ/mol, and water breakdown by direct heat occurs at very high temperatures (up to 2000 °C). However, it becomes challenging to separate oxygen from hydrogen at this temperature. However, thankfully using a catalyst and ceramic membrane for the decomposition reaction and gas separation water splitting can be a low-temperature process for hydrogen production [11]. Figure 1 illustrates the electrolysis of water using a standard electrical source.
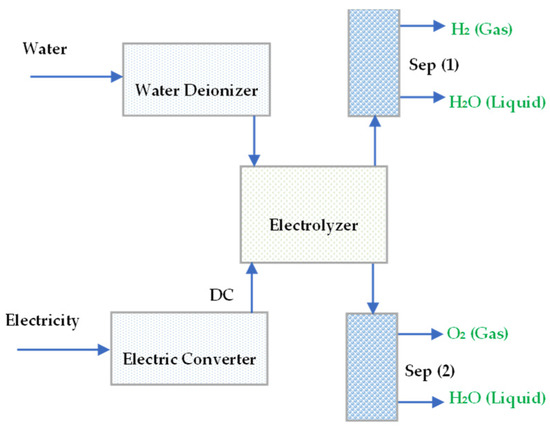
Figure 1.
The electrolysis of water with supplied DC power.
1.2. Literature Review
Various processes for producing hydrogen, including electrolysis, chemical reactions, and thermolysis, are described in the literature. Although the most environmentally friendly method of hydrogen production is to be adopted in the future, electrochemical technologies based on electricity from renewable energy sources are more applicable. Following the initial stages of the study on the electrolysis technique, several scientists utilized this technique to enhance hydrogen production. Electrolysis technologies, such as alkaline water [12], photovoltaic [13], and proton exchange membranes [14], are the main methods for hydrogen production.
Acar et al. [15] provided a review study on the photocatalytic production of hydrogen. The study evaluated the benefits and drawbacks of several hydrogen production technologies, focusing on photocatalytic hydrogen synthesis. Additionally, social, ecological, and economic indicators are considered when evaluating specific photocatalyst manufacturing techniques and types. Another review article on solar water-splitting technologies has been presented by Chatterjee et al. [16].
Review articles examining models that simulate electrolyzer performance and/or specific weather phenomena that occur within a particular electrolyzer component are highly beneficial to the research community, not only because they provide a clearer understanding of the current state of the art but also because they provide a variety of input variables and valuable guidelines for the creation of new models. Carmo et al. [17] published a review on the proton exchange membrane (PEM) electrolysis of water, including a section on modeling PEM water electrolysis. Olivier et al. [18] wrote a thorough review of low-temperature electrolysis system designs, including alkaline and PEM technology solutions. They also put the models they looked at into groups based on the physical domains they were involved in or how they were modeled numerically.
Gibson and Kelly [19] determined that the efficiency of the PV-electrolyzer system could be maximized by synchronizing the PV system’s amplitude and peak power production with the voltage level of the PEM electrolyzers. The results showed that the optimization procedure increased the hydrogen production efficiency to 12 percent for a solar-powered PV/PEM electrolyzer that could produce enough hydrogen for a fuel cell automobile. Clarke et al. [20] investigated the feasibility of directly coupling a photovoltaic system and a PEM electrolyzer for hydrogen production. The results indicated that the judicious matching of the properties of the photovoltaic and electrolyzer under varying solar radiation is crucial for achieving a maximum hydrogen production rate. Bhattacharyya et al. [21] electrolyzed water with yearly hydrogen production of the order of 10 Nm3/h. According to their study, an electrolyzer with a maximum power output of around 120 kW is necessary to produce 10 Nm3/h of hydrogen. The estimated payback period was 11,6 years based on an economic analysis of the selected site.
Qureshy and Dincer [22] put together an energy system that uses a renewable resource to generate hydrogen and a complete thermodynamic model to analyze the solar-water-hydrogen-power cycle in detail. The presented results demonstrate that the proposed system obtained an energy efficiency of 25.07%. At 115.86 MW, the energy and entropy production output in the photovoltaic panel is the highest. When the solar receiver collects heat at a rate of 1000 MW at 33.53%, it uses the least energy. Beck and [23] illustrate that integrating photovoltaic modules into the system is crucial to optimizing solar-to-hydrogen conversion. The study offers a novel paradigm based on simple transmission concepts to demonstrate that detaching the PV modules from the electrolytic system via energy monitoring could significantly improve the system’s efficiency. Decoupled systems could also use the current technology of solar cells and the silicon photovoltaic sector’s stability to speed up hydrogen production. Varadhan [24] described a simple and cost-effective strategy focused on photoelectrodes that operationally and spatially disentangle the light-harvesting aspect of the device from the electrolytic cell part, thus eradicating parasitic light absorption, reducing costs, and improving consistency without compromising the efficiency of hydrogen production. A correspondingly developed epitaxial lift-off produced the monolithically integrated electrolytic cell. The results show that the remarkable efficiency and durability attained here are a consequence of the light-harvesting/catalysis decoupled strategy, which simultaneously enhances the optical and electromagnetic properties and produces hydrogen of high quality. Grimm et al. [25] provide a circuit-comparison model for calculating the steady-state effectiveness of photoelectrochemical cells. The model consists of five distinct photoelectrochemical devices based on experimental data. The estimated performance corresponds well with the experimental data for the multiple devices. In addition, the model has been expanded to include the impact of light and tilt angle on the effectiveness of hydrogen production. The developed model was used to compare devices for various locations with varying average light levels and tilt angles. The outcomes indicate that the annual average solar-to-hydrogen conversion rate is much lower than the optimal rate. Astakhov et al. [26] showed that implementing batteries in PV water-splitting electrochemical systems is a suitable alternative to smooth out PV power fluctuations. In particular, the distribution of photovoltaic energy over 24 h reduces the electrochemical cell’s power and, consequently, its electrode potential loss.
The authors demonstrated the viability of the unassisted running of the PV, electrochemical, and rechargeable batteries device in a meaningful duty cycle. They investigated how the PV, electrochemical, and batteries system could function at a better solar-to-hydrogen efficiency than the similar standard PV, electrochemical system, notwithstanding the losses incurred by the batteries. Furthermore, Hassan et al. [27] compared the cost of hydrogen to determine two different technologies for hydrogen production using the photovoltaic system. The designs of the PV/EL system and the photoelectrochemical system have been compared based on hydrogen production cost and system efficiency. The results demonstrated that the hydrogen cost for the off-grid PV/EL system was determined to be USD 6.22/kg with an efficiency of 10.9%, and for the photoelectrochemical system, the hydrogen cost was USD 8.43/kg with an efficiency of 10%, which was much higher. The research study indicated that photoelectrochemical systems’ potential techno-economic advantages over PV/EL are ambiguous and, in the best-case scenario, modest. Although research into photoelectrochemical cells is still interesting, there is little reason to invest money into developing and scaling up the technology. Another critical study was conducted by Giménez and Bisquert [28], who investigated the economic and technical feasibility of two photoelectrochemical systems and two types of PV/EL systems. The results demonstrate that the photoelectrochemical system has a lower hydrogen cost than the off-grid PV/EL.
It has been found that prices have gone down a lot since it was published, especially for photovoltaic panels. However, the cost estimation of several essential components of the photoelectrochemical system was based on commercially available photovoltaic components and electrolyzers, which could be significantly different from that of an actual photoelectrochemical system in which both components are combined into a single device. There is a promising idea to combine solar PV and wind that have been investigated if the capacity of the electrolyzer that will be installed is enough to boost hydrogen production. Khouya [29] studied the synthesis of hydrogen using an electrolyzer powered by a solar-generated electric current. The research was carried out using weather information from the Tangier area of Morocco. The results demonstrate that the electrolyzer electricity consumption rates are 64 kWh/kg of solar energy respectively. The efficiency of hydrogen generation production was 62%, and the prices of electricity and hydrogen decreased as the photovoltaic capacity increased.
Hassani et al. [30] presented an energy management technique for a photovoltaic system with battery storage and an electrolyzer for hydrogen production, where each subsystem was developed to determine the most appropriate quantity of hydrogen-supplying components. An energy management system was implemented to control these various sources. Three critical situations were selected to show how improvements to the supervision protect batteries and get a steady power load. Yang et al. [31] investigate a universal technique to estimate the power redistribution and capacity configurations for grid-connected combined hydrogen production, utilizing 100 MW of photovoltaic electrical characterization and power to control the hydrogen system process under various storage configurations. The results showed that three sets of 800 Nm3/h electrolyzers and an annual hydrogen output of 7.01 million Nm3 were the best ways to set up the hydrogen production system using the grid connection method, which can cut CO2 emissions by 7.72 million tons compared to if it had been produced from fossil fuels.
Abd Elaziz et al. [32] implemented artificial intelligence to estimate the performance of PV/EL systems, including electrolytic hydrogen production. The investigation was carried out using two cooling working fluids (water or air), and a model was developed to estimate the effectiveness of the proposed system. The results showed that the proposed system could produce 4.41 kg of hydrogen per day at a high rate. Kurşun and Okten [33] developed a photovoltaic system for hydrogen production using a proton exchange membrane electrolyzer plant. The results indicated that the photovoltaic system improved energy efficiency, and hydrogen production increased between 0.02 kg/h and 0.30 kg/h at various rates depending on the parameter settings. The system proposed by Nordin and Rahman [34] utilizes extra energy to produce hydrogen, which will then be supplied to local customers. Using an adaptive approach, the authors compare the off-grid photovoltaic system with/without a battery for hydrogen production. The feasibility assessment of the off-grid PV system with a battery was much better in hydrogen production.
Green hydrogen stands at an early stage in most applications and requires policy support to advance from niche to mainstream and be a piece of the energy evolution; once priorities are set, policymakers must address the barriers specific to the sectors where green hydrogen is expected to deploy. Across countries, divergences are emerging as national H2 strategies reveal varying attitudes toward the role of hydrogen in ET (energy transitions). The development of a hydrogen policy is still in its early stages, although there is global interest and support. At present, only 12 countries and the European Union have published “National hydrogen strategies”, and a similar number is going to publish such a document in the near future [35].
Policymakers recognize the need to complement the energy transition with clean fuels such as green hydrogen. A large number of studies show the significant potential of hydrogen in global energy systems. Most countries identified green hydrogen as part of their decarbonization strategy, as well as a key element enabling energy security and resiliency.
The global market penetration by hydrogen will depend on several parameters, including technical, economic, infrastructure availability, initiatives, industry, private capital, investment and policy or regulatory decisions. Li et al. [36] assessed using a water electrolyzer fed by photovoltaic systems to produce hydrogen. Different water mass flow rates were used to evaluate the production of heat and electrical energy. Increasing the mass flow rate caused the electrolyzer temperature to drop, which ensured the maximum electrical efficiencies for water consumption by about 33.8% and 8.5%, respectively. Temiz and Javani [37] examined the utilization of a floating photovoltaic system in hydrogen production. Essential documentation for the investigation was obtained from Mumcular Dam in Turkey. The floating photovoltaic system decreased the temperature of the solar panels and improved power production. This system produces most of its electrical energy without needing fossil fuels or a grid connection. In addition, a floating photovoltaic system reduced the evaporation of water in a 3009 m2 area. Berrada and Laasmi [38] examined the technological and economic effects of producing sustainable hydrogen using solar energy in Morocco. The distribution of public subsidies has also been considered and researched to determine its influence on hydrogen price, energy cost, and CO2 emission reductions. The observed results indicate that the cost of producing hydrogen ranges between USD 3.49/kg and USD 5.96/kg. The investment site significantly increases due to the green hydrogen and the economic potential of its export.
Akyuz et al. [39] evaluated the intensity of solar radiation as a component of a set of variables that influence the performance of photovoltaic systems. In this investigation, a prototype system was installed in Turkey, and its hydrogen production was evaluated based on annual irradiance measurements. According to this research, one of the parameters estimating the probability distribution of the effectiveness of hydrogen production is the time variable. It was stated that the highest hydrogen production was around 600 and 650 W/m2, the total energy efficiency was 8.1%, and the average energy effectiveness of the examined PEM electrolysis system was 60.5% with a current density of 0.48 A/cm2. Authors conclude that hydrogen production in the Balikesir area of Turkey is expected to be approx. USD 4.39 per kilogram; however, many developments and price changes have appeared since this research time. According to the projections, 60 kW of power is required to generate 10 Nm3/h at 70 °C and 5 bar pressures. Bhattacharyya et al. [21] investigated the production of hydrogen gas under various environmental conditions using a photovoltaic system. It has been found that a different level of solar irradiation significantly impacts hydrogen production.
1.3. Objective and Structure
Numerous studies have examined hydrogen production using renewable energy globally; however, there still needs to be an investigation into hydrogen production in Iraq, even though the country is so rich in solar irradiation, and there is no information about the optimal electrolyzer size in reference to photovoltaic system size. The presented studies are carried out to fill a scientific and literature gap caused by a lack of this type of research work. At present, to the authors’ knowledge, there is no analysis presenting the potential of generating hydrogen gas using photovoltaic systems combined with an electrolyzer system in Iraq. This study is structured as follows: Section 2 contains the experimental data collected at the investigation locations and utilized for the proposed system. Section 3 describes the mathematical model used to predict PV power based on measured solar irradiance, hydrogen production, and cost. The results indexes acquired in Section 4 and Section 5 provide some final observations and conclusions.
2. Proposed System and Site of Investigation
The system under consideration is presented in Figure 2. The system consists of five primary parts. The first component is the PV array responsible for power generation; the next is AC/DC converter, an electrolyzer, a compressor, and a hydrogen tank. The photovoltaic array with the converter is responsible for controlling the amount of DC power that is transported to the electrolyzer. In addition, it is also responsible for the electric energy to drive the compressor. The water electrolyzer is accountable for separating oxygen and hydrogen from water.
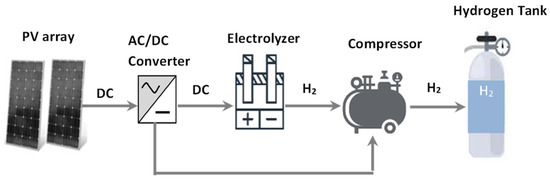
Figure 2.
Schematic of the proposed system to produce hydrogen using solar energy.
The proposed system is complete with the hydrogen storage tank and compressor units responsible for compressing up to 1000 bar and storing the hydrogen created. Table 1 shows the technical and economic specifications of the proposed energy system.

Table 1.
The technical and economic specifications.
The proposed hydrogen production system is tested in Baghdad, Iraq, at coordinates 33.31 N and 44.36 E. The PV array was positioned at the optimum annual adjustment, and the simulation procedure was performed at a resolution of one minute. The project has a lifespan between 2021 and 2035; since the economic evaluation is based on Iraqi regulations, the annual interest rate is 6%.
3. Experimental Environmental Data
The environmental data (solar irradiance and ambient temperature) have been measured for the selected site at a one-minute resolution by weather station type (FT0300) for the year 2021. Figure 3 and Figure 4 show the daily (for four selected days) and monthly average solar irradiance and ambient temperature. The annual average of solar irradiance was recorded at 4.5 kWh/m2/day, and the daily average ambient temperature was 27.8 °C.
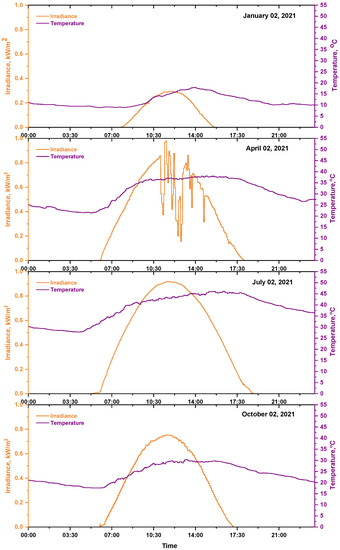
Figure 3.
Daily solar irradiance and ambient temperature for four selected days through 2021.
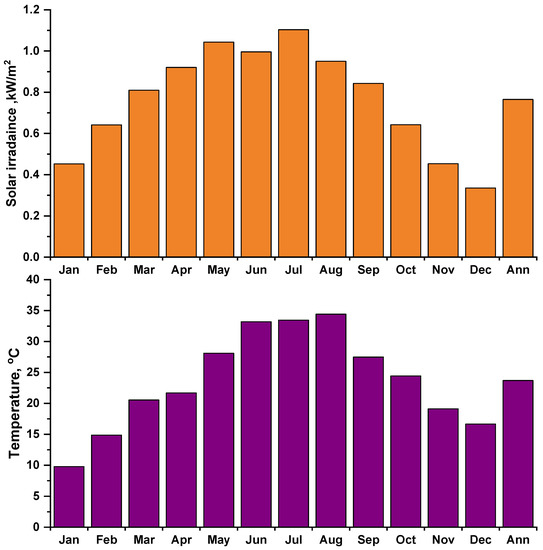
Figure 4.
Monthly average experimental solar irradiance and ambient temperature.
Table 2 shows the daily solar irradiance and ambient temperature for four selected days through 2021. Among the selected days, the highest solar irradiance and ambient temperature were observed on 2 July, which was 7.26 kWh/m2, 38.3 °C, respectively, and the lowest solar irradiance and ambient temperature were observed on 2 January, which was 1.36 kWh/m2, 11.8 °C, respectively.
Table 2.
Daily average solar irradiance and ambient temperature from experimental measurement for four selected days through 2021.
Figure 4 shows the experimental measurement’s monthly average solar irradiance and ambient temperature, the highest during the summer months and the lowest during the winter months.
4. Modeling and Governing Equations
4.1. Model of PV Array
The photovoltaic power output is estimated by the amount of incident solar irradiations and other environmental factors such as ambient temperature and humidity, etc. PV output power can be calculated as [43]:
whereas the temperature can be determined using solar irradiance, ambient temperature, and wind speed presented as [44,45]:
The fluctuation of PV cell temperatures can be evaluated using [46].
where τα demonstrates the effective absorption transmittance of PV cells.
4.2. Model for Electrolyzer
The electrolyzer hydrogen production rate is calculated as [47]:
The quantity of electrical energy input required by the electrolyzer can be calculated as [48]:
4.3. Model for Compressor and Hydrogen Tank
The power required to compress the hydrogen contained in the hydrogen tank can be calculated as [49]:
The predicted pressure within the hydrogen tank can be calculated as follows:
4.4. Model for Converter
The PV panel provides DC electricity, but the demand is typically AC. Therefore, the converter/inverter is required to convert DC power to AC power, in addition applied in the power system to regulate the energy flow. The efficiency of the converter can be calculated as [50]:
4.5. System Power Flow
The power flow distribution between the proposed system components, which is generated by the photovoltaic array and supplies adequate electricity to the electrolyzer and hydrogen, can be presented as the following equation:
4.6. Hydrogen Cost
The cost of hydrogen can be used to calculate the cost of producing one kilogram of hydrogen and may be computed using the following expression [4,51]:
5. Results and Discussions
Based on the real environmental data and the system presented in Figure 2, represented by the numerical model Equation (1), the simulation set was performed using MATLAB model implemented code at a one-minute precision. The photovoltaic array consisted of 12 modules with a total power of 12 kWp (module specifications presented in Table 1). The array was installed and placed at the optimal annual orientation for the chosen location. (tilt angle = 30° and azimuth angle = 0° south facing). The impact of ambient temperature on the energy generated by the photovoltaic array was considered with the power coefficient of 0.26%/°C. The derating factor was 95%, with the remaining 5% representing energy losses in the wiring and dust. The electrolyzer is available in various capacities (2 kW, 4 kW, 6 kW, 8 kW, 10 kW, 12 kW, and 14 kW) to select the optimal capacity that can be connected to the PV array in order to obtain the highest hydrogen production. The pricing for the proposed system components is based on Iraqi market conditions and an inflation rate of 0.6%.
5.1. Power Generation and Energy Production by the Photovoltaic Arrays
Figure 5 shows the daily power for the selected days and the monthly energy produced by the photovoltaic array. The day with the highest solar irradiance is 2 July 2021, and the day with the lowest solar irradiance is 2 January 2021 (see Figure 3). The daily energy generated by the photovoltaic array for four selected days the presented in Table 3. The maximum monthly energy generated by the proposed PV array in July and the minimum in December, with an annual maximum of 18,892 kWh at 4313 operation hours.
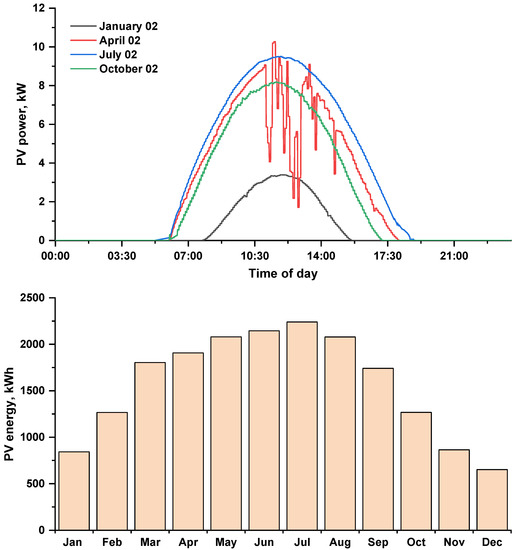
Figure 5.
Daily power and monthly energy generated by the (12 kWp) photovoltaic array.
Table 3.
Daily energy generated by the PV array for the selected days.
Table 3 shows the daily energy produced by the proposed PV array.
5.2. Daily Electrolyzer Energy Consumption and Hydrogen Production
The energy is taken by the electrolyzer at various capacities during the selected days presented in Table 4. Depending on the incident solar irradiance, the photovoltaic array begins producing electricity when the sun rises, and its maximum output is possible at midday. The electrolyzer energy consumption is highly dependent on the energy provided by the photovoltaic array and the electrolyzer capacity; with increasing electrolyzer capacity, energy consumption increases. The highest consumption for the electrolyzer capacity was 75.82 kWh on 2 July 2021. (10–14 kW).
Table 4.
Daily electrolyzer energy consumption (kWh) at several capacities for selected days.
The daily hydrogen production at various electrolyzer capacities for specified days is shown in Figure 6. The pace of hydrogen production is highly dependent on the power generated by the photovoltaic arrays and the electrolyzer capacity used. When PV power production and electrolyzer capacity expanded, then hydrogen production increased; however, this increase is not linear.
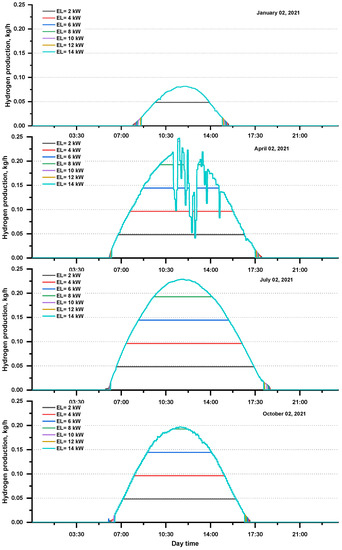
Figure 6.
Daily hydrogen production at various electrolyzer capacities for the selected days.
Table 5 shows the daily hydrogen production at several electrolyzer capacities for the selected days. The hydrogen production rate is highly dependent on the power consumed by the electrolyzer, which depends on the power generated by the photovoltaic array. Hydrogen production can be seen when PV power production and electrolyzer capacity increase. The highest production among the selected days was observed on 2 July 2021 and was equal to 1.82 kg at the electrolyzer capacity (10–14 kW).
Table 5.
Daily hydrogen production (kg) by an electrolyzer at several capacities for selected days.
5.3. Monthly Electrolyzer Energy Consumption and Hydrogen Production
The energy consumed by the electrolyzer depends on the amount of energy produced by the solar PV array, which is highest in the summer and lowest in the winter. The monthly energy consumption of the electrolyzer in various capacities is shown in Figure 7. The energy consumption of electrolyzers increased as their capacity increased; July had the highest electrolyzer energy usage, equal to 2230.43 kWh at the 10–14 kW electrolyzer.
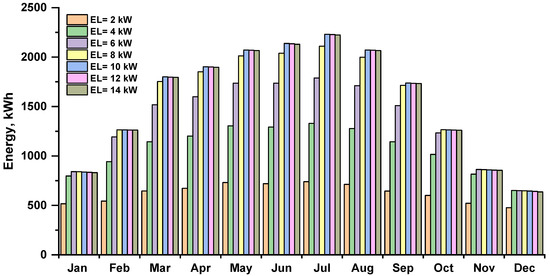
Figure 7.
Monthly energy consumption by the electrolyzer at various capacities.
The amount of hydrogen produced by an electrolyzer depends on the energy produced by a photovoltaic array. Figure 8 shows the monthly hydrogen production by the electrolyzer at various capacities. The maximum hydrogen production is shown in summer, and in winter, the lowest. The hydrogen production by electrolysis increased as the capacity was increased, the month of June, with 10–14 kW, electrolyzers produced the most hydrogen, approximately 53.21 kg.
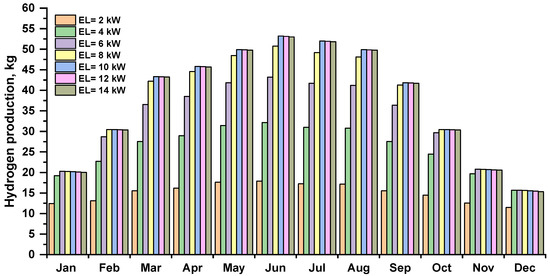
Figure 8.
Monthly hydrogen production by an electrolyzer at several capacities.
Based on daily and monthly statistics, it is difficult to determine the optimum electrolyzer capacity to obtain the highest hydrogen production for a 12 kWp photovoltaic array. At least one year of data is required for such analysis. Based on annual statistics for the analyzed case of a 12 kWp photovoltaic installation, increasing the electrolyzer power over 8 kW does not bring the expected benefits. It unnecessarily increases the cost and size of the device and contributes to a higher demand for primary energy necessary to produce it as well as requiring more rare materials. After exceeding a certain limit, the increase in the amount of hydrogen produced is small or negligibly small, which does not justify increasing its power.
As can be seen in Figure 8, increasing the capacity of the electrolyzer beyond 8 kW brings no benefit for fuel production and should not be justified by a greater potential co-financing for this type of investment. For this reason, for the implementation of green hydrogen, it is crucial to set not only the right priorities and the right policy in this area but also economically justified regulations. Policymakers should address barriers specific to sectors where green hydrogen is expected to be deployed, but this must be done for the benefit of the environment.
5.4. Annual Electrolyzer Energy Consumption and Hydrogen Production
The annual energy consumption of the electrolyzer at several capacities is shown in Figure 9. The capacity of the 10 kW electrolyzer had the highest consumption, at 18,822.98 kWh. As the electrolyzer capacity increased, this value slightly decreased to 18,793.11 kWh for the 12 kW electrolyzer and 18,754.80 kWh for the 14 kW electrolyzer, which is due to the efficiency drop because the electrolyzer capacity did not match the PV array capacity (it is overestimated).
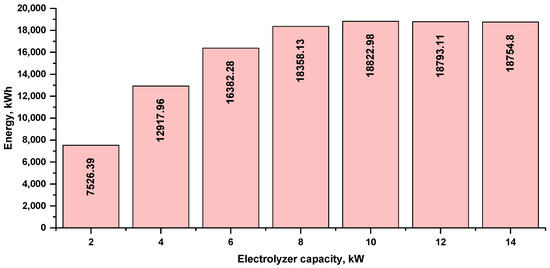
Figure 9.
Annual energy consumption by the electrolyzer at various capacities.
5.5. Annual Hydrogen Production and Cost
The annual hydrogen production by the electrolyzer at various capacities, with production cost, is shown in Figure 10. The 14 kW electrolyzer had the highest production of about 456.68 kg. As the electrolyzer capacity went up, this value went up, but the difference in hydrogen production between the electrolyzer capacities of 10 kW and 14 kW is minimal, approx. 1.06 kg/year, which is noticeable because increasing the electrolyzer capacity by more than 10 kW uses the lowest cost.
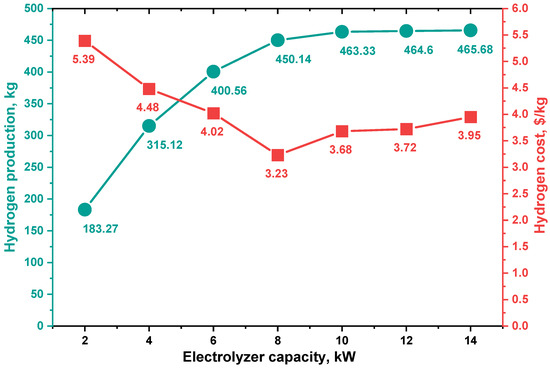
Figure 10.
Annual hydrogen production by an electrolyzer and hydrogen costs at several capacities.
For this analysis, the cost of hydrogen (COH) is calculated for one kilogram of hydrogen using Equation (10). The economic setting for the system components is presented in Table 1, and the project life span is taken as ten years for the period of (2021–2030). The results as depicted in Figure 10 shows that hydrogen costs vary from USD 5.39/kg to USD 3.23/kg. The lowest hydrogen cost was observed at the 8 kW electrolyzer size (450 kg/year), and this cost increased with increasing electrolyzer capacity.
Figure 11 shows the cost of green hydrogen production in USD /kg by location, with the cost of green hydrogen in Iraq in the current study being 45% cheaper than that of the United States [52,53].
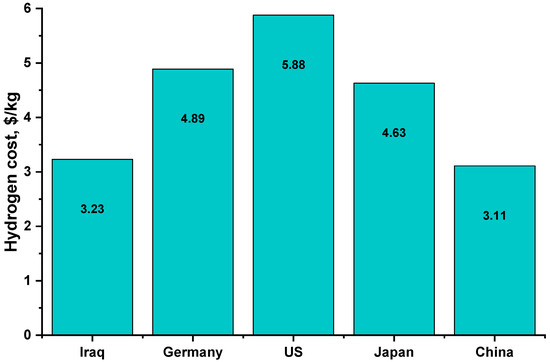
Figure 11.
Hydrogen cost compared with other countries.
The lower price of hydrogen is caused by many factors. It means, among others, efficient use of available devices, extending their working time, and using renewable energy to a greater extent. As research has shown, there is an optimal size of the electrolyzer whose use is the best, which has serious consequences and results in the lowest price of hydrogen produced. This globally means lower unit consumption of valuable and rare minerals for the construction of devices. This also translates into lower specific water consumption resulting from lower demand for primary energy used in the production of equipment and renewable energy used in the production of hydrogen.
6. Conclusions
It is clear that hydrogen can act as an energy carrier and industrial feedstock in a climate-neutral economy, but hydrogen is not widely available on the Earth and must be produced. Currently, for most applications, the production of hydrogen using renewable energy is at an early stage and still requires political support and funding, both at the stage of basic research and implementation or expansion of the distribution network, to move much faster from the concept and development stage and become an element of the energy transformation. At the same time, research studies are still required in order to reduce the cost of hydrogen production. Some predictions show that by 2050 hydrogen base system consumption will account for as much as 12% of global energy consumption. Recent changes in the energy market may speed up this process. At the current state, it is estimated that two-thirds of total hydrogen will be generated using renewable energy resources. That is a significant change in direction because two decades ago, nuclear power plants and chemical thermocycles were considered the leading sources of hydrogen production. This research study emphasizes the role of hydrogen production and system use in determining the eventual price of supplied hydrogen. It has been determined that a photovoltaic system alone has tremendous potential to produce green hydrogen.
The electrolyzer can be supplied with energy in an ever-independent and cost-effective approach. In many cases, energy can be used for hydrogen production exceeding that of energy that cannot be used for any other load.
Furthermore, the system is only available throughout the day: the electrolysis system must be activated at varying periods of the day, and not all applications work at total capacity. The variable nature of the solar resource reduces not only the electrolyzer’s rate of consumption but also its output and efficiency.
The use of electrolyzers whose size is adapted to the size of photovoltaic systems is crucial for further increasing hydrogen production while minimizing not only the cost of its production but also the environmental costs associated with its production. A lower unit price of hydrogen generation means not only a system with higher efficiency but also translates into lower unit consumption of mineral resources and water necessary for production. This also means less waste to be processed in the future and further benefits from this.
An optimal off-grid solar photovoltaic system is proposed for hydrogen production. The energy system is modeled and analyzed in MATLAB software at a one-minute resolution using one year of experimental data. The optimal system configuration, i.e., the electrolyzer capacity that matches the 12 kWp PV array, was obtained, minimizing the cost of hydrogen production. The annual energy generated by the specified PV array was 18,892 kWh at 4313 operation hours.
The results show the relevance of hydrogen production and the system utilization factor in determining the total cost of produced hydrogen, and the yearly hydrogen production cost, and energy consumption for the investigated site are as follows:
- For a 2 kW electrolyzer capacity, the annual energy consumption was 7526.39 kWh, and the annual hydrogen production was 183.27 kg at the cost of USD 5.39/kg.
- For a 4 kW electrolyzer capacity, the annual energy consumption was 12,917.96 kWh, and the annual hydrogen production was 315.12 kg at USD 4.48/kg.
- For a 6 kW electrolyzer capacity, the annual energy consumption was 16,382.28 kWh, and the annual hydrogen production was 400.56 kg at USD 4.02/kg.
- For an 8 kW electrolyzer capacity, the annual energy consumption was 18,358.13 kWh, and the annual hydrogen production was 450.14 kg at USD 3.23/kg.
- For a 10 kW electrolyzer capacity, the annual energy consumption was 18,822.98 kWh, and the annual hydrogen production was 463.33 kg at USD 3.68/kg.
- For a 12 kW electrolyzer capacity, the annual energy consumption was 18,793.11 kWh, and the annual hydrogen production was 464.6 kg at USD 3.72/kg.
- For a 14 kW electrolyzer capacity, the annual energy consumption was 18,754.8 kWh, and the annual hydrogen production was 465.68 kg at USD 3.95/kg.
The results indicate that a few costs competitive alternatives exist for systems with market combinations that closely resemble renewable hydrogen wholesale, tending to result in a hydrogen production cost range of USD 5.39/kg to USD 3.23/kg, with the optimal electrolyzer capacity of 8 kW matching a 12 kWp photovoltaic array that can produce 450 kg/year of hydrogen at the cost of USD 3.23/kg. In many studies, analyses show better solutions than using the same photovoltaic system and electrolyzer sizes. On the one hand, it fully utilizes PV power but simultaneously overestimates the electrolyzer size and increases the cost of hydrogen. It has been found that for the analyzed conditions, it is recommended to use two-thirds of the PV power as a size for the electrolyzer. Hydrogen cost at optimal configuration is much lower in the United States of America, Germany, and Japan.
The study reveals that this solar hydrogen production system is well suited for installation in the central region of Iraq and other regions with comparable climatic conditions, especially those with comparatively high solar energy.
The cost of green hydrogen production depends on reducing energy consumption by the system with electrolyzer and the electricity cost. For this reason, it is crucial to optimize electrolyzer size in reference to photovoltaic system size and to use a location with a large potential for renewable energy (high energy production from PV systems). Consequently, the first and the second kind of approaches should be taken parallel into account.
Author Contributions
Conceptualization, Q.H. and M.J.; methodology, I.S.A.; validation, M.J.; formal analysis, M.J. and Q.H.; investigation M.J.; writing, Q.H.; writing—review and editing, H.M.S., M.J., O.T.O. All authors have read and agreed to the published version of the manuscript.
Funding
The present work was partially supported by the Polish Ministry of Science (Grant AGH No. 16.16.210.476).
Data Availability Statement
Not applicable.
Conflicts of Interest
The authors declare no conflict of interest.
Abbreviations
| AC | Alternative Current |
| DC | Direct Current |
| NOCT | Nominal Operation Cell Temperature |
| PV | Photovoltaic |
| STC | Standard Test Conditions |
| STP | Standard Temperature and Pressure |
| WT | Wind Turbines |
List of Symbols
| AE, BE | Coefficient of the consumption curve (kW/kg/h) |
| F | Faraday constant |
| fPV | PV reduction factor |
| g | Polytrophic coefficient |
| hf | Faraday efficiency |
| hhtc | Hydrogen tank compressor efficiency |
| Ht | Amount of hydrogen produced per year in kilograms. |
| i | Discount rate |
| I | Initial investment cost |
| Ie | Electrolyzer current |
| IE | Electrolyzer current |
| MC | Operation and maintenance cost in (USD) |
| mH2 | Nominal hydrogen mass flow (kg/h) |
| n | Project lifetime |
| NC | Number of cells in series |
| Phti | Hydrogen tank inlet pressure |
| Phto | Hydrogen tank outlet pressure |
| Picon | Converter input power |
| Pocon | Converter output power |
| QH2 | Rate of hydrogen generated by the electrolyzer |
| R | Gas constant |
| SSTC | Incident solar radiation at standard test conditions (kW/m2) |
| ST | Incident solar radiation (kW/m2) |
| ST,NOCT | Incident solar radiation which NOCT (1 kW/m2) |
| t | Time in the year |
| TA | Ambient temperature (°C) |
| TA,NOCT | Temperature at which NOCT (25 °C) |
| TC | Temperature of the PV (°C) |
| TC,NOCT | Cell temperature at which NOCT |
| Thtci | Hydrogen tank compressor inlet temperature |
| Ts | Temperature of the PV under standard test conditions (25 °C) |
| UL | Coefficient of heat transfer to the surrounding |
| Vh tan Κ | Volume of hydrogen tank |
| Y PV | Nominal capacity of PV |
| αP | Temperature coefficient of power (%/°C) |
| ηC | Efficiency of PV |
| ηh tan Κ | Efficiency of hydrogen tank |
| γ | PV module azimuth angle |
| β | PV module tilt angle |
References
- Aydin, M.I.; Dincer, I.; Ha, H. Development of Oshawa hydrogen hub in Canada: A case study. Int. J. Hydrogen Energy 2021, 46, 23997–24010. [Google Scholar] [CrossRef]
- Razmjoo, A.; Kaigutha, L.G.; Rad, M.V.; Marzband, M.; Davarpanah, A.; Denai, M. A Technical analysis investigating energy sustainability utilizing reliable renewable energy sources to reduce CO2 emissions in a high potential area. Renew. Energy 2021, 164, 46–57. [Google Scholar] [CrossRef]
- Barhoumi, E.M.; Okonkwo, P.C.; Zghaibeh, M.; Belgacem, I.B.; Alkanhal, T.A.; Abo-Khalil, A.G.; Tlili, I. Renewable energy resources and workforce case study Saudi Arabia: Review and recommendations. J. Therm. Anal. Calorim. 2020, 141, 221–230. [Google Scholar] [CrossRef]
- Hassan, Q. Evaluation and optimization of off-grid and on-grid photovoltaic power system for typical household electrification. Renew. Energy 2021, 164, 375–390. [Google Scholar] [CrossRef]
- Gielen, D.; Gorini, R.; Leme, R.; Prakash, G.; Wagner, N.; Janeiro, L.; Collins, S.; Kadir, M.; Asmelash, E.; Ferroukhi, R.; et al. World Energy Transitions Outlook: 1.5 °C Pathway; International Renewable Energy Agency: Abu Dhabi, United Arab Emirates, 2021; Available online: https://www.irena.org/publications/2021/Jun/World-Energy-Transitions-Outlook (accessed on 25 October 2022).
- Wu, Y.; Deng, Z.; Tao, Y.; Wang, L.; Liu, F.; Zhou, J. Site selection decision framework for photovoltaic hydrogen production project using BWM-CRITIC-MABAC: A case study in Zhangjiakou. J. Clean. Prod. 2021, 324, 129233. [Google Scholar] [CrossRef]
- Hassan, Q.; Jaszczur, M.; Hafedh, S.A.; Abbas, M.K.; Abdulateef, A.M.; Hasan, A.; Abdulateef, J.; Mohamad, A. Optimizing a microgrid photovoltaic-fuel cell energy system at the highest renewable fraction. Int. J. Hydrogen Energy 2022, 47, 13710–13731. [Google Scholar] [CrossRef]
- Simoes, S.G.; Catarino, J.; Picado, A.; Lopes, T.F.; di Berardino, S.; Amorim, F.; Gírio, F.; Rangel, C.; de Leão, T.P. Water availability and water usage solutions for electrolysis in hydrogen production. J. Clean. Prod. 2021, 315, 128124. [Google Scholar] [CrossRef]
- Hydrogen Council. Path to Hydrogen Competitiveness: A Cost Perspective; IGEM: Derby, UK, 2020. [Google Scholar]
- Dos Santos, K.G.; Eckert, C.T.; De Rossi, E.; Bariccatti, R.A.; Frigo, E.P.; Lindino, C.A.; Alves, H.J. Hydrogen production in the electrolysis of water in Brazil, a review. Renew. Sustain. Energy Rev. 2017, 68, 563–571. [Google Scholar] [CrossRef]
- Rand, D.A.J.; Dell, R.M. Hydrogen Energy: Challenges and Prospects; Royal Society of Chemistry: London, UK, 2007. [Google Scholar]
- Awasthi, A.; Scott, K.; Basu, S. Dynamic modeling and simulation of a proton exchange membrane electrolyzer for hydrogen production. Int. J. Hydrogen Energy 2011, 36, 14779–14786. [Google Scholar] [CrossRef]
- Han, B.; Steen, S.M., III; Mo, J.; Zhang, F.Y. Electrochemical performance modeling of a proton exchange membrane electrolyzer cell for hydrogen energy. Int. J. Hydrogen Energy 2015, 40, 7006–7016. [Google Scholar] [CrossRef]
- Görgün, H. Dynamic modelling of a proton exchange membrane (PEM) electrolyzer. Int. J. Hydrogen Energy 2006, 31, 29–38. [Google Scholar] [CrossRef]
- Acar, C.; Dincer, I.; Naterer, G.F. Review of photocatalytic water-splitting methods for sustainable hydrogen production. Int. J. Energy Res. 2016, 40, 1449–1473. [Google Scholar] [CrossRef]
- Chatterjee, P.; Ambati, M.S.K.; Chakraborty, A.K.; Chakrabortty, S.; Biring, S.; Ramakrishna, S.; Wong, T.K.S.; Kumar, A.; Lawaniya, R.; Dalapati, G.K. Photovoltaic/photo-electrocatalysis integration for green hydrogen: A review. Energy Convers. Manag. 2022, 261, 115648. [Google Scholar]
- Grimm, A.; de Jong, W.A.; Kramer, G.J. Renewable hydrogen production: A techno-economic comparison of photoelectrochemical cells and photovoltaic-electrolysis. Int. J. Hydrogen Energy 2020, 45, 22545–22555. [Google Scholar] [CrossRef]
- Olivier, P.; Bourasseau, C.; Bouamama, P.B. Low-temperature electrolysis system modelling: A review. Renew. Sustain. Energy Rev. 2017, 78, 280–300. [Google Scholar] [CrossRef]
- Gibson, T.L.; Kelly, N.A. Optimization of solar powered hydrogen production using photovoltaic electrolysis devices. Int. J. Hydrogen Energy 2008, 33, 5931–5940. [Google Scholar] [CrossRef]
- Clarke, R.E.; Giddey, S.; Ciacchi, F.T.; Badwal, S.P.S.; Paul, B.; Andrews, J. Direct coupling of an electrolyser to a solar PV system for generating hydrogen. Int. J. Hydrogen Energy 2009, 34, 2531–2542. [Google Scholar] [CrossRef]
- Bhattacharyya, R.; Misra, A.; Sandeep, K.C. Photovoltaic solar energy conversion for hydrogen production by alkaline water electrolysis: Conceptual design and analysis. Energy Convers. Manag. 2017, 133, 1–13. [Google Scholar] [CrossRef]
- Qureshy, A.M.; Dincer, I. Energy and exergy analyses of an integrated renewable energy system for hydrogen production. Energy 2020, 204, 117945. [Google Scholar] [CrossRef]
- Beck, F.J. Rational Integration of Photovoltaics for Solar Hydrogen Generation. ACS Appl. Energy Mater. 2019, 2, 6395–6403. [Google Scholar] [CrossRef]
- Varadhan, P.; Fu, H.C.; Kao, Y.C.; Horng, R.H.; He, J.H. An efficient and stable photoelectrochemical system with 9% solar-to-hydrogen conversion efficiency via InGaP/GaAs double junction. Nat. Commun. 2019, 10, 5282. [Google Scholar] [CrossRef] [PubMed]
- Grimm, A.; Sainte-Marie, A.; Kramer, G.J.; Gazzani, M. Modeling photovoltaic-electrochemical water splitting devices for the production of hydrogen under real working conditions. Int. J. Hydrogen Energy 2022, 47, 11764–11777. [Google Scholar] [CrossRef]
- Astakhov, O.; Agbo, S.N.; Welter, K.; Smirnov, V.; Rau, U.; Merdzhanova, T. Storage batteries in photovoltaic–electrochemical device for solar hydrogen production. J. Power Sources 2021, 509, 230367. [Google Scholar] [CrossRef]
- Hassan, Q.; Jaszczur, M.; Al-Jiboory, A.K.; Hasan, A.; Mohamad, A. Optimizing of hybrid renewable photovoltaic/wind turbine/super capacitor for improving self-sustainability. Energy Harvest. Syst. 2022, 9, 151–164. [Google Scholar] [CrossRef]
- Giménez, S.; Bisquert, J. Photoelectrochemical Solar Fuel Production. In From Basic Principle to Advanced Devices; Springer: Cham, Switzerland, 2016. [Google Scholar]
- Khouya, A. Levelized costs of energy and hydrogen of wind farms and concentrated photovoltaic thermal systems. A case study in Morocco. Int. J. Hydrogen Energy 2020, 45, 31632–31650. [Google Scholar] [CrossRef]
- Hassani, H.; Zaouche, F.; Rekioua, D.; Belaid, S.; Rekioua, T.; Bacha, S. Feasibility of a standalone photovoltaic/battery system with hydrogen production. J. Energy Storage 2020, 31, 101644. [Google Scholar] [CrossRef]
- Yang, Y.; Ma, C.; Lian, C.; Zhang, Y.; Pang, X. Optimal power reallocation of large-scale grid-connected photovoltaic power station integrated with hydrogen production. J. Clean. Prod. 2021, 298, 126830. [Google Scholar] [CrossRef]
- Abd Elaziz, M.; Senthilraja, S.; Zayed, M.E.; Elsheikh, A.H.; Mostafa, R.R.; Lu, S. A new random vector functional link integrated with mayfly optimization algorithm for performance prediction of solar photovoltaic thermal collector combined with electrolytic hydrogen production system. Appl. Therm. Eng. 2021, 193, 117055. [Google Scholar] [CrossRef]
- Kurşun, B.; Ökten, K. Thermodynamic analysis of a Rankine cycle coupled with a concentrated photovoltaic thermal system for hydrogen production by a proton exchange membrane electrolyzer plant. Int. J. Hydrogen Energy 2019, 44, 22863–22875. [Google Scholar] [CrossRef]
- Nordin, N.D.; Rahman, H.A. Comparison of optimum design, sizing, and economic analysis of standalone photovoltaic/battery without and with hydrogen production systems. Renew. Energy 2019, 141, 107–123. [Google Scholar] [CrossRef]
- World Energy Council; EPRI; PwC. Working Paper, Hydrogen on the Horizon: National Hydrogen Strategies; No. 4184478; World Energy Council: London, UK, 2021. [Google Scholar]
- Li, J.; Gao, C.; Lu, X.; Hoseyni, A. A combined energy system consisting of fuel cell, water electrolyzer and solar technologies to produce hydrogen fuel and electricity. Energy Sources Part A Recovery Util. Environ. Eff. 2022, 44, 1173–1188. [Google Scholar] [CrossRef]
- Temiz, M.; Javani, N. Design and analysis of a combined floating photovoltaic system for electricity and hydrogen production. Int. J. Hydrogen Energy 2020, 45, 3457–3469. [Google Scholar] [CrossRef]
- Berrada, A.; Laasmi, M.A. Technical-economic and socio-political assessment of hydrogen production from solar energy. J. Energy Storage 2021, 44, 103448. [Google Scholar] [CrossRef]
- Akyuz, E.; Coskun, C.; Oktay, Z.U.H.A.L.; Dincer, I. Hydrogen production probability distributions for a PV-electrolyser system. Int. J. Hydrogen Energy 2011, 36, 11292–11299. [Google Scholar] [CrossRef]
- Monocrystalline, Luminous PV Module and Converter. Available online: https://luminous.com/ (accessed on 1 June 2022).
- Electrolyzer. Available online: http://www.geemblue.com/ (accessed on 1 June 2022).
- Compressor and Hydrogen Tank. Available online: https://www.doosan.com/ (accessed on 1 June 2022).
- Hassan, Q.; Abbas, M.K.; Abdulateef, A.M.; Abdulateef, J.; Mohamad, A. Assessment the potential solar energy with the models for optimum tilt angles of maximum solar irradiance for Iraq. Case Stud. Chem. Environ. Eng. 2021, 4, 100140. [Google Scholar] [CrossRef]
- Abbas, M.K.; Hassan, Q.; Jaszczur, M.; Al-Sagar, Z.S.; Hussain, A.N.; Hasan, A.; Mohamad, A. Energy visibility of a modeled photovoltaic/diesel generator set connected to the grid. Energy Harvest. Syst. 2021, 9, 27–38. [Google Scholar] [CrossRef]
- Hassan, Q.; Pawela, B.; Hasan, A.; Jaszczur, M. Optimization of Large-Scale Battery Storage Capacity in Conjunction with Photovoltaic Systems for Maximum Self-Sustainability. Energies 2022, 15, 3845. [Google Scholar] [CrossRef]
- Jaszczur, M.; Hassan, Q.; Al-Anbagi, H.N.; Palej, P. A numerical analysis of a HYBRID PV+ WT power system. E3S Web Conf. 2019, 128, 05001. [Google Scholar] [CrossRef]
- Boulmrharj, S.; Khaidar, M.; Bakhouya, M.; Ouladsine, R.; Siniti, M.; Zine-dine, K. Performance assessment of a hybrid system with hydrogen storage and fuel cell for cogeneration in buildings. Sustainability 2020, 12, 4832. [Google Scholar] [CrossRef]
- Hassan, Q. Assessing of renewable energy for electrical household ancillary based on photovoltaics and wind turbines. IOP Conf. Ser. Mater. Sci. Eng. 2021, 1076, 012006. [Google Scholar] [CrossRef]
- Barhoumi, E.M.; Farhani, S.; Bacha, F. High efficiency power electronic converter for fuel cell system application. Ain Shams Eng. J. 2021, 12, 2655–2664. [Google Scholar] [CrossRef]
- Jaszczur, M.; Hassan, Q.; Abdulateef, A.M.; Abdulateef, J. Assessing the temporal load resolution effect on the photovoltaic energy flows and self-consumption. Renew. Energy 2021, 169, 1077–1090. [Google Scholar] [CrossRef]
- Jaszczur, M.; Hassan, Q.; Palej, P.; Abdulateef, J. Multi-Objective optimisation of a micro-grid hybrid power system for household application. Energy 2020, 202, 117738. [Google Scholar] [CrossRef]
- Okonkwo, P.C.; Ige, O.O.; Barhoumi, E.M.; Uzoma, P.C.; Emori, W.; Benamor, A.; Abdullah, A.M. Platinum degradation mechanisms in proton exchange membrane fuel cell (PEMFC) system: A review. Int. J. Hydrogen Energy 2021, 46, 15850–15865. [Google Scholar] [CrossRef]
- Energy Information Administration Report. Available online: https://www.eia.gov/outlooks/aeo/ (accessed on 1 June 2022).


Disclaimer/Publisher’s Note: The statements, opinions and data contained in all publications are solely those of the individual author(s) and contributor(s) and not of MDPI and/or the editor(s). MDPI and/or the editor(s) disclaim responsibility for any injury to people or property resulting from any ideas, methods, instructions or products referred to in the content. |
© 2023 by the authors. Licensee MDPI, Basel, Switzerland. This article is an open access article distributed under the terms and conditions of the Creative Commons Attribution (CC BY) license (https://creativecommons.org/licenses/by/4.0/).