Article

Integrated Energy System Powered a Building in Sharjah Emirates in the United Arab Emirates

by
Tareq Salameh
1,
Abdul Ghani Olabi
1,2,*,
Mohammad Ali Abdelkareem
1,3,*,
Mohd Shahbudin Masdar
4,
Siti Kartom Kamarudin
4,* and
Enas Taha Sayed
3
1
Sustainable Energy & Power Systems Research Centre, RISE, University of Sharjah, Sharjah P.O. Box 27272, United Arab Emirates
2
Department of Mechanical Engineering and Design, School of Engineering and Applied Science, Aston University, Aston Triangle, Birmingham B4 7ET, UK
3
Chemical Engineering Department, Faculty of Engineering, Minia University, Minia 61111, Egypt
4
Fuel Cell Institute, Universiti Kebangsaan Malaysia, Bangi 43600 UKM, Malaysia
*
Authors to whom correspondence should be addressed.
Energies 2023, 16(2), 769; https://doi.org/10.3390/en16020769
Submission received: 18 November 2022 / Revised: 1 January 2023 / Accepted: 6 January 2023 / Published: 9 January 2023
(This article belongs to the Special Issue Current Advances in Fuel Cell Technology)

Abstract

:
In this study, a green hydrogen system was studied to provide electricity for an office building in the Sharjah emirate in the United Arab Emirates. Using a solar PV, a fuel cell, a diesel generator, and battery energy storage; a hybrid green hydrogen energy system was compared to a standard hybrid system (Solar PV, a diesel generator, and battery energy storage). The results show that both systems adequately provided the power needed for the load of the office building. The cost of the energy for both the basic and green hydrogen energy systems was 0.305 USD/kWh and 0.313 USD/kWh, respectively. The cost of the energy for both systems is very similar, even though the capital cost of the green hydrogen energy system was the highest value; however, the replacement and operational costs of the basic system were higher in comparison to the green hydrogen energy system. Moreover, the impact of the basic system in terms of the carbon footprint was more significant when compared with the green hydrogen system. The reduction in carbon dioxide was a 4.6 ratio when compared with the basic system.

1. Introduction

The transition of energy has developed into a significant problem since it is necessary to reduce global greenhouse gas emissions [1,2]. One of the most promising ways to combat the current climate change concerns is the efficient conversion of hydrogen into an energy source for transportation and industrial purposes [3,4]. Hydrogen is a renewable energy that might help sustainable energy systems [5]. In addition, hydrogen is a clean energy carrier that has drawn a lot of interest and is anticipated to make a substantial contribution to the energy mix in developing low-carbon energy [6]. The cost of hydrogen and the amount of CO2, which may be emitted in its production, are significantly different depending on the type of energy used, i.e., renewable or nonrenewable sources [7,8]. Steam-reforming of hydrocarbons, including natural gas, is the common method used for hydrogen production [9,10]. In general, when fossil fuels are used to create hydrogen, many emissions are created that are harmful to the environment and to the climate [11]. Therefore, switching to a low-carbon hydrogen production is essential [12].
Green hydrogen, made from water electrolysis using electricity from renewable sources, and blue hydrogen (hydrogen from fossil fuels accompanied by CO2 Capture) are both free or low-carbon hydrogen [12]. Green hydrogen still costs more than hydrogen produced from fossil fuels. Water electrolysis, a method used for manufacturing hydrogen without CO2 (green hydrogen in the case of using renewable energy sources) produces only 4% of hydrogen [13]. The increased production costs are the primary stumbling block for the use of green hydrogen. As a result, most research on green hydrogen contains an economic analysis [14]. The Levelized Cost of hydrogen (LCOH) combining an alkaline water electrolyzer (AWE) with solar energy was found to range from USD 4.55 to USD 4.62/kg [15]. The advances in renewable energies and electrolysis technologies could decrease such a cost.
Various studies were carried out to switch from using fossil fuel-based energy to green hydrogen-based ones. For instance, Karayel et al. [16] studied the potential of green hydrogen production in Turkey using solar energy as the main renewable energy source. The results demonstrated that an average 421.35 × 10⁶ tons of green hydrogen could be produced. Additionally, the study reported that among the 81 cities investigated, a few cities, such as Konya, Erzurum, Van, and Sivas, were the best cities for high hydrogen production capabilities. Kakoulaki et al. [17] investigated the potential of replacing grey hydrogen production in Europe with green hydrogen. The results of the study showed that the available renewable energy sources in Europe, i.e., wind, solar, and hydro, are enough for a green hydrogen production of 9.75 × 10⁶ tons. The study also recommends further studies to be carried out from a techno-economic point of view, including the transportation and the storage of green hydrogen. Bhandari [18] studies the potential of green hydrogen production for the transportation and electricity generation sectors in Niger. It was found that solar PV systems use 5% of the land to secure a total liquid hydrogen production of 11,700 tons by 2040. Using Homer software, Barhoumi et al. [19] investigated the potential of green hydrogen production in Oman for refuelling stations using solar energy based on three different strategies of PV integrated with batteries, fuel cells, or a grid. The LHC “Levelized Hydrogen Cost” of 5.5 EUR/kg in the case of the PV integrated with the grid is lower than the other two options. Hoelzen et al. [20] discussed the potential of green hydrogen applications in the aviation sector. The authors showed that the economic potential of a green hydrogen application in the aviation sector depends on the availability of cheap green hydrogen sources and the available infrastructure for liquid green hydrogen. The potential of green hydrogen production in Ireland was also investigated using solar and wind energies [21]. The techno-economic analysis of the green hydrogen production in Poland was performed by Benalcazar and Komorowska [22]. The authors demonstrated that green hydrogen cost (LCOH) could be produced at lower prices using solar and wind energies, reaching less than EUR 2/kg in 20,250 at a large scale. In general, the increased capacity and the improved technology over time have a significant role in decreasing the cost of green hydrogen production. For Austria, Spain, and Germany, the LCOE “Levelized Cost of Electricity” and LCOH of AWE were analyzed. When societal considerations, such as environmental costs, were taken into account, Austria was the best scenario, although Germany was thought to be the best private LCOH in all situations [23]. A hybrid system using wind turbines and PV panels was proposed in Alexandria, Egypt, for generating electricity and green hydrogen production of 1.9 tons/year [24]. The proposed system demonstrated energy and exergy efficiencies of 16.42 and 12.76%, with a LCOH of 3.73–4.656 USD/kg.
Salameh et al. studied the potential of using solar energy and wind energy integrated with a diesel generator and various energy storage systems, including an electrolyzer for green hydrogen production in Neom city, KSA [25]. In another study, the authors studied the effectiveness of hybrid renewable energy sources in providing for the energy requirements in Khorfacan city in UAE of 13.6 GWh. On a small scale, Rezk et al., studied the combination of the PV, electrolyzer, and the fuel cell in an integrated system for desalination purposes in remote areas [26]. In another study, Lee investigated hydrogen generation utilizing AWE. The authors reported that the electricity cost was the factor that would have the highest impact on LCOH [27]. Since the current in the water electrolyzer varies throughout the day because of variations in the electricity produced by the renewable energy system, the amount of hydrogen produced by the electrolyzer is directly proportional to the current. Using microgrid software Hybrid Optimization Model for Multiple Energy Resources “HOMER Pro,” the technical and economic performance of a hybrid system (PV-wind-fuel cell) to replace a diesel power plant in Duqm, Oman, with green hydrogen was evaluated [28]. The findings showed a COE “cost of energy” of USD 0.436/kWh, using the PV-wind-fuel cell with reduced noise and CO2 emissions (205,676,830 kg/year). The levelized cost of energy for the proposed system was USD 0.196/kWh. The levelized cost for the diesel system would rise to USD 0.243/kWh when accounting for the price of USD 100 per ton of CO2.
Pal et al., [29] performed a techno-economic analysis of a hybrid PV/FC system to provide 14 kW. The system used PV for electricity generation where the surplus energy was used for the power electrolyzer to produce green hydrogen. The system demonstrated an acceptable energy cost of 0.161 USD/kWh. The same group investigated the same system, i.e., PV/FC, for providing the energy requirements in north-east Indian states [30]. The authors used Homer software to model and simulated the proposed system. The system exhibited an economic energy production with an LCOE of 0.509–0.689 USD/kWh and annual green hydrogen production of 1.538–1.856 tons. Using Homer Pro, Kapen et al. [31] analyzed a hybrid energy system composed of PV and a biogas as renewable energy sources integrated with a fuel cell/electrolyzer and a battery as an energy storage system in Cameroon. Both the LCOE and LCOH significantly decreased with the increase in the capacity of the proposed hybrid energy system. The potential of using green hydrogen for refueling stations of fuel cell-based vehicles [32] was investigated by Venkatasatish and Dhanamjayulu [33].
As clear from the above discussion and based on the authors’ best knowledge, few studies applied the use of green hydrogen for buildings that are favored for energy decentralization. In this study, a green hydrogen system was investigated to provide the office building in Sharjah emirate, in UAE, with electricity. The basic hybrid system based on PV-DG-BES “solar PV, diesel generator, and battery energy storage” was compared to a hybrid green hydrogen energy system based on a solar PV, a fuel cell, a diesel generator, and battery energy storage (PV-DG-FC-BES) in terms of energy, economic, and environmental (3E). The aims of this work are as follows:
  • Build a hybrid system to produce green hydrogen for a residential office building in Sharjah in the United Arab Emirates.
  • Optimize the size of the components of the hybrid system using the optimizer tool in HOMER Pro software.
  • Compare the green hydrogen hybrid system with the base case hybrid system based on solar PV, diesel generator, and battery system in terms of the 3E aspects.

2. Energy Resources, Weather Conditions, and Load

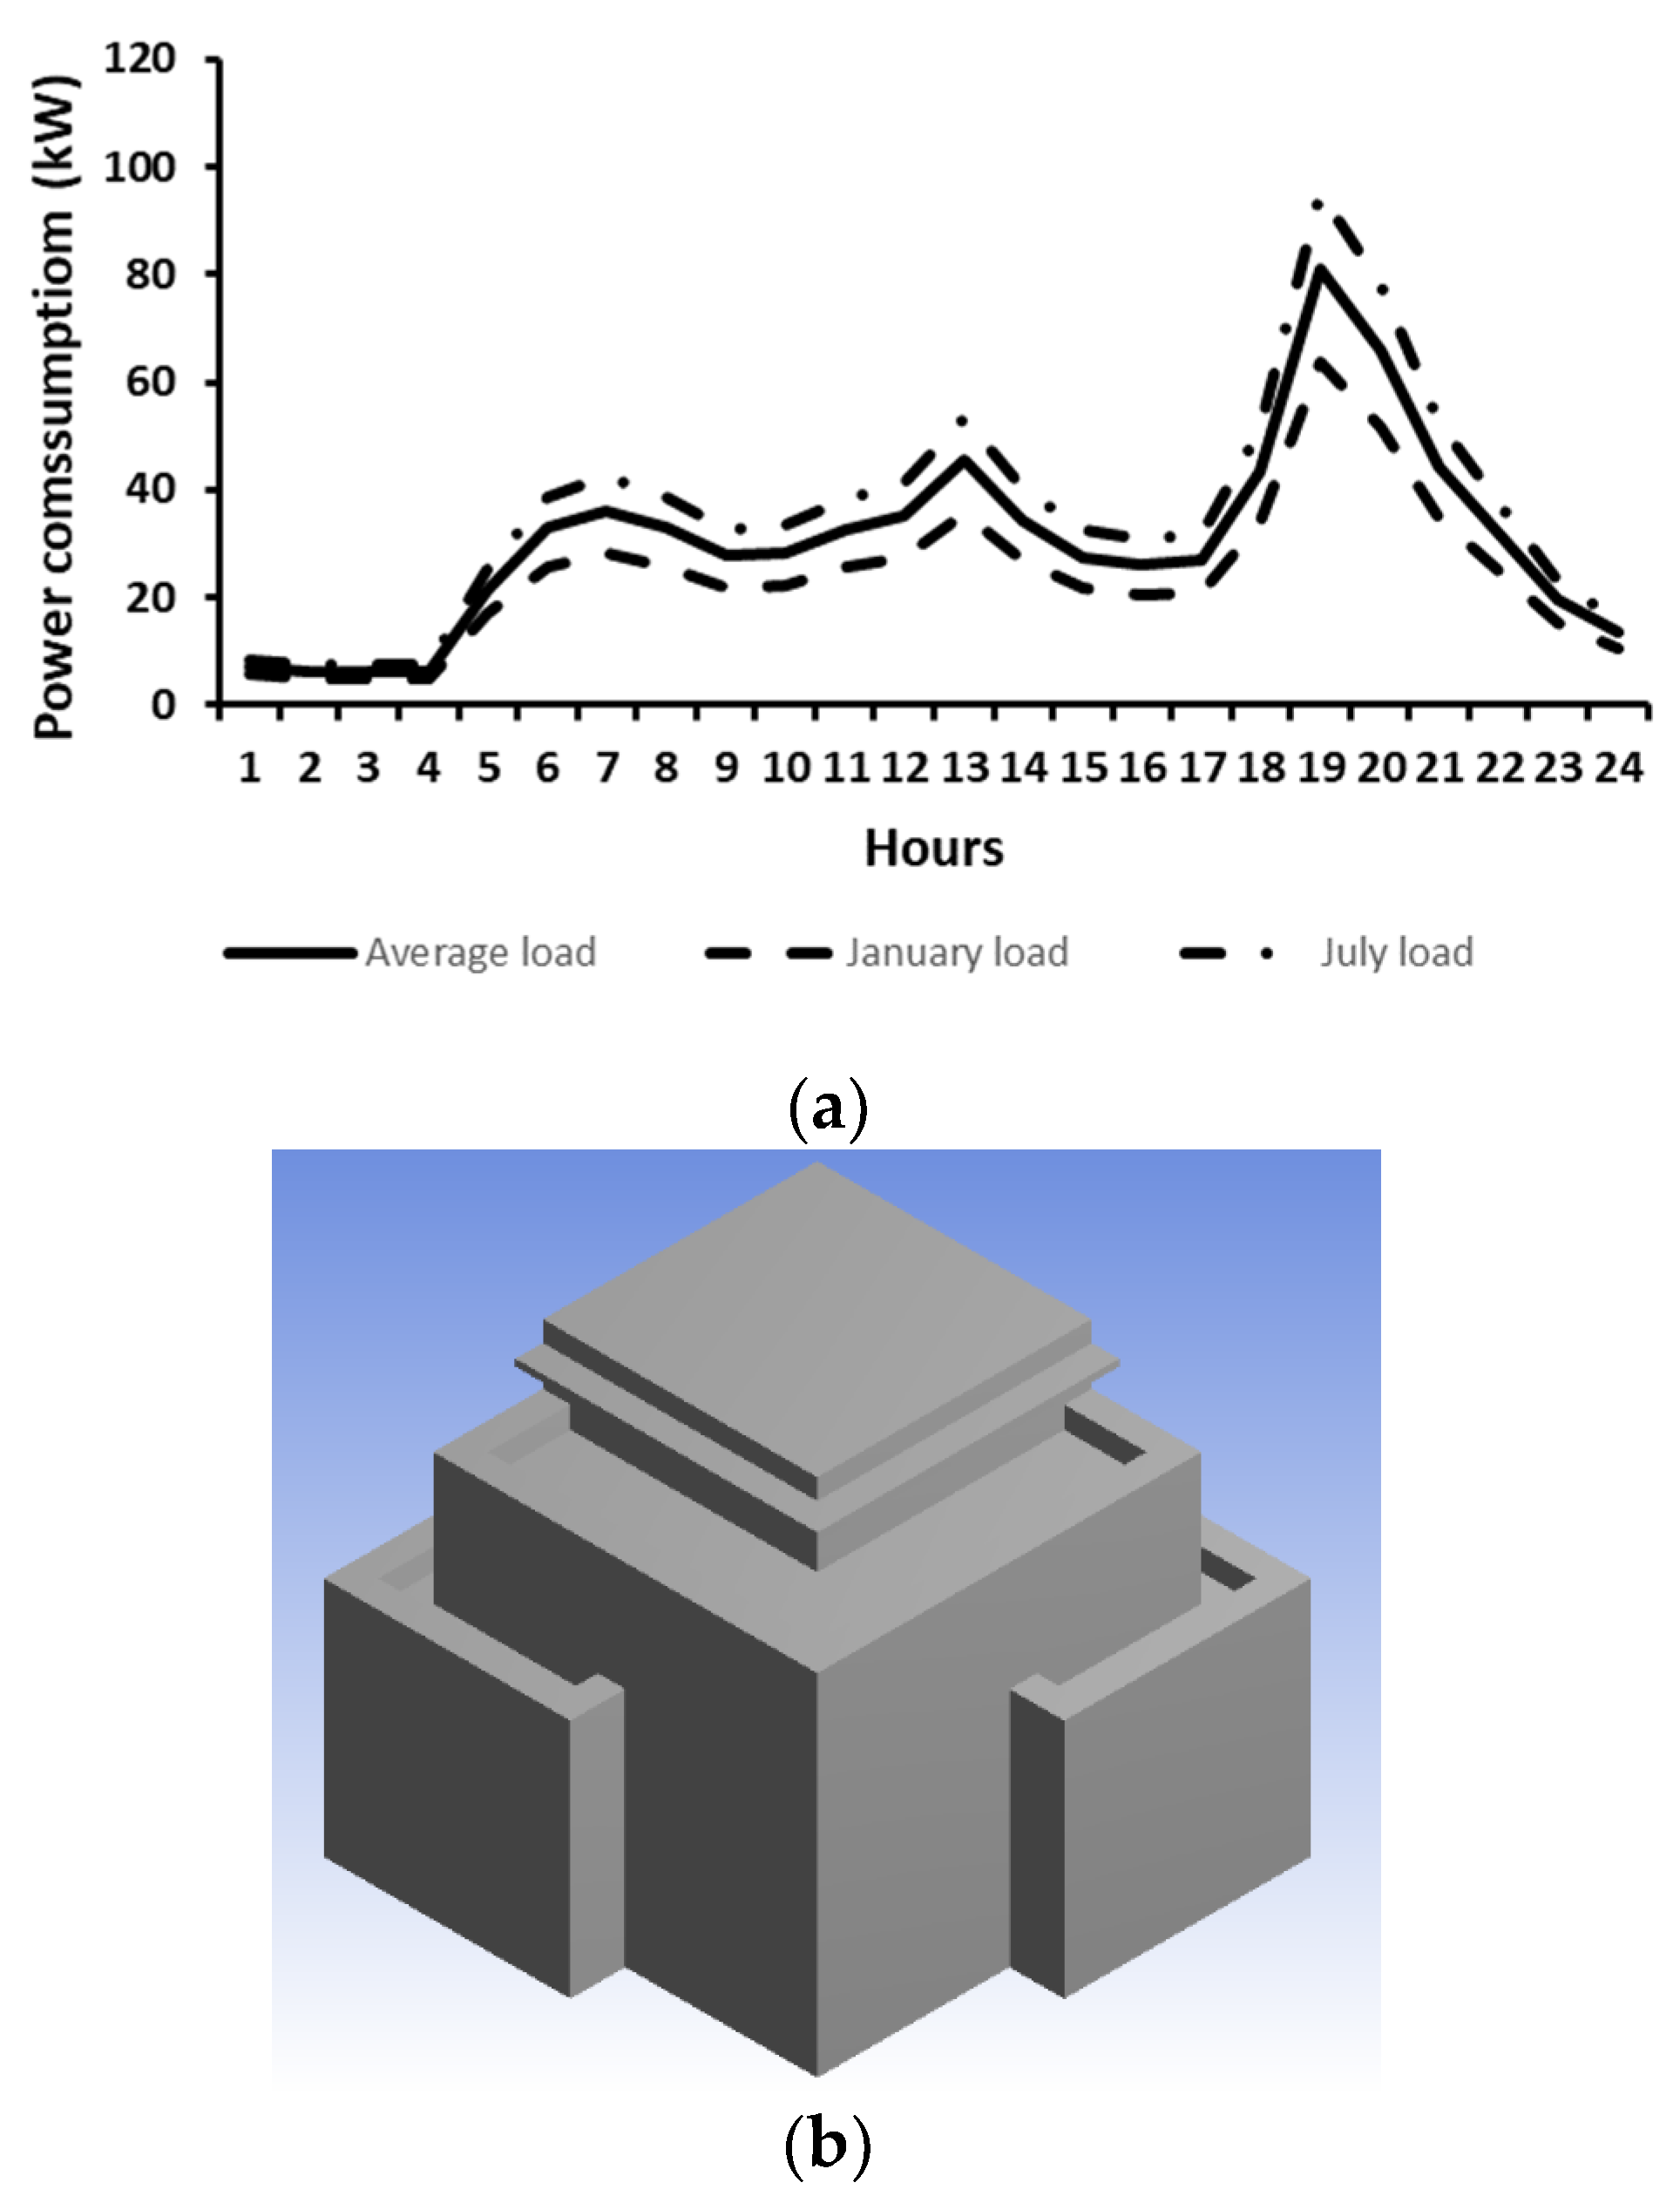
A commercial office building in Sharjah emirate (UAE) is the case study of this paper. The office building is located at a latitude and longitude of 25°16′ and 55°19′, respectively. According to Figure 1, the months with the highest and lowest solar insolation levels are June and December. The load includes both the thermal and electrical energy of the building, such as the cooling load, lighting, and appliances. Figure 2 depicts the three-dimensional (3D) geometry of the commercial office structure in Sharjah.

3. Sizing and Modelling of the Green Hydrogen Energy System

The architecture of the solar PV, FC, DG, BES, hydrogen tank, electrolyzer, charging/discharging controller of the BES, and the converter are shown in Figure 3. The technical and cost specifications of each system of the hybrid system are shown in Table 1. The following sections provide a thorough explanation of each architectural component’s specifics

3.1. Photovoltaic Array

According to Equation (1), the power production from the PV panel (PPV) is influenced by the temperature due to the negative temperature coefficient of power, but it rose with increasing solar irradiance:
P P V = P P V , S T C f P V G T G S T C [ 1 + α P ( T c T c , S T C ) ]
GSTC is the amount of solar insolation at 1000 W/m2 and 25 °C during standard test conditions (STC), GT is the actual amount of solar insolation, Tc,STC is the solar PV’s cell temperature under STC, Tc is the solar PV’s cell temperature, fPV is the solar PV’s derating factor, and αP is the temperature coefficient of power.
HOMER Pro automatically set the solar PV panel tilt angle at a value equal to the latitude of the building at 25 degrees, which is thought to be the best yearly tilt angle for the installation of solar PV panels.
Equation (2) can be used to determine the output power production from solar PV arrays with multiple panels connected in both series (Ns) and parallel (Np):
P P V , S T C = ( N s × N P ) P m S T C
where PmSTC is the solar PV panel power at a maximum point under STC.
While Equation (3) can be used to determine the PV array’s real power as follows:
P P V = ( N s × N P ) P m
Pm is the solar PV panel’s maximum power under the actual operating conditions.
The PV panels’ maximum efficiency ηmp,STC at STC is determined as follows:
η m p , S T C = P P V ,   S T C A P V G T , S T C
where APV is the PV panel’s area and GT,STC is the actual irradiance at STC.
By choosing a suitable number for the fPV, as shown in Equation (1), the dust effect was considered due to the desert nature in Sharjah City.
The following Equation (5) is used to calculate the system’s fraction of utilized renewable energy (fren):
f ren = 1 E nonren E cons
where Econs is the total energy consumption and Enonren is the conventional energy source (from DG).
It is worth mentioning that the solar PV panels will be fixed onto the roof of the building; however, the roof area is not enough to install all the solar panels. Therefore, the rest will be installed in the surrounding area of the building as well as on the surface of the parking area of the building.

3.2. Fuel Cell

Fuel cells can convert chemical energy into electricity in an electrochemical reaction [34,35]. The hydrogen that is kept in the hydrogen tank acts as the main fuel and the power is produced from the fuel cell as long as hydrogen and oxygen are supplied to the cell. The amount of the fuel’s chemical energy that is not converted into fuel cell electricity (PFC) is transformed into thermal energy and is released as waste heat from the stack (PFCT). PFC can be calculated from the stack’s voltage and current as follows:
P F C = U s t a c k   I = U S C   N   I
where N and USC are the number of cells in a series and single-cell voltage respectively.
Based on the H H V H 2 “higher heating value of the hydrogen fuel”, the actual efficiency of the cell ( η F C ) :
η F C = P F C m ˙ H 2 H H V H 2
m ˙ H 2 is the gravimetric rate in kg/s and the value H H V H 2 is 120 MJ/kg.

3.3. Electrolyzer

An electrolyzer is a device that utilizes electricity in order to produce hydrogen from water. Electrolysis is a process that involves the transfer of the field of an electric current through the water in order to break it down to its composites, i.e., hydrogen and oxygen gases. This is accomplished by electrolyzing the water. As can be seen in Figure 3, the produced hydrogen from the electrolysis process either serves as an external hydrogen load from the system or is stored as compressed hydrogen in the storage tank to use in the FC for the generated electricity. The following expression will give you the electrolyzer’s power consumption:
P E Z = m ˙ H 2 H H V H 2 η E Z
where the power consumption is expressed by PEZ, the mass rate of hydrogen in the electrolyzer is m ˙ H 2 in kg/s, and the electrolyzer’s efficiency is ηEZ. A hydrogen tank is required to store the hydrogen created by the electrolyzer so that it can be used later in a fuel cell or for a generator powered by hydrogen.

3.4. Diesel Generator

If the electricity provided by the solar PV and battery systems is inadequate, the diesel generator is used as a backup power source. The power production from the generator (PDG), which is determined using the following Equation (9), determines the consumption of fuel in the DG (GFC):
G F C = F o · Y D G + F 1 · P D G   < G F C P D G m a x
where F0 and F1 are the manufacturer’s fuel consumption coefficients, and YDG is the DG’s nominal (rated) power. The LHV “lower heating value” based DG efficiency is computed utilizing:
η g e n = 3.6   P D G G F C ·   L H V D
LHVD stands for the calorific value of diesel based on the water vapor, where GFC is the generator fuel consumption rate.
The battery’s maximum power, as well as the generator’s maximum power, are both utilized to calculate how long the generator will run:
P DG P DGmax
P DG < P bat ,   c lim

3.5. Converter

As shown in Figure 3, the converter is wired between a DC bus and an AC bus. It functions as an inverter of the DC current produced from the PV and the FC to the AC load, operating in both directions depending on the direction of the power flow. Both methods are acceptable for carrying out this process. The converter’s model takes into account both its rated capacity and efficiency, which are presumptively stable throughout the entirety of its working range. The rated DC voltage of each string in the PV array can also be used to calculate how many PV modules make up that string. The converter’s output power is determined as follows:
P I n v O u t = P I n v I n η I n v
where PInvOut is the output power to the inverter, PInvIn is the input of the power to the inverter, while η I n v is the inverter efficiency.

3.6. Battery Energy Storage System

Batteries play an important role in standalone HRES “hybrid renewable energy systems”, which may comprise any type of RES. This is because they are used to store any excess electrical energy and ensure that load demands are met during periods of load shortfall. A battery kinetics model was used throughout the time simulation, allowing for the estimate of the biggest power charge and discharge constraints, ( P bat ,   c lim ) and ( P bat ,   d lim ). This type of model would account for all voltage losses based on a capacity degradation brought on by temperature, DOD “depth of discharge,” resistance (serial), and rate of deterioration from cycle to cycle. The power of the battery bank can be roughly determined as follows:
P o u t = I   V o u t p u t = V 0 I R 0   I 2
The SOC “state of charge” of the battery is determined as follows:
S O C ( t + Δ t ) = min {   S O C ( t ) ( 1 δ ) + η c h ( P g e n P L ) Δ t ,   S O C m a x }                    
where t and Δt are the current time and time interval, δ is the self-discharge coefficient, ηch is the battery’s efficiency, power demand is PL, and the maximum allowed SOC is SOCmax.
PV or PV and DG are used for getting the produced power Pgen as follows:
P g e n = {   η i n v   P P V                                                   P V   o n l y ,                   η i n v   P P V + P D G                                                     P V   a n d   D G .
while the battery is undergoing charging-discharging, the power is limited by I b a t ,   c l i m “value of the charging current”:
P gen P L < P bat ,   c lim = I bat ,   c lim V bat
Vbat is the terminal voltage of the battery terminal.
The PV system can meet the demand for electricity with the help of batteries when there is not enough energy available, such as at night or when there is not enough sunlight. The discharging procedure is complete when the demand power reaches a level that exceeds the storage system’s discharge limit power, and the DG is able to handle the necessary load. Applying the following relationship will allow you to assess how much the SOC has changed:
SOC ( t + Δ t ) = { SOC ( t ) ( 1 δ )   if   P L P gen η dch > P bat , d lim max { SOC ( t ) ( 1 δ ) P L P gen η dch Δ t , SOC min }   if   P L P gen η dch P bat , d lim
where SOCmin is the minimum limit of the SOC and ηdch is the discharge efficiency.
Similar to the charging stage, the battery’s discharge power P bat ,   d lim is a result of the discharging current’s technological constraints ( I bat ,   d lim ):
P bat ,   d lim = I bat ,   d lim V bat
The simulation of the green hydrogen hybrid energy system (PV-FC-DG-BES) was performed based on an hourly basis, The optimization tools inside HOMER Pro were used to optimize the size of both the PV-DG-BES and the PV-FC-DG-BES hybrid energy systems. The simulations were performed for thousands of trial cases and sorted based on the cost of energy COE.

4. Results and Discussion

In this study, we used both the hybrid energy systems solar PV-DG-BES and solar PV-DG-FC-BES to produce the electrical energy to power an office building in Sharjah, as shown in Figure 4. The load profile includes the cooling load, lighting, and other appliances inside the office building. The weight percentage for the solar PV and the diesel generator of the PV-DG-BES was 80.9% and 19.1%, respectively, whereas the weight percentage for the solar PV, fuel cell, and the diesel generator of the PV-DG-FC-BES system were 87.7%, 9.25%, and 3.06%, respectively. Solar PV was selected as the main electrical power supply for running the electrical load for the office building in Sharjah, such as HVAC system components, lighting, and other electrical appliances. Solar PV provides the electrical power required for the electrolyzer. The electrical power needed for the electrolyzer used during the fuel cell operation means that the electrolyzer consumes electrical energy from the solar PV and provides the hydrogen required for the fuel cell operation. The function of a hydrogen tank is to store the excess hydrogen if the fuel cell is off and to use it for future operation. The excess electrical power from the solar PV is not only used for running the electrolyzer but is also used for charging the battery during the high peak production of solar PV. The DG is used as a backup if there is a low power production from the PV, FC, and BES.
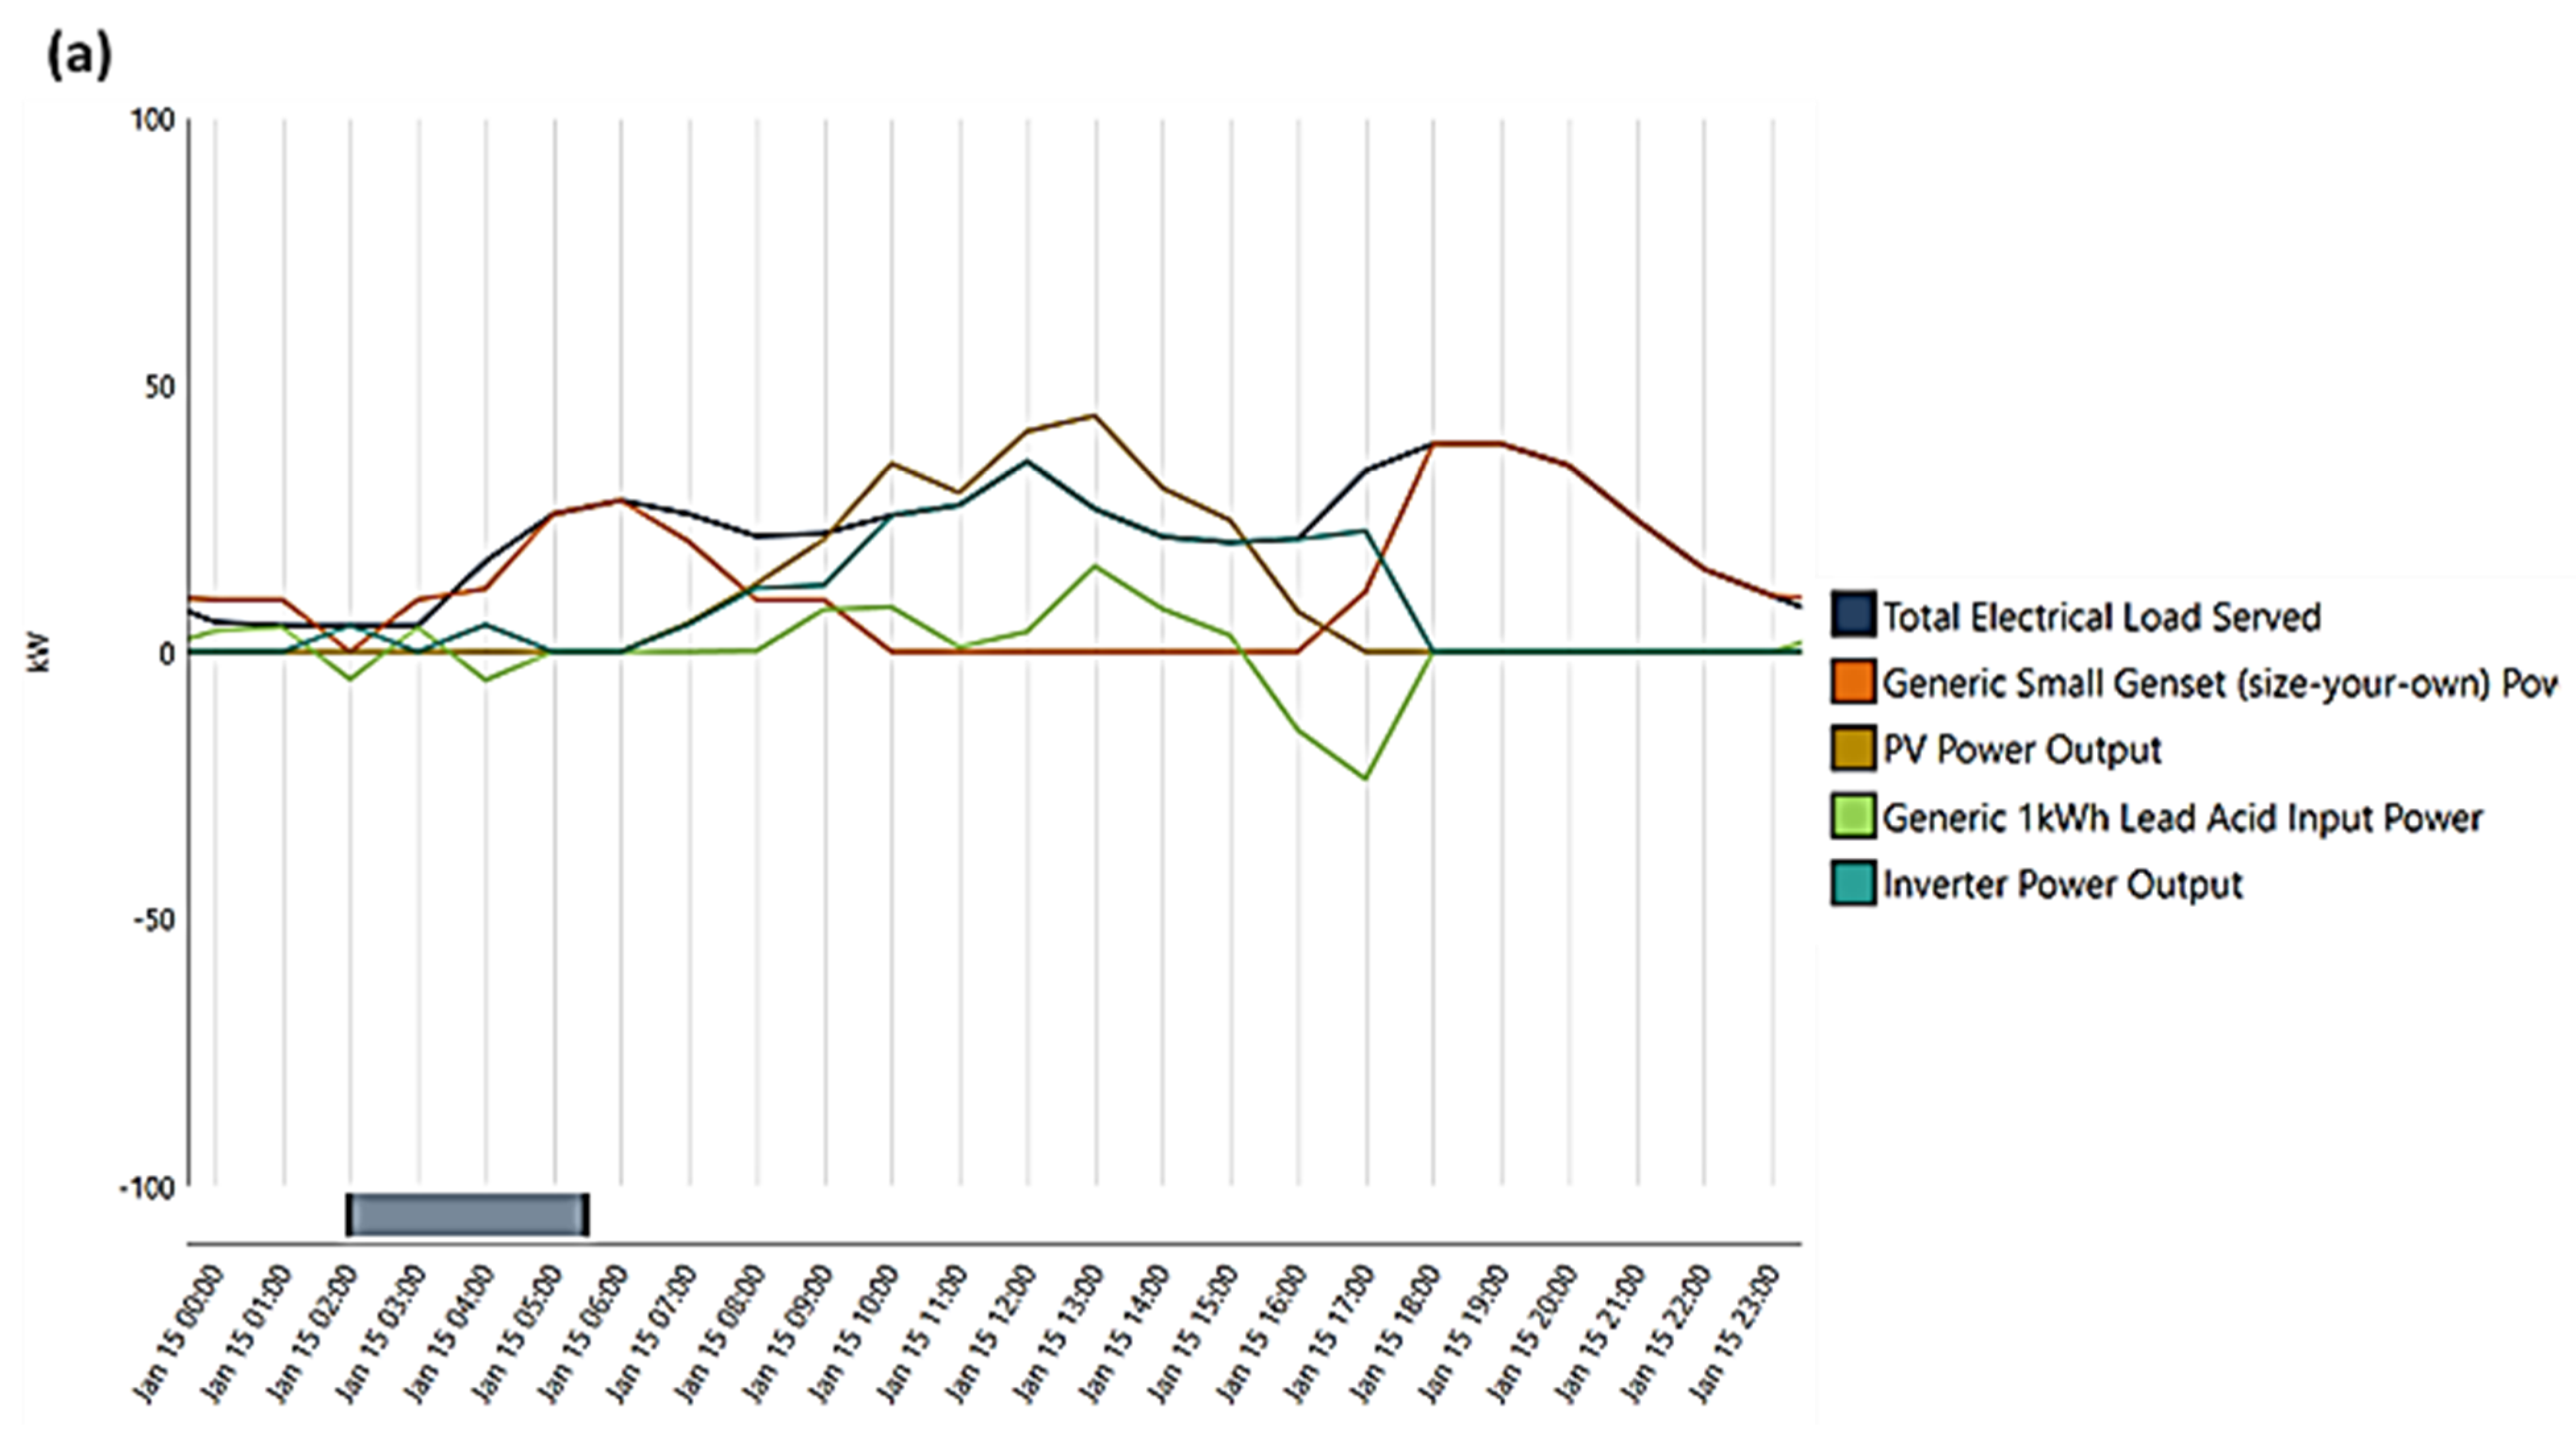
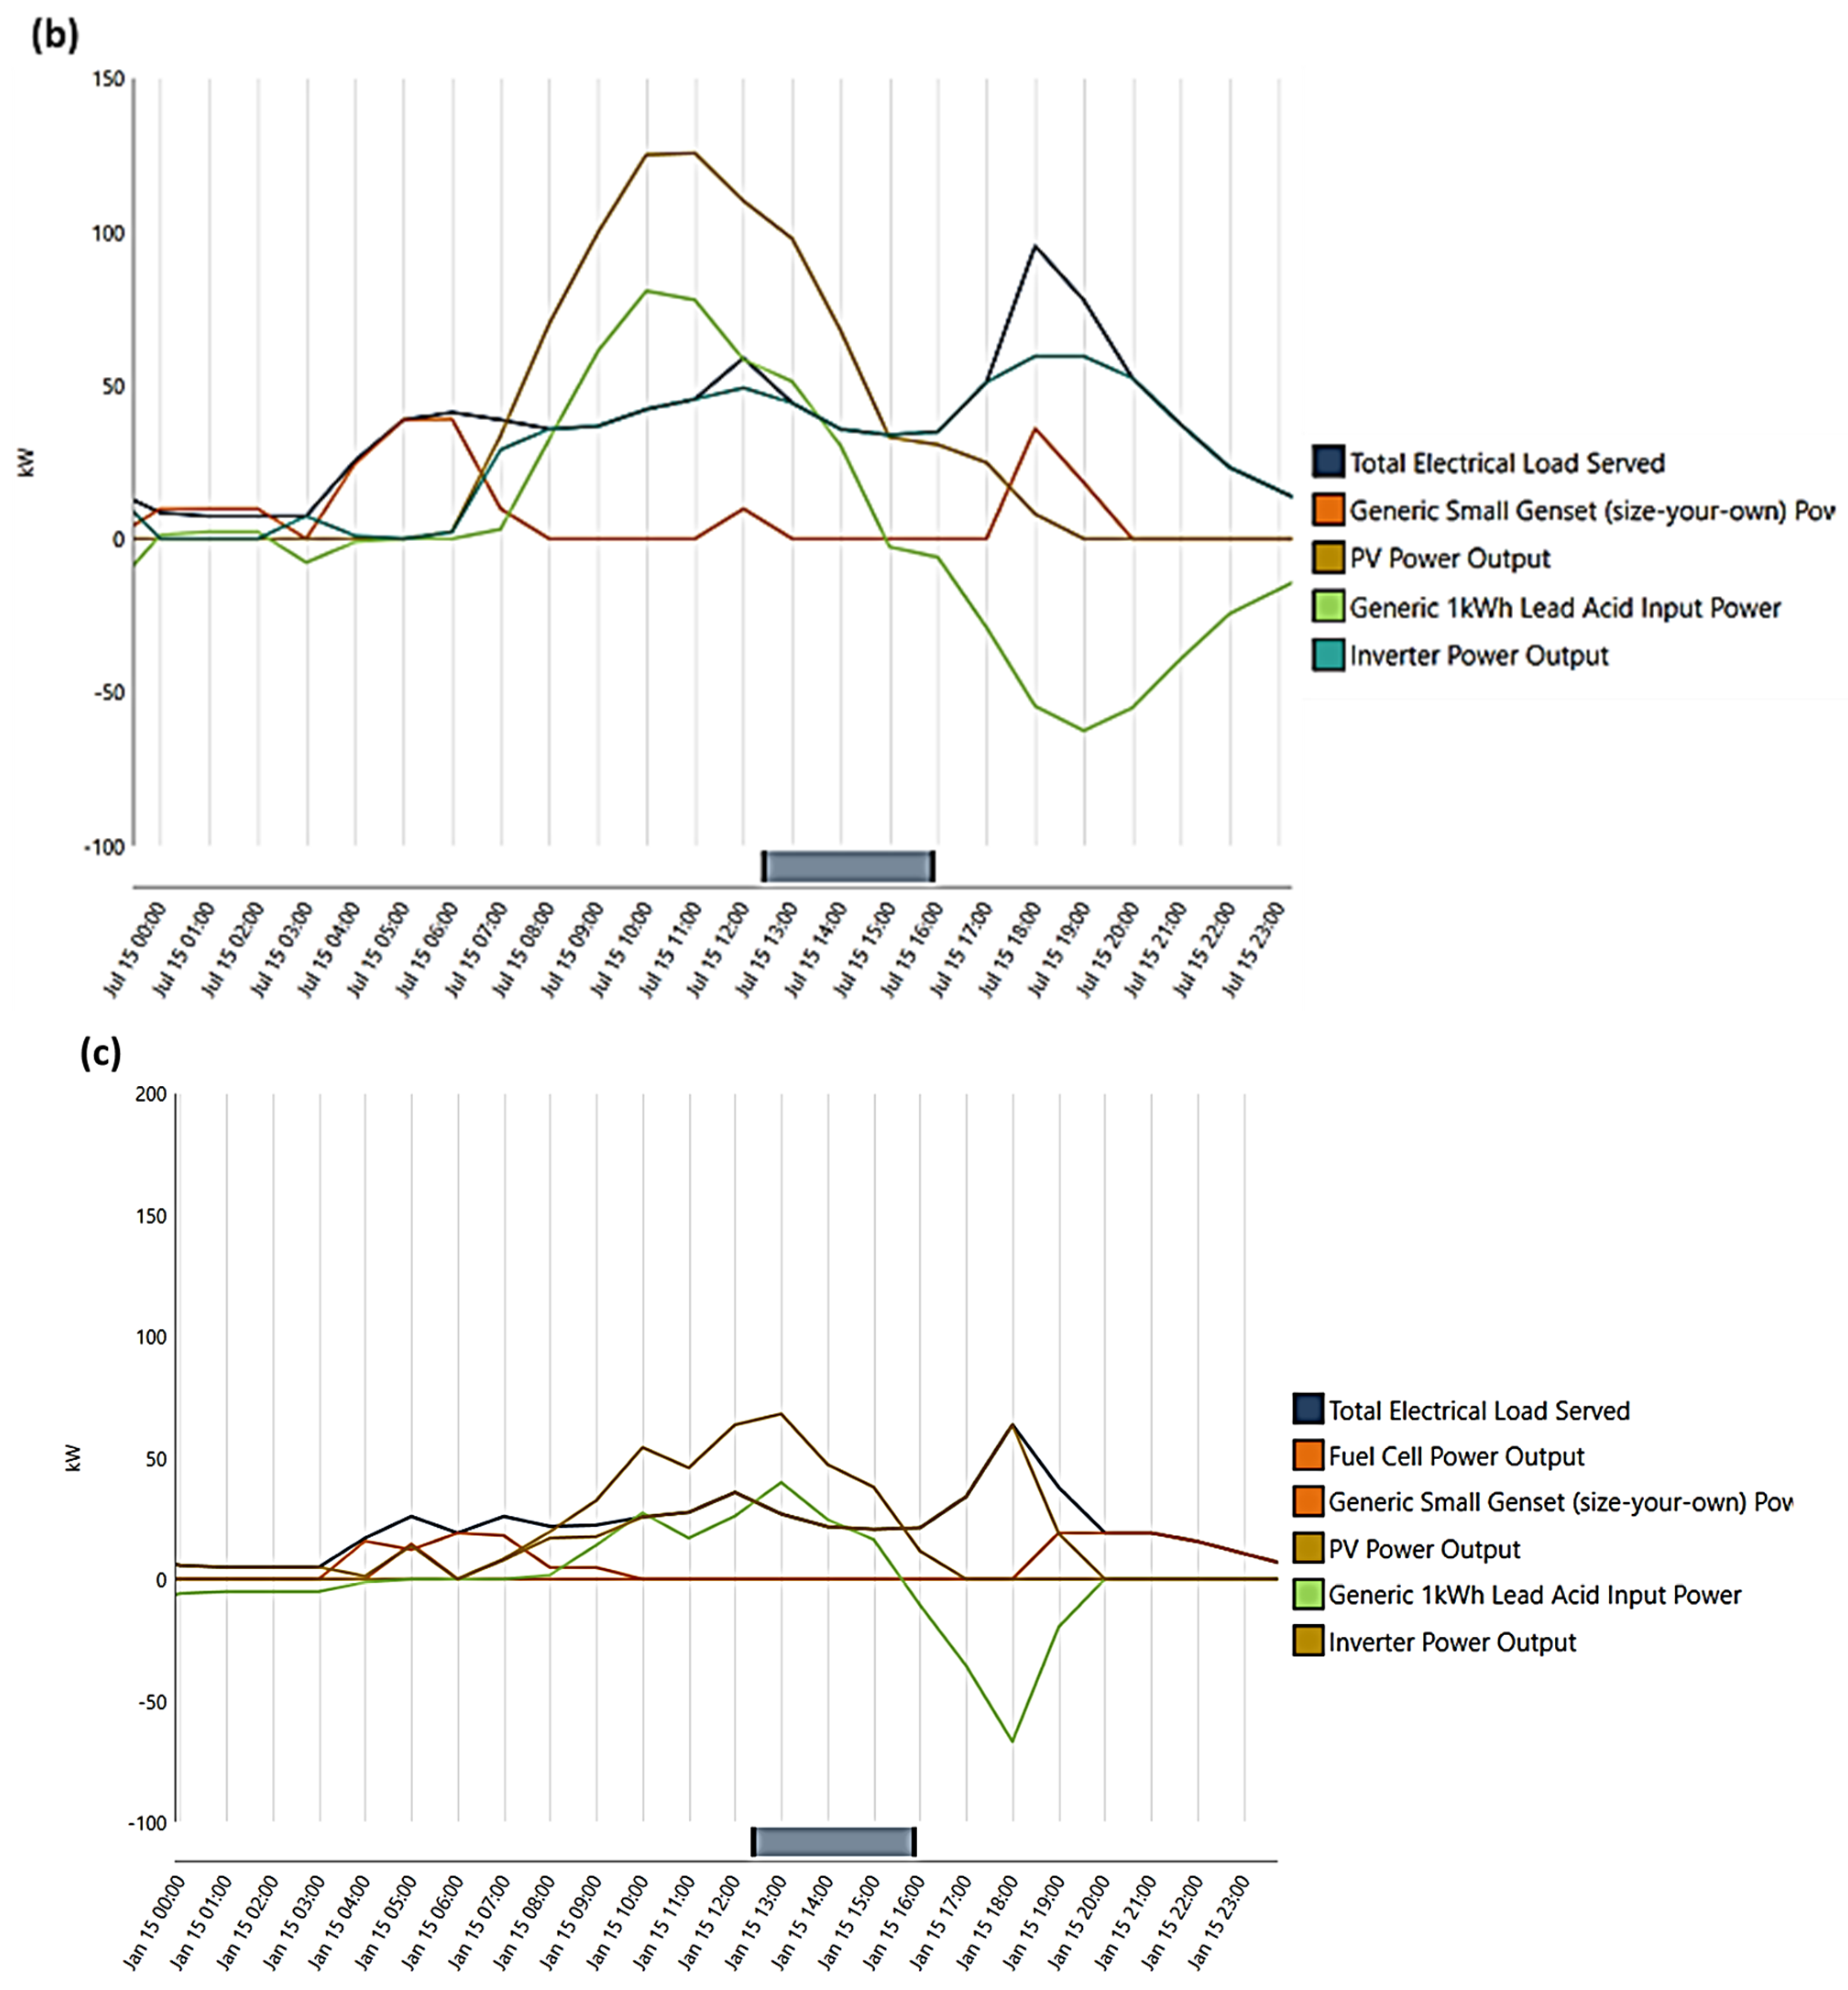
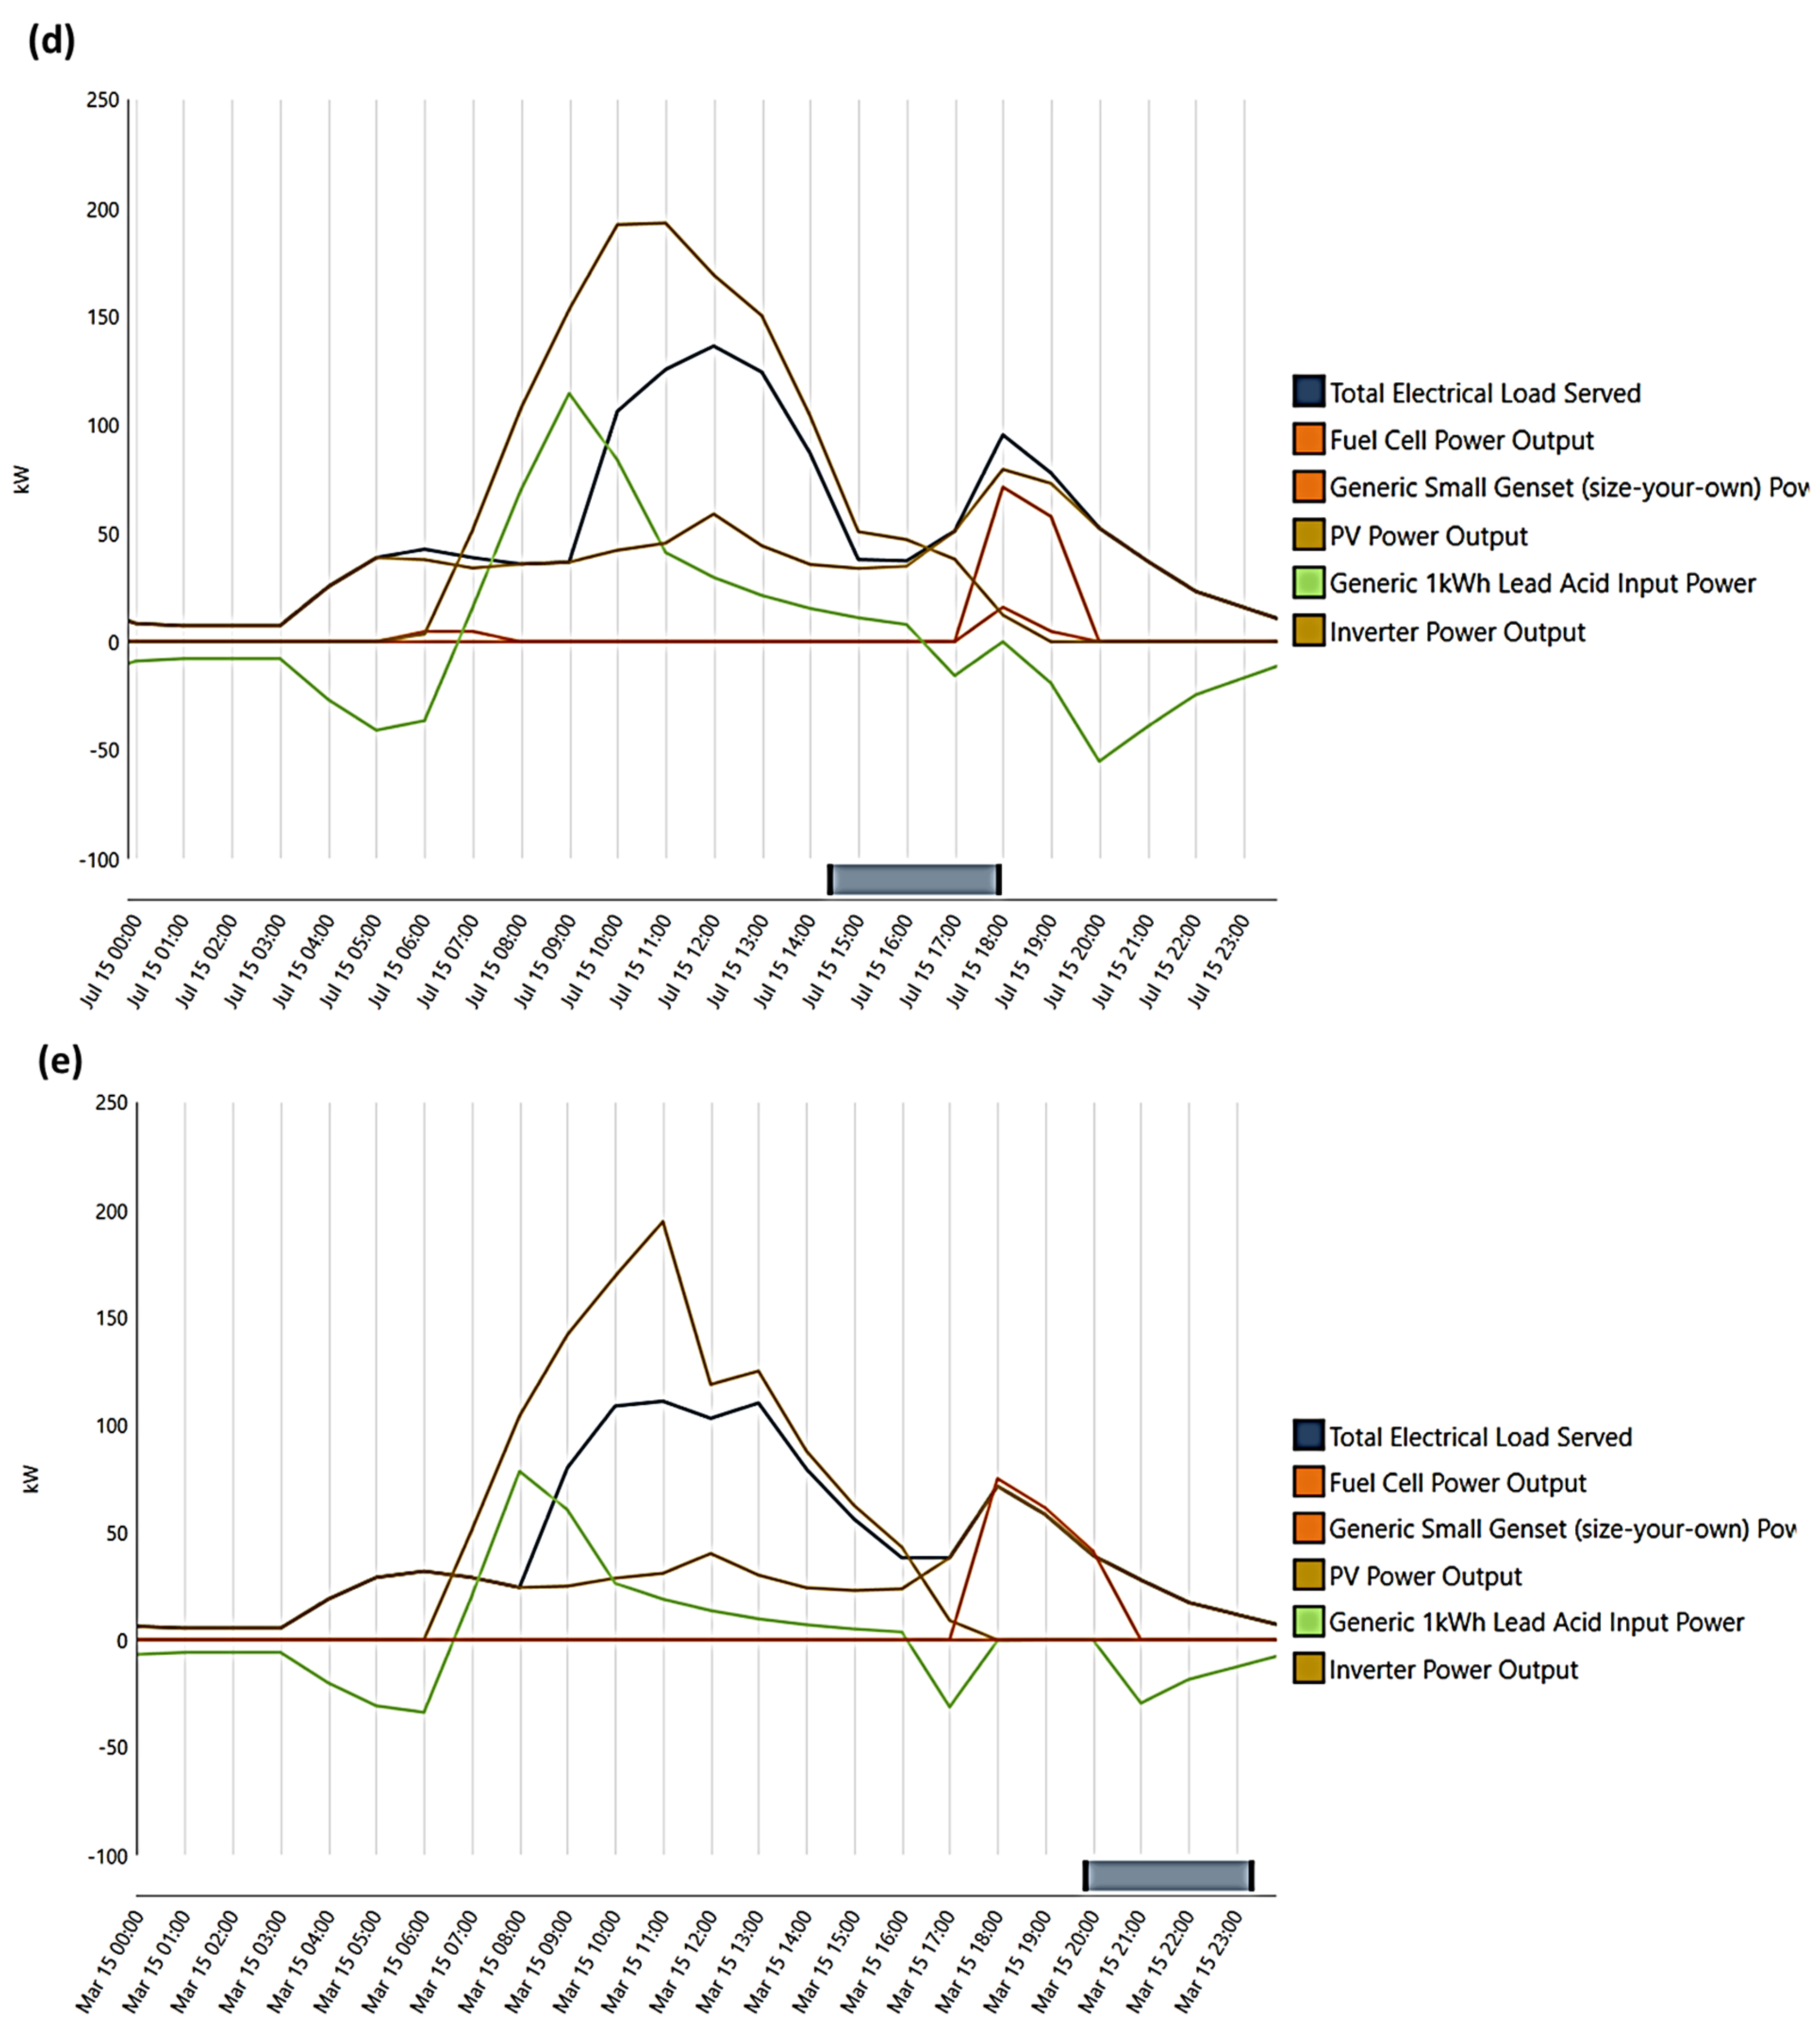
Figure 5a–d shows the hourly electrical power basis for both of the hybrid systems on the minimum and maximum loads in the months of January and July. The only curve that was below the x-axis is the BES curve when it is working in the discharging mode. The hourly electrical power basis for the PV-DG-FC-BES system is also shown for the month of March where all the hydrogen (green) produced from the solar PV system and the diesel fuel consumption is zero.
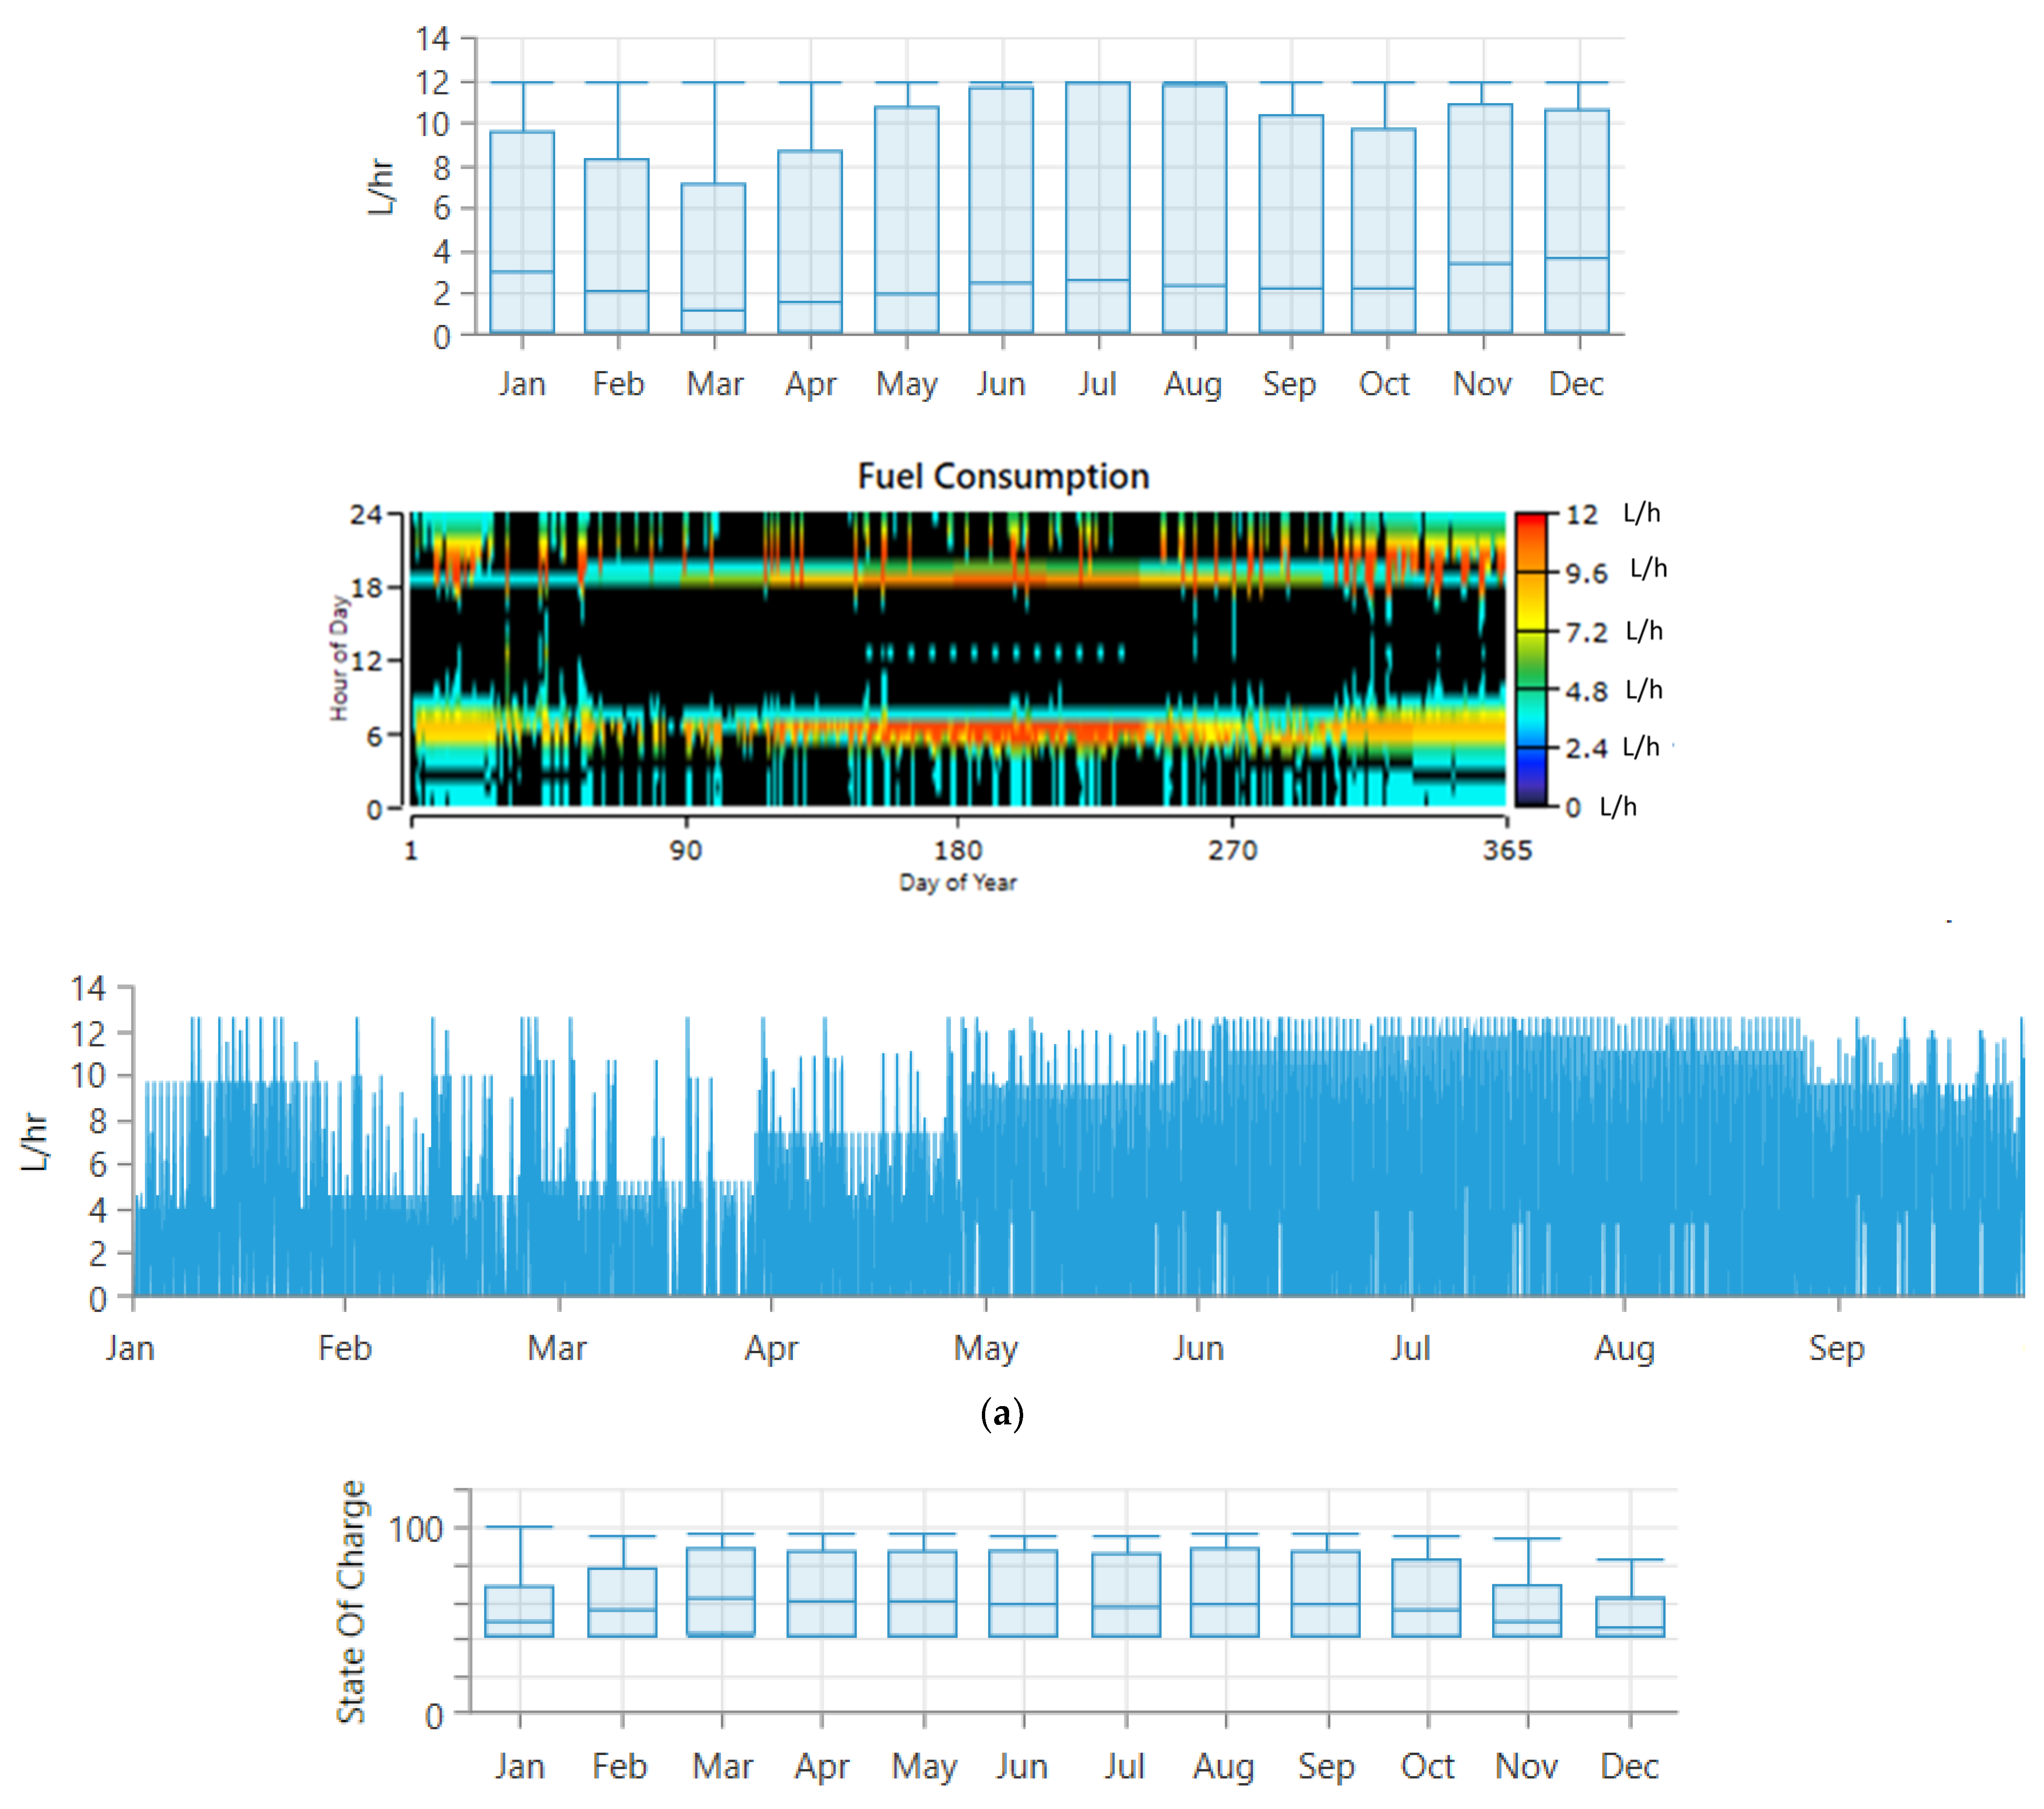
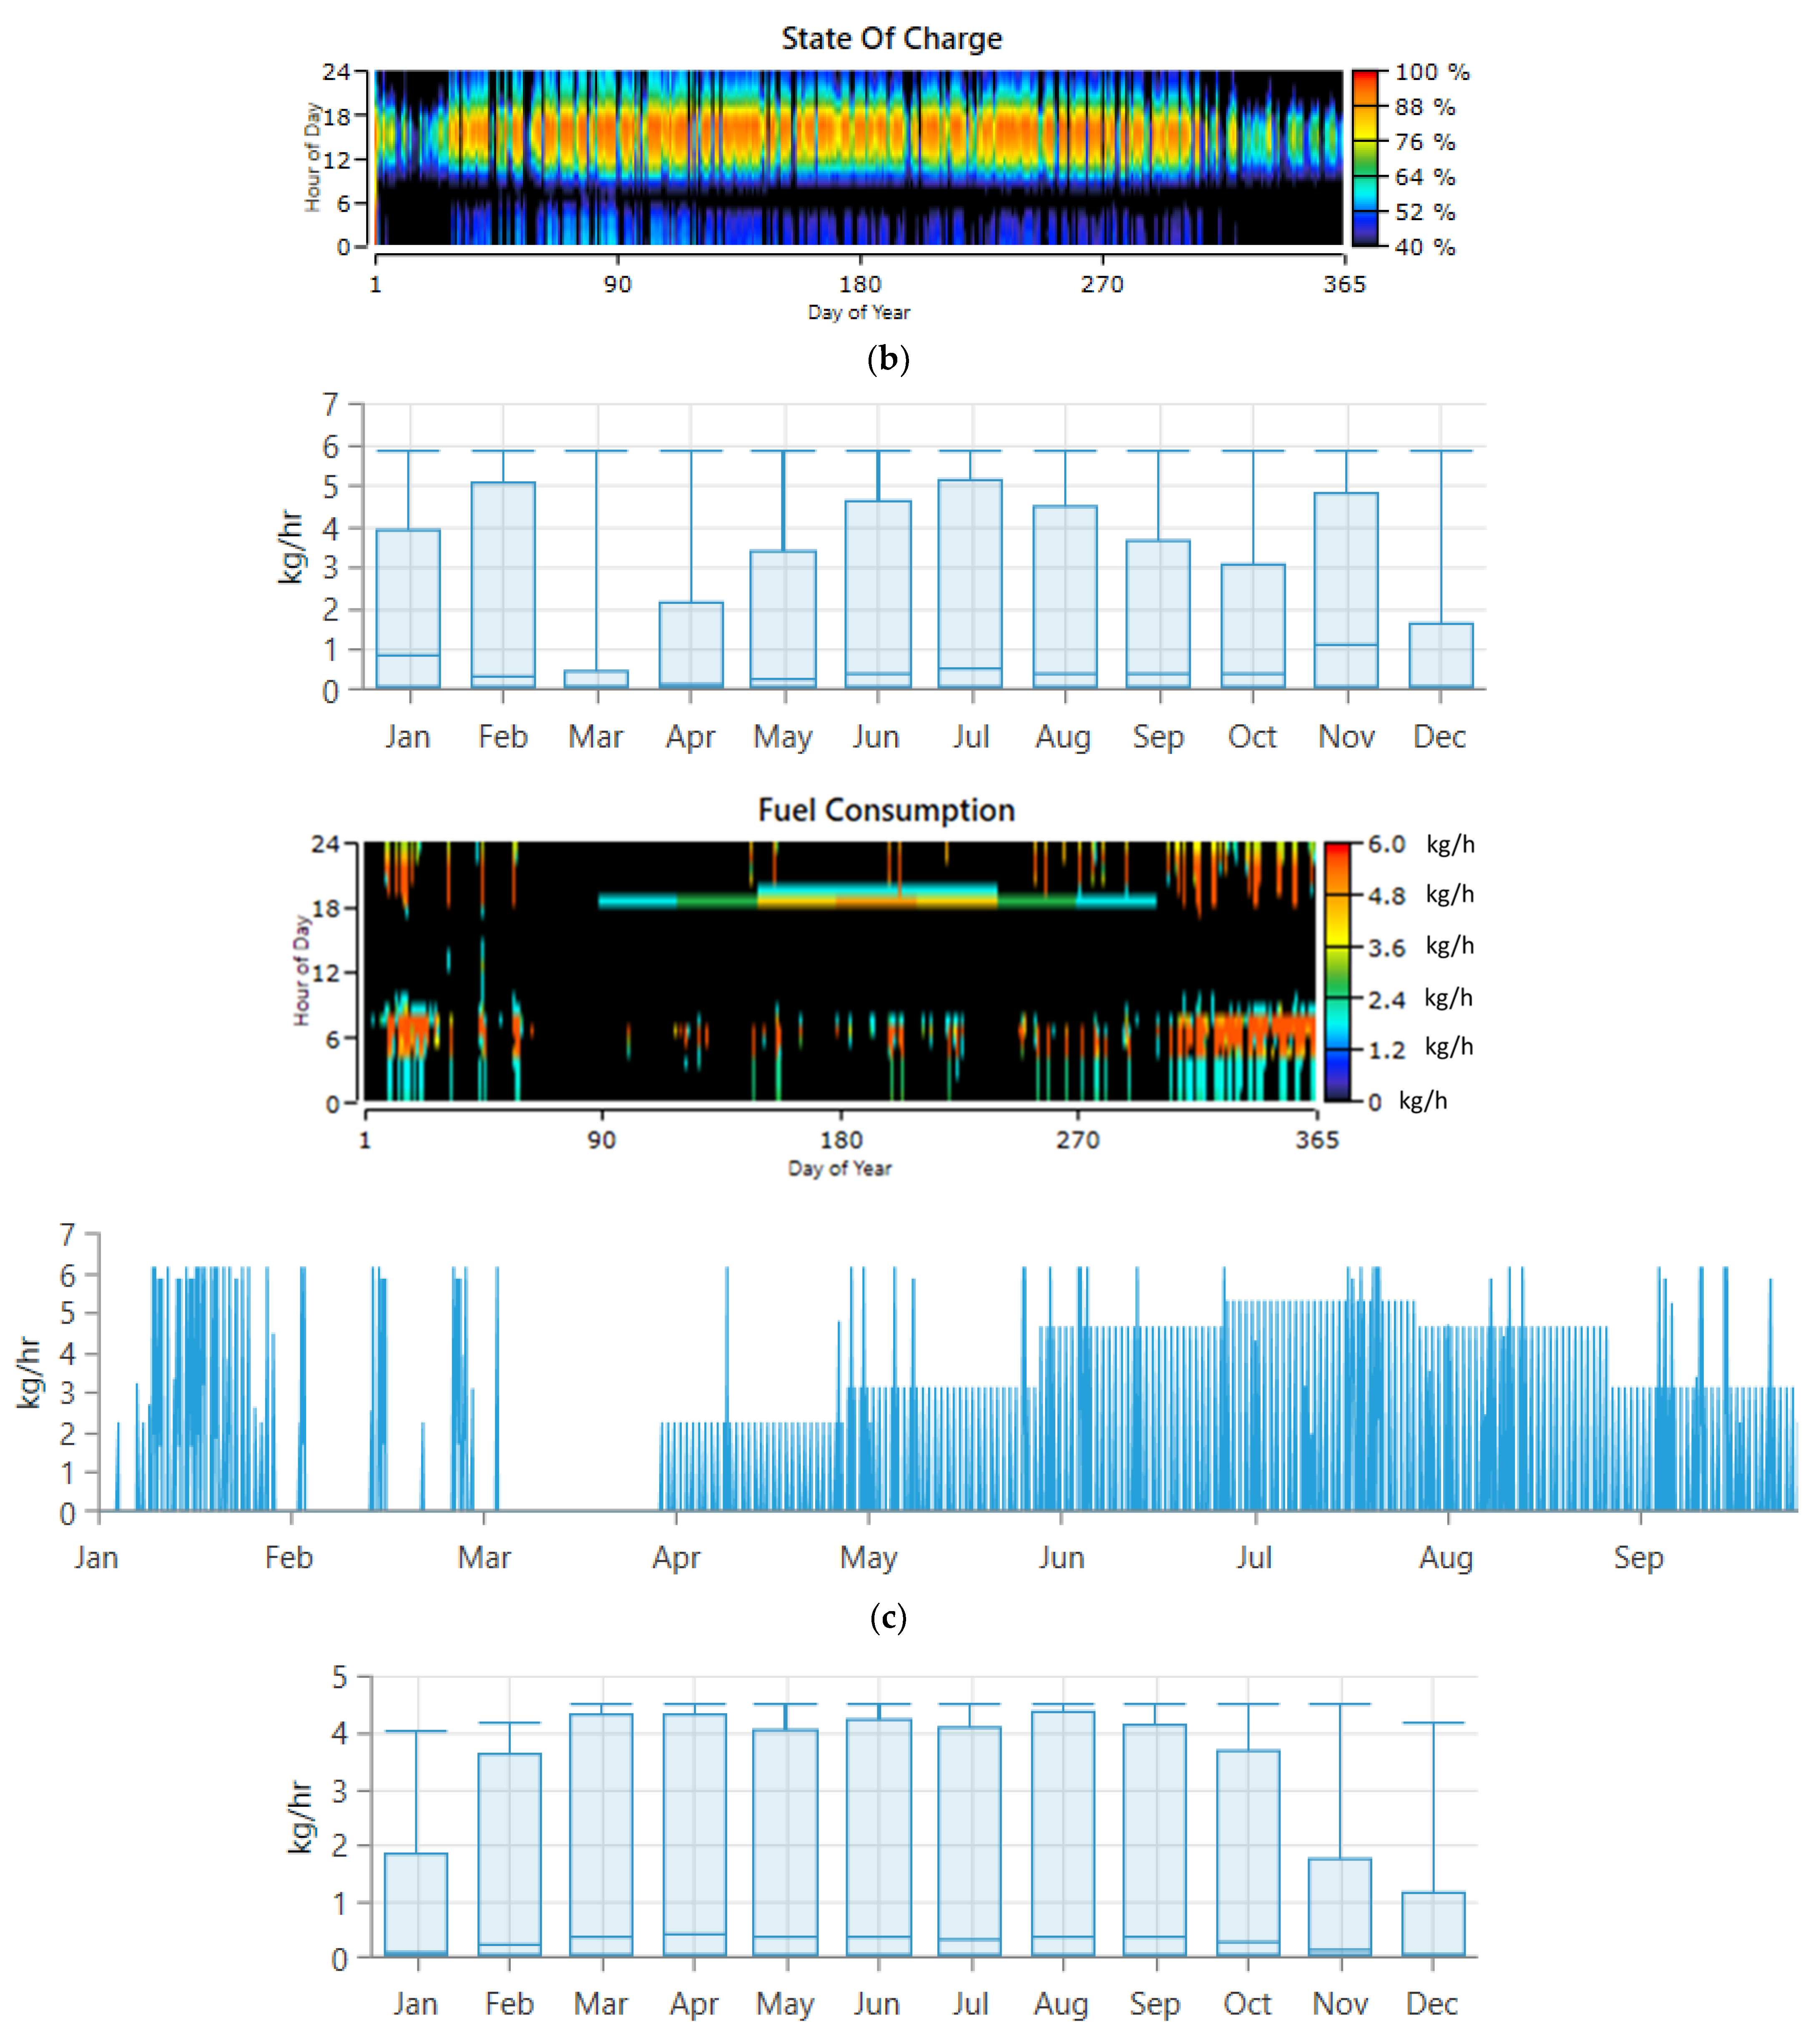
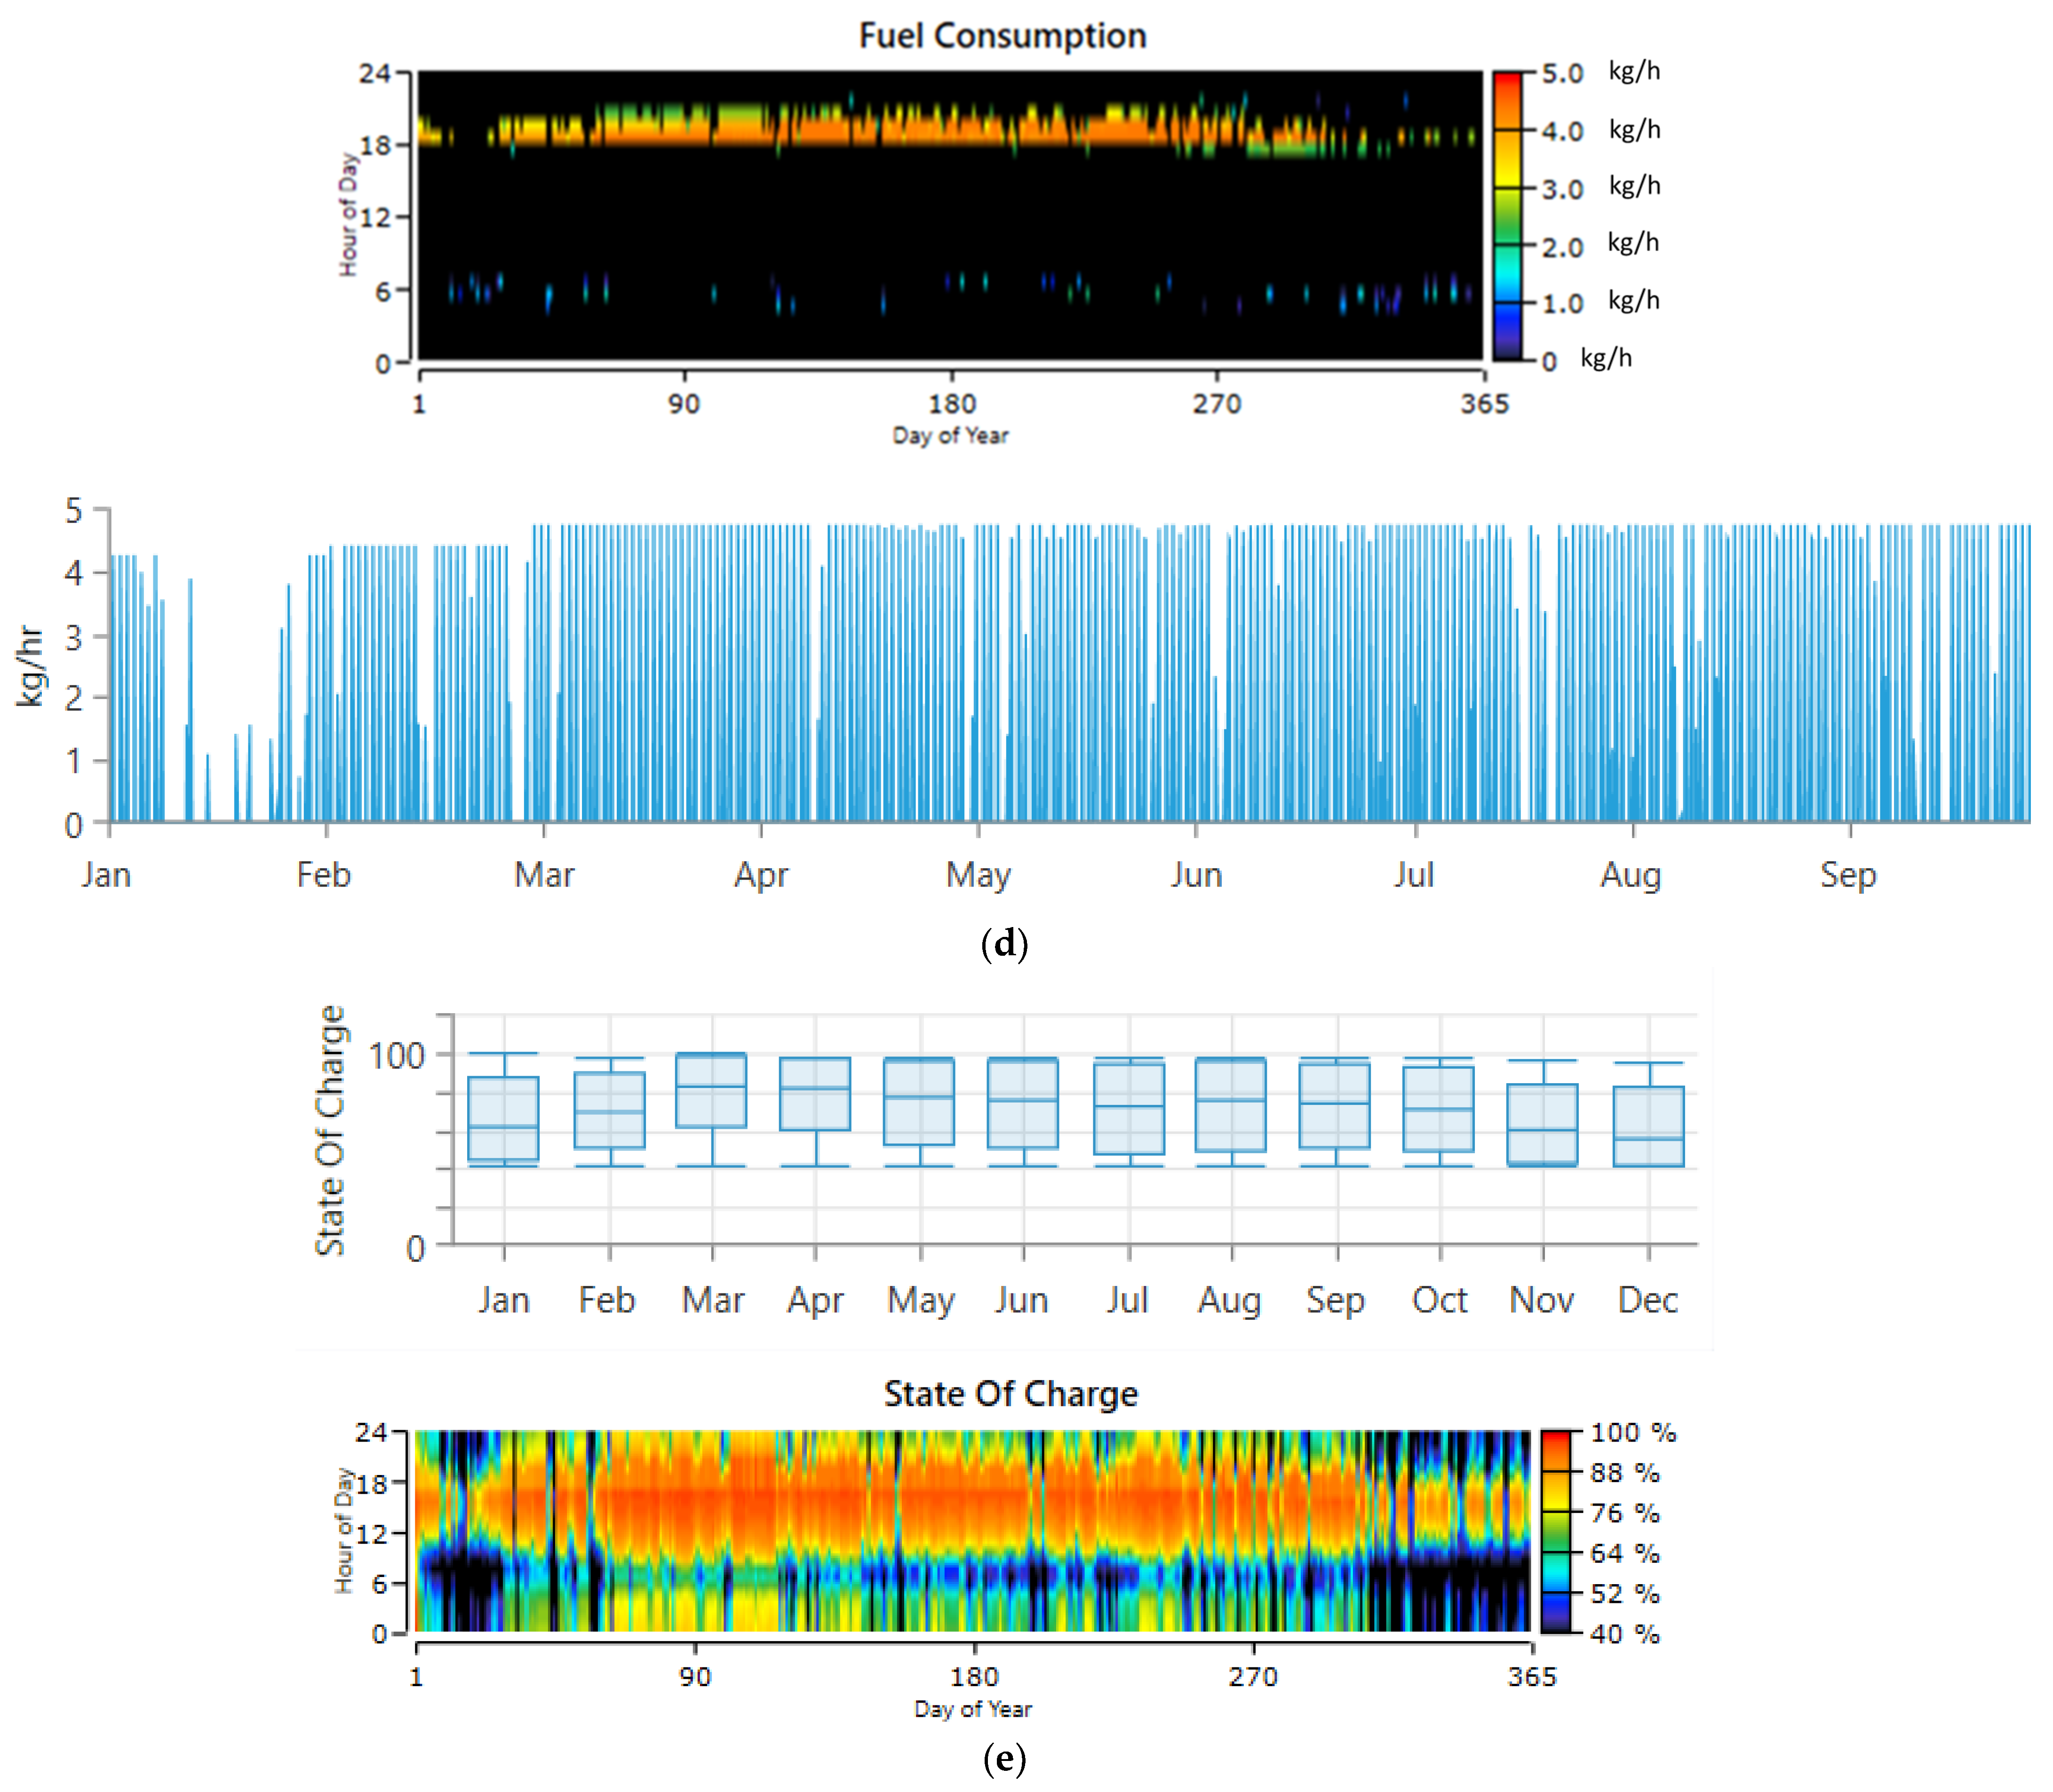
Figure 6a,b represents the performance of the PV-DG-BES system. As expected the system depends on both PV and DG to produce power with any excess of electrical power produced being sent to BES for storage. The PV-DG-BES system relies heavily on the PV for electric power production due to shorter daylight hours (winter session) and the abounded insolation in the UAE throughout the year. Whereas the diesel fuel consumption and the SOC were very high in the summer season due to longer daylight hours even though the amount of insolation is at its highest in comparison to the rest of the year. The highest fuel consumption of DG occurs at 6 PM corresponding to the time of peal load as shown in the hourly and daily mapping distribution in Figure 2a. On the other hand, Figure 6c–e shows the level of fuel consumption (diesel), fuel stored (hydrogen), and the battery’s electrical charge or state of charge (SOC). The monthly fuel consumption amount was very high during the winter season due to the decrease in solar radiation in Sharjah during this period of the year. Moreover, the monthly fuel storage amount was very high during April and May due to the better performance of the solar PV, which was working at the optimum operating temperature. Similar to the fuel consumption, the amount of electrical storage or SOC of the battery was very low due to the aforementioned reason for the fuel consumption. Moreover, the level of diesel fuel consumption, the level of hydrogen storage, and the SOC are shown in Figure 6c–e, respectively, based on the hourly and daily mapping distribution. This mapping distribution clearly shows how the hybrid solar PV, DG, FC, and BES provides electrical power for the office building in Sharjah. This mapping distribution reflects how the hybrid energy system meets the load profile of the office building. Moreover, the highest fuel consumption occurs at 6 PM, corresponding to the load peak, while the highest fuel storage also happens at 6 PM in the months of March and April due to the best performance of solar PV and in August due to a long time of operation. Furthermore, the SOC for the battery has the highest and lowest values in the afternoon and before sunrise due to the full charging process and the full discharge process.
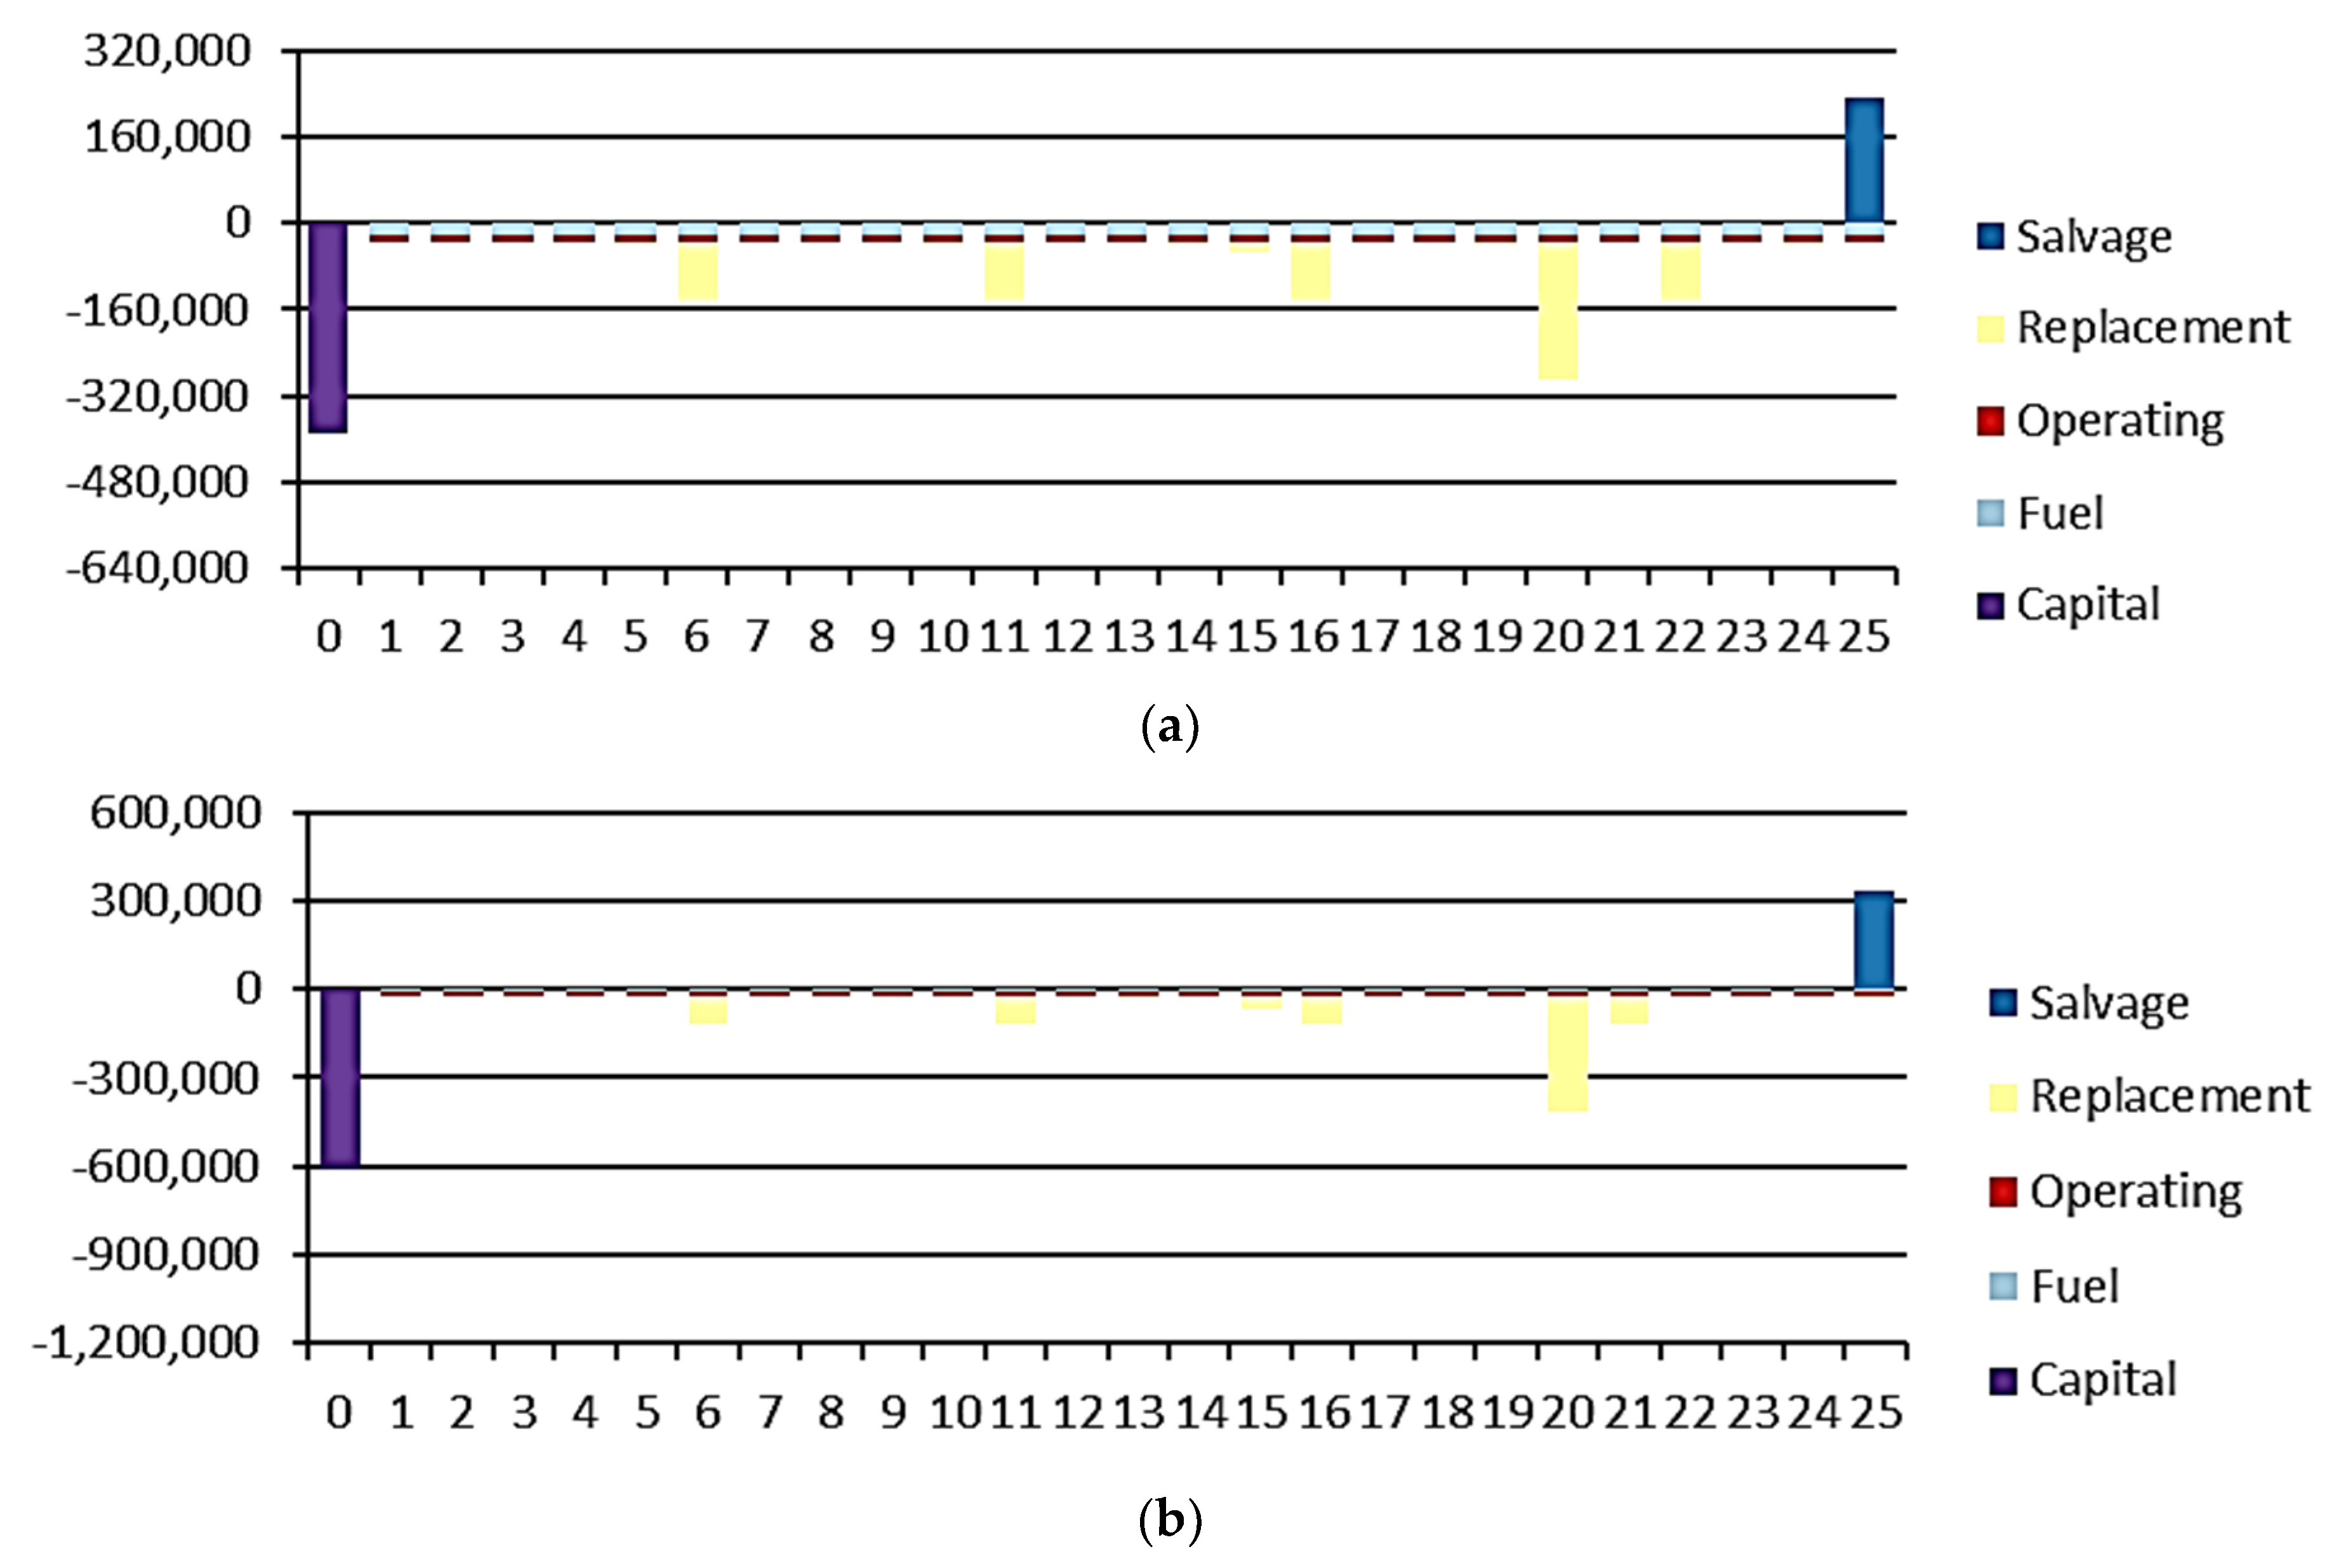
The economic aspect of both the hybrid systems was compared in terms of cost of energy (COE) USD/kWh. The COE for the PV-DG-BES and PV-FC-DG-BES systems were very similar to each other being 0.305 USD/kWh and 0.313 USD/kWh, respectively. Even though the capital cost of the PV-DG-FC-BES system is higher than the capital cost of the PV-DG-BES system, the replacement costs of the PV-DG-BES system was higher than the replacement cost of the PV-DG-FC-BES system as shown in the cash flow diagram in Figure 7.
The comparison between the two hybrid systems in terms of the carbon footprint was also performed based on the emission gases responsible for greenhouse gases, such as carbon dioxide, unburned hydrocarbons, particulate matter, Sulphur dioxide (SOx), and nitrogen oxides (NOx). The impact of each aforementioned item on the environment is shown in Table 2.
The results from this study were compared with some of the other studies in the literature [36,37,38]. The solar PV-DG with different energy storage technologies was studied by [36]. The COE was within the range of this study. Moreover, the PV-DG-BES hybrid system was studied by [37]; the COE varied from 0.392 to 0.465 USD/kWh with the load profile and the capacities of the components being close to the data found in this study. Furthermore, the PV-DG-FC-BES hybrid system was used for a small community in NEOM city in Saudi Arabia, the COE was 0.126 USD/kWh with the load being similar to the load used in [37] but the COE was dependent on the cost of the diesel fuel and the derating factor of solar PV.

5. Conclusions

The commercial office building in Sharjah, United Arab Emirates, was built to use a hybrid green hydrogen system based on PV-DG-FC-BES technology. The load profile of the office building was met by the electric energy generated using the basic PV-DG-BES and hybrid green hydrogen systems. The total load comprises the demands of the office lighting, cooling, and other equipment. The COE for the base case and green hydrogen energy systems was 0.305 USD/kWh and 0.313 USD/kWh, respectively. While the operation and replacement expenses for the basic system were the greatest, the capital cost of a green hydrogen system was greater than the basic system. The basic system had a much greater carbon footprint and pollution from gas emissions, such as carbon dioxide, carbon monoxide, unburned hydrocarbons, particulate matter, Sulphur dioxide, and nitrogen oxides than the green hydrogen system.
In this work the comparison between the PV-DG-BES system and the PV-FC-DG-BES system was conducted in order to show how green hydrogen is produced using renewable energy resources, such as solar photovoltaic. The study shows that green hydrogen can be produced during the months of March and April when the abounded of solar radiation and the performance of solar PV cells were the highest in comparison to the other months. Moreover, green hydrogen can be produced throughout the year by increasing the electrical power production of the PV system with the COE being high in this case. The hydrogen production in this study was mainly based on renewable resources as in the PV system. Furthermore, different control strategies will be applied to the diesel generator in future studies to minimize its operating hours and emissions.

Author Contributions

Conceptualization T.S., M.A.A. and E.T.S.; methodology, T.S., M.A.A., M.S.M. and E.T.S.; formal analysis, A.G.O., M.S.M. and S.K.K.; investigation, A.G.O., M.S.M. and S.K.K.; resources, A.G.O. and S.K.K.; data curation, T.S., A.G.O., M.A.A., M.S.M., S.K.K. and E.T.S.; writing original E.T.S., A.G.O., M.A.A., M.S.M., S.K.K. and E.T.S.; draft preparation, T.S., A.G.O., M.A.A., M.S.M., S.K.K. and E.T.S. All authors have read and agreed to the published version of the manuscript.

Funding

This work was supported by the University of Sharjah, Project No. 19020406129.

Conflicts of Interest

The authors declare no conflict of interest.

Nomenclature

AWEAlkaline water electrolyzer
APVThe PV panel’s area.
COEThe cost of energy
CO2Carbon Dioxide
COCarbon Monoxide
DODDepth of discharge
EconsThe total energy consumption
EnonrenThe conventional energy source
fPVThe solar PV’s derating factor
frenThe system’s fraction of utilized renewable energy
F0and F1The manufacturer’s fuel consumption coefficients
GTThe actual amount of solar insolation
GFCThe consumption of fuel in the DG
GFCthe generator fuel consumption rate.
GSTCThe amount of solar insolation at 1000 W/m2 and 25 °C during STC
HCHydrocarbons
HOMER ProHybrid Optimization Model for Multiple Energy Resources
H H V H 2 Higher heating value of the hydrogen fuel
HRESHybrid renewable energy systems
I b a t ,     c l i m Value of the charging current
LCOHThe Levelized Cost of hydrogen
LCOELevelized Cost of Electricity
LHVLower heating value-based DG efficiency
LHVDThe calorific value of diesel based on water vapor
m ˙ H 2 The mass rate of hydrogen in the electrolyzer in kg/s
NThe number of cells in series
NsSolar PV arrays with multiple panels connected in series
NpSolar PV arrays with multiple panels connected in parallel
NOxNitrogen oxides
PV-DG-FC-BESSolar PV, a fuel cell, a diesel generator, and battery energy storage system
PV-DG-BESSolar PV, a Diesel Generator, and Battery Energy Storage
PV-DG-FC-BESSolar PV, fuel cell, diesel generator, and battery energy storage
PPVThe power production from the PV panel
PmSTCThe solar PV panel power at a maximum point under STC.
PmThe solar PV panel’s maximum power under the actual operating conditions
P E Z The electrolyzer’s power consumption
PDGThe power production from the generator
PLThe power demand
PFCThe amount of the fuel’s chemical energy that is not converted into fuel cell electricity
PInvOutThe output power to the inverter,
PInvInThe input of the power to the inverter
P bat ,   d lim The battery’s discharge power
P o u t The power of the battery bank
RESRenewable energy system
STCStandard test conditions
SOCBattery’s electrical charge or state of charge
SOCmaxThe maximum allowed SOC
SOCminThe minimum limit of the SOC
SOxSulphur oxides
Tc,STCThe solar PV’s cell temperature under STC,
TcThe solar PV’s cell temperature,
tThe current time
UAEUnited Arab Emirates
USCSingle-cell voltage
Vbatthe terminal voltage of the battery terminal.
YDGThe DG’s nominal power.
αPThe temperature coefficient of power.
δThe self-discharge coefficient
ηmp,STCPV panels’ maximum efficiency at STC
η F C The actual efficiency of the Fuel cell
ηEZThe electrolyzer’s efficiency
η I n v The inverter efficiency.
ηchThe battery’s efficiency
ηdchThe discharge efficiency
ΔtTime interval

References

  1. Olabi, A.G.; Rezk, H.; Sayed, E.T.; Ghoniem, R.M.; Abdelkareem, M.A. Boosting carbon dioxide adsorption capacity applying Jellyfish optimization and ANFIS-based modelling. Ain Shams Eng. J. 2022, 14, 101931. [Google Scholar] [CrossRef]
  2. Olabi, A.G.; Wilberforce, T.; Elsaid, K.; Sayed, E.T.; Maghrabie, H.M.; Abdelkareem, M.A. Large scale application of carbon capture to process industries—A review. J. Clean. Prod. 2022, 362, 132300. [Google Scholar] [CrossRef]
  3. Caponi, R.; Bocci, E.; Del Zotto, L. Techno-economic model for scaling up of hydrogen refueling stations. Energies 2022, 15, 7518. [Google Scholar] [CrossRef]
  4. Bresa, Q.; Kovač, A.; Marciuš, D. Introduction of hydrogen in the Kosovo transportation sector. Energies 2022, 15, 7275. [Google Scholar] [CrossRef]
  5. Abdelkareem, M.A.; Soudan, B.; Mahmoud, M.S.; Sayed, E.T.; AlMallahi, M.N.; Inayat, A.; Radi, M.A.; Olabi, A.G. Progress of artificial neural networks applications in hydrogen production. Chem. Eng. Res. Des. 2022, 182, 66–86. [Google Scholar] [CrossRef]
  6. De Simio, L.; Iannaccone, S.; Masi, M.; Gobbato, P. Experimental study and optimisation of a non-conventional ignition system for reciprocating engines operation with hydrogen–methane blends, syngas, and biogas. Energies 2022, 15, 8270. [Google Scholar] [CrossRef]
  7. Acar, C.; Beskese, A.; Temur, G.T. Sustainability analysis of different hydrogen production options using hesitant fuzzy AHP. Int. J. Hydrogen Energy 2018, 43, 18059–18076. [Google Scholar] [CrossRef]
  8. Demir, M.E.; Dincer, I. Cost assessment and evaluation of various hydrogen delivery scenarios. Int. J. Hydrogen Energy 2018, 43, 10420–10430. [Google Scholar] [CrossRef]
  9. Diab, J.; Fulcheri, L.; Hessel, V.; Rohani, V.; Frenklach, M. Why turquoise hydrogen will Be a game changer for the energy transition. Int. J. Hydrogen Energy 2022, 47, 25831–25848. [Google Scholar] [CrossRef]
  10. Chen, S.; Pei, C.; Gong, J. Insights into interface engineering in steam reforming reactions for hydrogen production. Energy Environ. Sci. 2019, 12, 3473–3495. [Google Scholar] [CrossRef]
  11. Dawood, F.; Anda, M.; Shafiullah, G.M. Hydrogen production for energy: An overview. Int. J. Hydrogen Energy 2020, 45, 3847–3869. [Google Scholar] [CrossRef]
  12. Hermesmann, M.; Müller, T.E. Green, turquoise, blue, or grey? Environmentally friendly hydrogen production in transforming energy systems. Prog. Energy Combust. Sci. 2022, 90, 100996. [Google Scholar] [CrossRef]
  13. Grigoriev, S.A.; Fateev, V.N.; Bessarabov, D.G.; Millet, P. Current status, research trends, and challenges in water electrolysis science and technology. Int. J. Hydrogen Energy 2020, 45, 26036–26058. [Google Scholar] [CrossRef]
  14. Fragiacomo, P.; Genovese, M. Technical-economic analysis of a hydrogen production facility for power-to-gas and hydrogen mobility under different renewable sources in Southern Italy. Energy Convers. Manag. 2020, 223, 113332. [Google Scholar] [CrossRef]
  15. Hurtubia, B.; Sauma, E. Economic and environmental analysis of hydrogen production when complementing renewable energy generation with grid electricity. Appl. Energy 2021, 304, 117739. [Google Scholar] [CrossRef]
  16. Karayel, G.K.; Javani, N.; Dincer, I. Green hydrogen production potential for Turkey with solar energy. Int. J. Hydrogen Energy 2022, 47, 19354–19364. [Google Scholar] [CrossRef]
  17. Kakoulaki, G.; Kougias, I.; Taylor, N.; Dolci, F.; Moya, J.; Jäger-Waldau, A. Green hydrogen in Europe—A regional assessment: Substituting existing production with electrolysis powered by renewables. Energy Convers. Manag. 2021, 228, 113649. [Google Scholar] [CrossRef]
  18. Bhandari, R. Green hydrogen production potential in West Africa—Case of Niger. Renew. Energy 2022, 196, 800–811. [Google Scholar] [CrossRef]
  19. Barhoumi, E.M.; Okonkwo, P.C.; Ben Belgacem, I.; Zghaibeh, M.; Tlili, I. Optimal sizing of photovoltaic systems based green hydrogen refueling stations case study Oman. Int. J. Hydrogen Energy 2022, 47, 31964–31973. [Google Scholar] [CrossRef]
  20. Hoelzen, J.; Silberhorn, D.; Zill, T.; Bensmann, B.; Hanke-Rauschenbach, R. Hydrogen-powered aviation and its reliance on green hydrogen infrastructure—Review and research gaps. Int. J. Hydrogen Energy 2022, 47, 3108–3130. [Google Scholar] [CrossRef]
  21. Longoria, G.; Lynch, M.; Curtis, J. Green hydrogen for heating and its impact on the power system. Int. J. Hydrogen Energy 2021, 46, 26725–26740. [Google Scholar] [CrossRef]
  22. Benalcazar, P.; Komorowska, A. Prospects of green hydrogen in Poland: A techno-economic analysis using a Monte Carlo approach. Int. J. Hydrogen Energy 2022, 47, 5779–5796. [Google Scholar] [CrossRef]
  23. Kuckshinrichs, W.; Koj, J.C. Levelized cost of energy from private and social perspectives: The case of improved alkaline water electrolysis. J. Clean. Prod. 2018, 203, 619–632. [Google Scholar] [CrossRef]
  24. Nasser, M.; Megahed, T.F.; Ookawara, S.; Hassan, H. Performance evaluation of PV panels/wind turbines hybrid system for green hydrogen generation and storage: Energy, exergy, economic, and enviroeconomic. Energy Convers. Manag. 2022, 267, 115870. [Google Scholar] [CrossRef]
  25. Salameh, T.; Sayed, E.T.; Abdelkareem, M.A.; Olabi, A.G.; Rezk, H. Optimal selection and management of hybrid renewable energy System: Neom city as a case study. Energy Convers. Manag. 2021, 244, 114434. [Google Scholar] [CrossRef]
  26. Rezk, H.; Sayed, E.T.; Al-Dhaifallah, M.; Obaid, M.; El-Sayed, A.H.M.; Abdelkareem, M.A.; Olabi, A.G. Fuel cell as an effective energy storage in reverse osmosis desalination plant powered by photovoltaic system. Energy 2019, 175, 423–433. [Google Scholar] [CrossRef] [Green Version]
  27. Lee, B.; Lee, H.; Cho, H.-S.; Cho, W.-C.; Kim, C.-H.; Lim, H. Projected economic outlook and scenario analysis for H2 production by alkaline water electrolysis on the basis of the unit electricity price, the learning rate, and the automation level. Sustain. Energy Fuels 2019, 3, 1799–1807. [Google Scholar] [CrossRef]
  28. Al-Badi, A.; Al Wahaibi, A.; Ahshan, R.; Malik, A. Techno-economic feasibility of a solar-wind-fuel cell energy system in Duqm, Oman. Energies 2022, 15, 5379. [Google Scholar] [CrossRef]
  29. Pal, P.; Mukherjee, V.; Kumar, P.; Makhatha, M.E. Viability analysis of Direct Current (DC) standalone hybrid Photovoltaic (PV)/Hydrogen Fuel Cell (HFC) energy system: A techno-economic approach. Mater. Today Proc. 2021, 39, 1807–1812. [Google Scholar] [CrossRef]
  30. Pal, P.; Mukherjee, V. Off-grid solar photovoltaic/hydrogen fuel cell system for renewable energy generation: An investigation based on techno-economic feasibility assessment for the application of end-user load demand in North-East India. Renew. Sustain. Energy Rev. 2021, 149, 111421. [Google Scholar] [CrossRef]
  31. Tiam Kapen, P.; Medjo Nouadje, B.A.; Chegnimonhan, V.; Tchuen, G.; Tchinda, R. Techno-economic feasibility of a PV/battery/fuel cell/electrolyzer/biogas hybrid system for energy and hydrogen production in the far north region of cameroon by using HOMER pro. Energy Strategy Rev. 2022, 44, 100988. [Google Scholar] [CrossRef]
  32. Han, J.; Feng, J.; Chen, P.; Liu, Y.; Peng, X. A review of key components of hydrogen recirculation subsystem for fuel cell vehicles. Energy Convers. Manag. X 2022, 15, 100265. [Google Scholar] [CrossRef]
  33. Venkatasatish, R.; Dhanamjayulu, C. Reinforcement learning based energy management systems and hydrogen refuelling stations for fuel cell electric vehicles: An overview. Int. J. Hydrogen Energy 2022, 47, 27646–27670. [Google Scholar] [CrossRef]
  34. Olabi, A.G.; Wilberforce, T.; Alanazi, A.; Vichare, P.; Sayed, E.T.; Maghrabie, H.M.; Elsaid, K.; Abdelkareem, M.A. Novel trends in proton exchange membrane fuel cells. Energies 2022, 15, 4949. [Google Scholar] [CrossRef]
  35. Rezk, H.; Ferahtia, S.; Sayed, E.T.; Abdelkareem, M.A.; Olabi, A.G. Robust parameter identification strategy of solid oxide fuel cells using bald eagle search optimization algorithm. Int. J. Energy Res. 2022, 46, 10535–10552. [Google Scholar] [CrossRef]
  36. Kumar, P.; Pal, N.; Sharma, H. Techno-economic analysis of solar photo-voltaic/diesel generator hybrid system using different energy storage technologies for isolated islands of India. J. Energy Storage 2021, 41, 102965. [Google Scholar] [CrossRef]
  37. Arif, M.S.B.; Mustafa, U.; Prabaharan, N.; Ayob, S.B.M.; Ahmad, J. Performance evaluation of a hybrid solar PV system with reduced emission designed for residential load in subtropical region. Energy Sources Part A Recovery Util. Environ. Eff. 2020, 1–23. [Google Scholar] [CrossRef]
  38. Rezk, H.; Kanagaraj, N.; Al-Dhaifallah, M. Design and sensitivity analysis of hybrid photovoltaic-fuel-cell-battery system to supply a small community at Saudi NEOM City. Sustainability 2020, 12, 3341. [Google Scholar] [CrossRef]
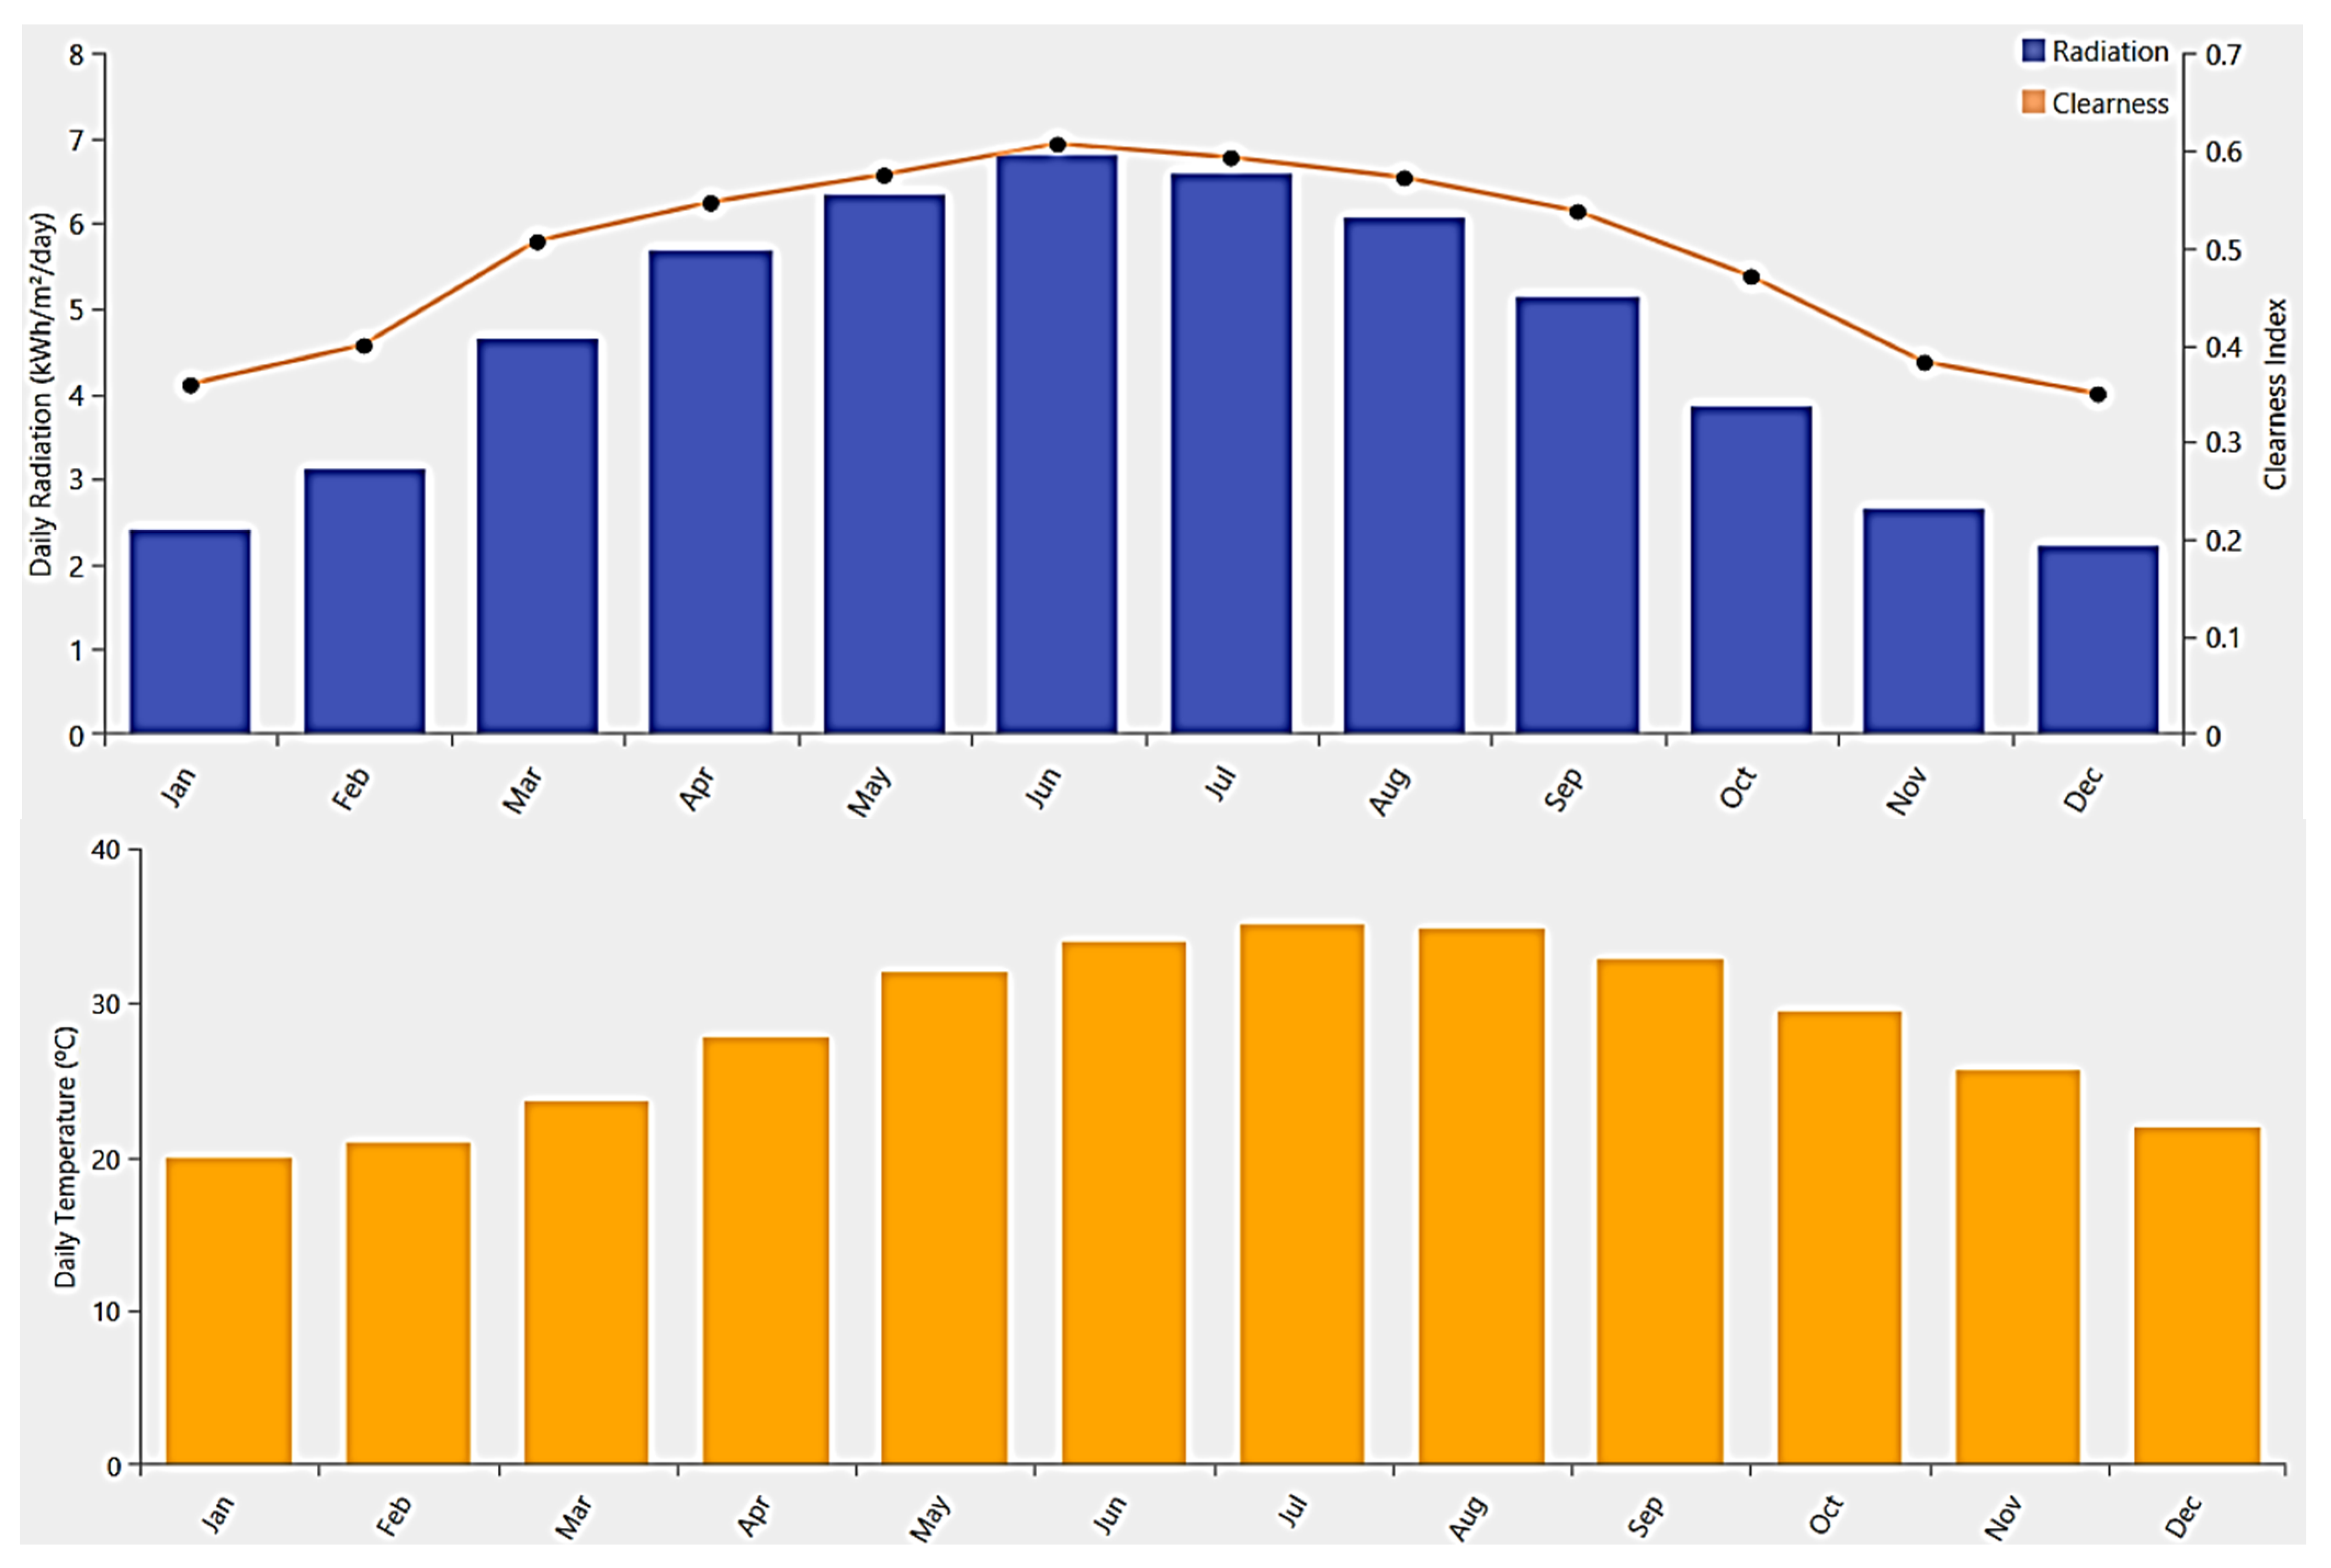
Figure 1. The metrological data for Sharjah city in UAE.
Energies 16 00769 g001
Figure 2. (a) the hourly load profile of the building (b) the commercial office building in Sharjah Emirate.
Energies 16 00769 g002
Figure 3. The schematic of a hybrid hydrogen energy system based on Solar PV-DG-FC-BES.
Energies 16 00769 g003
Figure 4. Monthly average electrical power supply from both hybrid systems for the office building in Sharjah city in UAE. (a) hybrid solar PV-DG-BES and (b) hybrid solar PV-DG-FC-BES systems.
Energies 16 00769 g004aEnergies 16 00769 g004b
Figure 5. Hourly electrical power supply for (a) PV−DG−BES, January, (b) PV−DG−BES, July, (c) PV−DG−FC−BES, January, (d) PV−DG−FC−BES, July, (e) PV−DG−FC−BES, March.
Energies 16 00769 g005aEnergies 16 00769 g005bEnergies 16 00769 g005c
Figure 6. (a) the level and mapping distribution of diesel fuel consumption for PV−DG-BES, (b) the level and mapping distribution of state of charge for PV−DG−BES, (c) the level and mapping distribution of diesel fuel consumption for PV−FC-DG−BES, (d) the level and mapping distribution of stored hydrogen fuel for PV−FC−DG−BES, (e) the level and mapping distribution of state of charge for PV−FC−DG−BES.
Energies 16 00769 g006aEnergies 16 00769 g006bEnergies 16 00769 g006c
Figure 7. Cash flow for both hybrid energy systems (a) PV−DG−BES (b) PV−DG−FC−BES.
Energies 16 00769 g007
Table 1. The components specification of hybrid energy system for green hydrogen production.
System
Component
System I (PV-DG-BES)System II (PV-FC-DG-BES)
Solar PV
-
Solar PV panels (Flat plate) with a range of 0–350 kW
-
PV panel operates at 47 °C
-
The power changes with temperature by −0.5%/°C
-
90% is the derating factor used
-
Fixed slope angle at the latitude of the site (25°) and facing south direction
-
Capital, replacement and operation, and maintenance cost are USD1400/kW, USD1400/kW, and USD10/year, respectively
-
Total PV lifetime is 25 years
DG
-
GGen50 with a capacity of 40 kW
-
Fuel type is a diesel with the following properties:
-
Density: 880 kg/m3, Calorific value based on water vapor: 38.5 MJ/kg, specific consumption of fuel: 0.286 L/h/kW, and minimal load ratio: 25%
-
Capital, replacement and operation, and maintenance cost are USD1400/kW, USD1400/kW, and USD10/year, respectively
-
Total diesel generator life: 15,000 h
Fuel cell,
Electrolyzer and
Hydrogen tank
-
Proton Exchange Membrane Fuel Cell IELiftModel 804 4.0 kW
-
Self-Contained Power Unit with a range 0–150 kW.
-
Fuel consumption Less than 70 g/kWh
-
Operating ambient temperature range 5 °C to 40 °C
-
Rated net power 4.0 kW @ 48 V or 2.88 kW @ 24 V
-
Rated current 83 A @ 48 V or 120 A @ 24 V
-
Startup Time Less than 10 s
-
Weight ~20 kg
-
Max dimensions 450 mm (W) × 300 mm (H) × 550 mm (D)
-
Electrolyzer with a capacity with a range 0–80 KW
-
Hydrogen tank with a maximum capacity of 75 Kg
Battery
-
Generic lead acid
-
Roundtrips efficiency 80%
-
Nominal voltage: 12 V
-
Charge and maximal discharge current: 16.7 A and 24.33 A
-
Nominal capacity of each battery is 1 kWh.
-
Throughput lifetime: 800 kWh
-
Capital, replacement, operation, and maintenance costs are USD 150/battery, USD 150/battery, and USD 10/year, respectively
-
Lifetime: 10 years
-
Weight: 11.5 kg of each
Converter
-
Generic 105 kW
-
Convert direct current (DC) to alternating current (AC) and via versa as a rectifier.
-
Capital, replacement, operation, and maintenance cost are USD300/kW, USD300/Kw, and USD5/year, respectively
Table 2. Pollution from both PV-DG-BES and PV-DG-FC-BES hybrid energy system.
PollutantBasic Hybrid SystemHydrogen Hybrid System
CO2 “Carbon Dioxide” (kg/yr.)54,29311,864
CO “Carbon Monoxide” (kg/yr.)33990.5
Unburned HC “Hydrocarbons” (kg/yr.)14.95.07
Particulate Matter (kg/yr.)2.031.67
SO2 “Sulphur Dioxide” (kg/yr.)13329.1
NOx “Nitrogen Oxides” (kg/yr.)319215
Disclaimer/Publisher’s Note: The statements, opinions and data contained in all publications are solely those of the individual author(s) and contributor(s) and not of MDPI and/or the editor(s). MDPI and/or the editor(s) disclaim responsibility for any injury to people or property resulting from any ideas, methods, instructions or products referred to in the content.