Article

A Method of Vibration Measurement with the Triboelectric Sensor during Geo-Energy Drilling

1
State Key Laboratory of Coal Mine Disaster Dynamics and Control, Chongqing University, Chongqing 400044, China
2
Powerchina Hubei Electric Engineering Co., Ltd., Wuhan 430040, China
3
Faculty of Mechanical and Electronic Information, China University of Geosciences, Wuhan 430074, China
*
Author to whom correspondence should be addressed.
Energies 2023, 16(2), 770; https://doi.org/10.3390/en16020770
Submission received: 14 November 2022 / Revised: 31 December 2022 / Accepted: 4 January 2023 / Published: 9 January 2023

Abstract

:
In the process of geo-energy drilling, the real-time vibration measurement of drill pipes is of significance for an understanding of the downhole conditions and the properties of rock. However, the vibration sensors used in downhole areas at present require additional power sources, such as batteries, and replacing the batteries would significantly reduce production efficiency and increase costs. In our work, a new vibration measurement method using a triboelectric nanogenerator is proposed which will synchronously achieve axial and lateral vibration, and also simultaneously be self-powered. The triboelectric nanogenerator is mainly made of nanomaterials, such as polyimide film and polytetrafluoroethylene (PTFE), and depends on the pulse signal generated by the contact of the two friction layers to measure the vibration frequency. Axial vibration tests show that the output voltage signal amplitude is approximately 3 V, the measurement range is from 0 to 9 Hz, the measurement error is less than 4%, and the maximum output power is 5.63 uW. Additionally, the lateral vibration tests show that the output voltage signal amplitude is approximately 2.5 V, the measurement range is from 0 to 6.8 Hz, the measurement error is less than 6%, and the maximum output power is 4.01 uW. The nanogenerator can typically work in an environment where the temperature is less than 145 °C and the relative humidity is less than 90%.

1. Introduction

The vibration of the drill pipes in the geo-energy drilling process may damage the downhole drilling tool, decrease the drilling efficiency, and even cause a downhole accident if the vibration is too strong [1]. Researchers have achieved results worldwide regarding the vibration measurement of drill pipes. For example, a three-axis accelerometer can measure the vibration frequency of a blow-out preventer (BOP) stack [2]. A designed joint can measure the levels of axial and torsional vibration [3]. Additionally, a wire telemetry system composed of accelerometers can measure the force, vibration, and formation parameters [4]. A measure-while-drilling (MWD) sensor can be used to measure axial, tangential, and radial acceleration changes [5,6]. A gyro can measure the angular velocity and obtain the vibration frequency by analyzing the output data [7]. Furthermore, sensors’ response elaboration can be combined with machine learning to improve responses [8].
There are many vibration measurement methods for drill pipes, such as surface measurement [9] and downhole measurement [10]. Due to the severe attenuation effect when the vibration propagates in the drill string, it is difficult to obtain the actual motion state of the downhole drill string by surface measurement, so the downhole measurement is mainly used at present. However, neither of the two vibration measurement methods has the function of self-powered supply, a deficiency which seriously affects the drilling efficiency. Self-powered sensors do not require an external power source, saving a small amount of downhole space. In addition, self-powered sensors eliminate the need for periodic power source replacements, improving drilling efficiency. Therefore, self-powered sensors are undoubtedly more suitable for the work requirements of deep drilling. Because of their excellent characteristics, nanomaterials are widely used in various fields, such as machining [11,12,13], aerospace [14,15], photovoltaic energy [16] and so on.
The triboelectric nanogenerator was proposed in 2012 [17], and has been widely used in the fields of energy harvesting and sensors (Figure 1). For example, in the field of sensors, triboelectric nanogenerators have been widely used in gesture monitoring [18,19], pressure monitoring [20,21], acceleration monitoring [22,23,24], speed monitoring [25,26], rotation monitoring [27,28,29], health monitoring [30,31], sports monitoring [32,33,34], etc. In the field of energy harvesting, triboelectric nanogenerators have been widely used to harvest ocean energy [35,36], wind energy [37,38,39], vibration energy [40,41,42], rotational energy [43,44], rain energy [45,46,47], biomechanical energy [48,49,50], etc. Therefore, the triboelectric nanogenerator is very suitable for developing self-powered sensors. In this work, a new vibration measurement sensor is designed on the basis of a triboelectric nanogenerator. Subsequently, the sensor is installed in the existing downhole instrument, so that the axial and transverse vibration can be measured simultaneously.

2. Manufacturing and Working Principle

2.1. Composition and Manufacturing

As shown in Figure 2a,b, the sensor, with a size of φ150 × 30 mm (φ is the outer diameter), is mainly composed of a pedestal, a weight block and three springs, in which the friction layers adhere to the weight block and the pedestal. The pedestal and weight block are 3D-printed using the polylactic acid (PLA) material, with a printing temperature of 210 Celsius, printing layer thickness of 0.2 mm, and printing structure duty cycle of 80%. The electrode layer of the weight block, both in the axial direction (the x axis direction in Figure 2a) and lateral direction (the yz plane in Figure 2a), is made of Cu (copper) with a thickness of 0.05 mm, and a PTFE (polytetrafluoroethylene) layer with a thickness of 0.03 mm is pasted onto its surface as the friction layer. The buffer layer of the pedestal, both axial direction and lateral direction, are all made of polyimide film (PY11YG, Lingmei Co., Ltd., Dongguan, China) with a thickness of 0.1 mm, and a Cu layer with a thickness of 0.05 mm is pasted onto its surface as the electrode layer and friction layer. The function of the buffer layer is to convert the hard friction between the two friction layers into soft friction, thereby expanding the contact area of the two friction layers. Since the contact area between the two friction layers is proportional to the power generated by contact friction [21], the buffer layer increases the output signal amplitude and the service life of the sensor. In addition, the sensor size is compatible with existing bits and drill pipes sizes to ensure adequate installation space.

2.2. Working Principle

As shown in Figure 2a,b, the weight block and the pedestal generate the same contact frequency as the vibration frequency when the axial vibration (or lateral direction vibration) is being measured. Due to the presence of the friction layer on the weight block and the pedestal, a regular charge transfer will occur when two friction layers are in contact and separated, and so the vibration frequency of the axial direction (or lateral direction) can be obtained by analyzing the rule of charge. A further explanation of the working principle for the sensor measuring the axial vibration is shown in Figure 2c; the friction layer of the weight block is named the upper friction layer, while the friction layer of the pedestal is named the lower friction layer for the convenience of introduction. The principle of measuring the lateral vibration is the same as that of determining the axial vibration, and so we do not repeat it.
Figure 2(ci) shows the initial state. Because there is no contact between the upper and the lower friction layer, there is no electric charge generated, and the open circuit voltage is 0. As shown in Figure 2(cii), the upper and lower friction layer contact each other due to the inertial force when the axial vibration occurs. Because Cu is more likely to lose electrons than PTFE [22], the lower friction layer is positively charged, while the upper friction layer is negatively charged, and the open circuit voltage remains at 0 V. As shown in Figure 2(ciii), the two friction layers will gradually separate from each other due to the restoring force of the spring, which causes the open circuit voltage to gradually increase. As shown in Figure 2(civ), the separation distance between the two friction layers reaches the maximum value, and the open circuit voltage also increases to the maximum value. As shown in Figure 2(cv), the two friction layers become close again due to the inertial force when a new axial vibration begins, which causes the open circuit voltage to gradually decrease to 0. The theoretical output voltage signal of the above steps is shown in Figure 2d. Every time the above process is repeated, a voltage pulse signal will be generated, so we take the voltage pulse signal as the basis for detection.
The sensor is designed based on the triboelectric nanogenerator of vertical contact type, and so the theoretical output of open-circuit voltage Voc and short-circuit ISC can be expressed by the following formula [51].
V o c = σ x ( t ) ε 0
I s c = S σ d 0 d 0 + x t 2 d x d t
where σ is the charge density, ε0 is the vacuum permittivity, x(t) is the separation distance between the two contact materials, S is the area of friction contact, d0 is effective thickness constant of two friction contact materials.

3. Tests

The tests are divided into three parts. The first part consists of the measurement function tests, which are mainly used to verify the performance of the sensor in measuring vibration. The second consists of the power generation function tests, which are mainly used to measure the power generation performance of the sensor. The last consists of the environmental tests, which are mainly used to test the characteristics and reliability of the sensor in different environments.

3.1. Test Devices

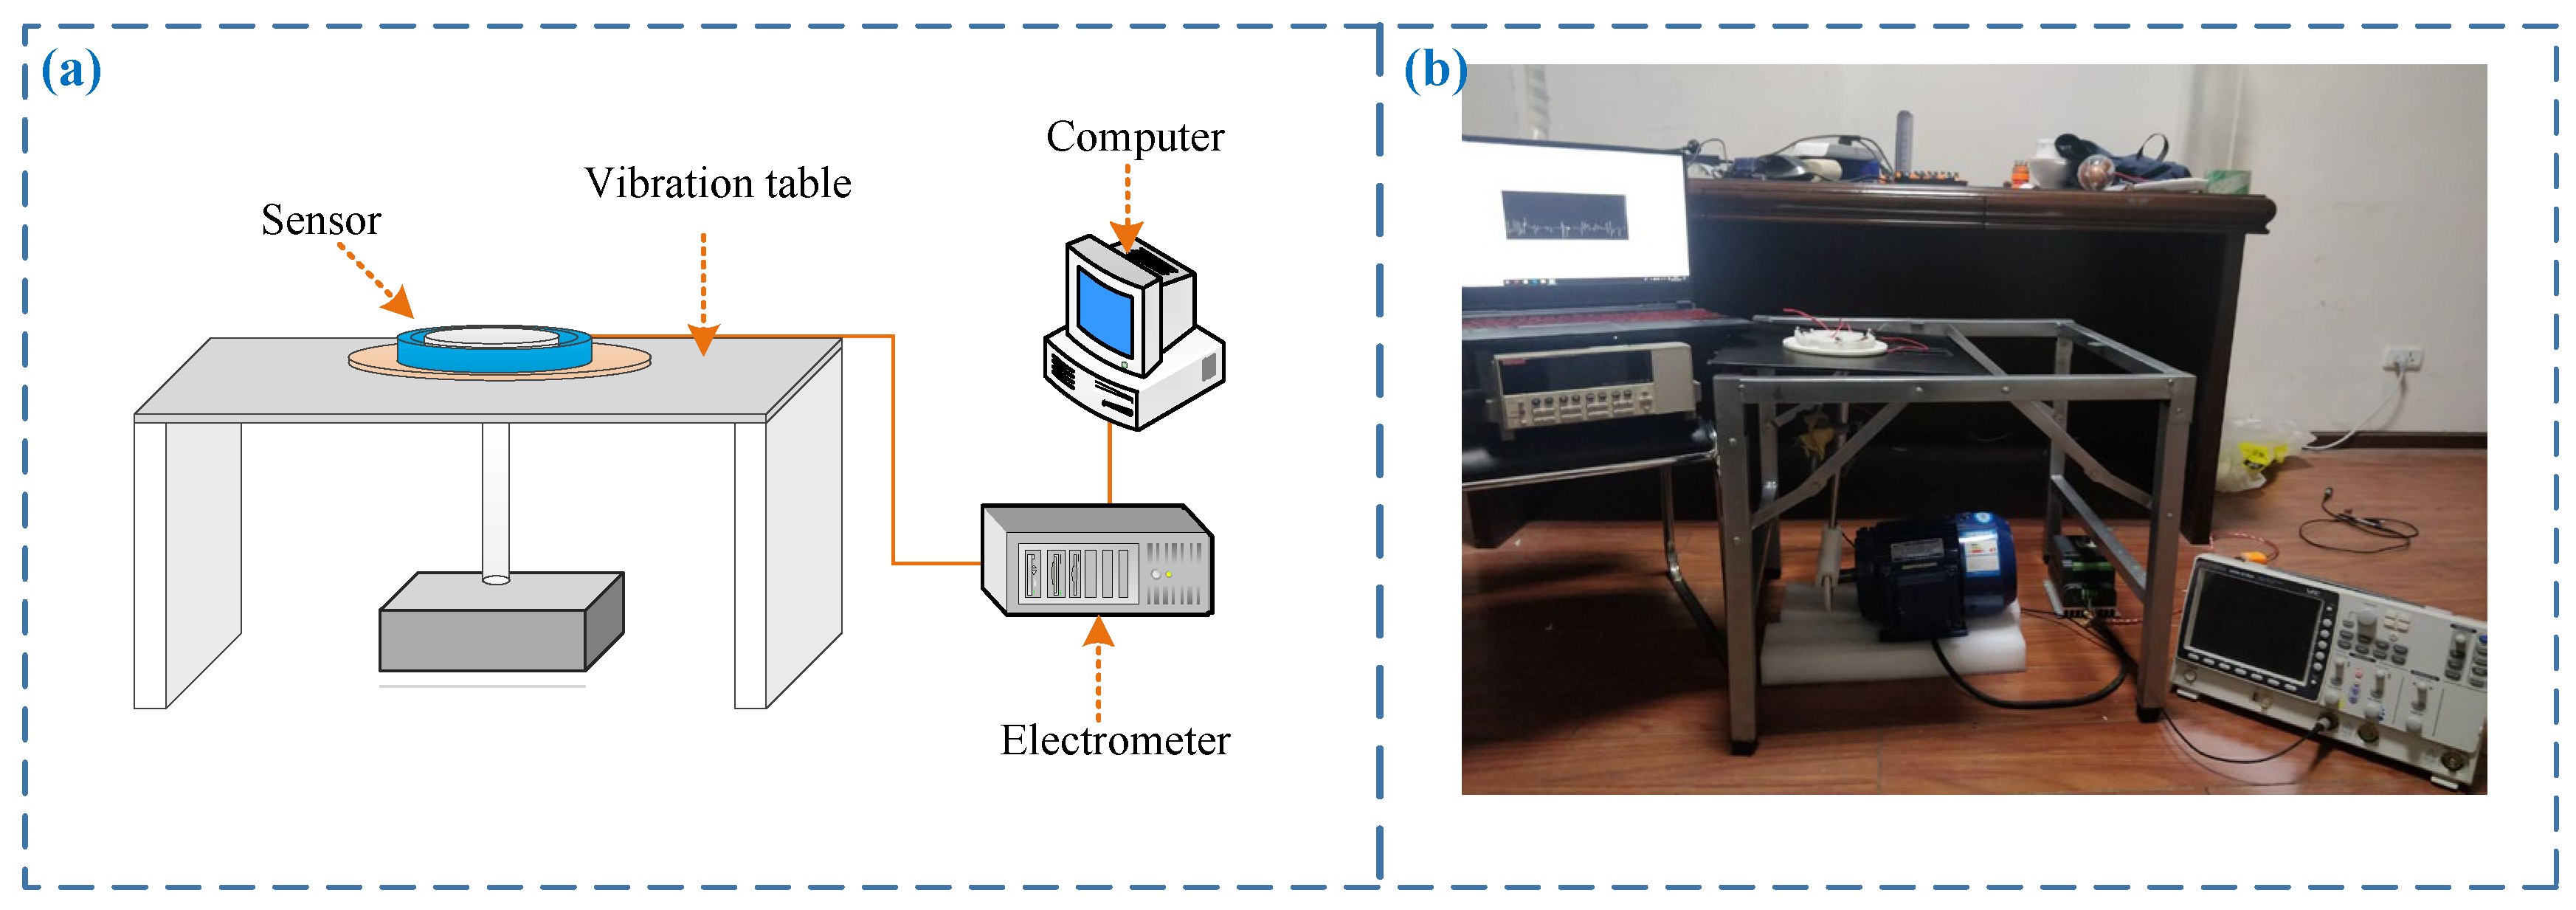
As shown in Figure 3, the test devices are composed of a vibration table, an electrometer, and a computer. The sensor is fixed on a vibration table, where the vibration table is composed of a motor, a crank and a connecting rod mechanism. The vibration table can provide a maximum vibration frequency of 900 Hz by adjusting the motor output speed. The longitudinal or transverse vibration can be measured by changing the installation position of the sensor. The output signal of the sensor is detected by the electrometer (6514, Keithley Co., Ltd., Cleveland, OH, USA) and then input to the computer, and the test results are further displayed through the software in the computer.

3.2. Measurement Function Tests

When vibration occurs, the weight block of the sensor and the base will continuously come into contact and then separate, and a voltage pulse signal will be generated during every two periods of contact between the two. Therefore, the vibration frequency can be judged by the voltage pulse signal frequency of the sensor. We tested the measurement performance of the sensor, and the results are shown in Figure 4. As shown in Figure 4a,b, the sensor can output voltage pulse signals when measuring axial vibration and lateral vibration, and the number of pulses corresponds to the vibration frequency. However, the sensor outputs a small positive pulse signal after the negative pulse signal, which is different from the theoretical waveform shown in Figure 2d. The reason is that, in theory, the weight block should directly return to the initial state, and there is no positive pulse signal in this case. However, a small damping motion near the initial state is made, thus generating a small positive pulse. Furthermore, during the measurement process, due to factors such as weight block not rebounding in time under the action of inertia, measurement errors will also occur. As shown in Figure 4c, when the axial and the lateral vibration frequencies are from 0 to 9 Hz and 0 to 6.8 Hz, respectively, the output voltages of the sensor are about 3 V and 2.5 V, respectively, and the measured value of the sensor is garbled when the frequency exceeds the above range. As such, the measurement ranges of axial and lateral vibration are from 0 to 9 Hz and 0 to 6.8 Hz, respectively. During the measurement error tests of the sensor, 10 groups of data are measured at each vibration frequency, and the measurement error is defined as the ratio of the measurement difference to the standard value. The mean values of the error are taken as the starting points of the error rod, the standard deviations are taken as the lengths of the error rods, and the measurement results are shown in Figure 4d. As shown in Figure 4d, the measurement errors of the sensor are scattered and irregular at different frequencies. Therefore, the maximum value is taken as the measurement error of the sensor, that is, the maximum measurement errors in axial vibrations and lateral vibrations are less than 4% and 6%, respectively.

3.3. Power Generation Function Tests

Furthermore, we tested the power generation performance of the sensor. First, when the external load was 10 ohms, we tested the current of the sensor at different vibration frequencies, and the results are shown in Figure 5a. It can be seen from Figure 5a that the output current during axial and lateral vibration is basically proportional to the vibration frequency. The reason for this may be that the faster the vibration is, the greater the number of collisions per unit time there are, a situation which leads to an increase in the amount of charge transferred per unit time. Therefore, the output current increases. Then, we tested the power generation performance of the sensor in cases of an axial vibration of 9 Hz and a horizontal vibration of 5.5 Hz, respectively. The results were shown in Figure 5b,c. It can be seen that, as the load increases, the load voltage gradually increases, and the load current gradually decreases. When the load is less than 104 ohm or more than 108 ohms, this change trend is relatively smooth. When the load is between 104 and 108 ohms, this change trend is more drastic. When the load is 105 ohms, both the axial vibration and horizontal vibration reach the maximum load power. The maximum load power of the axial vibration is 5.63 µW, and the maximum load of the horizontal vibration is 4.01 µW. In addition, we also measured the output power under different vibration frequencies. It can be seen from Figure 5d that the output power increases with the increase in vibration frequency when there is a 105 ohm resistance in series. This may be the increase in the output current per unit time due to the increase in vibration frequency, resulting in an increase in the output power calculated by our measurement system.

3.4. Environmental Tests

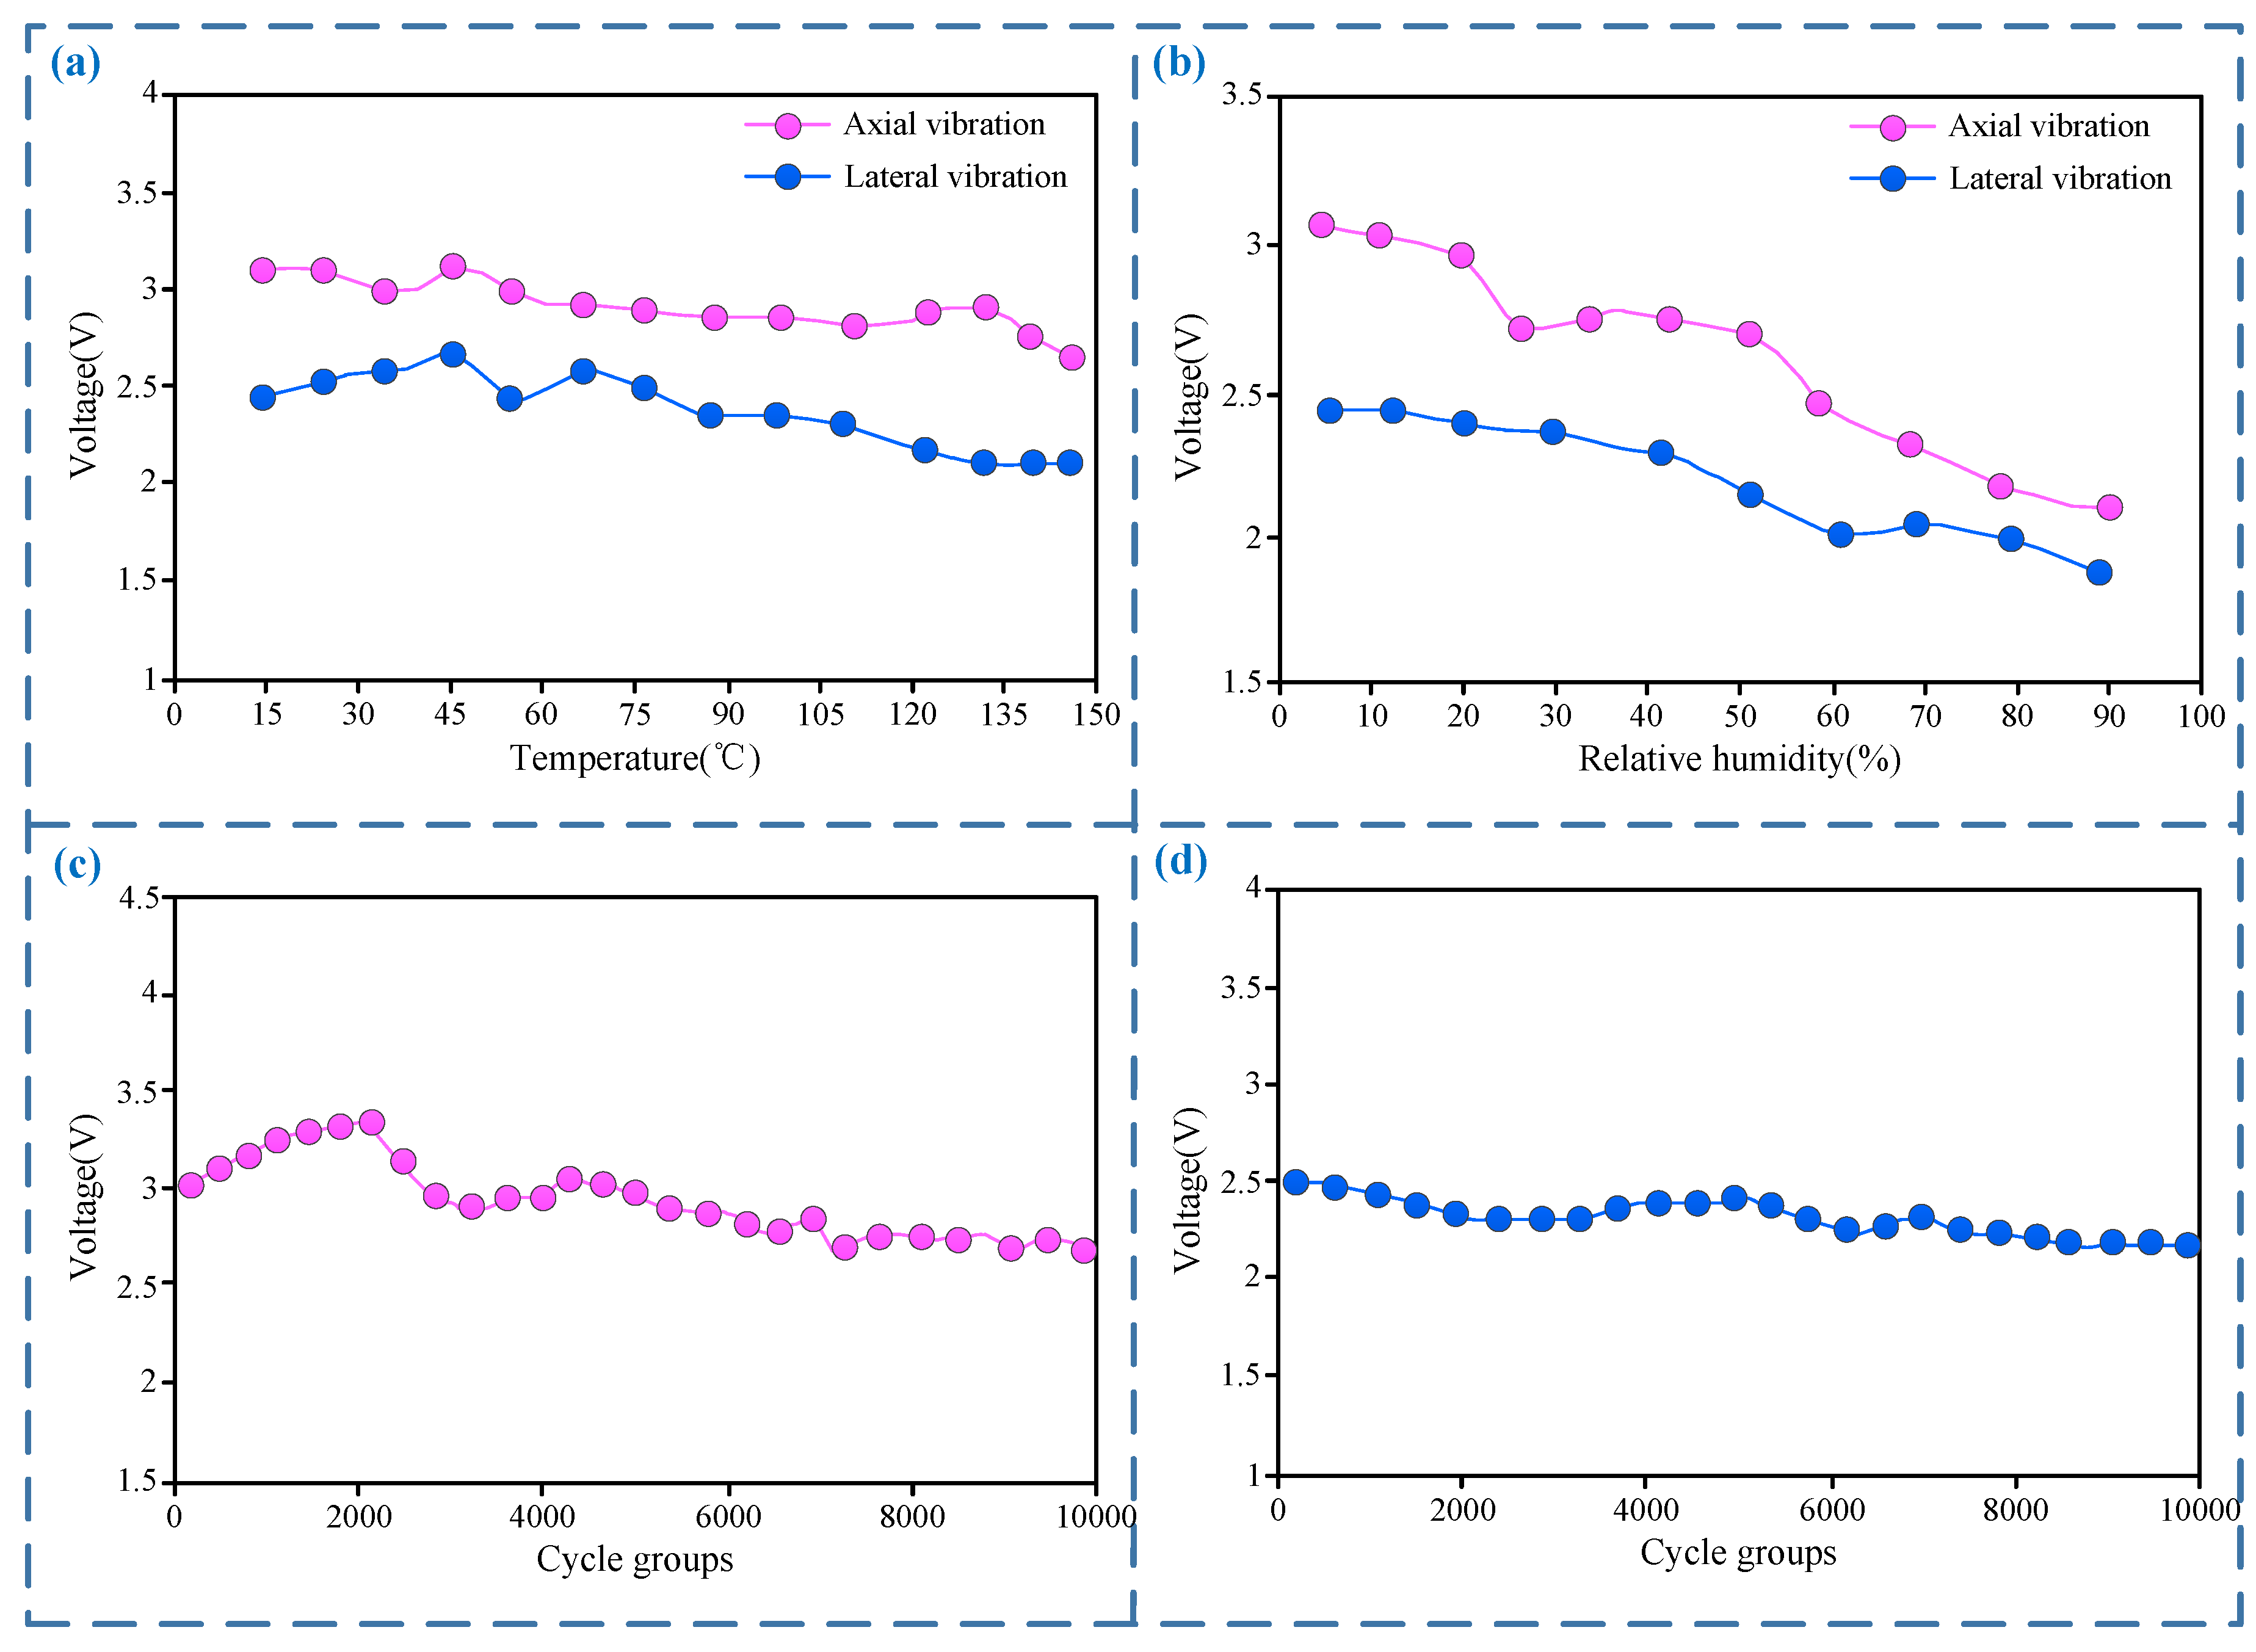
The environment affects the output of a sensor, and so we conducted environmental tests; the results are shown in Figure 6. Since the temperature of coal methane drilling is generally not higher than 120°, we tested the output voltage of the sensor in a range below 145 °C. From the results in Figure 6a, it can be seen that the output voltage for measuring axial and lateral vibrations decreases with the increase in temperature, but the signal attenuation is not obvious. Therefore, the sensor can still work normally in a temperature range below 145 °C as the decreased voltage amplitude still has a higher signal-to-noise ratio. In addition, the output lag of the sensor occurs when the temperature change is large and rapid, but the sensor output is not affected in actual drilling because the downhole temperature changes very slowly. As shown in Figure 6b, we tested the output voltage of the sensor at different relative humidities. The output voltage will drop by approximately 22% when the environmental relative humidity increases to 90%. Although the reduced voltage amplitude still has a high signal-to-noise ratio, moisture-proof measures are also necessary in order to ensure the optimal performance of the sensor. Furthermore, we tested the output voltage of the sensor at different cycle groups. From the results shown in Figure 6c,d, it can be seen that the output voltage exhibits a slight decrease as the number of cycle groups increases, but the amplitude after the decrease is still higher, which indicates that the sensor has high reliability.

4. Conclusions and Discussions

A new vibration measurement method is presented which can measure the axial and lateral vibration of drill pipes in a self-powered model, using a triboelectric nanogenerator for geo-energy drilling. The axial vibration tests show that the output voltage signal amplitude is approximately 3 V, the measurement range is from 0 to 9 Hz, the measurement error is less than 4%. When the load is 0.1 M ohms and the vibration frequency is 9 Hz, the maximum output power is 5.63 µW. Meanwhile, the lateral vibration tests show that the output voltage signal amplitude is approximately 2.5 V, the measurement range is 0 to 6.8 Hz, and the measurement error is less than 6%. When the load is 0.1 M ohms and the vibration frequency is 5.5 Hz, the maximum output power is 4.01 µW. In addition, the sensor can work normally and with high reliability in an environment where the temperature is less than 145 °C and the relative humidity is less than 90%.
Compared with the traditional downhole vibration sensor, the sensor has the following advantages. Firstly, the sensor requires no external power, which will be it more suitable for use in downhole working environments. Secondly, the sensor can measure not only axial vibration, but also lateral vibration, which makes the sensor richer in functions. Thirdly, if multiple sensors are connected in series and the output power is stored for a certain period of time, it is possible to use this to supply power for other downhole low-power instruments in real time.
However, there are still some limitations that need to be improved. Firstly, the lateral vibration of the drill pipes includes general lateral vibration and torsional vibration if strictly divided. Due to the limitations of the structure, the sensor cannot make such a fine distinction between the two vibrations at this stage. Thus, the question how to distinguish between the two vibrations is a key point to be considered in future study. Secondly, the power generated by the sensor is very small, and remains is far from the real-time power supply required for other downhole instruments. Thus, the issue of how to increase the power generation, which must be assessed by comprehensively considering the sensor structure, the selection and preparation of nanomaterials, and the surface characteristics of the materials, is another key point to be investigated in our future work.

Author Contributions

R.L. wrote parts of the manuscript, researched the related literature. H.H. designed the sensor and performed parts of tests. C.W. wrote parts of the manuscript and performed parts of tests. All authors have read and agreed to the published version of the manuscript.

Funding

This work was supported by Guizhou Province Science and Technology Support Program (2022-245); National Natural Science Foundation of China (52204125); Chongqing Natural Science Foundation (CSTB2022NSCQ-MSX1338); Guangdong Basic and Applied Basic Research Foundation (2022A1515010467); Geological Scientific Research Project of Guizhou Provincial Bureau of Geology and Mineral Exploration and Development (2021-25).

Data Availability Statement

Not applicable.

Conflicts of Interest

The authors declare no conflict of interest.

References

  1. Kapitaniak, M.; Hamaneh, V.V.; Chávez, J.P.; Nandakumar, K.; Wiercigroch, M. Unveiling complexity of drill–string vibrations: Experiments and modelling. Int. J. Mech. Sci. 2015, 101, 324–337. [Google Scholar] [CrossRef]
  2. Kim, Y.Y.; Simons, L.H. Drilling Vibration Measurements on a BOP Stack. In Proceedings of the Offshore Technology Conference, Houston, TX, USA, 2–5 May 1976; Volume 1. [Google Scholar] [CrossRef]
  3. Deily, F.H.; Dareing, D.W.; Patt, G.H. Downhole Measurement of Drill pipes Forces and Motions. J. Eng. Ind. 1968, 90, 217–255. [Google Scholar] [CrossRef]
  4. Wolf, S.F.; Zacksenhouse, M.; Arian, A. Field Measurements of Downhole Drillstring Vibrations; Society of Petroleum Engineers: Richardson, TX, USA, 1985; Volume 1. [Google Scholar] [CrossRef]
  5. Zannoni, S.A.; Cheatham, C.A.; Chen, C.K.; Golla, C.A. Development and Field Testing of a New Downhole MWD Drillstring Dynamics Sensor. In Proceedings of the SPE Annual Technical Conference and Exhibition, Las Vegas, NV, USA, 22–26 September 1985; Society of Petroleum Engineers: Richardson, TX, USA, 1993. [Google Scholar] [CrossRef]
  6. Schen, A.E.; Snell, A.D.; Stanes, B.H. Optimization of Bit Drilling Performance Using a New Small Vibration Logging Tool. In Proceedings of the SPE/IADC Drilling Conference, SPE/IADC 92336, Amsterdam, The Netherlands, 23–25 February 2005. [Google Scholar]
  7. Lines, L.A.; Mauldin, C.L.; Hill, J.W.; Aiello, R.A. Advanced Drilling Dynamics Sensor Allows Real-Time Drilling Optimization, Damage Prevention and Condition Monitoring of RSS and LWD BHAs. In Proceedings of the SPE Annual Technical Conference and Exhibition, Amsterdam, The Netherlands, 27–29 October 2014; Society of Petroleum Engineers: Richardson, TX, USA, 2014; Volume 10. [Google Scholar] [CrossRef]
  8. Millan, E.; Ringer, M.; Boualleg, R.; Li, D. Real-Time Drillstring Vibration Characterization Using Machine Learning. In Proceedings of the SPE/IADC International Drilling Conference and Exhibition, The Hague, The Netherlands, 5–7 March 2019; Society of Petroleum Engineers: Richardson, TX, USA, 2019; Volume 3. [Google Scholar] [CrossRef]
  9. Baumgartner, T.; van Oort, E. Pure and coupled drill string vibration pattern recognition in high frequency downhole data. In Proceedings of the SPE Annual Technical Conference and Exhibition, Amsterdam, The Netherlands, 27–29 October 2014; OnePetro: Richardson, TX, USA, 2014. [Google Scholar]
  10. Li, Y.; Wang, J.; Shan, Y.; Wang, C.; Hu, Y. Measurement and Analysis of Downhole Drill String Vibration Signal. Appl. Sci. 2021, 11, 11484. [Google Scholar] [CrossRef]
  11. Zhang, Z.; Sui, M.; Li, C.; Zhou, Z.; Liu, B.; Chen, Y.; Said, Z.; Debnath, S.; Sharma, S. Residual stress of grinding cemented carbide using MoS2 nano-lubricant. The International J. Adv. Manuf. Technol. 2022, 119, 5671–5685. [Google Scholar] [CrossRef]
  12. Zhang, Y.; Li, H.N.; Li, C.; Huang, C.; Ali, H.M.; Xu, X.; Mao, C.; Ding, W.; Cui, X.; Yang, M.; et al. Nano-enhanced biolubricant in sustainable manufacturing: From processability to mechanisms. Friction 2022, 10, 1–39. [Google Scholar] [CrossRef]
  13. Jia, D.; Li, C.; Zhang, Y.; Yang, M.; Zhang, X.; Li, R.; Ji, H. Experimental evaluation of surface topographies of NMQL grinding ZrO2 ceramics combining multiangle ultrasonic vibration. Int. J. Adv. Manuf. Technol. 2019, 100, 457–473. [Google Scholar] [CrossRef]
  14. Cui, X.; Li, C.; Ding, W.; Chen, Y.; Mao, C.; Xu, X.; Liu, B.; Wang, D.; Li, H.; Zhang, Y.; et al. Minimum quantity lubrication machining of aeronautical materials using carbon group nanolubricant: From mechanisms to application. Chin. J. Aeronaut. 2021, 35, 85–112. [Google Scholar] [CrossRef]
  15. Xu, W.; Li, C.H.; Zhang, Y.; Ali, H.M.; Sharma, S.; Li, R.; Yang, M.; Gao, T.; Liu, M.; Wang, X.; et al. Electrostatic atomization minimum quantity lubrication machining: From mechanism to application. Int. J. Extrem. Manuf. 2022, 4, 042003. [Google Scholar] [CrossRef]
  16. Ejaz, A.; Babar, H.; Ali, H.M.; Jamil, M.M.J.; Fattah, I.M.R.; Said, Z.; Li, C. Concentrated photovoltaics as light harvesters: Outlook, recent progress, and challenges. Sustain. Energy Technol. Assess. 2021, 46, 101199. [Google Scholar] [CrossRef]
  17. Fan, F.R.; Tian, Z.Q.; Wang, Z.L. Flexible triboelectric nanogenerator. Nano Energy 2012, 1, 328–334. [Google Scholar] [CrossRef]
  18. Qin, K.; Chen, C.; Pu, X.; Tang, Q.; He, W.; Liu, Y.; Zeng, Q.; Liu, G.; Guo, H.; Hu, C. Magnetic array assisted triboelectric nanogenerator sensor for real-time gesture interaction. Nano-Micro Lett. 2021, 13, 51. [Google Scholar] [CrossRef]
  19. Guo, Y.; Zhang, X.S.; Wang, Y.; Gong, W.; Zhang, Q.; Wang, H.; Brugger, J. All-fiber hybrid piezoelectric-enhanced triboelectric nanogenerator for wearable gesture monitoring. Nano Energy 2018, 48, 152–160. [Google Scholar] [CrossRef]
  20. Vivekananthan, V.; Chandrasekhar, A.; Alluri, N.R.; Purusothaman, Y.; Kim, S. A highly reliable, impervious and sustainable triboelectric nanogenerator as a zero-power consuming active pressure sensor. Nanoscale Adv. 2020, 2, 746–754. [Google Scholar] [CrossRef]
  21. Xia, S.Y.; Long, Y.; Huang, Z.; Zi, Y.; Tao, L.; Li, C.; Sun, H.; Li, J. Laser-induced graphene (LIG)-based pressure sensor and triboelectric nanogenerator towards high-performance self-powered measurement-control combined system. Nano Energy 2022, 96, 107099. [Google Scholar] [CrossRef]
  22. Zhang, B.; Wu, Z.; Lin, Z.; Guo, H.; Chun, F.; Yang, W.; Wang, Z. All-in-one 3D acceleration sensor based on coded liquid–metal triboelectric nanogenerator for vehicle restraint system. Mater. Today 2021, 43, 37–44. [Google Scholar] [CrossRef]
  23. Liu, C.; Wang, Y.; Zhang, N.; Yang, X.; Wang, Z.; Zhao, L.; Yang, W.; Dong, L.; Che, L.; Wang, G. A self-powered and high sensitivity acceleration sensor with VQa model based on triboelectric nanogenerators (TENGs). Nano Energy 2020, 67, 104228. [Google Scholar] [CrossRef]
  24. Liu, C.; Fang, L.; Zou, H.; Wang, Y.; Chi, J.; Che, L.; Zhou, X.; Wang, Z.; Wang, T.; Dong, L. Theoretical investigation and experimental verification of the self-powered acceleration sensor based on triboelectric nanogenerators (TENGs). Extrem. Mech. Lett. 2021, 42, 101021. [Google Scholar] [CrossRef]
  25. Wang, J.; Ding, W.; Pan, L.; Wu, C.; Yu, H.; Yang, L.; Liao, R.; Wang, Z. Self-powered wind sensor system for detecting wind speed and direction based on a triboelectric nanogenerator. ACS Nano 2018, 12, 3954–3963. [Google Scholar] [CrossRef]
  26. Kim, D.; Tcho, I.W.; Choi, Y.K. Triboelectric nanogenerator based on rolling motion of beads for harvesting wind energy as active wind speed sensor. Nano Energy 2018, 52, 256–263. [Google Scholar] [CrossRef]
  27. Zhou, Q.; Huang, H.; Wu, C.; Wen, G.; Liu, B. A self-powered sensor for drill pipes capable of monitoring rotation speed and direction based on triboelectric nanogenerator. Rev. Sci. Instrum. 2021, 92, 055006. [Google Scholar] [CrossRef]
  28. Jin, L.; Zhang, S.L.; Xu, S.; Yang, W.; Wang, Z. Free-fixed rotational triboelectric nanogenerator for self-powered real-time wheel monitoring. Adv. Mater. Technol. 2021, 6, 2000918. [Google Scholar] [CrossRef]
  29. Lee, Y.; Kang, S.G.; Jeong, J. A self-powered absolute shaft encoder based on triboelectric nanogenerator. Nano Energy 2022, 98, 107230. [Google Scholar] [CrossRef]
  30. Yi, F.; Zhang, Z.; Kang, Z.; Liao, Q.; Zhang, Y. Recent advances in triboelectric nanogenerator-based health monitoring. Adv. Funct. Mater. 2019, 29, 1808849. [Google Scholar] [CrossRef]
  31. Wang, S.; Tai, H.; Liu, B.; Duan, Z.; Yuan, Z.; Pan, H.; Su, Y.; Xie, G.; Du, X.; Jiang, Y. A facile respiration-driven triboelectric nanogenerator for multifunctional respiratory monitoring. Nano Energy 2019, 58, 312–321. [Google Scholar] [CrossRef]
  32. Zhang, J.; Wu, C.; Zhou, Q. Bolt-Shaped Triboelectric Nanogenerator for Rock-Climbing Training Trajectory Detection. IEEE Sens. J. 2020, 21, 2693–2701. [Google Scholar] [CrossRef]
  33. Luo, J.; Gao, W.; Wang, Z.L. The Triboelectric Nanogenerator as an Innovative Technology toward Intelligent Sports. Adv. Mater. 2021, 33, 2004178. [Google Scholar] [CrossRef]
  34. Luo, J.; Wang, Z.; Xu, L.; Wang, A.C.; Han, K.; Jiang, T.; Lai, Q.; Bai, Y.; Tang, W.; Fan, F.R.; et al. Flexible and durable wood-based triboelectric nanogenerators for self-powered sensing in athletic big data analytics. Nat. Commun. 2019, 10, 5147. [Google Scholar] [CrossRef] [Green Version]
  35. Wang, Z.L.; Jiang, T.; Xu, L. Toward the blue energy dream by triboelectric nanogenerator networks. Nano Energy 2017, 39, 9–23. [Google Scholar] [CrossRef]
  36. Zhang, D.; Shi, J.; Si, Y.; Li, T. Multi-grating triboelectric nanogenerator for harvesting low-frequency ocean wave energy. Nano Energy 2019, 61, 132–140. [Google Scholar] [CrossRef]
  37. Lin, Z.; Zhang, B.; Guo, H.; Wu, Z.; Zou, H.; Yang, J.; Wang, Z. Super-robust and frequency-multiplied triboelectric nanogenerator for efficient harvesting water and wind energy. Nano Energy 2019, 64, 103908. [Google Scholar] [CrossRef]
  38. Yong, S.; Wang, J.; Yang, L.; Wang, H.; Luo, H.; Liao, R.; Wang, Z.L. Auto-Switching Self-Powered System for Efficient Broad-Band Wind Energy Harvesting Based on Dual-Rotation Shaft Triboelectric Nanogenerator. Adv. Energy Mater. 2021, 11, 2101194. [Google Scholar] [CrossRef]
  39. Xia, Y.; Tian, Y.; Zhang, L.; Ma, Z.; Dai, H.; Meng, B.; Peng, Z. An Optimized Flutter-Driven Triboelectric Nanogenerator with a Low Cut-In Wind Speed. Micromachines 2021, 12, 366. [Google Scholar] [CrossRef]
  40. Xu, M.; Wang, P.; Wang, Y.C.; Zhang, S.L.; Wang, A.C.; Zhang, C.; Wang, Z.; Pan, X.; Wang, Z.L. A soft and robust spring based triboelectric nanogenerator for harvesting arbitrary directional vibration energy and self-powered vibration sensing. Adv. Energy Mater. 2018, 8, 1702432. [Google Scholar] [CrossRef]
  41. Yuan, Z.; Wang, C.; Xi, J.; Han, X.; Li, J.; Han, S.T.; Gao, W.; Pan, C. Spherical Triboelectric Nanogenerator with Dense Point Contacts for Harvesting Multidirectional Water Wave and Vibration Energy. ACS Energy Lett. 2021, 6, 2809–2816. [Google Scholar] [CrossRef]
  42. Rahman, M.T.; Rana, S.M.S.; Salauddin, M.; Maharjan, P.; Bhatta, T.; Kim, H.; Cho, H.; Park, J.Y. A highly miniaturized freestanding kinetic-impact-based non-resonant hybridized electromagnetic-triboelectric nanogenerator for human induced vibrations harvesting. Appl. Energy 2020, 279, 115799. [Google Scholar]
  43. Zhao, C.; Zhang, Q.; Zhang, W.; Du, X.; Zhang, Y.; Gong, S.; Ren, K.; Sun, Q.; Wang, Z.L. Hybrid piezo/triboelectric nanogenerator for highly efficient and stable rotation energy harvesting. Nano Energy 2019, 57, 440–449. [Google Scholar] [CrossRef]
  44. Kong, D.S.; Han, J.Y.; Ko, Y.J.; Park, S.H.; Lee, M.; Jung, J.H. A highly efficient and durable kirigami triboelectric nanogenerator for rotational energy harvesting. Energies 2021, 14, 1120. [Google Scholar] [CrossRef]
  45. Yoo, D.; Park, S.C.; Lee, S.; Sim, J.Y.; Song, I.; Choi, D.; Lim, H.; Kim, D.S. Biomimetic anti-reflective triboelectric nanogenerator for concurrent harvesting of solar and raindrop energies. Nano Energy 2019, 57, 424–431. [Google Scholar] [CrossRef]
  46. Zhang, Q.; Jiang, C.; Li, X.; Dai, S.; Ying, Y.; Ping, J. Highly Efficient Raindrop Energy-Based Triboelectric Nanogenerator for Self-Powered Intelligent Greenhouse. ACS Nano 2021, 15, 12314–12323. [Google Scholar] [CrossRef]
  47. Zhao, L.; Duan, J.; Liu, L.; Wang, J.; Duan, Y.; Roca, L.V.; Yang, X.; Tang, Q. Boosting power conversion efficiency by hybrid triboelectric nanogenerator/silicon tandem solar cell toward rain energy harvesting. Nano Energy 2021, 82, 105773. [Google Scholar] [CrossRef]
  48. Xiong, J.; Cui, P.; Chen, X.; Wang, J.; Parida, K.; Lin, M.; Lee, P.S. Skin-touch-actuated textile-based triboelectric nanogenerator with black phosphorus for durable biomechanical energy harvesting. Nat. Commun. 2018, 9, 4280. [Google Scholar] [CrossRef] [PubMed] [Green Version]
  49. Chen, C.; Guo, H.; Chen, L.; Wang, Y.; Pu, X.; Yu, W.; Wang, F.; Du, Z.; Wang, Z.L. Direct current fabric triboelectric nanogenerator for biomotion energy harvesting. ACS Nano 2020, 14, 4585–4594. [Google Scholar] [CrossRef] [PubMed]
  50. Li, M.; Xu, B.; Li, Z.; Gao, Y.; Yang, Y.; Huang, X. Toward 3D double-electrode textile triboelectric nanogenerators for wearable biomechanical energy harvesting and sensing. Chem. Eng. J. 2022, 450, 137491. [Google Scholar] [CrossRef]
  51. Niu, S.; Wang, S.; Lin, L.; Liu, Y.; Zhou, Y.S.; Hu, Y.; Wang, Z.L. Theoretical study of contact-mode triboelectric nanogenerators as an effective power source. Energy Environ. Sci. 2013, 6, 3576–3583. [Google Scholar] [CrossRef]
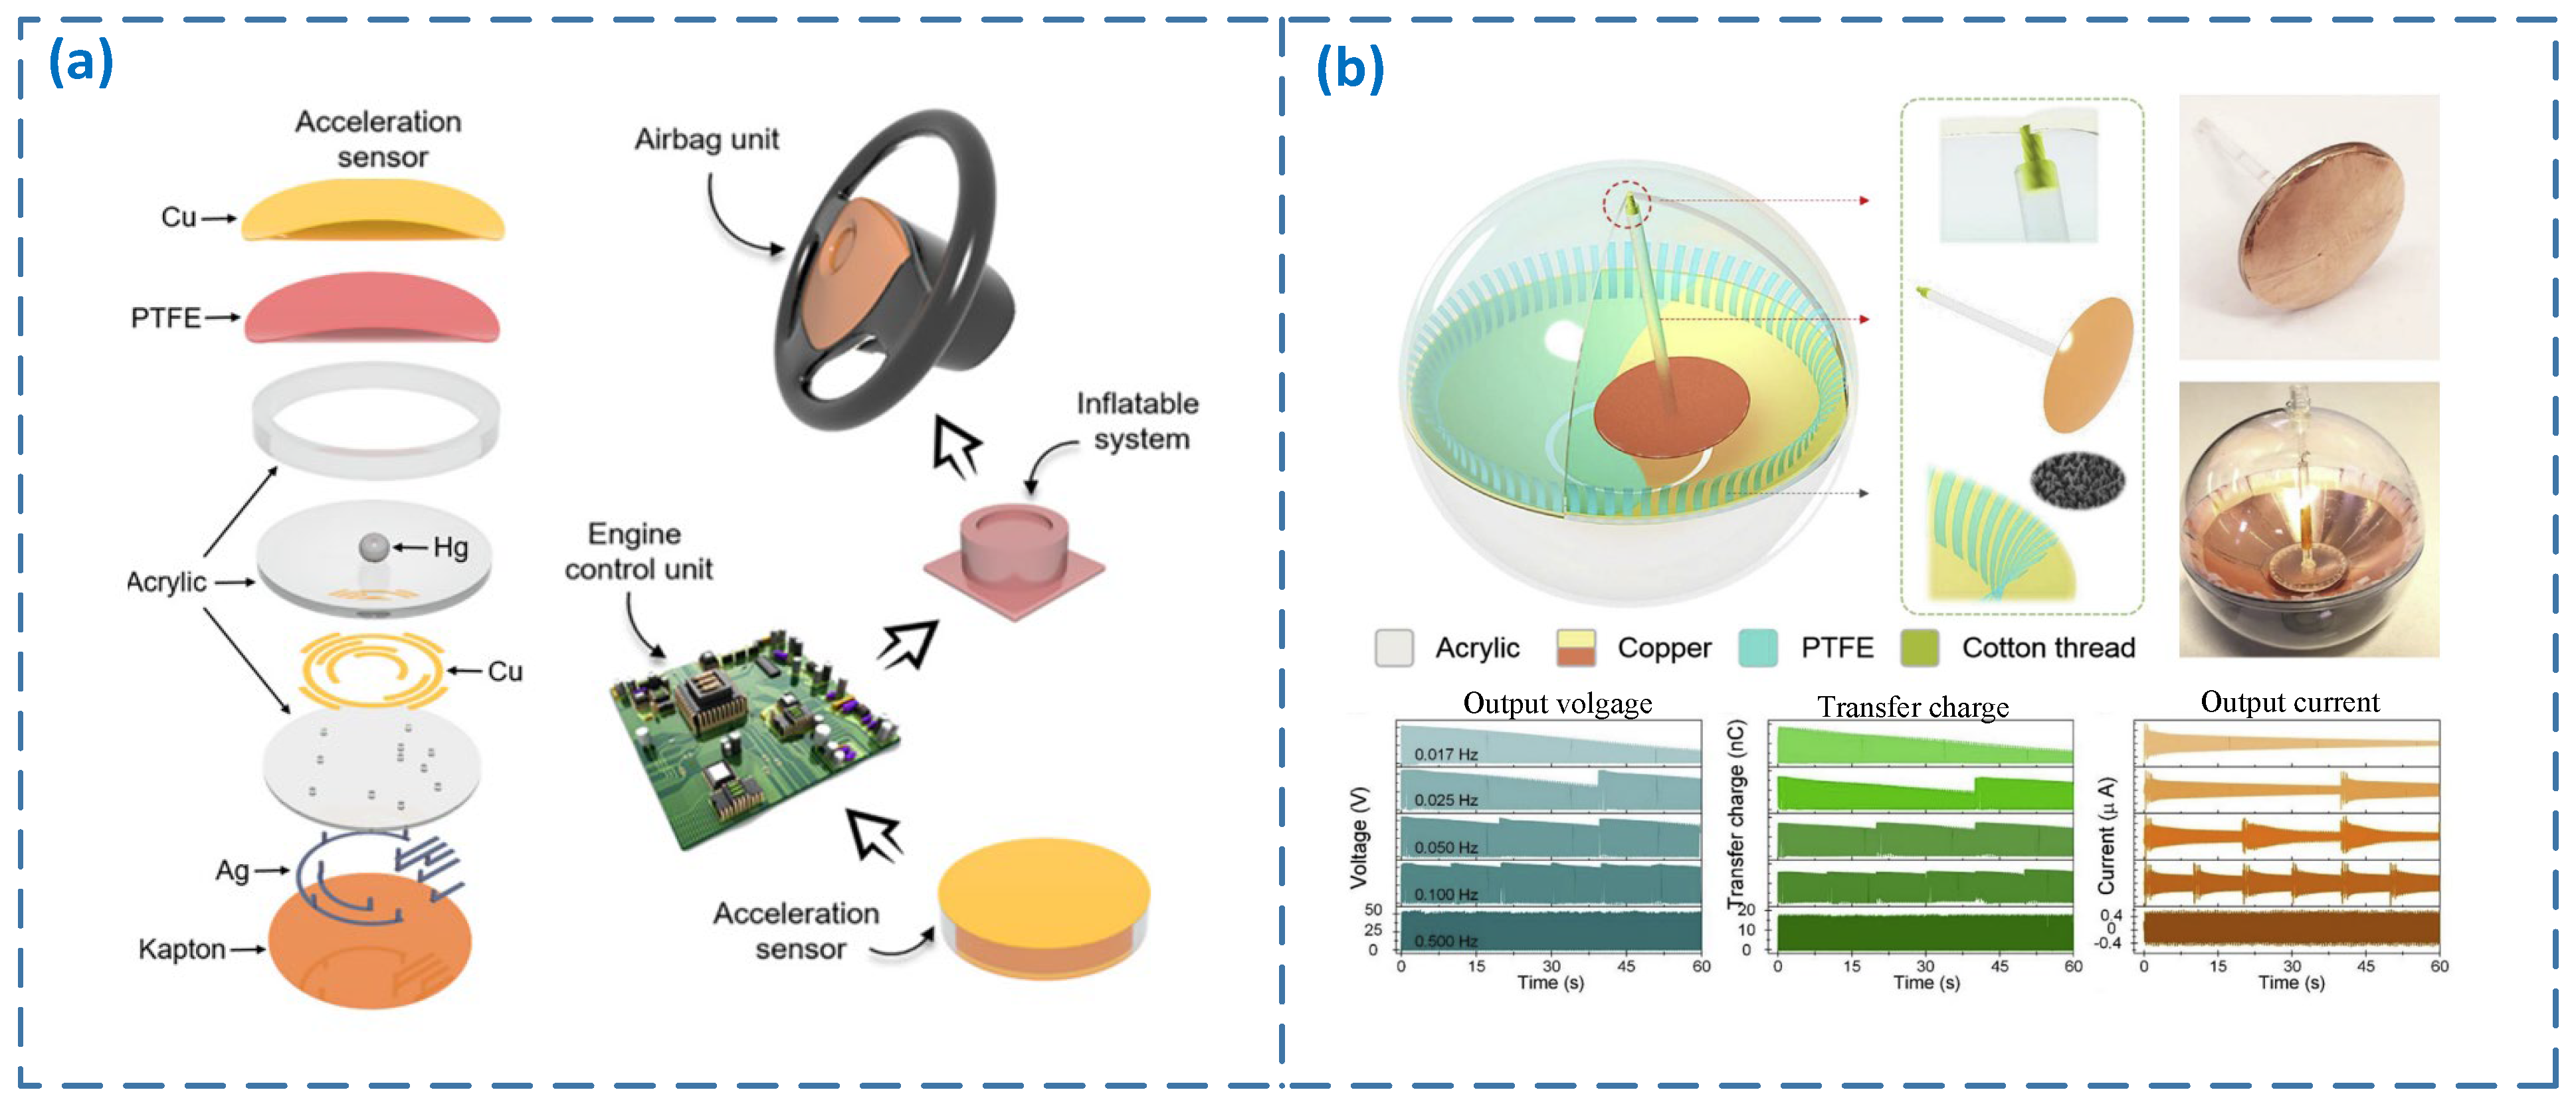
Figure 1. Application of Triboelectric Nanogenerator. (a) Triboelectric nanogenerator used to measure acceleration [22]; (b) Triboelectric nanogenerators for energy harvesting [37].
Energies 16 00770 g001
Figure 2. Composition and working principle of the vibration sensor. (a) Composition of the vibration sensor; (b) picture of the vibration sensor; (c) working steps of the vibration sensor when measuring axial vibration, and c–i to c–v are the schematic diagrams of various states in the working process; and (d) theoretical output voltage signal when measuring axial vibration.
Energies 16 00770 g002
Figure 3. Test devices. (a) The schematic of the test devices; (b) a picture of the test devices.
Energies 16 00770 g003
Figure 4. Results of vibration tests. (a) Output voltage when the axial vibration frequency is 8.5 Hz; (b) output voltage when the lateral vibration frequency is 8.5 Hz; (c) output voltage of axial and lateral vibration at different frequencies; and (d) measurement error of axial and lateral vibration at different frequencies.
Energies 16 00770 g004
Figure 5. Results of power generation function tests. (a) Output current of the axial and the lateral vibration at different frequencies; (b) output current, voltage, and power of the axial vibration under different loads; (c) output current, voltage, and power of the lateral vibration under different loads; and (d) output power of the axial and the lateral vibration at different frequencies.
Energies 16 00770 g005
Figure 6. Results of environmental tests. (a) Output voltage of the axial and lateral vibration at different temperatures; (b) output voltage of the axial and lateral vibration at different relative humidity; (c) output voltage of the axial vibration in different cycle groups; and (d) output voltage of the lateral vibration in different cycle groups.
Energies 16 00770 g006
Disclaimer/Publisher’s Note: The statements, opinions and data contained in all publications are solely those of the individual author(s) and contributor(s) and not of MDPI and/or the editor(s). MDPI and/or the editor(s) disclaim responsibility for any injury to people or property resulting from any ideas, methods, instructions or products referred to in the content.