Article

A Novel Analytical Formulation of SiC-MOSFET Losses to Size High-Efficiency Three-Phase Inverters

1
INESC-ID, Energy Systems, Green Energy and Smart Converters Group, 1000-029 Lisbon, Portugal
2
Departamento de Engenharia Eletrotécnica e de Computadores, University of Lisbon, Técnico Lisboa, 1049-001 Lisboa, Portugal
*
Authors to whom correspondence should be addressed.
Energies 2023, 16(2), 818; https://doi.org/10.3390/en16020818
Submission received: 15 December 2022 / Revised: 4 January 2023 / Accepted: 6 January 2023 / Published: 11 January 2023

Abstract

:
This paper presents a novel analytical loss formulation to predict the efficiency of three-phase inverters using silicon carbide (SiC) metal—oxide—semiconductor field-effect transistors (MOSFETs). The proposed analytical formulation accounts for the influence of the output current harmonic distortion on the conduction losses as well as the impact of the output parasitic capacitances and the deadtime on the switching losses. The losses are formulated in balanced conditions to select suitable SiC MOFETs for the desired target efficiency. To validate the proposed methodology, a 3-phase inverter is designed to present full load efficiency in excess of 99% when built using SiC MOSFETs antiparalleled with SiC Schottky diodes selected for the specified full load efficiency. Experimental assessment of the designed inverter efficiency is compared with the expected values from the proposed analytical formulation and shown to match or exceed the predicted results for loads ranging from 40% to 100% of full load.

1. Introduction

Silicon carbide (SiC) power semiconductors low losses and now widespread availability are feeding the continuous demand for higher efficiencies and higher power densities in power electronic converters. The higher operating voltages of power SiC MOSFET devices, regarding power Si MOSFETs, and their lower switching losses compared to power equivalent Si IGBT devices place SiC MOSFETs as the frontrunner semiconductors for electrical vehicles (EVs) and hybrid electrical vehicles (HEV) motor drives among other applications [1].
The advantages of SiC power semiconductors over Si power semiconductors are well documented and highlighted across multiple papers [2,3,4]. Two clear advantages stand out from the aforementioned works, (1) the reduced chip size area for high efficiency (>99%) converters promising higher power densities and (2) the ability to withstand higher operating temperatures.
Recent studies have also reviewed the past, current, and future applications of SiC power semiconductors showing promising penetration across a variety of areas, emphasizing the numerous advantages of EV motor drives [5,6]. The increase in efficiency brings a reduction in the cooling requirements with clear contributions to the power density whose importance is as meaningful as the cost. Furthermore, the increased efficiency also translates into EVs adopting smaller battery packs, reducing their weight, and increasing the cruising distance [7]. It should still be pointed out that the use of SiC MOSFETs can translate in higher investment costs, both on the development and manufacturing of the inverter, and is as such reserved for applications where the efficiency benefits outweigh these additional costs. A 1% efficiency increase is usually enough to recover the initial extra costs along the converter lifetime.
Inverters with SiC MOSFET technology might aim for unparalleled power densities and efficiencies, as reported in many published works presenting inverter designs showing efficiencies higher than 99% [8,9,10,11,12]. These five works propose distinct approaches for the inverter design, however, they all present a power density lower than 20 kW/dm3 while [13,14,15,16,17] present converters with power densities higher than 20 kW/dm3 but they have efficiencies lower than 99%. Figure 1 depicts the above-mentioned works in terms of their efficiency and power density.
Estimating inverter efficiencies in an early stage of the design process is extremely important. Changing the power semiconductors (e.g., if the required efficiencies are not attained) later in the design stages or in an early production stage comes with considerable costs. As such, it is desirable to have a loss formulation that allows for a preliminary selection of the power semiconductors devices to attain a desired efficiency.
The authors of [18] conclude that in three-phase SiC MOSFET inverter motor drives, 99% of the losses come from the power semiconductor modules where the SiC MOSFET itself is responsible for about 96.5% of the total losses, as these inverters do not need magnetic components. As such, a suitable loss formulation for early-stage design should depend mostly on the SiC MOSFET parameters and on the characteristics of the load. It is still important to note that this approximation is application dependent and losses in magnetic components can be significant and eventually considered for an accurate estimation of the converter losses, if magnetic components are embedded in the inverter.
Several efforts to obtain loss models of a single SiC MOSFET have been recently made. The authors of [19,20] review and list several loss computation methods for a wide set of SiC power semiconductor devices. These methods can be roughly divided into physics-based models, behavioral models, and analytical models. Physics-based models depend on a wide set of constructive parameters of the semiconductors that are not easily accessible to power converter designers [21]. Behavioral models depend on transient simulations, which can take extensive computational effort making it inefficient to compare different MOSFETs.
Analytical formulations can be considerably faster to compute but ultimately may have less accuracy than physics-based or behavioral models. As an example, in [22] an analytical model is shown to be 3000 times faster than a physics-based model with similar accuracy to compute the switching losses for a single turn-ON and turn-OFF event. This formulation divides the switching transient in six different stages and provides an analytical loss formulation for each one. However, despite its accuracy, the formulation is not easily adaptable for a three-phase inverter operation with multiple switching events across a period of low frequency AC output current. A similar conclusion can also be taken for the work in [23], which considers both the SiC MOSFET and the SiC Schottky diode.
Efforts toward an analytical model that can predict the losses on a three-phase inverter can be found in [10] using a piecewise linear model for the switching losses to obtain the energy associated with each commutation during the fundamental output period. The results show a good approximation at higher output powers; however, the error increases substantially for lower output powers.
A loss formulation with a similar goal to the one presented in this paper can be found in [24] but for a three-level neutral-point-clamped inverter where twice as many semiconductors are used. However, the formulation is presented in an integral form and as such, it either depends on a transient simulation to know the profiles of the voltage and current across the semiconductors or assume a constant derivative of the voltages and currents across the semiconductor. Furthermore, it disregards the effect of the deadtime in the switching losses. The influence of this deadtime in a bridge configuration with SiC semiconductors leads to reduced switching losses at higher output currents and increased switching losses at lower output currents [25].
A more complete formulation, but still without the influence of the deadtime, can be found in [26]. This formulation is suitable to be used in early design stages as long as the characteristics of the switching energies variation with the output current for a given DC link voltage are known or extracted by a double pulse test (which can be costly to compare multiple semiconductors). This formulation was tested experimentally with low relative errors for output powers close to nominal.
Most loss formulations assume an even distribution of the losses across the three inverter legs, balanced loads, and AC voltages together with a balanced modulator. When the inverter is in abnormal operating conditions, such as load asymmetries or phase faults, the assumption of evenly distributed losses might not hold. The wide set of potential asymmetric operating conditions that could result in unbalanced operating conditions make it impractical to simulate or even devise pure analytical models to account for all these possibilities. Statistical model verification methods for power electronics converters as described in [27] are a modern approach to provide insight on the expected abnormal operating conditions, and have been successfully applied to multi-level three-phase inverters in [28].
The contribution proposed in this paper is a novel analytical formulation that considers the influence of the output current THD as well as the converter deadtime in the estimation of the conduction and switching losses. The proposed formulation depends only on the characteristics of the load, switching frequency, and parameters that can be typically extracted directly from the device’s datasheets. The influence of the reverse recovery time is neglected since it is considered that external SiC Schottky diodes are used which have reverse recovery times and currents much smaller than the more traditional PiN diodes [29].
The new formulation is presented in the next section. Section 3 discusses the semiconductor selection process within the proposed methodology and explores application-specific insights about the proposed formulation. In Section 4, the proposed formulation is experimentally tested against a three-phase SiC inverter and the results are compared and discussed. Conclusions are taken in Section 5, followed by appendixes about formula derivation and experimental measurements uncertainty analysis.

2. Three-Phase Inverter Efficiency Formulation

The inverter efficiency η can be defined considering the input power P i and the output power P o . Assuming the output power is known, the efficiency is:
η = P o P i = P o P o + P l o s s e s = 1 1 + P l o s s e s P o
where   P l o s s e s is the sum of all the converter losses. As seen in (1), the efficiency value is dominated by the ratio   P l o s s e s / P o   . This ratio can be expressed as:
P l o s s e s P o = 1 η η
Therefore, if the three-phase SiC is to be designed for an efficiency of around 99.3% then the term   P l o s s e s / P o   should be around 0.70%.
Assuming most losses are in the SiC MOSFETs, the term   P l o s s e s may be decomposed into conduction, P O N , and the switching losses, P S W resulting in an efficiency given by:
η = 1 1 + P O N P o + P S W P o
Throughout the following subsections the losses ratios P O N / P o and P S W / P o will be expanded to account for the traditional conduction and switching losses along with the influence of the parasitic capacitances and harmonic distortion. The inverter is assumed to use external SiC Schottky diodes and as such, losses from the diodes reverse recovery process are negligible [30].

2.1. Computation of the Conduction Losses Ratio Pon/Psw

Most inverter pulse width modulators (PWM) switch every semiconductor evenly, therefore equally sharing the losses among the SiC MOSFETs of the three inverter legs. Assume that all the six SiC-MOSFETs have equal channel resistance R D S o n , with root mean square (RMS) current I O R M S / 2 , where I O R M S is the RMS value of the fundamental harmonic output current per inverter phase. The line to neutral voltage is V O R M S and the balanced load has power factor F p . The on-state losses ratio, considering only the fundamental component of the output current, P O N f / P o can be estimated as:
P O N f P o = 6 3 V 0 R M S I 0 R M S F p R D S o n I 0 R M S 2 2 = R D S o n I 0 R M S V 0 R M S F p
This equation shows that the ratio P O N f / P o is proportional to R D S o n , and increases linearly with the fundamental harmonic output current I O R M S , while decreasing for increasing V O R M S at constant F p . Introducing the inverter power modulation index m p of the inverter powered at constant voltage U D C , m p = 6 V O R M S / U D C , Equation (4) can be written as:
P O N f P o = R D S o n 6 I 0 R M S m P U D C F p = R D S o n P o 3 V 0 R M S 2 F p 2 = R D S o n 2 P o m p 2 U D C 2 F p 2
This shows that the on-state losses ratio (for the fundamental current component) at constant U D C and F p , still raises linearly with the output power P o , and increases as m p and F p decrease at constant I O R M S . The on-state losses ratio is proportional to the output power and inversely proportional to U D C 2 at constant F p and m p .
Furthermore, considering an equivalent load impedance magnitude Z 0 , that is I 0 R M S = V 0 R M S / Z 0 = m p U D C / ( 6 Z 0 ) , then (5) can be further simplified to:
P O N f P o = R D S o n 6 m p U D C m p U D C F p 6 Z 0 = R D S o n F p Z 0
This shows that the P O N f ratio depends only on the ratio of the transistor on-state resistance R D S o n to load impedance magnitude Z 0 , at a constant power factor F p . Therefore, to minimize on-state losses the ratio R D S o n / Z 0 should be minimized.
The above formulation for the conduction losses assumes a purely sinusoidal output current, thereby neglecting the effects of the output current ripple. Given that the behavior of the current ripple depends upon the selected modulation scheme and/or controllers, an analytical approach to account for the current ripple in the losses calculations will mostly be application dependent. Contributions with such analytical approaches for modulation methods can be found in [31,32].
However, as an approximation, the power loss formulation can be attained only from the total harmonic distortion (THD) of the output current. The RMS value of the output current considering all the harmonics, I 0 T R M S can be given by:
I 0 T R M S = I 0 R M S 1 + T H D 2
The on-state losses can then be computed considering the true RMS output current:
P O N = 3 R D S o n I 0 T R M S 2 = 3 R D S o n I O R M S 2 ( 1 + T H D 2 )
As such the conduction losses can be divided in two terms, one following the formulation in (5) and (6) complemented with an additional term to account for the output current THD, P O N d :
P O N d P o = 3 R D S o n I O R M S 2 T H D 2 3 V 0 R M S I 0 R M S F p = R D S o n I 0 R M S T H D 2 V 0 R M S F p = R D S o n F p Z 0 T H D 2
The conduction losses ratio P O N / P o can then be written as
P O N P o = P O N f P o + P O N d P o = R D S o n I 0 R M S V 0 R M S F p ( 1 + T H D 2 ) = R D S o n F p Z 0 ( 1 + T H D 2 )
Note that the output power P o was computed accounting only for the fundamental component output current for two reasons: (1) most inverter loads output power is only related to the fundamental frequency (e.g., electrical machines); (2) it allows a simple but accurate enough relation between the conduction losses and the output power.

2.2. Computation of the Switching Losses

Switching losses are often computed by considering the falling and rising times of the current, t f i and t r i , and the falling and rising times of the voltage, t f u and t r u , along with the typical waveforms of the drain to source current, i D S ( t ) , and the drain to source voltage, v D S ( t ) . The typical switching waveforms can be found in Figure 2 where v h d r and v l r d are the high and low driving voltages of the SiC MOSFET, v t h and v p l t are the MOSFET threshold and gate plateau voltages, respectively.
Considering the times of the above figures the turn-ON and turn-OFF losses are normally computed considering the triangular area formed by the multiplication of the current and voltage waveforms. Additionally, some authors include an additional term to account for the dissipation of the energy stored in the parasitic output capacitance C o s s [22] while others contest that its inclusion results in an overestimation of the switching losses [25].
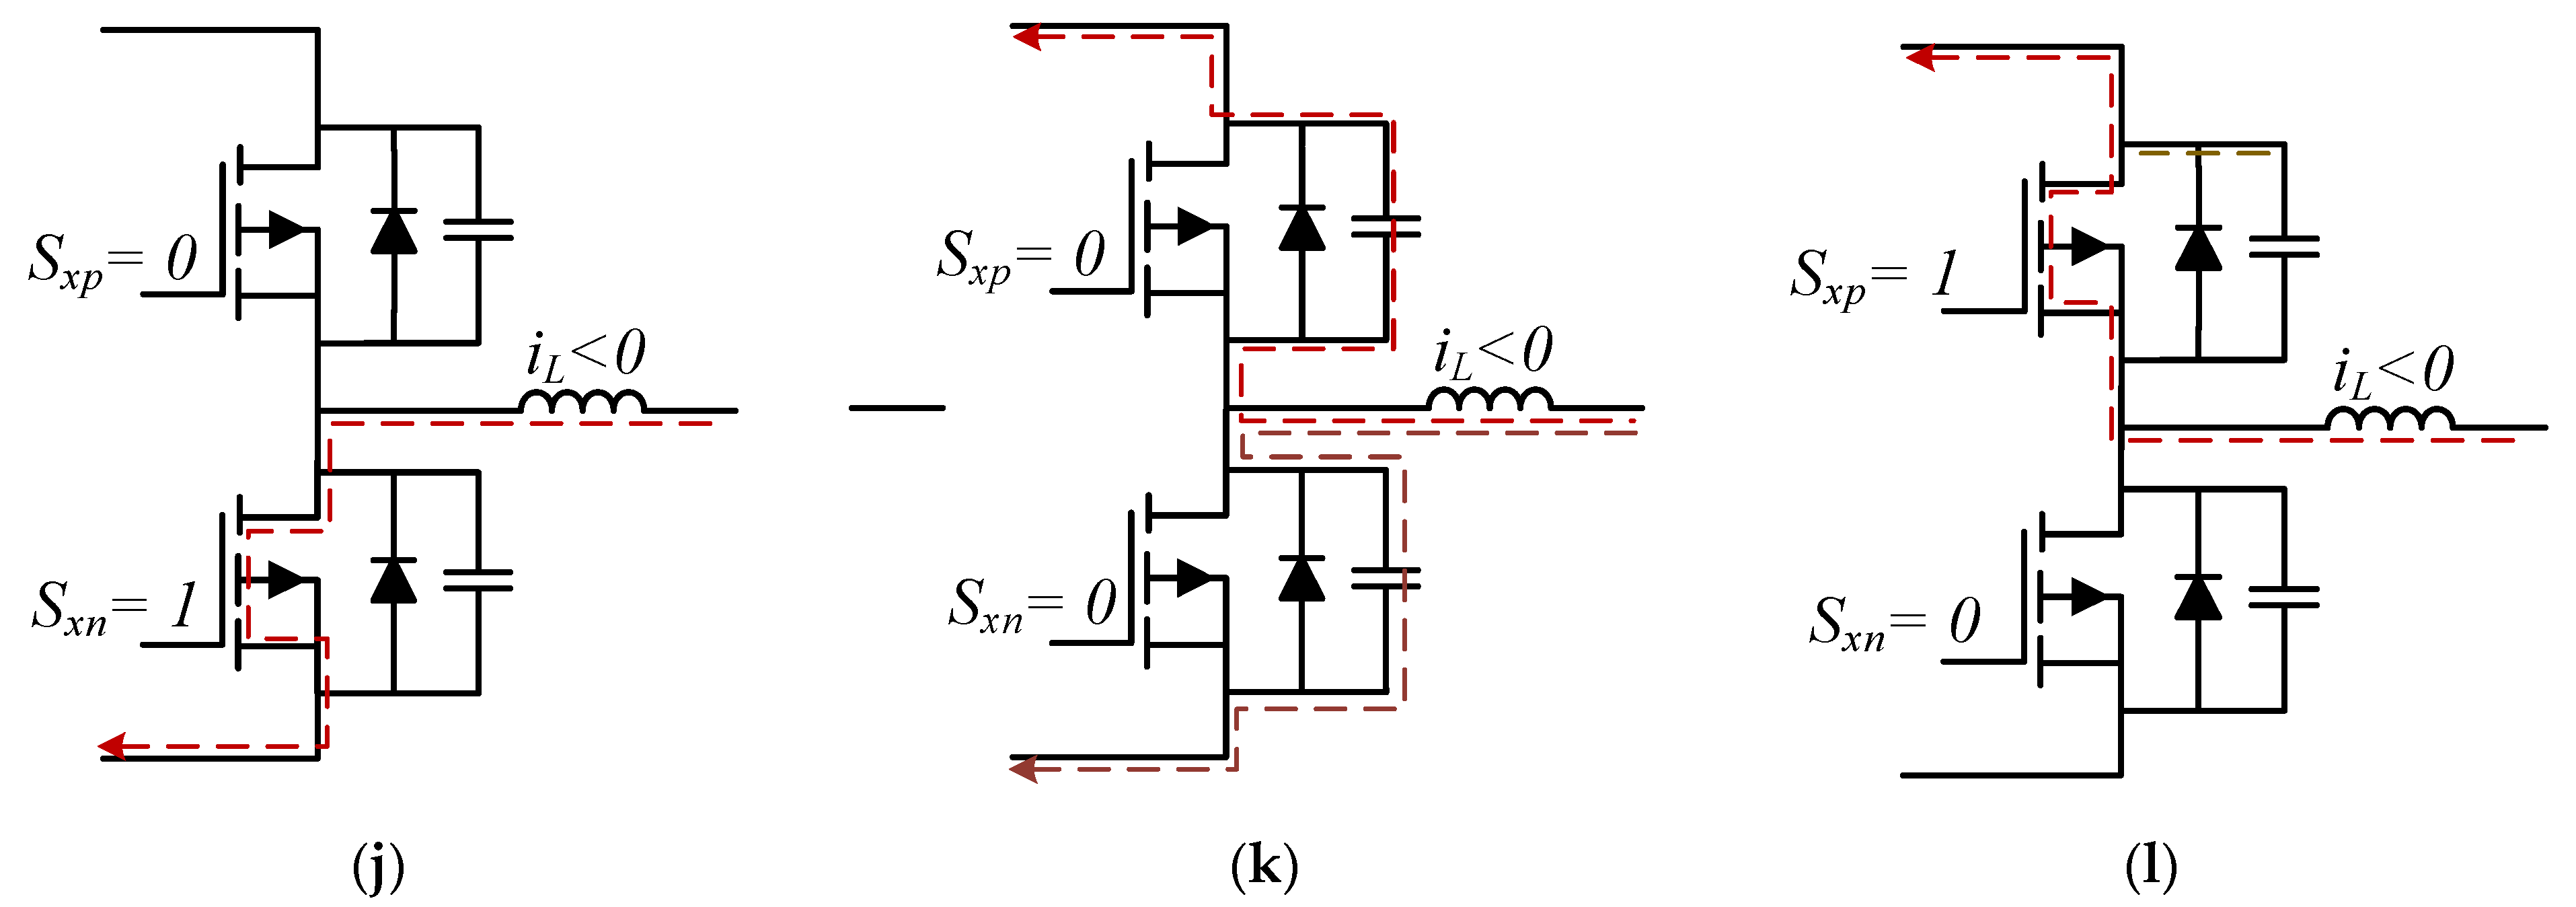
The switching losses estimation as described in [22,25] is only valid for setups as the double pulse test. When MOSFETs are used to build an inverter leg a more careful inspection is required. Figure 3 details four different commutation scenarios for a single inverter leg: Two transitions from high-side conduction to low-side conduction and two transitions from low-side conduction to high-side conduction both with positive and negative output phase currents.
Consider the scenario shown in Figure 3a–c, that illustrates the inverter leg commutation from the high side ( S x p = 1 ) to the low side ( S x n = 1 ) with a positive phase current i L > 0 . The commutation starts with the gate driving signal to open the upper MOSFET ( S x p = 0 ) which removes the MOSFET conduction channel charge carriers, previously carrying the inductor current i L . Considering ideal switching this current would go into the S x n antiparallel diode.
Consider similar upper and lower parasitic capacitances, C T , (as depicted in Figure 3) given by the sum of the MOSFET parasitic output capacitance, C o s s , and the external diode parasitic capacitance, C d such that C T = C o s s + C d . During the deadtime no MOSFET is driven ON, therefore considering that the output current is positive, both upper and lower parasitic capacitors will charge and discharge trough the load current, respectively (as shown in Figure 3b).
Consider first that the positive load current is high enough to conclude the charging and the discharging process of these capacitors before the lower MOSFET is driven ON. In these circumstances S x n can do a soft commutation with almost zero voltage and the only losses term will be the turn-OFF of the upper MOSFET. An identical conclusion can be obtained for the commutation from the low side to high side with a negative phase current (Figure 3j–l).
Consider now the scenario in Figure 3d–f, where a commutation from high-side conduction to low-side conduction is depicted with a negative phase current. At the instant the upper MOSFET is driven OFF the output current will progressively be carried through the SiC diode keeping the lower parasitic capacitance charged, as a result the turn-OFF process of the upper MOSFET results in a soft commutation with close to zero voltage. During the deadtime the phase current goes through the upper diode and consequently the lower and upper capacitances remain respectively charged and discharged Figure 3e.
The last step of this commutation is the turn-ON process of the lower MOSFET. Once S x n is driven to the ON state then multiple current paths appear (Figure 3f): (1) The output phase current that was circulating through the upper diode is forced through the S x n MOSFET channel. (2) S x n parasitic output capacitance must also be discharged through the MOSFET channel. (3) The current required to charge the parasitic output capacitance of S x p must also conduct through the channel of S x n . The commutation from low side to high side with positive output current shares the same process and is depicted in Figure 3g–i.
To conclude, during a single switching period there will be one turn-ON and one turn-OFF process contributing to losses. If the output current is positive enough then the upper MOSFET turn-ON commutation and the lower MOSFET turn-OFF commutation will contribute to the switching losses. If the output current is negative enough then this conclusion is reversed. Note that this is only true if, and only if, the output phase current is high enough to charge and discharge the parasitic capacitances during the deadtime.
Hereby follows the loss formulation taking the above-described process into account. The contribution of the turn-ON and turn-OFF losses of both MOSFET (which happen a single time per period, T , per inverter leg) can be written as:
P S W l P o = 3 I D S U D S 3 V 0 R M S I 0 R M S F p t f u + t r i + t r u + t f i 2 T
It important to note that the I D S current in (11) is not constant along one period of the fundamental output sinusoidal current. However, for a prior efficiency forecast the I D S current can be estimated considering the average of the instantaneous MOSFET current values over one half-period of the fundamental harmonic output current giving I D S = 2 I O R M S / π :
P S W l P o = 2 3 I 0 R M S π m p I 0 R M S F P t f u + t r i + t r u + t f i 2 T = 3 π m p F P t o n + t o f f T
where t o n = t f u + t r i and t o f f = t r u + t f i . This losses ratio decreases linearly with m p and F p while increasing linearly with the switching frequency, 1 / T , and the switching times t f u , t r i , t r u , and t f i . Remarkably, in the conditions highlighted above, this losses ratio does not depend on the amplitudes of the currents and voltages.
Note that t f u , t r i , t r u , and t f i are normally extracted from the devices datasheets for a given set of operating conditions. t r i and t f i can be extracted from the input parasitic capacitance of the MOSFET, C i s s , the gate resistance R g and the gate driving voltages. For simplicity, consider that the values of t r u , t f u , t r i , and t r u are known. These values can be computed directly from parameters available in the device’s datasheets, either presented directly or from the parasitic capacitances and driving voltages. An estimation of these times accounting for the influence of non-flat Miller plateau region can be found in [33].
The relation in (12) accounts only for one of the three current paths described in the turn-ON process and is missing the contributions of the currents that results from the charging and discharging of the parasitic capacitances. Assuming a single hard commutation per inverter leg, the hard commutation will have to handle the discharge current of one parasitic capacitance and the charge current of the opposite. The losses contribution from the charge and discharge of the parasitic capacitances C T can be shown to be:
P S W C P o = 3 ( 2 1 2 T C T U D C 2 ) 3 V o r m s I o r m s F p = C T U D C 2 V o r m s I o r m s F p T
Using the relations for m p and I o r m s used in (5) and in (6), respectively, (13) can be simplified to:
P S W C P o = 6 C T U D C 2 m p U D C I o r m s F p T = 6 C T Z 0 m p 2 F p T
This result shows that the parasitic capacitance C T contributes linearly to the P S W C / P o ratio. This ratio also reduces quadratically with m p and F p while it increases linearly with the load impedance, Z 0 , and the switching frequency, 1 / T .
The complete switching losses ratio is given by:
P S W P o = P S W l P o + P S W C P o = 3 π m p F P t o n + t o f f T + 6 C T Z 0 m p 2 F p T
Notice that both terms increase with the decrease in m p , however the term related to the parasitic capacitance depends on the square value of m p as such the influence of this component to the overall losses would be more significant for lower values of m p .
It is once again important to note that the relation in (15) assumes that the output current is always high enough to ensure that the charge/discharge process of the parasitic capacitors is performed before the end of the deadtime. In practice, since the output current is sinusoidal, it is expected that during a time interval of the fundamental output period an additional losses term needs to be considered. This time interval, t c , is depicted in Figure 4 and depends mostly on the parasitic output capacitance of the SiC MOSFET, the selected deadtime and the output phase peak current.
Considering the deadtime, t d , this additional loss term can be shown to be (Appendix A):
P S W a P o = ( 3 2 π m p F P t o n + t o f f T + 3 C T Z 0 m p 2 F p T ) ( 2 arcsin ( 2 3 C T Z o m p t d ) / π )
The relation in (16) depends on the a priori knowledge of the deadtime which depends on several design parameters. To have a formulation suitable for an early-stage selection of the inverter semiconductors the following approximation is proposed:
P S W a P o = ( 3 2 π m p F P t o n + t o f f T + 3 C T Z 0 m p 2 F p T ) ( 1 m p )
The concept behind this alternative is that for lower values of m p the expected output current amplitude, for constant Z 0 , is also lower and as such the portion of the fundamental output period where the additional losses term is required is also higher. The difference between (16) and (17) will be shown to be negligible in the experimental results.
The switching losses terms with the above-described compensation can be then given by:
P S W P o = P S W l P o + P S W C P o + P S W a P o = ( 3 2 π m p F P t o n + t o f f T + 3 C T Z 0 m p 2 F p T ) ( 3 m p )
The switching losses ratio increases with the switching times, parasitic capacitance, and output load impedance, and reduces with increasing F p , T , and m p .

3. Considerations of the Proposed Methodology, Semiconductor Selection, and Case Study

The complete formulation for the three-phase SiC MOSFET inverter can then be given by:
η = 1 1 + P O N P o + P S W P o = 1 1 + R D S o n F p Z 0 ( 1 + T H D 2 ) + ( 3 2 π m p F P t o n + t o f f T + 3 C T Z 0 m p 2 F p T ) ( 3 m p )
Since the output power factor and the load impedance are not independent variables the proposed formulation can be further simplified to account only for the resistive component of the load impedance, since F p = R 0 / Z 0 the converter efficiency can be written as:
η = 1 1 + P O N P o + P S W P o = 1 1 + R D S o n R 0 ( 1 + T H D 2 ) + ( 3 2 π m p F P t o n + t o f f T + 3 C T R 0 m p 2 F p 2 T ) ( 3 m p )
Considering that for a high enough output power, the converter losses are dominated by the semiconductor losses, and then the characteristics of the SIC MOSFET device must fulfill the following:
R D S o n λ 1 η η R 0 ( 1 + T H D 2 ) t o n + t o f f ( 1 λ ) 1 η η 2 3 3 π m p F P T ( 3 m p ) 2 π 3 C T R 0 m p F p
where λ is the weighting factor allowing a compromise between switching losses and conduction losses. These equations provide a way to size the semiconductor parameters to attain a given efficiency at a given output power.
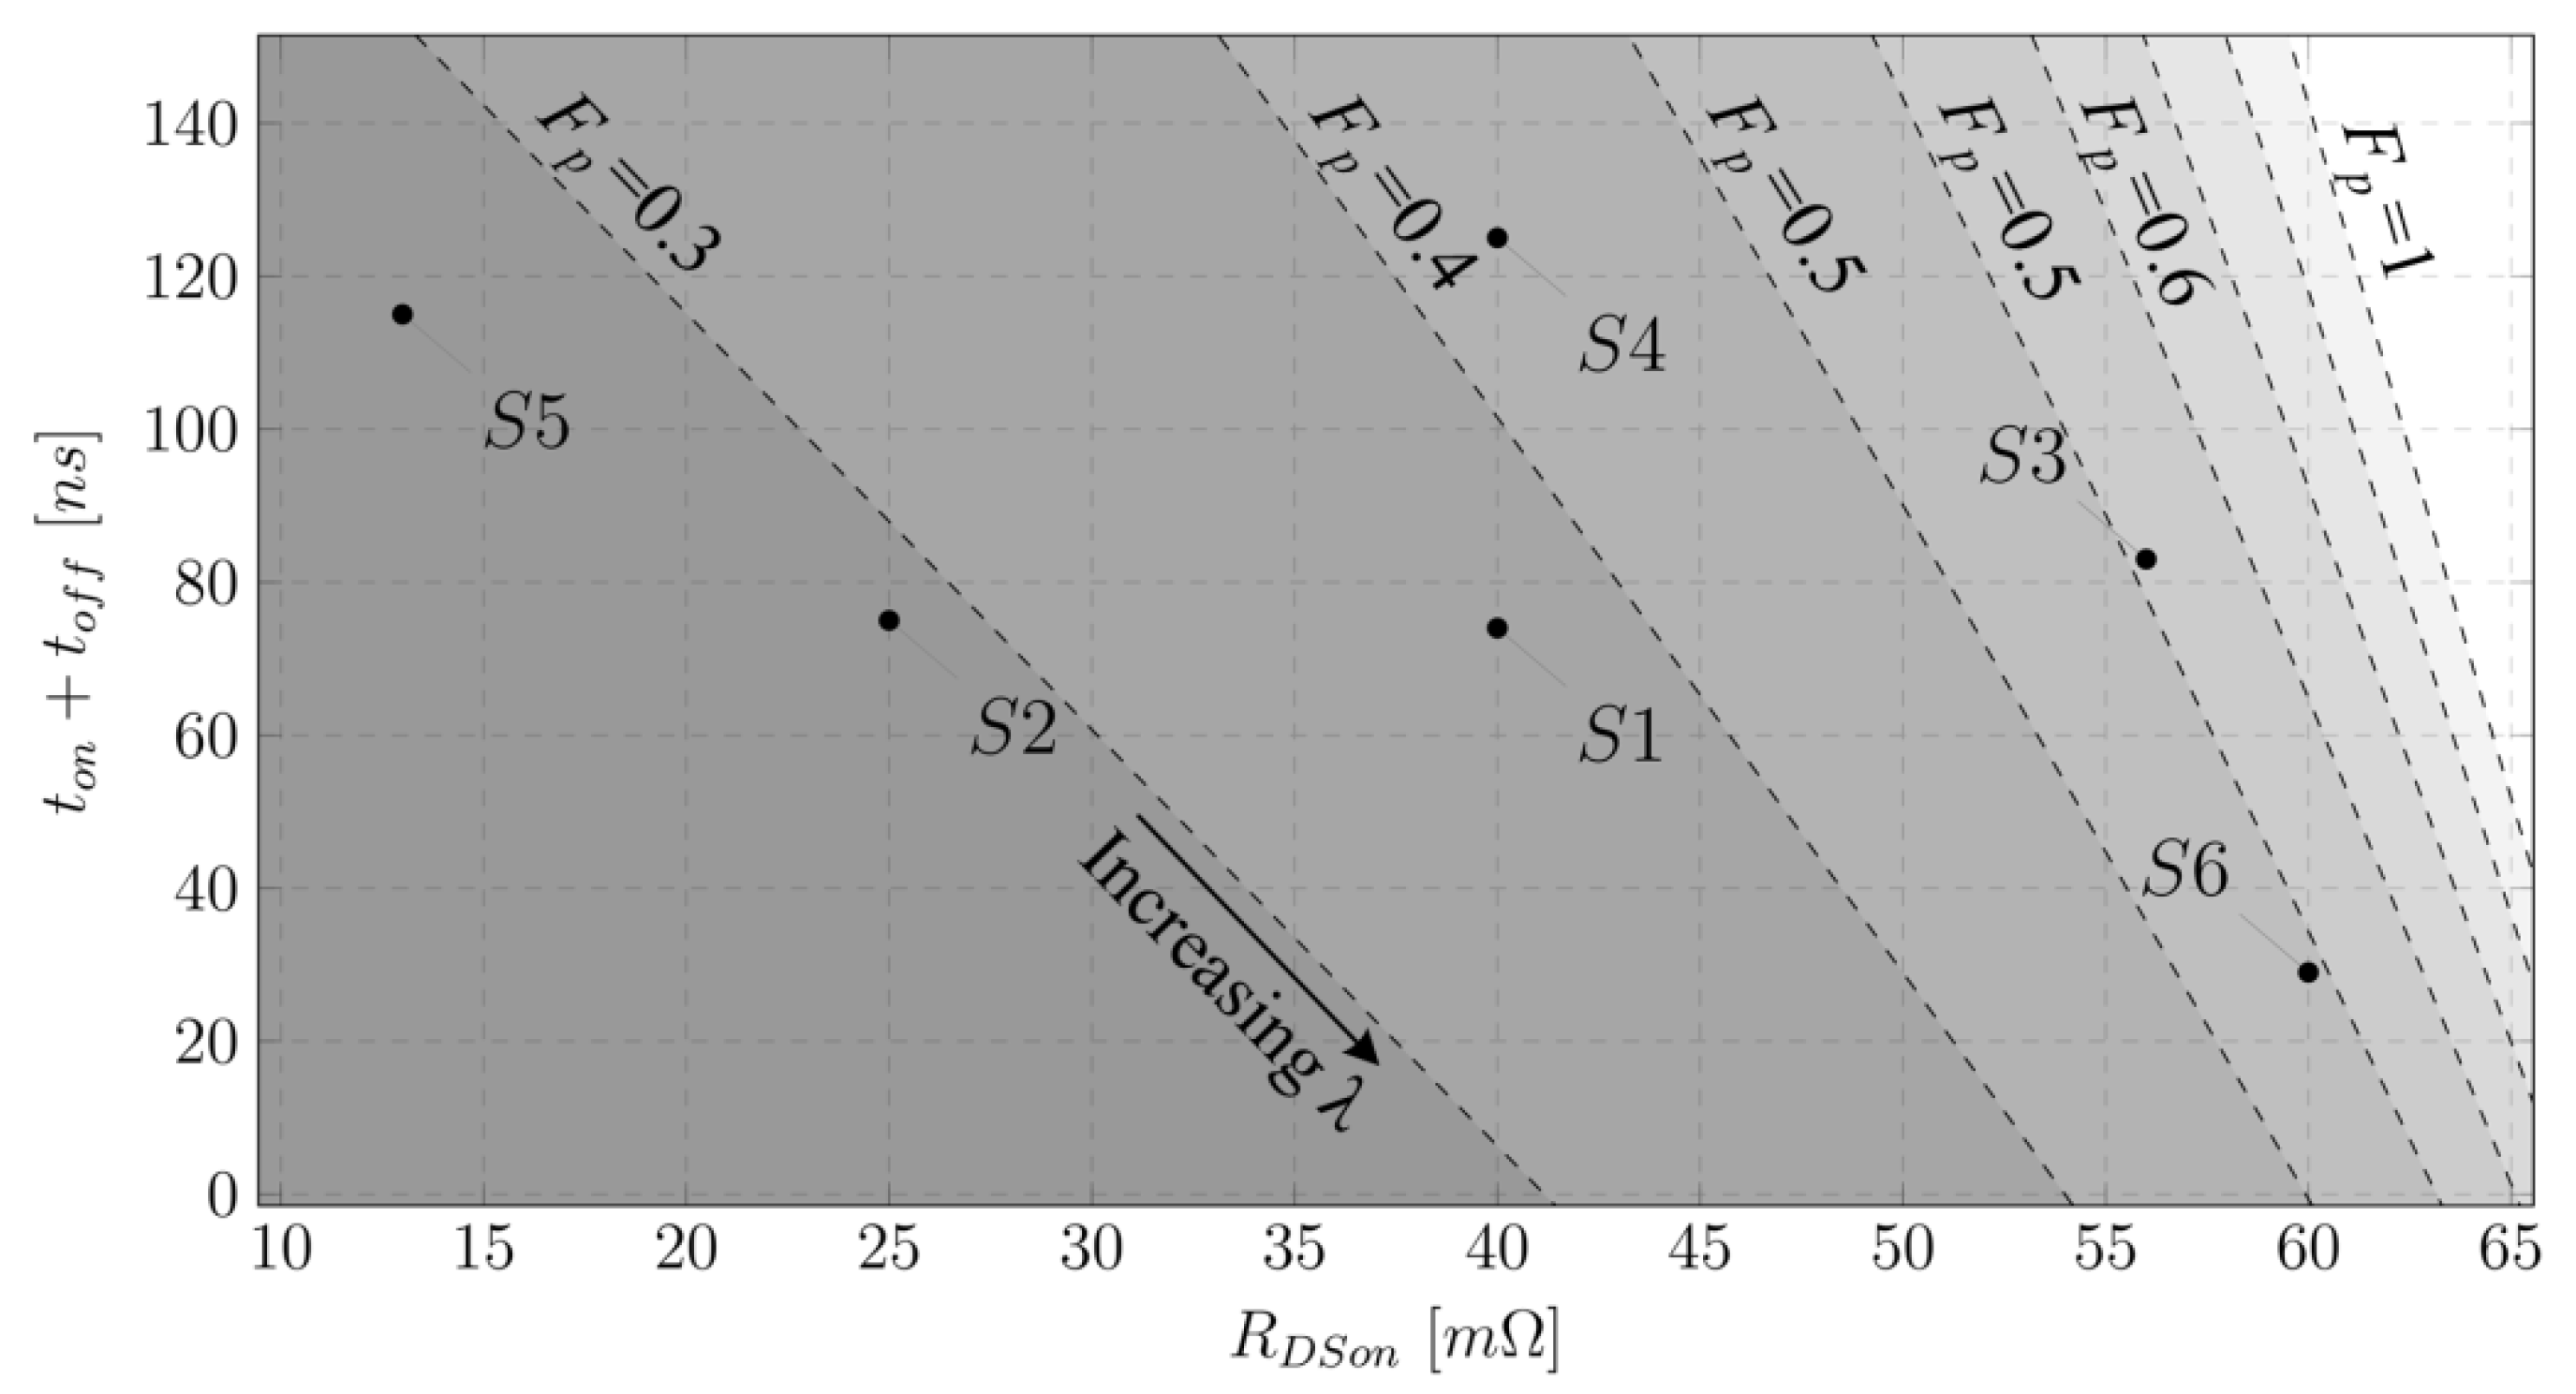
The relations in (21) allow to roughly size the semiconductor parameters as a function of the converter operating point and the characteristics of the load. Figure 5 illustrates this reasoning. Considering a constant modulation index and a constant power factor Figure 5 shows traces that represent the minimum relation between t o n + t o f f and R D S o n to attain a desired efficiency η   = 99.3% for different values of R 0 . The interpretation of this result can be made as follows: for a load resistance of 11 Ω all semiconductors depicted satisfy the desired efficiency constrain. For a load resistance of 6 Ω only S2 and S5 should be considered. The list of the semiconductor’s parameters depicted in Figure 5 can be seen in Table 1.
A similar consideration can be made for a varying power factor keeping everything else constant, as shown in Figure 6. In this illustrative set of conditions with a constant load resistance R 0   = 10   Ω , only the semiconductors S5, S2, and S1 can attain an efficiency of at least 99.3% for a load with a power factor of 0.4 (a value selected to merely illustrate a potential selection process). The visual inspection of both Figure 5 and Figure 6 also reveals that for the selected operating conditions, the requirements for the switching times of the semiconductor are more influenced by the load power factor than from the load resistance, while the requirements for the R D S o n will be mostly dictated by the real component of the load impedance.
Supposing that the power modulation index, the load impedance, and the power factor are all kept constant, and the output power is changed by regulating the DC supply voltage, the partial derivatives of the ratios with respect to the supply voltage yield:
P O N / P o U D C = 0 P S W / P o U D C = 0
This shows that the on-state losses ratio and switching losses ratio remain constant for a variable input voltage if Z 0 and m p are kept constant.
Suppose now that output power is changed by varying the resistive component R 0 of the load impedance Z 0 while the power modulation index and the supply voltage are kept constant. Since F p = R o / Z 0 the partial derivatives of the losses ratio to the resistive part of the load yield:
P O N / P o R 0 = ( 1 + T H D 2 ) R D S o n R 0 2 P S W / P o R 0 = 3 C T ( 3 m p ) F p 2 m p 2 T
This shows that the switching losses ratio will increase linearly with increasing R 0 as long as F p , m p , and T are kept constant. Furthermore, and as expected, the on state losses ratio decreases with increasing R 0 indifferently from the values of m p , F p , or T .
Finally, suppose that the output power is changed by varying the modulation index while both the supply voltage and resistive component R 0 of the load impedance are kept constant, the partial derivative of both ratios with respect to m p yield:
{ P O N / P o m p = 0 P S W / P o m p = 3 ( t o n + t o f f ) F p m p 2 π T ( 6 m p ) 3 C T R 0 F p 2 m p 3 T
This shows that the on-state losses ratio will keep constant when varying the power modulation index m p while the switching loss ratio will decrease with m p at constant F p and R 0 although with a smaller derivative for higher value of m p .
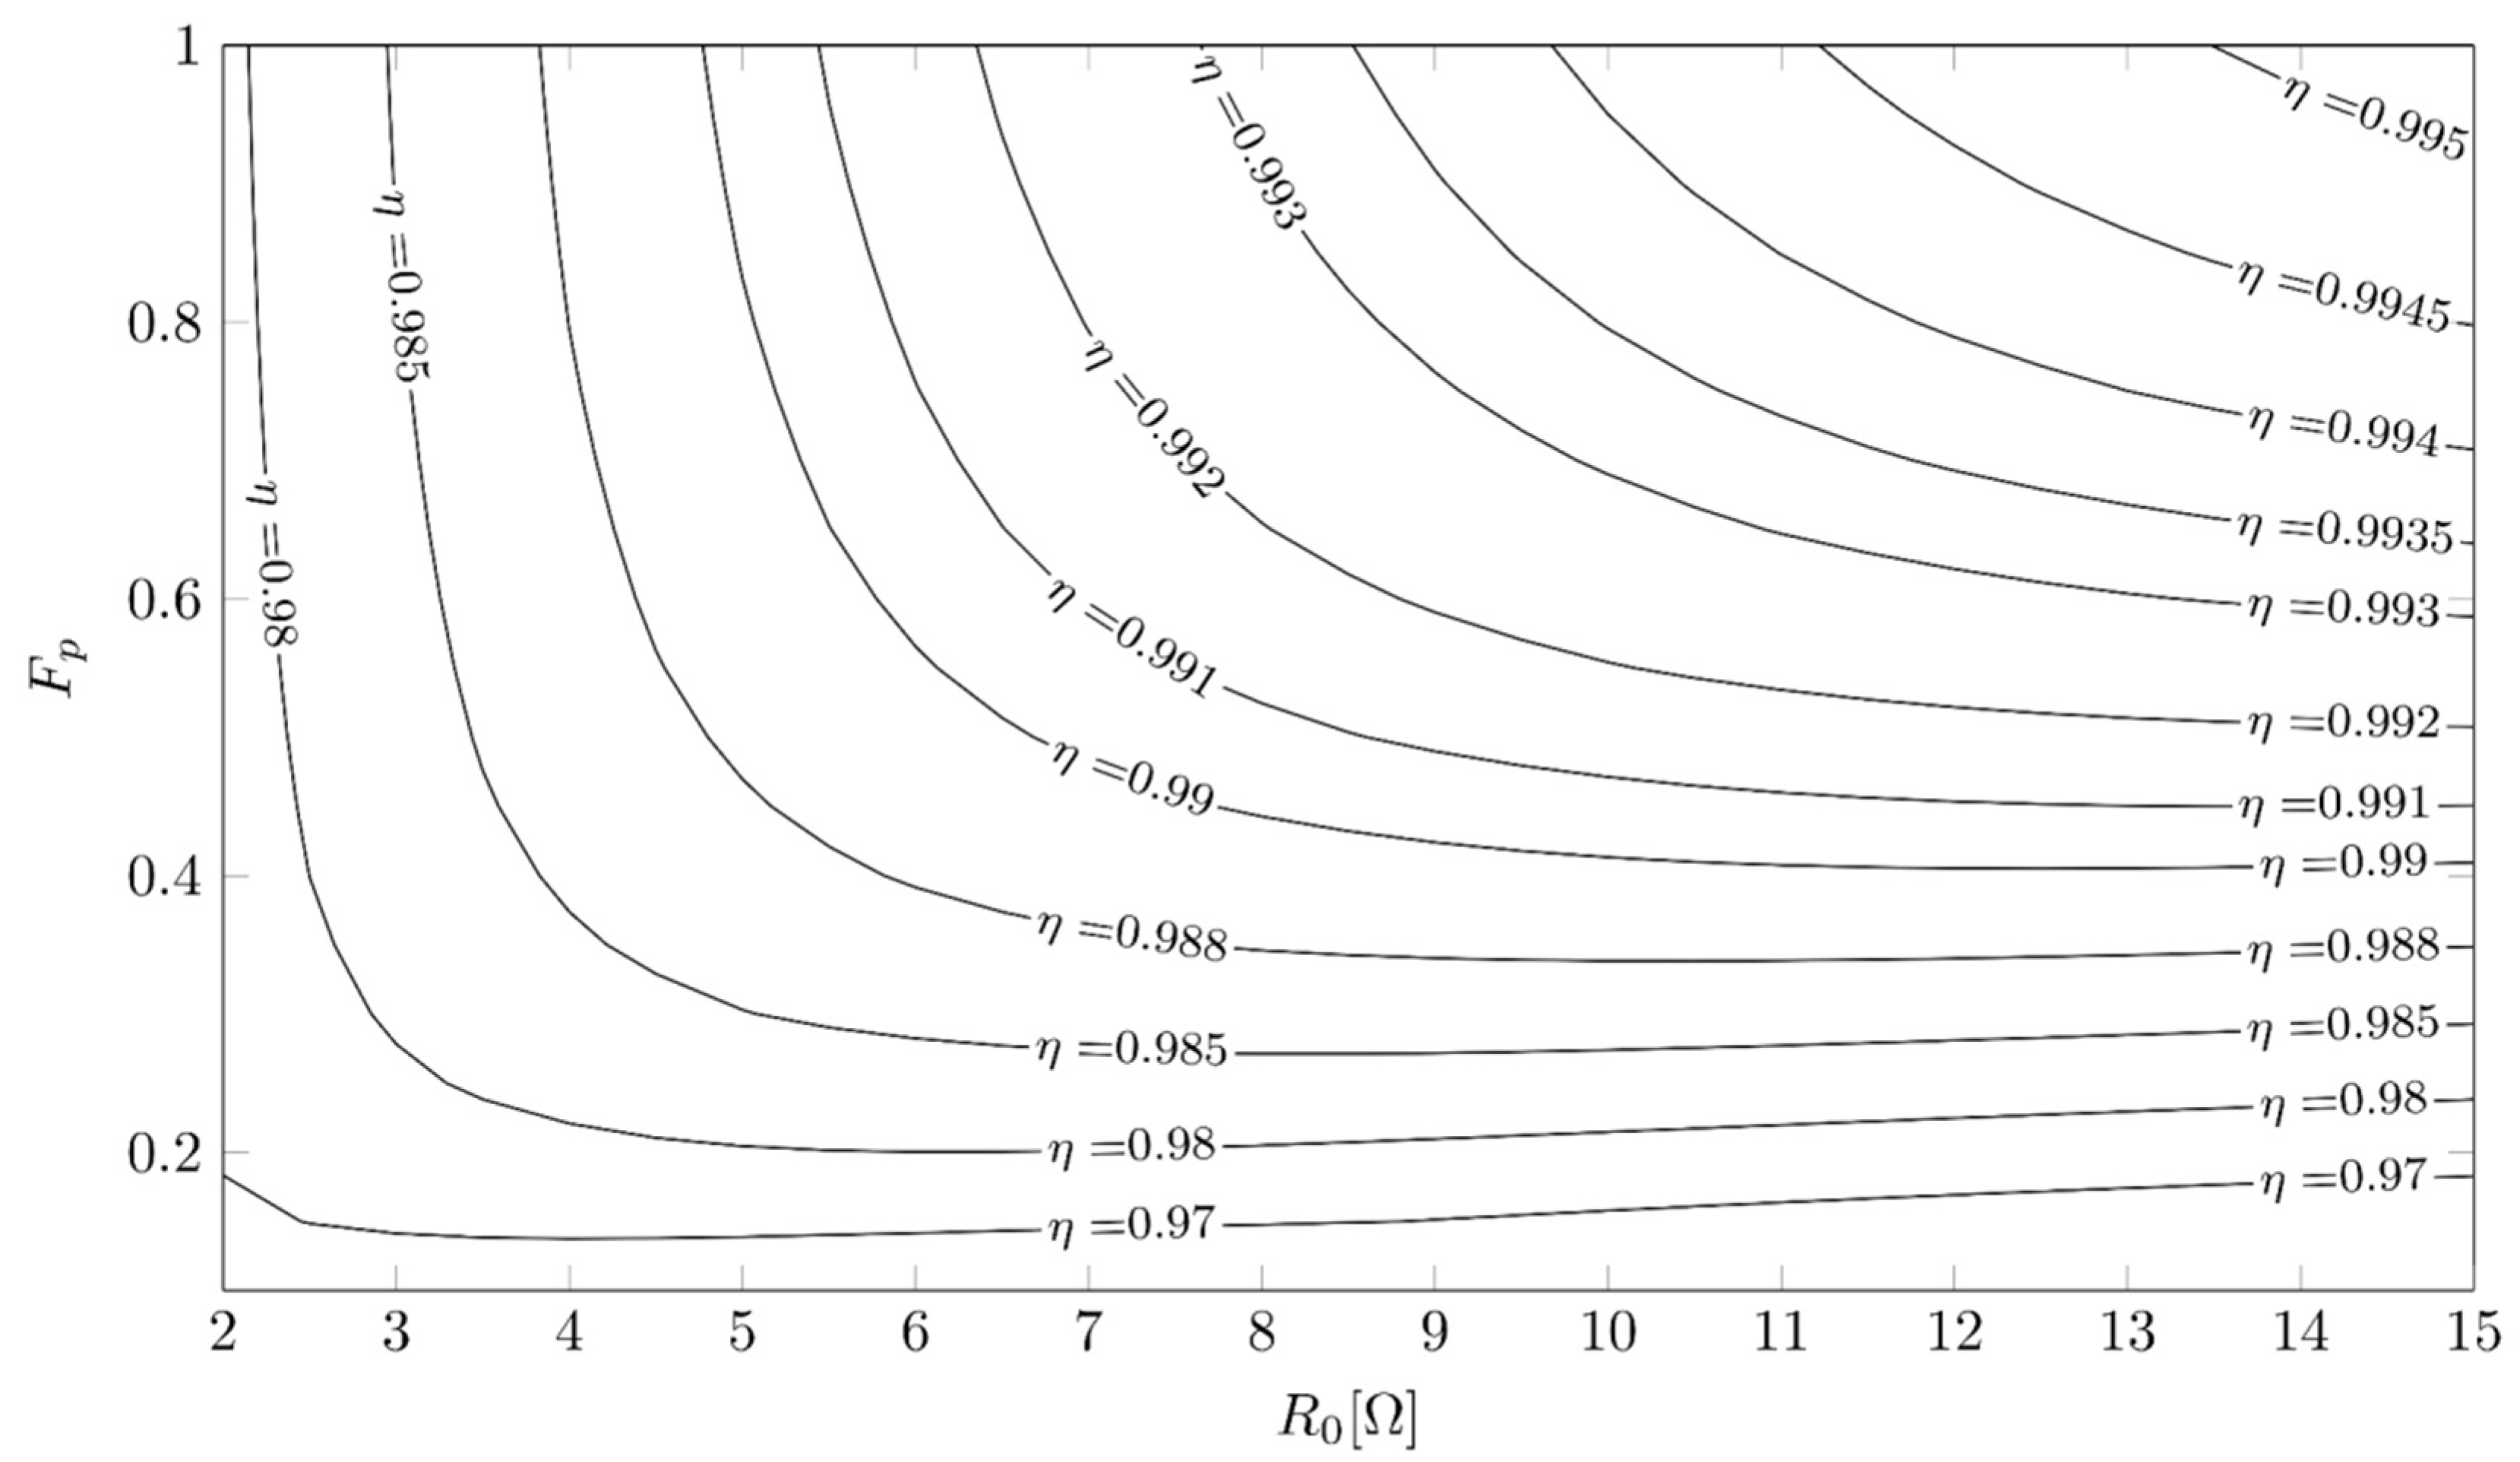
To close the analysis of the proposed loss formulation, a 3-phase SiC MOSFET inverter was considered where the properties of the semiconductor are given by the device S1 of Table 1. Considering a fixed modulation index m p = 1 and a voltage U D C = 600   the expected converter efficiency as a function of the load impedance Z 0 is depicted in Figure 7. These results can be quickly attained for a variety of semiconductors with little computational effort allowing to compare a wide range of semiconductors devices. This comparison would be unpractical using most physics based or behavioral models.
According to the results shown in Figure 7 an inverter designed and built with Wolfspeed C2M0040120D SiC MOSFET (S1) should be able to have an efficiency higher than 99.2% with a load with R 0 10 Ω and F p 0.7 .

4. Experimental Results

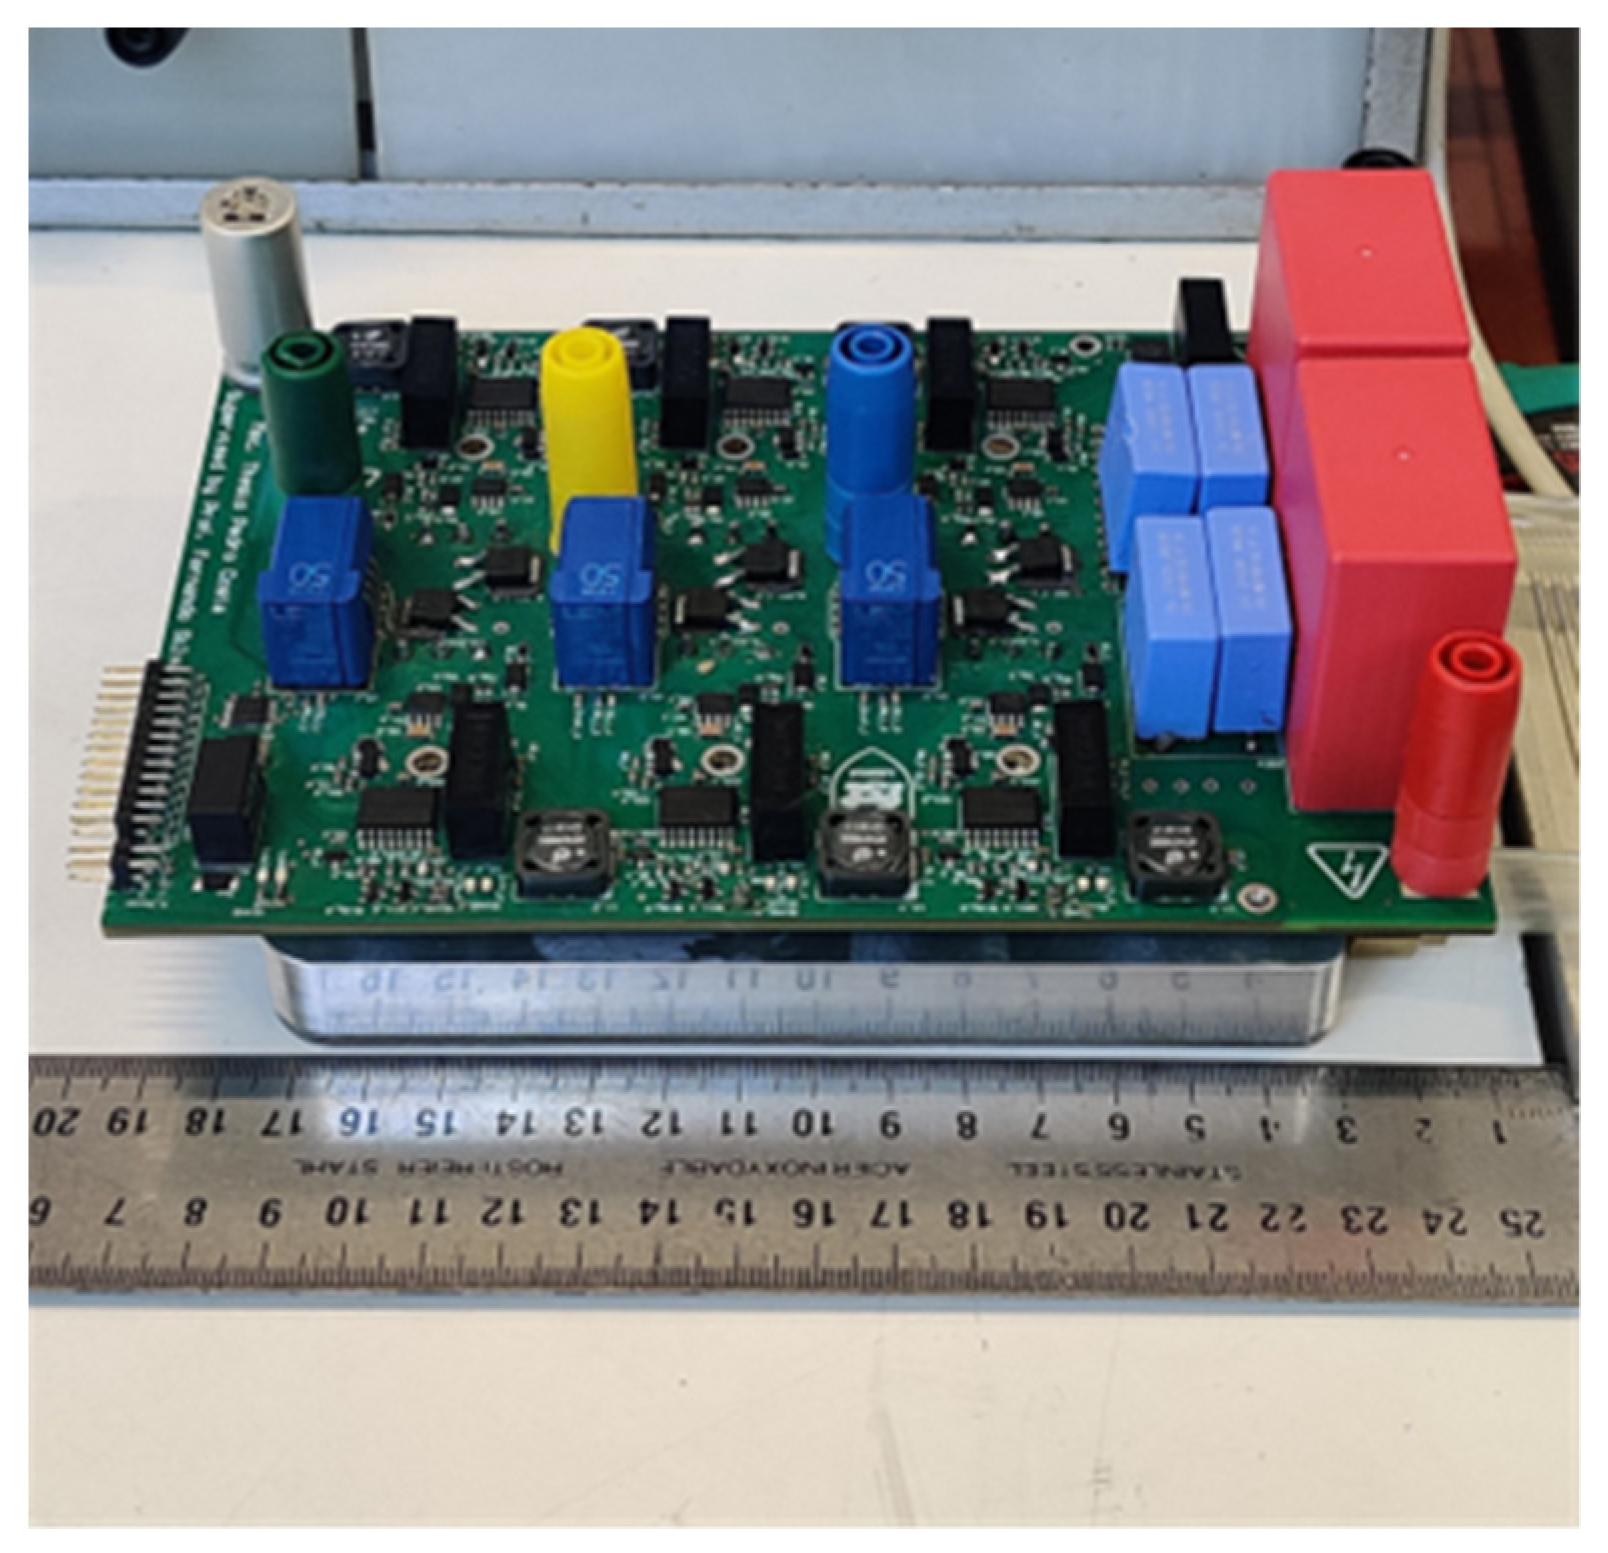
To obtain experimental validation a three-phase SiC-MOSFET inverter was built and designed with the semiconductor device S1. The resulting inverter is shown in Figure 8, with a resulting power density of 21 kW/L.
The inverter efficiency was measured at different output powers. Two test setups were performed. In the first test, at constant input DC voltage U D C = 600   V , the output power was varied using an adjustable power modulation index. In the second test, at a constant power modulation index m p = 1 , the output power was varied by changing the input DC voltage. The inverter efficiency was attained from the direct measurements of the input and output powers. During experiments, the temperature of the inlet water is kept at approximately the ambient temperature of 20 °C.
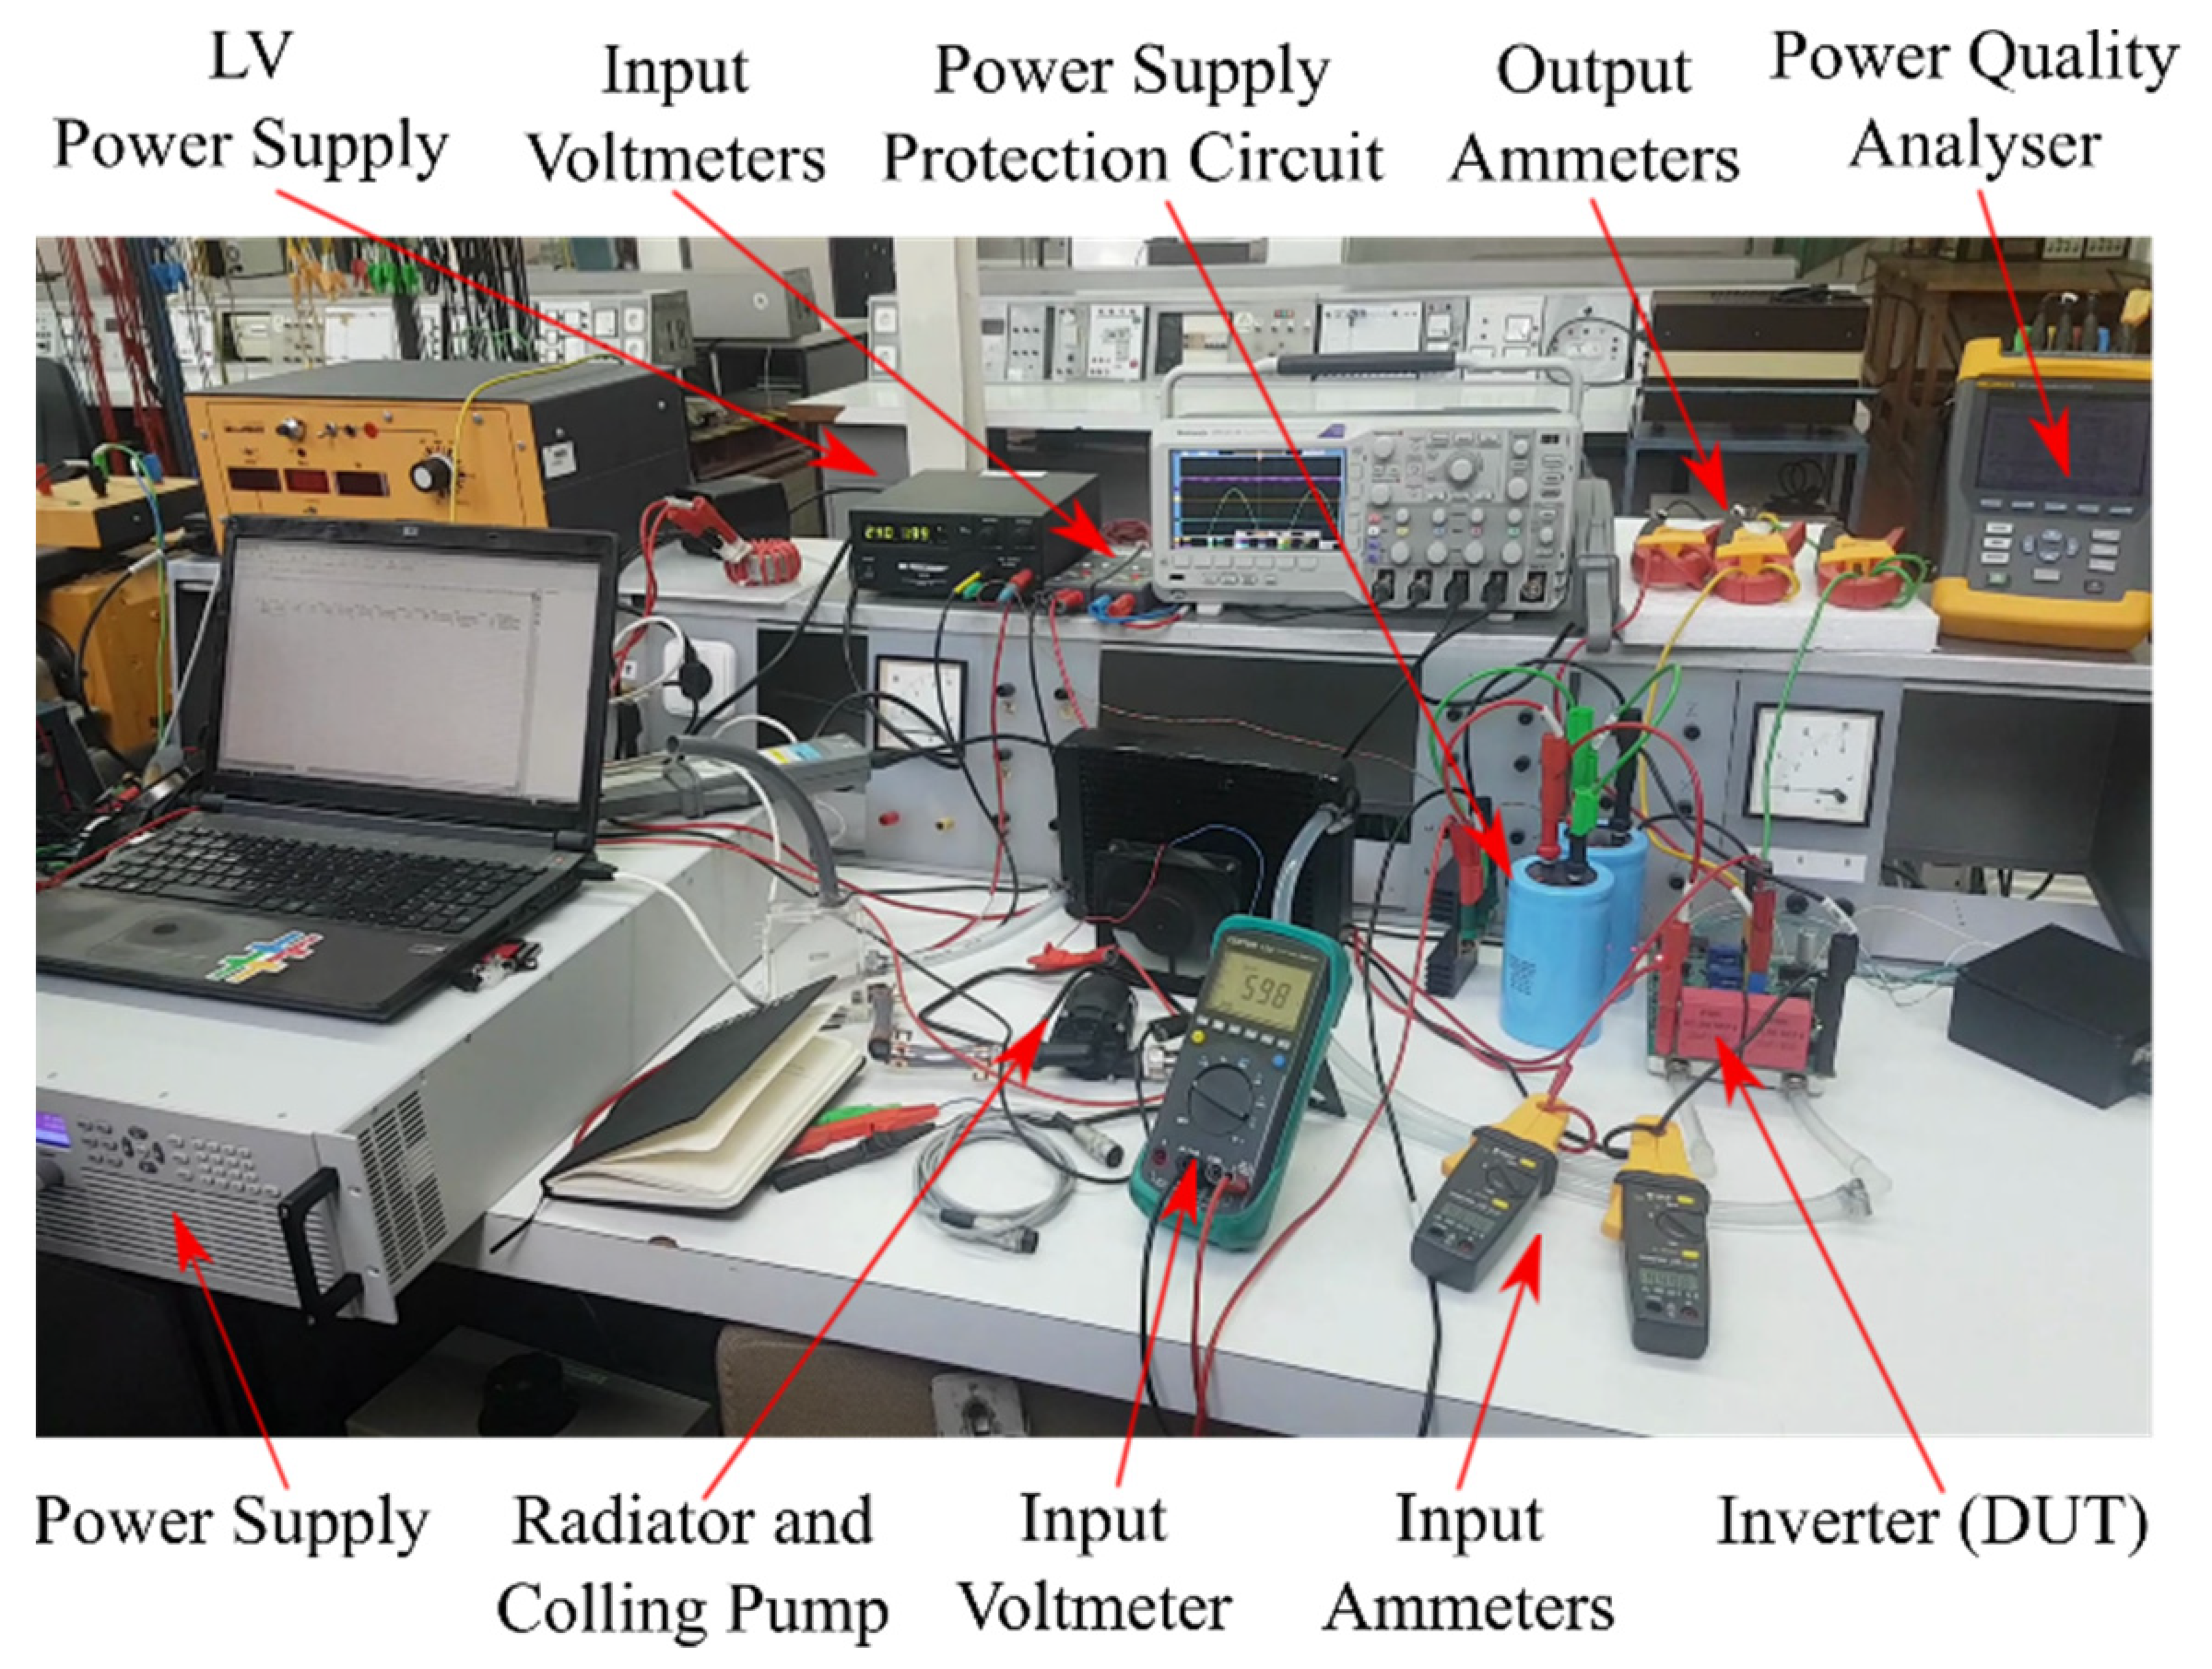
The experimental setup can be seen in Figure 9. It consists of a 15 kW power supply with embedded output voltage, current, and power measurement (Keysight N8955A), two additional current probes (Center 223 high-resolution clamp meter), a voltmeter (Center 122), the designed inverter system and the respective cooling circuit, a three-phase RL load and a power quality analyzer, Fluke 435-II.
All the experiments were made using a space vector pulsewidth modulation (SVM) with a switching frequency f s w = 20   kHz with a deadtime t d = 100   n s in order to obtain the predicted efficiency of 99.2%. Using the S1 device, higher switching frequencies led to lower efficiencies. An example of an acquisition set for increasing power with constant input voltage can be seen in Table 2 showing the obtained experimental efficiency η and the theoretically obtained efficiency using the approximation of (17), η t 1 , and using directly the influence of the deadtime as per (16), η 2 .
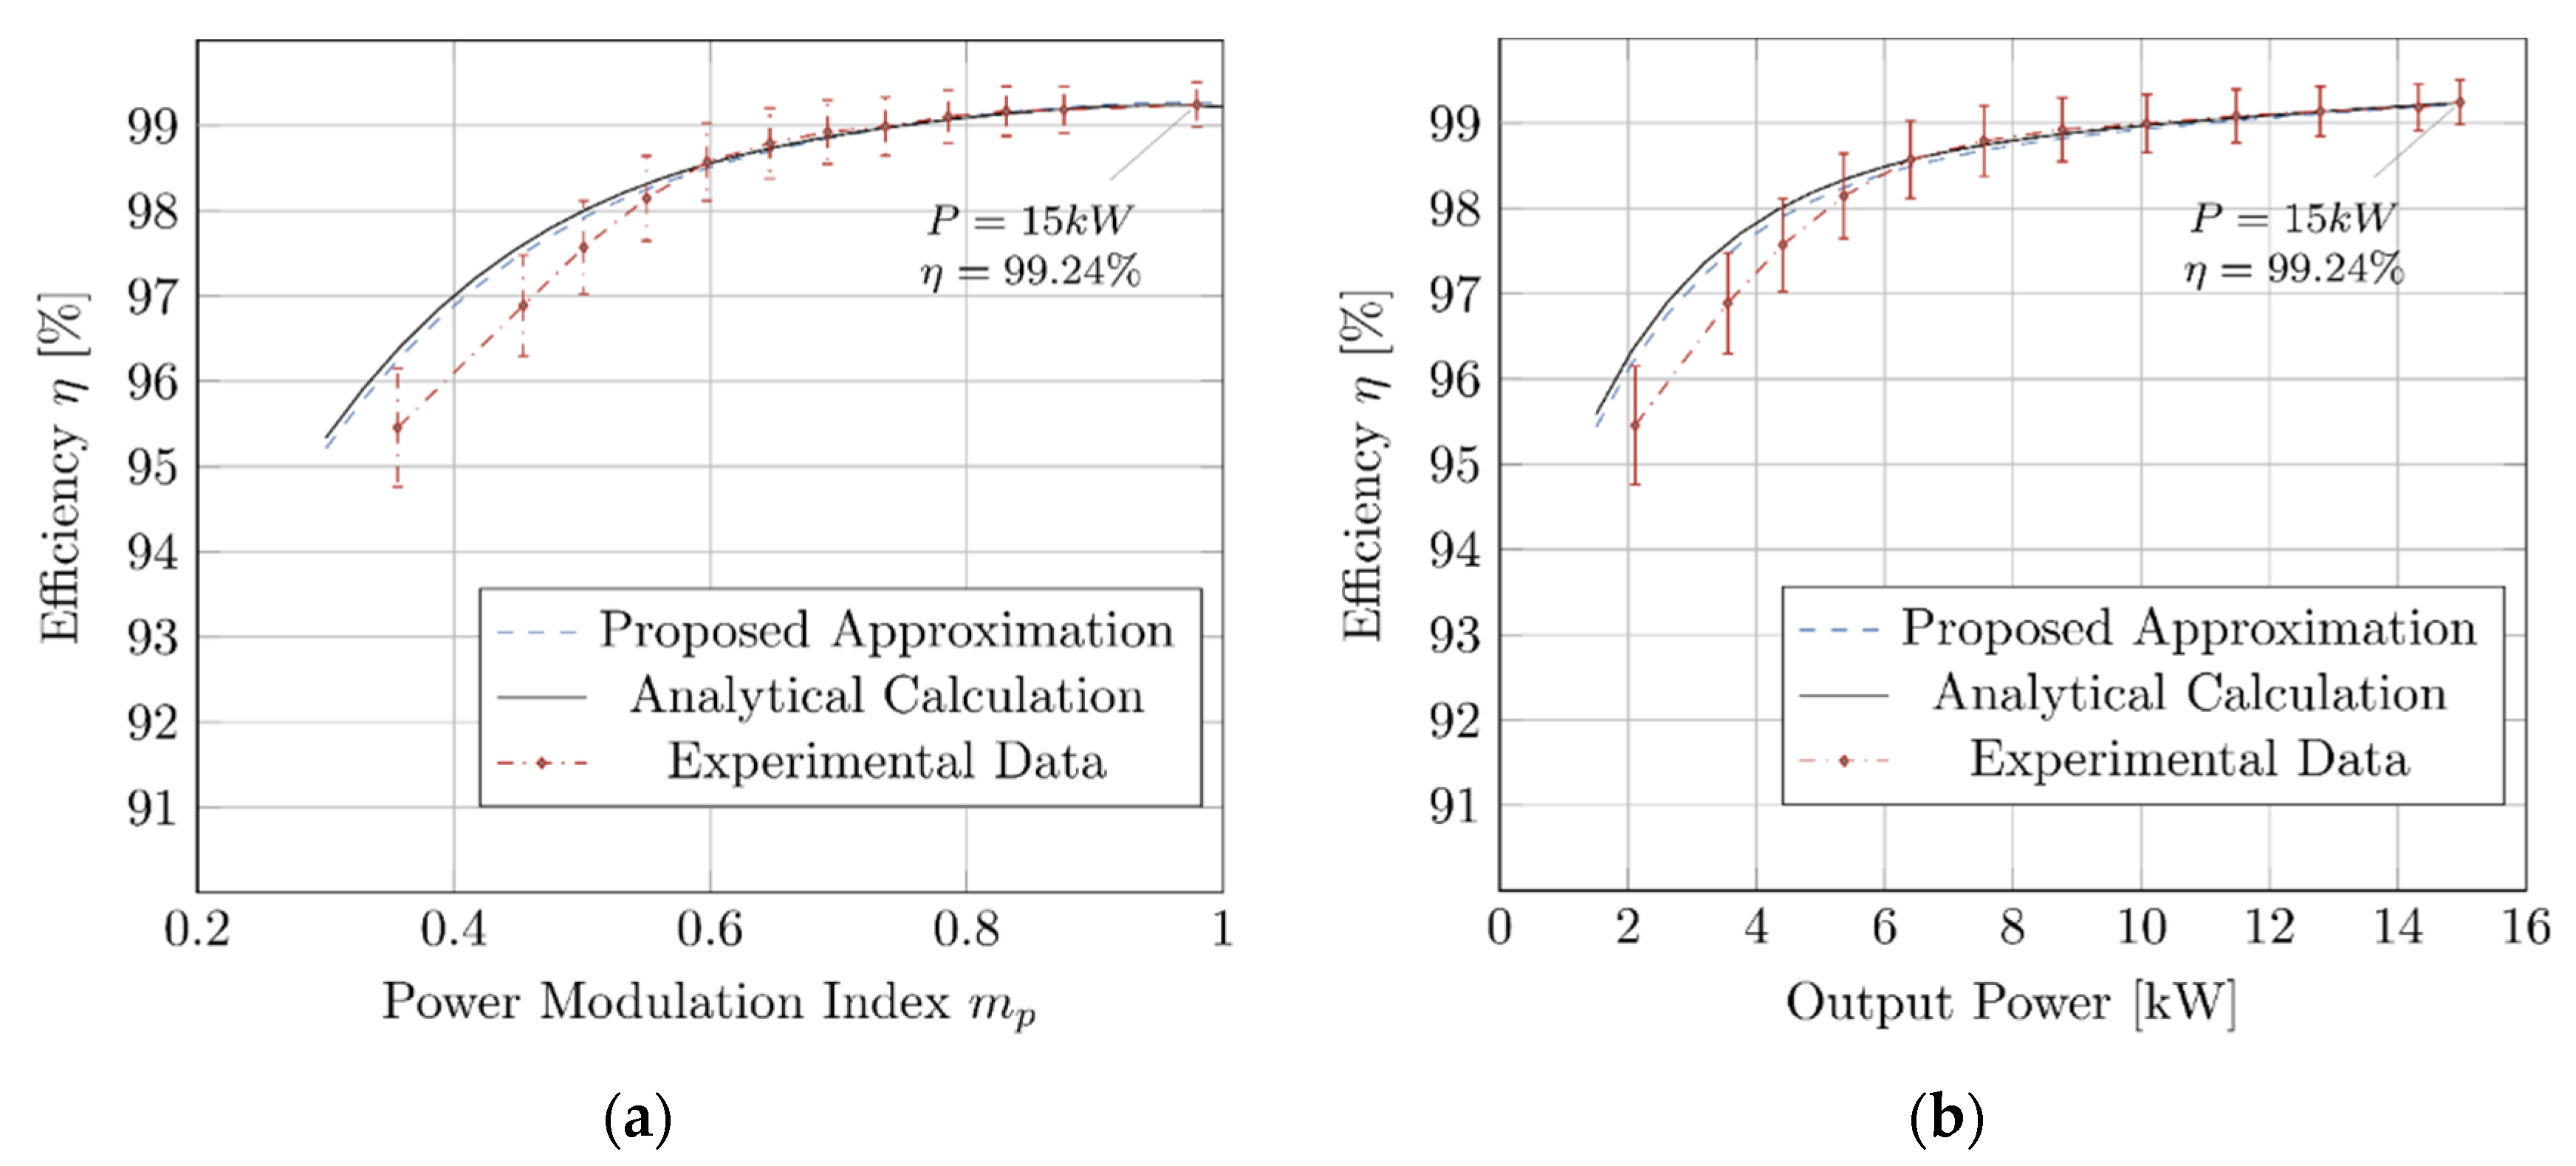
The comparison between the experimentally obtained efficiencies and the analytical calculations obtained from the loss formulations are graphically depicted in Figure 9, the presented measurement errors are further discussed in Appendix B which discusses the uncertainty analysis.
The results shown in Figure 10 compare the experimental results with the proposed analytical formulation. The solid line represents the expected efficiency when computing the switching losses as per (16). The dashed line represents the proposed approximation of the switching losses as per (17). The results show that the proposed approximation closely follows the analytical formulation that depends on the deadtime.
From around 5 kW to 15 kW, the deviation is lower than 0.2%, corresponding to modulation indexes higher than 0.5; however, for lower output powers, the measured efficiencies are lower than the ones predicted (nearly 1% prediction error). Despite being within the estimated measurement uncertainty there is a clear trend for higher deviation in lower modulation indexes. Three main factors are pointed out as potential reasons for this difference: 1—The proposed formulation only accounts for the semiconductor losses not considering other losses sources such as the input capacitors, drivers, and corresponding isolated power supplies, whose losses start to be significant at lower output powers; 2—For lower modulation indexes, the approximation for the deadtime influence considered in Appendix A can be insufficient if, for most of the fundamental output period, the deadtime is not enough to circulate the energy between the two capacitors; 3—The analytical results assume a constant load, therefore excluding small variations due to load different operating temperatures.
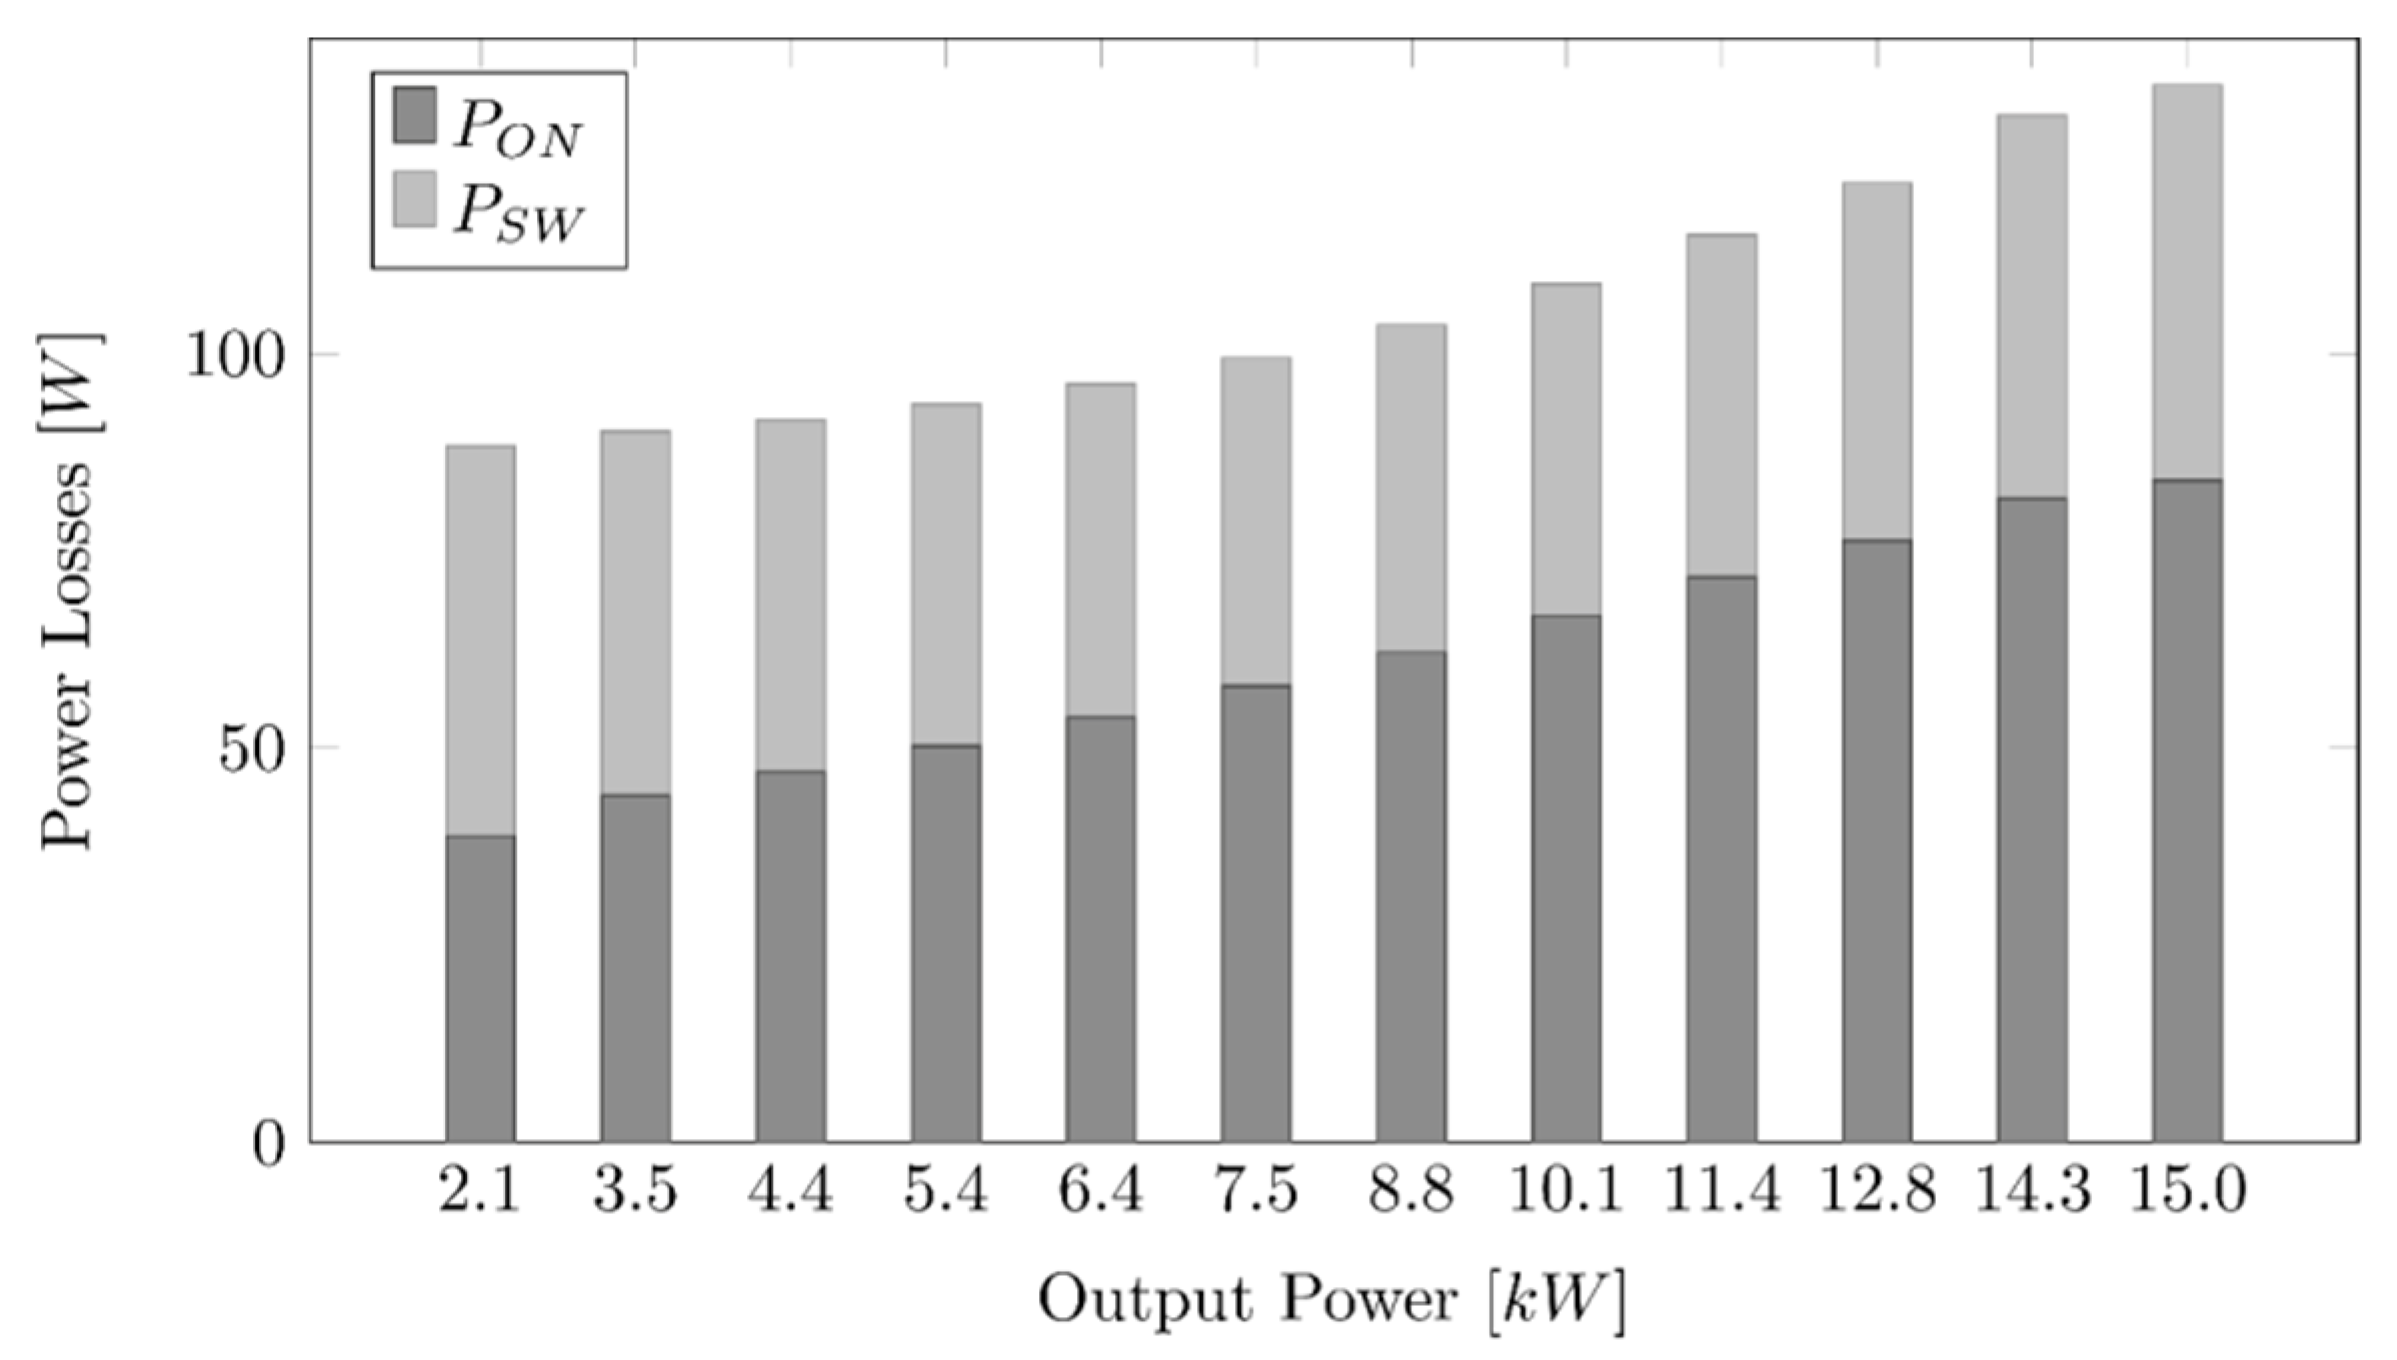
The distinct contribution of the switching and conduction losses for the results obtained in Figure 10 can be seen in Figure 11 computed according to the proposed analytical formulation. These results can provide insight to the designer on potential efficiency gains. As expected, the switching losses have a higher relative contribution for lower output powers where the influence of the deadtime in the switching losses is higher.
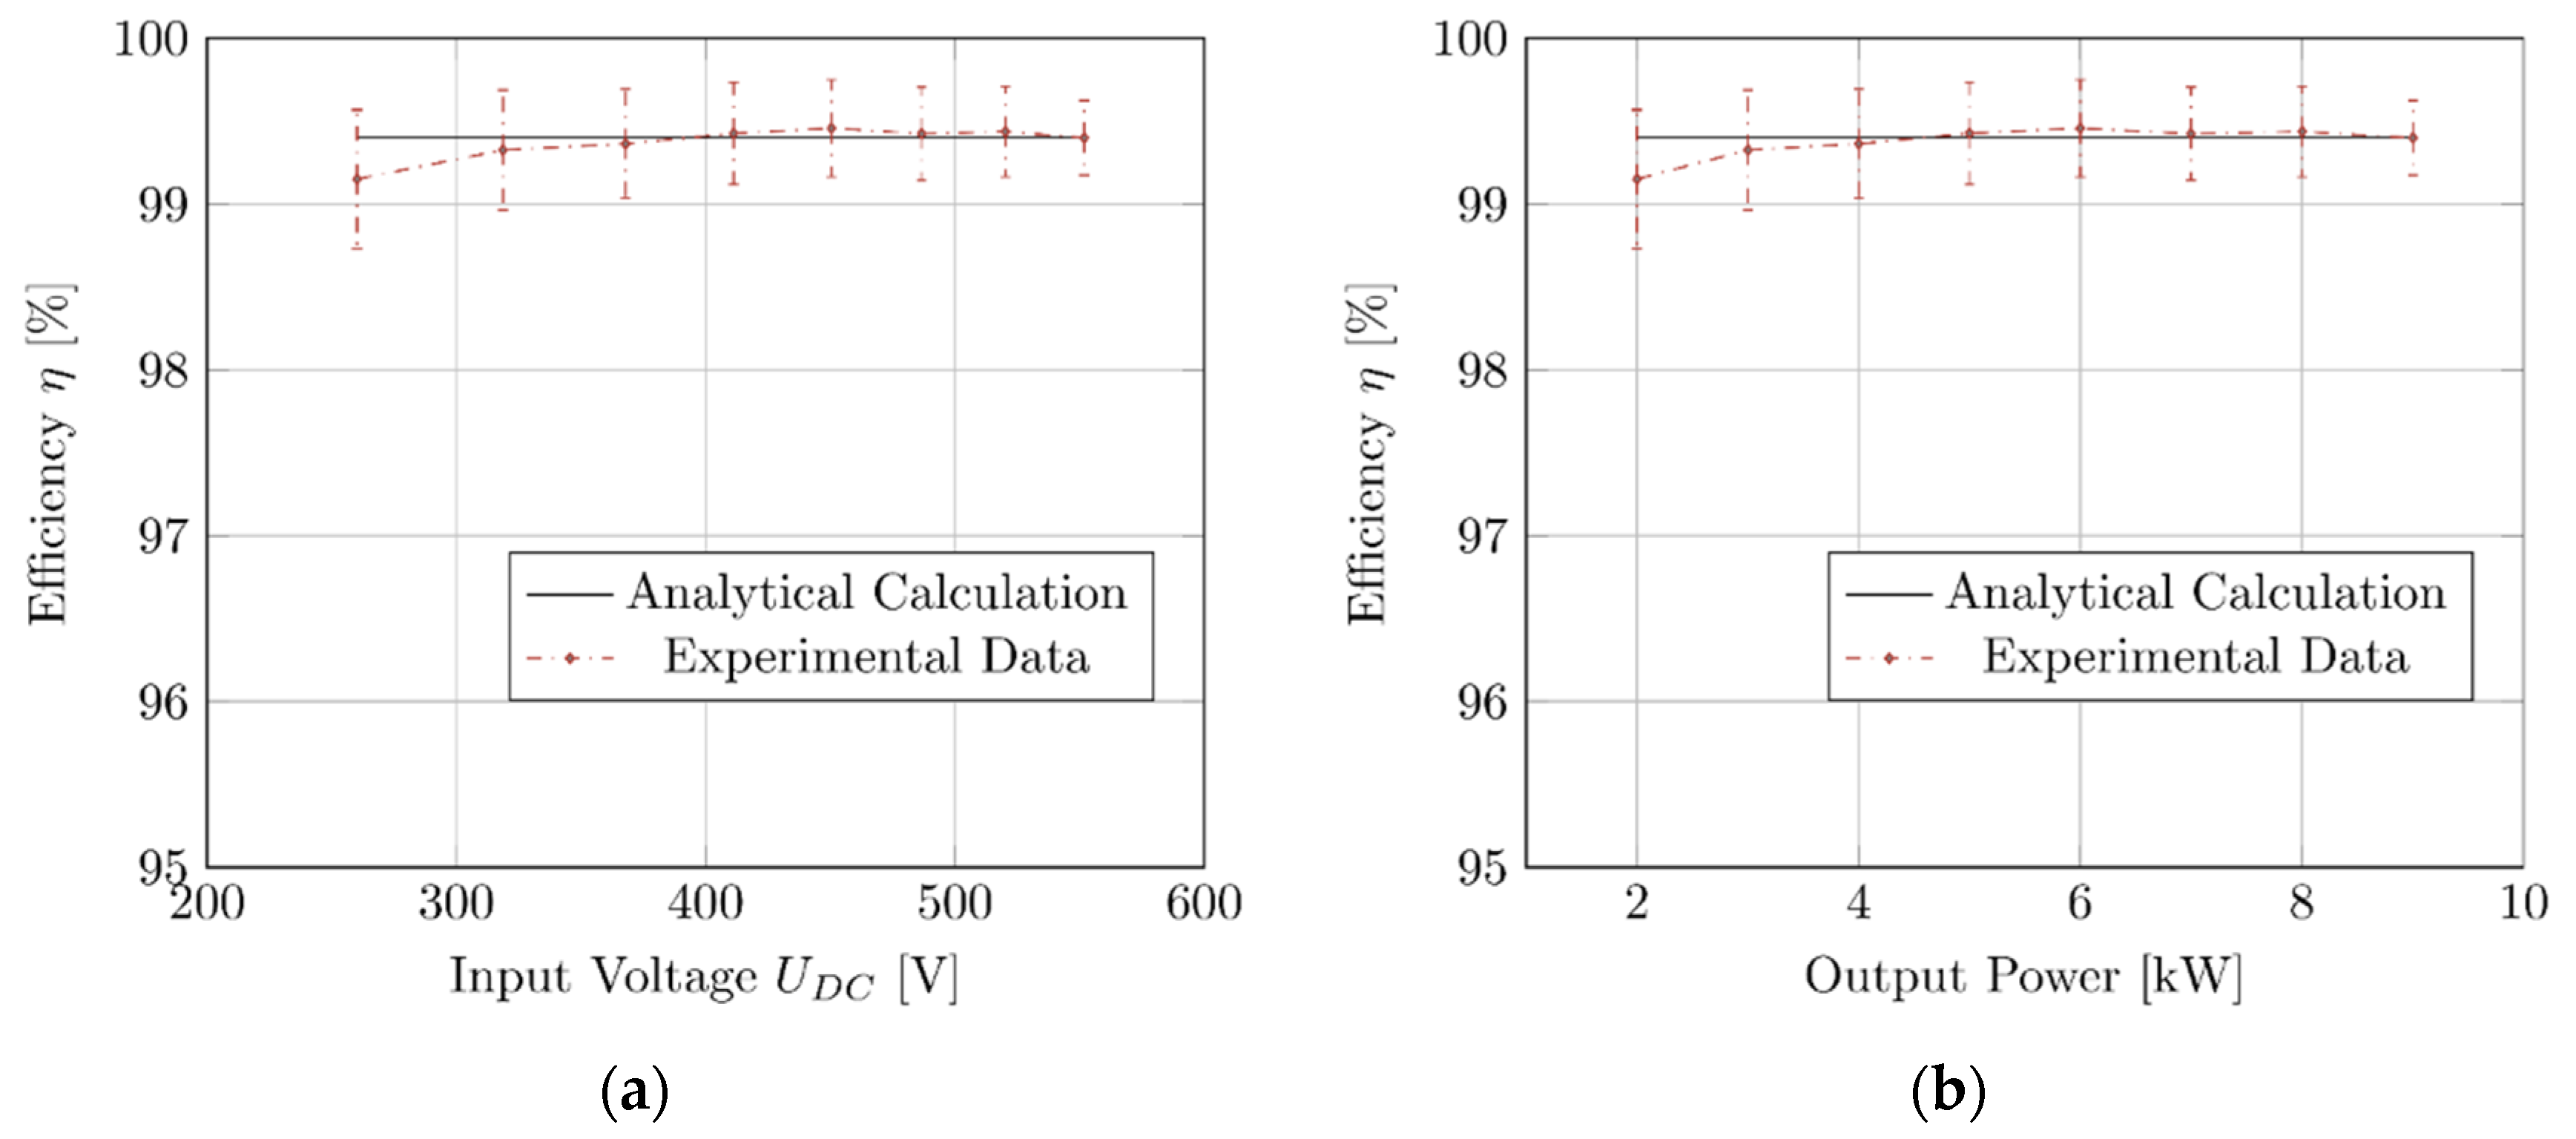
Figure 12 shows the obtained results for an experimental setup where the output power was varied by increasing the DC input voltage with a constant power modulating index m p , and a constant output impedance Z 0 . Once again, there is a visible deviation (but within measurement uncertainty) of around 0.2% for smaller input voltages (Figure 12a), but a closer prediction for output powers higher than 4 kW (Figure 12b). Notice that according to (22), the efficiency should hold constant; the discrepancies for lower output powers are once again justified mainly from additional losses besides the semiconductor losses and not accounted for in the analytical formulation.

5. Conclusions

This work proposed an efficiency-oriented formulation for SIC semiconductor selection and efficiency prediction of a three-phase inverter considering the semiconductor losses. The formulation is suited for the correct sizing of the semiconductors to attain a given efficiency goal, using only the SiC manufacturers data and required output power and load. The formulation considers the influence of the THD in the conduction losses as well as the influence of the deadtime in the switching losses. These results are of practical validity for an early sizing of the semiconductor parameters for a given target efficiency or to evaluate the potential efficiency for a given semiconductor.
The proposed formulation does not make assumptions on the modulation schema or controller making only use of the application-specific parameters (input and output voltages, output power …) and semiconductor characteristics ( t o n ,   t o f f ,   R D S o n ) making an even more practical approach for early design stage semiconductor sizing.
A SiC MOSFET inverter was built and planned for a target efficiency (at the nominal operating point) of at least 99.2% using the proposed sizing method. A set of experimental measurements of efficiency was made for a varying output power with a varying modulation index, and a varying output power with a varying input voltage, both with constant loads. Results of said measurements were compared with predictions taken from the proposed formulation. Nominal output power led to an efficiency around 99.2% with estimation errors smaller than 0.1%.

Author Contributions

Conceptualization, P.C. and J.F.S.; methodology, P.C. and J.F.S.; software, P.C.; validation, P.C.; formal analysis, P.C. and J.F.S.; investigation, P.C., J.F.S. and S.P.; resources, P.C., J.F.S. and S.P.; data curation, P.C.; writing—original draft preparation, P.C.; writing—review and editing, J.F.S. and S.P.; visualization, P.C.; supervision, J.F.S. and S.P.; project administration, J.F.S.; funding acquisition, J.F.S. and S.P. All authors have read and agreed to the published version of the manuscript.

Funding

This work was supported through funds from Fundação para a Ciência e Tecnologia (FCT) with project reference UIDB/50021/2020 and PTDC/EEI-EEE/32550/2017 and by a FCT PhD grant with reference SFRH/BD/146591/2019.

Data Availability Statement

No new data were created or analyzed in this study. Data sharing is not applicable to this article.

Conflicts of Interest

The authors declare no conflict of interest.

Appendix A

Assuming a constant load current during the commutation time and rise and fall voltages across the SiC MOSFET with constant slopes, the minimum output current, i L m i n that can discharge one output capacitance, C T , and charge another output capacitance C T is given by:
i L min = 2 C T U D C t d
Describing a single-phase current as 2 I o r m s sin ( ω t ) equaling to the current i L m i n and solving for time yields:
2 I o r m s sin ( ω t ) = I c t c = arcsin ( I c / 2 I o r m s ) / ω
The time t c represents the time at which the output phase current equals the minimum current i L m i n . Replacing (A1) in (A2) and using the relation for I o r m s described in (6) it is possible to further simplify t c to:
t c = arcsin ( 2 C T U D C 6 Z o 2 m p U D C t d ) / ω = arcsin ( 2 3 C T Z o m p t d ) / ω
During a full period of the output current wave the time portion, τ , where the output current is not enough to fully charge and discharge the output parasitic capacitances is given by:
τ = 4 t c T = 4 arcsin ( 2 3 C T Z o m p t d ) 1 2 π f s w T = 2 π arcsin ( 2 3 C T Z o m p t d )
Considering that Z 0 = R 0 / F p then:
τ = 2 π arcsin ( 2 3 C T R 0 m p F p t d )
Finally following the same the same methodology as the one presented for the switching losses it can be assumed that an additional set of 3 commutations needs to be considered. This can be performed with the same formulation presented above with the additional factor of τ and ½. The τ factor represents the fraction of the output period that the additional commutations are taking place. The ½ factor is justified because for these additional commutations the capacitors voltages have been partially discharged/charged during the deadtime which on average results that the switching is conducted with half of the U D C voltage.
P S W a P o = 1 2 ( P S W l P o + P S W C P o ) τ = ( 3 2 π m p F P t f u + t r i T + 3 C T Z 0 m p 2 F p T ) ( 2 arcsin ( 2 3 C T Z o m p t d ) / π )

Appendix B

Efficiency was computed as the quotient between the output and input measured powers. The input power measurement was made indirectly through the measurement of the input voltage and input current which were both measured with multiple devices and multiple samples per device.
The input current was measured using the embedded measurement of the power supply with an uncertainty Δ i 1 = 60   mA and two current clamp meters with an uncertainty Δ i 2 , 3 = 1 % i x + 5   mA where i x is the measured value of the current for each current clamp meter.
The input voltage is measured by a similar process, using the embedded measurement of the power supply with an uncertainty Δ v 1 = 1.5   V and two voltmeters with uncertainties Δ v 2 , 3 = 0.2 % v x + 0.2   V where v x is the measured voltage. The output power was measured by a direct power measurement with Δ p a c 1 = 1 % p a c x where p a c x is the measured power and by the measurement of the RMS values of the current and voltage and the power factor with uncertainties Δ v a c = 0.1 % v a c x , Δ i a c = 0.25 % i a c x ± 0.05   A and Δ F P = 0.1 % F P x where v a c x ,   i a c x and F P x are the measurements of the AC voltage, AC current, and power factor respectively.
The final measurement for each quantity is obtained through a weighted mean with the form:
x ¯ = j = 1 k α j x j , α i = Δ j 1 l = 1 k Δ l 1 , j = 1 , , k
where Δ j is the uncertainty associated with the measurement j , and k is the total number of measurements including the measurements from different equipment. Notice that   α j = 1 . The combined uncertainty for each measurement is then given by [34]:
Δ ¯ j = 1 i = 1 k 1 / Δ i 2
To obtain the uncertainty of the input power measurement the uncertainty propagation must be taken into account, the relative uncertainty of the input power measurement can be given by:
Δ ¯ p p ¯ = ( Δ ¯ v v ¯ ) 2 + ( Δ ¯ i i ¯ ) 2
The output power relative uncertainty is given as a combination of direct power measurement uncertainty and the uncertainty from the power computed through the output voltage current and power factor using (A7) and (A8), where Δ p a c 2 is obtained by:
Δ ¯ p a c 2 p ¯ a c = ( Δ ¯ v a c v ¯ ) 2 + ( Δ ¯ i a c i ¯ ) 2 + ( Δ ¯ F P F P ¯ ) 2
The uncertainty of the efficiency measurement can be obtained by the propagation of the relative uncertainties through the quotient of the powers:
Δ η η ¯ = ( Δ ¯ p p ¯ ) 2 + ( Δ ¯ p a c p ¯ a c ) 2
Since the absolute uncertainties depend on the measured values the efficiency uncertainty varies along the power profile, with a maximum absolute value of 0.81% at the lower output powers, and a minimum of 0.26% at the maximum value.
Each of the results in Figure 10 and Figure 12 depicts the obtained uncertainties for each measurement along the output power variation. Notice that the higher the output power the lower the uncertainty.
To further reduce the uncertainty of the measured efficiency other measurement methods should be considered, such as the indirect measurement of the losses through temperature increase [35,36].
It is important to notice that the experimental data and uncertainty are related to the total power losses, while the analytical data only accounts for the losses of the MOSFETS justifying the difference for lower output powers.

References

  1. Furuhashi, M.; Tomohisa, S.; Kuroiwa, T.; Yamakawa, S. Practical Applications of SiC-MOSFETs and Further Developments. Semicond. Sci. Technol. 2016, 31, 034003. [Google Scholar] [CrossRef]
  2. Rabkowski, J.; Peftitsis, D.; Nee, H.P. Silicon Carbide Power Transistors: A New Era in Power Electronics Is Initiated. IEEE Ind. Electron. Mag. 2012, 6, 17–26. [Google Scholar] [CrossRef]
  3. Biela, J.; Schweizer, M.; Waffler, S.; Kolar, J.W. SiC versus Si—Evaluation of Potentials for Performance Improvement of Inverter and DCDC Converter Systems by SiC Power Semiconductors. IEEE Trans. Ind. Electron. 2011, 58, 2872–2882. [Google Scholar] [CrossRef]
  4. Han, D.; Noppakunkajorn, J.; Sarlioglu, B. Comprehensive Efficiency, Weight, and Volume Comparison of SiC- and Si-Based Bidirectional Dc-Dc Converters for Hybrid Electric Vehicles. IEEE Trans. Veh. Technol. 2014, 63, 3001–3010. [Google Scholar] [CrossRef]
  5. She, X.; Huang, A.Q.; Ozpineci, B. Review of Silicon Carbide Power Devices and Their Applications. IEEE Trans. Ind. Electron. 2017, 64, 8193–8205. [Google Scholar] [CrossRef]
  6. Zhang, H.; Tolbert, L.M.; Ozpineci, B. Impact of SiC Devices on Hybrid Electric and Plug-in Hybrid Electric Vehicles. IEEE Trans. Ind. Appl. 2011, 47, 912–921. [Google Scholar] [CrossRef]
  7. Ding, X.; Cheng, J.; Chen, F. Impact of Silicon Carbide Devices on the Powertrain Systems in Electric Vehicles. Energies 2017, 10, 533. [Google Scholar] [CrossRef] [Green Version]
  8. Yin, S.; Tseng, K.J.; Tong, C.F.; Simanjorang, R.; Gajanayake, C.J.; Gupta, A.K. A 99% Efficiency SiC Three-Phase Inverter Using Synchronous Rectification. In Proceedings of the 2016 IEEE Applied Power Electronics Conference and Exposition (APEC), Long Beach, CA, USA, 20–24 March 2016; pp. 2942–2949. [Google Scholar] [CrossRef]
  9. Rabkowski, J.; Peftitsis, D.; Nee, H.P. Design Steps towards a 40-KVA SiC Inverter with an Efficiency Exceeding 99.5%. In Proceedings of the 2012 Twenty-Seventh Annual IEEE Applied Power Electronics Conference and Exposition (APEC), Orlando, FL, USA, 5–9 February 2012; pp. 1536–1543. [Google Scholar] [CrossRef]
  10. Zhu, J.; Kim, H.; Chen, H.; Erickson, R.; Maksimovic, D. High Efficiency SiC Traction Inverter for Electric Vehicle Applications. In Proceedings of the 2018 IEEE Applied Power Electronics Conference and Exposition (APEC), San Antonio, TX, USA, 4–8 March 2018; pp. 1428–1433. [Google Scholar] [CrossRef]
  11. Colmenares, J.; Peftitsis, D.; Sadik, D.; Nee, H. High-Efficiency Three-Phase Inverter with SiC MOSFET Power Modules for Motor-Drive Applications. In Proceedings of the 2014 IEEE Energy Conversion Congress and Exposition (ECCE), Pittsburgh, PA, USA, 14–18 September 2014; pp. 468–474. [Google Scholar]
  12. Chinthavali, M.; Ayers, C.; Campbell, S.; Wiles, R.; Ozpineci, B. A 10-KW SiC Inverter with a Novel Printed Metal Power Module with Integrated Cooling Using Additive Manufacturing. In Proceedings of the 2014 IEEE Workshop on Wide Bandgap Power Devices and Applications, Knoxville, TN, USA, 13–15 October 2014; pp. 48–54. [Google Scholar] [CrossRef]
  13. Olejniczak, K.; Flint, T.; Simco, D.; Storkov, S.; McGee, B.; Shaw, R.; Passmore, B.; George, K.; Curbow, A.; McNutt, T. A Compact 110 KVA, 140 °C Ambient, 105 °C Liquid Cooled, All-SiC Inverter for Electric Vehicle Traction Drives. In Proceedings of the 2017 IEEE Applied Power Electronics Conference and Exposition (APEC), Tampa, FL, USA, 26–30 March 2017; pp. 735–742. [Google Scholar] [CrossRef]
  14. Murakami, Y.; Tajima, Y.; Tanimoto, S. Air-Cooled Full-SiC High Power Density Inverter Unit. World Electr. Veh. J. 2013, 6, 669–672. [Google Scholar] [CrossRef] [Green Version]
  15. Yin, S.; Tseng, K.J.; Simanjorang, R.; Liu, Y.; Pou, J. A 50-KW High-Frequency and High-Efficiency SiC Voltage Source Inverter for More Electric Aircraft. IEEE Trans. Ind. Electron. 2017, 64, 9124–9134. [Google Scholar] [CrossRef]
  16. Zhang, C.; Srdic, S.; Lukic, S.; Kang, Y.; Choi, E.; Tafti, E. A SiC-Based 100 KW High-Power-Density (34 KW/L) Electric Vehicle Traction Inverter. In Proceedings of the 2018 IEEE Energy Conversion Congress and Exposition (ECCE), Portland, OR, USA, 23–27 September 2018; pp. 3880–3885. [Google Scholar] [CrossRef]
  17. Takao, K.; Shinohe, T. Demonstration of 25 W/cm3 Class All-SiC Three Phase Inverter. In Proceedings of the 2011 14th European Conference on Power Electronics and Applications, Birmingham, UK, 30 August–1 September 2011. [Google Scholar]
  18. Song, Q.; Wang, W.; Zhang, S.; Li, Y.; Ahmad, M. The Analysis of Power Losses of Power Inverter Based on SiC MOSFETs. In Proceedings of the 2019 IEEE 1st Global Power, Energy and Communication Conference (GPECOM2019), Nevsehir, Turkey, 12–15 June 2019; pp. 152–157. [Google Scholar]
  19. Mantooth, H.A.; Peng, K.; Santi, E.; Hudgins, J.L. Modeling of Wide Bandgap Power Semiconductor Devices—Part I. IEEE Trans. Electron Devices 2015, 62, 423–433. [Google Scholar] [CrossRef]
  20. Santi, E.; Peng, K.; Mantooth, H.A.; Hudgins, J.L. Modeling of Wide-Bandgap Power Semiconductor Devices—Part II. IEEE Trans. Electron Devices 2015, 62, 434–442. [Google Scholar] [CrossRef]
  21. Kraus, R.; Castellazzi, A. A Physics-Based Compact Model of SiC Power MOSFETs. IEEE Trans. Power Electron. 2016, 31, 5863–5870. [Google Scholar] [CrossRef]
  22. Wang, X.; Zhao, Z.; Li, K.; Zhu, Y.; Chen, K. Analytical Methodology for Loss Calculation of SiC MOSFETs. IEEE J. Emerg. Sel. Top. Power Electron. 2019, 7, 71–83. [Google Scholar] [CrossRef]
  23. Peng, K.; Eskandari, S.; Santi, E. Analytical Loss Model for Power Converters with SiC MOSFET and SiC Schottky Diode Pair. In Proceedings of the 2015 IEEE Energy Conversion Congress and Exposition, ECCE 2015, Montreal, QC, Canada, 20–24 September 2015; pp. 6153–6160. [Google Scholar]
  24. Ahmed, M.H.; Wang, M.; Hassan, M.A.S.; Ullah, I. Power Loss Model and Efficiency Analysis of Three-Phase Inverter Based on SiC MOSFETs for PV Applications. IEEE Access 2019, 7, 75768–75781. [Google Scholar] [CrossRef]
  25. Li, X.; Li, X.; Liu, P.; Guo, S.; Zhang, L.; Huang, A.Q.; Deng, X.; Zhang, B. Achieving Zero Switching Loss in Silicon Carbide MOSFET. IEEE Trans. Power Electron. 2019, 34, 12193–12199. [Google Scholar] [CrossRef]
  26. Wang, W.; Song, Q.; Zhang, S.; Li, Y.; Ahmad, M.; Gong, Y. The Loss Analysis and Efficiency Optimization of Power Inverter Based on SiC Mosfets under the High-Switching Frequency. IEEE Trans. Ind. Appl. 2021, 57, 1521–1534. [Google Scholar] [CrossRef]
  27. Szcześniak, P.; Grobelna, I.; Novak, M.; Nyman, U. Overview of Control Algorithm Verification Methods in Power Electronics Systems. Energies 2021, 14, 4360. [Google Scholar] [CrossRef]
  28. Novak, M.; Nyman, U.M.; Dragicevic, T.; Blaabjerg, F. Statistical Performance Verification of FCS-MPC Applied to Three Level Neutral Point Clamped Converter. In Proceedings of the 2018 20th European Conference on Power Electronics and Applications (EPE’18 ECCE Europe), Riga, Latvia, 17–21 September 2018. [Google Scholar]
  29. Kim, J.; Kim, K. 4H-SiC Double-Trench MOSFET with Side Wall Heterojunction Diode for Enhanced Reverse Recovery Performance. Energies 2020, 13, 4602. [Google Scholar] [CrossRef]
  30. Efthymiou, L.; Longobardi, G.C.G.; Udrea, F.; Lin, E.; Chien, T.; Chen, M. Zero Reverse Recovery in SiC and GaN Schottky Diodes: A Comparison. In Proceedings of the 2016 28th International Symposium on Power Semiconductor Devices and ICs (ISPSD), Prague, Czech Republic, 12–16 June 2016; pp. 71–74. [Google Scholar]
  31. Perruchoud, P.J.P.; Pinewski, P.J. Power Losses for Space Vector Modulation Techniques. In Proceedings of the Power Electronics in Transportation, Dearborn, MI, USA, 24–25 October 1996; pp. 167–173. [Google Scholar]
  32. Kolar, J.W.; Ertl, H.; Zach, F.C. Influence of the Modulation Method on the Conduction and Switching Losses of a PWM Converter System. IEEE Trans. Ind. Appl. 1991, 27, 1063–1075. [Google Scholar] [CrossRef]
  33. Agrawal, B.; Freindl, M.; Bilgin, B.; Emadi, A. Estimating Switching Losses for SiC MOSFETs with Non-Flat Miller Plateau Region. In Proceedings of the 2017 IEEE Applied Power Electronics Conference and Exposition (APEC), Tampa, FL, USA, 26–30 March 2017; pp. 2664–2670. [Google Scholar]
  34. Taylor, J.R. Introduction to Error Analysis, the Study of Uncertainties in Physical Measurements, 2nd ed.; University Science Books: New York, NY, USA, 1997. [Google Scholar] [CrossRef]
  35. Costa, P.B.C.; Silva, J.F.; Pinto, S.F. Experimental Evaluation of SiC MOSFET and GaN HEMT Losses in Inverter Operation. In Proceedings of the IECON 2019—45th Annual Conference of the IEEE Industrial Electronics Society, Lisbon, Portugal, 14–17 October 2019; pp. 6595–6600. [Google Scholar] [CrossRef]
  36. Christen, D.; Badstuebner, U.; Biela, J.; Kolar, J.W. Calorimetric Power Loss Measurement for Highly Efficient Converters. In Proceedings of the 2010 International Power Electronics Conference—ECCE ASIA, Sapporo, Japan, 21–24 June 2010; pp. 1438–1445. [Google Scholar] [CrossRef]
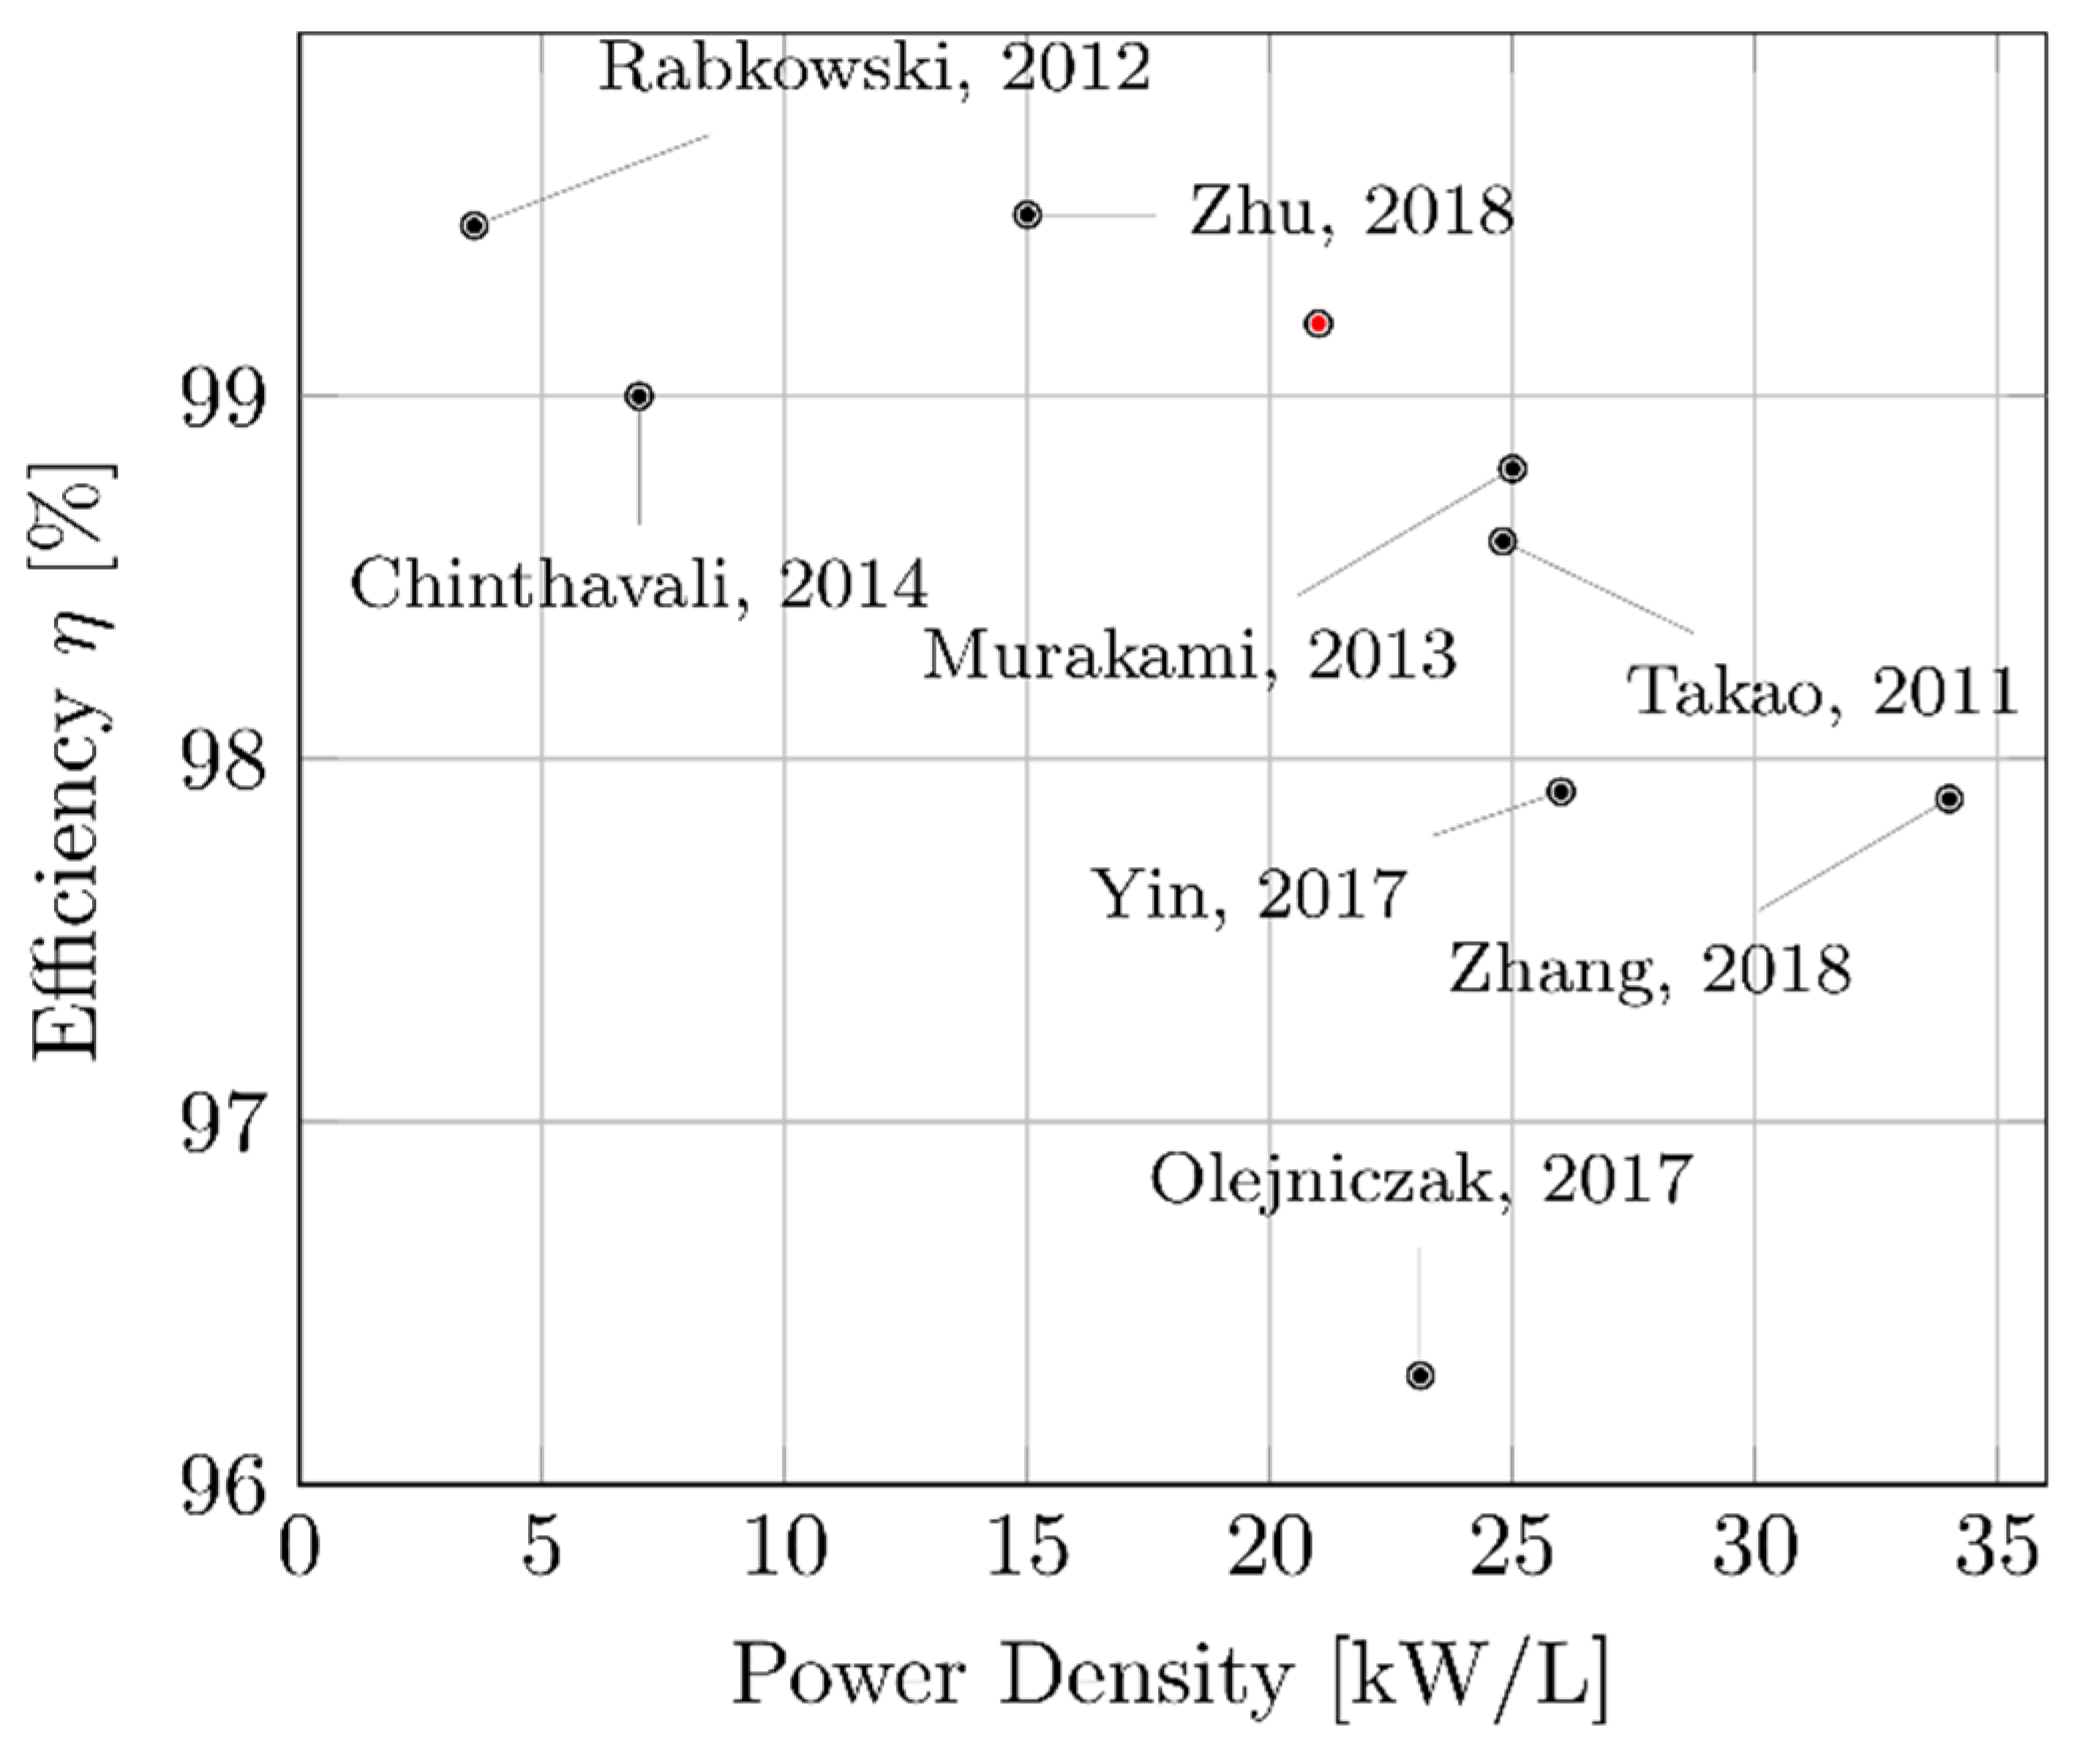
Figure 1. Map of efficiencies vs. power densities for inverters using SiC MOSFETs with the inverter developed to validate this work marked in red [9,10,11,12,13,14,15,16,17].
Energies 16 00818 g001
Figure 2. Simplified depiction of the turn-ON and turn-OFF process of a MOSFET device assuming constant derivatives for the channel current and the device drain to source voltage.
Energies 16 00818 g002
Figure 3. Depiction of the commutation process for an inverter leg with parasitic output capacitances and external SiC Diodes. (ac) Commutation from high side to low side with positive output current. (df) Commutation from high side to low side with negative output current. (gi) Commutation from low side to high side with positive output current. (jl) Commutation from high side to low side with negative output current.
Energies 16 00818 g003aEnergies 16 00818 g003b
Figure 4. Representation of the zones (in grey) where the combination of deadtime and output current are not enough to respectively charge and discharge the parasitic output capacitances of the SiC MOSFET and SiC Diode in a inverter leg configuration.
Energies 16 00818 g004
Figure 5. Relation between the SiC MOSFET turn-ON plus turn-OFF times with the channel ON-state resistance for a minimum efficiency of 99.3% at diffent values of the load resistance at constant power factor and modulation index. ( R 0 resistance in Ω ).
Energies 16 00818 g005
Figure 6. Relation between the SiC MOSFET turn-ON plus turn-OFF times with the channel ON-state resistance for a minimum efficiency of 99.3% at diffent values of the load power factor with a constant output load resistance and modulation index.
Energies 16 00818 g006
Figure 7. Analytically obtained efficiency of a 3 phase SiC MOSFET Inverter with device S4 from Table 1 as a function of the load impedance here divided in resistance and power factor.
Energies 16 00818 g007
Figure 8. Three-phase SiC MOSFET inverter under test with a water-cooled cooling plate. Ruler scale in cm.
Energies 16 00818 g008
Figure 9. Experimental laboratory setup used to attain the efficiency of the three-Phase SiC Inverter. The 15 kW loads are on the back of the test bench.
Energies 16 00818 g009
Figure 10. Efficiency vs. Power Modulation Index (a) and Output Power (b) comparison between experimental results (dashed) and analytical calculation.
Energies 16 00818 g010
Figure 11. Analytical estimation of the separate contribution of conduction and switching losses for the total losses measured in the experimental setup.
Energies 16 00818 g011
Figure 12. Efficiency vs. Input Voltage (a) and output power (b) comparison between experimental results (dashed) and analytical calculation (solid).
Energies 16 00818 g012
Table 1. List of considered semiconductors and their respective properties shown in Figure 4.
Semiconductor V D S S
[V]
t o n + t o f f
[ns]
R D S o n   [ m Ω ] Coss
[pF]
S1-Wolfspeed C2M0040120D12007440171
S2-Wolfspeed C2M0025120D12007525224
S3-OnSemi NTBG040N120SC112008356139
S4-OnSemi NVH4L040N120SC1120010740137
S5-Wolfspeed CAS120M12BM2120011513980
S6-Infineon AIMW120R060M1H1200296058
Table 2. Example of the acquired and calculated quantities for the results presented in Figure 10.
U D C ¯  
[V]
m I D C ¯  
[A]
P i n ¯
[W]
P o u t ¯  
[W]
THD [%] η
[%]
η T 1
[%] [%]
η T 2
[%]
598.60.3563.848221021105.595.4596.23 [−0.82]96.37 [−0.96]
598.60.4546.318366935514.196.7797.49 [−0.74]97.61 [−0.87]
598.60.5017.720452144123.997.5797.94 [−0.37]98.03 [−0.47]
598.60.5509.298546553643.198.1598.20 [−0.06]98.28 [−0.14]
598.60.59711.010650064082.498.5798.46 [−0.11]98.53 [−0.05]
598.60.64712.913763875462.198.7998.67 [−0.11]98.72 [−0.07]
598.60.69214.963886587701.498.9298.83 [−0.09]98.87 [−0.05]
598.60.73717.16010,18610,0831.098.9998.97 [−0.02]98.99 [−0.05]
598.60.78619.48011,58311,4800.899.1099.05 [−0.05]99.07 [−0.04]
598.50.83121.63312,90212,7950.899.1799.12 [−0.05]99.13 [−0.04]
598.50.87624.15314,44214,3250.699.1899.15 [−0.03]99.16 [−0.02]
598.50.97825.20315,08714,9730.599.2499.23 [−0.01]99.23 [−0.02]
Disclaimer/Publisher’s Note: The statements, opinions and data contained in all publications are solely those of the individual author(s) and contributor(s) and not of MDPI and/or the editor(s). MDPI and/or the editor(s) disclaim responsibility for any injury to people or property resulting from any ideas, methods, instructions or products referred to in the content.