Article

Energy-Consumption Pattern-Detecting Technique for Household Appliances for Smart Home Platform

1
Italian National Agency for New Technologies, Energy and Sustainable Economic Development (ENEA), Lungotevere Thaon di Revel, 76, 00196 Rome, Italy
2
Department of Engineering and Applied Sciences, University of Bergamo, Viale Marconi 5, 24044 Dalmine, Italy
*
Author to whom correspondence should be addressed.
Energies 2023, 16(2), 824; https://doi.org/10.3390/en16020824
Submission received: 30 November 2022 / Revised: 22 December 2022 / Accepted: 23 December 2022 / Published: 11 January 2023
(This article belongs to the Topic IoT for Energy Management Systems and Smart Cities)

Abstract

:
Rising electricity prices and the greater penetration of electricity consumption in end-uses have prompted efforts to set up data-driven methodologies to optimise energy consumption and foster user engagement in demand-side management strategies. The performance of energy-management systems is greatly affected by the consumer behaviors and the adopted energy-management methodology. Consequently, it is necessary to develop appliance-level, detailed energy-consumption information models to inform citizens to improve behaviors toward energy use. The goal of the Home Energy Management System (HEMS) is to foster an ecosystem that is energy-optimized and can manage Internet of things (IoT) equipment over its network. HEMS allows consumers to reduce energy costs by adapting their consumption to variable pricing over the day. With the use of descriptive data-mining techniques, we have developed a numerical model that gives consumers access to information on their domestic appliances with regard to the number and duration of operations, cycles disaggregation for appliances that have cyclic operation (e.g., washing machine, dishwasher), and energy consumption throughout various time periods basing on 15-min monitoring data. The model has been calibrated and validated on two datasets collected by ENEA by real-time monitoring of Italian dwellings and has been tested over several appliances showing effective analysis of the energy-consumption patterns. Therefore, it has been integrated in the DHOMUS IoT platform, developed by ENEA to monitor and analyse the energy consumption in dwellings in order to increase citizens’ engagement and awareness of their energy consumption. The results indicate that the developed model is sufficiently accurate, and that it is possible to promote a more virtuous and sustainable use of energy by end users, as well as to reduce the energy demand as required by the current European Council Regulation (EU) 2022/1854.

1. Introduction

Domestic energy consumption is estimated to account for 30–40% of worldwide generation [1] and it is expected to increase as more appliances and electronic devices are utilized. Moreover, buildings contribute to one-third of worldwide final CO2 emissions, thus urging a substantial reduction of both consumption and emissions in this sector [2]. Therefore, energy efficiency has become one of the most important challenges. According to statistics [3], customer engagement and awareness of better energy-consumption habits make a considerable difference in energy reduction [4]. Consumers should be given individual load-level consumption information rather than aggregated consumption information [5]. By raising customer knowledge on the usage habits of domestic appliances, appliance-level energy information can significantly contribute to reducing energy consumption [6]. Home energy-management systems (HEMS) can be an effective solution [7] by enabling a set of long-term smart energy-saving applications [8]. They provide visual feedback to consumers in the form of energy-use statistics, utility-driven automation and control, load forecasting, and optimum load-scheduling strategies [9]. With smart meters and sensors that can measure real-time power consumption, monitoring power consumption has become easier with the help of signal-processing methods [10]. The Internet of things (IoT) adds a new degree of machine-to-machine communication to the interactions between humans and apps. The advancement of new communication technologies and smart devices that function by parsing signals has increased the ability to manage different equipment. Smart home (SH) devices can store data, respond to users’ prompts, provide feedbacks to users, and issue alarms. SH-IoT promises to create an energy-optimized environment by connecting devices, in addition to providing flexibility in home management and monitoring [11].
Unlike previous studies in which HEMS relies on raw data collected by energy meters from which models disaggregate desired appliances by relying on classification methods based on the prior information of appliance energy signatures, in this paper we propose a model based on 15-min aggregated raw data that relies on descriptive data-mining techniques. The model is quite simple and computationally less complex, yet effective. It can detect energy-consumption patterns, the appliance operation (i.e., on–off, standby), and the duration period in which the appliance is operative for all household appliances. Moreover, it provides consumers with the information on the total number of cycles, disaggregates cycles in close sequence, identifies cycles according to their duration (i.e., short, medium, and long cycles), and calculates energy consumption during customised time periods. The model has been calibrated and validated on two datasets collected by ENEA by real-time monitoring of Italian dwellings equipped with IoT devices. The former dataset contains measurements of 58 domestic appliances from 14 homes over a period of 2.2 years, and the latter contains measurements of 48 appliances from 10 homes over a period of 6 months. The key contributions of this work are as follows.
  • A pattern-detecting method for different appliances (cyclic and noncyclic) has been developed that is quite simple, computationally less complex, and that can accurately disaggregate energy-consumption cycles occurred in the close succession. Moreover, the algorithm developed herein could be applied to any device dataset.
  • The developed algorithms have been implemented in a code used to process the data acquired by a IoT platform developed by ENEA and currently operating in some dwellings, aimed at fostering user engagement and energy awareness by providing customised feedbacks to the users.
  • The DHOMUS platform uses open and interoperable protocols for data acquisition at the device and HEMS level and, therefore, can be easily replicated in broader contexts.

2. Literature Review

The diffusion of smart meters, low-cost sensors, and smart appliances has paved the way for novel energy management strategies including communication and interaction among users, devices, and the grid. Whereas greater resolution data is necessary for more precise energy analysis, raw consumption data by itself is not enough to provide details on the causes of energy demand and what can be done to reduce it.
Demand–response (DR) strategies can be used to boost the efficiency of smart grids. There are several DR initiatives in the literature aimed at lowering customers’ bills and reducing grid loads. Authors in [11] devised a homomorphic encryption-based alternate direction technique of multipliers approach to address cost-aware appliance scheduling optimization in a distributed way and scheduled home appliances without compromising users’ privacy. They show that the suggested secure appliance scheduling for a flexible and efficient energy-consumption method, termed SAFE, significantly decreases power costs while protecting users’ privacy through an intensive simulation research by using real-world datasets. Appliances’ operating mode identification, which uses the cycle-clustering technique proposed in [12] is a smart home energy-management system primary approach based on sensed power consumption values, which enables DR by allowing users to employ energy-saving appliance operation modes. Cycles from an appliance single-usage profile, are extracted and reshaped into characteristics in the form of clusters of cycles. By using K-nearest neighbours, these attributes are then used to determine the operating mode during each occurrence. Identification of operation modes is deemed fundamental for several possible smart DR applications inside HEMS. Authors in [13] presented the K-means clustering technique to classify different modes of operations of home appliances. To validate the proposed method, a case study based on a refrigerator was presented. By combining an automatic switch-off system with load balancing and a scheduling algorithm, authors in [14] proposed a smart-home energy-management system that reduces energy waste. The load-balancing technique operates within defined limitations to keep the household’s total energy consumption within a certain limit. The least slack time (LST) method is used to schedule appliances, by considering the user’s comfort. The simulation results demonstrated a considerable reduction in residential energy consumption aided by an automatic switch-off mechanism thanks to the suggested LST-based energy-management system (EMS). Support vector machines were used in [15] to identify load characteristics of appliances in various operating modes, and a smart home energy-conservation system was constructed to test the approach and validate the proposed EMS. The authors of [16] applied an artificial neural network to identify usage patterns of some common household electric appliances from daily profiles of energy records obtained with 15-min granularity, and the proposed method showed effectiveness when applied to several daily load diagrams captured by a few residential meters. The iterative disaggregation approach based on consumption patterns presented in [17] is a method that merges the fuzzy C-means clustering technique, which provides an initial working condition, with subsequence searching dynamic time warping, which recovers single-source energy usage based on typical power-consumption patterns. The results demonstrate that the suggested method properly disaggregates power usage and is suited for situations when many appliances are used at the same time. To decrease peak power and improve users’ comfort, authors of [18] proposed an efficient home energy-management controller (EHEMC) based on the genetic harmony search algorithm. With real-time electricity pricing and critical peak pricing tariffs, they evaluated EHEMC for a single house and multiple dwellings. The study [19] provided a nonintrusive affinity propagation clustering algorithm based on factor graph model and the belief propagation theory, and the results revealed that the algorithm correctly recognizes the basic and combination classes of household appliances. This strategy laid the groundwork for power-management firms to efficiently and effectively allocate electricity. The study [20] proposed a novel method for assessing the energy consumption of various appliances, and it was utilized to develop a recommendation system that would advise renters on how to reduce their usage.
Clustering, association rule mining, and artificial neural networks were all used to perform data-mining tasks. Authors in [21] presented various unsupervised machine learning techniques to find energy-usage patterns in a smart home. Moreover, they provide solutions for smart metering systems that may help to: (1) raise energy awareness; (2) assist accurate use forecasts; and (3) give input for demand response systems in homes that provide users with timely energy saving advice. In [22], three data-analysis processes and a data-mining framework, i.e., data classification, cluster analysis and association rule mining, were proposed for efficient data analysis of buildings. A systematic approach for providing immediate feedback and recommendations to building occupants to assist them in taking appropriate action to minimize energy use was developed in [23]. For a specific building, the notion of a reference building (RB), i.e., an energy-efficient building, was established, and RB was created by using data-mining techniques that included clustering analysis and neural networks. The performance of a building was determined in comparison to a reference building, which provided feedbacks to suggest occupants the appropriate actions to enhance building energy performance (e.g., turning off lights or heating and air conditioning, etc.). In some other studies [24,25], the nonintrusive load-monitoring (NILM) method was designed to identify the activation of a target appliance by analysing the recorded active power transient response and estimating its consumption in real time.
Smart metering, on the other hand, has been promising in several applications, such as energy modelling [26,27,28,29,30,31], behaviour characterization [32,33,34], grid infrastructure technical evaluations [35,36,37,38,39], and end-user engagement [40,41,42]. Power and consumption data for household appliances used in a two-person family in Turkey was gathered with high resolution in one-second intervals in [43]. Moreover, authors of [44] reported a dataset of 15 households in Germany over a 3.5-year period, with a total of 50 appliances monitored at 1 Hz.
From the literature, it has been observed that most of work reported is related to overall load-level consumption information, cost-aware appliance scheduling, load balancing, and a scheduling algorithm based upon energy meter data. To the best of our knowledge, we have not found simple models aimed at extracting patterns such as the number and duration of operations, cycle disaggregation for appliances that have cyclic operation (e.g., washing machine, dishwasher), and energy consumption throughout various time periods, which can be easily integrated into IoT platforms dedicated to residential users.

3. DHOMUS Platform

Data Homes and Users (DHOMUS), is a platform developed by ENEA (https://dhomus.smartenergycommunity.enea.it, accessed on 1 December 2022) that is dedicated to residential users for smart home applications. The layout of the smart home is depicted in Figure 1 [45]. The main objective of DHOMUS is to make users aware of their energy data, to let them understand how much energy they consume and why, to support reduction of both consumption and costs, thereby contributing to decrease their impact on the environment, to increase energy awareness, and to transform residential users into active subjects that contribute to the stability of the grid. The DHOMUS platform currently collects and analyses real-time data from smart homes located in Rome. They consist of 24 homes equipped with a kit of commercial sensors (their characteristics are described in Table 1), which monitor the electrical consumption of the home meter and of selected appliances, as well as the presence of people and indoor comfort. The management of all these devices is wireless, based on Z-Wave protocol, and the gateway is connected to the Internet through the energy box, which collects, integrates, and sends sensors’ data to the cloud platform. As the electrical data acquisition time varies from sensor to sensor, postprocessing is performed to calculate their 15-min averages, similar to the method used for smart meters.

3.1. Datasets

The model has been calibrated and validated based on two datasets of electrical consumption of homes and single appliances monitored by DHOMUS platform, in the following Dataset A and Dataset B. Dataset A includes energy measurements of 58 appliances in 14 homes over 2.2 years, collected with a 15-min granularity. The start and end times of the measurements are not the same for all dwellings, as reported in Table A1 in Appendix A. Figure 2 depicts the available data for the appliances included in Dataset A. For most of the appliances, the data are recorded over the period from February 2018 to March 2020. Fridges, dishwashers, washing machines, and TVs are the most commonly monitored appliances.
Dataset B includes measurements of 48 appliances from 10 homes from June 2021 to November 2021 and data were collected with a 15-min granularity as reported in Table A2. Figure 3 shows the available data for the appliances in dataset B. Dishwashers and washing machines have the most data available.

4. Methodology

4.1. Appliance Data Analysis Model

A model has been implemented in the MATLAB® environment to analyse the data collected by the data acquisition system interacting with ENEA’s DHOMUS platform. The model performs data mining and a statistical analysis of the energy use of the dwelling energy meter and of single appliances, distinguishing between those that operate with cycles (e.g., washing machine, dishwasher, tumble dryer) and those that operate continuously (e.g., air conditioners, TV, etc.). The model can detect the operation mode (standby, operating, off, monitoring sensor disconnected/not working) of all domestic appliances, as well as the start, end, and length of operation. Moreover, a statistical analysis of electricity consumption is also performed for each operation, determining the total consumption, the average energy consumption on the reference time step, which is equal to 15 min, and the maximum and minimum energy. Additionally, consumption is split into time slots set by the ARERA Authority [46], as well as customised time slots between 8 a.m. and 8 p.m. (with a minimum resolution of one hour). The model then carries out a monthly analysis of the operation and calculates the number of times the appliance is working, the duration of operation, and the total monthly energy, and then it compares these outputs with reference values, based on similar users or benchmarks derived from the technical literature, in order to make assessments on the actual use of the appliance. Additional outputs are calculated for domestic appliances that operate in a cyclic mode. The model is simple, fast, and it can distinguish nearby cycles in which one cycle runs immediately after another. It calculates the number of times the appliance has been used and the corresponding consumption; this information is used to provide households with feedback aimed at improving rational energy use. The algorithms are detailed as follows.
The flow chart in Figure 4 represents the structure of the numerical model. First, the algorithm imports monitoring data from .csv or .txt files exported from the data acquisition system. Data for various homes, different household appliances, and for an arbitrary time span could well be stored in the file. Input files have the following structure (taken from an example file), and the description of parameters is shown in Table 2:
 
home_id, sensor, date, sum_of_energy_of_power, delta_energy, last_value_switch
EnergyBox1, fridge plug,2019-01-01 00:30:00.0000,8.8,0,0
EnergyBox1, fridge plug,2019-01-01 00:45:00.0000,8.8,0,0
EnergyBox1, fridge plug,2019-01-01 01:00:00.0000,8.8,0,0
 
The quantities sum_of_energy_of_power and delta_energy provide similar information on the consumption of the appliance; therefore, the model uses the former for the energy calculations.
Module Smart Home Analyzer (SHAM) (i.e., module 1 in Figure 4) imports the monitoring data in a table format. Then, it sequentially calls the modules explained below. The call syntax is as follows:
smart_home_analyser_v2(B_id, B_name, elettrodom, energy_data).
 
The required inputs are B_id, the ID of the building which represents the energy box (e.g., EB-1 to EB-14 for dataset A, and NEB-1 to NEB-12 for dataset B), B_name, the acronym of the building used to plot the results and save the results, elettrodom, the name of the appliance (e.g., “dishwasher”), and energy_data, a table with the imported quarter-hour monitoring data. The code can recognize all possible appliances installed in the home.
The module detects the dwelling and the appliance provided as input, and if it cannot find the combination “house, appliance”, then it provides an error message and ends as shown in Figure 4.
The function “smart home” (module 2 in Figure 4) is automatically called if the dwelling and the appliance are found in the dataset. This function sorts the imported energy data over time and removes any duplicate; moreover, it verifies the unit of measurement of the energy quantities and, if necessary, converts from kWh to Wh. The module then produces a table-formatted array containing the input quantities sorted through time, checked, and with required units.
The function “appliances” (module 3 in Figure 4) automatically receives the following inputs from the previous function: B_name is the acronym of the dwelling (e.g., “EB-1”), B_appl and appl_name are the abbreviation and label of the appliance, respectively, and they are used to plot and save the results, cyc_on is a boolean variable that indicates whether the appliance has a cyclic operation or not, and t_cdz_i is the table array produced by the "smart home" function.
Furthermore, the “appliance” module performs data analysis and data mining. First, it provides a set of operating features that are used to calculate the appliance standby energy and to setup customised daytime periods. Additional parameters are adopted for the study of individual cycles if the appliance has a cyclic operation:
  • Minimum cycle duration, i.e., shorter operations are neglected;
  • Minimum cycle energy consumption, i.e., operations with a smaller consumption are neglected;
  • Parameters for the separation of nearby cycles;
  • Threshold to skip the analysis for those months when insufficient data are available;
  • Energy threshold to distinguish low consumption cycles;
  • Time threshold for short cycles; and
  • Time threshold for long cycles.
These parameters depend on the type of appliance, and therefore they require calibration.
The module creates a table with energy consumption and corresponding datetime, which starts on the first day of the first month and ends on the last day of the last month recorded in the imported dataset. This operation is useful to manage full months, especially to account for new sensors and for relying on a comparable data structure because sensors may be connected to different appliances in different moments.

4.2. Information Analysis

The model relies on consumption during standby mode in order to determine whether the appliance is operative or not. Standby energy (U) is calculated by the following equations,
F ^ n ( t ) = 1 n i = 1 n E i t
F = F ^ n ( t )
U = m a x ( F ) ,
where F ^ n ( t ) represents the empirical cumulative distribution of energy consumption E i t function over time, and F represents the gradient of F ^ n ( t ) . The algorithm assumes that switching from standby to normal operation corresponds to the maximum energy gradient; therefore, the standby consumption is calculated as the energy that determines the maximum gradient of the cumulative distribution of measured consumption.
In actual operation, the appliance may perform several cycles in close succession (e.g., two washes, one immediately after the other for the washing machine). The model can separate cycles in close succession based on their energy-consumption profile. The disaggregation of cycles is computed with the following equations,
Y = θ A
Δ Y = Z C I ( Y ) ,
where θ A is the energy consumption of aggregated cycles, Y is the gradient of consumption and Δ Y is the position over time of the relative maxima of energy consumption in aggregated cycles. The Z C I (Y) function interpolates from the points it identifies near the zero crossings to linearly approximate the actual zero crossings. Maxima characterized by energy consumption above the value that corresponds to the percentile set as a parameter of the model (e.g., 85% of the consumption of the aggregated cycle) identify separate cycles and are used by the algorithm to disaggregate nearby cycles. Typically, energy consumption is higher during the first stage of the cycle (i.e., water heating) for washing machines and dishwashers.
As anticipated, the model neglects operations that last less than or that consume less than the thresholds set as input parameters in order to exclude those situations that may not represent real operating cycles. The corresponding data (spurious data) are stored separately in the results.
Then the model allocates energy consumption in time slots. In particular, hours between 8 a.m. and 8 p.m. can be grouped in a customized number of time slots provided as input. Moreover, the algorithm accounts for the standard time slots defined by the Italian Energy Authority (ARERA) as follows [46]:
  • F1: from Monday to Friday, from 8 a.m. to 7 p.m. (except holidays);
  • F2: from Monday to Friday from 7 a.m. to 8 a.m. and from 7 p.m. to 11 p.m., Saturday from 7 a.m. to 11 p.m., (except holidays); and
  • F3: from Monday to Saturday, from 12 a.m. to 7 a.m. and from 11 p.m. to 12 a.m., Sundays and holidays.
For each individual period and cycle of operation, the following quantities are calculated: total energy consumption, average 15-min energy consumption, maximum and minimum consumption, and maximum/minimum ratio as an indicator of the variability of the consumption during operation.
The code then performs a monthly analysis, and calculates the following quantities:
a.
Number of records in the dataset;
b.
Number of NULL records, i.e., with sensor disconnected or inactive;
c.
Number of records with zero consumption;
d.
Number of records when the appliance is in standby mode;
e.
Number of spurious records, i.e., characterized by either duration or consumption below the input thresholds;
f.
Number of records when the appliance is operative;
g.
Number of records when the appliance is operative during F1 time slot;
h.
Number of records when the appliance is operative during F2 time slot;
i.
Number of records when the appliance is operative during F3 time slot; and
j.
Number of records when the appliance is operative during the i-th custom time slot, for all daytime slots set as input.
Similar quantities are calculated with reference to the monthly energy consumption. For household appliances with cyclic operation, the following additional quantities are calculated by differentiating cycles according to energy consumption and duration:
  • Cycles with consumption above the minimum input value;
  • Cycles with duration less than the input threshold S d 1 (short cycles);
  • Cycles with duration between boundaries S d 1 and S d 2 (medium cycles); and
  • Cycles with duration greater than the input threshold S d 2 (long cycles).
Moreover, for single cycles and for aggregated cycles (i.e., cycles before the application of the algorithm that distinguish cycles in close sequence) the following monthly quantities are calculated:
  • Percentage of records in the month;
  • Number of cycles recorded;
  • Number of cycles extrapolated for every month, in the presence of missing data (i.e., the sensor returns NULL) and within the limits of acceptability set as input parameter (e.g., months with only 10% of records are discarded, because extrapolation over the month would not be reliable);
  • Number of cycles extrapolated on annual basis, that comply similar condition on missing data as for monthly extrapolation;
  • Average cycle duration;
  • Average cycle consumption;
  • Maximum consumption; and
  • Minimum consumption.
Finally, the code performs a series of energy balance checks and then results are printed and plotted in graphs, and the relevant variables are saved in .xlsx and .mat files.

5. Results and Discussion

In this section, the analysis on the operation of a washing machine is used as an example to describe the results and the logic of the model. Indeed, this electrical appliance has many features that can be representative of other appliances, i.e., it is cyclic, and it can be used to illustrate the main features of the model. Similar remarks apply to other appliances.

5.1. Calibration of Parameters

As the algorithm can analyse all domestic appliances, the control parameters need to be tuned before deploying the model to the analysis of real data. Hence, Dataset A has been used for calibration of these parameters, which are then are applied to Dataset B in order to validate the model. Table 3 shows the range of parameters and the calibrated values obtained for washing machines. In detail, parameter st_by_prc is the reference percentile of energy used to evaluate the usability of standby energy. Parameter min_dur represents the minimum length of useful operative cycles, and the calibrated value (30 min) has been obtained from all cyclic appliances. Parameter min_Wh represents the minimum energy of useful operative cycles (i.e., 100 Wh for washing machines). All the other parameters are equal for cyclic appliances.

5.2. Algorithm Results

The energy analysis starts with the calculation of the standby consumption of the appliance. Figure 5 depicts the cumulative distribution of the energy consumption for a washing machine from which the standby energy is equal to 0.15 Wh. The model uses this value to distinguish among periods of operation and inactivity for the specific appliance.
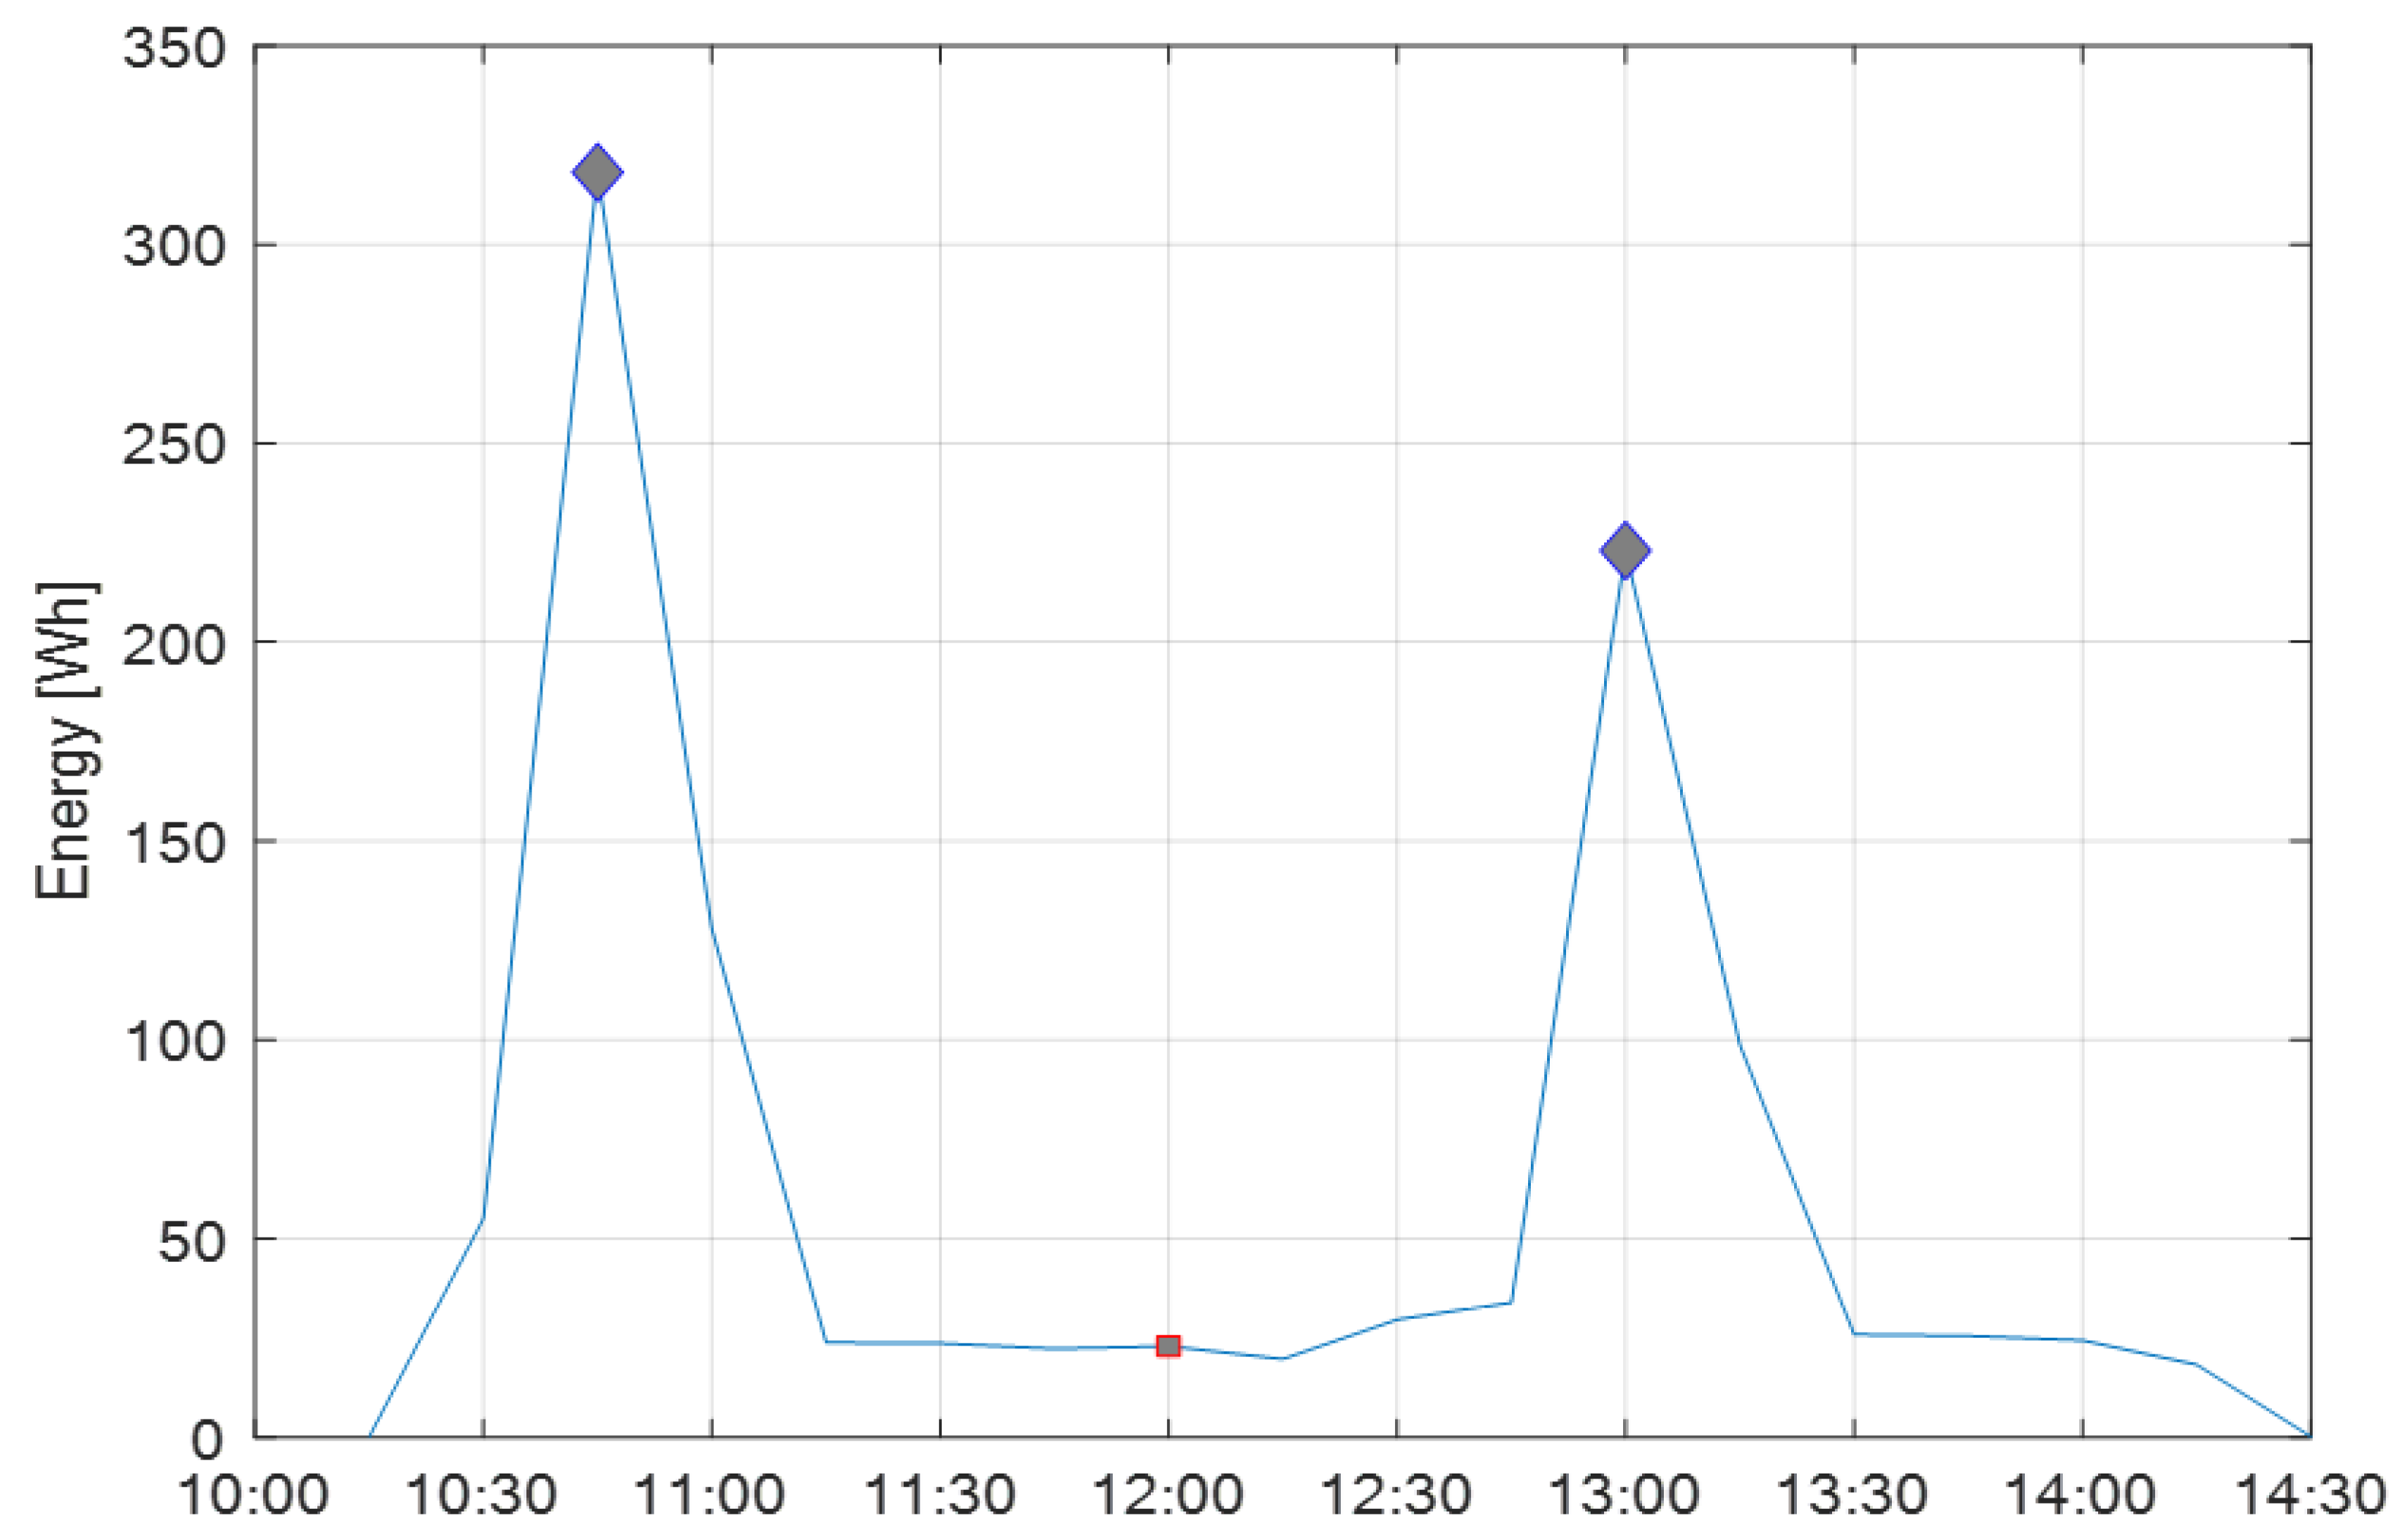
The energy consumption profile in a typical cycle for washing machines is shown in Figure 6: an initial peak of consumption corresponding to water heating is followed by a longer phase (depending on the type of cycle set by the user as well as the type, model, and age of the appliance) with lower consumption. The algorithm calculates the gradient of energy demand and finds consumption peaks, which correspond to relative maxima (i.e., zero gradient), for each aggregate cycle (multiple nearby cycles). The consumption of the peaks that separate individual nearby cycles (i.e., the first phase of operation) exceeds a specific percentile of the cycles’ consumption, the value of which is selected among the parameters of the model. Once the various cycles have been recognized according to this methodology, the model determines the start and the end time (which corresponds to the lowest consumption before the peak of consumption of the next cycle), and duration of the single cycles. Tests have demonstrated that the algorithm is reliable in distinguishing nearby cycles, as shown in Figure 7. A finer sample period could produce better accuracy, but for the purposes of this investigation, the quarter-hour interval is appropriate.
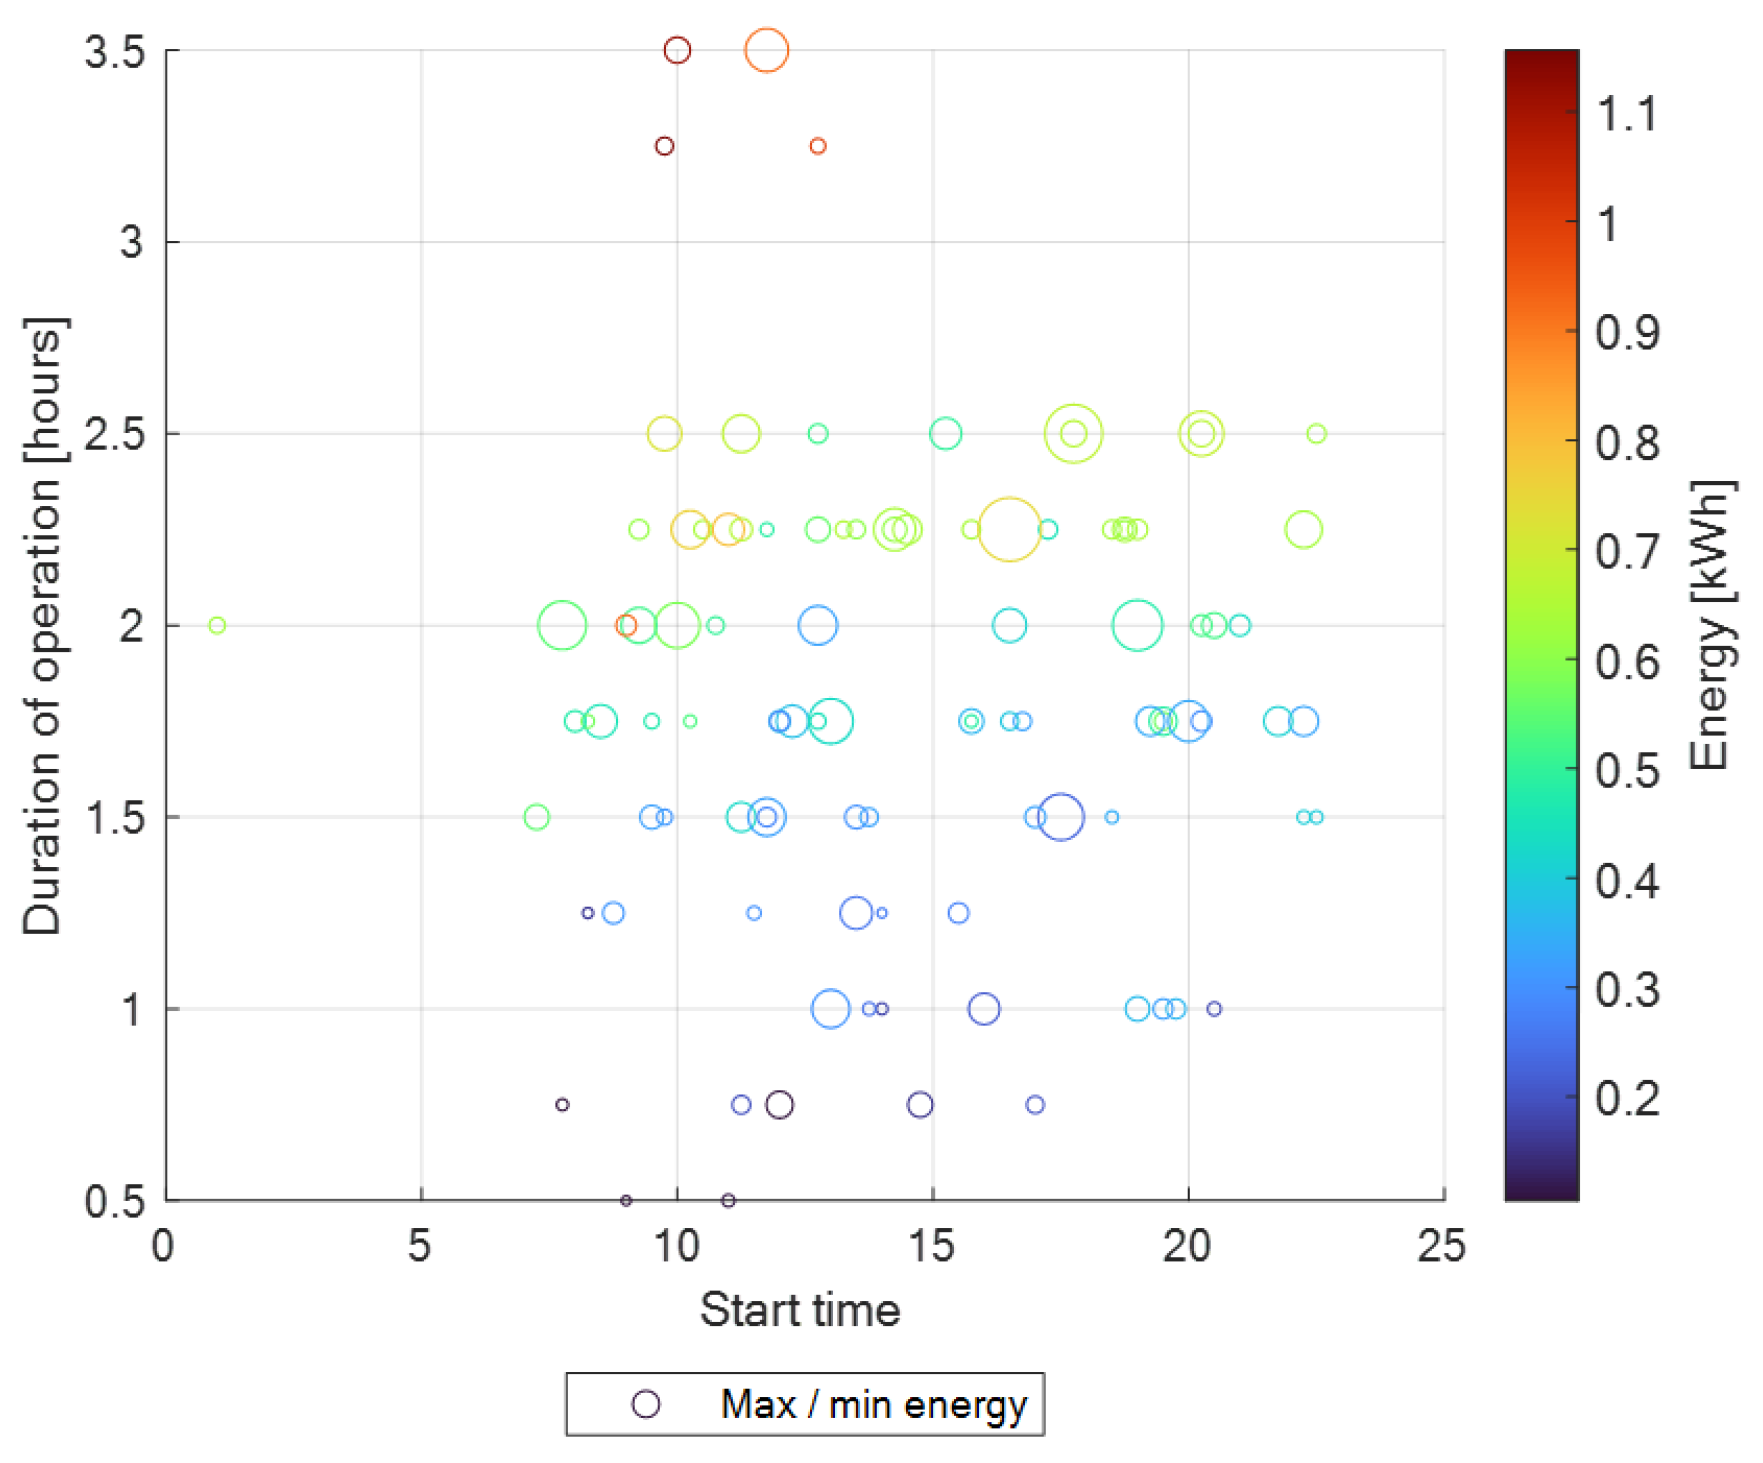
Figure 8 illustrates a bubble chart with relevant information on cycle length and consumption of the same washing machine. The start hour during the day is displayed (abscissa) versus duration (ordinate), and the consumption is represented by the coloured scale of bubbles, whose size is proportional to the ratio between the highest and lowest quarter-hour consumption in the cycle. Larger bubble sizes in washing machines (and dishwashers) indicate washing cycles at a medium-high temperature.
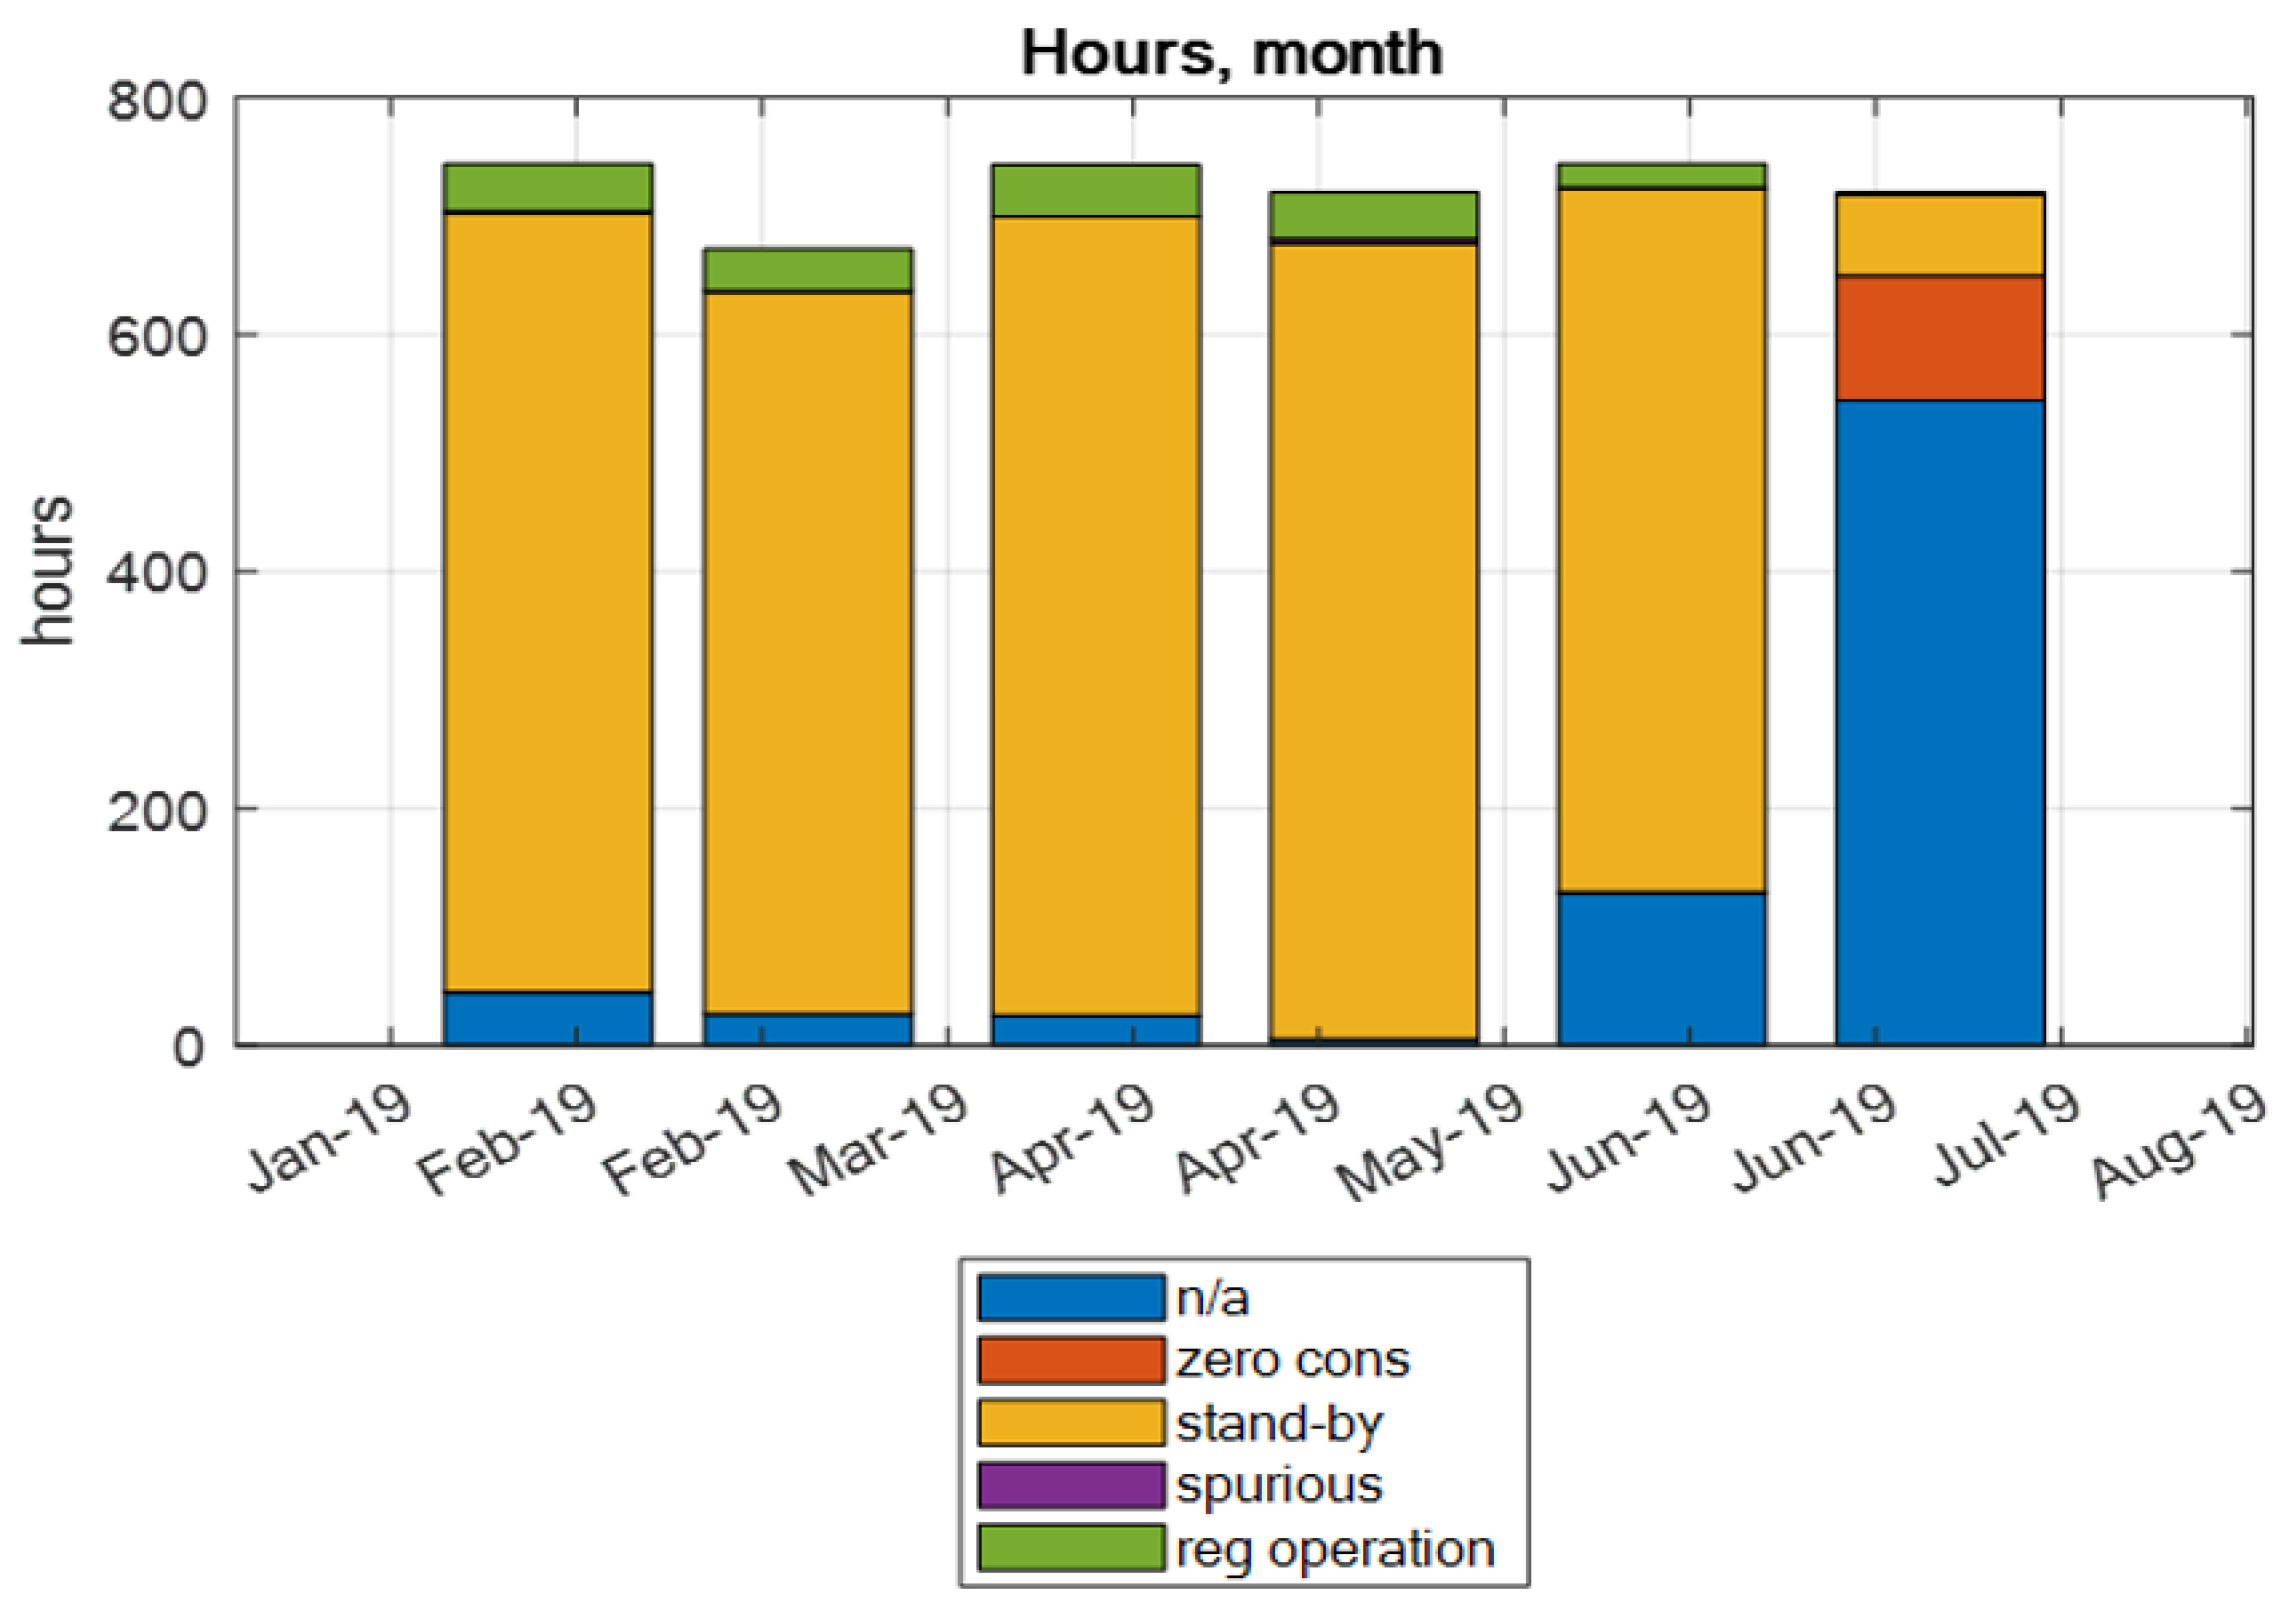
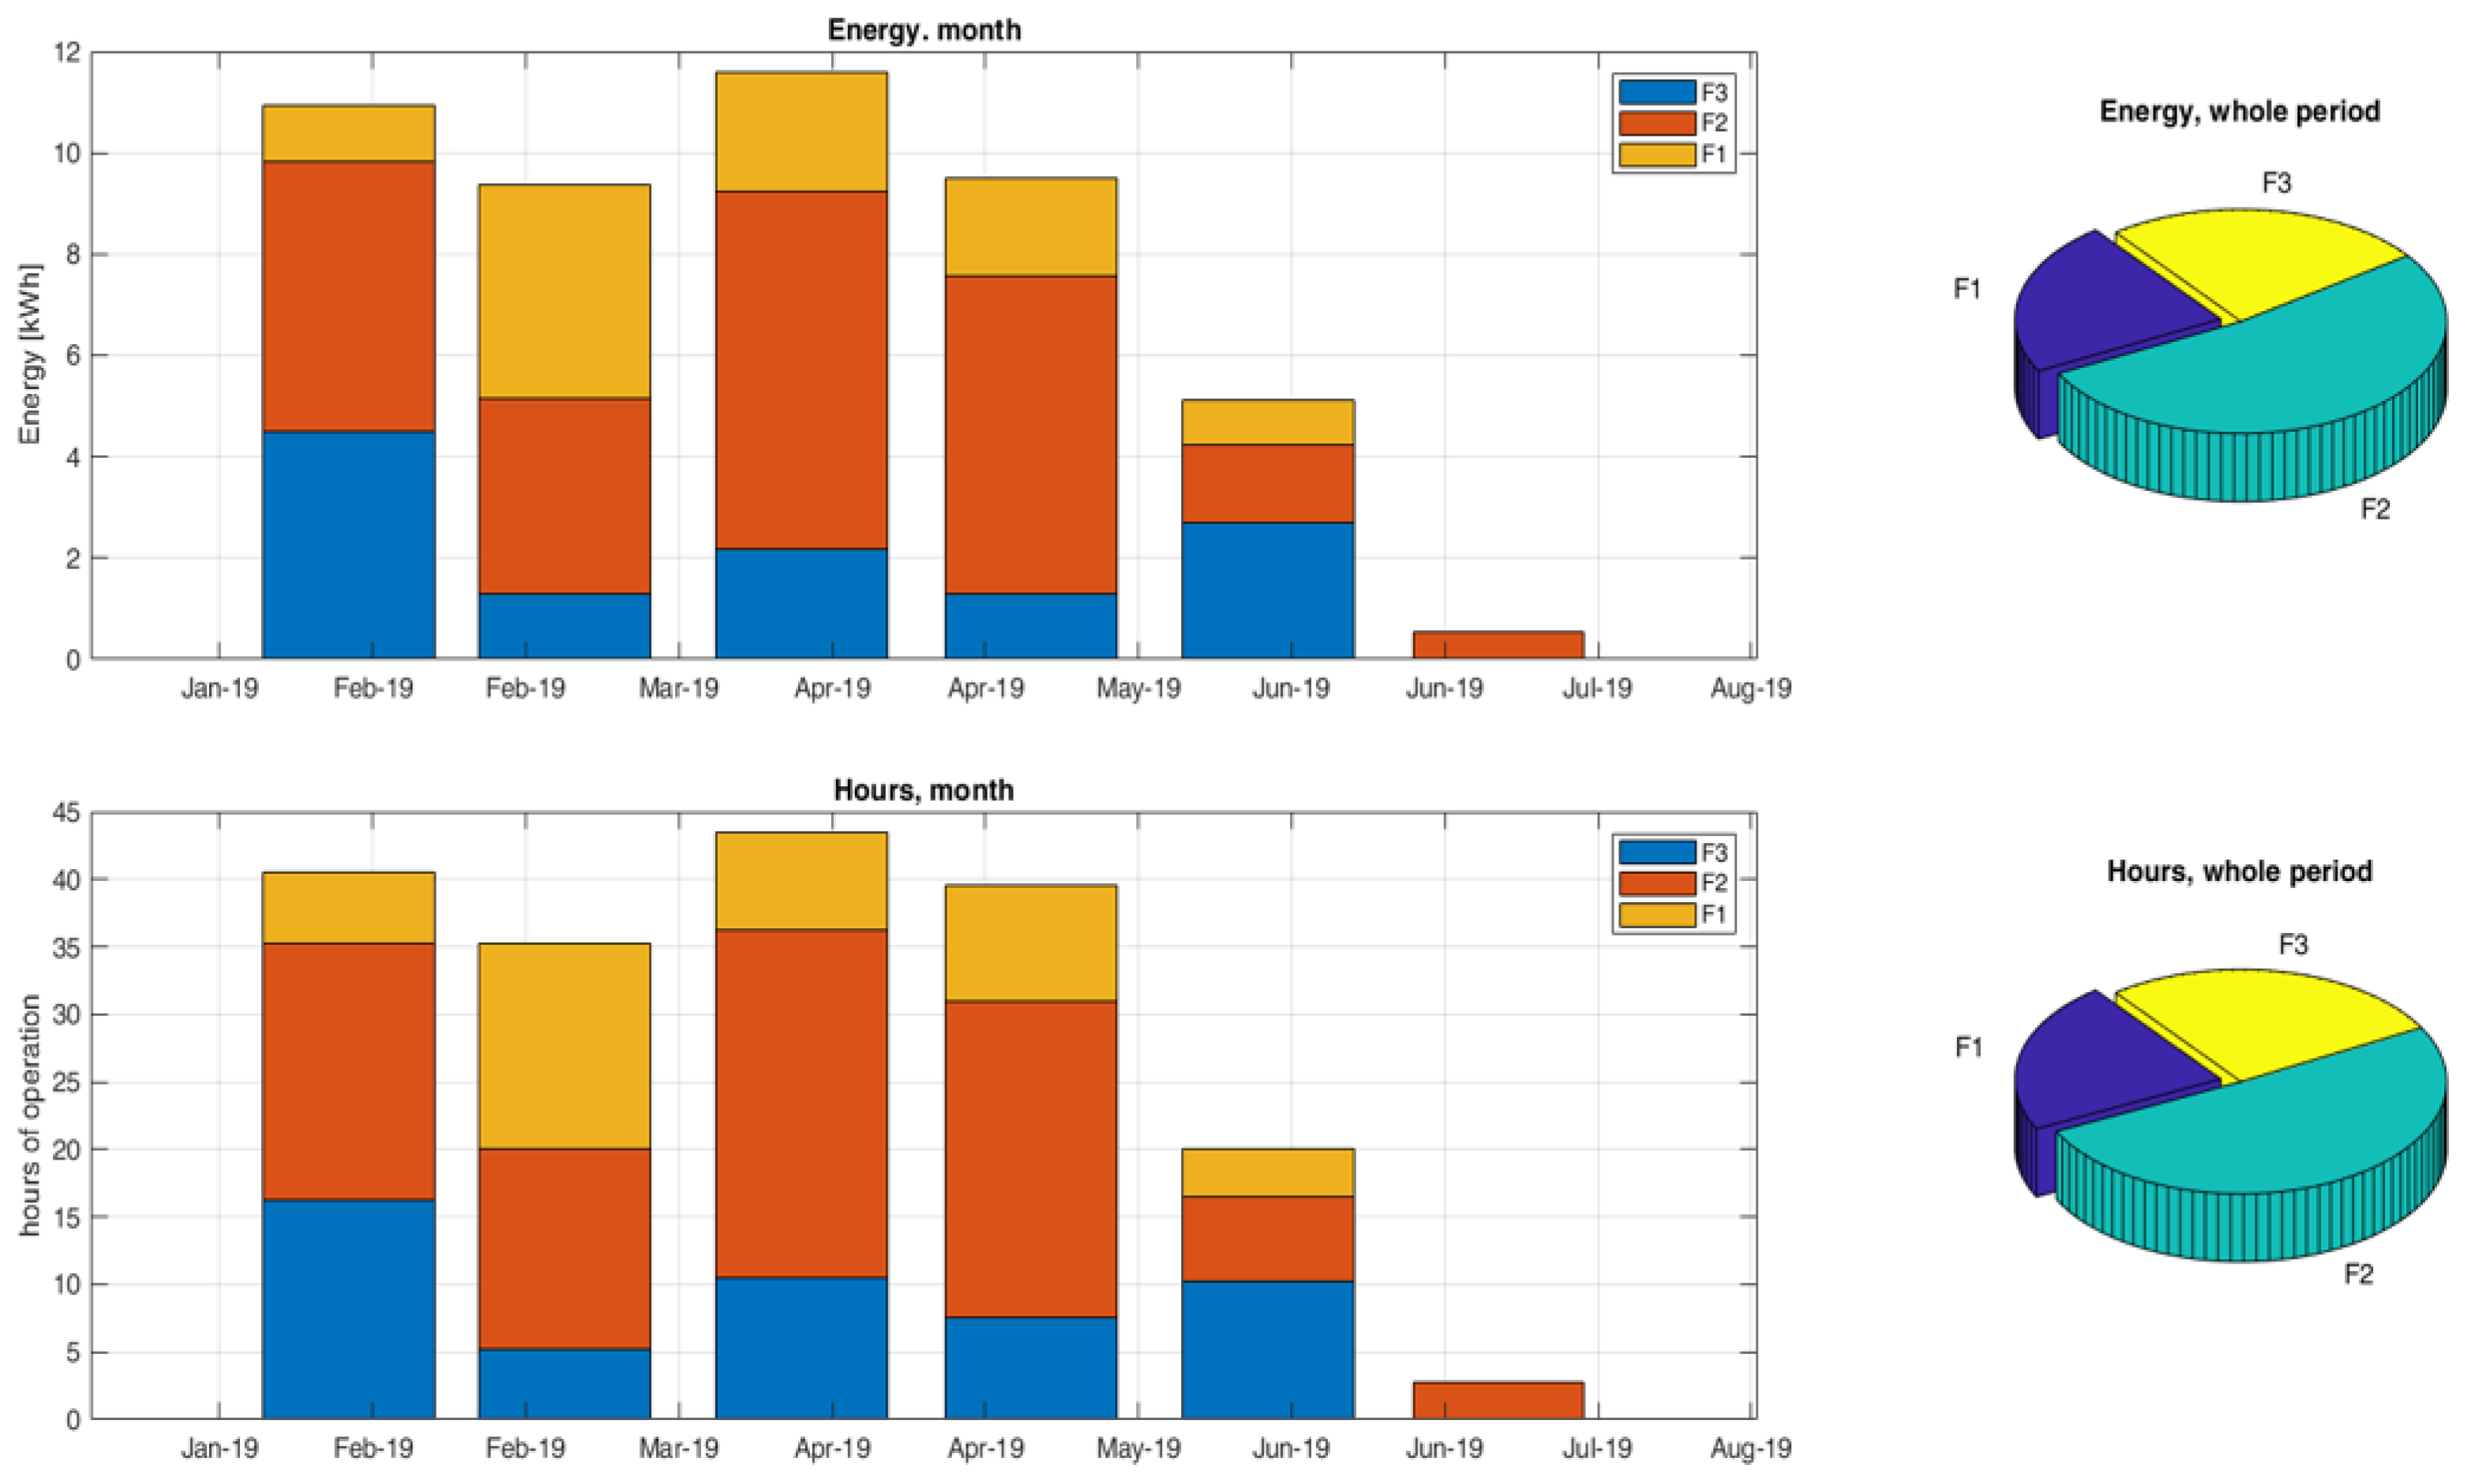
Figure 9 depicts the subdivision of records (upper chart) and consumption (lower chart) based on the type of operation: appliance operative, standby mode, off, spurious data, and sensor not active (i.e., n/a label). Washing cycles correspond to a small fraction of the time but are associated with most of the consumption, unlike standby mode. Moreover, Figure 10 shows the subdivision of the records on a monthly basis, whereas Figure 11 illustrates the monthly (histogram on the left) and overall subdivision of consumption (pie chart on the right) for ARERA time slots. The upper graphs in Figure 12 show the monthly (histogram on the left) and overall (pie chart on the right) allocation of consumption according to the customized daytime slots, in the specific case three time slots (i.e., 8 a.m. to 12 p.m., 12 p.m. to 4 p.m., 4 p.m. to 8 p.m.), whereas the bottom graphs represent the number of operating hours (histogram on the left) and the overall operating hours (pie chart on the right).

5.3. Comparative Analysis

This section illustrates the comparison of appliances characterized by different energy classes. As described, the proposed algorithm is able to detect many features, and some of them have been selected in order to compare the performance of appliances: total number of cycles (recorded, extrapolated), percentage of consumption during peak hours, percentage of short cycles (recorded, extrapolated), percentage of long cycles (recorded, extrapolated), average energy consumption of short cycles and average energy consumption of long cycles.
Table 4 compares seven washing machines representing three energy classes (A, A++, and A+++) belonging to both datasets described in Section 3.1. Washing machines installed in homes EB-2 and NEB-4 are class A, those installed in homes EB-3, NEB-9, and NEB-10 are class A++, whereas homes EB-9 and NEB1 use washing machines of class A+++. Homes have a different number of residents, and they use the appliance in different manners. The model can determine the usage pattern of households in such different contexts. Furthermore, Table 4 presents the relevant quantities considered in the comparative analysis: the total number of cycles ( T n θ ) that is subdivided into short and long cycles, the energy consumption during peak hours (PEC), and the percentage of short cycles ( P θ s ) and long cycles ( P θ L ). The washing machine installed in home EB-3 carried out the largest number of cycles ( T n θ ) in both datasets, as confirmed by the energy consumption of both short cycles ( A E C θ s ) and long cycles ( A E C θ L ). As regards the energy consumption during peak hours, the washing machine in NEB-9 operated at 96% in this time slot, whereas the household of EB-2 showed a wiser behavior since he run his washing machine only for 28% of the time during peak hours. The percentage of short cycles for the washing machines of NEB-4 and NEB-1 is approximately the same even though the number of short cycles is 23 for the former and 52 for the latter, and the corresponding energy consumption during the analyzed period is 2.263 kWh and 3.264 kWh, respectively. Therefore, the average energy consumption in a single short cycle calculated for these appliances is consistent with their energy labels, i.e., class A and A+++ respectively.
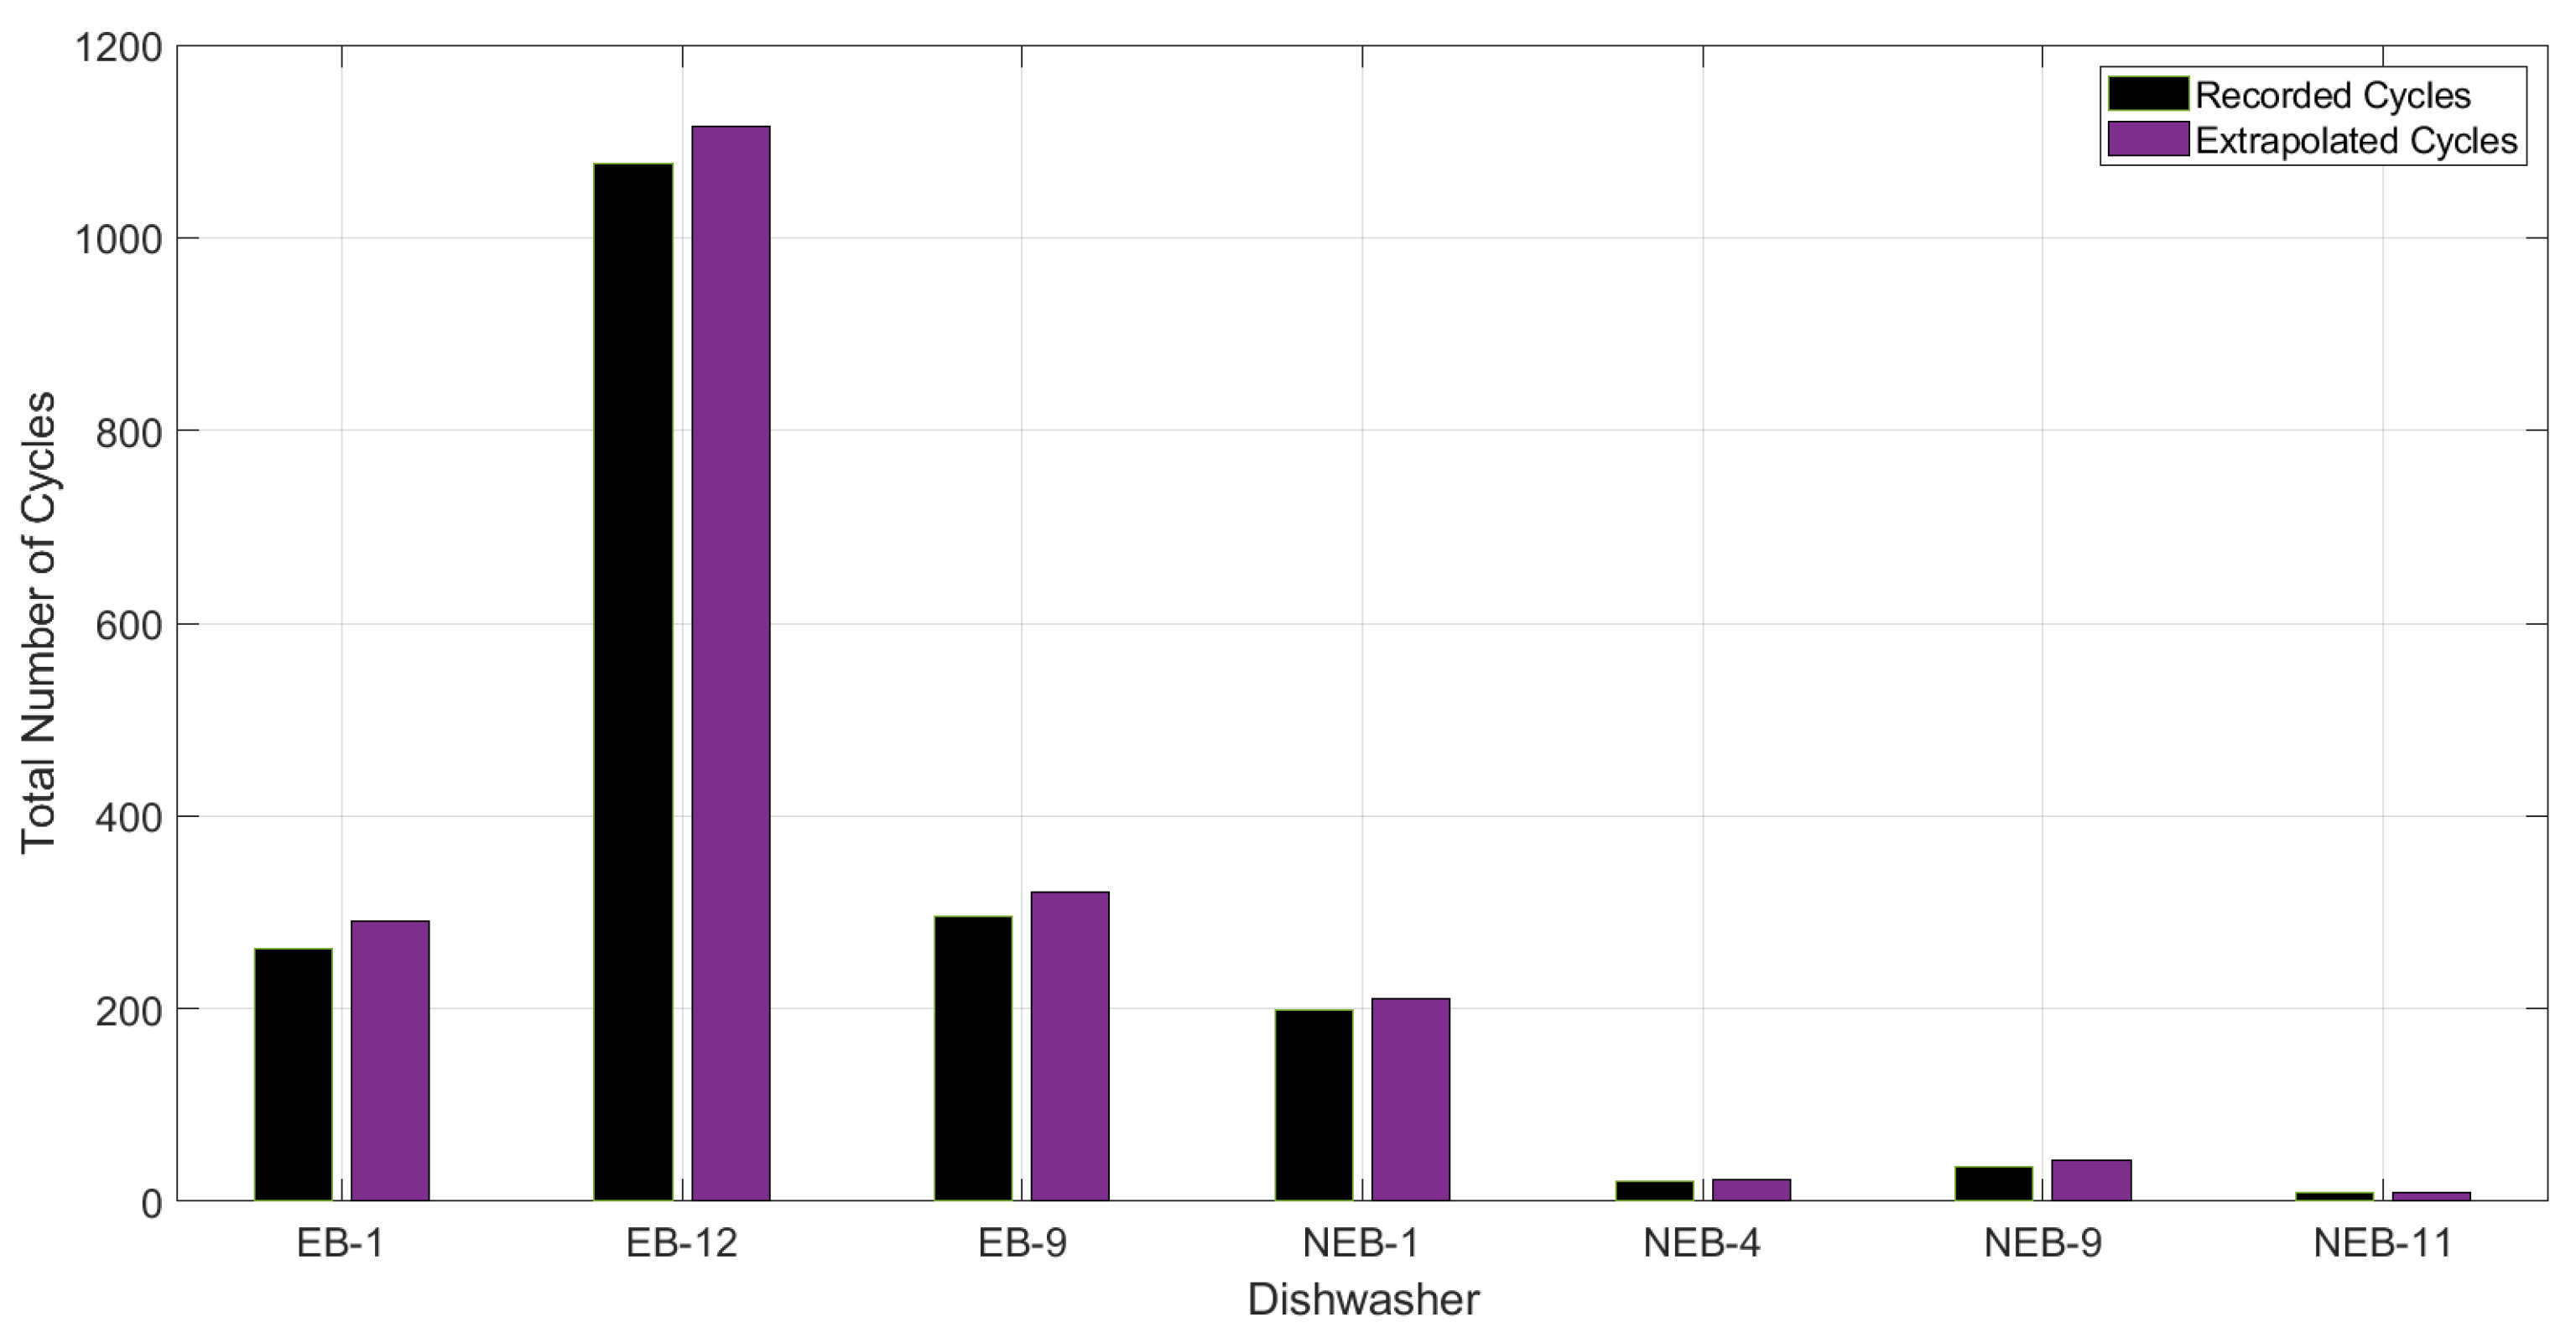
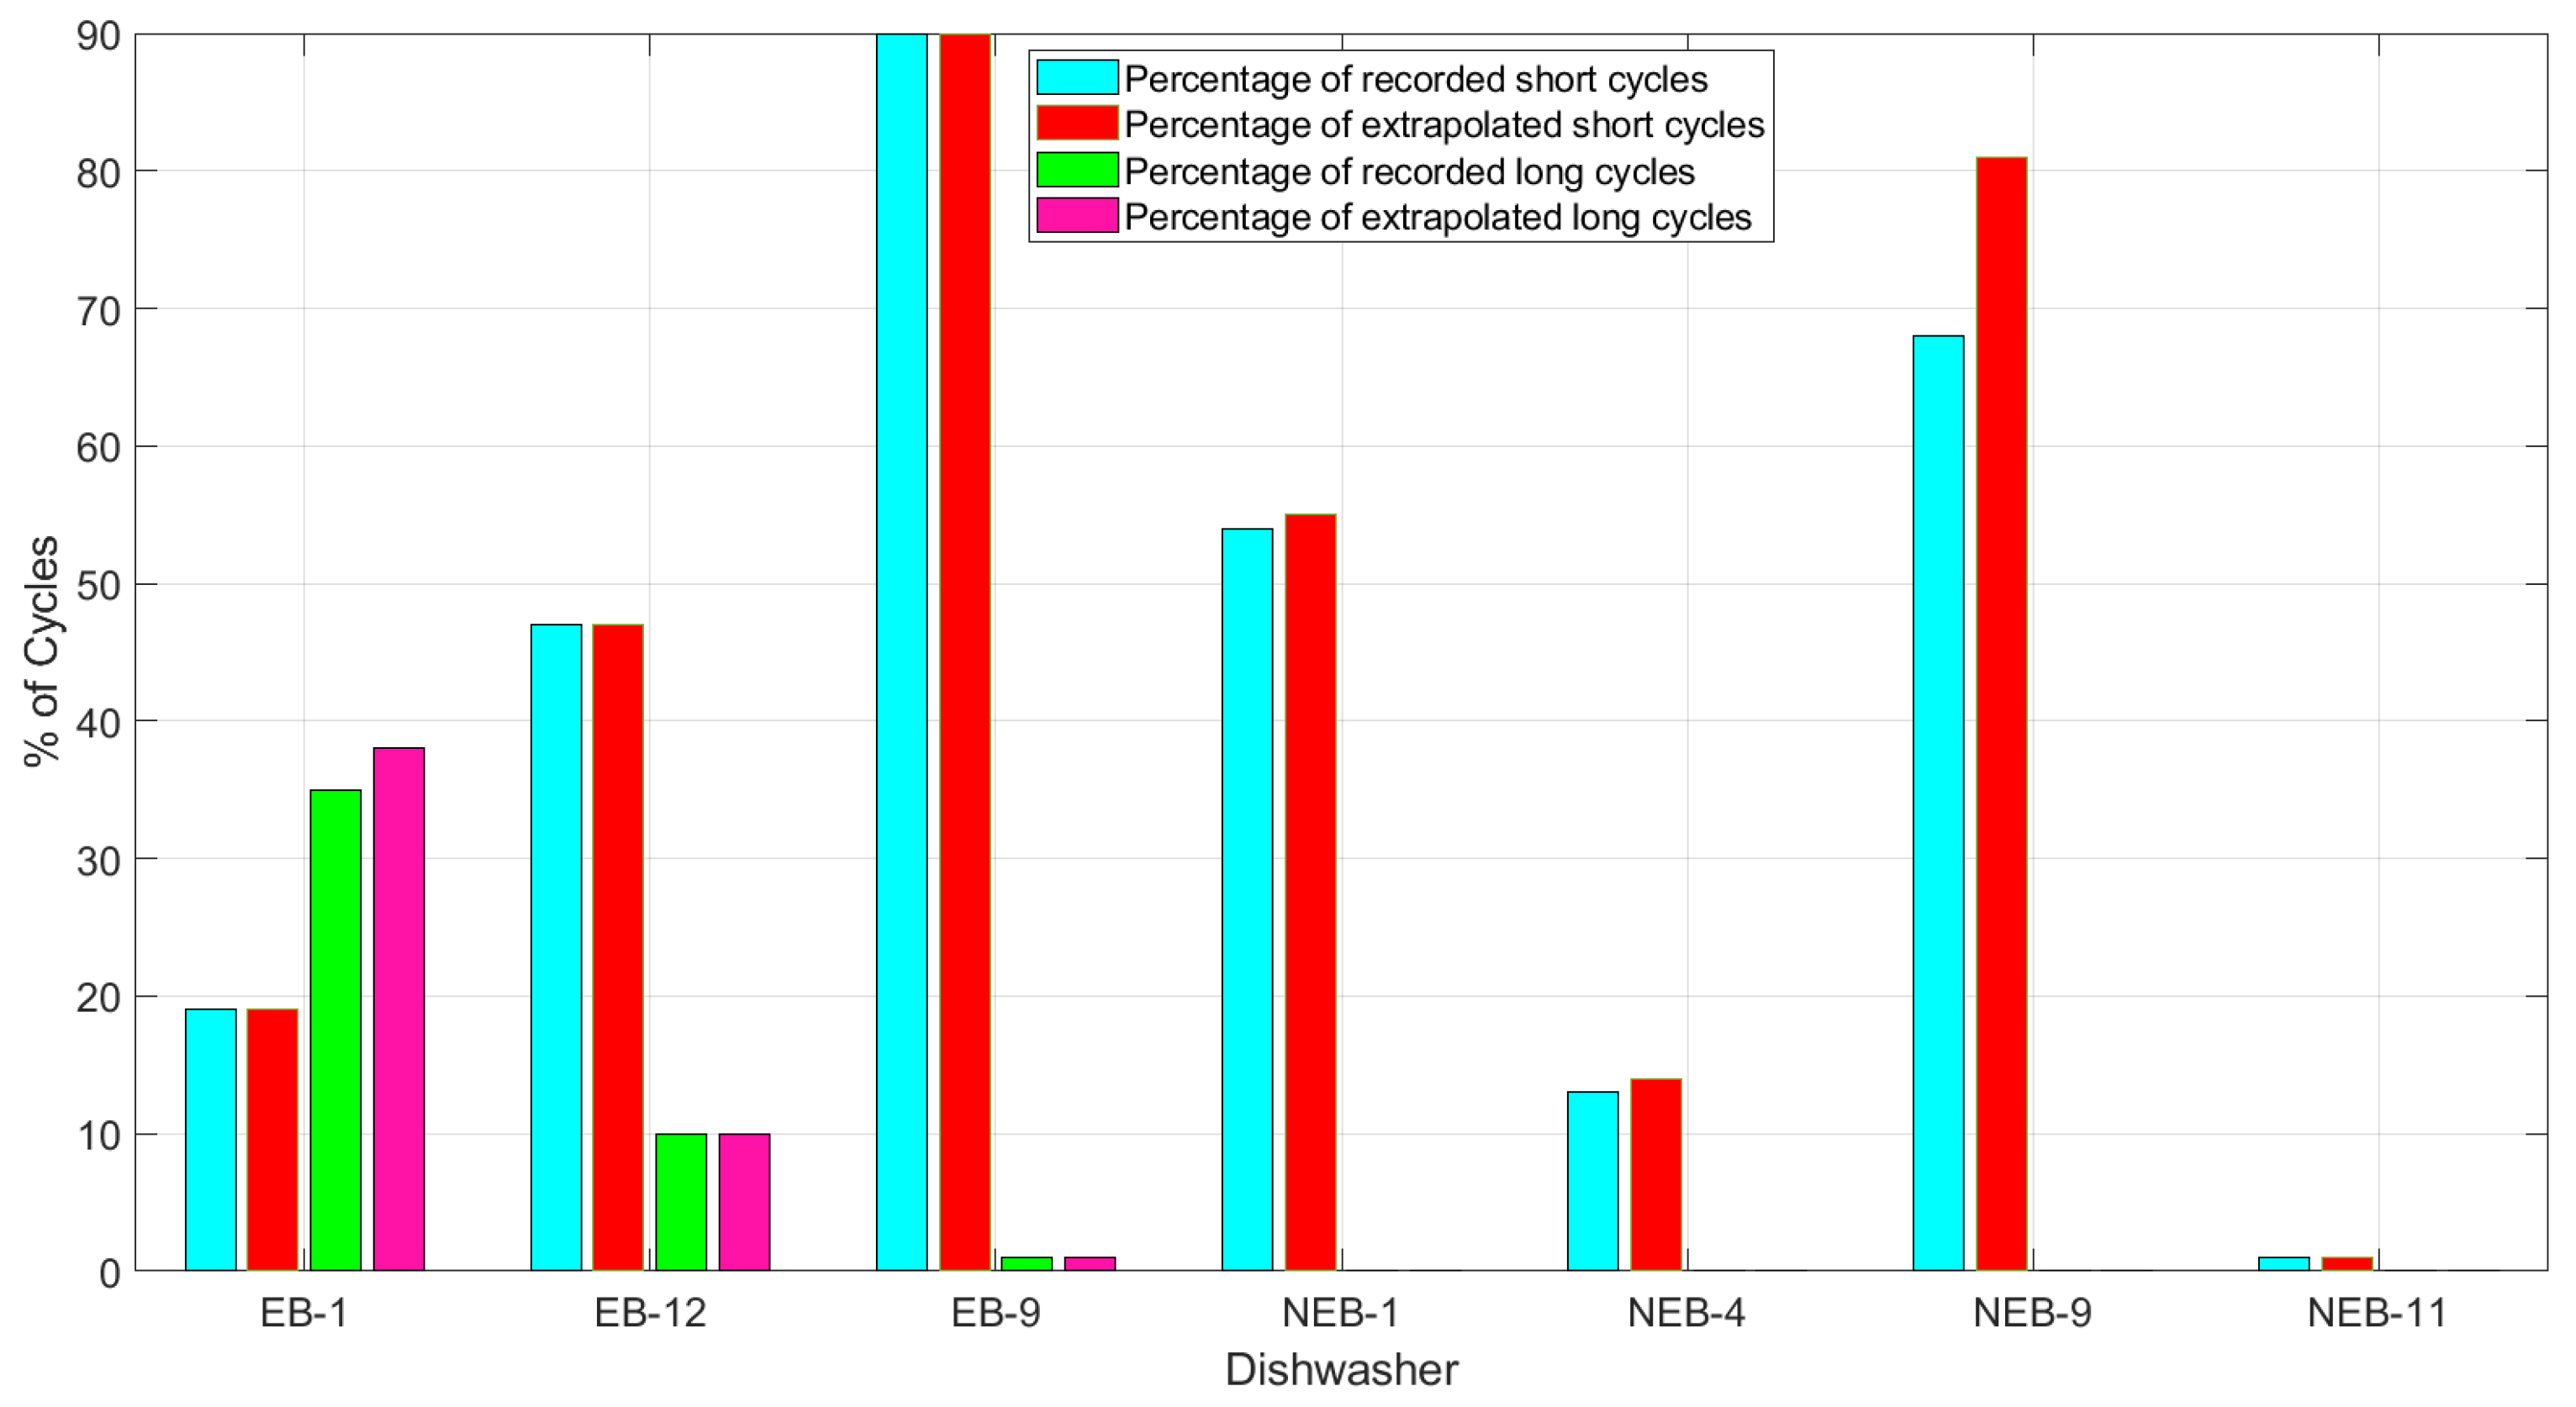
Similarly, the results obtained with seven dishwashers monitored in the two datasets are reported from Figure 13, Figure 14 and Figure 15. Figure 13 depicts the total number of cycles (recorded and extrapolated) in both datasets. The model calculated the highest number of cycles for the dishwasher in EB-12, while the total number of cycles for dishwashers in EB-1, EB-9 and in NEB-1 are similar. Figure 14 illustrates the percentage of short and long cycles for the dishwashers. The highest number of long cycles occurred in EB-1 while dishwashers in NEB-1, NEB-4, NEB-9, and NEB-11 operated only short cycles. Figure 15 depicts the total energy consumption of long (orange bar) and short (green bar) cycles during the analyzed period. The dishwasher in EB-12 consumed more energy during long cycles. By comparing the usage of appliances with their energy labels, it can be seen that even though dishwasher in EB-9 run fewer cycles than the dishwasher in EB-12 (see Figure 13), they consumed a similar amount of energy (see Figure 15). This outcome is consistent with the energy class of those appliances, i.e., class D for the former and class A++ for the latter.
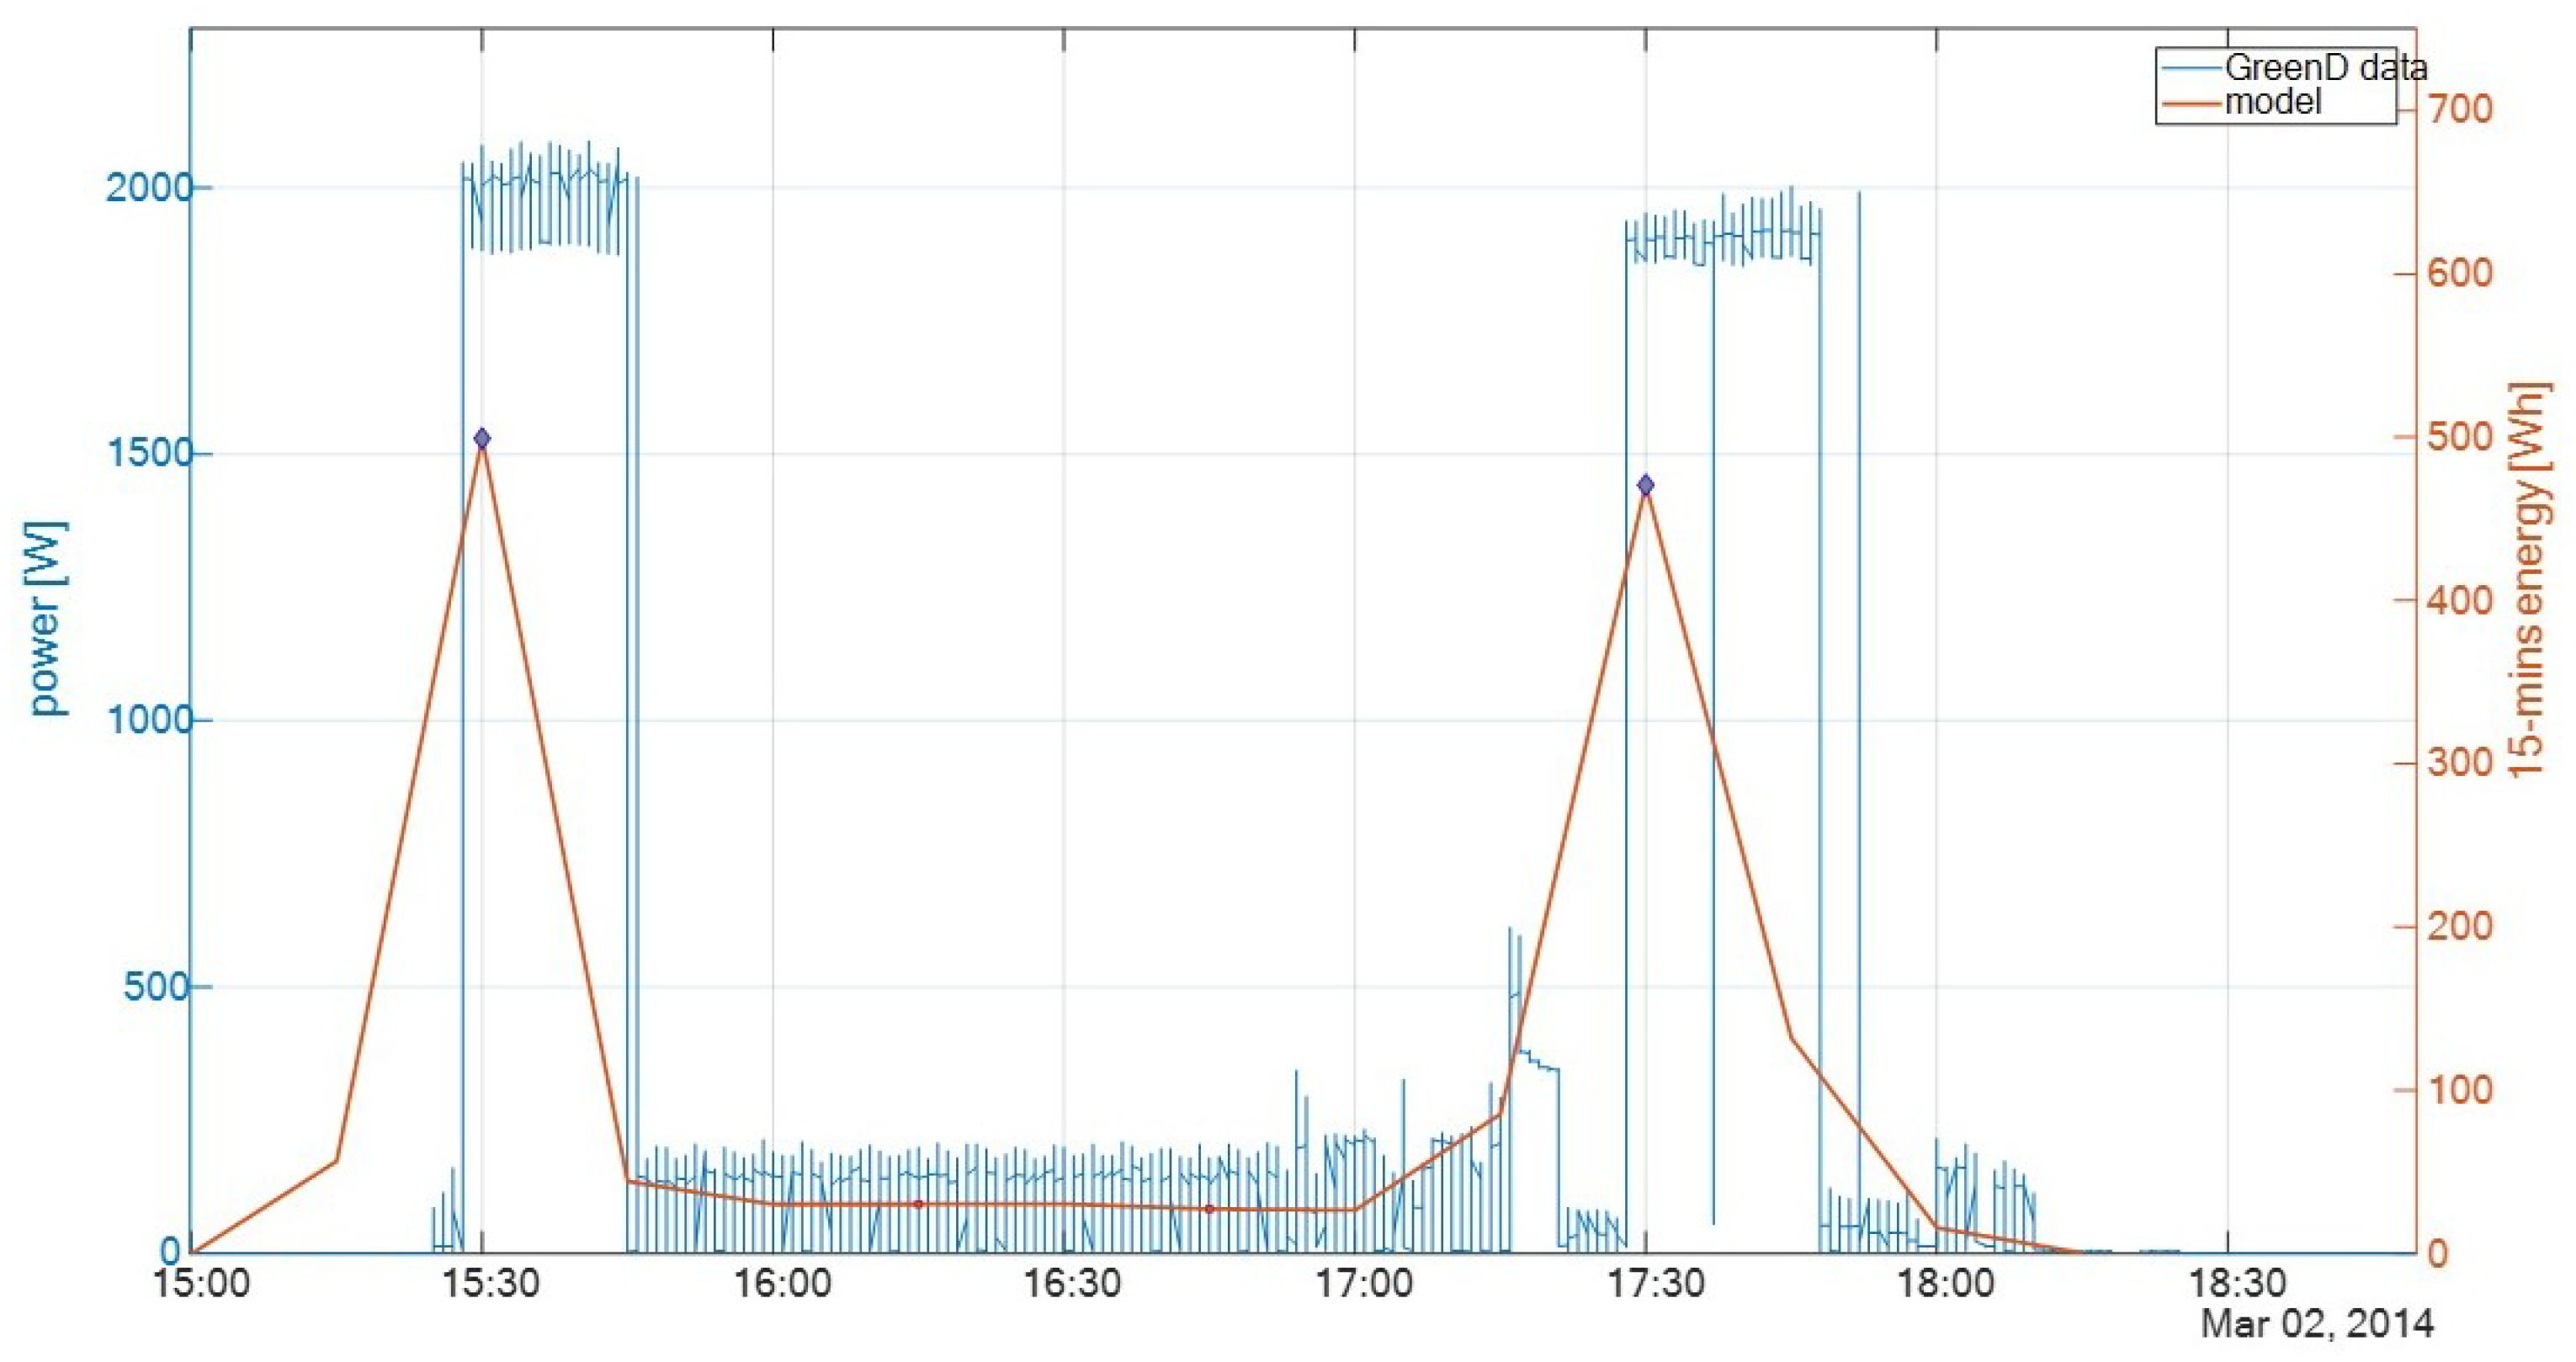
In order to test the model on other datasets found in the literature, we applied it on the GreenD Energy database [47], containing detailed information on energy consumption obtained through a measurement campaign in households in Austria and Italy (December 2013 to November 2014). The results show that our implemented algorithms can extract all patterns for the available appliances in the dataset, including disaggregation of energy consumption cycles occurred in close succession, which is one of the distinctive outcomes of the model, as shown in Figure 16.

5.4. Feedbacks to the Consumer in DHOMUS Platform

The implemented model has been integrated in the DHOMUS platform in order to provide users with feedback on the electrical consumption and to compare their energy habits and patterns with other users participating in the experimentation, and with benchmarks as well. The platform provides a web interface for user feedback to encourage their virtuous and conscious behaviours. Moreover, a monthly report presented in Figure 17 contains summary of the calculations carried out by model and some suggestions to promote energy saving. In particular, the monthly report shows the detailed results obtained from the model and related to consumption during peak hours and to the shares of short cycles (“cicli brevi” in Italian) and of long cycles (“cicli lunghi” in Italian). Furthermore, tips are provided to the users, e.g., those reported in Figure 18 for the washing machine (infographics are in Italian since the DHOMUS platform is native for Italian users), which shows a comparison with similar users. Moreover, tips are provided to assess the impact of virtuous behaviours, e.g., the reduction of the number of cycles by using the appliance at full load in order to reduce water consumption as well. On the other hand, Figure 18 shows the comparison of the average consumption with simular customers: washing machine, refrigerator, and dishwasher are compared in a bar graph on the left side of the illustration. The orange bar reflects the average consumption of other users, while the blue bar represents the average consumption of the specific user.

6. Conclusions

In this paper, a method for the detection of energy-consumption patterns from household appliances data for a smart home platform is described. The model is quite simple, computationally not intensive, but effective in detecting patterns, such as the number of times the appliance is on, off, in standby mode, start time, end time, etc. The method can handle both cyclic and noncyclic appliances. For cyclic appliances, by using descriptive data-mining techniques, the model provides quantitative information on the total number of cycles and the disaggregation of cycles in close succession. Moreover, energy consumption computation over customized time periods and disaggregation of aggregated cycles is a distinguishing feature of the proposed model. The model has been applied on a set of appliances for training and for parameter calibration. Validation has been done with a different dataset, demonstrating that the model can efficiently detect energy consumption and usage patterns. Results from two cyclic appliances (washing machine, dishwasher) are presented to show how the model manages energy-consumption patterns, disaggregates independent washing cycles, and performs monthly statistics. Based on these findings, the implemented model has been integrated into DHOMUS, an IoT platform developed by ENEA, to offer users feedback on their consumption patterns and enable them to effectively compare their energy habits with those of similar customers.
The proposed model can be used with sufficient accuracy for all kinds of household appliances. However, the current release of the model can only handle batch processing data with 15-min granularity. Furthermore, in the case of high-frequency data sets (e.g., with 1-s data sampling), a frequency conversion algorithm is required before applying our developed algorithm, because the current version of the model automatically imports dataset where data have been already aggregated every 15 min by the IoT devices. Moreover, the current version of the model cannot be used in a real-time processing environment; the latter feature has been selected among future developments of the numerical code.

Author Contributions

Conceptualization, M.C. and S.R.; methodology, M.C.; software, M.C. and A.H.; validation, M.C. and A.H.; formal analysis, M.C.; investigation, A.H.; resources, S.R. and V.R.; data curation, S.R.; writing—original draft preparation, A.H.; writing—review and editing, M.C. and V.R.; visualization, S.R.; supervision, M.C.; project administration, S.R.; funding acquisition, S.R. All authors have read and agreed to the published version of the manuscript.

Funding

This research and the APC was funded by the “Electrical System Research” Programme Agreement 2019–2021 between ENEA and the Italian Ministry of Ecological Transition, funding number I34I19005780001.

Data Availability Statement

The data presented in this study are available on request from the corresponding author. The data are not publicly available due to privacy restrictions.

Acknowledgments

We thank the anonymous reviewers for providing helpful feedback.

Conflicts of Interest

The authors declare no conflict of interest.

Abbreviations and Symbols

The following abbreviations and symbols are used in this manuscript:
DHOMUSENEA’s Data Homes and Users Platform
DRDemand response
ECEnergy class
HEMSHome Energy Management System
IoTInternet of Things
NoPNumber of people
SHSmart home
NILMNon-intrusive load monitoring
T n θ Total Numbers of cycles
R θ Recorded cycles
E x θ Extrapolated cycles
P E C ( F 1 ) Percentage of energy consumption during peak hours
P R θ s Percentage of recorded short cycles
P E x θ s Percentage of extrapolated short cycles
S d 1 Lower cycle duration limit (short cycles)
S d 2 Higher cycle duration limit (long cycles)
A E C θ s Energy consumption of short cycles
P R θ L Percentage of recorded long cycles
P E x θ L Percentage of extrapolated long cycles
A E C θ L Energy consumption of long cycles
E i t Energy consumption function over time
F ^ n ( t ) Empirical cumulative density function
UStandby energy
θ A Aggregated cycles
YGradient over aggregated cycles

Appendix A

Table A1. Details of Dataset A.
HomeApplianceStart DateEnd DateTime Span DaysAvailable DataData Holes
EB-1Fridge21/02/201828/03/202076661.89%July–August 2019
EB-1Dish washer20/02/201828/03/202076761.37%July–August 2019
EB-1Washing machine21/02/201828/03/202076645.30%July–November 2019
EB-1Tv21/02/201828/03/202076637.77%July–November 2019
EB-2Fridge22/02/201828/03/202076534.73%March 2019–March 2020
EB-2Bimby22/02/201828/03/202076528.60%March2019–March 2020
EB-2Washing machine22/02/201828/03/202076533.76%March2019–March 2020
EB-2Lamp22/02/201828/03/202076528.57%March 2019–March 2020
EB-2Fan heater22/02/201828/03/202076515.89%March 2019–March 2020
EB-3Fridge14/04/201828/03/202071487.83%Nov-18
EB-3Air conditioner14/04/201828/03/202071485.16%Nov-18
EB-3Washing machine01/03/201828/03/202075810.26%March 2018, November 2018
EB-3Microwave14/04/201828/03/202071486.41%Nov-18
EB-4Vacuum cleaner02/03/201828/03/20207575.58%February 2020–March 2020
EB-4Kettle02/03/201828/03/202075744.95%February 2020–March 2020
EB-4Washing machine02/03/201828/03/202075752.46%February 2020–March 2020
EB-4Tv02/03/201828/03/202075758.91%February 2020–March 2020
EB-5Dish washer02/03/201828/03/202075758.27%March 2018, 2019, January 2020–March 2020
EB-5Washing machine02/03/201828/03/202075758.68%March 2018,2019, January 2020–March 2020
EB-5Coffee machine02/03/201828/03/202075758.96%March 2018,2019, January 2020–March 2020
EB-6Fridge09/05/201828/03/202068961.57%June 2019–August 2019, January 2020–March 2020
EB-6Dish washer09/05/201828/03/202068952.80%June 2019–August 2019, December 2019, January 2020–March 2020
EB-6Washing machine09/05/201828/03/202068959.37%June 2019–August 2019, January 2020–March 2020
EB-6Microwave05/03/201828/03/202075448.17%March 2018–April 2018, June 2019–August 2019, December 2019, January 2020–March 2020
EB-7Fridge06/03/201828/03/202075355.41%July 2019–March 2020
EB-7Dish washer06/03/201828/03/202075347.23%July 2019–March 2020
EB-7Washing machine06/03/201828/03/202075354.79%July 2019–March 2020
EB-7Microwave06/03/201828/03/202075352.13%July 2019–March 2020
EB-8Vacuum cleaner09/03/201828/03/202075029.95%March 2018–April 2018, August 2018–September 2018, February–March 2020
EB-8Washing machine06/03/201828/03/202075347.61%March 2018–April 2018, August 2018–September 2018, February–March 2020
EB-8TV09/03/201828/03/202075029.37%March 2018–April 2018, August 2018–September 2018, February–March 2020
EB-9Fridge05/04/201828/03/202072365.16%April 2018, January 2020–March 2020
EB-9Dish washer06/04/201828/03/202072265.10%April 2018, January 2020–March 2020
EB-9Washing machine05/04/201828/03/202072326.81%April 2018, January 2020–March 2020
EB-9Microwave19/10/201828/03/202052666.39%January 2020–March 2020
EB-9Fan heater05/04/201828/03/202072364.51%April 2018, January 2020–March 2020
EB-10Fridge04/04/201828/03/202072420.77%August 2018–September 2018, March 2019–May 2019, August 2019–March 2020
EB-10Dish washer05/04/201828/03/202072320.67%August 2018–September 2018, March 2019–May 2019, August 2019–March 2020
EB-10Washing Machine04/04/201828/03/202072420.56%August 2018–September 2018, March 2019–May 2019, August 2019- March 2020
EB-10TV05/04/201828/03/202072320.75%August 2018–September 2018, March 2019–May 2019, August 2019–March 2020
EB-11Fridge19/06/201808/06/202072079.84%April–June 2020
EB-11Washing machine20/06/201808/06/202071979.46%April–June 2020
EB-11Lamp19/06/201808/06/202072075.31%April–June 2020
EB-12Oven27/02/201831/01/202070382.25%No Holes
EB-12Dryer27/02/201831/01/202070315.84%No Holes
EB-12Dishwasher02/03/201831/01/202070083.45%No Holes
EB-12Microwave27/02/201831/01/202070382.37%No Holes
EB-12Washing machine02/03/201831/01/202070017.72%No Holes
EB-12TV27/02/201831/01/202070379.11%No Holes
EB-13Fridge20/06/201808/06/202071944.85%July 2019–June 2020
EB-13Dish washer13/06/201808/06/202072645.74%July 2019–June 2020
EB-13Washing machine13/06/201808/06/202072643.07%July 2019–June 2020
EB-13Warmer07/09/201808/06/202064041.11%July 2019–June 2020
EB-13Oven07/09/201808/06/202064029%April 2019–June 2018
EB-13Fridge12/06/201808/06/202072738.06%April 2019–June 2018
EB-13Dishwasher07/09/201808/06/202064029.49%April 2019–June 2018
EB-13Microwave12/06/201808/06/202072736.31%April 2019–June 2018
EB-13TV12/06/201808/06/202072738.01%April 2019–June 2018
Table A2. Details of Dataset B.
HomeApplianceStart DateEnd DateTime Span DaysAvailable DataData Holes
NEB-1Dryer01/06/202130/11/202118292.20%No Holes
NEB-1Kids’ computer01/06/202130/11/202118240.80%June–August 2021
NEB-1Computer studio01/06/202130/11/202118240.81%June–August 2021
NEB-1Bedroom air conditioner01/06/202130/11/202118259.20%October–November 2021
NEB-1Kids’ room air conditioner01/06/202130/11/202118277.08%No Holes
NEB-1Living room air conditioner01/06/202130/11/202118292.20%No Holes
NEB-1Whole house lighting01/06/202130/11/202118239.86%June–August 2021
NEB-1Dishwasher01/06/202130/11/202118292.22%No Holes
NEB-1Washing machine01/06/202130/11/202118292.23%No Holes
NEB-1Water heater and heat pump01/06/202130/11/202118292.26%No Holes
NEB-1Tv Bedroom01/06/202130/11/202118219.22%June–August 2021, November 2021
NEB-1Tv living room01/06/202130/11/202118240.81%June–August 2021
NEB-2Dryer01/06/202130/11/20211824.80%June–August 2021, October–November 2021
NEB-2Bedroom air conditioner01/06/202130/11/20211820%Whole Period
NEB-2Living room air conditioner01/06/202130/11/202118210.61%June–September 2021
NEB-2Dishwasher01/06/202130/11/20211824.82%June–August 2021, October–November 2021
NEB-2Washing machine01/06/202130/11/202118215.21%June–August 2021, June–August 2021, November 2021
NEB-2Water heater and heat pump01/06/202130/11/20211824.79%June–August 2021, June–August 2021, November 2021
NEB-3Dishwasher01/06/202130/11/202118292.90%No Holes
NEB-3Washing machine01/06/202130/11/202118292.94%No Holes
NEB-3Tv01/06/202130/11/202118292.87%No Holes
NEB-4Bedroom air conditioner01/06/202130/11/20211823.32%June–July 2021, September–November 2019
NEB-4Fridge01/06/202130/11/202118287.77%No Holes
NEB-4Dishwasher01/06/202130/11/202118287.70%No Holes
NEB-4Washing machine01/06/202130/11/202118287.21%No Holes
NEB-5Coffee machine01/06/202130/11/202118283.43%No Holes
NEB-5Fridge01/06/202130/11/202118284.11%No Holes
NEB-5Washing machine01/06/202130/11/202118284.11%No Holes
NEB-5TV01/06/202130/11/202118284.07%No Holes
NEB-6Dryer01/07/202130/11/202115283.75%No Holes
NEB-6Fridge01/07/202130/11/202115283.85%No Holes
NEB-6Washing machine01/07/202130/11/202115283.85%No Holes
NEB-6Dishwasher01/07/202130/11/202115283.84%No Holes
NEB-6Bedroom air conditioner01/07/202130/11/202115273.49%No Holes
NEB-9Washing machine01/06/202130/11/202118256.65%November 2021
NEB-9Dishwasher01/06/202130/11/202118256.57%November 2021
NEB-9Bedroom air conditioner01/06/202130/11/202118256.65%November 2021
NEB-9Bedroom air conditioner201/06/202130/11/202118256.63%November 2021
NEB-9Dryer01/06/202130/11/202118256.60%November 2021
NEB-10Washing machine01/06/202130/11/202118269.66%No Holes
NEB-10Dishwasher01/06/202130/11/202118248.88%No Holes
NEB-10Fridge01/06/202130/11/202118269.63%No Holes
NEB-11Washing machine01/06/202130/11/20211822.70%July–November 2021
NEB-11Dishwasher01/06/202130/11/202118255.68%No Holes
NEB-11Fridge01/06/202130/11/202118255.65%No Holes
NEB-11Bedroom air conditioner01/06/202130/11/202118245.57%October–November2021
NEB-11Air conditioner hobby room01/06/202130/11/20211822.47%July–November2021
NEB-12Fridge01/06/202130/11/202118269.75%No Holes
NEB-12Washing machine01/06/202130/11/202118268.89%No Holes
NEB-12Dishwasher01/06/202130/11/202118269.72%No Holes

References

  1. Gan, P.; Li, Z. An econometric study on long-term energy outlook and the implications of renewable energy utilization in Malaysia. Energy Policy 2008, 36, 890–899. [Google Scholar] [CrossRef]
  2. Herrero, S.; Nicholls, L.; Strengers, Y. Smart home technologies in everyday life: Do they address key energy challenges in households? Curr. Opin. Environ. Sustain. 2018, 31, 65–70. [Google Scholar] [CrossRef]
  3. Jorde, D.; Jacobsen, H. Event detection for energy consumption monitoring. IEEE Trans. Sustain. Comput. 2020, 6, 703–709. [Google Scholar] [CrossRef]
  4. Armel, K.; Gupta, A.; Shrimali, G.; Albert, A. Is disaggregation the holy grail of energy efficiency? The case of electricity. Energy Policy 2013, 52, 213–234. [Google Scholar] [CrossRef] [Green Version]
  5. Lopez, J.; Pouresmaeil, E.; Canizares, C.; Bhattacharya, K.; Mosaddegh, A.; Solanki, B. Smart residential load simulator for energy management in smart grids. IEEE Trans. Ind. Electron. 2018, 66, 1443–1452. [Google Scholar] [CrossRef] [Green Version]
  6. Li, P.; Wang, H.; Zhang, B. A distributed online pricing strategy for demand response programs. IEEE Trans. Smart Grid 2017, 10, 350–360. [Google Scholar] [CrossRef] [Green Version]
  7. AlHammadi, A.; AlZaabi, A.; AlMarzooqi, B.; AlNeyadi, S.; AlHashmi, Z.; Shatnawi, M. Survey of IoT-based smart home approaches. In Proceedings of the 2019 Advances In Science And Engineering Technology International Conferences (ASET), Dubai, United Arab Emirates, 26 March–10 April 2019; pp. 1–6. [Google Scholar]
  8. Barsim, K.; Streubel, R.; Yang, B. An approach for unsupervised non-intrusive load monitoring of residential appliances. In Proceedings of the 2nd International Workshop On Non-Intrusive Load Monitoring, Austin, TX, USA, 3 June 2014; pp. 1–5. [Google Scholar]
  9. Liu, Y.; Qiu, B.; Fan, X.; Zhu, H.; Han, B. Review of smart home energy management systems. Energy Procedia 2016, 104, 504–508. [Google Scholar] [CrossRef]
  10. Yang, J.; Zhao, J.; Wen, F.; Kong, W.; Dong, Z. Mining the big data of residential appliances in the smart grid environment. In Proceedings of the 2016 IEEE Power And Energy Society General Meeting (PESGM), Boston, MA, USA, 17–21 July 2016; pp. 1–5. [Google Scholar]
  11. Errapotu, S.; Wang, J.; Gong, Y.; Cho, J.; Pan, M.; Han, Z. SAFE: Secure appliance scheduling for flexible and efficient energy consumption for smart home IoT. IEEE Internet Things J. 2018, 5, 4380–4391. [Google Scholar] [CrossRef]
  12. Jaradat, A.; Lutfiyya, H.; Haque, A. Appliance Operation Modes Identification Using Cycles Clustering. arXiv 2021, arXiv:2101.10472. [Google Scholar]
  13. Wang, Z.; Srinivasan, R. Classification of household appliance operation cycles: A case-study approach. Energies 2015, 8, 10522–10536. [Google Scholar] [CrossRef] [Green Version]
  14. Silva, B.; Khan, M.; Han, K. Load balancing integrated least slack time-based appliance scheduling for smart home energy management. Sensors 2018, 18, 685. [Google Scholar] [CrossRef] [PubMed]
  15. Chen, M.; Lin, C. Standby power management of a smart home appliance by using energy saving system with active loading feature identification. IEEE Trans. Consum. Electron. 2018, 65, 11–17. [Google Scholar] [CrossRef]
  16. Prudenzi, A. A neuron nets based procedure for identifying domestic appliances pattern-of-use from energy recordings at meter panel. In Proceedings of the 2002 IEEE Power Engineering Society Winter Meeting. Conference Proceedings (Cat. No. 02CH37309), New York, NY, USA, 27–31 January 2002; Volume 2, pp. 941–946. [Google Scholar]
  17. Wang, H.; Yang, W. An iterative load disaggregation approach based on appliance consumption pattern. Appl. Sci. 2018, 8, 542. [Google Scholar] [CrossRef] [Green Version]
  18. Hussain, H.; Javaid, N.; Iqbal, S.; Hasan, Q.; Aurangzeb, K.; Alhussein, M. An efficient demand side management system with a new optimized home energy management controller in smart grid. Energies 2018, 11, 190. [Google Scholar] [CrossRef] [Green Version]
  19. Du, S.; Li, M.; Han, S.; Shi, J.; Li, H. Multi-pattern data mining and recognition of primary electric appliances from single non-intrusive load monitoring data. Energies 2019, 12, 992. [Google Scholar] [CrossRef] [Green Version]
  20. Ashouri, M.; Haghighat, F.; Fung, B.; Lazrak, A.; Yoshino, H. Development of building energy saving advisory: A data mining approach. Energy Build. 2018, 172, 139–151. [Google Scholar] [CrossRef]
  21. Gajowniczek, K.; Ząbkowski, T. Data mining techniques for detecting household characteristics based on smart meter data. Energies 2015, 8, 7407–7427. [Google Scholar] [CrossRef] [Green Version]
  22. Yu, Z.; Fung, B.; Haghighat, F. Extracting knowledge from building-related data—A data mining framework. Build. Simul. 2013, 6, 207–222. [Google Scholar] [CrossRef]
  23. Ashouri, M.; Fung, B.; Haghighat, F.; Yoshino, H. Systematic approach to provide building occupants with feedback to reduce energy consumption. Energy 2020, 194, 116813. [Google Scholar] [CrossRef]
  24. Athanasiadis, C.; Doukas, D.; Papadopoulos, T.; Chrysopoulos, A. A scalable real-time non-intrusive load monitoring system for the estimation of household appliance power consumption. Energies 2021, 14, 767. [Google Scholar] [CrossRef]
  25. Athanasiadis, C.; Papadopoulos, T.; Doukas, D. Real-time non-intrusive load monitoring: A light-weight and scalable approach. Energy Build. 2021, 253, 111523. [Google Scholar] [CrossRef]
  26. Ge, L.; Liao, W.; Wang, S.; Bak-Jensen, B.; Pillai, J. Modeling daily load profiles of distribution network for scenario generation using flow-based generative network. IEEE Access 2020, 8, 77587–77597. [Google Scholar] [CrossRef]
  27. Fischer, D.; Härtl, A.; Wille-Haussmann, B. Model for electric load profiles with high time resolution for German households. Energy Build. 2015, 92, 170–179. [Google Scholar] [CrossRef]
  28. Widen, J.; Lundh, M.; Vassileva, I.; Dahlquist, E.; Elleg, K.; Wäckelg, E. Constructing load profiles for household electricity and hot water from time-use data—Modelling approach and validation. Energy Build. 2009, 41, 753–768. [Google Scholar] [CrossRef]
  29. Wijaya, T.; Vasirani, M.; Humeau, S.; Aberer, K. Cluster-based aggregate forecasting for residential electricity demand using smart meter data. In Proceedings of the 2015 IEEE International Conference On Big Data (Big Data), Santa Clara, CA, USA, 29 October–1 November 2015; pp. 879–887. [Google Scholar]
  30. Khan, Z.; Jayaweera, D.; Alvarez-Alvarado, M. A novel approach for load profiling in smart power grids using smart meter data. Electr. Power Syst. Res. 2018, 165, 191–198. [Google Scholar] [CrossRef]
  31. Sousa, J.; Neves, L.; Jorge, H. Assessing the relevance of load profiling information in electrical load forecasting based on neural network models. Int. J. Electr. Power Energy Syst. 2012, 40, 85–93. [Google Scholar] [CrossRef]
  32. Hayn, M.; Bertsch, V.; Fichtner, W. Electricity load profiles in Europe: The importance of household segmentation. Energy Res. Soc. Sci. 2014, 3, 30–45. [Google Scholar] [CrossRef]
  33. Yilmaz, S.; Chambers, J.; Patel, M. Comparison of clustering approaches for domestic electricity load profile characterisation-Implications for demand side management. Energy 2019, 180, 665–677. [Google Scholar] [CrossRef]
  34. Craig, T.; Polhill, J.; Dent, I.; Galan-Diaz, C.; Heslop, S. The north east scotland energy monitoring project: Exploring relationships between household occupants and energy usage. Energy Build. 2014, 75, 493–503. [Google Scholar] [CrossRef]
  35. Martinez-Pabon, M.; Eveleigh, T.; Tanju, B. Smart meter data analytics for optimal customer selection in demand response programs. Energy Procedia 2017, 107, 49–59. [Google Scholar] [CrossRef]
  36. Zhou, K.; Fu, C.; Yang, S. Big data driven smart energy management: From big data to big insights. Renew. Sustain. Energy Rev. 2016, 56, 215–225. [Google Scholar] [CrossRef]
  37. Zhou, K.; Yang, S. Understanding household energy consumption behavior: The contribution of energy big data analytics. Renew. Sustain. Energy Rev. 2016, 56, 810–819. [Google Scholar] [CrossRef]
  38. Laicane, I.; Blumberga, D.; Blumberga, A.; Rosa, M. Reducing household electricity consumption through demand side management: The role of home appliance scheduling and peak load reduction. Energy Procedia 2015, 72, 222–229. [Google Scholar] [CrossRef] [Green Version]
  39. Gyamfi, S.; Krumdieck, S.; Urmee, T. Residential peak electricity demand response—Highlights of some behavioural issues. Renew. Sustain. Energy Rev. 2013, 25, 71–77. [Google Scholar] [CrossRef] [Green Version]
  40. Azarova, V.; Cohen, J.; Kollmann, A.; Reichl, J. Reducing household electricity consumption during evening peak demand times: Evidence from a field experiment. Energy Policy 2020, 144, 111657. [Google Scholar] [CrossRef]
  41. Weber, S.; Puddu, S.; Pacheco, D. Move it! How an electric contest motivates households to shift their load profile. Energy Econ. 2017, 68, 255–270. [Google Scholar] [CrossRef] [Green Version]
  42. Crosbie, T.; Broderick, J.; Short, M.; Charlesworth, R.; Dawood, M. Demand response technology readiness levels for energy management in blocks of buildings. Buildings 2018, 8, 13. [Google Scholar] [CrossRef] [Green Version]
  43. Issi, F.; Kaplan, O. The determination of load profiles and power consumptions of home appliances. Energies 2018, 11, 607. [Google Scholar] [CrossRef] [Green Version]
  44. Wenninger, M.; Maier, A.; Schmidt, J. DEDDIAG, a domestic electricity demand dataset of individual appliances in Germany. Sci. Data 2021, 8, 176. [Google Scholar] [CrossRef]
  45. Clerici Maestosi, P. Sustainable Urban Transitions; Maggioli Publisher: Santarcangelo di Romagna, Italy, 2021. [Google Scholar]
  46. Aggiornamento delle Fasce Orarie Con Decorrenza 1 Gennaio 2007. ARERA. Available online: https://www.arera.it/it/docs/06/181-06.html (accessed on 2 August 2022).
  47. Monacchi, A.; Egarter, D.; Elmenreich, W.; D’Alessandro, S.; Tonello, A. GREEND: An energy consumption dataset of households in Italy and Austria. In Proceedings of the 2014 IEEE International Conference On Smart Grid Communications (SmartGridComm), Venice, Italy, 3–6 November 2014; pp. 511–516. [Google Scholar]
Figure 1. Smart home: representation of sensors.
Energies 16 00824 g001
Figure 2. Percentage of available data for Dataset A.
Energies 16 00824 g002
Figure 3. Percentage of available data for Dataset B.
Energies 16 00824 g003
Figure 4. Flow chart of the numerical model.
Energies 16 00824 g004
Figure 5. Cumulative distribution of the energy consumption.
Energies 16 00824 g005
Figure 6. Automatic identification of the phases in the consumption profile of a single washing cycle of a washing machine.
Energies 16 00824 g006
Figure 7. Automatic detection of two consecutive washing cycles.
Energies 16 00824 g007
Figure 8. Duration, start time, and energy consumption of a washing machine’s cycles.
Energies 16 00824 g008
Figure 9. Subdivision of records (upper graph) and consumption (lower graph) based on the type of operation for a washing machine.
Energies 16 00824 g009
Figure 10. Monthly subdivision of records based on the type of operation for a washing machine.
Energies 16 00824 g010
Figure 11. Monthly allocation of consumption in the three time slots defined by ARERA.
Energies 16 00824 g011
Figure 12. Monthly allocation of consumption according to the user-defined daytime slots.
Energies 16 00824 g012
Figure 13. Energy recorded and extrapolated by the model for different dishwashers.
Energies 16 00824 g013
Figure 14. Percentage of short and long cycles for dishwashers.
Energies 16 00824 g014
Figure 15. Energy consumption in short and long cycles for dishwashers.
Energies 16 00824 g015
Figure 16. Comparison of energy consumption cycles occurred in close succession for the washing machine.
Energies 16 00824 g016
Figure 17. Feedback on the DHOMUS platform regarding the use of washing machine (in Italian).
Energies 16 00824 g017
Figure 18. Section of the DHOMUS dashboard reporting the user’s consumption vs. average consumption of other similar users (in Italian).
Energies 16 00824 g018
Table 1. Sensors used in the experimentation.
SensorManufacturer/ModelMeasured Quantity
Home energy meterAeotec/ZW095-Cpower, energy
Smart plugAeotec/switch 7power, energy, current, voltage
Sensor and integrated or
comfort-presence
Aeotec/Multisensory 6temperature, illuminance, humidity,
movement
Door/window contactAeotec/Door window sensoropening/closing
Table 2. Input data for the model.
ParametersDescription
home_idName of the energy box
sensorName of the sensor associated with the appliance
dateDatetime
sum_of_energy_of_powerEnergy provided in Wh on a quarter-hour basis
delta_energyEnergy counter, in Wh or kWh
last_value_switchsensor parameter (not used)
Table 3. Parameter tuning for washing machines.
ParameterCalibrated ValueTuning Range
st_by_prc98[90–99]
min_dur30 min[15 30 45]
min_Wh100 Wh[50 100 150 500]
thr_en800 Wh[500 600 700 800]
thr_d145 min[15 30 45]
thr_d2120 min[90 105 … 500]
Table 4. Comparative analysis on energy consumption for washing machines.
HomeECNoP Tn θ PEC P θ s AEC θ s P θ L AEC θ L
R θ Ex θ Peak Hours PR θ s PEx θ s (kWh) PR θ L PEx θ L (kWh)
EB-2A29911428%6%6%1.14054%53%8.523
NEB-4A2313645%65%64%2.263000
EB-3A++434039172%7%6%2.06242%41%18.295
NEB-9A++3312696%9%88%3.759000
NEB-10A++2807444%86%85%3.662000
EB-9A+++3822165%12%19%1.4924%02.521
NEB-1A+++4768260%64%65%3.2641%1%1.558
Disclaimer/Publisher’s Note: The statements, opinions and data contained in all publications are solely those of the individual author(s) and contributor(s) and not of MDPI and/or the editor(s). MDPI and/or the editor(s) disclaim responsibility for any injury to people or property resulting from any ideas, methods, instructions or products referred to in the content.