Abstract
Renewable energy is increasingly mobilizing more investment around the globe. However, there has been little attention to evaluating economic and regulatory (E&R) uncertainties, despite their enormous impact on the project cashflows. Consequently, this review analyzes, classifies, and discusses 130 articles dealing with the design of renewable energy projects under E&R uncertainties. After performing a survey and identifying the selected manuscripts, and the few previous reviews on the matter, the following innovative categorization is designed: sources of uncertainty, uncertainty characterization methods, problem formulations, solution methods, and regulatory frameworks. The classification reveals that electricity price is the most considered source of uncertainty, often alone, despite the existence of six other equally influential groups of E&R uncertainties. In addition, real options and optimization arise as the two main approaches researchers use to solve problems in energy system design. Subsequently, the following aspects of interest are discussed in depth: how modeling can be improved, which are the most influential variables, and potential lines of research. Conclusions show the necessity of modeling E&R uncertainties with currently underrepresented methods, suggest several policy recommendations, and encourage the integration of prevailing approaches.
1. Introduction
The global energy landscape is currently shifting at a tremendous speed. Investments in renewable energy (RE) were already considered a catalyst for the post-COVID economic recovery [1]. However, after the turmoil in the energy markets caused by the war in Ukraine, their relevance has been emphasized. According to the International Energy Agency, clean energy investment accounted for three-quarters of the growth in total energy investment in 2022 [2]. This represents an important step in the right direction but falls short of what is needed to meet international climate goals. Therefore, it is imperative to keep mobilizing investment in RE from all available sources.
A proven relationship exists between investor engagement in RE projects and risk or uncertainty [3]. Uncertainty can be defined as the inherent variability and unpredictability of several system parameters (i.e., aleatory uncertainty) plus the limitations of our knowledge of the subject (epistemic uncertainty) [4]. It is generally accepted that engagement increases when either the expected return increases or when the negative consequences of uncertainty are better forecasted. Therefore, one of the challenges researchers in RE face is quantifying the uncertainty arising in the system design [5].
1.1. Literature Review
Uncertainty quantification in RE systems has been reviewed thoroughly in the literature [5,6,7]. However, they tend to focus exclusively on the optimal design problem [5,7] or the uncertainty coming from physical parameters [6]. Uncertainty related to economic and regulatory (E&R) factors, although always present in RE projects [5], has received much less attention.
Among the few works that deal with E&R variables, it is worth highlighting the work of Schachter and Mancarella [8], which offers a comprehensive analysis of real options analysis (ROA). The review discusses the limitations of typical discounted cash flow (DCF) methods for assessing energy projects. It later describes how ROA can overcome these limitations and how uncertainties can be integrated into the different ROA models.
Ioannou et al. [9] use a more general approach, which details a literature review of models capturing uncertainties in sustainable energy planning. The classification includes ROA, optimization and simulation methods, portfolio theory, and semi-quantitative analyses. The strengths and weaknesses of each approach are outlined, and it is concluded that no method goes for everything.
Lastly, a review by Murgas et al. [10] evaluates the state-of-the-art in wind energy investment between 2006 and 2020. The authors employed a different classification of the models but identified that the ROA approach was the most popular and that electricity price was the most acknowledged uncertain parameter.
1.2. Objectives
However, to the authors’ best knowledge, no works systematically define and classify E&R uncertainties relevant to RE projects. In addition, as Table 1 shows, the highlighted reviews about uncertainty modeling focus on a single RE technology [10] or problem formulation [5,7,8], do not include E&R parameters [6], or do not detail solution algorithms or methods [9,10]. This review attempts to cover this gap in the following way:

Table 1.
Literature review summary and contributions of this study.
- -
- Update the state-of-the-art in the design of RE systems, covering the most relevant articles dealing with at least one uncertain economic or regulatory variable;
- -
- Perform a detailed classification of the articles, categorizing the sources of uncertainty (SoUs), uncertainty characterization methods (UCMs), problem formulations, solving methods, and regulatory frameworks (RFs). This classification exceeds the scope of previous reviews;
- -
- Identify the trends in the design of RE systems under uncertainty, based on the results of the classification as follows: which are the most relevant approaches for each category, and which are emerging;
- -
- Discuss future lines of research and provide modeling recommendations based on the findings.
The article is organized as follows: Section 2 details the methodology of this review. Section 3 exposes the different RFs encountered. Section 4 defines the SoU, while Section 5 identifies the main UCMs used in the context of RE systems. Section 6 includes the aspects related to mathematical modeling, while Section 7 discusses the findings of this review. Finally, conclusions are outlined in Section 8.
2. Methodology
The literature review for this article was conducted systematically. Several queries have been performed on the Scopus database to identify potential references. The queries included keywords that aimed to obtain true positives (all relevant literature) while avoiding false negatives (missing important articles) altogether. The queries also sought to keep the number of false positives (unrelated literature) at a minimum.
Candidate articles must at least: deal with RE projects, employ a quantitative model, and consider economic or regulatory uncertainties. The queries included words referring to all three aspects (Figure 1). Terms referring to the same aspect were joined with an OR operator, and all three parts were combined with AND operators. After obtaining all potential references, the authors manually crafted the final selection after conducting a high-level review and verifying that their publication date was 2015 or later. This process resulted in 130 references. [11,12,13,14,15,16,17,18,19,20,21,22,23,24,25,26,27,28,29,30,31,32,33,34,35,36,37,38,39,40,41,42,43,44,45,46,47,48,49,50,51,52,53,54,55,56,57,58,59,60,61,62,63,64,65,66,67,68,69,70,71,72,73,74,75,76,77,78,79,80,81,82,83,84,85,86,87,88,89,90,91,92,93,94,95,96,97,98,99,100,101,102,103,104,105,106,107,108,109,110,111,112,113,114,115,116,117,118,119,120,121,122,123,124,125,126,127,128,129,130,131,132,133,134,135,136,137,138,139,140]. The other 36 references found in this review are used to justify several claims made by the authors or to acknowledge the use of intellectual property. The methodology process and the relevant keywords are schematized in Figure 1.
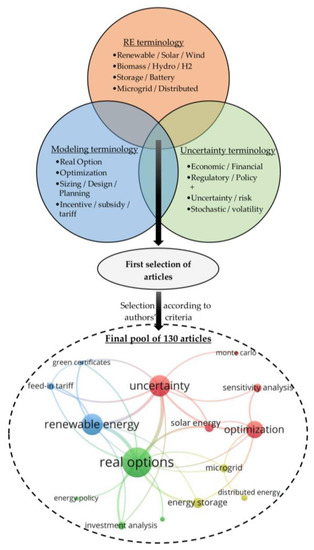
Figure 1.
Methodology schematization and keyword network of the reviewed articles.
After completing the article pool, the classification system was devised. We first based our classification on [6], which makes the distinction between handling approaches (here, UCMs) and uncertain parameters (here, SoUs). However, as in [9], there was the need to distinguish the different quantitative approaches encountered (e.g., ROA and optimization). Therefore, the category of problem formulation was created. After that, the classification was completed with the solution methods, which had been exposed independently for ROA [8] and optimization [7]. The content exposed in each category may differ from previous reviews. For instance, Monte Carlo is a UCM in [6], while it is a solving method in [8] and this review. The classification is schematized in Figure 2 as follows:
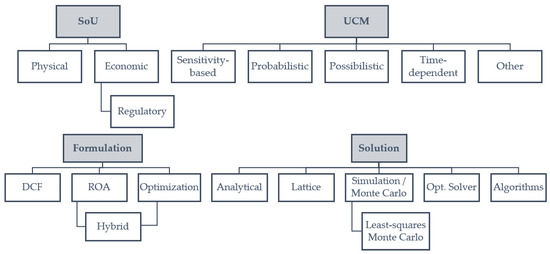
Figure 2.
Classification of the articles analyzed in this review.
To finish, as this review deals with E&R uncertainty, and the uncertain parameters change depending on the policy scheme, we identified each of the RFs that appear in the papers. This has not been performed in any review dealing with uncertainty in RE.
3. Regulatory Frameworks
This section explains the different policies that have been adopted to promote RE systems and have been found in the pool of articles. Including one or more of these RFs does not entail the realization of an uncertainty analysis. However, the parameters that can be uncertain (i.e., the SoUs) change depending on the RF applied, so it is essential to define these policies in advance.
3.1. Feed-In Tariff and Feed-In Premium
The most widespread frameworks in the analyzed literature are feed-in tariff (FiT) and feed-in premium (FiP). These systems remunerate the energy fed into the grid, hence the name. Feed-in mechanisms foster RE by a fixed tariff—FiT—established by law or by adding a premium—FiP—over the market price.
Feed-in mechanisms are characterized by three elements [141]. First, renewable producers are guaranteed priority access to the grid. Second, the electricity grid is forced to absorb all the RE that is fed into it. Additionally, the government determines a minimum tariff or premium for the sale of renewable electricity. The amount and type of the subsidy change depending on the source, size, and location of the plant, and because of political goals.
FiT and FiP should decrease with time to promote technological change. The more mature a technology is, the less subsidized it needs to be [130]. A low tariff might discourage investment in RE. Still, the adverse effects of an excessive tariff are well studied in the literature as follows: investing in less capacity [31], hindering battery adoption [137], and increasing government expenditure futilely [74,120]. In addition, the tariff should be fully disclosed from the beginning so that investors can predict their remuneration during the project’s lifespan. In practice, however, tariffs and premiums change several times during the lifetime of a facility, and often in an unforeseeable manner [33]. Policymakers should combat this regulatory uncertainty to attract investment in RE technologies.
3.2. Net Metering and Net Billing
Net metering (NM) and net billing (NB) are designed specifically for prosumers. Under these frameworks, the utility company introduces a bidirectional meter, meaning it goes backward if on-site generation exceeds on-site demand. At the end of the billing period, which can be hourly, daily, or monthly, the consumer only pays for their net consumption—NM—or their net monetary balance—NB—[50]. When paying for net consumption, the difference between the energy consumption and the energy fed into the grid is charged at a fixed rate. Under NB, rates between purchased and sold energy may differ. NM and NB systems help promote small-scale renewable plants without the risk of incurring excessive government expenditure [142]. However, they also increase the chances of a utility death spiral [93], where passive consumers are obliged to adopt self-consumption, not to pay the distribution costs that other prosumers managed to offset.
3.3. Renewable Portfolio Standard and Trading Certificate Systems
Renewable portfolio standards (RPS) require that a minimum percentage of electricity generation comes from renewable sources. Utilities and other qualified entities that operate under an RPS obtain RE credits or certificates (REC). One REC represents the benefit of generating one MWh of renewable electricity and is used to verify that utilities meet environmental targets. These certificates are tradable. Utilities that generate more RECs than their requirements may profit from selling them to utilities that cannot meet the minimum RE share.
RECs are quantity-based subsidies, in opposition to feed-in mechanisms, which are price-based subsidies. Some studies claim certificate markets expose investors to significant risk because, unlike FiT, the support level is not fixed. It is determined by the market price of the certificates, which can be extremely volatile to regulatory changes [57]. However, market-based support policies such as RECs are said to be more cost-effective than price-based subsidies [108], and more governments are considering their implementation.
3.4. Investment Subsidies
Investment subsidies are employed when market conditions are good enough not to need a feed-in mechanism to promote RE. RE operating costs are generally low, but capital costs may dishearten some investors when planning a power plant. Direct reduction of capital expenditures (CAPEX) via subsidy is proved to prompt earlier or greater investment [29]. Compared to other mechanisms, which extend in time, direct subsidies give investors certainty about the amount of money that will be available at the commissioning of the facility. However, direct subsidies must be paid upfront using public finances, which can be detrimental to the government.
3.5. Tax Credits
Likewise, tax credits reduce the burden that investors face at the time of promoting a facility. The US has implemented both Investment Tax Credit (ITC) and Production Tax Credit (PTC) schemes. Under the ITC, homeowners receive credits proportionally to their investment amount. Under the PTC, investors obtain credit for every unit of energy produced. These credits can later be applied to reduce or waive personal or corporate income taxes, value-added tax, and property tax [60]. Tax benefits have been proven to make profitable projects that previously had negative NPV [48].
3.6. Market Price with Guarantee or Adjustment
Feed-in mechanisms tend to concentrate risk on one of two sides. The fixed rate of FiT focuses all the risk on the policymaker, shielding the investor from market volatility. FiP, on the other hand, fully exposes the investor to the market price risk. A guarantee or price floor on the market price can be incorporated to divide risks between agents [47]. A cap may also be introduced to compensate for the risk the policymaker incurs in setting the guarantee. Other variants of this scheme include a shared upside between investor and policymaker [47] and a FiT where the tariff is not fixed but instead based on the average market price [143].
3.7. Capacity Payments
Capacity mechanisms provide payments to power plants for being available for generating electricity when needed. Renewable power plants have always been ruled out of these mechanisms because of their intermittency. However, there have been cases of successful capacity mechanisms for promoting RE [71]. The capacity payment studied in [71] sets an annuity based on project costs and neglects revenues from electricity sales. The capital cost part is corrected by a performance coefficient, which sets a cap on the payments once the target energy production per unit of capacity has been achieved. The authors claim that under this scheme, investors are shielded from market risk as effectively as with FiT, and capacity choice is not determined by the amount of subsidy but by practical factors such as local demand, grid access, and generation potential.
3.8. Summary
In Figure 3, the main RFs are ranked by the number of articles that consider them. It can be seen how FiT is, by far, the most common policy that researchers choose to model.
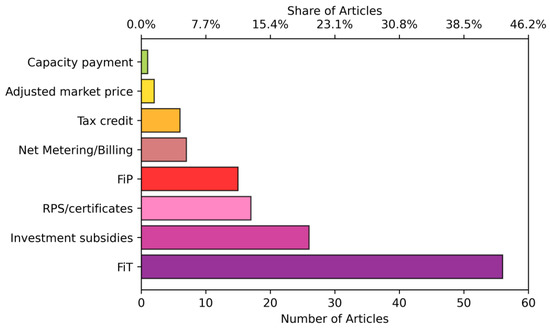
Figure 3.
Number and share of articles in the pool that consider each RF. Each article may consider more than one RF.
However, as RE technologies are reaching maturity, the use of FiT is decreasing in favor of other RFs, particularly REC and FiP. These schemes take advantage of the market forces to compensate RE and entail a smaller risk for the policymaker.
4. Sources of Uncertainty
This section identifies and describes the SoUs appearing in the article pool. Including E&R uncertainties was the primary requirement for articles to be included in the pool. Many of these articles also analyze uncertainty in physical parameters. What differentiates them is that E&R parameters can be affected by policy changes.
The distinction between economic and regulatory uncertainties is very thin. For instance, electricity and technology prices are mainly driven by market forces, although regulation can intervene in prices by, for example, adding taxes or setting a cap. On the other side, the level and duration of a FiT, although based on the current market trends, are mostly set by policymakers.
Therefore, SoUs are divided into two sections: Section 4.1 devotes to explaining physical uncertainty, and Section 4.2 describes E&R uncertainties. Section 4.3 summarizes the findings.
4.1. Physical Uncertainty
4.1.1. Renewable Generation
New RE investments consist primarily of solar and wind energy [1]. Both are highly dependent on the weather; therefore, the facility’s total annual output at the end of a given year is uncertain. As these facilities make money by selling energy or reducing net load, the output variability causes income uncertainty.
In the short term, RE and load uncertainty affect the system’s operation, as generation and demand must always match. The use of flexibility devices, such as storage [19] or electric vehicles [89] and demand response [139] helps to overcome this uncertainty.
4.1.2. Load and Load Growth
The consumption of a single building can be extremely volatile. Factors such as different appliances, work schedules, habits, and finances influence the amount and time of energy demanded. However, load exhibits some regularities when aggregated [57], such as regular peaks and valleys of consumption. This allows for building a model that appropriately represents load.
Load growth is also modeled extensively [42,52,112]. Although in developed countries, load growth is practically nonexistent or even decreasing, in developing countries, it can be challenging to forecast [55].
4.1.3. Component Failure or Degradation
Mechanical components suffer wear, and in the case of RE, it directly influences the amount of energy produced and, subsequently, the facility’s profits. Therefore, wear must be accounted for in a multi-year simulation to estimate cash flows correctly. Wear can be modeled by considering the probability of failure. In [135,136], a Bernouilli distribution represents the failure chances of a biomass CHP plant.
Wear can also be modeled by a degradation coefficient, which reduces output [18], or by assuming an extra cost [17,116]. In the case of photovoltaics (PV), most panel manufacturers establish that performance decreases linearly [110]. Degradation, however, is an uncertain event that depends on the use of the facility and external factors such as climate. A remarkably complex degradation process occurs in batteries, where magnitudes such as temperature, state of charge, depth of discharge, and C-rate influence their lifetime number of cycles [66]. Algorithms such as rainflow counting [90] or depth of discharge calculation [15] allow estimating the battery lifetime, though their nonlinear procedures increase problem complexity.
4.2. Economic and Regulatory Uncertainty
4.2.1. Electricity Price
Electricity price is the most widespread SoU in the analyzed papers. In most regulations, RE producers must provide bids containing the amount and price of the energy offered for every hour of the day in advance. As RE facilities have a low, almost zero cost of opportunity (unless they can store energy), bids are usually low too. This allows them to have priority in the market and perceive the clearing price, which depends on the most expensive technology producing at that time. That technology, in turn, is determined by factors such as the aggregate demand [106], the amount of low opportunity cost facilities (such as RE [70] and nuclear), the price of other commodities such as fuel or natural gas (NG) [69], and even carbon price [131]. As a result, the electricity price is highly uncertain.
4.2.2. Fuel Price
Like the electricity price, the fuel price (coal, NG, or oil) is determined in international markets and is subject to rapid changes. Articles on the pool mainly forecast these prices to compare how valuable RE is as an alternative to a fossil-fueled system. However, NG also has a strong influence on electricity prices, and in consequence, on RE profitability [144]. Combined cycles are more efficient than other non-renewable power plants and have a high opportunity cost and fast ramp-up times. This leads them to be the marginal technology (the one that sets the clearing price) for many hours of the day. Consequently, the evolution of NG prices is studied thoroughly [80,86,140] and even modeled jointly with electricity prices [95].
4.2.3. CO2 Price
Emission trading systems (ETS) aim to facilitate emission reductions where it is cheapest to achieve them [145]. In an ETS, members transact the rights to emit a unit of pollution, commonly measured by tons of CO2 equivalent. The government establishes a cap on emissions in every sector. Those who wish to pollute more must buy emission permits from those who do not need to pollute up to their cap. Currently, the EU, Canada, China, Japan, New Zealand, South Korea, Switzerland, and the US operate an ETS [145]. A higher CO2 price may promote the development of RE because it makes fossil fuel systems more expensive to operate [38,133]. It also increases the electricity clearing price, which depends on NG, and reduces the subsidy needs [129,130]. However, its long-term effect is debated [146], and volatility in the carbon price may hinder its effectivity [76].
4.2.4. Capital and Operational Expenditures
RE technologies are constantly developing, and their costs are progressively reduced at an uncertain pace. The levelized cost of energy (LCOE) of utility-scale PV and on-shore wind projects declined by 90% and 72%, respectively, between 2009 and 2021 [147]. This decline is expected to continue during the following years, though less steep than in the last decade. Even some voices warn that costs may rise again [146]. Researchers acknowledge this and consider CAPEX, operational expenditures (OPEX), or both as uncertain parameters.
4.2.5. Subsidy Payments and Regime Switching
Mechanisms that promote RE are varied (Section 3), and determining the right type and amount of subsidy that every facility should perceive is challenging. Depending on the RF, subsidy payments are different, and the variables that can be uncertain change, as summarized in Table 2.
Table 2.
Variables that can be an SoU depending on the RF.
In addition, it is not safe to assume that subsidies will remain constant during the facility’s lifetime. For example, in Spain, subsidy retraction became a reality in 2014 [113]. Additionally, even governments that opt for a fixed FiT recognize the need to update the rates every few years [45]. Therefore, the amount of subsidy and the sudden change of RF are acknowledged as SoUs in the literature.
4.2.6. Discount Rates
RE facilities’ lifetime extends, in most cases, over two decades. Therefore, when evaluating their net present value (NPV), it is imperative to discount future cashflows with an appropriate rate. Many papers employ the risk-free rate directly related to the inflation rate. Inflation can change (and has changed) abruptly between consecutive years, especially in developing economies [104], which justifies considering the risk-free rate as a potential SoU.
However, even the safest investment carries a non-zero amount of risk. Therefore, many researchers prefer to employ a risk-adjusted rate [30], which consists in adding a risk premium to the risk-free rate. Some studies use the weighted average cost of capital (WACC) [29,63], which is the expected cost of financing a company’s debt and equity.
4.2.7. Other Economic Rates
Other uncertain economic rates are tax, financing, and currency exchange rates. Taxes reduce the profitability of a project by taking a percentage of the revenue generated by selling energy or a fixed amount on the land used to install the facility. Tax rates tend to change several times over the lifespan of a RE facility [22]. Loan rates determine the interest the project promoter must pay back at the bank for borrowing money. It is frequently considered static once the loan has been taken, but if the investment is postponed in time (case analyzed in ROA), it can be regarded as uncertain [60,61,62,63].
Some RE facilities are installed in countries whose currency fluctuates with respect to the US dollar. As many international transactions (e.g., fuel purchases) are performed in US dollars, there is a risk that the fluctuation of the local currency affects the feasibility of the RE facility. In addition, many microgrid projects are financed in a stable currency [121], and many components must be bought internationally. Therefore, the risk of a currency devaluation can be harmful to the profitability of a project and must be accounted for [63].
4.3. Summary
Physical SoUs are ranked in Figure 4a, while economic uncertainties are ranked in Figure 4b. Electricity price is the most considered SoU, followed by technology costs. Other commodity prices or interannual rates are less often modeled as uncertain.
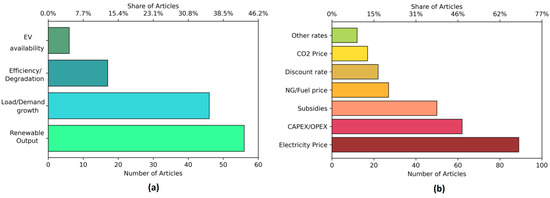
Figure 4.
Number and share of articles in the pool that consider each source of physical uncertainty (a) and E&R uncertainty (b). Each article considers one or more E&R uncertainty but may not consider any physical uncertainty.
Regarding physical uncertainty, renewable generation and demand are widely considered in the literature, while component failure, degradation, lack of efficiency, or availability are behind.
In addition, subsidy uncertainty can be further decomposed depending on the RF (Figure 5).
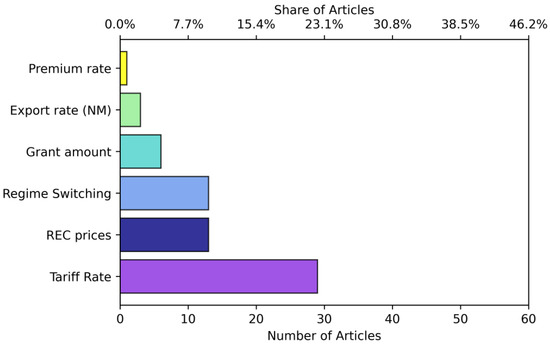
Figure 5.
Number and share of articles in the pool that consider each source of subsidy uncertainty, which depends on the RF. As each article can consider more than one RF, the sum of all the SoUs considered in this graph is greater than the subsidy uncertainty in Figure 4.
It is important to note that these results are valid for the articles analyzed in this review, which all consider E&R uncertainties. In the field of RE design under uncertainty, physical uncertainties dominate overall [148].
5. Uncertainty Characterization Methods
The following section explains various mathematical techniques used to capture and model uncertainties in RE projects. These techniques are called UCMs and are divided into the following different groups: sensitivity-based approaches, where the values of uncertain parameters are manually changed; probabilistic and possibilistic approaches, where the parameter is assumed to follow a specific distribution or membership function; time-domain parametric models, used to model the evolution of uncertainty with time; other approaches that do not fit into any of the previous categories.
5.1. Sensitivity or Scenario Approaches
5.1.1. Sensitivity Analysis
Sensitivity analysis (SA) is the most straightforward method to capture uncertainties in RE design. With this method, a single parameter is changed at a time, and its effects on the output are evaluated. SA supports decision making because it reveals which variables the outcome is more sensitive to, which allows planning contingency measures where they are needed the most. For example, if SA reveals that a slight increase in the price of a particular fuel causes a steep decline in revenues, the decision-maker can opt for a design that avoids its use. SA has been employed on variables such as discount rate [21,62], carbon tax [117], average annual irradiance [50], different tariff designs [35], energy and demand charges [14], subsidy level [128], CAPEX [110], battery lifetime and diesel price [62].
5.1.2. Global Sensitivity Analysis
While local SA performs a one-at-a-time variation of the SoU, a global SA (GSA) considers the mutual interaction of the uncertain parameters. Hence, it allows the formulation of a more precise contingency plan. GSA is classified into screening methods (e.g., Morris method) or sampling-based methods (e.g., Sobol method) [87]. The Morris method performs a screening by discretizing the stochastic space defined by the SoUs. SA is performed on the discretized points, and the elementary effects on each input parameter are quantified and ranked. This process allows for identifying the most critical drivers of the uncertainty in the system output. In the context of E&R uncertainty, the Morris method is applied to long-term energy planning [6,100] and for the robust design of a remote microgrid [96].
Alternatively, sampling-based methods cover the entire stochastic space, defined probabilistically. After sampling the input distributions, a Sobol index quantifies the relative contribution of an input parameter to the total variance on the system output. Surrogate-assisted GSA significantly improves the computational efficiency of the Sobol method. A surrogate model using polynomial chaos expansion (PCE) has been applied in whole-energy systems [149] and proved computationally efficient for a high stochastic dimension [43]. In the context of PCE, the coefficients in the expansion allow an analytical quantification of the Sobol indices. Hence, no post-process sampling method is required once the PCE is constructed.
5.2. Probabilistic and Possibilistic Approaches
5.2.1. Probability Distribution Functions
One major drawback of SA is that alterations of the uncertain parameters are often arbitrary. However, some uncertain parameters can be appropriately characterized by a probability distribution function (PDF). By this method, estimates of the SoU over many simulations approximate the observed values. The use of PDF aids in decision-making because it provides the expected value and variability of the involved variables and the outcome. It also allows the use of stochastic formulations, which provide more realistic solutions than deterministic ones [150].
For wind speed uncertainty, it is common to use Weibull distribution [12,112], while solar irradiance is often modeled by Beta distribution [72]. Normal distribution does the same for load and electricity price [91], and uniform distributions are often used with SA [64,88]. With less frequency, other PDFs can be observed in the literature as follows: log-normal for market price [17], PERT for discount rate [99], half-normal for costs [64], and distributions estimated from historical data [37,53].
Another related approach is to fit a regression curve to estimate the values of the SoU. This approach has been used to relate costs with time [56], industry growth rate [32], cumulative installed capacity [65,73,120], or cumulative R&D capacity [132]. The simulated value is the sum of the forecast and a random noise normally distributed with a mean of 0.
Finally, a PDF approach can be combined with risk constraints to increase model robustness. Risk constraints have the goal of limiting the undesirable consequences of uncertainty realization. The most common risk metric is the conditional value at risk (CVaR), which measures the right tail of the risk distribution [115]. CVaR has been used repeatedly in RE system design [77,95,106,132].
5.2.2. Fuzzy Theory
Fuzzy theory is a possibilistic approach that quantifies risks based on qualitative variables and represents uncertainty in the absence of complete data [58]. Fuzzy theory uses fuzzy sets, which, instead of containing elements, assigns its members a degree of membership. While in classical sets, the elements are either in or out (binary), in fuzzy sets, membership is a real number between 0 and 1. Therefore, elements can partly pertain to one or more sets. Trapezoid fuzzy numbers have been used to quantify risk perception [58], renewable output [75], and revenues [124], while triangular fuzzy numbers have been used for demand and costs [118].
5.2.3. Probability Boxes
In imprecise probability theory, the epistemic and aleatory uncertainty on a parameter are categorized separately, yet their effect is considered simultaneously when propagated through the system model [4]. Among the imprecise probability methods, probability boxes (p-box) provide an intuitive representation of both uncertainty types on a parameter, i.e., the shape of the cumulative density functions in the box represents the aleatory uncertainty, while the width of the box represents the epistemic uncertainty. To propagate a p-box, typically computationally intensive, nested Monte Carlo simulation methods are used. Recently, surrogate-assisted p-box propagation has been introduced and applied in the evaluation of a PV-heat pump system with thermal storage [42].
5.3. Time-Dependent Processes or Series
5.3.1. Geometric Brownian Motion
In probabilistic and possibilistic approaches, the relationship of forecasted values with time is not captured. For example, even though PDFs can model electricity prices, this approach does not capture the fact that prices tend to be higher during certain hours of the day or the year-by-year variation. These relationships are better modeled with stochastic processes or time series, which can model SoUs effectively in the time domain.
The most common stochastic process used in RE design is Geometric Brownian Motion (GBM). GBM is a stochastic process that can be written in closed-form analytical solutions, which makes it very desirable in ROA. A stochastic process St follows a GBM if it satisfies the following equation:
where u is the drift, σ is the volatility, and Wt is a Wiener process, the financial equivalent of a Brownian motion, which describes the trajectory of suspended particles. Solving the differential equation results in the following closed-form equation:
dSt = uSt dt + σSt dWt
This shows that under a GBM, the SoU follows a log-normal distribution. This is not the case in energy prices, which present a tendency to move towards the mean (mean-reversion), spikes, and jumps [8]. However, some researchers argue that mean-reversion in electricity prices can be ignored when considering long-term planning investments and that GBM does not lead to significant errors [78,143]. Therefore, because of its convenience, GBM is ubiquitous in the analyzed literature. Besides electricity prices, coal prices [120], FiT degression [82], LCOE [85], demand growth [83], green certificate prices [27,102], and renewable output [13] have been modeled using GBM.
5.3.2. Diffusion Processes
As said in the previous section, GBM may not be adequate to model some SoUs in energy models. Other stochastic processes and time series frequently arise in the literature. One common workaround to the problem of mean reversion of GBM is to employ mean-reverting GBM [84].
where α is the speed of reversion to the mean and μ is the reversion level. Some researchers use a simpler model to account for mean reversion, the Ornstein–Uhlenbeck process [49,106]:
The generalization of these processes is called a diffusion process. This term is used for any continuous-time process whose sample paths are continuous but nowhere differentiable.
5.3.3. Jump Processes: Markov and Poisson Models
A Markov chain is a stochastic process in which the probability of being in a specific state depends exclusively on the previous states. Markov chain models commonly have order one, meaning only the immediately previous state is considered. A probability transition matrix defines the chances of switching from one state to another in a single time step. Therefore, these processes are suitable for modeling sudden jumps such as policy changes [33,45], electricity price regimes [24], and renewable certificate prices [51].
A Poisson process is a model for a series of discrete events where the average time between events is known, even though the exact timing is random. The events must be independent, one at a time, and the average rate constant, though the model can be built even if the assumptions are violated. Poisson processes are also considered jump processes because the realization of an event causes a discontinuity in the sample path. They have been observed to model price floor rates [28], policy interventions, technology innovations [109], and the arrival of new information related to the project [101]
Combinations of GBM, mean-reverting, and jump processes are also found in the literature. These jump-diffusion processes explain the evolution of the SoU more generally. However, their mathematical complexity does not allow for closed-form analytical solutions; simulation approaches must be used instead. GBMs with Poisson jumps have been used to model panel costs [98,114], electricity price [25,26,41], CO2 price [23], and green certificates price [54].
5.3.4. Time Series
Models for time series data are the discrete-time equivalent of stochastic processes. For instance, autoregressive time series models are discrete-time equivalents of Ornstein–Uhlenbeck processes. A generalization of this model, the autoregressive-integrated moving average (ARIMA), can be found in forecasting RE [34,49], energy demand [92,111], day-ahead [77,151], and NG prices [20]. ARIMA models comprise an autoregressive component, where the variable of interest yt is forecasted using p past values of the same variable (); a moving average component, where the forecast uses q past errors (); sometimes several (d) degrees of differentiation. The equation of the process is the following:
where is the intercept and are the autoregressive and moving average coefficients, respectively.
The generalized autoregressive conditional heteroskedasticity (GARCH) model is also found. This model is used to forecast the variance or volatility , when it is known not to be constant over time. Certificates [57] and electricity prices [22] have been adjusted to the GARCH model. Its equation can be found as follows:
where is the intercept and and are the coefficients of the past errors and volatilities, respectively.
5.4. Other Approaches
5.4.1. Interval Analysis
Interval analysis is a UCM that often appears in the context of robust optimization. This kind of formulation seeks a solution with a certain degree of robustness. This means searching for a solution that stays optimal or at least acceptable under the variability of the input parameters. Interval analysis achieves this by constraining the uncertain parameters between two predefined values [152]. Then, the upper and lower bounds of the solution are computed. In most robust formulations, the solution is obtained using the worst possible realization of the chosen interval, set, or range. Therefore, this UCM is often labeled as a ‘worst-case scenario’ [8]. Interval analysis has effectively modeled electricity prices [59,103], demand [90], and PV generation [59,90,103].
5.4.2. Neural Networks
Artificial neural networks (ANN) are a machine learning method widely applied in engineering analysis and forecasting. ANNs stand out because they can handle large and complex systems with many interrelated parameters. No previous information about the system is needed. ANNs learn the relationship between the input and the output variables by studying a data stream. This makes them ideal in RE systems, where they are seen emulating battery operational profiles [83] and forecasting demand, prices, and wind speed [16].
In its most common configuration, the multi-layer perceptron, the ANN consists of an input layer, an output layer, and several hidden layers. Each layer contains several neurons, and each neuron is connected to its counterparts in the previous and following layers. The weights of each connection are adjusted in a training process so the network achieves the desired output based on the input data [153].
5.5. Summary
As seen in Figure 6, PDF is the most employed UCM. GBM, the most used stochastic process, follows closely, surpassing diffusion and jump processes. This can be explained by their synergy with the most common problem formulations, which will be detailed in the next section. PDFs favor stochastic optimization because they allow the generation of a wide range of scenarios, which collectively represent the behavior of the SoU accurately. On the other side, GBM simplifies the option value calculation in ROA. The broad use of sensitivity analyses is explained because of their simplicity. Other UCMs are still a minority. They attempt to characterize uncertainties with greater accuracy at the expense of modeling easiness.
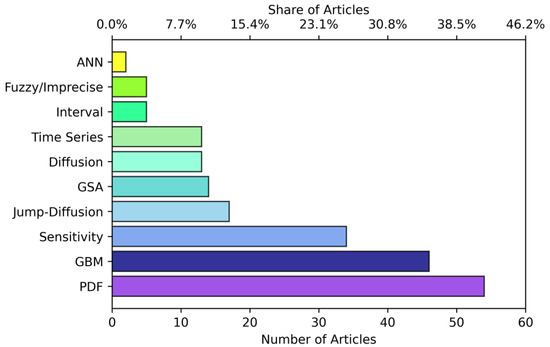
Figure 6.
Number and share of articles in the pool that consider each UCM. Each article may consider more than one UCM.
6. Mathematical Modeling
This section develops how the different models can be built to achieve the goals of each article. Here two main aspects can be derived: firstly, how the problem is formulated (Section 6.1). This means whether the problem tries to calculate a simple project evaluation (DCF), the optimal timing for a fixed investment (ROA), or the optimal investment for the current situation (optimization). Additionally, how the article arrives at an optimal or desirable solution (Section 6.2), whether analytically, through an algorithm, or using commercial software.
6.1. Problem Formulation
6.1.1. Discounted Cash Flow
DCF is the most straightforward method to calculate the profitability of a project. RE projects involve large investments in technology that might not yet be mature, so correctly estimating the profitability becomes crucial. This is performed by estimating the net cashflows (cash inflows minus cash outflows) over the project’s lifetime. Cashflows in successive years are discounted, which updates the future value of money at present. Then, indicators such as NPV and IRR are calculated, and the project’s profitability is inferred from them.
However, DCF analysis suffers from severe limitations, which has made its use decline over time. First, it cannot incorporate the value of adjusting decisions (such as postponing, expanding, or retracting from an investment) based on future conditions. In addition, DCF is very rigid at incorporating uncertainties. It relies on the discount factor as the only SoU while assuming the certainty of future cash flows. This view has proved inaccurate and has led to the use of other problem formulations, although some papers still use DCF for simplicity.
6.1.2. Real Options Analysis
ROA quantifies the effect of the timing of investment decisions considering the existing economic uncertainties at a particular stage. Hence, ROA allows delaying certain decisions until the uncertainty on the effect of that decision is sufficiently reduced, at the expense of a cost of delay (e.g., delaying a PV array expansion to reduce uncertainty on investment costs, at the expense of a prolonged susceptibility towards varying grid electricity prices). The method typically relies on stochastic processes to capture the uncertainty of time-varying parameters [8]. ROA is particularly useful when considering time-dependent tariffs, RE certificate trading mechanisms, and electricity and NG prices. It can be applied in the following project stages: the design stage, when the investments are calculated but not yet undertaken; the operational stage, and decommissioning. An extensive amount of ROA applications on RE systems exists [9], including investment timing decisions in utility-scale RE [65], regulation of PV plants [25], and carbon trading market [76].
6.1.3. Optimization Methods
In optimization under uncertainty, an objective function is optimized while considering randomness in the model parameters. In the context of energy systems, the most common optimization approaches are stochastic programming (SP) and robust optimization [154]. SP is a scenario-based approach that considers probabilistic input uncertainties and optimizes the system’s expected performance [7]. Optimization can consist of several stages, the most common being two-stage SP (2SSP). In 2SSP, the optimal decision is made in the first stage, and the realization of the uncertain variables is revealed in the second stage. When the number of scenarios is too high for practical computation, scenario reduction approaches such as backward/Kantorovich [20,90,97], fast forward selection [108], or k-means [137] are used.
SP is combined with game-theoretical approaches when conflicting interests arise between agents involved in the problem. Some applications are the following: how regulation affects the PV supply chain [122], how different enterprises react to subsidies [123], how private investors and utilities [39] or governments [73,127] compete for installing new power generation and in establishing the energy price on a P2P market [36,75].
Alternatively, robust optimization considers the combination of input parameter values, defined by interval uncertainty, that optimize the design under worst-case conditions [155]. This method avoids the tedious characterization of uncertainties using PDFs, which are seldom based on accurate information and sufficient data points [6]. However, the nested anti-optimization routine to find the worst-case scenario can become computationally intractable when many uncertainties are considered. Moreover, this approach generally leads to over-conservative designs [154]. Robust optimization is gaining interest in the last decade concerning the techno-economic optimization of RE systems [67,103] but remains limited compared to stochastic optimization schemes (Figure 7).
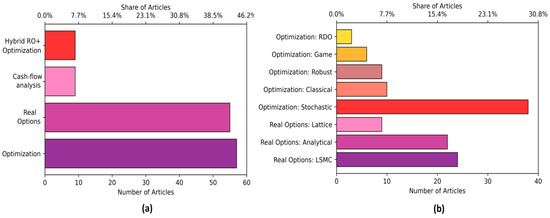
Figure 7.
(a) Number and share of articles in the pool that consider each problem formulation. Each article belongs to one of these categories. (b) Breakdown of optimization and ROA formulations.
In other fields, such as aeronautics and structural mechanics, the following alternative robust optimization method is applied: robust design optimization (RDO) [43]. RDO aims at optimizing the expected performance (i.e., the mean) while minimizing the variability in that performance (i.e., the standard deviation). By considering the standard deviation as a metric for robustness, RDO provides alternative designs that are less sensitive to the uncertain environment. RDO is often applied with surrogate modeling methods, such as PCE, to make the application computationally tractable for complex models. Despite its potential, RDO applications in the techno-economic optimization of RE systems are limited (Figure 7b). In the last five years, the following applications emerged: among others, heat pump design with thermal storage [42], renewable ammonia production [156], and hydrogen-based heavy-duty mobility [157].
6.1.4. Hybrid Approaches
Hybrid approaches combining ROA and optimization remain limited. Both approaches complement each other well because they serve the following different purposes: ROA determines the best timing for a particular investment, while optimization calculates the optimal investment for a specific time. The combination of both could determine the optimal timing and size of the investment. The hybrid approaches observed in the literature, however, are not truly hybrid in this sense. For instance, optimization models have been embedded in ROA [24] for auxiliary purposes (determining the optimal operation of a battery [24] or calculating the prospects of smart grid diffusion [36,39,127]). Or optimization models are reformulated to include flexibility, simulating “ROA thinking” [86,119]. Only one genuinely hybrid approach [66] effectively combines ROA and optimization to simultaneously calculate the optimal sizing and investment timing of a battery system.
6.2. Solution Method
6.2.1. Analytical Solution
Analytical solutions are used to determine the value of investing immediately or postponing the investment. These solutions are based on the Black-Scholes model [133] for European options (an option that can only be exercised at a specific time).
Uncertainty is incorporated using stochastic processes with a closed-form definition, mostly GBM. Then, Itô’s lemma is applied to differentiate the GBM-dependent function. After taking expectations and some algebraic manipulation, an ordinary or partial differential equation is obtained. Solving it gives, as a result, a mathematical expression that captures the value of the project and its dynamics over time.
The use of closed-form solutions is often criticized because it uses simplified uncertainty modeling. Only one type of uncertainty, or a few correlated ones, can be modeled [22]. These models often use constant mean or volatility, neglecting mean reversion, jumps, or spikes, features often appearing in commodity prices. Therefore, analytical solutions can be challenging to apply in real-life settings.
6.2.2. Lattice Models
Lattice and tree models allow expanding ROA valuation to American options, meaning projects that can be exercised at any time. Lattice models allow finding the optimal time to invest over several time periods, making them closely related to multi-stage SP (MSSP).
The most common lattice model is the binomial lattice, a discrete-time approximation of GBM [56]. At every time step, the value of exercising the option (investing immediately) is compared with the value of continuing with the option (defer investment). The larger value determines the optimal policy. Other multinomial lattice structures, which allow for more complex uncertainty modeling, have been seen in the literature [105].
Lattice models form a dynamic programming model, so the option value is obtained by solving the Bellman equation through backward induction [68]. They become complex when dealing with multiple or path-dependent uncertainties [8]. In these instances, MSSP and scenario trees become more valuable.
6.2.3. Simulations: Monte Carlo and Commercial Software
Monte Carlo simulations are used when dealing with many different uncertainties or when the complexity of the processes makes it daunting to obtain a closed-form solution. By repeating random calculations, a sufficiently large number of times, the true distribution of the project value is approximated. Simulations allow uncertainties to follow general stochastic processes with changing volatility, mean reversion, or jumps. They can be computed in parallel, allowing steep reductions in computational time, and they are simple to use. This makes them more applicable and realistic than the other resolution methods stated above.
As random sampling is a computationally intensive process to reach statistically sound results (i.e., 104 ÷ 106 samples), the method becomes intractable when more than a few minutes are needed for a single evaluation. To address this limitation, improved sampling schemes have been proposed, such as Latin hypercube sampling [46,56], sample average approximation [12], Morris screening [72], and quasi-random Sobol sampling [87].
Another way to perform simulations to deal with uncertain parameters is by simulation tools. For microgrids, HOMER is the most widespread commercial software and has also been used in scientific publications [104,110]. Custom software developed by the researchers has also been tested [60,61,62]. Finally, an attempt has been made to integrate ROA into an Excel spreadsheet [81] to extend its use to practitioners.
6.2.4. Least Squares Monte Carlo
One major limitation of Monte Carlo is that it reveals uncertain paths forwards. However, optimal timing for investment must be obtained in a backward fashion, such as with dynamic programming. In addition, when the number of scenarios becomes large, which is expected at valuing energy options, the computation can be very time-consuming. Longstaff and Schwartz developed the least squares Monte Carlo (LSMC) algorithm [158], which circumvents these difficulties. LSMC combines a Monte Carlo simulation with a least squares regression that allows for reducing the total number of scenarios while retaining an accurate result. The fitted value of the regression estimates the conditional expected value of continuation. Like in lattice models, this value is compared to the exercise value in an approximate dynamic programming fashion [101,126]. This allows for obtaining an optimal exercise strategy along each path.
6.2.5. Optimization Solvers and Algorithms
An optimization solver is used to solve a problem by maximizing or minimizing an objective function subject to several constraints. If both the objective function and the constraints are linear, the routine is called linear programming (LP). However, some features cannot be captured by linear equations, so integer or binary variables (mixed integer LP (MILP)), quadratic terms (convex programming), or other nonlinear terms (nonlinear programming) often appear.
It is preferred to formulate optimization problems as LP or MILP as they allow the use of computationally efficient algorithms and guarantee that the optimal solution is global in the whole domain. When nonlinearities are essential to the problem, they should be relaxed under certain assumptions. Piecewise linear functions [72], big-M method [15,59], McCormick envelopes [16], and auxiliary variables [34] are the linearization techniques that have been observed.
If it is not possible or not desirable to linearize the problem, a more complex solver, which often leads to sub-optimal solutions, must be used. Metaheuristic algorithms such as genetic [21,43], particle swarm [55,89], grey wolf [119], and non-linear solvers such as deterministic policy gradient [66], DICOPT [138], ANTIGONE [17], and KNITRO [107] have been employed in the literature.
Figure 8 shows the solution methods, the number of articles on each kind of formulation, and how researchers have solved their model.
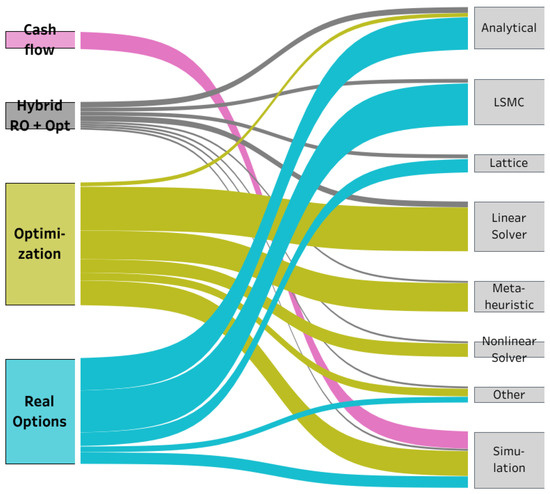
Figure 8.
Sankey flowcharts of problem formulations (left) to solution methods (right). The width represents the article count. Self-elaboration based on [159].
Problems formulated with ROA and optimization have fundamentally different resolution methodologies. For instance, optimization approaches are mainly tackled by commercial solvers and custom metaheuristic algorithms. Researchers are fairly divided between the option of linearizing the problem and the option of keeping nonlinearities. In the last case, the use of heuristics is preferred over the use of a complex nonlinear solver. In the case of ROA, LSMC is the preferred approach. However, the number of researchers that opt for calculating the option value analytically is surprising, given the limitations of this approach. Simulation is the only method that allows the incorporation of uncertainties in DCF analysis. It remains fairly used both in ROA and optimization.
7. Discussion
7.1. Drawbacks of the Most Common UCMs Modeling E&R Variables
Even though RE systems are ubiquitous, the emergence of the energy transition requires even more rapid investment. LCOE of mature technologies, such as PV solar and onshore wind, is flatting out and even may slightly trend up [146]. Therefore, to foster investment, researchers must focus on reducing the risk of RE projects by improving the characterization of RE uncertainties.
The most considered economic uncertainty is the electricity price, as this review shows (Figure 4), in accordance with previous works [148]. The actual marginal pricing system, and the reliance on fast-response generator units such as NG combined cycles to back up RE, create a volatility well-known by researchers. Although electricity price is known to have mean reversion and spikes, most articles model it using GBM or uniform and normal PDFs. However, forecasts performed in the last decade by GBM and PDF could not predict the drastic change in prices that occurred in 2021 and 2022, especially in Europe.
One of the reasons is that representing E&R uncertainties by common distributions such as uniform or normal is inaccurate. Uniform distributions consider zero probability to outliers (i.e., tail events) [160]. On the other hand, while normal distributions are unbounded and capture tail events, their probability is commonly underestimated. This is because the likelihood of tail events results from an extrapolation on the distribution, defined by distribution parameters estimated from predictions near its center. In other words, scenarios focus on the ordinary rather than the exceptions. Alternatively, skewed distributions (e.g., log-normal distribution) prove more realistic as their asymmetry assigns a non-negligible probability to scenarios with high energy prices [161]. Therefore, we encourage the adoption of more realistic distributions in the characterization of electricity prices and other E&R variables.
Alternatively, GBM (Section 5.3.1) is a time-domain stochastic process whose realization follows a log-normal distribution and has several advantages over the PDF approach. Hypothesis testing has validated its use for forecasting commodity prices and costs [30,32,40,56], but it performs less well than a mean-reverting process [78]. Moreover, SA performed on the GBM volatility show that slight changes in the parameter have an enormous impact on the investment thresholds [94]. While GBM can be praised for its modeling simplicity, future research should explore the use of more advanced UCMs that are less sensitive to the arbitrary choice of parameters.
7.2. Several Missing UCMs and Their Potential in Modeling Improvement
As seen in Figure 6, a wide range of UCMs are used to tackle the different E&R uncertainties exposed in the article. However, it is also worth mentioning what Figure 6 does not show, i.e., common UCMs that have been seen in the context of RE but not in the pool of articles of this review.
For instance, point estimate methods (PEM) are probabilistic approaches that estimate the behavior of the SoU based on their first central moments [6]. An earlier reference using PEM on electricity price has been found [52], but it has not been a popular option to model E&R uncertainties.
Although ANNs have been observed in the context of E&R uncertainties, there are no more references employing other popular machine learning techniques, such as support vector machine (SVM). SVM classifies data by defining a hyperplane between two categories of observations. It has been widely used in forecasting RE and load [162,163]. It is also successful in the context of energy economics [164], so researchers should consider its use in RE system design. Other machine learning algorithms besides ANN and SVM that could thrive in characterizing E&R uncertainties are Gaussian process regression [163], logistic regression, Bayesian methods, and reinforcement learning [162].
Information gap decision theory (IGDT) constitutes another relevant method used in RE forecasting [165]. IGDT is based on the idea that people make decisions based on their current level of knowledge or their ‘information gap’. It is used when the lack of data prevents modeling an SoU using a probabilistic or possibilistic approach. IGDT tries to find a solution that fulfills a certain degree of robustness (satisfies the requirements when the situation is different than expected). Additionally, IGDT provides a framework to model opportuneness, i.e., the minimal level of uncertainty that enables a better-than-anticipated outcome [166].
Most often, the modeling of an uncertain variable is performed based on limited data points and merged with users’ judgments and experiences [160]. While practitioners can generally provide a good idea of the distribution type of a parameter, their estimation of the parameter values is typically poor, especially for higher-order moments (e.g., the variance and skewness). Even more, there is a strong tendency to underestimate the uncertainty of predictions elicited by subject experts.
We acknowledge that the probability of outliers is inherently difficult to predict. Therefore, as a potential improvement, we suggest considering an anti-fragile approach toward energy system planning. As it is more convenient to quantify the system response towards outliers than to quantify the probability of these outliers, one could consider aiming for solutions that benefit significantly from positive outliers but are relatively indifferent to negative outliers. Such systems could be modeled using the techniques exposed above, which are currently underused in E&R uncertainty.
7.3. Ranking the Influence of E&R Variables in RE Planning
Papers employing GSA offer, through the calculation of the sensitivity index, a method to rank the influence of the SoUs in the outcome of the design. Nevertheless, every paper does not consider the same uncertainties simultaneously. Moreover, reports differ in location, system configuration, model fidelity, and objectives. Hence, as sensitivity indices are relative indicators, their value should be put in perspective with the system and random environment considered in each paper separately. Therefore, we provide a qualitative ranking of the most influential parameters in RE planning.
First, the uncertain parameters that top the ranking are the ones related to the energy price and regulatory parameters, i.e., the price of electricity [42,44,99,125], NG [42,79,99], hydrogen [134] and diesel [157], the FiT rate [99], and wind curtailment penalty [125]. These parameters are characterized by considerable uncertainty as they are typically estimated over the system’s lifetime. In addition, the considered systems are usually optimized toward economic performance and therefore remain significantly dependent on energy import [44].
Second, the interest and discount rates are typically highly ranked in GSA [11,42,44]. Whenever costs are considered uncertain, their variability is distributed equally over all the components. Therefore, the interest rate multiplies the influence of the compound uncertainty of these costs. Even more, as novel projects are evaluated with technologies that are not yet mature, the interest rate carries significant volatility. This rate should be specific for every project, but it is often chosen subjectively in the absence of information. Most estimates assume between 5 and 10%, which causes a difference of 2.5 times the sum of cashflows for a 20-year lifetime and constant yearly revenue.
Third, the uncertainty on the investment costs related to emerging technologies is significant, i.e., for hydrogen electrolysis [44,134], heat pumps, and thermal storage [11,42], but also PV [64]. As some of these technologies are not yet fully mature, a high market variability exists, leading to significant uncertainty ranges on their related investment costs. One can argue about the philosophy behind the uncertainty on investment costs. When the investment is performed in one stage at the start of the project, the investment costs will not evolve over time and can therefore be considered deterministic. However, a significant timeframe exists between the initial design stage and the actual investment, making the initial decision subject to market variability. Moreover, unexpected investment costs might occur [71].
Finally, the physical parameters (e.g., efficiency [79]), climate conditions, and energy demand [42,157] are grouped. The uncertainty on the intermittency of RE (e.g., wind [125], solar irradiance [44]) is indeed less influential, despite its extensive modeling. To illustrate, when sampling a distribution on the intermittent RE source (e.g., a Weibull distribution for the wind speed), the positive autocorrelation between consecutive wind speeds is lost. Therefore, authors generally adopt methods to generate synthetic time series or PDFs to shift an initial time series based on interannual variability. In such a scenario, the uncertainty on the economic parameters dominates the uncertainty on interannual variability in cost estimations. Instead, interhourly variability is predominant in isolated systems when high costs are allocated to a potential loss of load.
7.4. Potential New Lines of Research
As seen through the review, modelers still commonly assume a constant FiT rate for all lifetime facilities. The use of the tariff rate as an SoU (Figure 5) is smaller than the use of FiT as an RF (Figure 3). FiT, however, is subject to constant revisions. In addition, retroactive phasing out of subsidies cannot be ruled out completely, as recent experiences show [105]. Therefore, regime switching is vital for accurately modeling regulatory uncertainty. The switch can result in a different subsidy level or a market-based regime. Markov chains, Poisson jumps, or binomial distributions have been used to model FiT changes, but there is room for improvement.
On a related note, RPS and certificate systems are becoming increasingly popular. However, the evolution of certificate prices must be tracked similarly to electricity prices. GBM and PDFs are the most common approaches, although processes with mean-reversion and jumps would be more suitable.
Furthermore, the optimal regulation to promote RE systems is not apparent. As seen, every scheme has its characteristic uncertainty. There is a lack of studies comparing the effectiveness of RFs, the ways to contain their uncertainty, and how it affects the optimal capacity of RE plants.
Problem formulation can be further researched. Stochastic methods are limited by the curse of dimensionality, i.e., the computational cost grows exponentially with the number of uncertain parameters considered [157]. Recent developments, such as grouping or screening the stochastic space [6] and the integration of surrogate models [43], improve computational efficiency and therefore allow the consideration of cross-field uncertainties.
Finally, as mentioned in Section 6.1.4, the combination of ROA and optimization would enable determining the optimal capacity of RE systems and the best moment to undertake the investment. At present, this hybrid approach needs to be researched more.
7.5. Summary
To finish this section, it is worth highlighting how different problem formulations deal with different SoUs and how each SoU is dealt with dissimilar UCMs. Unlike [9], our classification of problem formulation includes mostly optimization and ROA. Under ROA, uncertainties tend to be modeled with time-dependent processes such as GBM, diffusion, or jump processes, while under—stochastic—optimization, probabilistic approaches such as PDFs are preferred. Sensitivity is used in all formulations to determine a parameter’s optimal influence, especially those that are not time-dependent on a daily scale, such as costs and rates. It can also be observed how ROA tends to consider subsidies as an uncertain variable, while the bulk of optimization models model physical uncertainties and electricity prices. The number of articles of each formulation that deal with each SoU and the number of times each SoU has been dealt with a particular UCM are depicted in the Sankey diagram of Figure 9.
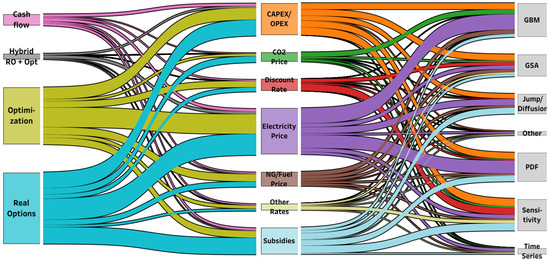
Figure 9.
Multi-level Sankey flowchart of problem formulations (left) to SoUs (middle) to UCMs (right). The total flow represents the number of SoUs analyzed. One article can deal with more than one SoU, and each SoU is characterized by one of the UCM. Self-elaboration based on [159].
8. Conclusions
In this review, 130 articles from 2015 to 2022 tackling E&R uncertainty in RE systems have been identified. An extensive classification of the articles has been performed, which includes SoUs, UCMs, problem formulations, and solving methods. The RFs considered in each paper have also been identified, from the popular feed-in mechanisms to the emerging REC. This classification identified the following most modeled economic uncertainties: electricity prices, technology costs, and subsidies; it also allowed quantifying their influence on economic performance. Energy prices and regulatory parameters top the ranking, followed by the discount rate, investment costs, and technical parameters.
This review also identified the following most employed UCM: PDFs and GBM. However, their limitations have been exposed, particularly in modeling tail events. The use of other UCMs is encouraged. Interval uncertainty, jump-diffusion processes, time series, fuzzy theory, p-boxes, and ANN are beginning to gain relevance. This review also identified UCMs that have yet to be used in E&R uncertainties, such as machine learning algorithms (besides ANN) and IGDT.
Problem formulation comprises mainly ROA and optimization, although a minority of articles still employ DCF, despite its drawbacks. In the few cases ROA and optimization are embedded in the same model, it is tangentially and does not form a genuine hybrid model. Each formulation is solved with different methods, the most popular being LSMC for ROA and linear solvers for optimization.
Seven different RFs have been identified. There is still no clear answer to which is the optimal framework for promoting RE, as each has its benefits and drawbacks. However, policymakers should consider withdrawing FiT, which concentrates all the risk on the policymaker and is more suitable for emerging technologies. Certificate systems, FiP, and minimal market interventions (such as price floors and capacity payments) prove more adequate to promote RE systems at this stage.
A major limitation of this work is that the methods exposed have been compared based on what other researchers exposed in their articles but not quantitatively based on the authors’ experiments. Therefore, future works should explore modeling E&R uncertainties in the following problems arising in RE systems: expansion planning, system design, and energy management. In particular, subsidy uncertainty, which depends on the RF, should be further studied. Modelers cannot assume that policy will remain constant during the facility’s lifetime. The possibility of regime switching must be accounted for. In addition, future works may incorporate uncommon UCMs, such as p-boxes, time series, and machine learning algorithms. They have been validated in other fields, and it is suggested to research their use in E&R uncertainties. Finally, the problem of simultaneously calculating the optimal time and size of a RE project has not been studied thoroughly. A combination of ROA and optimization could provide this additional insight and help accelerate the development of RE projects to fulfill the energy transition.
Author Contributions
Conceptualization, À.A.-T. and D.C.; methodology, À.A.-T.; software, J.d.l.H.; validation, À.A.-T., D.C. and H.M.; formal analysis, À.A.-T.; investigation, À.A.-T.; resources, H.M.; data curation, À.A.-T.; writing—original draft preparation, À.A.-T. and D.C.; writing—review and editing, À.A.-T. and H.M.; visualization, À.A.-T.; supervision, J.d.l.H. and H.M.; project administration, J.d.l.H. and H.M.; funding acquisition, H.M. All authors have read and agreed to the published version of the manuscript.
Funding
This research received no external funding.
Data Availability Statement
Not applicable.
Conflicts of Interest
The authors declare no conflict of interest.
Abbreviations and Acronyms
| 2SSP | Two-stage stochastic programming |
| ANN | Artificial neural network |
| ARIMA | Autoregressive-integrated moving average |
| CAPEX | Capital expenditure |
| CHP | Combined heat and power |
| CVaR | Conditional value at risk |
| DCF | Discounted cash flow |
| ETS | Emission trading system |
| E&R | Economic and regulatory |
| FiT | Feed-in tariff |
| FiP | Feed-in premium |
| GARCH | Generalized autoregressive conditional Heteroskedasticity |
| GBM | Geometric Brownian motion |
| GSA | Global sensitivity analysis |
| IGDT | Information gap decision theory |
| ITC | Investment tax credit |
| LCOE | Levelized cost of energy |
| LP | Linear programming |
| LSMC | Least squares monte carlo |
| MILP | Mixed-integer linear programming |
| MSSP | Multistage stochastic programming |
| NB | Net billing |
| NG | Natural gas |
| NM | Net metering |
| NPV | Net present value |
| OPEX | Operational expenditure |
| PCE | Polynomial chaos expansion |
| Probability distribution function | |
| PEM | Point estimate method |
| PTC | Production tax credit |
| PV | Photovoltaics |
| RDO | Robust design optimization |
| RE | Renewable energy |
| REC | Renewable energy certificates |
| RF | Regulatory framework |
| ROA | Real options analysis |
| RPS | Renewable portfolio standard |
| R&D | Research and development |
| SA | Sensitivity analysis |
| SoU | Source of uncertainty |
| SP | Stochastic programming |
| SVM | Support vector machine |
| UCM | Uncertainty characterization method |
| WACC | Weighted average cost of capital |
References
- International Renewable Energy Agency. The Post-Covid Recovery. An Agenda for Resilience, Development and Equality. Available online: https://www.irena.org/-/media/Files/IRENA/Agency/Publication/2020/Jun/IRENA_Post-COVID_Recovery_2020.pdf (accessed on 3 July 2022).
- International Energy Agency. World Energy Investment 2022; IEA: Paris, France, 2022; p. 12.
- Lüthi, S.; Wüstenhagen, R. The Price of Policy Risk—Empirical Insights from Choice Experiments with European Photovoltaic Project Developers. Energy Econ. 2012, 34, 1001–1011. [Google Scholar] [CrossRef]
- Der Kiureghian, A.; Ditlevsen, O. Aleatory or Epistemic? Does It Matter? Struct. Saf. 2009, 31, 105–112. [Google Scholar] [CrossRef]
- Mavromatidis, G.; Orehounig, K.; Carmeliet, J. A review of uncertainty characterisation approaches for the optimal design of distributed energy systems. Renew. Sustain. Energy Rev. 2018, 88, 258–277. [Google Scholar] [CrossRef]
- Jordehi, A.R. How to deal with uncertainties in electric power systems? A review. Renew. Sustain. Energy Rev. 2018, 96, 145–155. [Google Scholar] [CrossRef]
- Zakaria, A.; Ismail, F.B.; Lipu, M.S.H.; Hannan, M.A. Uncertainty Models for Stochastic Optimization in Renewable Energy Applications. Renew. Energy 2020, 145, 1543–1571. [Google Scholar] [CrossRef]
- Schachter, J.A.; Mancarella, P. A Critical Review of Real Options Thinking for Valuing Investment Flexibility in Smart Grids and Low Carbon Energy Systems. Renew. Sustain. Energy Rev. 2016, 56, 261–271. [Google Scholar] [CrossRef]
- Ioannou, A.; Angus, A.; Brennan, F. Risk-Based Methods for Sustainable Energy System Planning: A Review. Renew. Sustain. Energy Rev. 2017, 74, 602–615. [Google Scholar] [CrossRef]
- Murgas, B.; Henao, A.; Guzman, L. Evaluation of Investments in Wind Energy Projects, under Uncertainty. State of the Art Review. Appl. Sci. 2021, 11, 10213. [Google Scholar] [CrossRef]
- Abokersh, M.H.; Vallès, M.; Cabeza, L.F.; Boer, D. A Framework for the Optimal Integration of Solar Assisted District Heating in Different Urban Sized Communities: A Robust Machine Learning Approach Incorporating Global Sensitivity Analysis. Appl. Energy 2020, 267, 114903. [Google Scholar] [CrossRef]
- AbuElrub, A.; Al-Masri, H.M.K.; Singh, C. Hybrid Wind-Solar Grid-Connected System Planning Using Scenario Aggregation Method. Int. Trans. Electr. Energy Syst. 2020, 30, e12519. [Google Scholar] [CrossRef]
- Adkins, R.; Paxson, D. Subsidies for Renewable Energy Facilities under Uncertainty. Manch. Sch. 2016, 84, 222–250. [Google Scholar] [CrossRef]
- Ahn, H.; Rim, D.; Pavlak, G.S.; Freihaut, J.D. Uncertainty Analysis of Energy and Economic Performances of Hybrid Solar Photovoltaic and Combined Cooling, Heating, and Power (CCHP + PV) Systems Using a Monte-Carlo Method. Appl. Energy 2019, 255, 113753. [Google Scholar] [CrossRef]
- Alharbi, W.; Bhattacharya, K. Flexibility Provisions from a Fast Charging Facility Equipped with DERs for Wind Integrated Grids. IEEE Trans. Sustain. Energy 2019, 10, 1006–1014. [Google Scholar] [CrossRef]
- Allahdadi Mehrabadi, R.; Parsa Moghaddam, M.; Sheikh-El-Eslami, M.K. Generation Expansion Planning in Multi Electricity Markets Considering Environmental Impacts. J. Clean. Prod. 2020, 243, 118611. [Google Scholar] [CrossRef]
- Amir, V.; Azimian, M. Dynamic Multi-Carrier Microgrid Deployment Under Uncertainty. Appl. Energy 2020, 260, 114293. [Google Scholar] [CrossRef]
- An, J.; Kim, D.K.; Lee, J.; Joo, S.K. Least Squares Monte Carlo Simulation-Based Decision-Making Method for Photovoltaic Investment in Korea. Sustainability 2021, 13, 10613. [Google Scholar] [CrossRef]
- Andreolli, F.; D’Alpaos, C.; Moretto, M. Valuing Investments in Domestic PV-Battery Systems under Uncertainty. Energy Econ. 2022, 106, 105721. [Google Scholar] [CrossRef]
- Ansari, M.; Zadsar, M.; Sebtahmadi, S.S.; Ansari, M. Optimal Sizing of Supporting Facilities for a Wind Farm Considering Natural Gas and Electricity Networks and Markets Constraints. Int. J. Electr. Power Energy Syst. 2020, 118, 105816. [Google Scholar] [CrossRef]
- Arriaga, M.; Cañizares, C.A.; Kazerani, M. Long-Term Renewable Energy Planning Model for Remote Communities. IEEE Trans. Sustain. Energy 2016, 7, 221–231. [Google Scholar] [CrossRef]
- Assereto, M.; Byrne, J. No Real Option for Solar in Ireland: A Real Option Valuation of Utility Scale Solar Investment in Ireland. Renew. Sustain. Energy Rev. 2021, 143, 110892. [Google Scholar] [CrossRef]
- Azari Marhabi, A.; Arasteh, A.; Paydar, M.M. Sustainable Energy Development under Uncertainty Based on the Real Options Theory Approach. Int. J. Environ. Sci. Technol. 2022, 19, 5897–5910. [Google Scholar] [CrossRef]
- Bakke, I.; Fleten, S.E.; Hagfors, L.I.; Hagspiel, V.; Norheim, B.; Wogrin, S. Investment in Electric Energy Storage under Uncertainty: A Real Options Approach. Comput. Manag. Sci. 2016, 13, 483–500. [Google Scholar] [CrossRef]
- Balibrea-Iniesta, J. Economic Analysis of Renewable Energy Regulation in France: A Case Study for Photovoltaic Plants Based on Real Options. Energies 2020, 13, 2760. [Google Scholar] [CrossRef]
- Balibrea-Iniesta, J.; Sánchez-Soliño, A.; Lara-Galera, A. Application of Real Options Theory to the Assessment of Public Incentives for Onshore Wind Energy Development in Spain. Int. J. Energy Econ. Policy 2015, 5, 791–800. [Google Scholar]
- Bangjun, W.; Feng, Z.; Feng, J.; Yu, P.; Cui, L. Decision Making on Investments in Photovoltaic Power Generation Projects Based on Renewable Portfolio Standard: Perspective of Real Option. Renew. Energy 2022, 189, 1033–1045. [Google Scholar] [CrossRef]
- Barbosa, L.; Ferrão, P.; Rodrigues, A.; Sardinha, A. Feed-in Tariffs with Minimum Price Guarantees and Regulatory Uncertainty. Energy Econ. 2018, 72, 517–541. [Google Scholar] [CrossRef]
- Bean, P.; Blazquez, J.; Nezamuddin, N. Assessing the Cost of Renewable Energy Policy Options—A Spanish Wind Case Study. Renew. Energy 2017, 103, 180–186. [Google Scholar] [CrossRef]
- Bertolini, M.; D’Alpaos, C.; Moretto, M. Do Smart Grids Boost Investments in Domestic PV Plants? Evidence from the Italian Electricity Market. Energy 2018, 149, 890–902. [Google Scholar] [CrossRef]
- Bigerna, S.; Wen, X.; Hagspiel, V.; Kort, P.M. Green Electricity Investments: Environmental Target and the Optimal Subsidy. Eur. J. Oper. Res. 2019, 279, 635–644. [Google Scholar] [CrossRef]
- Biondi, T.; Moretto, M. Solar Grid Parity Dynamics in Italy: A Real Option Approach. Energy 2015, 80, 293–302. [Google Scholar] [CrossRef]
- Boomsma, T.K.; Linnerud, K. Market and Policy Risk under Different Renewable Electricity Support Schemes. Energy 2015, 89, 435–448. [Google Scholar] [CrossRef]
- Bruno, S.; Ahmed, S.; Shapiro, A.; Street, A. Risk Neutral and Risk Averse Approaches to Multistage Renewable Investment Planning under Uncertainty. Eur. J. Oper. Res. 2016, 250, 979–989. [Google Scholar] [CrossRef]
- Bustos, C.; Watts, D.; Olivares, D. The Evolution over Time of Distributed Energy Resource’s Penetration: A Robust Framework to Assess the Future Impact of Prosumage under Different Tariff Designs. Appl. Energy 2019, 256, 113903. [Google Scholar] [CrossRef]
- Castellini, M.; Di Corato, L.; Moretto, M.; Vergalli, S. Energy Exchange among Heterogeneous Prosumers under Price Uncertainty. Energy Econ. 2021, 104, 105647. [Google Scholar] [CrossRef]
- Cervantes, J.; Choobineh, F. Optimal Sizing of a Nonutility-Scale Solar Power System and Its Battery Storage. Appl. Energy 2018, 216, 105–115. [Google Scholar] [CrossRef]
- Chen, W.; Bi, Y. Electricity Price Subsidy or Carbon-Trading Subsidy: Which Is More Efficient to Develop Photovoltaic Power Generation from a Government Perspective? Mitig. Adapt. Strateg. Glob. Chang. 2018, 23, 667–683. [Google Scholar] [CrossRef]
- Chen, W.; Zeng, Y.; Xu, C. Energy Storage Subsidy Estimation for Microgrid: A Real Option Game-Theoretic Approach. Appl. Energy 2019, 239, 373–382. [Google Scholar] [CrossRef]
- Cheng, C.; Wang, Z.; Liu, M.; Chen, Q.; Gbatu, A.P.; Ren, X. Defer Option Valuation and Optimal Investment Timing of Solar Photovoltaic Projects under Different Electricity Market Systems and Support Schemes. Energy 2017, 127, 594–610. [Google Scholar] [CrossRef]
- Choi, G.B.; Lee, S.G.; Lee, J.M. Multi-Period Energy Planning Model under Uncertainty in Market Prices and Demands of Energy Resources: A Case Study of Korea Power System. Chem. Eng. Res. Des. 2016, 114, 341–358. [Google Scholar] [CrossRef]
- Coppitters, D.; De Paepe, W.; Contino, F. Robust Design Optimization of a Photovoltaic-Battery-Heat Pump System with Thermal Storage under Aleatory and Epistemic Uncertainty. Energy 2021, 229, 120692. [Google Scholar] [CrossRef]
- Coppitters, D.; De Paepe, W.; Contino, F. Surrogate-Assisted Robust Design Optimization and Global Sensitivity Analysis of a Directly Coupled Photovoltaic-Electrolyzer System under Techno-Economic Uncertainty. Appl. Energy 2019, 248, 310–320. [Google Scholar] [CrossRef]
- Coppitters, D.; De Paepe, W.; Contino, F. Robust Design Optimization and Stochastic Performance Analysis of a Grid-Connected Photovoltaic System with Battery Storage and Hydrogen Storage. Energy 2020, 213, 118798. [Google Scholar] [CrossRef]
- Dalby, P.A.O.; Gillerhaugen, G.R.; Hagspiel, V.; Leth-Olsen, T.; Thijssen, J.J.J. Green Investment under Policy Uncertainty and Bayesian Learning. Energy 2018, 161, 1262–1281. [Google Scholar] [CrossRef]
- DeLuque, I.; Shittu, E. Generation Capacity Expansion under Demand, Capacity Factor and Environmental Policy Uncertainties. Comput. Ind. Eng. 2019, 127, 601–613. [Google Scholar] [CrossRef]
- Devine, M.T.; Farrell, N.; Lee, W.T. Optimising Feed-in Tariff Design through Efficient Risk Allocation. Sustain. Energy Grids Netw. 2017, 9, 59–74. [Google Scholar] [CrossRef]
- Di Bari, A. A Real Options Approach to Valuate Solar Energy Investment with Public Authority Incentives: The Italian Case. Energies 2020, 13, 4181. [Google Scholar] [CrossRef]
- Díaz, G.; Moreno, B.; Coto, J.; Gómez-Aleixandre, J. Valuation of Wind Power Distributed Generation by Using Longstaff-Schwartz Option Pricing Method. Appl. Energy 2015, 145, 223–233. [Google Scholar] [CrossRef]
- Ellabban, O.; Alassi, A. Integrated Economic Adoption Model for Residential Grid-Connected Photovoltaic Systems: An Australian Case Study. Energy Rep. 2019, 5, 310–326. [Google Scholar] [CrossRef]
- Eryilmaz, D.; Homans, F.R. How Does Uncertainty in Renewable Energy Policy Affect Decisions to Invest in Wind Energy? Electr. J. 2016, 29, 64–71. [Google Scholar] [CrossRef]
- Evangelopoulos, V.A.; Georgilakis, P.S. Optimal Distributed Generation Placement under Uncertainties Based on Point Estimate Method Embedded Genetic Algorithm. IET Gener. Transm. Distrib. 2014, 8, 389–400. [Google Scholar] [CrossRef]
- Farrokhifar, M.; Aghdam, F.H.; Alahyari, A.; Monavari, A.; Safari, A. Optimal Energy Management and Sizing of Renewable Energy and Battery Systems in Residential Sectors via a Stochastic MILP Model. Electr. Power Syst. Res. 2020, 187, 106483. [Google Scholar] [CrossRef]
- Finjord, F.; Hagspiel, V.; Lavrutich, M.; Tangen, M. The Impact of Norwegian-Swedish Green Certificate Scheme on Investment Behavior: A Wind Energy Case Study. Energy Policy 2018, 123, 373–389. [Google Scholar] [CrossRef]
- Fioriti, D.; Poli, D.; Duenas-Martinez, P.; Perez-Arriaga, I. Multi-Year Stochastic Planning of off-Grid Microgrids Subject to Significant Load Growth Uncertainty: Overcoming Single-Year Methodologies. Electr. Power Syst. Res. 2021, 194, 107053. [Google Scholar] [CrossRef]
- Gahrooei, M.R.; Zhang, Y.; Ashuri, B.; Augenbroe, G. Timing Residential Photovoltaic Investments in the Presence of Demand Uncertainties. Sustain. Cities Soc. 2016, 20, 109–123. [Google Scholar] [CrossRef]
- Ganhammar, K. The Effect of Regulatory Uncertainty in Green Certificate Markets: Evidence from the Swedish-Norwegian Market. Energy Policy 2021, 158, 112583. [Google Scholar] [CrossRef]
- Gatzert, N.; Vogl, N. Evaluating Investments in Renewable Energy under Policy Risks. Energy Policy 2016, 95, 238–252. [Google Scholar] [CrossRef]
- Gazijahani, F.S.; Salehi, J. Reliability Constrained Two-Stage Optimization of Multiple Renewable-Based Microgrids Incorporating Critical Energy Peak Pricing Demand Response Program Using Robust Optimization Approach. Energy 2018, 161, 999–1015. [Google Scholar] [CrossRef]
- Hau, V.B.; Husein, M.; Chung, I.Y.; Won, D.J.; Torre, W.; Nguyen, T. Analyzing the Impact of Renewable Energy Incentives and Parameter Uncertainties on Financial Feasibility of a Campus Microgrid. Energies 2018, 11, 2446. [Google Scholar] [CrossRef]
- Husein, M.; Chung, I.Y. Optimal Design and Financial Feasibility of a University Campus Microgrid Considering Renewable Energy Incentives. Appl. Energy 2018, 225, 273–289. [Google Scholar] [CrossRef]
- Husein, M.; Kim, H.J.; Chung, I.Y. The Impact of Policy and Technology Parameters on the Economics of Microgrids for Rural Electrification: A Case Study of Remote Communities in Bolivia. Energies 2020, 13, 877. [Google Scholar] [CrossRef]
- Jeon, C.; Lee, J.; Shin, J. Optimal Subsidy Estimation Method Using System Dynamics and the Real Option Model: Photovoltaic Technology Case. Appl. Energy 2015, 142, 33–43. [Google Scholar] [CrossRef]
- Jing, R.; He, Y.; He, J.; Liu, Y.; Yang, S. Global Sensitivity Based Prioritizing the Parametric Uncertainties in Economic Analysis When Co-Locating Photovoltaic with Agriculture and Aquaculture in China. Renew. Energy 2022, 194, 1048–1059. [Google Scholar] [CrossRef]
- Kashani, H.; Ashuri, B.; Shahandashti, S.M.; Lu, J. Investment Valuation Model for Renewable Energy Systems in Buildings. J. Constr. Eng. Manag. 2015, 141, 04014074. [Google Scholar] [CrossRef]
- Kelly, J.J.; Leahy, P.G. Optimal Investment Timing and Sizing for Battery Energy Storage Systems. J. Energy Storage 2020, 28, 101272. [Google Scholar] [CrossRef]
- Khodaei, A. Provisional Microgrid Planning. IEEE Trans. Smart Grid 2017, 8, 1096–1104. [Google Scholar] [CrossRef]
- Kim, B.; Kim, K.; Kim, C. Determining the Optimal Installation Timing of Building Integrated Photovoltaic Systems. J. Clean. Prod. 2017, 140, 1322–1329. [Google Scholar] [CrossRef]
- Kitapbayev, Y.; Moriarty, J.; Mancarella, P. Stochastic Control and Real Options Valuation of Thermal Storage-Enabled Demand Response from Flexible District Energy Systems. Appl. Energy 2015, 137, 823–831. [Google Scholar] [CrossRef]
- Kitzing, L.; Juul, N.; Drud, M.; Boomsma, T.K. A Real Options Approach to Analyse Wind Energy Investments under Different Support Schemes. Appl. Energy 2017, 188, 83–96. [Google Scholar] [CrossRef]
- Kozlova, M.; Fleten, S.E.; Hagspiel, V. Investment Timing and Capacity Choice under Rate-of-Return Regulation for Renewable Energy Support. Energy 2019, 174, 591–601. [Google Scholar] [CrossRef]
- Li, C.; Wang, N.; Wang, Z.; Dou, X.; Zhang, Y.; Yang, Z.; Maréchal, F.; Wang, L.; Yang, Y. Energy Hub-Based Optimal Planning Framework for User-Level Integrated Energy Systems: Considering Synergistic Effects under Multiple Uncertainties. Appl. Energy 2022, 307, 118099. [Google Scholar] [CrossRef]
- Li, L.; Liu, J.; Zhu, L.; Zhang, X.B. How to Design a Dynamic Feed-in Tariffs Mechanism for Renewables–a Real Options Approach. Int. J. Prod. Res. 2020, 58, 4352–4366. [Google Scholar] [CrossRef]
- Li, L.; Cao, X. Comprehensive Effectiveness Assessment of Energy Storage Incentive Mechanisms for PV-ESS Projects Based on Compound Real Options. Energy 2022, 239, 121902. [Google Scholar] [CrossRef]
- Li, L.; Cao, X.; Zhang, S. Shared Energy Storage System for Prosumers in a Community: Investment Decision, Economic Operation, and Benefits Allocation under a Cost-Effective Way. J. Energy Storage 2022, 50, 104710. [Google Scholar] [CrossRef]
- Li, Y.; Wu, M.; Li, Z. A Real Options Analysis for Renewable Energy Investment Decisions under China Carbon Trading Market. Energies 2018, 11, 1817. [Google Scholar] [CrossRef]
- Liang, H.; Ma, J. Data-Driven Resource Planning for Virtual Power Plant Integrating Demand Response Customer Selection and Storage. IEEE Trans. Ind. Inform. 2022, 18, 1833–1844. [Google Scholar] [CrossRef]
- Linnerud, K.; Andersson, A.M.; Fleten, S.E. Investment Timing under Uncertain Renewable Energy Policy: An Empirical Study of Small Hydropower Projects. Energy 2014, 78, 154–164. [Google Scholar] [CrossRef]
- Liu, T.; Jiao, W.; Tian, X. A Framework for Uncertainty and Sensitivity Analysis of District Energy Systems Considering Different Parameter Types. Energy Rep. 2021, 7, 6908–6920. [Google Scholar] [CrossRef]
- Locatelli, G.; Invernizzi, D.C.; Mancini, M. Investment and Risk Appraisal in Energy Storage Systems: A Real Options Approach. Energy 2016, 104, 114–131. [Google Scholar] [CrossRef]
- Locatelli, G.; Mancini, M.; Lotti, G. A Simple-to-Implement Real Options Method for the Energy Sector. Energy 2020, 197, 117226. [Google Scholar] [CrossRef]
- Ma, R.; Cai, H.; Ji, Q.; Zhai, P. The Impact of Feed-in Tariff Degression on R&D Investment in Renewable Energy: The Case of the Solar PV Industry. Energy Policy 2021, 151, 112209. [Google Scholar] [CrossRef]
- Ma, Y.; Chapman, A.C.; Verbič, G. Valuation of Compound Real Options for Co-Investment in Residential Battery Systems. Appl. Energy 2022, 318, 119111. [Google Scholar] [CrossRef]
- Ma, Y.; Swandi, K.; Chapman, A.C.; Verbič, G. Multi-Stage Compound Real Options Valuation in Residential PV-Battery Investment. Energy 2020, 191, 116537. [Google Scholar] [CrossRef]
- Maeda, M.; Watts, D. The Unnoticed Impact of Long-Term Cost Information on Wind Farms’ Economic Value in the USA.—A Real Option Analysis. Appl. Energy 2019, 241, 540–547. [Google Scholar] [CrossRef]
- Martínez Ceseña, E.A.; Capuder, T.; Mancarella, P. Flexible Distributed Multienergy Generation System Expansion Planning under Uncertainty. IEEE Trans. Smart Grid 2016, 7, 348–357. [Google Scholar] [CrossRef]
- Mavromatidis, G.; Orehounig, K.; Carmeliet, J. Uncertainty and Global Sensitivity Analysis for the Optimal Design of Distributed Energy Systems. Appl. Energy 2018, 214, 219–238. [Google Scholar] [CrossRef]
- Mavromatidis, G.; Orehounig, K.; Carmeliet, J. Comparison of Alternative Decision-Making Criteria in a Two-Stage Stochastic Program for the Design of Distributed Energy Systems under Uncertainty. Energy 2018, 156, 709–724. [Google Scholar] [CrossRef]
- Merrington, S.; Khezri, R.; Mahmoudi, A. Optimal Planning of Solar Photovoltaic and Battery Storage for Electric Vehicle Owner Households with Time-of-Use Tariff. IET Gener. Transm. Distrib. 2022, 16, 535–547. [Google Scholar] [CrossRef]
- Mohammadi, F.; Faghihi, F.; Kazemi, A.; Salemi, A.H. The Effect of Multi -Uncertainties on Battery Energy Storage System Sizing in Smart Homes. J. Energy Storage 2022, 52, 104765. [Google Scholar] [CrossRef]
- Mohseni, S.; Brent, A.C. Quantifying the Effects of Forecast Uncertainty on the Role of Different Battery Technologies in Grid-Connected Solar Photovoltaic/Wind/Micro-Hydro Micro-Grids: An Optimal Planning Study. J. Energy Storage 2022, 51, 104412. [Google Scholar] [CrossRef]
- Mohy-Ud-Din, G.; Vu, D.H.; Muttaqi, K.M.; Sutanto, D. An Integrated Energy Management Approach for the Economic Operation of Industrial Microgrids under Uncertainty of Renewable Energy. IEEE Trans. Ind. Appl. 2020, 56, 1062–1073. [Google Scholar] [CrossRef]
- Moncada, J.A.; Tao, Z.; Valkering, P.; Meinke-Hubeny, F.; Delarue, E. Influence of Distribution Tariff Structures and Peer Effects on the Adoption of Distributed Energy Resources. Appl. Energy 2021, 298, 117086. [Google Scholar] [CrossRef]
- Moon, Y.; Baran, M. Economic Analysis of a Residential PV System from the Timing Perspective: A Real Option Model. Renew. Energy 2018, 125, 783–795. [Google Scholar] [CrossRef]
- Mu, Y.; Wang, C.; Cao, Y.; Jia, H.; Zhang, Q.; Yu, X. A CVaR-Based Risk Assessment Method for Park-Level Integrated Energy System Considering the Uncertainties and Correlation of Energy Prices. Energy 2022, 247, 123549. [Google Scholar] [CrossRef]
- Nadal, A.; Ruby, A.; Bourasseau, C.; Riu, D.; Berenguer, C. Accounting for Techno-Economic Parameters Uncertainties for Robust Design of Remote Microgrid. Int. J. Electr. Power Energy Syst. 2020, 116, 105531. [Google Scholar] [CrossRef]
- Pazouki, S.; Haghifam, M.R. Optimal Planning and Scheduling of Energy Hub in Presence of Wind, Storage and Demand Response under Uncertainty. Int. J. Electr. Power Energy Syst. 2016, 80, 219–239. [Google Scholar] [CrossRef]
- Penizzotto, F.; Pringles, R.; Olsina, F. Real Options Valuation of Photovoltaic Power Investments in Existing Buildings. Renew. Sustain. Energy Rev. 2019, 114, 109308. [Google Scholar] [CrossRef]
- Petkov, I.; Gabrielli, P. Power-to-Hydrogen as Seasonal Energy Storage: An Uncertainty Analysis for Optimal Design of Low-Carbon Multi-Energy Systems. Appl. Energy 2020, 274, 115197. [Google Scholar] [CrossRef]
- Pizarro-Alonso, A.; Ravn, H.; Münster, M. Uncertainties towards a Fossil-Free System with High Integration of Wind Energy in Long-Term Planning. Appl. Energy 2019, 253, 113528. [Google Scholar] [CrossRef]
- Pringles, R.; Olsina, F.; Penizzotto, F. Valuation of Defer and Relocation Options in Photovoltaic Generation Investments by a Stochastic Simulation-Based Method. Renew. Energy 2020, 151, 846–864. [Google Scholar] [CrossRef]
- Qu, J.; Jeon, W. Price and Subsidy under Uncertainty: Real-Option Approach to Optimal Investment Decisions on Energy Storage with Solar PV. Energy Environ. 2022, 33, 263–282. [Google Scholar] [CrossRef]
- ur Rehman, W.; Bo, R.; Mehdipourpicha, H.; Kimball, J.W. Sizing Battery Energy Storage and PV System in an Extreme Fast Charging Station Considering Uncertainties and Battery Degradation. Appl. Energy 2022, 313, 118745. [Google Scholar] [CrossRef]
- Rezaei, M.; Dampage, U.; Das, B.K.; Nasif, O.; Borowski, P.F.; Mohamed, M.A. Investigating the Impact of Economic Uncertainty on Optimal Sizing of Grid-Independent Hybrid Renewable Energy Systems. Processes 2021, 9, 1468. [Google Scholar] [CrossRef]
- Ritzenhofen, I.; Spinler, S. Optimal Design of Feed-in-Tariffs to Stimulate Renewable Energy Investments under Regulatory Uncertainty—A Real Options Analysis. Energy Econ. 2016, 53, 76–89. [Google Scholar] [CrossRef]
- Russo, M.; Kraft, E.; Bertsch, V.; Keles, D. Short-Term Risk Management of Electricity Retailers under Rising Shares of Decentralized Solar Generation. Energy Econ. 2022, 109, 105956. [Google Scholar] [CrossRef]
- Sadeghian, O.; Oshnoei, A.; Khezri, R.; Muyeen, S.M. Risk-Constrained Stochastic Optimal Allocation of Energy Storage System in Virtual Power Plants. J. Energy Storage 2020, 31, 101732. [Google Scholar] [CrossRef]
- Scott, I.J.; Botterud, A.; Carvalho, P.M.S.; Silva, C.A.S. Renewable Energy Support Policy Evaluation: The Role of Long-Term Uncertainty in Market Modelling. Appl. Energy 2020, 278, 115643. [Google Scholar] [CrossRef]
- Sendstad, L.H.; Chronopoulos, M. Sequential Investment in Renewable Energy Technologies under Policy Uncertainty. Energy Policy 2020, 137, 111152. [Google Scholar] [CrossRef]
- Sgobba, A.; Meskell, C. On-Site Renewable Electricity Production and Self Consumption for Manufacturing Industry in Ireland: Sensitivity to Techno-Economic Conditions. J. Clean. Prod. 2019, 207, 894–907. [Google Scholar] [CrossRef]
- Shakouri, M.; Lee, H.W.; Kim, Y.W. A Probabilistic Portfolio-Based Model for Financial Valuation of Community Solar. Appl. Energy 2017, 191, 709–726. [Google Scholar] [CrossRef]
- Shojaabadi, S.; Abapour, S.; Abapour, M.; Nahavandi, A. Simultaneous Planning of Plug-in Hybrid Electric Vehicle Charging Stations and Wind Power Generation in Distribution Networks Considering Uncertainties. Renew. Energy 2016, 99, 237–252. [Google Scholar] [CrossRef]
- Sisodia, G.S.; Soares, I.; Ferreira, P. Modeling Business Risk: The Effect of Regulatory Revision on Renewable Energy Investment—The Iberian Case. Renew. Energy 2016, 95, 303–313. [Google Scholar] [CrossRef]
- Tian, L.; Pan, J.; Du, R.; Li, W.; Zhen, Z.; Qibing, G. The Valuation of Photovoltaic Power Generation under Carbon Market Linkage Based on Real Options. Appl. Energy 2017, 201, 354–362. [Google Scholar] [CrossRef]
- To, T.; Heleno, M.; Valenzuela, A. Risk-Constrained Multi-Period Investment Model for Distributed Energy Resources Considering Technology Costs and Regulatory Uncertainties. Appl. Energy 2022, 319, 119210. [Google Scholar] [CrossRef]
- Tomosk, S.; Haysom, J.E.; Wright, D. Quantifying Economic Risk in Photovoltaic Power Projects. Renew. Energy 2017, 109, 422–433. [Google Scholar] [CrossRef]
- Torani, K.; Rausser, G.; Zilberman, D. Innovation Subsidies versus Consumer Subsidies: A Real Options Analysis of Solar Energy. Energy Policy 2016, 92, 255–269. [Google Scholar] [CrossRef]
- Tsao, Y.C.; Van Thanh, V.; Chang, Y.Y.; Wei, H.H. COVID-19: Government Subsidy Models for Sustainable Energy Supply with Disruption Risks. Renew. Sustain. Energy Rev. 2021, 150, 111425. [Google Scholar] [CrossRef]
- Venkatasubramanian, B.V.; Jately, V.; Azzopardi, B. Techno-Economic Framework for Optimal Capacity Expansion of Active Microgrid in the Mediterranean: A Case Study of Mcast. IEEE Access 2021, 9, 120451–120463. [Google Scholar] [CrossRef]
- Wesseh, P.K.; Lin, B. A Real Options Valuation of Chinese Wind Energy Technologies for Power Generation: Do Benefits from the Feed-in Tariffs Outweigh Costs? J. Clean. Prod. 2016, 112, 1591–1599. [Google Scholar] [CrossRef]
- Williams, N.J.; Jaramillo, P.; Taneja, J. An Investment Risk Assessment of Microgrid Utilities for Rural Electrification Using the Stochastic Techno-Economic Microgrid Model: A Case Study in Rwanda. Energy Sustain. Dev. 2018, 42, 87–96. [Google Scholar] [CrossRef]
- Xu, T.; Ma, J. Feed-in Tariff or Tax-Rebate Regulation? Dynamic Decision Model for the Solar Photovoltaic Supply Chain. Appl. Math. Model. 2021, 89, 1106–1123. [Google Scholar] [CrossRef]
- Yang, D.-X.; Jing, Y.-Q.; Wang, C.; Nie, P.-Y.; Sun, P. Analysis of Renewable Energy Subsidy in China under Uncertainty: Feed-in Tariff vs. Renewable Portfolio Standard. Energy Strateg. Rev. 2021, 34, 100628. [Google Scholar] [CrossRef]
- Yu, L.; Li, Y.P.; Shan, B.G.; Huang, G.H.; Xu, L.P. A Scenario-Based Interval-Stochastic Basic-Possibilistic Programming Method for Planning Sustainable Energy System under Uncertainty: A Case Study of Beijing, China. J. Clean. Prod. 2018, 197, 1454–1471. [Google Scholar] [CrossRef]
- Yu, X.; Dong, X.; Pang, S.; Zhou, L.; Zang, H. Energy Storage Sizing Optimization and Sensitivity Analysis Based on Wind Power Forecast Error Compensation. Energies 2019, 12, 4755. [Google Scholar] [CrossRef]
- Zeng, Y.; Klabjan, D.; Arinez, J. Distributed Solar Renewable Generation: Option Contracts with Renewable Energy Credit Uncertainty. Energy Econ. 2015, 48, 295–305. [Google Scholar] [CrossRef]
- Zeng, Y.; Chen, W. The Socially Optimal Energy Storage Incentives for Microgrid: A Real Option Game-Theoretic Approach. Sci. Total Environ. 2020, 710, 136199. [Google Scholar] [CrossRef]
- Zhang, M.M.; Wang, Q.; Zhou, D.; Ding, H. Evaluating Uncertain Investment Decisions in Low-Carbon Transition toward Renewable Energy. Appl. Energy 2019, 240, 1049–1060. [Google Scholar] [CrossRef]
- Zhang, M.M.; Zhou, D.Q.; Zhou, P.; Chen, H.T. Optimal Design of Subsidy to Stimulate Renewable Energy Investments: The Case of China. Renew. Sustain. Energy Rev. 2017, 71, 873–883. [Google Scholar] [CrossRef]
- Zhang, M.M.; Zhou, D.Q.; Zhou, P.; Liu, G.Q. Optimal Feed-in Tariff for Solar Photovoltaic Power Generation in China: A Real Options Analysis. Energy Policy 2016, 97, 181–192. [Google Scholar] [CrossRef]
- Zhang, M.M.; Zhou, P.; Zhou, D.Q. A Real Options Model for Renewable Energy Investment with Application to Solar Photovoltaic Power Generation in China. Energy Econ. 2016, 59, 213–226. [Google Scholar] [CrossRef]
- Zhang, M.; Tang, Y.; Liu, L.; Zhou, D. Optimal Investment Portfolio Strategies for Power Enterprises under Multi-Policy Scenarios of Renewable Energy. Renew. Sustain. Energy Rev. 2022, 154, 111879. [Google Scholar] [CrossRef]
- Zhang, R.; Shimada, K.; Ni, M.; Shen, G.Q.P.; Wong, J.K.W. Low or No Subsidy? Proposing a Regional Power Grid Based Wind Power Feed-in Tariff Benchmark Price Mechanism in China. Energy Policy 2020, 146, 111758. [Google Scholar] [CrossRef]
- Zhang, Y.; Wang, L.; Wang, N.; Duan, L.; Zong, Y.; You, S.; Maréchal, F.; Van Herle, J.; Yang, Y. Balancing Wind-Power Fluctuation via Onsite Storage under Uncertainty: Power-to-Hydrogen-to-Power versus Lithium Battery. Renew. Sustain. Energy Rev. 2019, 116, 109465. [Google Scholar] [CrossRef]
- Zheng, Y.; Jenkins, B.M.; Kornbluth, K.; Kendall, A.; Træholt, C. Optimization of a Biomass-Integrated Renewable Energy Microgrid with Demand Side Management under Uncertainty. Appl. Energy 2018, 230, 836–844. [Google Scholar] [CrossRef]
- Zheng, Y.; Jenkins, B.M.; Kornbluth, K.; Træholt, C. Optimization under Uncertainty of a Biomass-Integrated Renewable Energy Microgrid with Energy Storage. Renew. Energy 2018, 123, 204–217. [Google Scholar] [CrossRef]
- Zheng, Z.; Li, X.; Pan, J.; Luo, X. A Multi-Year Two-Stage Stochastic Programming Model for Optimal Design and Operation of Residential Photovoltaic-Battery Systems. Energy Build. 2021, 239, 110835. [Google Scholar] [CrossRef]
- Zhou, L.; Zhang, Y.; Lin, X.; Li, C.; Cai, Z.; Yang, P. Optimal Sizing of PV and Bess for a Smart Household Considering Different Price Mechanisms. IEEE Access 2018, 6, 41050–41059. [Google Scholar] [CrossRef]
- Zhou, N.; Liu, N.; Zhang, J.; Lei, J. Multi-Objective Optimal Sizing for Battery Storage of PV-Based Microgrid with Demand Response. Energies 2016, 9, 591. [Google Scholar] [CrossRef]
- Zou, B.; Wang, J.; Wen, F. Optimal Investment Strategies for Distributed Generation in Distribution Networks with Real Option Analysis. IET Gener. Transm. Distrib. 2017, 11, 804–813. [Google Scholar] [CrossRef]
- De La Hoz, J.; Alonso, À.; Coronas, S.; Martín, H.; Matas, J. Impact of Different Regulatory Structures on the Management of Energy Communities. Energies 2020, 13, 2892. [Google Scholar] [CrossRef]
- Alonso, À.; de la Hoz, J.; Martín, H.; Coronas, S.; Matas, J. Individual vs. Community: Economic Assessment of Energy Management Systems under Different Regulatory Frameworks. Energies 2021, 14, 676. [Google Scholar] [CrossRef]
- Fleten, S.E.; Maribu, K.M.; Wangensteen, I. Optimal Investment Strategies in Decentralized Renewable Power Generation under Uncertainty. Energy 2007, 32, 803–815. [Google Scholar] [CrossRef]
- What Are the Major Factors Affecting Natural Gas Prices? Available online: https://www.eia.gov/tools/faqs/faq.php?id=43&t=8 (accessed on 6 October 2022).
- Emission Trading Systems. Available online: https://www.oecd.org/environment/tools-evaluation/emissiontradingsystems.htm (accessed on 6 October 2022).
- Pahle, M.; Tietjen, O.; Osorio, S.; Egli, F.; Steffen, B.; Schmidt, T.S.; Edenhofer, O. Safeguarding the Energy Transition against Political Backlash to Carbon Markets. Nat. Energy 2022, 7, 290–296. [Google Scholar] [CrossRef]
- Levelized Cost of Energy, Levelized Cost of Storage, and Levelized Cost of Hydrogen. Available online: https://www.lazard.com/perspective/levelized-cost-of-energy-levelized-cost-of-storage-and-levelized-cost-of-hydrogen/ (accessed on 25 October 2022).
- Alonso-Travesset, À.; Martín, H.; Coronas, S.; De La Hoz, J. Optimization Models under Uncertainty in Distributed Generation Systems: A Review. Energies 2022, 15, 1932. [Google Scholar] [CrossRef]
- Rixhon, X.; Limpens, G.; Coppitters, D.; Jeanmart, H.; Contino, F. The Role of Electrofuels under Uncertainties for the Belgian Energy Transition. Energies 2021, 14, 4027. [Google Scholar] [CrossRef]
- Mirkhani, S.; Saboohi, Y. Stochastic modeling of the energy supply system with uncertain fuel price—A case of emerging technologies for distributed power generation. Appl. Energy 2012, 93, 668–674. [Google Scholar] [CrossRef]
- Alonso, À.; de la Hoz, J.; Martín, H.; Coronas, S.; Salas, P.; Matas, J. A Comprehensive Model for the Design of a Microgrid under Regulatory Constraints Using Synthetical Data Generation and Stochastic Optimization. Energies 2020, 13, 5590. [Google Scholar] [CrossRef]
- Soroudi, A.; Amraee, T. Decision Making under Uncertainty in Energy Systems: State of the Art. Renew. Sustain. Energy Rev. 2013, 28, 376–384. [Google Scholar] [CrossRef]
- Kalogirou, S.A. Artificial Neural Networks in Renewable Energy Systems Applications: A Review. Renew. Sustain. Energy Rev. 2000, 5, 373–401. [Google Scholar] [CrossRef]
- Liu, B.; Wang, Y. Energy System Optimization under Uncertainties: A Comprehensive Review; Elsevier Inc.: Amsterdam, The Netherlands, 2020; ISBN 9780128183762. [Google Scholar]
- Ben-Tal, A.; Ghaoui, L.; Nemirovski, A. Robust Optimization; Princeton University Press: Princeton, NJ, USA, 2013; ISBN 978-069114368-2. [Google Scholar]
- Verleysen, K.; Coppitters, D.; Parente, A.; De Paepe, W.; Contino, F. How Can Power-to-Ammonia Be Robust? Optimization of an Ammonia Synthesis Plant Powered by a Wind Turbine Considering Operational Uncertainties. Fuel 2020, 266, 117049. [Google Scholar] [CrossRef]
- Coppitters, D.; Verleysen, K.; De Paepe, W.; Contino, F. How Can Renewable Hydrogen Compete with Diesel in Public Transport? Robust Design Optimization of a Hydrogen Refueling Station under Techno-Economic and Environmental Uncertainty. Appl. Energy 2022, 312, 118694. [Google Scholar] [CrossRef]
- Longstaff, F.A.; Schwartz, E.S. Valuing American Options by Simulation: A Simple Least-Squares Approach. Rev. Financ. Stud. 2001, 14, 113–147. [Google Scholar] [CrossRef]
- Tableau Chart Templates Part 1: Sankeys. Available online: https://www.flerlagetwins.com/2018/04/sankey-template.html (accessed on 25 October 2022).
- Li, Y.; Zio, E. Uncertainty Analysis of the Adequacy Assessment Model of a Distributed Generation System. Renew. Energy 2012, 41, 235–244. [Google Scholar] [CrossRef]
- Shlyakhter, A.I.; Kammen, D.M.; Broido, C.L.; Wilson, R. Quantifying the Credibility of Energy Projections from Trends in Past Data. The US Energy Sector. Energy Policy 1994, 22, 119–130. [Google Scholar] [CrossRef]
- Ahmad, T.; Madonski, R.; Zhang, D.; Huang, C.; Mujeeb, A. Data-Driven Probabilistic Machine Learning in Sustainable Smart Energy/Smart Energy Systems: Key Developments, Challenges, and Future Research Opportunities in the Context of Smart Grid Paradigm. Renew. Sustain. Energy Rev. 2022, 160, 112128. [Google Scholar] [CrossRef]
- Sharifzadeh, M.; Sikinioti-Lock, A.; Shah, N. Machine-Learning Methods for Integrated Renewable Power Generation: A Comparative Study of Artificial Neural Networks, Support Vector Regression, and Gaussian Process Regression. Renew. Sustain. Energy Rev. 2019, 108, 513–538. [Google Scholar] [CrossRef]
- Ghoddusi, H.; Creamer, G.G.; Rafizadeh, N. Machine Learning in Energy Economics and Finance: A Review. Energy Econ. 2019, 81, 709–727. [Google Scholar] [CrossRef]
- Majidi, M.; Mohammadi-Ivatloo, B.; Soroudi, A. Application of Information Gap Decision Theory in Practical Energy Problems: A Comprehensive Review. Appl. Energy 2019, 249, 157–165. [Google Scholar] [CrossRef]
- Ben-Haim, Y. Info-Gap Decision Theory (IG). In Decision Making under Deep Uncertainty: From Theory to Practice; Marchau, V., Walker, W., Bloemen, P., Popper, S., Eds.; Springer: Cham, Switzerland, 2019. [Google Scholar] [CrossRef]


Disclaimer/Publisher’s Note: The statements, opinions and data contained in all publications are solely those of the individual author(s) and contributor(s) and not of MDPI and/or the editor(s). MDPI and/or the editor(s) disclaim responsibility for any injury to people or property resulting from any ideas, methods, instructions or products referred to in the content. |
© 2023 by the authors. Licensee MDPI, Basel, Switzerland. This article is an open access article distributed under the terms and conditions of the Creative Commons Attribution (CC BY) license (https://creativecommons.org/licenses/by/4.0/).