Article

Numerical Study on Protective Measures for a Skid-Mounted Hydrogen Refueling Station

1
Institute of Thermal Science and Technology, Shandong University, Jinan 250061, China
2
Research Institute of State Grid Zhejiang Electric Power Company, Ltd., Hangzhou 310014, China
3
Shanghai Institute of Applied Physics, Chinese Academy of Sciences, Shanghai 201800, China
4
School of Mechanical Engineering, Shandong University, Jinan 250061, China
*
Author to whom correspondence should be addressed.
Energies 2023, 16(2), 910; https://doi.org/10.3390/en16020910
Submission received: 8 December 2022 / Revised: 1 January 2023 / Accepted: 4 January 2023 / Published: 13 January 2023
(This article belongs to the Special Issue Hydrogen Economy and Advanced Energy Management Strategies)

Abstract

:
Hydrogen refueling stations are one of the key infrastructure components for the hydrogen-fueled economy. Skid-mounted hydrogen refueling stations (SHRSs) can be more easily commercialized due to their smaller footprints and lower costs compared to stationary hydrogen refueling stations. The present work modeled hydrogen explosions in a skid-mounted hydrogen refueling station to predict the overpressures for hydrogen-air mixtures and investigate the protective effects for different explosion vent layouts and protective wall distances. The results show that the explosive vents with the same vent area have similar overpressure reduction effects. The layout of the explosion vent affects the flame shape. Explosion venting can effectively reduce the inside maximum overpressure by 61.8%. The protective walls can reduce the overpressures, but the protective walls should not be too close to the SHRS because high overpressures are generated inside the walls due to the confined shock waves. The protective wall with a distance of 6 m can effectively protect the surrounding people and avoid the secondary overpressure damage to the container.

1. Introduction

Environmental pollution and resource shortages have become increasingly serious due to the extensive use of fossil fuels. Hydrogen plays an important role in a long-term transition toward a clean and sustainable future because hydrogen is clean, sustainable, and abundant [1,2,3,4]. However, hydrogen infrastructure is now insufficient for the commercialization of fuel cell vehicles, especially hydrogen refueling stations [5]. Skid-mounted hydrogen refueling stations (SHRSs) have the advantages of a small footprint, short construction time, and low cost, which can be more easily commercialized [6]. Hydrogen safety is important for the large-scale commercialization of SHRSs. Hydrogen is a fuel with similar dangerous properties as methane and gasoline [7]. The physical properties of hydrogen, methane, and gasoline are shown in Table 1. The hydrogen flammability range is very wide compared to other fuels. The energy required to initiate hydrogen combustion is much lower than that required for other common fuels, and the hydrogen flame is much more likely to progress to a widespread deflagration, or even to a detonation, than methane or gasoline flames [8].
The SHRS is a congested space, in which the leaked hydrogen will be confined and accumulate to form a dangerous explosive gas mixture [11,12]. Once the gas mixture is ignited, the explosion will harm the people and equipment inside and outside the container if there are no explosion protection measures. Explosion venting is commonly used in the process industries as a prevention solution to protect equipment or buildings against excessive internal pressure caused by an internal explosion [13]. The size of explosion vent openings and the degree of congestion within a building are key factors in structural damage following an explosion [14]. The maximum explosion peak overpressure occurs inside the room, and the explosion peak overpressure gradually decreases as the vent size increases [15]. Studies of explosions in confined spaces with built-in obstacles have shown that obstacles can cause increased turbulence and flame instability, resulting in flame acceleration [16]. The location of the ignition in the enclosed space also has an impact on the detonation; setting up a detonation port near the ignition source area can effectively reduce the overpressure [17]. Several studies on explosion venting used the premixing of combustible gases to evaluate explosion overpressure behaviors [18,19]. The maximum length and duration of the external flame rises and then falls with the increasing hydrogen concentration [20]. Explosion venting effectively reduces the internal overpressure of the container to protect people and equipment inside the container, but it cannot reduce the overpressure damage outside the container. Once the hydrogen mixture is ignited, the explosion will harm nearby people and facilities. Protective walls can protect the nearby personnel and equipment and reduce the separation distances with the proper size in the leak direction [21,22,23,24]. Higher walls can block more pressure waves and jet flames [25]. However, when the protective wall height reaches a certain value, further increase of the wall height cannot significantly promote greater protective effects [26]. Numerical modeling has been widely used to analyze the circulation phenomena near the wall, the development law of shock wave flows, and the development of reflection and flow around the wall [27,28,29,30].
However, most existing studies of vented explosions have focused on the size of explosion vents and the concentrations of premixed fuel, with few analyses of the explosion vent layouts in SHRSs. The studies of protective walls have focused on the wall heights and the development law of shock wave flows, with few analyses of the wall distances from the container. Therefore, the present work modeled hydrogen explosions in a skid-mounted hydrogen refueling station to predict the overpressures for hydrogen-air mixtures and investigate the protective effects of different explosion vent layouts and protective wall distances from the SHRS.

2. CFD Model

2.1. Modeling Approach

The premixed hydrogen explosions were modeled using FLACS software, which was developed by Gexcon and validated for hydrogen applications [31,32,33]. The SIMPLE pressure correction algorithm is applied [34] and extended to handle compressible flows, with additional source terms for the compression work in the enthalpy equation. Iterations are repeated until a mass residual of less than 10−4 is obtained. A standard k-ε turbulence model is used for turbulent modeling.
In FLACS, the solution convergence process is decided by the Courant–Friedrichs–Lewy (CFL) number. The length of time step becomes adaptive by adjusting the speed of sound (CFLC) and the fluid flow velocity (CFLV) to meet CFL number stability criteria. The FLACS user manual suggests that the calculation of the explosion should use CFLC = 5 and CFLV = 0.5 [35].

2.2. Modeling Validation

In this study, experimental data in the literature were used to further validate the accuracy of the numerical results. The experimental data were obtained from experiments performed in a 64 m3 explosion test chamber. The overall dimensions of the chamber were 4.6 × 3.0 × 4.6 m3, with a square vent of 5.4 m2 located on one of the vertical walls. Four pressure transducers were mounted to the chamber: one at the center of the wall opposite the vent, one on the wall containing the vent, and two on a wall perpendicular to the vent. A hydrogen-air mixture was supplied by injecting the pure fuel through an inlet at the floor of the chamber while mixing fans within the chamber were used to create a uniform mixture [36]. This study used a geometric model of the same size as in the experiment, as shown in Figure 1a, and used the 90,000 element mesh for calculation. The ambient conditions were the static wind, and the ambient temperature was 25 °C. An 18% vol hydrogen-air mixture filled the chamber. The ignition point was at the center of the container, and monitoring points were set up at locations corresponding to the experiments. The comparison between the calculated overpressures and experimental data are shown in Figure 1b, which shows that the trend of overpressures agrees with the experimental data. Therefore, the FLACS software shows excellent performance in the simulation of hydrogen explosions.

2.3. Geometry

2.3.1. Explosion Vent Layouts

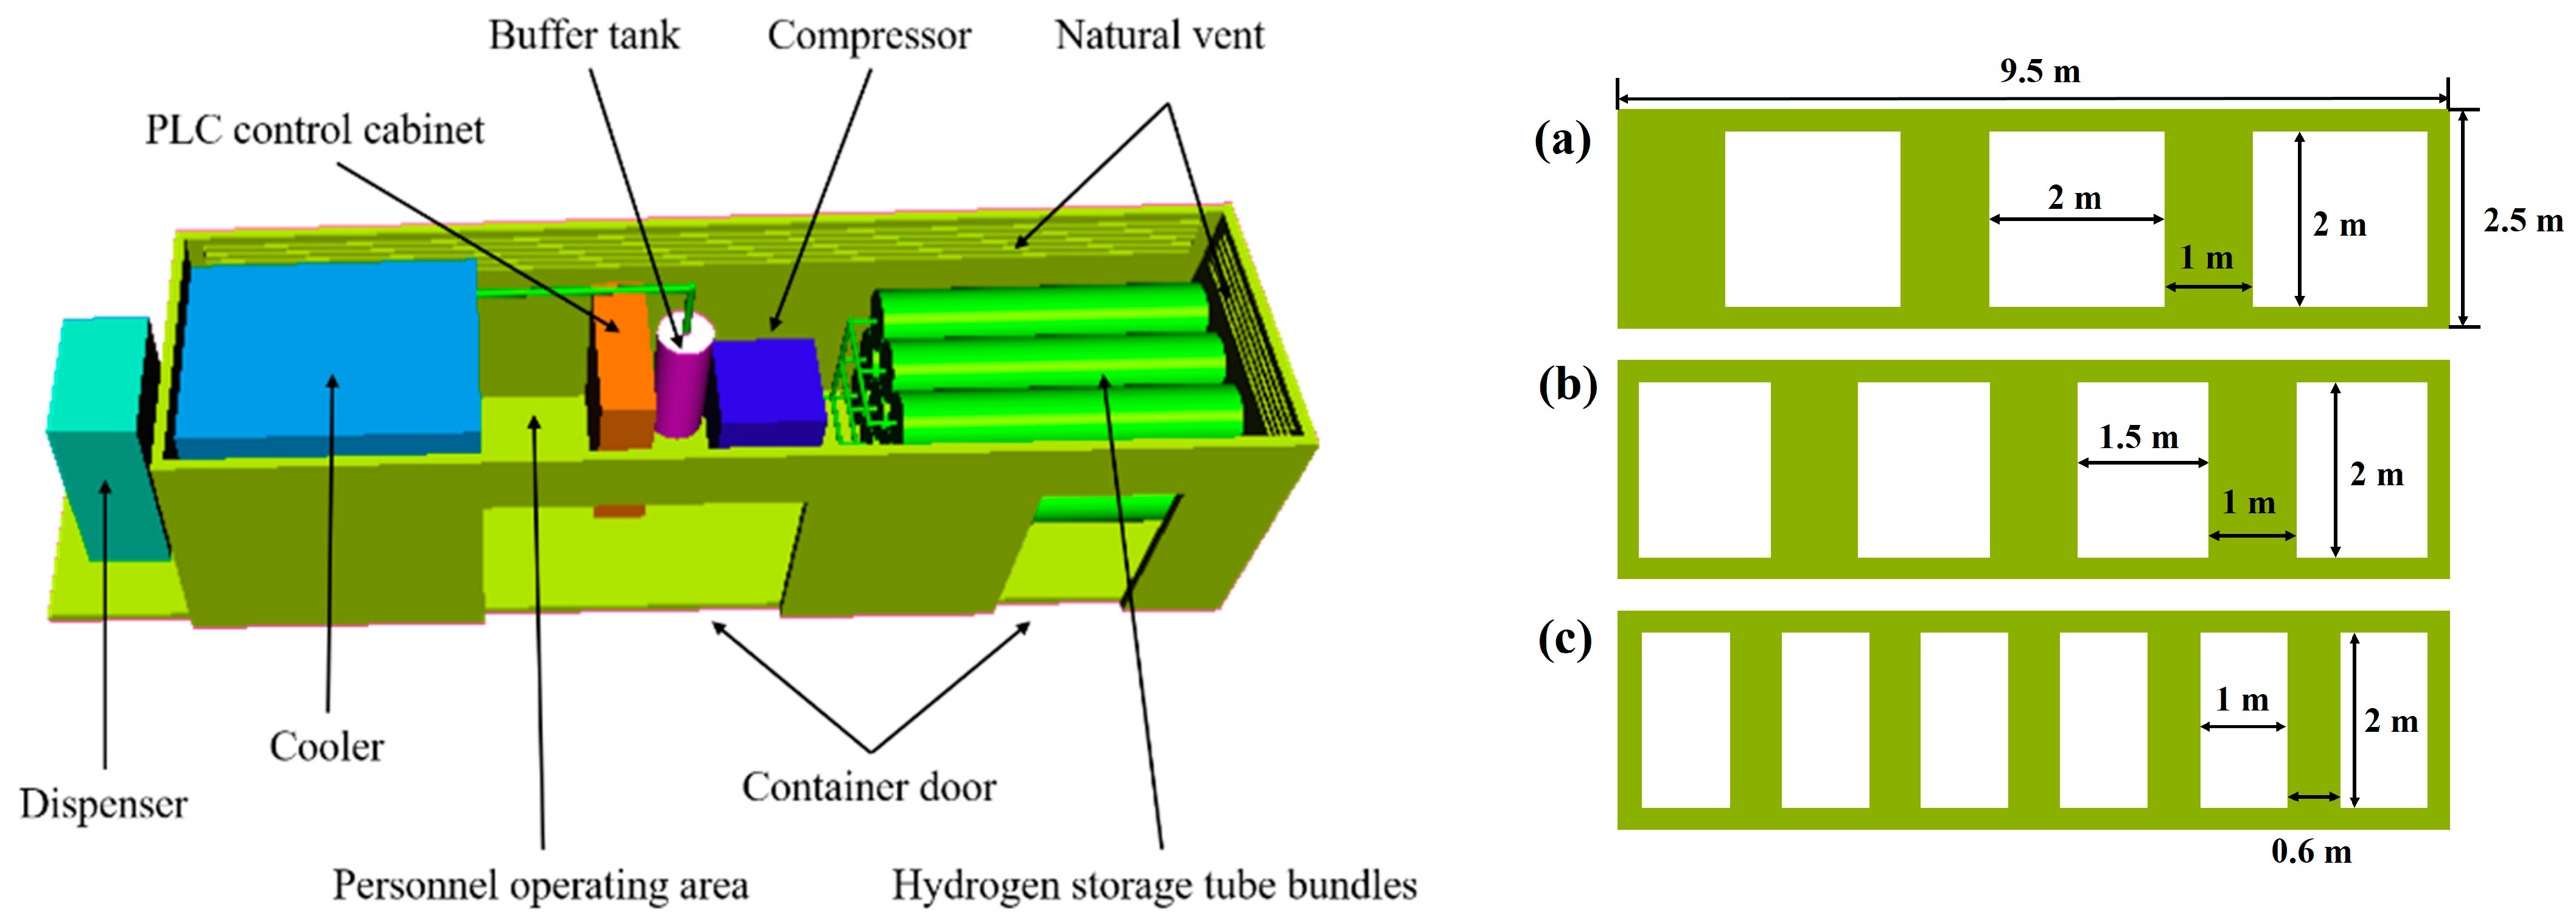
The model geometry shown in Figure 2 represents a skid-mounted hydrogen refueling station. The container was 9.5 m long, 2.5 m wide, and 2.5 m high. In this study, the explosion vented area was calculated to be 12 m2, according to the GB 50516-2010 Technical Code for Hydrogen Fuelling Station (2021 Edition) and the GB 50016-2014 Code for Fire Protection design of Buildings (2018 Edition). Three different explosion vent layouts were installed on the top of the SHRS container. The explosion vent areas were the same for different vent layouts. This study used the stoichiometric concentration of hydrogen in the air (29.6%) to model the most severe hydrogen explosion and analyzed the protective effect of the vent on the SHRS. The PLC control cabinet is prone to electric leakage and static electricity; thus, the PLC control cabinet was set as the ignition region. The ignition region and hydrogen-air premixed region are shown in Figure 3. The environment was set as static wind conditions, and the ambient air temperature was 20 °C. The calculation domain was 30 m × 25 m × 15 m. The core area of the explosion around the SHRS container was locally refined to ensure the calculation accuracy and capture the details of the explosion. The explosion venting calculations used the 913,000 element mesh in this study.

2.3.2. Protective Wall Layouts

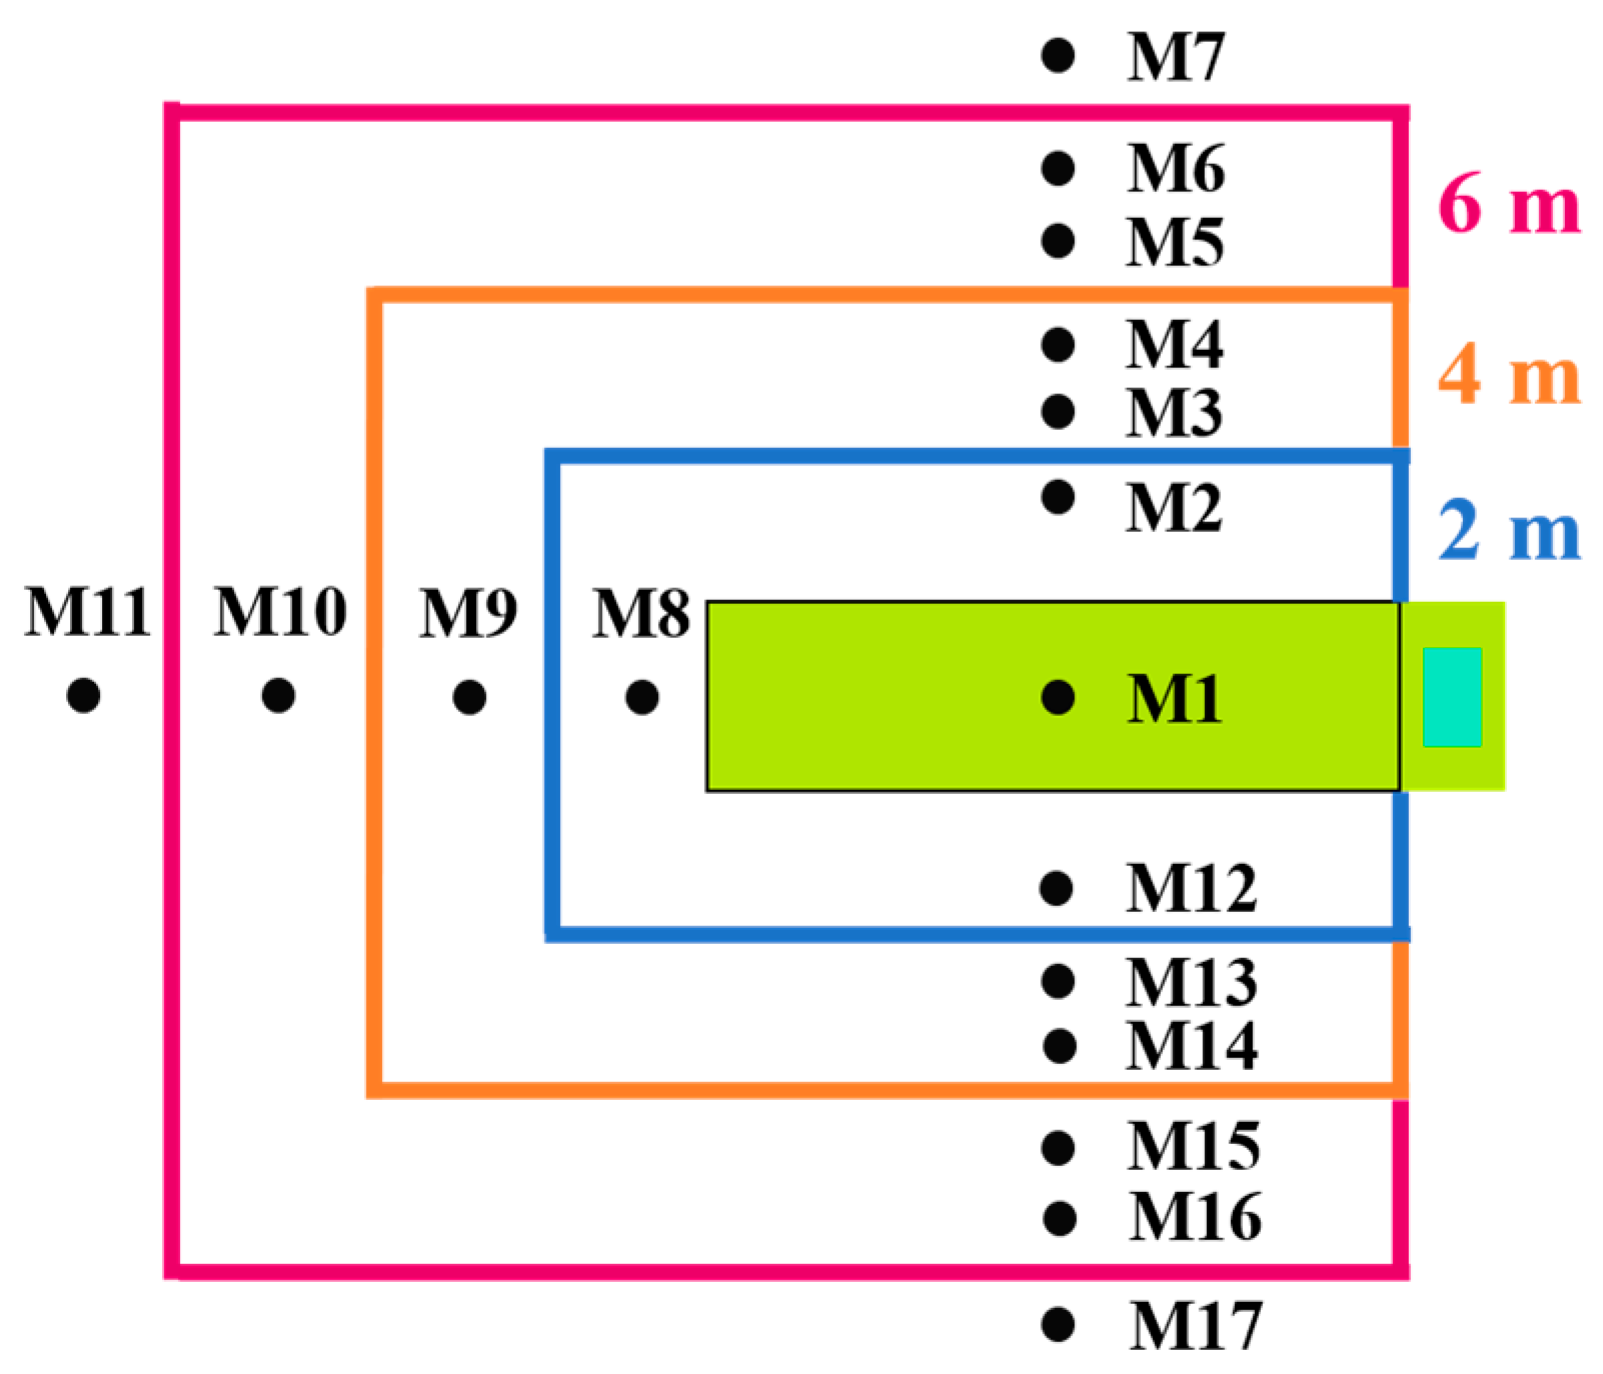
The SHRS needs to set aside space for refueling when setting up protective walls. Therefore, protective walls were installed behind the dispenser. The protective walls were 3.5 m high and at a distance of 2 m, 4 m, and 6 m from the SHRS, as shown in Figure 4. The ignition region and hydrogen-air premixed region are shown in Figure 3. The ambient air temperature was 20 °C, and the environment is windless. The calculation domain was 28 m × 28 m × 15 m. The calculation areas of X and Y directions were reduced because the protective wall limited the development of shock waves and flames. The core area of the explosion was locally refined, and the boundary mesh was stretched to reduce the number of mesh and reduce the calculation time. The protective wall calculations used the 620,000 element mesh in this study. Seventeen monitoring points were set up to record the hydrogen overpressures in the cabinet and the operating area, as shown in Figure 5.

2.4. Explosion Overpressure Harm Criteria

Hydrogen explosions cause shock waves with overpressures that can lead to different levels of harm to nearby personnel and equipment. The injury to the auditory organs and internal organs was used to determine the damage caused by overpressure on a person. The damage to windows, walls and other building structures was used to determine the damage to the building from overpressures. The injury standards shown in Table 2 were used to determine the risk associated with a hydrogen explosion. The affected areas and safety distances for specific accidents were determined based on these injury standards to ensure the safety of people around the equipment and to provide reference data for emergency response plans for hydrogen production systems [37].

3. Effects of Explosion Vents

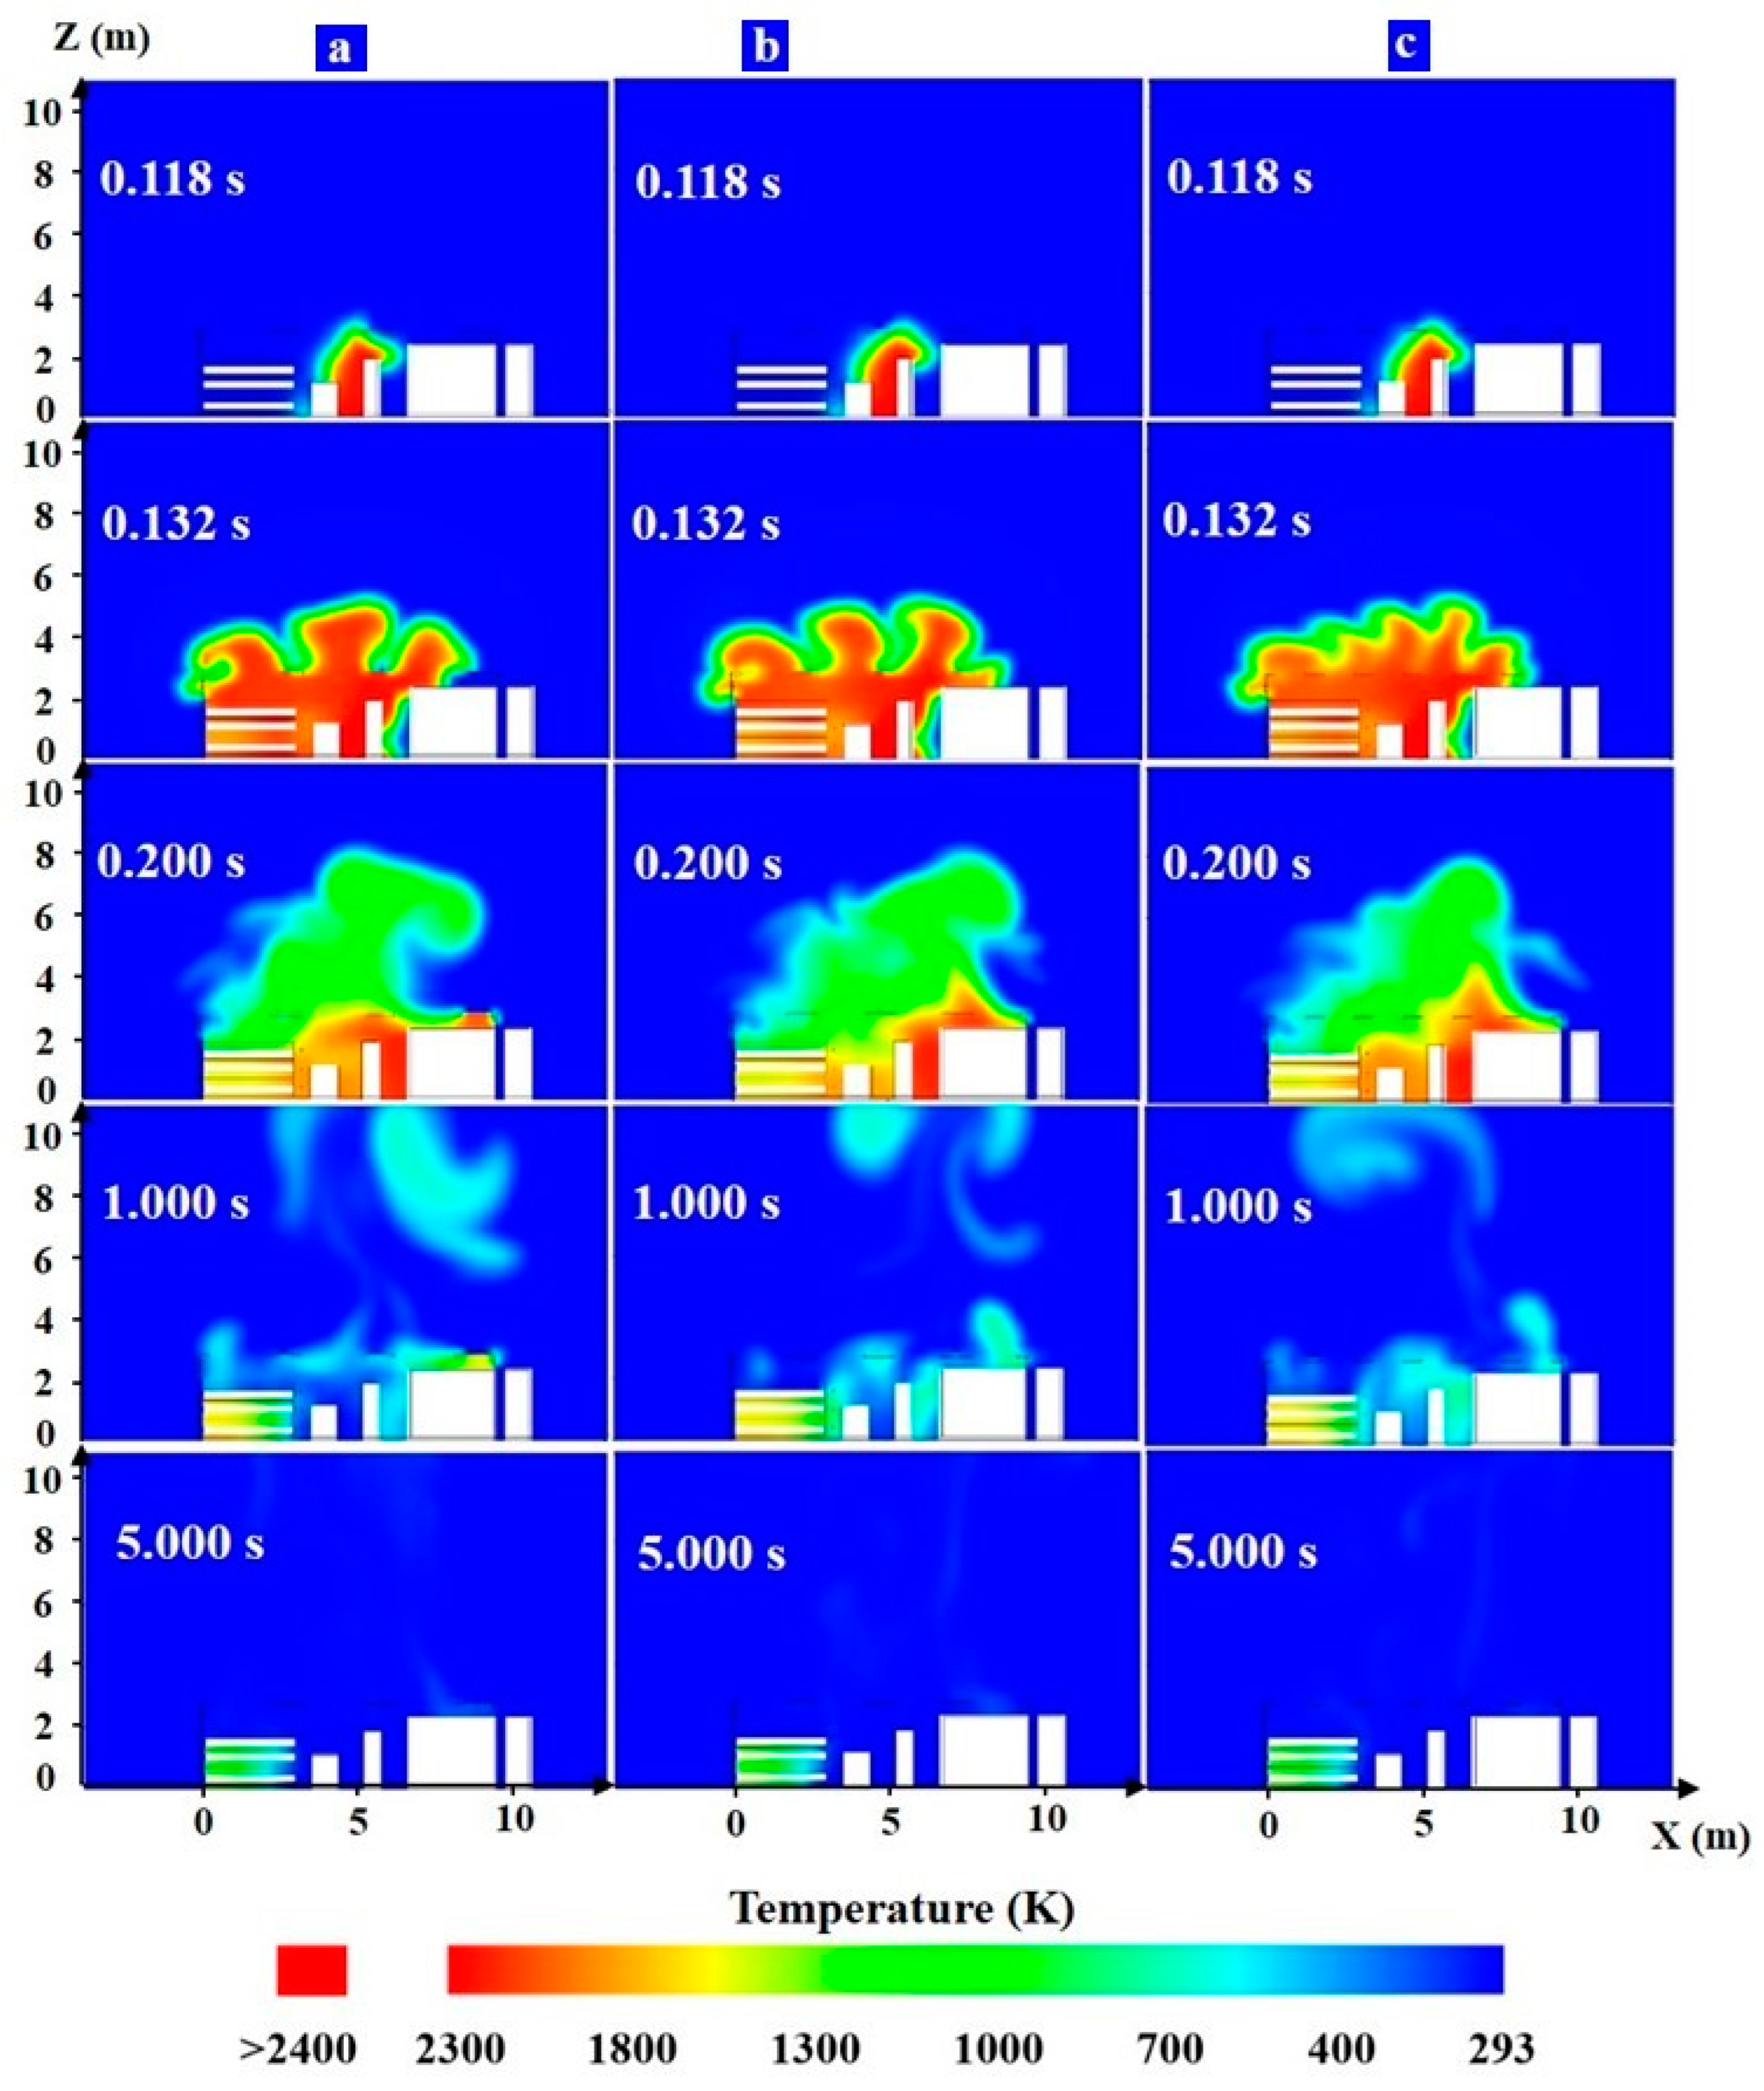
The calculated temperatures for various explosion vent layouts are shown in Figure 6. Premixed hydrogen flammable clouds ignited at the back of the PLC control cabinet and the flame spread from the vicinity of the ignition area to the surrounding area. The hydrogen flame heights are similar, but the flame shapes are different after 0.132 s. The maximum flame heights of the 3 vent layouts were about 8 m after the hydrogen flame burning 0.2 s. The temperature inside the container decreases with the development of the flame. The hydrogen flammable clouds easily accumulate in the gap of the hydrogen storage tank, thus there is still a high-temperature flame burning in the storage tank area after 5 s of ignition.
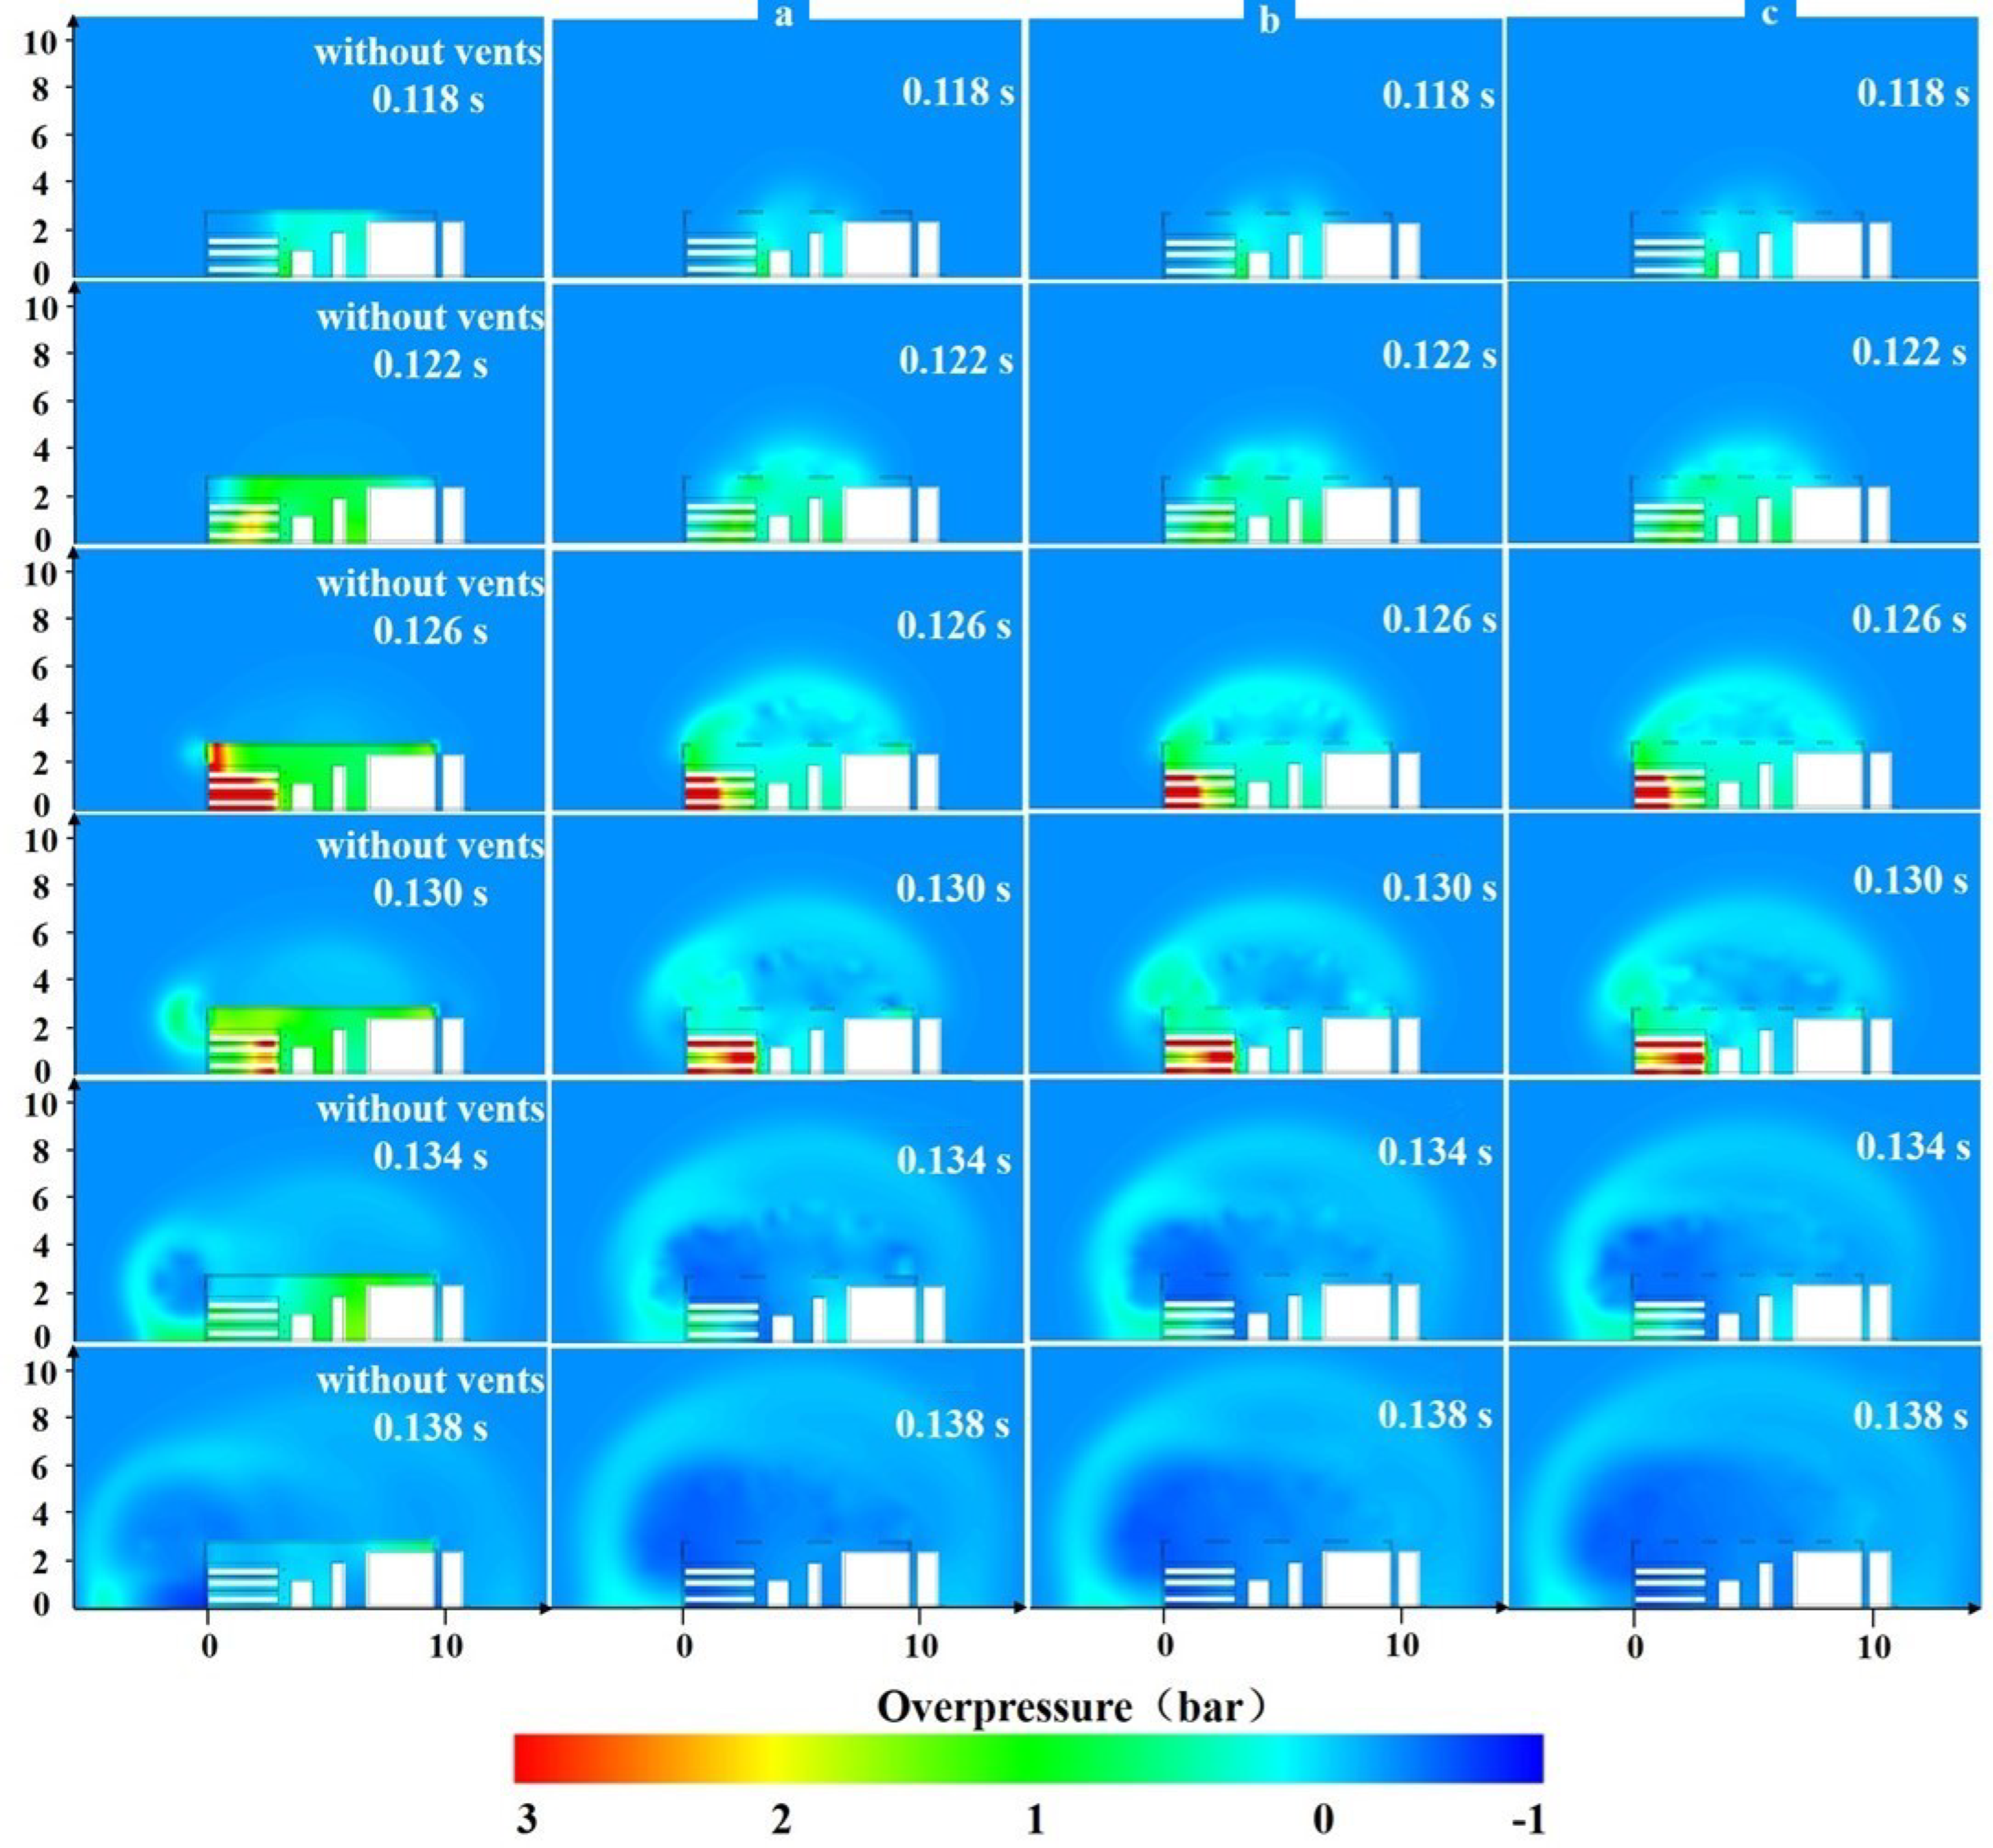
The calculated overpressures for various explosion vent layouts are shown in Figure 7. The premixed hydrogen flammable cloud ignited, and the pressure wave propagated from the middle of the container in all directions. The pressure wave developed outside the tank through the explosion vents after 0.018 s. The overpressure increased when the shock wave developed to the hydrogen storage tank area, and the maximum overpressure was about 9.28 bar, which could lead to the destruction of steel structures, the dislodging of hydrogen storage tanks, and the damage of tank valves. Therefore, hydrogen storage tanks should be placed separately outside the container of SHRS. The maximum overpressure in the container was 11.89 bar when there were no explosion vents in the SHRS. Explosion vents can effectively reduce the overpressure, compared with the container without the explosion vents. The effects of different vent layouts on the explosion overpressure distributions are minor.
The evolution of the hydrogen overpressures for various explosion vent layouts inside the container is shown in Figure 8a. The maximum overpressure inside the container without the explosion vents was 1.78 bar, which would cause severe damage to people and equipment inside the container. The explosion venting reduced the maximum overpressure inside the container by 61.83%, but the people and equipment inside the container would suffer serious overpressure injuries. The evolution of the hydrogen overpressures for various explosion vent layouts outside the container is shown in Figure 8b. The maximum pressure outside the container without the explosion vents was 0.91 bar, which would cause serious injuries to the nearby people and facilities. The explosion venting reduced the maximum overpressure outside the container by 29.07%, but the people and facilities outside the container would still suffer serious overpressure injuries. The overpressure curve of the three different vent layouts approximately overlaps; hence, the explosion vent layouts do not affect the explosion venting effects.

4. Effects of Protective Walls

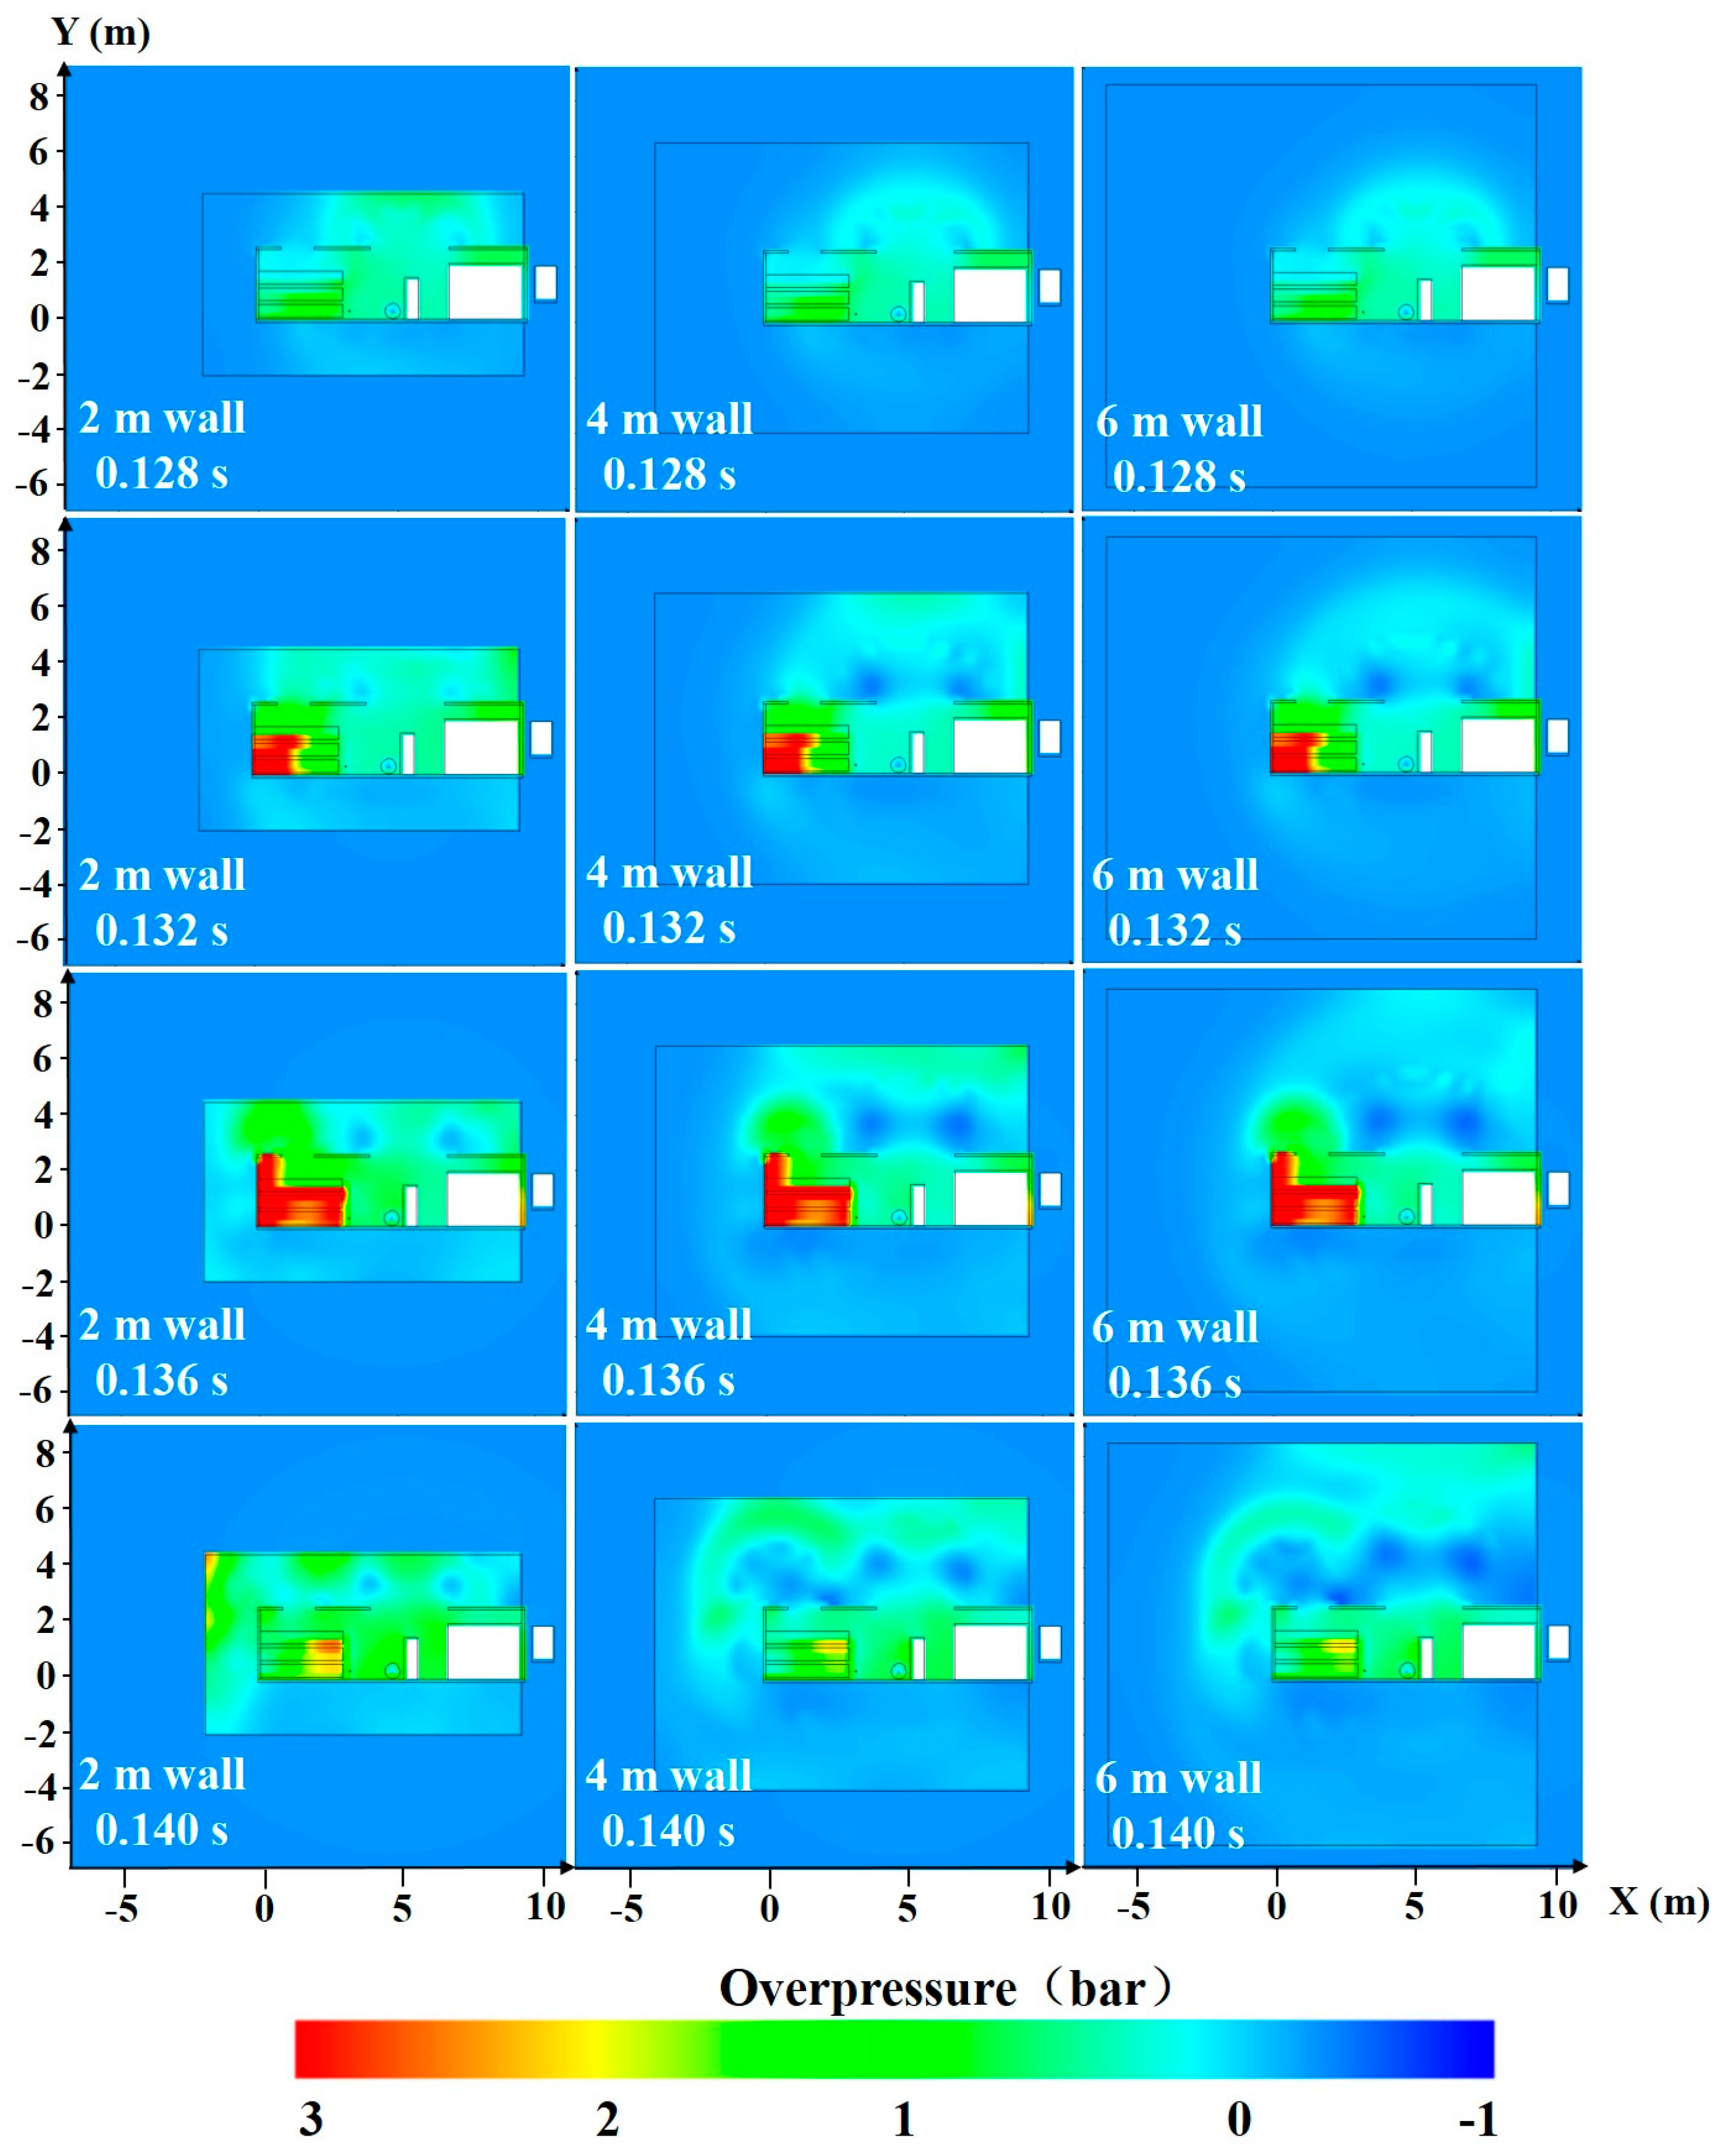
The calculated overpressures at 1.4 m height for various protective wall distances are shown in Figure 9. When the combustible hydrogen cloud ignited after 0.028 s, the explosion generated a shock wave that reached the location of the protective wall at a distance of 2 m, and the pressure near the protective wall increased to 1 bar. The overpressure in the corner of the 2 m protective wall was 2.6 bar after 0.04 s of ignition, and there was still about 1 bar of overpressure near the ignition source in the container, which could cause serious injuries to the people and equipment. The front and side protective walls of SHRSs are more damaged by explosion overpressure. The protective walls can significantly limit the range of overpressure damage from the explosion.
The overpressures at monitoring points inside and outside the protective walls at different distances in front of the SHRS are shown in Figure 10. The maximum overpressures were 0.86 bar inside the wall and 0.04 bar outside the wall when the distance of the protective wall was 2 m. Setting a protective wall at a distance of 2 m could reduce the maximum overpressure in front of the container by 94.9%, as shown in Figure 10a. The maximum overpressures were 0.85 bar inside the wall and 0.04 bar outside the wall when the distance of the protective wall was 4 m. Setting a protective wall at a distance of 4 m could reduce the maximum overpressure in front of the container by 95.9%, as shown in Figure 10b. The reflected secondary peak overpressure was 0.97 bar when the distance of the protective wall was 2 m and 0.80 bar when the distance of the protective wall was 4 m; therefore, the 2 m and 4 m protective walls are too close to the container, and the secondary peak overpressure could cause serious injuries to the container. The maximum overpressures were 0.78 bar inside the wall without the secondary peak overpressure and 0.05 bar outside the wall when the distance of the protective wall was 6 m. Setting a protective wall at a distance of 6 m could reduce the maximum overpressure in front of the container by 94.9%, as shown in Figure 10c. Therefore, the protective walls can reduce the overpressure damage in front of the SHRS to a safe range, and the separation distance of 6m in front of the container is more appropriate.
The overpressures at monitoring points inside and outside the protective walls at different distances on the side of the SHRS are shown in Figure 11. The maximum overpressures were 0.82 bar inside the wall and 0.05 bar outside the wall when the distance of the protective wall was 2 m. Setting a protective wall at a distance of 2 m could reduce the maximum overpressure on the side of the container by 93.4%, as shown in Figure 11a. However, the 2 m protective walls were too close to the container, thus the peak overpressure could cause serious injuries to the people and equipment inside the protective walls. The maximum overpressures were 0.37 bar inside the wall and 0.06 bar outside the wall when the distance of the protective wall was 4 m. Setting a protective wall at a distance of 4 m could reduce the maximum overpressure on the side of the container by 84.7%, as shown in Figure 11b. The maximum overpressures were 0.30 bar inside the wall and 0.05 bar outside the wall when the distance of the protective wall was 6 m. Setting a protective wall at a distance of 6 m could reduce the maximum overpressure on the side of the container by 81.4%, as shown in Figure 11c. The protective walls can reduce the overpressure damage outside the wall to a safe range.
The overpressures at monitoring points inside and outside the protective wall at different distances at the back of the SHRS are shown in Figure 12. The maximum overpressures were 0.21 bar inside the wall and 0.06 bar outside the wall when the distance of the protective wall was 2 m. Setting a protective wall at a distance of 2 m could reduce the maximum overpressure at the back of the container by 73.6%, as shown in Figure 12a. The maximum overpressures were 0.17 bar inside the wall and 0.04 bar outside the wall when the distance of the protective wall was 4 m. Setting a protective wall at a distance of 4 m could reduce the maximum overpressure at the back of the container by 76.2%, as shown in Figure 12b. The secondary overpressure was within the acceptable range for the 2 m and 4 m protective walls. The maximum overpressure inside the wall is 0.15 bar and outside the wall is 0.03 bar when the distance of the protective wall is 6 m. Setting a protective wall at a distance of 6 m could reduce the maximum overpressure at the back of the container by 80.3%, as shown in Figure 12c. Therefore, the protective walls can reduce the overpressure damage outside the wall to a safe range.

5. Conclusions

In the present work, hydrogen explosions were modeled for hydrogen-air mixtures in a skid-mounted hydrogen refueling station. The vented explosion experimental data were used to verify the accuracy of the calculation results. The protective effects of explosion vents and protective walls were evaluated for various explosion vent layouts and protective wall distances.
Three different explosion vent layouts were compared to the case without explosion vents, and the protective effect for the inside and outside of the container was analyzed. The results show that the explosion vents have a consistent protective effect with the same vent area, which can reduce the inside maximum overpressure by 61.8% and reduce the outside maximum overpressure by 29.1%.
Three different protective wall distances (2 m, 4 m, and 6 m away from the skid-mounted hydrogen refueling station) were investigated for the protective effects. The protective walls can reduce the overpressure outside the skid-mounted hydrogen refueling stations to protect nearby personnel and equipment. However, the protective walls should not be too close to the SHRS because high overpressures are generated inside the walls due to the confined shock waves. The protective wall with a distance of 6 m can effectively protect the surrounding people and avoid the secondary overpressure injury of the container.

Author Contributions

Conceptualization, X.L.; methodology, M.L. and G.X.; validation, M.L.; formal analysis, Z.Z. and Q.B.; data curation, Z.Z. and Q.B.; writing-original draft preparation, Z.Z.; writing-review and editing, G.X., T.C. and X.L.; funding acquisition, M.L., G.X., T.C. and X.L. All authors have read and agreed to the published version of the manuscript.

Funding

This study was funded by the National Natural Science Foundation of China [No. 52176191]; the Technology Project of State Grid Zhejiang Electric Power Company, LTD. “Research on risk identification and safety protection technology of electric-hydrogen coupling system” [No. B311DS221001]; the Strategic Priority Research Program of the Chinese Academy of Sciences “Transformational technologies for clean energy and demonstration” [No. XDA21000000]; the National Natural Science Foundation of China [No. 22209200]; and the Shanghai Sailing Program [No. 22YF1457700].

Conflicts of Interest

The authors declare no conflict of interest.

References

  1. Rabbi, M.F.; Popp, J.; Máté, D.; Kovács, S. Energy Security and Energy Transition to Achieve Carbon Neutrality. Energies 2022, 15, 8126. [Google Scholar] [CrossRef]
  2. Salimi, M.; Hosseinpour, M.; Borhani, T. The Role of Clean Hydrogen Value Chain in a Successful Energy Transition of Japan. Energies 2022, 15, 6064. [Google Scholar] [CrossRef]
  3. Barbir, F. Transition to renewable energy systems with hydrogen as an energy carrier. Energy 2009, 34, 308–312. [Google Scholar] [CrossRef]
  4. Najjar, Y.S.H. Hydrogen safety: The road toward green technology. Int. J. Hydrogen Energy 2013, 38, 10716–10728. [Google Scholar] [CrossRef]
  5. Fang, D.; Yu, T.; Xie, Q. Discussion about the planning development mode of hydrogen fuelling stations in urban areas of China. Energy Conserv. 2019, 2, 122–123. [Google Scholar] [CrossRef]
  6. Li, X.; Xu, J.; Zhou, Y. Technical scheme of skid mounted hydrogen refueling unit. Nat. Gas Chem. Ind. 2019, 44, 61–64. [Google Scholar]
  7. Crowl, D.A.; Jo, Y. The hazards and risks of hydrogen. J. Loss Prevent. Process Ind. 2021, 21, 162–184. [Google Scholar] [CrossRef]
  8. Jeon, J.; Kim, S.J. Recent Progress in Hydrogen Flammability Prediction for the Safe Energy Systems. Energies 2020, 13, 6263. [Google Scholar] [CrossRef]
  9. White, C.M.; Steeper, R.R.; Lutz, A.E. The hydrogen-fueled internal combustion engine: A technical review. Int. J. Hydrogen Energy 2006, 31, 1292–1305. [Google Scholar] [CrossRef]
  10. Lewis, B.; Elbe, G. Combustion, Flames and Explosions of Gases; Academic Press: Orlando, FL, USA, 1987. [Google Scholar] [CrossRef]
  11. Yang, J.X.; Li, X.J. Design of skid-mounted LCNG fueling station for vehicle. Appl. Mech. Mater. 2013, 273, 3–7. [Google Scholar] [CrossRef]
  12. Sun, K.; Pan, X.; Li, Z.; Ma, J. Risk analysis on mobile hydrogen refueling stations in Shanghai. Int. J. Hydrogen Energy 2014, 39, 20411–20419. [Google Scholar] [CrossRef]
  13. Herrmann, D.D. Developing a sound basis for the design of vented explosion barricades in chemical processes. Chem. Eng. Process 2005, 24, 52–58. [Google Scholar] [CrossRef]
  14. Tomlin, G.; Johnson, D.M.; Cronin, P.; Phylaktou, H.N.; Andrews, G.E. The effect of vent size and congestion in large-scale vented natural gas/air explosions. J. Loss Prevent. Process Ind. 2015, 35, 169–181. [Google Scholar] [CrossRef]
  15. Zhang, S.; Zhang, Q. Effect of vent size on vented hydrogen-air explosion. Int. J. Hydrogen Energy 2018, 43, 17788–17799. [Google Scholar] [CrossRef]
  16. Li, Y.; Bi, M.; Zhou, Y.; Jiang, H.; Huang, L.; Zhang, K.; Gao, W. Experimental and theoretical evaluation of hydrogen cloud explosion with built-in obstacles. Int. J. Hydrogen Energy 2020, 46, 28007–28018. [Google Scholar] [CrossRef]
  17. Luo, X.; Wang, C.; Rui, S.; Wan, Y.; Li, Q. Effects of ignition location, obstacles, and vent location on the vented hydrogen-air deflagrations with low vent burst pressure in a 20-foot container. Fuel 2020, 280, 118677. [Google Scholar] [CrossRef]
  18. Zhang, Y.; Jiao, F.; Huang, Q.; Cao, W.; Shi, L.; Zhao, M.; Yu, C.; Nie, B.; Cao, X. Experimental and numerical studies on the closed and vented explosion behaviors of premixed methane-hydrogen/air mixtures. Appl. Therm. Eng. 2019, 159, 113907. [Google Scholar] [CrossRef]
  19. Rocourt, X.; Awamat, S.; Sochet, I.; Jallais, S. Vented hydrogen-air deflagration in a small enclosed volume. Int. J. Hydrogen Energy 2014, 39, 20462–20466. [Google Scholar] [CrossRef]
  20. Wang, J.; Jin, G.; Yang, F.; Zhang, J.; Lu, S. Effects of hydrogen concentration on the vented deflagration of hydrogen-air mixtures in a 1-m3 vessel. Int. J. Hydrogen Energy 2018, 43, 21161–21168. [Google Scholar] [CrossRef]
  21. Tchouvelev, A.V.; Zhong, C.; Agranat, V.M.; Zhubrin, S.V. Effectiveness of small barriers as means to reduce clearance distances. Int. J. Hydrogen Energy 2007, 32, 1409–1415. [Google Scholar] [CrossRef]
  22. Evans, G.; Groethe, M.; Schefer, R.W.; Houf, W.G. Experimental evaluation of barrier walls for risk reduction of unintended hydrogen releases. Int. J. Hydrogen Energy 2009, 34, 1590–1606. [Google Scholar] [CrossRef]
  23. Schefer, R.W.; Mcrilo, E.G.; Groethe, M.A.; Houl, W.G. Experimental investigation of hydrogen jet fire mitigation by barrier walls. Int. J. Hydrogen Energy 2011, 36, 2530–2537. [Google Scholar] [CrossRef]
  24. Li, J.; Ma, G.; Hao, H.; Huang, Y. Optimal blast wall layout design to mitigate gas dispersion and explosion on a cylindrical FLNG platform. J. Loss Prevent. Process Ind. 2017, 49, 481–492. [Google Scholar] [CrossRef] [Green Version]
  25. Kang, H.S.; Kim, S.M.; Kim, J. Safety issues of a hydrogen refueling station and a prediction for an overpressure reduction by a barrier using OpenFOAM software for an SRI explosion test in an open space. Energies 2022, 15, 7556. [Google Scholar] [CrossRef]
  26. Yu, X.; Yan, W.; Liu, Y.; Zhou, P.; Li, B.; Wang, C. The flame mitigation effect of vertical barrier wall in hydrogen refueling stations. Fuel 2022, 315, 123265. [Google Scholar] [CrossRef]
  27. Salimath, P.S.; Ertesvåg, I.S.; Gruber, A. Computational analysis of premixed methane-air flame interacting with a solid wall or a hydrogen porous wall. Fuel 2020, 272, 117658–117673. [Google Scholar] [CrossRef]
  28. Chiquito, M.; Castedo, R.; Santos, A.P.; López, L.M.; Caldentey, A.P. Numerical modelling and experimental validation of the behaviour of brick masonry walls subjected to blast loading. Int. J. Impact Eng. 2021, 148, 103760–103774. [Google Scholar] [CrossRef]
  29. Sun, Z. Cracking Elements Method for Simulating Complex Crack Growth. J. Appl. Comput. Mech. 2019, 5, 552–562. [Google Scholar] [CrossRef]
  30. Yenerdag, B.; Minamoto, Y.; Aoki, K.; Shimura, M.; Nada, Y.; Tanahashi, M. Flame-wall interactions of lean premixed flames under elevated, rising pressure conditions. Fuel 2017, 189, 8–14. [Google Scholar] [CrossRef] [Green Version]
  31. Lucas, M.; Atanga, G.; Hisken, H.; Mauri, L.; Skjold, T. Simulating vented hydrogen deflagrations: Improved modelling in the CFD tool FLACS-hydrogen. Int. J. Hydrogen Energy 2021, 46, 12464–12473. [Google Scholar] [CrossRef]
  32. Vyazmina, E.; Jallais, S. Validation and recommendations for FLACS CFD and engineering approaches to model hydrogen vented explosions: Effects of concentration, obstruction vent area and ignition position. Int. J. Hydrogen Energy 2016, 41, 15101–15109. [Google Scholar] [CrossRef]
  33. Pedersen, H.H.; Middha, P. Modelling of vented gas explosions in the CFD tool FLACS. Chem. Eng. Trans. 2012, 26, 357–362. [Google Scholar] [CrossRef]
  34. Patankar, S.V. Numerical Heat Transfer and Fluid Flow; Taylor & Francis: Abingdon, UK, 1980. [Google Scholar] [CrossRef]
  35. FLACS v9.0 User’s Manual, Norway. 2009. Available online: https://www3.gexcon.com/files/manual/flacs/html/index.html (accessed on 9 November 2022).
  36. Bauwens, C.R.; Chaffee, J.; Dorofeev, S.B. Vented explosion overpressures from combustion of hydrogen and hydrocarbon mixtures. Int. J. Hydrogen Energy 2011, 36, 2329–2336. [Google Scholar] [CrossRef]
  37. Huang, T.; Wang, Y.; Xiao, G.; Zhao, M.; Ba, Q.; Zhao, Z.; Li, X. Protective wall settings for a skid-mounted electrolytic hydrogen production system. SAE Int. J. Sustrans. Energy Envir. Policy 2022, 3, 1–11. [Google Scholar] [CrossRef]
  38. Fu, Z.; Huang, J.; Zang, N. Quantitative analysis for consequence of explosion shock wave. Fire Sci. Technol. 2009, 28, 390–395. [Google Scholar]
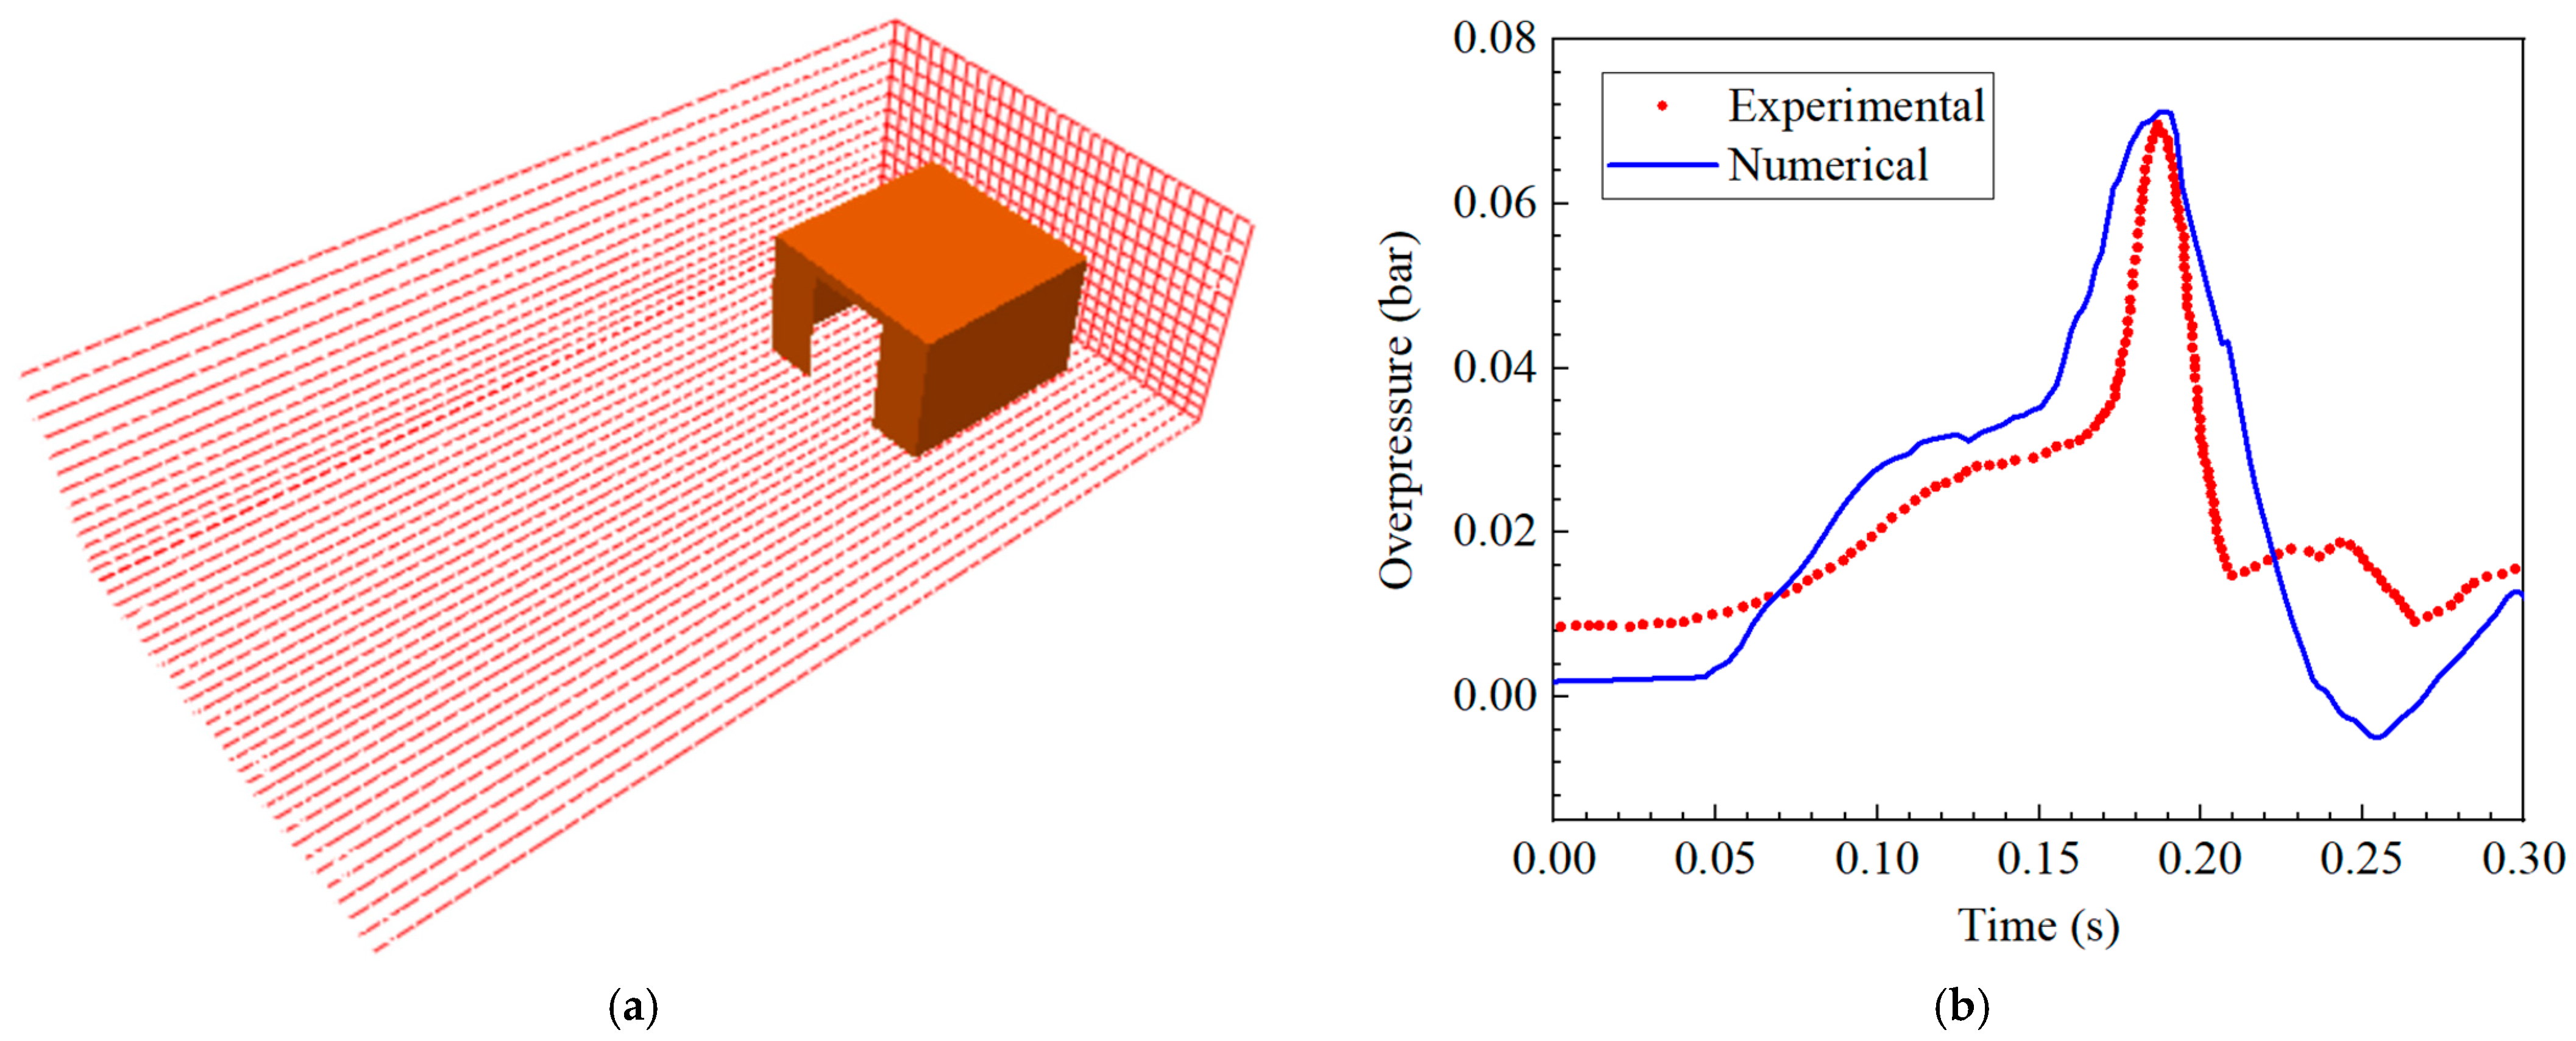
Figure 1. (a) Grid for validation, (b) comparison of calculated and measured overpressures of the explosion in a chamber.
Energies 16 00910 g001
Figure 2. Geometry and explosion vent layouts (ac) of the skid-mounted hydrogen refueling station.
Energies 16 00910 g002
Figure 3. The ignition region and hydrogen-air premixed region.
Energies 16 00910 g003
Figure 4. Protective wall models.
Energies 16 00910 g004
Figure 5. Monitoring point locations.
Energies 16 00910 g005
Figure 6. Temperatures at various times for various explosion vent layouts (ac).
Energies 16 00910 g006
Figure 7. Overpressures at various times for various explosion vent layouts (ac).
Energies 16 00910 g007
Figure 8. Evolution of the hydrogen overpressures for various explosion vent layouts. (background colors: red-death risk region, orange-serious injury region, yellow-moderate injury region, and blue-slight injury region).
Energies 16 00910 g008
Figure 9. Overpressures at various times for various protective wall distances.
Energies 16 00910 g009
Figure 10. Evolution of the hydrogen overpressures in front of the SHRS for various protective wall distances.
Energies 16 00910 g010
Figure 11. Evolution of the hydrogen overpressures on the side of the SHRS for various protective wall distances.
Energies 16 00910 g011
Figure 12. Evolution of the hydrogen overpressures at the back of the SHRS for various protective wall distances.
Energies 16 00910 g012
Table 1. Properties of hydrogen, methane, and gasoline [9,10].
PropertiesHydrogenMethaneGasoline
Gas Density (kg/m3)0.08080.6431.767
Diffusion Coefficient (cm2/s)0.610.160.05
Lower Flammability Limit (Volume %)45.32.2
Upper Flammability Limit (Volume %)75159.5
Flame Radiation Fraction (%)17~2523~3330~42
Minimum Ignition Energy (mJ)0.020.290.24
Auto-ignition Temperature (K)858813505
Burning Velocity (cm/s)265~32537~4537~43
Stoichiometric Concentration (Volume %)29.539.481.76
Table 2. Overpressure damages to buildings and humans (Reprinted with permission from Ref. [38]).
Overpressure (bar)Damage to BuildingsHuman Injury
0.20~0.30Partial damageSlight injury
0.30~0.50Significant damageModerate injury, such as hearing injuries and bone fractures
0.50~1.00Serious damage or destructionSerious injury to human viscera
>1.00Residential structures collapseMost people die
Disclaimer/Publisher’s Note: The statements, opinions and data contained in all publications are solely those of the individual author(s) and contributor(s) and not of MDPI and/or the editor(s). MDPI and/or the editor(s) disclaim responsibility for any injury to people or property resulting from any ideas, methods, instructions or products referred to in the content.