Abstract
Investigation of power output from PV arrays under different fault conditions is an essential task to enhance performance of a photovoltaic system under all operating conditions. Significant reduction in power output can occur during various PV faults such as module disconnection, bypass diode failure, bridge fault, and short circuit fault under non-uniform shading conditions. These PV faults may cause several peaks in the characteristics curve of PV arrays, which can lead to failure of the MPPT control strategy. In fact, impact of a fault can differ depending on the type of PV array, and it can make the control of the system more complex. Therefore, consideration of suitable PV arrays with an effective control design is necessary for maximum power output from a PV system. For this purpose, the proposed study presents a comparative study of two intelligent control schemes, i.e., fuzzy logic (FL) and particle swarm optimization (PSO), with a conventional control scheme known as perturb and observe (P&O) for power extraction from a PV system. The comparative analysis is based on the performance of the control strategies under several faults and the types of PV modules, i.e., monocrystalline and thin-film PV arrays. In this study, numerical analysis for complex fault scenarios like multiple faults under partial shading have also been performed. Different from the previous literature, this study will reveal the performance of FL-, PSO-, and P&O-based MPPT strategies to track maximum peak power during multiple severe fault conditions while considering the accuracy and fast-tracking efficiencies of the control techniques. A thorough analysis along with in-depth quantitative data are presented, confirming the superiority of intelligent control techniques under multiple faults and different PV types.
1. Introduction
Momentous increase in the penetration of PV systems has been apparent over the past few years despite their vulnerability to unexpected faults and low energy conversion efficiency [1]. An effective technique for enhancing the energy conversion efficiency of a PV system is generally based on an MPPT scheme. However, the effectiveness of any MPPT strategy can be substantially compromised during the occurrence of various PV faults, including wiring losses, hot spot, defects of bypass diodes, and module mismatch faults. The aforementioned PV faults can produce numerous peaks in the PV characteristics curve leading to the degradation of MPPT techniques.
Several studies have been proposed for extracting optimal power from PV systems during faults. In [2], a detailed literature survey has been conducted on control approaches and synchronization procedures for abnormal and normal conditions of DG systems. Different power control methods are also discussed for eliminating fluctuations in current, power, and voltage signals such as hysteresis control, PI control, dead beat control, and fractional order controllers. Moreover, in [3], conventional PI controllers based on synchronous reference frame (SRF) and stationary reference frame (STRF) for unbalanced grid fault conditions have been compared. These studies have deeply discussed the overcoming of power quality issues for grid-tied PV systems. Considering various PV arrays with suitable control is also an important discussion for the extraction of maximum peak power from PV systems.
Several MPPT schemes have been proposed in the literature for maximum power extraction, such as perturb and observe (P&O), hill climbing, incremental inductance (IC), and incremental resistance (IR). The most commonly used MPPT scheme is P&O due to its simplicity. However, the P&O algorithm may not be able to achieve fast and accurate tracking under changing operating conditions due to its fixed step size. Many MPPT algorithms with variable step sizes have been studied in the literature, showing that they alleviate the problem of fixed step size, but most of those algorithms require solar panel data, which are dependent on real-time operating conditions [4]. Recently, a few smart MPPT schemes like genetic algorithms, a neural network (NN) approach, the particle swarm optimization (PSO) algorithm, the cuckoo search algorithm, and the fuzzy logic (FL) scheme have been introduced to tackle the problems associated with both fixed and variable step size of MPPT [5,6,7,8,9,10].
In [11], the authors implemented a genetic algorithm-based MPPT module; however, for this strategy, an accurate and large input data set is required, which makes the algorithm more complex and difficult to implement. To overcome this, studies have been focusing on fuzzy logic schemes due to their ability to handle imprecise data and control non-linear systems. Fuzzy logic schemes can easily mitigate the problems associated with conventional MPPT schemes like P&O and integral MPPT schemes without using complex and large data sets. They can also cover a wide range of operating conditions, which increases their effectiveness under various fault conditions. Effectiveness of fuzzy logic-based schemes in the detection of intricate faults like short circuit fault in PV array under shading have been proved in [12] through applying a fuzzy inference system. Authors in [13,14,15,16,17] proposed FL systems that achieve high and accurate power peaks without using large and complex data sets, unlike machine learning techniques. In [13], comparison of P&O with fuzzy logic control (FLC) has been proposed for different irradiance conditions. However, different PV materials and complex faults conditions were not considered. The authors in [14] proposed a comparative study of P&O with an FLC scheme for a single PV module for a boost converter. An MPPT strategy based on both P&O and FL is proposed in [15]; however, the performance is only tested for rapidly changing irradiances, while faults and type of the PV module are ignored. Authors in [16] presented a fuzzy controller for evaluation of the system’s performance under changing irradiance condition. Moreover, the authors in [17] presented an MPPT scheme for type-2 FLC systems that uses an interval type-2 FLC scheme to attain optimization under noise and uncertainty. A modified fuzzy logic MPPT scheme was introduced in [18] with enhanced accuracy, which uses convergent distribution type membership functions (MFs) instead of symmetrical MFs. However, lack of adaptivity for different operating points is the major drawback of this strategy. A modified sine–cosine FL integrated method with sliding mode control is proposed in [19]. Nevertheless, lack of dynamic adjustment of MF boundaries and types makes the controller unsuitable for the changing operating conditions. In [20], a fractional order combined with FL has been considered for enhancing the tracking efficiency of the control scheme; however, high complexity in the design of the controller and computation of the alpha factor are the major limitations.
In [21], hybrid MPPT strategies are introduced in the literature where FL is combined with P&O to achieve more adaptability at the operating point. However, this algorithm experiences slow convergence under the varying real-time conditions.
In a different context, the sudden occurrence of faults under the changing conditions and efficiency of PV technology can severely impact the MPPT strategy and overall performance of a PV system. Different PV technologies such as monocrystalline, polycrystalline, and thin film have different behaviors under partial shading, which can impact the maximum power extraction strategy [22,23].
Previous studies have shown that crystalline technology exhibits less shade tolerance than thin film technology due to the former’s lower efficiency. For this purpose, further in-depth research is needed to understand the influence of faults on different PV technologies for maximum extraction of power under different PV fault conditions. A detailed review of the literature with identification of research gaps is given in Table 1.

Table 1.
Overview of existing literature with research gaps.
Owing to the above-mentioned gap, this research presents an evaluation of intelligent control schemes for five different fault conditions, such as partial shading, bypass diode failure, bridge fault under shading, and multiple fault scenarios with consideration of different PV array technologies. The thin film (TF) technology has shown promising performance under shading scenarios; however, it is not an extensively used technology in comparison to crystalline PV materials. Thus, it is worthwhile to consider the impact of multiple faults in a PV array with PSO and FLC schemes on TF material. It is found that both FL and PSO schemes with TF technology are advantageous in increasing the power output under PV fault conditions.
The main contributions of the proposed study can be listed as:
- Maximization of a PV power system is achieved by developing FLC and PSO schemes in numerous fault scenarios. A comparison of PSO and FL schemes with the P&O scheme is performed on both a thin film and a crystalline PV array under a variety of faulty conditions, which is not reported in the literature [13,14,15]. Comparative analysis of a conventional control scheme with the FLC strategy on changing irradiance conditions is performed in the referenced works [16,17] without consideration of different PV arrays like CIGS thin film and crystalline PV arrays.
- Performance of the presented FLC scheme is also analyzed under a special case of multiple faults known as a day-to-night transition fault, in which the combined effect of the faults is examined. This special fault is also analyzed as a combined fault in this research study. Various authors [18,19,20,21,22,23,24] have designed control schemes for tracking global power peaks under shading conditions, but the introduction of multiple faults under shading makes the tracking more difficult and challenging. For the proposed study, the fuzzy logic-based MPPT and PSO schemes are designed for the analysis of multiple faults under shading conditions, which is an addition to the new aspect of the presented research work.
- Importantly, the influence of all the considered faults on current (I) and power (P) with consideration of TF and crystalline PV technology is finely inspected in this study, which is not explained comprehensively in previous work [25,26,27,28,29,30,31,32,33,34,35,36,37,38,39]. The proposed FLC scheme is suitable for handling imprecise data and control of non-linear systems under fault occurrences. The occurrence of multiple faults under shading can severely impact the performance of the conventional controllers, but FLC can extract maximum power under severe multiple fault conditions, which is also performed as a significant part of the contributions of this paper.
- In this study, the challenging task of defining 49 fuzzy rules for IMFs and OMFs is performed for designing the FLC scheme to accurately track global peak power under various fault scenarios for thin film and crystalline PV arrays, which is an addition to the contributions of this paper. The proposed FLC scheme offers an optimized performance of the PV system in terms of accuracy.
In this paper, extraction of maximum power from the PV arrays through the implementation of intelligent FL- and PSO-based control schemes lead towards the improvement in efficiency, accurate control, and fault tolerance of PV systems, which is the main driving force for conducting the presented research work.
The paper is structured in a number of sections and sub-sections: Section 1 is the introduction, and the proposed system model is given in Section 2. In Section 3, different PV fault scenarios are detailed. The developed PSO- and FL-based MPPT strategies are compared with the P&O control scheme in Section 4. The simulations and graphical results are illustrated in Section 5. Section 6 concludes the paper.
2. Proposed System Model
This study uses a grid-connected PV system with different control strategies for MPPT schemes as illustrated in Figure 1a. In this figure, the PV model used is of 75 PV arrays further connected to the PCC of the power grid through an inverter and DC–DC booster converter circuit. The two stage PV system uses a DC–DC boost converter to increase the voltage level of the PV array in order to standardize it for grid connection. Typically, for the grid connection, the inverter input voltage should be higher than the inverter output voltage in order to avoid instability issues due to reverse power flow. Moreover, for testing purposes, various faults are introduced in the PV array that practically impact the power output of the PV system. The output parameters such as current and voltage from PV arrays are fed into the MPPT scheme for estimating the duty cycle, D. Here, the MPPT scheme shows the FL control scheme for the sake of clarity in the test model specifics. In Stage I of the FL-based scheme, error (E) and change in error (CE) are computed by estimating current, voltage, and power, which are then used for defining fuzzy rules. The IF–THEN fuzzy rules are used for defining IMFs and OMFs in Stage II. The membership functions are defined such that they accurately yield the estimated duty cycle through mapping of MFs.
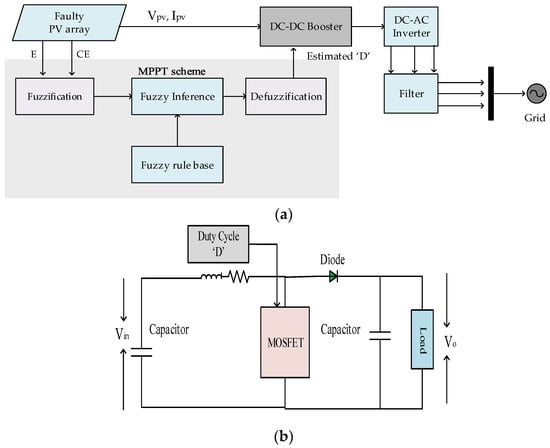
Figure 1.
MPPT schemes: (a): Block diagram of PV system with FL-based MPPT. (b): Flow diagram of the proposed MPPT scheme.
The fuzzy rules-based MPPT is compared with an intelligent control technique, i.e., PSO MPPT, which randomly initializes the velocity and position of particles for computing power output, as shown in Figure 2. A comparative analysis of intelligent control schemes and the conventional P&O algorithm is performed in this study to investigate the impact of all the studied faults on current (Ipv), voltage (Vpv), frequency (f), and power (Ppv). Significant improvement in results is achieved by applying FL and PSO schemes in both thin film and monocrystalline PV arrays. The inverter converts the values from DC to AC, and afterward the power is distributed to the power grid via a filter after the transformation stage. The proposed MPPT scheme and operation of the boost converter is the most crucial stage in the extraction of maximum power from the considered PV system. The operation of the boost converter is explained thoroughly in the next sub-section.
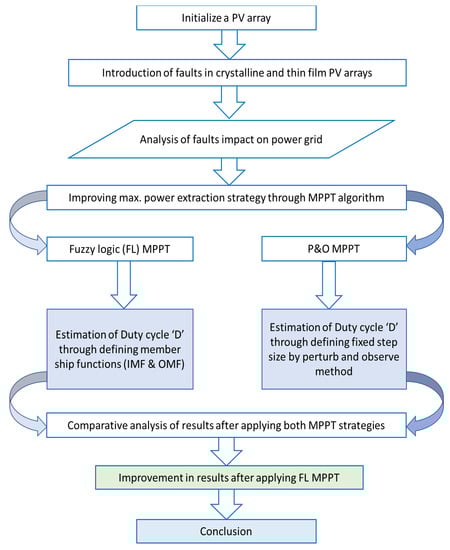
Figure 2.
Flow diagram of the proposed MPPT scheme.
2.1. Operation of Boost Converter
The DC–DC boost converter is essential for incrementing the level of voltage after receiving the control pulses (D) through the MPPT module. The output is controlled by the duty cycle of the switch. The transmitted control pulses received through the MPPT scheme control the DC–DC power converter to maximize the extracted power through switching of a high-speed switching transistor, i.e., MOSFET in this case. When the switch is ON, the current flow , i.e., the difference between peak current and output current, can be expressed as:
when the switch is OFF, the current is expressed as:
where, can be found by solving the above equations such that:
here, the estimated Duty cycle can be found using:
here, the relation between input and output can be found by neglecting and as:
is the output voltage of the boost converter, and it is directly related to . The duty cycle can be estimated using:
where is the operating duty cycle of the converter and RL is the equivalent resistance for the boost converter load. The MPPT mode voltage and peak power are denoted by and , respectively. The MPPT strategy receives the values of and from the PV array to track peak operating power through alteration of duty cycle by varying the level of voltage [31]. It is important to mention that the occurrence of sudden faults under shading conditions can severely impact the performance of the MPPT scheme through decreased power from the PV array.
2.2. PV Array
Various types of PV arrays are analyzed for the proposed work, including p–n homo-junction (monocrystalline silicon) and p–n hetero-junction copper indium gallium selenide (CIGS/thin film). The homojunction cells adhere to the principle of superposition as light current is computed as the sum of its diode current and photocurrent. Heterojunction cells do not fulfill this law and may not follow the superposition law. Authors in [32,33] have taken different models, including CIGS solar arrays, for computation of temperature and irradiance dependent I–V parameters of a PV array. This cell contains a zinc oxide (ZnO) window layer and a cadmium sulphide (CdS) buffer layer, fixed on the upper layer of the CIGS absorber. For the efficiency of a solar module, two important parameters should be understood. One is the photocurrent density, which is the ratio of photocurrent produced by the photoelectrode to the area exposed to sunlight. Second is the light current density, which is the density when the excess carriers are generated when the PV material absorbs light due to the energy of the photon. If the energy of the photon is large enough, it will break the bond between the two atoms of the semiconductor and cause an electron hole to be formed. The photocurrent density and the light current density can be expressed as:
where represents the photocurrent density and represents the light current; is the ratio of diffusion to thermionic emission velocity, while is a temperature independent factor of voltage partition. The and are the pre-factors of shunt current, respectively, and γ pertains to the log shunt current. The value of represents voltage with the addition of a log shunt current. Jo depends on radiance and temperature. The built-in voltage of the p–n junction is nearly 0.7 V.
The output current of the PV array, which is affected due to the occurrence of faults, is expressed as [35]:
Here, is also called light-generated current of monocrystalline types of the PV array [35]. The value of n is nearly 1, while Tr represents the reference temperature. The coefficient of is stated as , and denotes an irradiance of 1000 W/m2. and indicate interconnected series and parallel cells, respectively, as found in Equation (11). The output current of the PV array can be affected due to the occurrence of sudden faults as expressed in the above-listed equations, which are presented for demonstrating the behavior of thin film and crystalline solar arrays under different types of fault scenarios. These computed parameters of both CIGS and crystalline solar arrays can help in understanding the fundamentals of non-linear parameters of different arrays in various environmental conditions that affect the applied strategy of MPPT.
3. Studied Faults
In this study, five different PV faults are introduced on monocrystalline and thin film PV arrays for finding the effectiveness of the adopted control strategies. The considered PV faults are illustrated in Figure 3. The investigated faults are given as [40,41]:
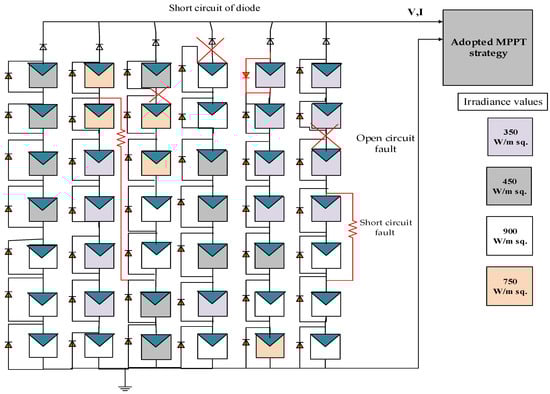
Figure 3.
Considered faults in a PV array.
Partial shading or non-uniform shading fault (F1): This fault is introduced by applying non-uniform irradiance level to the PV array. Different types of irradiance levels are applied to each interconnected PV module to analyze this fault case.
Bridge fault of PV array under shading (F2): Unintentional short circuit between two different solar arrays is developed for the analysis of this fault case.
Bypass diode defect under shading (F3): Failure of bypass diodes due to reverse interconnection and short-circuit of the diode is investigated with low irradiance in this fault case.
Open circuit fault (F4): Severe impact of module disconnection fault on the PV array with partial shading condition is analyzed in this scenario.
Combined fault (F5): The impact of all faults, including diode defects, open-circuit, bridge fault, and non-uniform shading, is investigated in this scenario. This is also a complex case of day-to-night fault.
4. Adopted Strategies for Maximum Power Extraction
This section proposes the strategies utilized for the operation of different PV technologies under multiple faults. Two different MPPT strategies, including PSO- and FL-based controls, are designed for tracking the maximum power point in this research study. The two intelligent control strategies are also compared with the conventional P&O MPPT scheme in terms of extraction of peak power under multiple fault scenarios and for changing environmental conditions. The conventional P&O algorithm is unable to track the accurate peak power under dynamic environments such as abrupt temperature and irradiance variation and during fault conditions. On the other hand, the PSO strategy tracks the power point by randomly initiating the position and velocity of particles. The PSO scheme is an optimization strategy that can accurately track the maximum power point for PV arrays. It is an efficient strategy for extracting peak power under dynamic environmental conditions. The FL-based control scheme uses fuzzy logic rules for controlling the duty cycle through defining membership functions. Furthermore, these techniques will be tested under multiple fault conditions and variable environment conditions. The aforementioned control techniques are further discussed in detail in the following sub-sections.
4.1. P&O MPPT
Different stages in the P&O scheme are displayed in Figure 4a. The algorithm starts with initialization of the values of V(k) and I(k) in stage 1. The value of power is computed by the measured values of V(k) and I(k) in stage 2. The P&O strategy tracks maximum power in stage 3 through altering control pulses D after observing the change in the direction of PV output power. If at any instant k, the power and voltage are larger than earlier computed values of power and voltage (k-1), then adjustment remains in the same direction. Otherwise, it changes direction. The P&O technique is simple to implement but cannot track peak power accurately under fast-changing irradiance and fault occurrences, so an intelligent controller is needed that can handle different fault conditions.
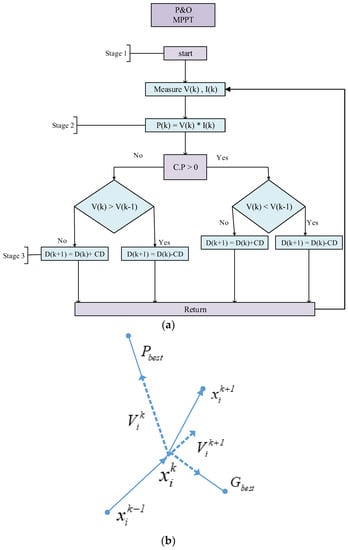
Figure 4.
Different stages in the P&O scheme: (a) The flow diagram of the P&O MPPT scheme. (b) Particle movement during optimization.
4.2. PSO-Based MPPT Scheme
Intelligent meta-heuristic approaches such as PSO have been given wide attention in recent studies [42] for solving optimization problems. PSOs have also been applied in the proposed MPPT control study for comparative analysis of PV faults with application of different control strategies. The solution to an optimization problem can be found by searching for the best solutions that involve minimization or maximization of the problem’s objective function while satisfying a set of user-defined constraints. The proposed PSO scheme is inspired by the social behavior of flocks of birds and schools of fish. Mathematical equations have been used for guiding the particles during the phenomenon of displacement for modeling their social behavior. Swarm has a composition that is made up of a set of particles (N). Particles represent potential solutions to the problem being addressed. Swarms fly over search space, which is denoted by D for searching for the global optimum (). Each particle has its best solution, known as , which is stored in their memory [42,43]. The strategy has been shown in Figure 4b, which illustrates the scheme adopted for moving a particle. Firstly, different particles are initialized randomly. At each iteration, the movement of particles can be expressed as:
The velocity element signifies the step size. The movement of particles after each iteration is presented as follows:
Here, V is the varied particle speed and W is the inertial weight of the previously computed velocity in the current computation of speed. C1 and C2 are acceleration coefficients regarding best particle and best global position during stages of updating velocity values. R1 and R2 are random variables that are distributed in the interval [0, 1]. A larger value of inertial weight W is beneficial for finding the global optimum. The influence of the best global position and local position will be small on larger values. Relatively smaller values of W are helpful for convergence. It helps to demonstrate good global search capabilities at the beginning and local search capabilities in later iterations of the optimization algorithm. The typical movement of particles in the optimization process has been shown in Figure 4b. The output reference current is given by:
The above equation shows the currents in which convergence occurs. The convergence of this optimization method is based on the objective function, which is known as a fitness function. In the proposed study, fitness function is an objective function that compares the existing power of a PV system with the power achieved in the previous iteration. This terminology can be expressed as:
The process for reinitialization is defined by:
Iteration i ≤ 10 establishes the condition of convergence.
represents the power calculated from the previous iteration, while signifies the power over the current iteration. is a minimum error, which is taken as 0.1 in this study. The value of is 1.24 and is 1.32, while W is 0.3. After convergence is achieved, the selected is related to .
The steps of the PSO algorithm have been illustrated in Figure 5. Values of velocity and positions of particles are randomly initialized during the first stage, which is the most crucial stage of this proposed strategy. Accurate defining of initial design parameters with velocity and position of particles like change in power, C1, C2, and W is important for prevention of inaccurate control of the proposed PSO-based MPPT scheme that can lead to premature convergence and tacking of local peak power [44]. The computation of power has been performed in the second stage for checking the condition of convergence after measuring new computed values of velocity and position of each particle. Resetting of particles has been performed if the condition of convergence is true; otherwise, a fitness check will be performed for updating the values of Gbest and Pbest. The reference current has been computed after updating values of Gbest and Pbest. If the condition of convergence is satisfied, then the process is repeated by reinitializing the random velocity and position of particles. The selected is related to Gbest. The process of reiteration will be stopped after achieving the optimal position.
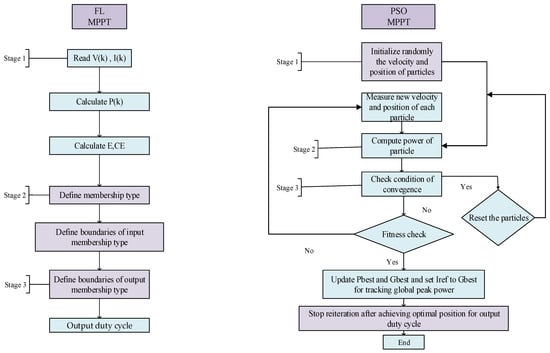
Figure 5.
Flow diagram of MPPT strategies for comparative analysis of faults.
4.3. FL-Based Control Scheme
An FL-based controller is also designed in this study to efficiently extract peak power under various fault scenarios. The fuzzy set theory is adopted for controlling the maximum power point through a fuzzy logic-based scheme. Three basic components are involved in the considered MPPT, including fuzzification unit, inference engine, and defuzzification unit [45,46,47].
First stage of fuzzification involves computation of variations in output voltage and current of the PV arrays, which is then used for defining IMFs of the fuzzy logic-based MPPT control scheme. These MFs are defined for each input of the FL controller in order to transform the measured variation into appropriate inputs for the MPPT scheme. The accuracy of this MPPT scheme is dependent upon the number of IMFs. The second step is the rule evaluation stage, in which rules of fuzzy logic are evaluated for determining the appropriate control action, which forms the relation of logic function to IMFs and OMFs. Outcome of this rule evaluation stage is a fuzzy OMF for every subsequent action of IMFs.
Defuzzification is the last stage of the fuzzy logic scheme, in which an expected value of OMF is obtained and considered as an output for the system. The E and CE are input to the FL controller. The error signal is estimated as a variation in PV output power over variation in PV output voltage. The estimation of E and CE are given as:
where P(i) and P(i − 1) denote present and past samples of the PV output power, respectively. Also, and represent present and past samples of the measured PV output voltage, respectively. The error and change in error are estimated using Equations (17) and (18), which signify present, and the past samples of the error measured by present and past samples of voltage and power. A total of 49 fuzzy rules are defined for controlling the fuzzy logic-based MPPT scheme under the considered fault scenarios. The values of E and CE are computed in 49 fuzzy rules. The duty cycle of the proposed FL-based control is mapped as the OMF of the system. The rules that link the IMFs and OMFs for the proposed FL-based MPPT scheme are given in Table 2. The surface function is a three-dimensional illustration of input–output MFs for the proposed fuzzy logic control/scheme.
Table 2.
Fuzzy rules with relationships between IMFs and OMFs.
In the proposed algorithm, symmetrical and triangular membership functions are de-fined for both IMFs and OMFs using if–else rules for MF as shown in Table 2. The last stage is defuzzification, whereby OMF is converted into a numerical output. The total 49 fuzzy rules of IF–THEN ELSE have been used in the proposed FL scheme to describe the relation between IMFs and OMFs. In this way, the proposed fuzzy logic scheme can im-prove the performance of the proposed system under introduced fault scenarios through defining 49 rules of fuzzy logic for its MF, which enables the accurate tracking of peak power as presented in the next section.
5. Numerical Analysis
A 75 PV array is developed in Simulink to examine the performance of the PV system. The PV array is developed on a solar module of 230 W. Description of the studied modules is detailed in Table 3. Total peak power produced by a 75 PV array under STC conditions is nearly 8000 W.
Table 3.
Parameters of the studied solar modules.
Five different fault scenarios are considered for the computation of power under several faulty conditions, including partial shading, bridge fault under shading, bypass diode failure under shading, open circuit, and combined fault. The characteristics curves of several fault states are indicated in Figure 6a,b. Multiple peaks in the curve appear due to the manifestation of PV faults. Shading of the PV array further deteriorates the performance of the PV array. The CIGS array outperforms the crystalline PV in terms of characteristics curve analysis. The tracking of peak power through conventional control schemes like the P&O algorithm is difficult in the considered fault scenarios. Thus, smart controllers like PSO and FL are designed for increasing the tracking of peak power under these fault scenarios. All of the test cases are shown in Table 4, Table 5 and Table 6, while the simulation results are illustrated in Table 7.
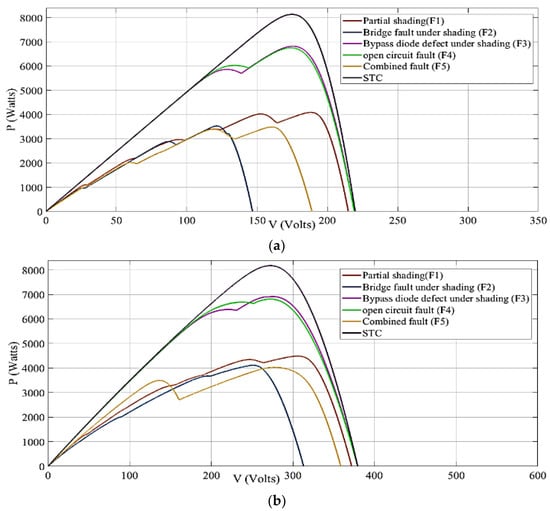
Figure 6.
Fault States: (a) PV curve under various faults (monocrystalline). (b) PV curve under various faults (CIGS).
Table 4.
Computed values of PV under various faults.
Table 5.
Computed values of the PV system under various faults.
Table 6.
Percentage increase in peak power from MC and TF PV arrays under various faults.
Table 7.
Simulation results.
Multiple power peaks due to occurrence of faults with a significant decrease in peak power have been analyzed using characteristics curve analysis. It is noted that thin film PV has better performance than monocrystalline PV for maximum power output as shown in Figure 6b.
Results of Faulty PV Arrays with Enabled MPPT Strategies
This section presents analysis of the impact of the faults on power output from a PV system. Firstly, tracking of peak power is observed under standard test conditions (STC) for the proposed system. The MPPT begins adjusting across varying D upon enabling MPPT at 3100 ms in the P&O algorithm. As shown in Figure 7, approximately 7900 W of peak power is traced with a tracking time of 3400 ms at 1000 W/m2 irradiance and at nearly 25 °C temperature. This tracking scheme has successfully traced peak power under STC.
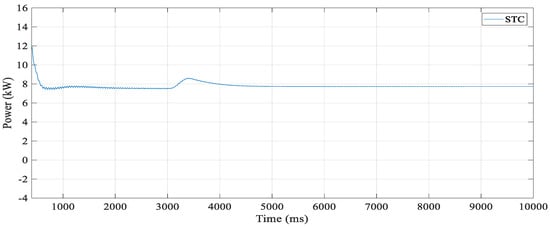
Figure 7.
Power under STC (1000 W/m2 and 25 °C).
A detailed illustration of the obtained results is given in Table 4 and Table 7. Impact on current and grid power under five different faults has been analyzed. The PV system of two different PV materials, CIGS and monocrystalline, is considered for the testing.
Performance of the monocrystalline PV system is observed under severe partial shading, which is termed fault F1. The conventional MPPT scheme cannot track the optimal peak power under shading conditions. The duty cycle cannot be efficiently adjusted under this fault condition; therefore, the PSO and FLC schemes are used for tracking peak power. Both PSO and FL schemes are compared with the P&O scheme to analyze the increase in power after adopting intelligent control schemes. It is found that the current flow is reduced under partial shading fault F1, which impacts the power output. It is also observed that the P&O scheme obtains peak power of 3500 W after 5000 ms and further reduces to 2500 W under shading conditions. The peak power is reduced from 7900 W to 4010 W under partial shading fault F1 by applying the PSO strategy. The obtained peak power is the same, i.e., 4010 W, after applying an FL-based MPPT. Both FL- and PSO-based intelligent MPPT schemes offer higher power than the conventional P&O scheme. This can be even further beneficial for reserve power applications in power systems where graph theory can be used to coordinate several PV sources [48,49,50].
Thin film or the CIGS PV array is also analyzed under non-uniform shading F1. The peak power gets reduced from 7900 W to approximately 4010 W under partial shading fault F1 with monocrystalline PV. The obtained peak power is increased from 4010 W to 4300 W after applying the FL-based MPPT scheme to a thin film PV array. The performance of the system is enhanced under this fault scenario by using a fuzzy algorithm with thin film PV technology. PSO also achieves the same power peak in this fault scenario, which shows that fuzzy and PSO algorithms can successfully track the global peak under shading conditions with high speed and accuracy. The CIGS technology has better performance under a shading fault due to its complex geometrical structure as compared to crystalline-type PV. The current flow is affected under partial shading fault F1. The value of the current of the system gets reduced, which impacts the power as portrayed through behavior of the current. However, the performance of CIGS (thin film) is better than that of the crystalline PV array due to its fault tolerance and complex geometrical structure.
The impact of bridge fault F2 on tracked power is also illustrated in Table 7. The conventional P&O control scheme cannot track the optimal peak power during this fault condition and further reduces to nearly 2300 W after 5000 ms. The new peak power is 3450 W under partial shading fault F2 after applying the PSO strategy to a crystalline PV array. The PSO scheme successfully tracks global peak power under the reduced irradiance with bridge fault. On the other hand, the FL-based scheme also efficiently tracks peak power under the severe fault condition. The tracked peak power is 3440 W after applying the fuzzy logic-based MPPT to a crystalline PV array. The current is reduced due to the occurrence of bridge fault under shading. The performance of CIGS (thin film) technology is better than that of the crystalline PV array for bridge fault under non-uniform shading F2. The conventional P&O scheme still cannot track global power peak under this fault condition. The peak power of 4010 W is successfully tracked under F2 after applying the PSO strategy. The same peak power is tracked, i.e., 4010 W, after applying a fuzzy logic-based MPPT to a thin film CIGS PV system. The utilization of thin film with FL and PSO strategies can optimize the performance of a system during the occurrence of a bridge fault with severe shading condition. The proposed FL-based scheme can improve the performance of the system by 11.3% under F2 with a thin-film PV array.
Peak power is much affected by bypass diode failure F3 for a crystalline PV array. Here, peak power is reduced from 7900 W to 6750 W under the considered fault case. The peak power is successfully tracked after applying PSO- and fuzzy logic-based MPPT. However, PSO has faster tracking capability. Fuzzy starts tracking the peak power after 3000 ms. Maximum peak power can be achieved by the proposed intelligent MPPT schemes in this fault scenario. The current flow is reduced during bypass diode failure under shading fault F3. Power from the thin film PV array is also decreased upon introduction of diode failure under non-uniform shading (F3). The peak power is recorded as 6805 W during bypass diode failure under partial shading fault F3 through applying the PSO strategy. The tracked peak power is 6800 W upon implementation of the fuzzy logic-based MPPT scheme. It is observed that the performance of thin film is better than crystalline PV array in this fault scenario, and applying the PSO- and FL-based strategies further optimizes the performance of the PV systems.
In case of open circuit fault F4, the peak power is approximately 6700 W through applying the PSO algorithm and fuzzy logic, which optimizes the performance of the system by increasing peak power to 6700 W. Utilization of thin film PV technology further improves the results and performs better than a crystalline photovoltaic array in the considered fault scenario. The occurrence of an open-circuit fault decreases the current of the system. The tracked peak power is 6780 W through the implementation of a fuzzy logic-based MPPT scheme to the thin film PV array. The occurrence of an open circuit fault reduces the current of the system.
It is found that the thin film PV array performs better than crystalline in all above studied fault scenarios. In addition, combined fault F5 is also performed for analysis of results in a day-to-night transition duration. The peak power is 3300 W upon application of the PSO scheme under the fault F5, whereas the same peak power is achieved after applying FLC, i.e., 3300 W. It is noted that the occurrence of multiple faults reduces the current of the system as depicted. Importantly, extraction of maximum peak power through the proposed PSO and fuzzy scheme can significantly contribute to improvement of the system’s performance under the studied multiple fault scenario. The comparative analysis of multiple faults, i.e., combined fault, reveals that maximum peak power of 4005 W is achieved through the PSO algorithm and 4005 W peak power is achieved from FLC with a thin film PV array. The combined fault case F5 exhibits a decrease in the current.
For an in-depth analysis, multiple fault case F5 is analyzed on both monocrystalline and thin film PV arrays. Peak power is accurately tracked by applying the fuzzy logic scheme and the PSO scheme. On the other hand, the tracked power gets decreased to 4005 W in a thin film array by applying FLC-based MPPT. It is noteworthy that the PV performance of power is still 4005 W after implementation of the PSO-based scheme in the F5 fault scenario. It is established that thin film (TF) PV technology optimizes the performance of the system by improving peak power up to 4005 W in fault case F5 through PSO and fuzzy logic implementation. The thin film PV is useful in optimizing the performance under all the studied fault scenarios with implementation of a proposed MPPT strategy. Calculation of a PV system under various fault scenarios is shown in Table 6. Increase in power extraction from PV arrays is also computed after implementation of the FL- and PSO-based schemes on the MPPT algorithm, as given in Table 7. The increase in power is computed by:
Here, is the maximum power computed under an intelligent control scheme and is the power computed with a conventional P&O algorithm.
The obtained results of percentage increase in power with FL- and PSO-based controllers are shown in Figure 8a. A total of 14.5% and 7.2% increments in peak power are observed with the FL scheme from crystalline and thin film PV arrays, respectively.
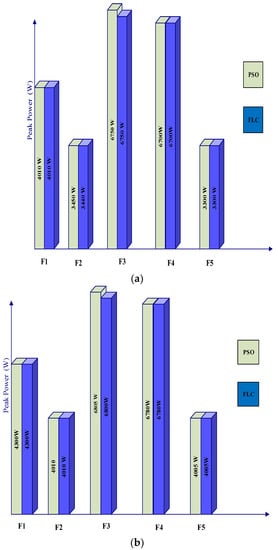
Figure 8.
FL- and PSO-based controllers: (a) Representation of peak power generated from monocrystalline PV arrays with implementation of PSO and fuzzy logic control. (b) Representation of peak power generated from thin film PV arrays with implementation of PSO and FL schemes.
Increases of 10.9% and 11.3% in the tracked power with crystalline and thin film PV arrays, respectively, are recorded under fault scenario F2. It can be clearly seen that 10.6% and 9.6% increases in the tracked power with crystalline and thin film PV arrays are computed during occurrence of fault scenario F3. The details of the increase in power through the proposed FL and PSO schemes under all fault scenarios are shown in Figure 9. Both intelligent control schemes successfully tracked global power peaks under difficult fault scenarios.
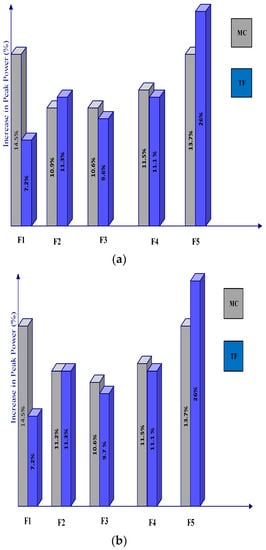
Figure 9.
FL and PSO schemes under all fault scenarios: (a) Comparison of increase in peak power from monocrystalline and thin film PV arrays with implementation of the proposed FL-based scheme under the studied fault cases. (b) Comparison of increase in peak power from monocrystalline and thin film PV arrays with implementation of the proposed PSO-based scheme under the studied fault cases.
6. Conclusions
In this study, three MPPT-based methods, namely FL, PSO, and P&O, are developed and tested under five different fault scenarios and two types of PV module technologies, i.e., CIGS thin film and crystalline PV arrays. This study shows that both PSO- and fuzzy logic-based intelligent control schemes are capable of optimizing and improving the performance of the PV system through accurate tracking of maximum power under the considered fault scenarios. Through extensive simulation results and quantitative analysis, it is demonstrated that the PSO and the fuzzy logic-based controller track peak power more accurately compared to the conventional P&O algorithm under multiple faults. It is shown that the PSO-based MPPT scheme is easy to implement while offering faster tracking capability; however, defining initial design parameters is important for accurate control. Inaccurate initialization of parameters can lead to premature convergence and tracking of local peak power under the fast-changing contingent conditions, which lead to low performance of a PV system. On the contrary, the FL method requires larger computational time than that of conventional algorithms, and it may be considered a limitation of this scheme. This study not only presented testing case studies for multiple faults of PVs but also presented a comparison of different technologies of PVs, which concludes that thin film PV arrays can further enhance the performance of the PV system as compared to the crystalline PV models.
Author Contributions
Writing—original draft, A.U.-H., R.B. and S.G.; Conceptualization, A.U.-H.; Formal analysis, A.U.-H., R.B. and S.F.; Writing—review & editing, A.U.-H., R.B. and S.F.; Supervision, R.B. All authors have read and agreed to the published version of the manuscript.
Funding
This research received no external funding.
Data Availability Statement
Not applicable.
Conflicts of Interest
The authors declare no conflict of interest.
References
- Kivimäki, S.J. Revisited perturbation frequency design guideline for direct fixed-step maximum power point tracking algo-rithms. IEEE Trans. Ind. Elec. 2017, 64, 4601–4609. [Google Scholar] [CrossRef]
- Meral, M.; Çelík, D. A comprehensive survey on control strategies of distributed generation power systems under normal and abnormal conditions. Annu. Rev. Control 2019, 47, 112–132. [Google Scholar] [CrossRef]
- Meral, M.; Çelík, D. Comparison of SRF/PI- and STRF/PR-based power controllers for grid-tied distributed generation systems. Electr. Eng. 2018, 100, 633–643. [Google Scholar] [CrossRef]
- Ahmed, E.M.; Shoyama, M. Scaling Factor Design Based Variable Step Size Incremental Resistance Maximum Power Point Tracking for PV Systems. J. Power Electron. 2012, 12, 164–171. [Google Scholar] [CrossRef]
- Hu, K.; Cao, S.; Li, W.; Zhu, F. An Improved Particle Swarm Optimization Algorithm Suitable for Photovoltaic Power Tracking Under Partial Shading Conditions. IEEE Access 2019, 7, 143217–143232. [Google Scholar] [CrossRef]
- Ahmed, J.; Salam, Z. A Maximum Power Point Tracking (MPPT) for PV system using Cuckoo Search with partial shading capability. Appl. Energy 2014, 119, 118–130. [Google Scholar] [CrossRef]
- Kaced, K.; Larbes, C.; Ramzan, N.; Bounabi, M.; Dahmane, Z.E. Bat algorithm based maximum power point tracking for photovoltaic system under partial shading conditions. Sol. Energy 2017, 158, 490–503. [Google Scholar] [CrossRef]
- Eltamaly, A.M.; Al-Saud, M.S.; Abokhalil, A.G. A Novel Bat Algorithm Strategy for Maximum Power Point Tracker of Photovoltaic Energy Systems Under Dynamic Partial Shading. IEEE Access 2020, 8, 10048–10060. [Google Scholar] [CrossRef]
- Ahmed, J.; Salam, Z. An enhanced adaptive P&O MPPT for fast and efficient tracking under varying environmental conditions. IEEE Trans. Sust. Energy 2018, 9, 1487–1496. [Google Scholar]
- Elobaid, L.M.; Abdelsalam, A.K.; Zakzouk, E.E. Artificial neural network-based photovoltaic maximum power point tracking techniques: A survey. IET Renew. Power Gen. 2015, 9, 1043–1063. [Google Scholar] [CrossRef]
- Seyedmahmoudian, B.M. State of the art artificial intelligence-based MPPT techniques for mitigating partial shading effects on PV systems–A review. Renew. Sust. Energy Rev. 2016, 64, 435–455. [Google Scholar] [CrossRef]
- Yi, Z.; Etemadi, A.H. Fault Detection for Photovoltaic Systems Based on Multi-Resolution Signal Decomposition and Fuzzy Inference Systems. IEEE Trans. Smart Grid 2016, 8, 1274–1283. [Google Scholar] [CrossRef]
- Bounechba, H.; Bouzid, A.; Nabti, K.; Benalla, H. Comparison of Perturb & Observe and Fuzzy Logic in Maximum Power Point Tracker for PV Systems. Energy Procedia 2014, 50, 677–684. [Google Scholar] [CrossRef]
- Dorji, S.; Wangchuk, D.; Choden, T.; Tshewang, T. Maximum Power Point Tracking of solar pho-tovoltaic cell using Perturb & Observe and fuzzy logic controller algorithm for boost converter and quadratic boost converter. Mater. Today Proc. 2020, 27, 1224–1229. [Google Scholar]
- Al-Majidi, S.D.; Abbod, M.F.; Al-Raweshidy, H.S. A novel maximum power point tracking technique based on fuzzy logic for photovoltaic systems. Int. J. Hydrogen Energy 2018, 43, 14158–14171. [Google Scholar] [CrossRef]
- Algarín, C.R.; Giraldo, J.T.; Alvarez, O.R. Fuzzy Logic Based MPPT Controller for a PV System. Energies 2017, 10, 2036. [Google Scholar] [CrossRef]
- Hong, Y.-Y.; Buay, P.P.M. Robust design of type-2 fuzzy logic-based maximum power point tracking for photovol-taics. Sustain. Energy Technol. Assess. 2020, 38, 100669. [Google Scholar]
- Saidi, A.; Benachaiba, C. Comparison of IC and P&O algorithms in MPPT for grid connected PV module. In Proceedings of the 8th International Conference on Modelling, Identification and Control (ICMIC), Algiers, Algeria, 15–17 November 2016; pp. 213–218. [Google Scholar] [CrossRef]
- Elkhateb, A.; Rahim, N.A.; Selvaraj, J.; Uddin, M.N. Fuzzy-logiccontroller-based SEPIC converter for maximum power point tracking. IEEE Trans. Ind. Appl. 2014, 50, 2349–2358. [Google Scholar] [CrossRef]
- Karmouni, H.; Chouiekh, M.; Motahhir, S.; Qjidaa, H.; Jamil, M.; Sayyouri, M. A novel modified sine-cosine optimized MPPT algorithm for grid integrated PV system under real operating conditions. IEEE Access 2019, 7, 10467–10477. [Google Scholar]
- Hamouda, N.; Babes, B.; Boutaghane, A.; Kahla, S.; Talbi, B. An enhanced MPPT method combining fractional-order and fuzzy logic control. IEEE J. Photovolt. 2017, 7, 640–650. [Google Scholar]
- Al Nabulsi, A.; Dhaouadi, R. Efficiency optimization of a DSP-based standalone PV system using fuzzy logic and dual-MPPT control. IEEE Trans. Ind. Inf. 2012, 8, 573–584. [Google Scholar] [CrossRef]
- Han, G.; Zhang, S.; Boix, P.; Wong, L.; Sun, L.; Lien, S.-Y. Towards high efficiency thin film solar cells. Prog. Mater. Sci. J. 2017, 87, 246–291. [Google Scholar] [CrossRef]
- Quansah, D.A.; Adaramola, M.S. Comparative study of performance degradation in poly- and mono-crystalline-Si solar PV modules deployed in different applications. Int. J. Hydrogen Energy 2018, 43, 3092–3109. [Google Scholar] [CrossRef]
- Priyadarshi, N.; Sanjeevikumar, P.; Ranjana, M.S.B.; Blaabjerg, F.; Sharma, A. Fuzzy SVPWM-based inverter control realization of grid integrated photovoltaic-wind system with fuzzy particle swarm optimisation maximum power point tracking algorithm for a grid-connected PV/wind power generation system: Hardware implementation. IET Electr. Power Appl. 2018, 12, 962–971. [Google Scholar] [CrossRef]
- Firth, S.; Lomas, K.; Rees, S. A simple model of PV system performance and its use in fault detection. Sol. Energy 2010, 84, 624–635. [Google Scholar] [CrossRef]
- Bostan, V.; Toma, A.R.; Tudorache, T.; Paţurcă, S.V.; Dumitrescu, A.-M.; Bostan, I. Performance analysis of polycrystalline and CIS thin-film PV panels in real operation conditions. In Proceedings of the 2017 5th International Symposium on Electrical and Electronics Engineering (ISEEE), Galati, Romania, 20–22 October 2017; pp. 1–4. [Google Scholar]
- Ozden, T.; Akinoglu, B.G.; Kurtz, S. Performance and Degradation Analyses of two Different PV Modules in Central Anatolia. In Proceedings of the 2018 International Conference on Photovoltaic Science and Technologies (PVCon), Ankara, Turkey, 4–6 July 2018; pp. 1–4. [Google Scholar]
- Pachauri, R.K.; Chauhan, Y.K. Hybrid PV/FC Stand Alone Green Power Generation: A Perspective for Indian Rural Telecommunication Systems. In Proceedings of the 2014 International Conference on Issues and Challenges in Intelligent Computing Techniques (ICICT), Ghaziabad, India, 7–8 February 2017; pp. 807–815. [Google Scholar]
- Villalva, M.G.; Gazoli, J.R.; Filho, E.R. Comprehensive approach to modeling and sim-ulation of photovoltaic arrays. IEEE Trans. Power Elect. 2009, 24, 1198–1208. [Google Scholar] [CrossRef]
- Ahmed, J.; Salam, Z. A critical evaluation on maximum power point tracking methods for partial shading in PV systems. Renew. Sustain. Energy Rev. 2015, 47, 933–953. [Google Scholar] [CrossRef]
- Sun, X.; Silverman, T.; Garris, R.; Deline, C.; Alam, M.A. An Illumination- and Temperature-Dependent Analytical Model for Copper Indium Gallium Diselenide (CIGS) Solar Cells. IEEE J. Photovolt. 2016, 6, 1298–1307. [Google Scholar] [CrossRef]
- Silverman, T.J.; Deceglie, M.G.; Sun, X.; Garris, R.L.; Alam, M.A.; Deline, C.; Kurtz, S. Thermal and electrical effects of partial shade in monolithic thin-film photovoltaic modules. IEEE J. Photovolt. 2015, 5, 1742–1747. [Google Scholar] [CrossRef]
- Ul-Haq, A.; Alammari, R.; Iqbal, A.; Jalal, M.; Gul, S. Computation of Power Extraction from Photo-voltaic Arrays under Various Fault Conditions. IEEE Access 2020, 8, 47619–47639. [Google Scholar] [CrossRef]
- Blaifi, S.-A.; Moulahoum, S.; Benkercha, R.; Taghezouit, B.; Saim, A. M5P model tree based fast fuzzy maximum power point tracker. Sol. Energy 2018, 163, 405–424. [Google Scholar] [CrossRef]
- Zaki, S.A.; Zhu, H.; Yao, J. Fault detection and diagnosis of photovoltaic system using fuzzy logic control. E3S Web Conf. 2019, 107, 02001. [Google Scholar] [CrossRef]
- Kandemir, E.; Cetin, N.S.; Borekci, S. A Comparison of Perturb & Observe and Fuzzy-Logic Based MPPT Methods for Uniform Environment Conditions. Period. Eng. Nat. Sci. (PEN) 2017, 5, 16–23. [Google Scholar] [CrossRef]
- Bendib, B.; Krim, F.; Belmili, H.; Almi, M.; Boulouma, S. Advanced Fuzzy MPPT Controller for a Stand-alone PV System. Energy Procedia 2014, 50, 383–392. [Google Scholar] [CrossRef]
- Ilyas, A.; Ayyub, M.; Khan, M.R.; Jain, A.; Husain, M.A. Realisation of incremental conductance the MPPT algorithm for a solar photovoltaic system. Int. J. Amb. Energy 2018, 39, 873–884. [Google Scholar] [CrossRef]
- Priyadarshi, N.; Padmanaban, S.; Maroti, P.K.; Sharma, A. An extensive practical investigation of FPSO-based MPPT for grid integrated PV system under variable operating conditions with anti-islanding protection. IEEE Syst. J. 2019, 13, 1861–1871. [Google Scholar] [CrossRef]
- Priyadarshi, N.; Padmanaban, S.; Holm-Nielsen, J.B.; Blaabjerg, F.; Bhaskar, M.S. An Experimental Estimation of Hybrid ANFIS–PSO-Based MPPT for PV Grid Integration Under Fluctuating Sun Irradiance. IEEE Syst. J. 2020, 14, 1218–1229. [Google Scholar] [CrossRef]
- Priyadarshi, N.; Bhaskar, M.S.; Padmanaban, S.; Blaabjerg, F.; Azam, F. New CUK–SEPIC converter based photovoltaic power system with hybrid GSA–PSO algorithm employing MPPT for water pumping applications. IET Power Electron. 2020, 13, 2824–2830. [Google Scholar] [CrossRef]
- Fahad, S.; Mahdi, A.J.; Tang, W.H.; Huang, K.; Liu, Y. Particle Swarm Optimization Based DC-Link Voltage Control for Two Stage Grid Connected PV Inverter. In Proceedings of the 2018 International Conference on Power System Technology POWERCON, Guangzhou, China, 6–9 November 2018; pp. 2233–2241. [Google Scholar]
- Natarajan, K.; Bala, P.K.; Sampath, V. Fault Detection of Solar PV System Using SVM and Thermal Image Processing. IJRER 2020, 10, 967–977. [Google Scholar]
- Alwar, S.; Samithas, D.; Boominathan, M.S.; Balachandran, P.K.; Mihet-Popa, L. Performance Analysis of Thermal Image Processing-Based Photovoltaic Fault Detection and PV Array Reconfiguration—A Detailed Experimentation. Energies 2022, 15, 8450. [Google Scholar] [CrossRef]
- Devarakonda, A.K.; Karuppiah, N.; Selvaraj, T.; Balachandran, P.K.; Shanmugasundaram, R.; Senjyu, T. A Comparative Analysis of Maximum Power Point Techniques for Solar Photovoltaic Systems. Energies 2022, 15, 8776. [Google Scholar] [CrossRef]
- Selvaraj, T.; Rengaraj, R.; Venkatakrishnan, G.; Soundararajan, S.; Natarajan, K.; Balachandran, P.; David, P.; Selvarajan, S. Environmental Fault Diagnosis of Solar Panels Using Solar Thermal Images in Multiple Convolutional Neural Networks. Int. Trans. Electr. Energy Syst. 2022, 2022, 2872925. [Google Scholar] [CrossRef]
- Fahad, S.; Goudarzi, A.; Li, Y.; Xiang, J. A coordination control strategy for power quality enhancement of an active distribution network. Energy Rep. 2022, 8, 5455–5471. [Google Scholar] [CrossRef]
- Shang, Y. Resilient Multiscale Coordination Control against Adversarial Nodes. Energies 2018, 11, 1844. [Google Scholar] [CrossRef]
- Fahad, S.; Goudarzi, A.; Xiang, J. From Grid Feeding to Grid Supporting Converters: A Constant Power Active Distribution Network Perspective. In Proceedings of the 2020 IEEE 29th International Symposium on Industrial Electronics (ISIE), Delft, The Netherlands, 17–19 June 2020; pp. 862–867. [Google Scholar] [CrossRef]


Disclaimer/Publisher’s Note: The statements, opinions and data contained in all publications are solely those of the individual author(s) and contributor(s) and not of MDPI and/or the editor(s). MDPI and/or the editor(s) disclaim responsibility for any injury to people or property resulting from any ideas, methods, instructions or products referred to in the content. |
© 2023 by the authors. Licensee MDPI, Basel, Switzerland. This article is an open access article distributed under the terms and conditions of the Creative Commons Attribution (CC BY) license (https://creativecommons.org/licenses/by/4.0/).