Article

Saudi Arabia’s Journey toward Net-Zero Emissions: Progress and Challenges

by
Mazen A. Al-Sinan
1,*,
Abdulaziz A. Bubshait
2 and
Fatimah Alamri
1
1
Procurement & Supply Chain Management, Saudi Aramco, Dhahran 31311, Saudi Arabia
2
Department of Construction Engineering & Management, King Fahd University of Petroleum and Minerals, Dhahran 31261, Saudi Arabia
*
Author to whom correspondence should be addressed.
Energies 2023, 16(2), 978; https://doi.org/10.3390/en16020978
Submission received: 24 November 2022 / Revised: 11 January 2023 / Accepted: 13 January 2023 / Published: 15 January 2023
(This article belongs to the Section C: Energy Economics and Policy)

Abstract

:
Combating climate change by reducing greenhouse gas (GHG) emissions has become an obligation for countries that ratified the Paris Agreement. Saudi Arabia, as a member of the Paris Agreement, pledged to achieve net zero emissions (NZE) by 2060. This endeavor is challenging for all countries. This paper provides an analysis and assessment of the Saudi measures to achieve NZE by 2060. The analysis reveals that Saudi Arabia will reduce the total net emissions to 49.67 Mt of CO2eq, whereas under a business-as-usual scenario, the emissions would reach 1.724 million tons (Mt) of CO2 equivalent (CO2eq). The study reveals that sectors conducting environmental, social, and governance ratings (ESG) and those where the government is a stakeholder are on the right track and will facilitate the government’s efforts in reaching NZE. The gap in reaching NZE will be mainly due to the Saudi steel and cement industries.

1. Introduction

Climate change has been linked to the increase in greenhouse gas (GHG) emissions due to anthropogenic activities, such as the burning of fossil fuels and deforestation [1]. For example, CO2 concentration has increased by more than 40% (from 280 ppm in 1850 to more than 400 ppm in this century) due to human activities [2].
One of the Provisions of the Paris Agreement is to achieve net-zero emissions (NZE) in the second half of this century [3]. The Kingdom of Saudi Arabia, as one of the countries that ratified the Paris Agreement, pledged to reach NZE by 2060.
Achieving NZE is a challenging goal for almost all counties, let alone a country whose economy is growing and heavily depends on the hydrocarbon industry. The Saudi Vision 2030 was announced on 25 April 2016 to be in tandem with the NZE journey.
This paper contributes to Saudi Arabia’s journey toward fulfilling its pledge to reach NZE by 2060. In this paper, the policies, technologies, and strategies for reducing emissions are benchmarked in the context of Saudi measures to achieve NZE. This benchmark could assist policymakers in considering the introduction of additional measures such as carbon tax and credit policy. The paper provides an assessment of Saudi measures to reduce emissions. A forecast is presented concerning Saudi emissions until 2060 based on an analysis of the current emissions and the measures being applied to reduce emissions by analyzing each source of emission separately. In addition to analyzing the emission sources, the impact of the Saudi Green Initiative, which plays a significant role in sequestering CO2 (carbon sink), was analyzed.

2. Methodology

This paper attempts to answer the following questions:
  • Will Saudi Arabia be able to reach NZE by 2060?
  • Are Saudi measures to reduce emissions sufficient?
Figure 1 shows a summary of the research methodology.
To answer the first question, each industry that contributes to the emissions was analyzed together with the relevant mitigation measures that are under execution. A forecast of the emissions from each source was developed based on assumptions that incorporate the future growth and the potential effects of the mitigation measures announced by the Saudi government and the initiatives that are under implementation. The announced measures cover the present period until 2030. Accordingly, via extrapolation and substantiated assumptions, a forecast was developed to estimate the net emissions by 2060.
The discrepancies in the available emission data and the calculation methods can result in uncertainty of ±10% to ±50% [4]. The emission estimates and the forecast were based on the most excessive published estimates, and the worst-case scenario was utilized in forecasting the growth. By applying the 2006 Intergovernmental Panel on Climate Change (IPCC) Guidelines for National Greenhouse Gas Inventories for any source of emissions, the results would be lower than the estimate of this study [5]. The discrepancy between the actual and the estimated emissions for a particular year should be acceptable since the study attempts to forecast 35 years ahead, where the plus and minus tolerance in the estimates will offset each other over the years.
Regarding the Saudi measures to reduce emissions, several studies were reviewed to determine and discuss the commonly implemented measures [6,7,8,9,10,11,12,13,14,15,16,17,18,19]. Subsequently, a benchmark of the Saudi measures reported in the 2021 Nationally Determined Contribution (NDC) [20] was conducted against the common measures to reduce emissions.
Section 3 provides a background of GHG, the Paris Agreement, and the measures to reduce and remove GHG emissions. Section 4 covers the 2021 Saudi NDC. Section 5 provides the emissions forecast analysis for Saudi Arabia. Section 6 provides a general discussion, and the conclusion is presented in Section 7.

3. Literature Review

3.1. GHG

CO2 represents approximately 72% of GHGs, CH4 corresponds to 18%, N2O to 6%, and SF6, HFC, and PFC together represent 3%. The potency in trapping heat varies significantly among the six gases [21]. In some studies, other non-anthropogenic gases are presented as GHGs, for instance, water vapor (H2O) and ozone (O3) [22].
The literature and the global efforts focus on CO2 emissions because they represent roughly 72% of the total GHG emissions and possibly due to the practical monitoring and management of CO2. Nevertheless, the other gases are potentially more harmful due to the pollution and its consequent health effects. The potency of other gases in trapping heat is stronger; for example, N₂O is 300 times more potent than CO2 [21]. GHG emissions are calculated as CO2 eq. In this study, the terms “GHG emissions” and “CO2 emissions” are used interchangeably.
GHG emissions are classified into scope 1, scope 2, and scope 3. Scope 1 refers to the emissions associated directly with the organization’s activities and originating from sources owned or controlled by the organization. Scope 2 refers to the emissions associated with the generation of electricity, heat cooling, or steam purchased by the organization. Scope 3 refers to emissions associated with sources other than what is covered under scopes 1 and 2, including supply chains and emissions from the use of sold products [23,24].

3.2. The Paris Climate Agreement

The Paris Agreement provides countries with the flexibility to establish their own nationally determined contributions (NDCs). The agreement does not mandate binding emission targets, and countries are not obligated to implement their NDCs. In other words, it is left to each country to determine its approach and targets to reduce emissions [3]. Under the Paris Agreement, mitigation measures refer to efforts to reduce emissions and enhance sinks, while adaption measures refer to the efforts to reduce the negative impact of climate change [25]. The agreement mandates the countries to communicate their NDCs to the UNFCCC Secretariat every five years to demonstrate their progress [26].
Among the provisions of the Paris Agreement are the following [3,25]:
  • Achieving NZE in the second half of this century.
  • Application of mitigation measures of individual countries to be expressed in NDCs.
  • NDCs should be revised at least every five years to reflect the advancements since the last iteration.
  • Using emission trading or by permitting result-based payments, countries can transfer the results of their mitigation efforts globally to fulfill their NDC commitments.
  • Providing $100 billion per year until 2025 and $100 billion after 2025 as a floor. Developing nations are urged to offer voluntary assistance. The significance of public monies in finance is essential. Developed nations are required to submit reports twice a year on the extent of the aid given.

3.3. Measures to Reduce and Remove GHG Emissions

The removal of CO2 from the atmosphere can be accomplished through several strategies and technologies, including forestation, habitat restoration, soil carbon sequestration, biochar, bioenergy with carbon capture, biomass-based construction, enhanced terrestrial weathering, mineral carbonation, ocean alkalinity, direct air capture, and carbon storage, and low-carbon concrete [2]. Some of these options have their own challenges and are not mature enough for the time being. Carbon capture storage, carbon capture, utilization, and storage (CCUS), and forestation (planation), along with other strategies, have been tested and proved effective in removing CO2 emissions. They are addressed in the following subsections.

3.3.1. Policies

Governments’ common measures to reduce emissions include introducing policies (e.g., carbon pricing mechanisms, energy efficiency), supporting research and development, and deploying low-carbon technologies [6]. Governments can adopt one or more of the following policies to reduce GHG and carbon emissions in particular [7,8,9,10,11]:
  • Carbon cap policy.
  • Carbon tax policy
  • Cap-and-trade policy (carbon trading policy).
  • Carbon subsidy policy.
  • Carbon offset policy.
  • Carbon cap-and-price policy.
  • Carbon banking-and-borrowing policy.
Kiss and Popovics [8] evaluated the effectiveness of national carbon policies and found that the emissions were still increasing regardless of the policy type. Countries with hybrid emission trading systems and carbon tax policies reported relative success.

3.3.2. Strategies

In addition to the policies, many strategies can be adopted to reduce carbon dioxide emissions. These strategies include the following [6,12,13]:
  • Energy efficiency.
  • Energy conservation.
  • Fuel switching.
  • Removal of fossil fuel subsidies.
  • Removal of the tax differential between diesel and gasoline.

3.3.3. Carbon Capture Technology

Carbon Capture, Usage, and Storage (CCUS) is a technology to sequester CO2 and injects it underground for storage [14]. The injected CO2 could increase oil/gas recovery; this is called enhanced oil recovery. Turning the captured CO2 into expensive materials with wide applications, such as graphene, could make the necessary investment in CCUS lucrative. The Karlsruhe Institute of Technology in Germany successfully managed to produce graphene from CO2 [15].
There are three methods to capture CO2: pre-combustion capture, post-combustion capture, and oxy-combustion capture [24].
In 2021, the total number of operating CCUS around the globe was 27, with a total capacity of approximately 40 Mt of CO2 per year. Many projects have announced the building of CCUS in various countries, which will increase the capacity to almost 3-fold the current capacity [13].

3.3.4. Plantation and Forestation

Afforestation and reforestation are proven effective techniques to remove carbon from the atmosphere by planting trees in a non-forest area (afforestation), e.g., desert, or by replanting trees in deforested areas (reforestation). Trees sequester carbon over the years and store it for long periods [2,16].
Trees sequester CO2 via photosynthesis, a process by which the leaves of plants process water and CO2 with light to create biomass [15]. Young trees sequester larger amounts of CO2 in comparison to old trees. The carbon sequestration rates vary according to the plantation species and region [17].

3.3.5. Circular Carbon Economy (CCE)

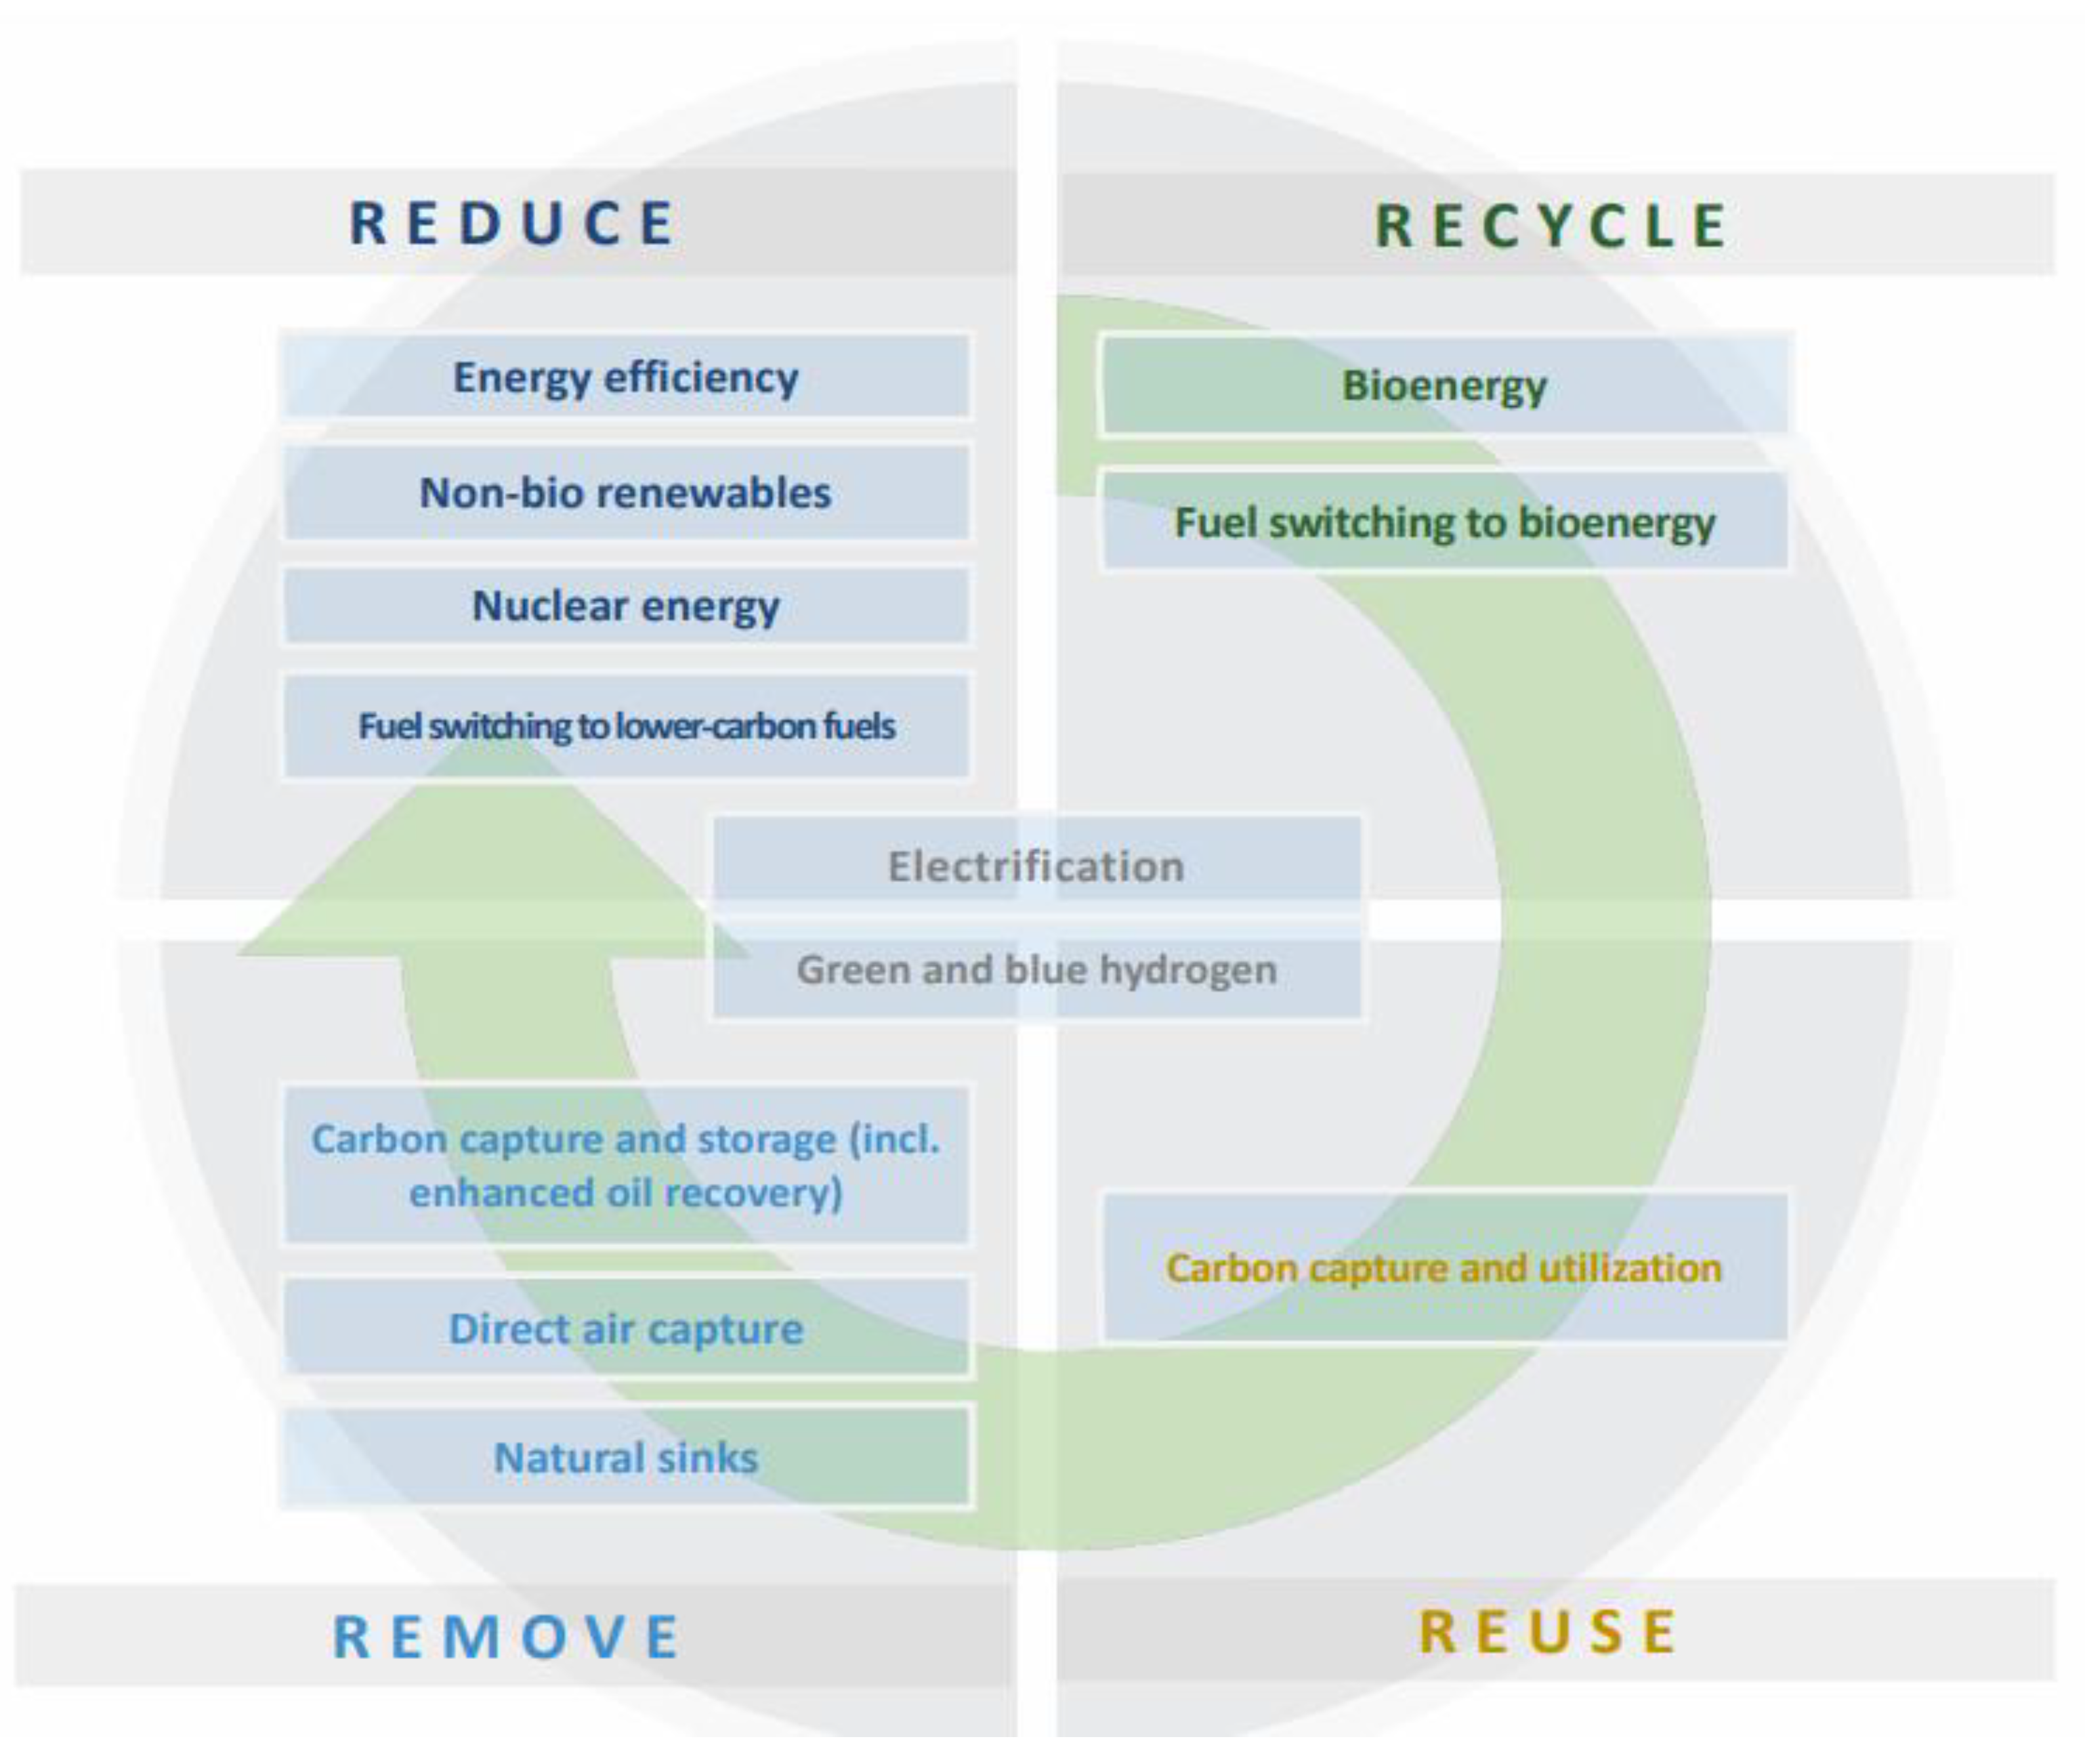
In November 2020, during the G-20, Saudi Arabia announced the launch of the National Program for Circular Carbon Economy (CCE), which provides a framework to reduce GHG emissions. CCE employs four strategies: reduction, reuse, recycling, and removal to reduce emissions (Figure 2) [18].
The CCE concept provides a comprehensive framework for options to reach NZE at the global, national, and organizational levels. The program focuses on energy, and emission flows rather than materials and products. It considers multiple technologies and strategies, including renewable energy, CCUS, energy efficiency, fuel switching, and natural carbon sinks. The CCE attempts to prevent GHG emissions from being released into the atmosphere [19].

4. Saudi 2021 Nationally Determined Contribution

The Saudi NDCs draw the roadmap toward achieving NZE. Saudi 2021 NDC pledged to remove GHG emissions of 278 Mt of CO2eq annually by 2030, with 2019 as the reference year. This is a significant increase from the previous NDC (130 Mt of CO2eq) [20]. Thus, this submission represents progress and the highest possible ambition. This NDC program is premised on the Kingdom’s Vision 2030, which is contingent on economic growth and diversification. The Kingdom focuses on the CCE framework to realize its climate goals. The Saudi 2021 NDC covers the following actions [20]:
  • Energy efficiency. This includes maximizing the efficiency of home appliances and air-conditioning units, feedstock utilization, improving the fuel economy of transportation fleets, phasing out inefficient and used light-duty vehicles, implementing aerodynamic regulations for heavy-duty vehicles, and improving thermal efficiency.
  • Renewable energy. By 2030, Saudi Arabia plans to use renewable energy for 50% of its energy mix. Saudi Arabia will conduct research and development and manufacture renewable energy products as part of its efforts to localize renewable energy. Renewable energy sources include solar photovoltaics (PVs), concentrated solar power, wind power, geothermal power, and waste-to-energy.
  • Green hydrogen. A green hydrogen facility will be built as part of the Saudi mega project “NEOM.”
  • CCUS. The state is planning to build the world’s largest CCUS plant as part of the national CCE program.
  • Utilization of gas. Saudi Arabia is working on increasing the utilization of natural gas in its energy mix to represent up to 50% of its electricity generation by 2030.
  • Methane management. By adopting zero flaring in the oil and gas industry, recovery, and subsequent usage for power generation and petrochemical manufacturing, methane emissions will be reduced.
In addition to these migration measures, the Saudi 2021 NDC refers to adaptation measures, including the Saudi Green Initiative (SGI), which focuses on tree plantations.
Saudi Arabia has adopted all common and recommended measures to reduce emissions (see Section 3.3) except for legislating carbon policies, such as carbon tax or credit policies.

5. Emission Forecast Analysis for Saudi Arabia

This section provides an analysis to assess Saudi Arabia’s ability to achieve NZE by 2060. Conducting a forecast for a given state for more than 35 years ahead is challenging on its own since there are many potential unforeseen variables, including policy, technology, and geopolitics, that could impact the Saudi journey to reach NZE. The analysis focuses on the progress that will be achieved by 2030 since many Saudi initiatives to reduce emissions are tangled with the Saudi Vision 2030. For the period between 2030 and 2060, extrapolation and announced long-term measures had been incorporated to forecast the emissions. In addition, the future of imminent technologies, such as the vehicle manufacturers’ shift from combustion engines to electric vehicles (EVs), will impact emissions globally, for which they have been incorporated in the analysis.
The accuracy of the amount of the current emissions and their distribution among sources is essential to develop a realistic forecast. Conducting a national emissions inventory is challenging, and uncertainties are unavoidable because of various reasons, such as the unavailability of certain source-specific input data. Collecting emission data from various sectors and activities could result in poor-quality data. Selecting the emission factors could be misleading. For example, the Revised 1996 IPCC Guidelines for National Greenhouse Gas Inventories provide emission factors based on a group of activities that comprises several activities as a default emission factor without considering that the group of activities varies from one country to another. This could result in high uncertainty [27,28,29,30].
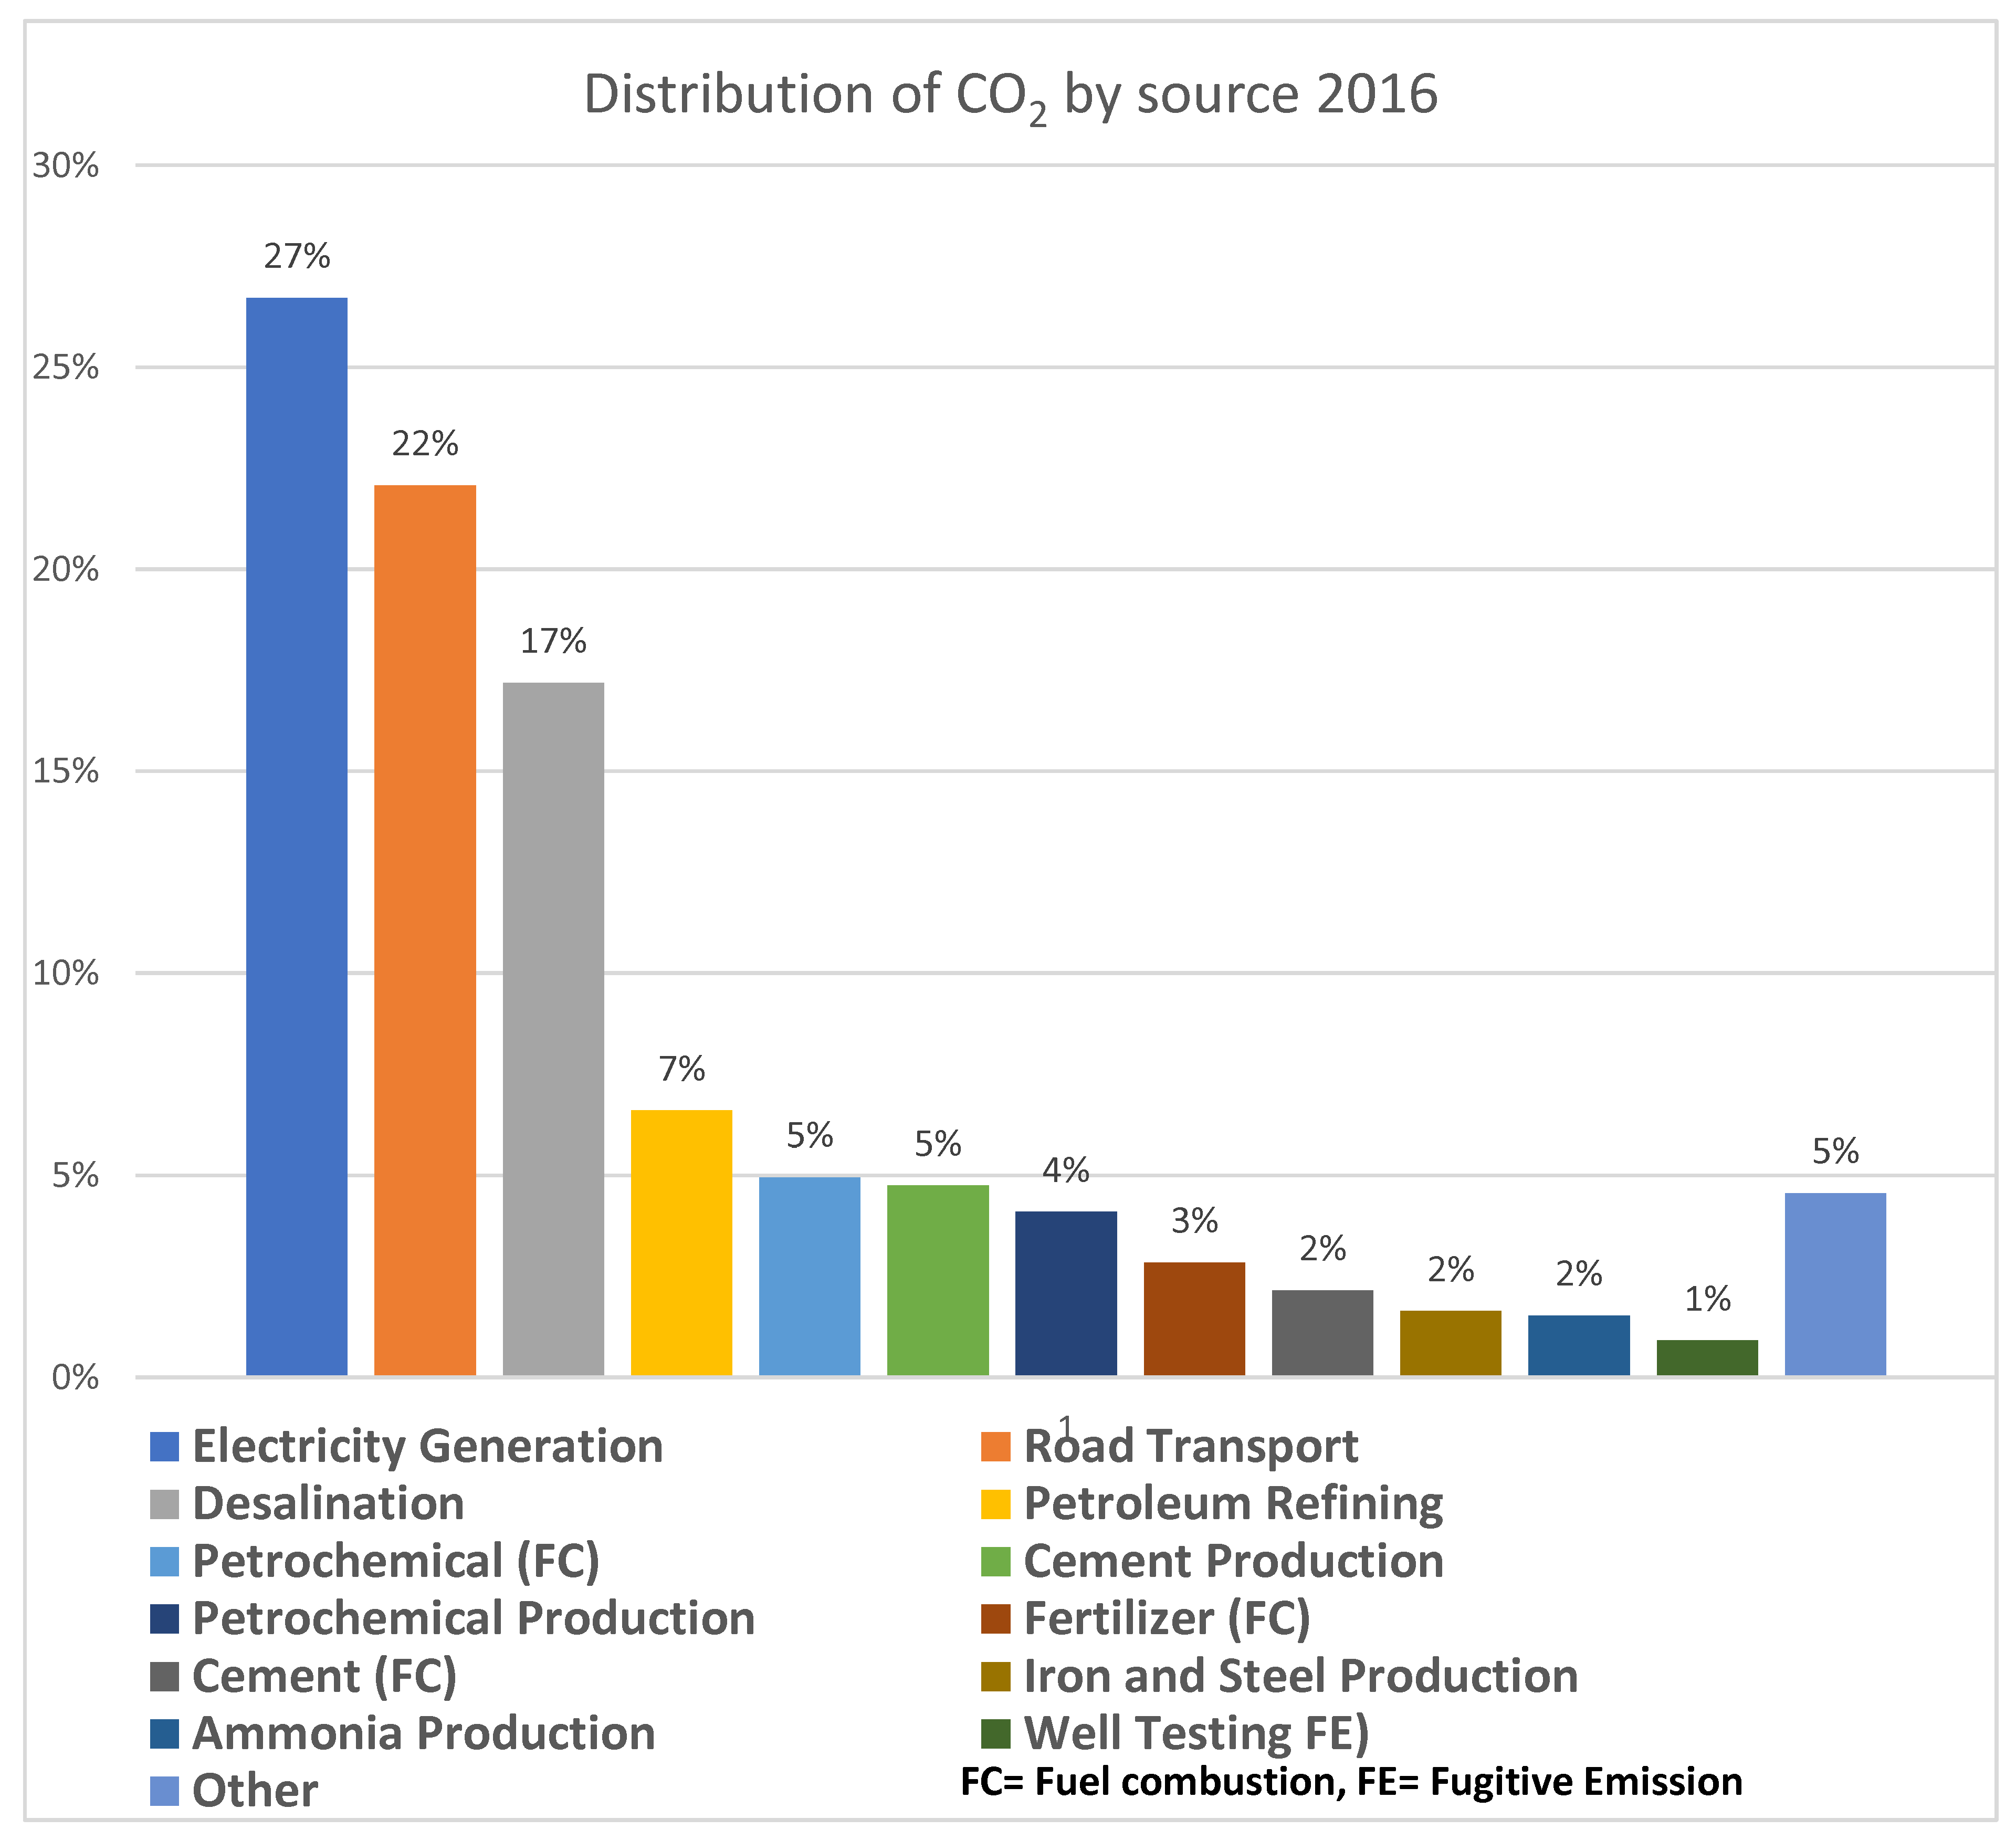
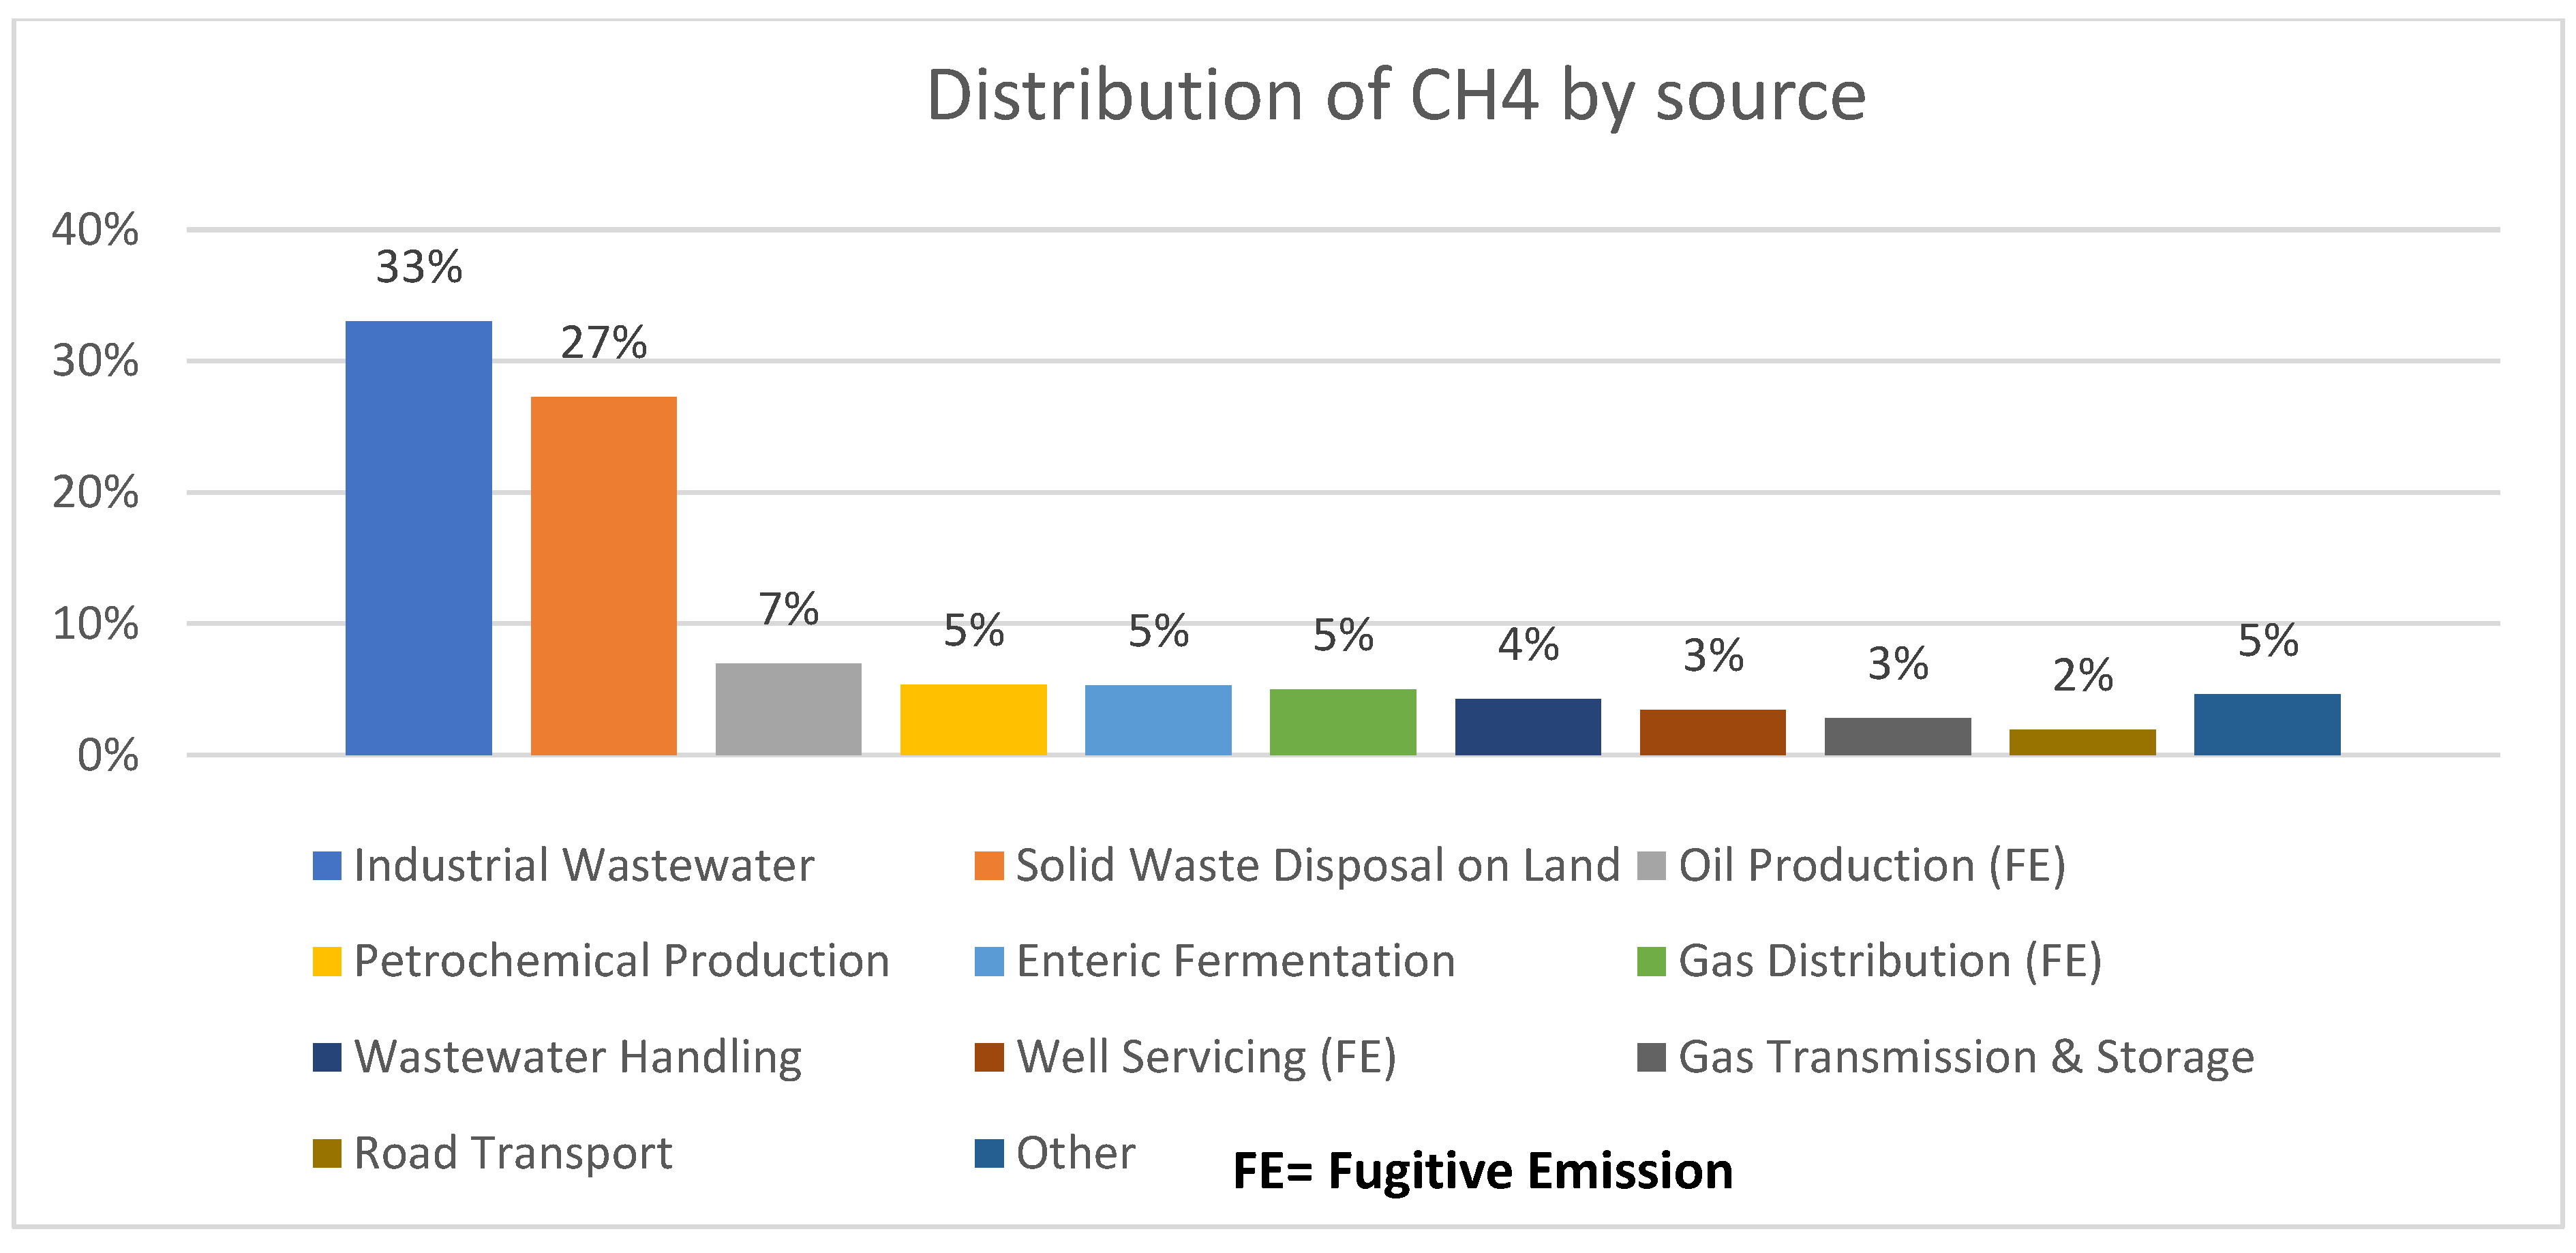
In 2022, Saudi Arabia reported the 2016 national inventory of anthropogenic emissions by sources [31]. The inventory focused on three greenhouse gases, namely, CO2, CH4, and N2O. The net emission after accounting for the sink was 593.55 Mt of CO2, 1.95 Mt of CH4, and 0.03824 Mt of N2O [31]. After the conversion of the CH4 (25 times more potent than CO2) and N2O (300 times more potent than CO2) emissions to CO2eq, the emissions from the three gases added up to 663.8 Mt of CO2eq. The distribution of emissions by sources per the 2016 national emissions inventory [31] for CO2, CH4, and N2O are shown in Figure 3, Figure 4 and Figure 5, respectively.
The World Bank reports that Saudi CO2 emissions were 15.3 tons per capita in 2019 [32]. According to the European union‘s Joint Research Centre, the estimated Saudi CO2 emissions in 2020 were approximately 588.81 Mt and 16.9 Mt per capita [33]. The United Nations Environmental Program’s (UNEP) website reports that the Saudi GHG emissions in 2018 were 22.37 tons per capita, and the total GHG emissions were 750.60 Mt [34]. In 2020, the per capita CO2 emissions in Saudi Arabia reached 17.97 tons, and the total emissions of 625.51 Mt [35]. In 2019, the total GHG emissions, including CH4 and N₂O, were 744.76 Mt of CO2eq [35]. Figure 6 shows the distribution of GHG emissions in 2019 by sources.
The estimate of total GHG emissions in Figure 6 is close to UNEP’s 2018 estimate. Nevertheless, Figure 6 shows that 11% of the emissions come from fugitive emissions, which is high. The Saudi 2016 national inventory allocates less than 1% for fugitive gases from well testing. Figure 6 provides categorizations of the GHG emissions that might not be a true reflection of the Saudi economy. For example, the oil industry, which is significant within the Saudi economy, is not considered a standalone source of emissions. Accordingly, the Saudi 2016 national emission inventory classification of emission sources is more appropriate for analyzing and forecasting Saudi emissions.
The UNEP’s estimate was used as a basis for the analysis (worst-case scenario). The analysis assumes that the GHG emissions were 750.6 Mt of CO2eq in 2018 since there are no more recently published figures.
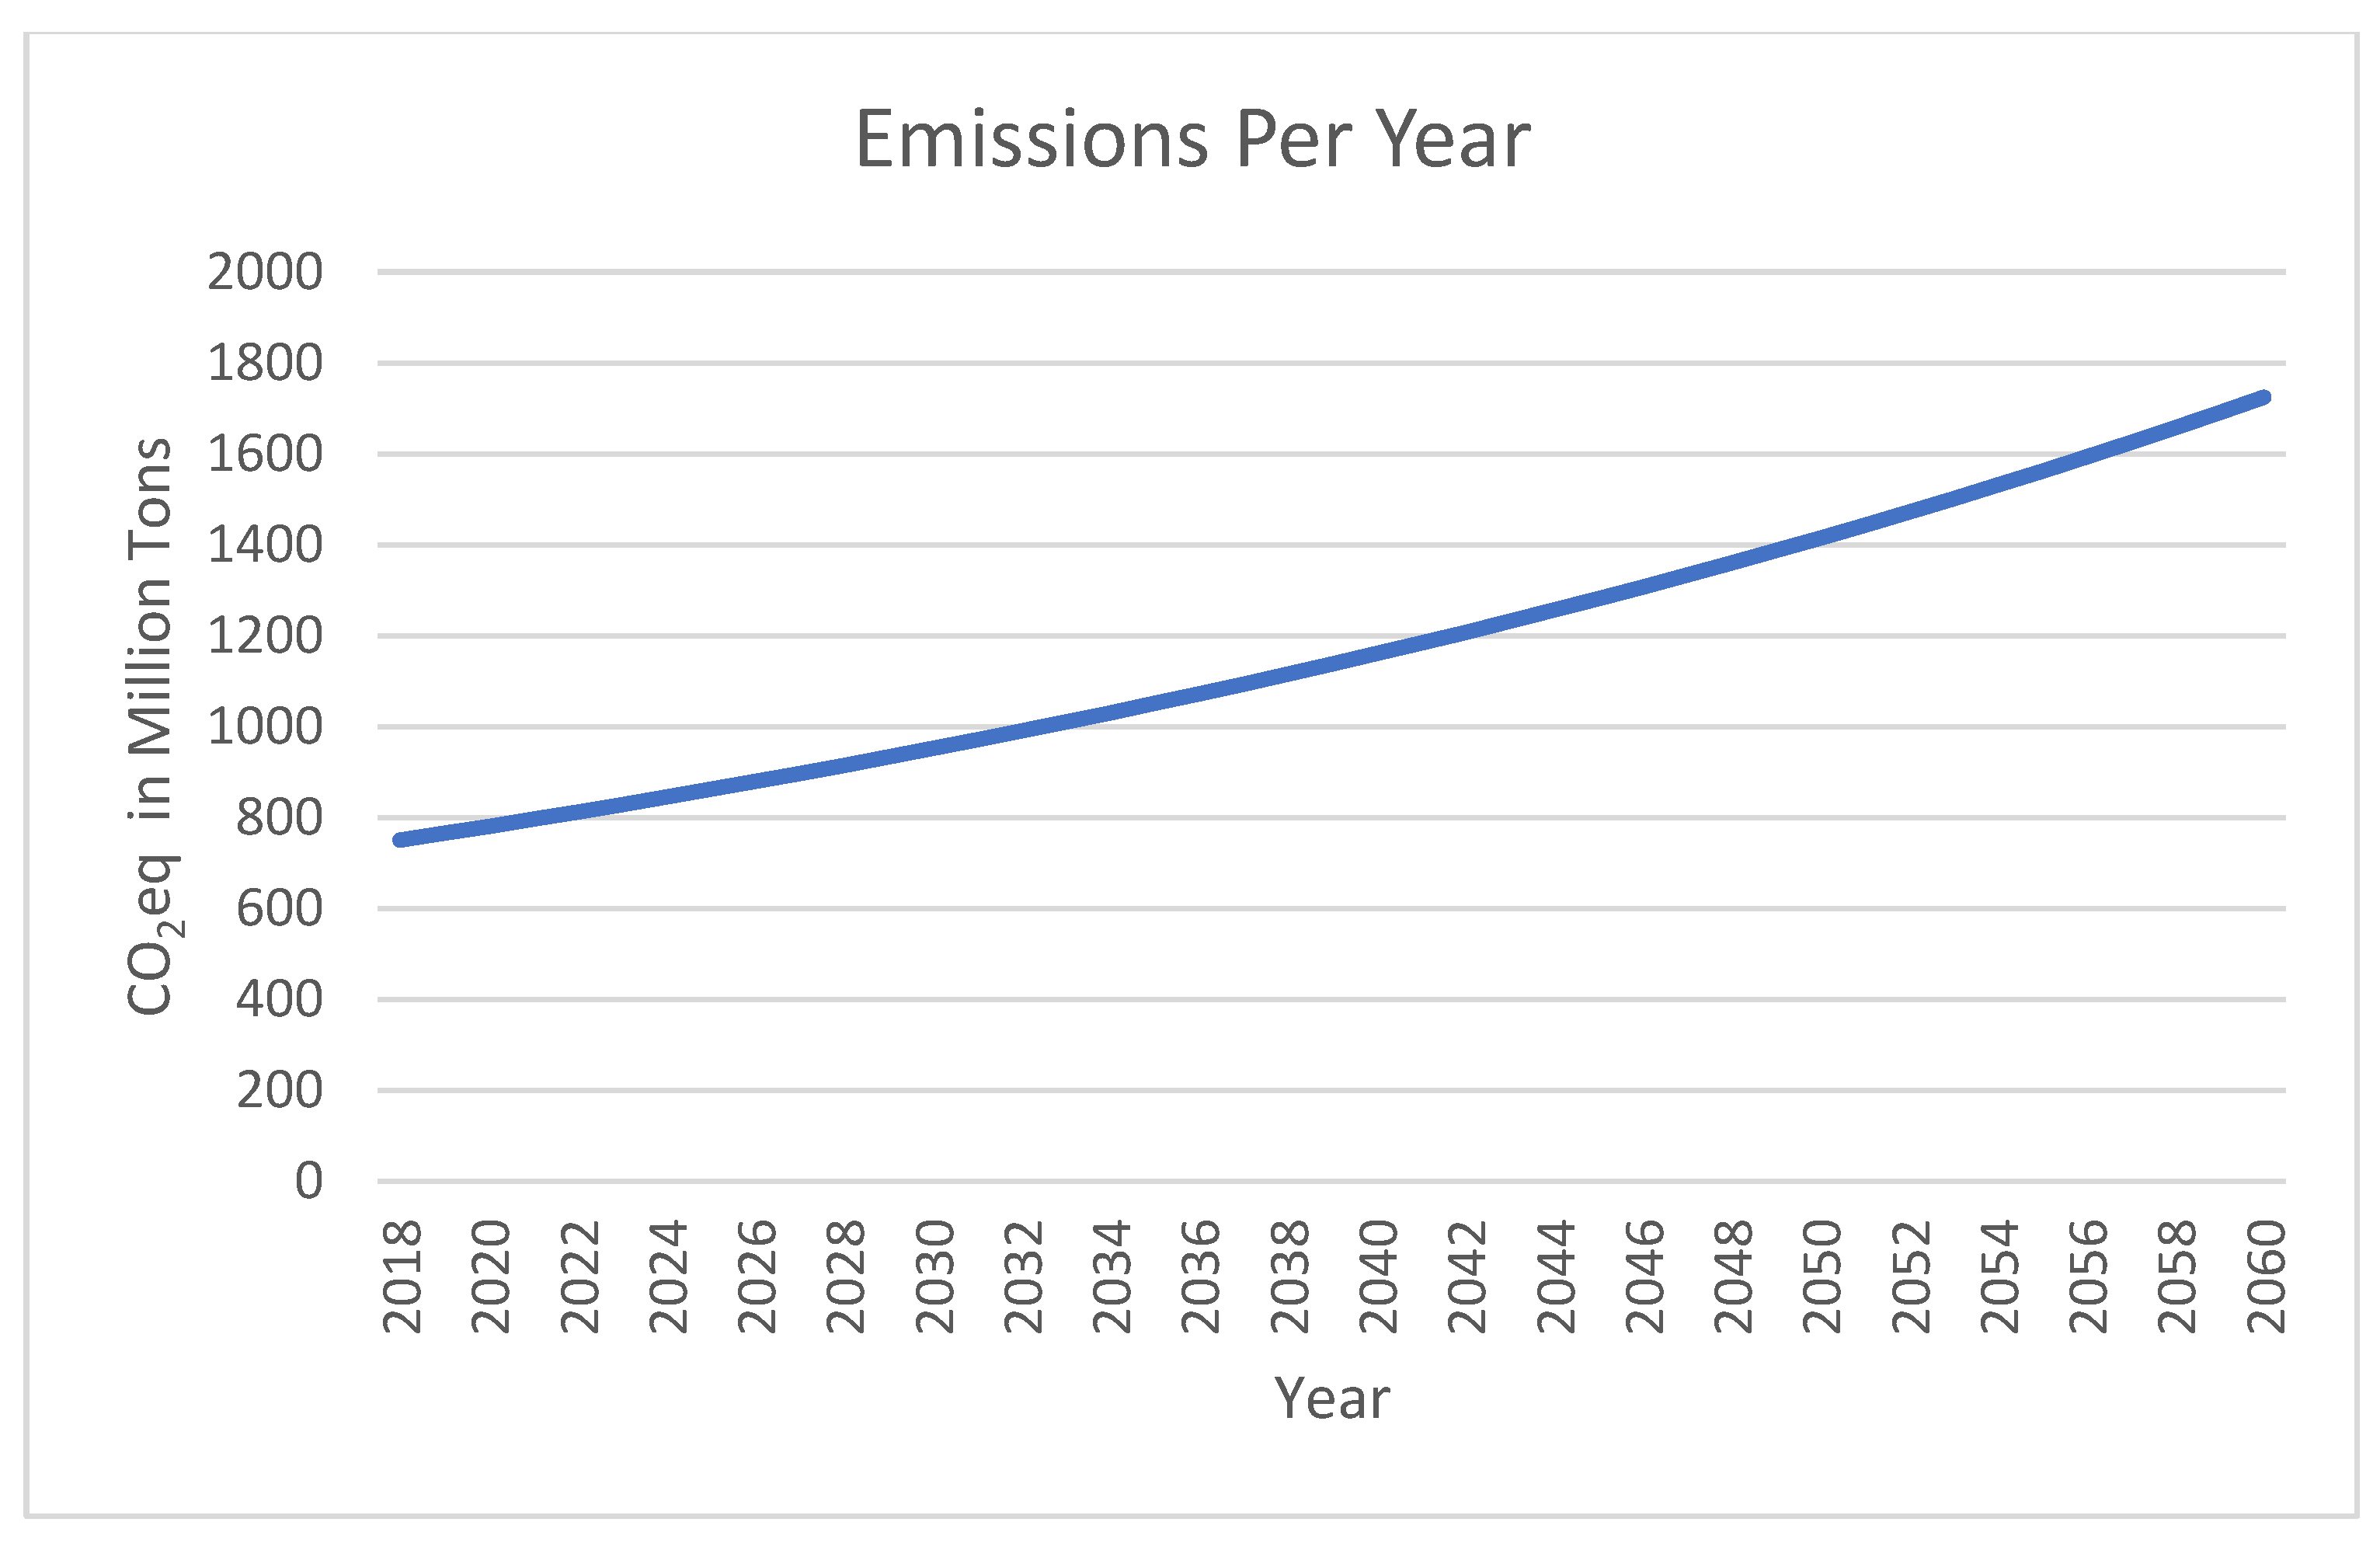
There is a correlation between energy consumption and economic growth [36]. In fact, industrial energy combustion increases with economic growth, while transport and desalination increase as the population increases. Therefore, considering the business-as-usual (BAU) scenario with a forecast of 2% overall economic and population growth on average, the annual emissions will reach 1724. Mt of CO2eq in 2060. Figure 7 shows the forecasted emission growth under the BAU scenario.
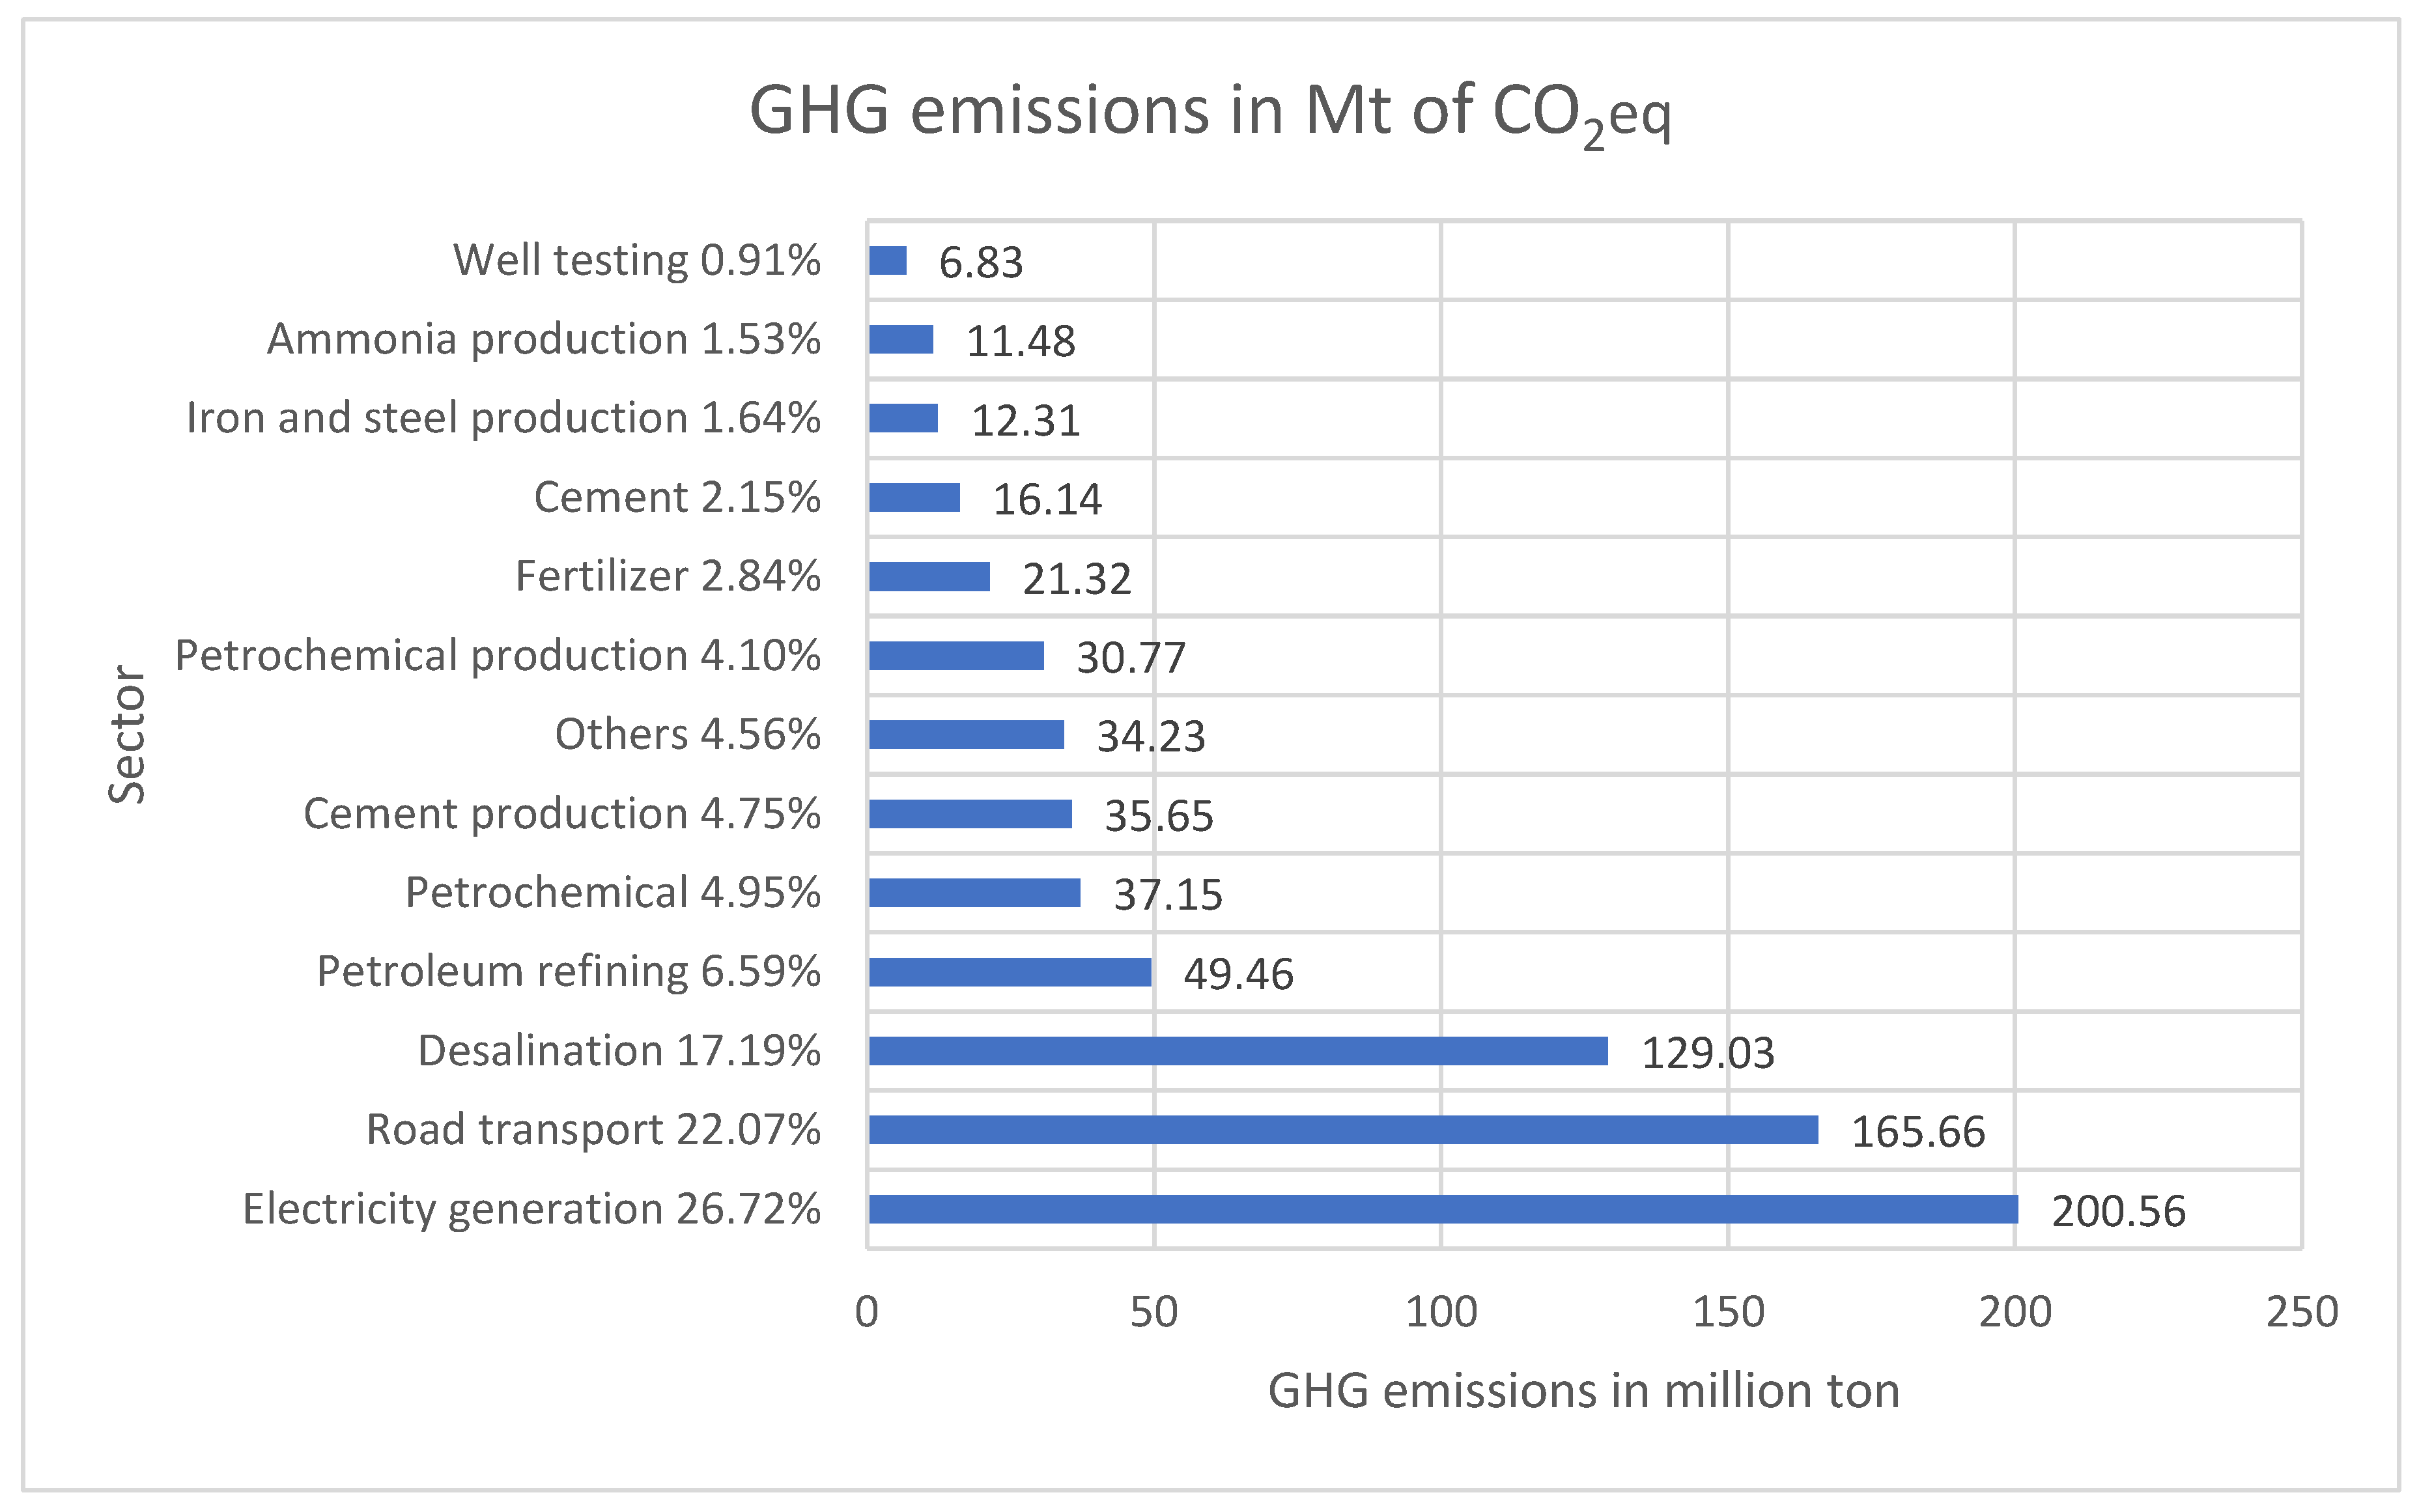
Figure 8 shows an estimate of GHG emissions by sector per UNEP’s estimate of Saudi Arabia’s 2018 GHG emissions and by applying the CO2 distribution percentage of the Saudi 2016 national inventory report since CH4, and N₂O emissions are relatively small and will not significantly impact the precision of the analysis (Figure 3).
The analysis to assess whether the Saudi measures will achieve NZE was conducted by analyzing each source of emissions separately. For the sake of the analysis, petrochemical, fertilizer, petrochemical production, and ammonia production are analyzed jointly since most of those industries are under the leading Saudi petrochemical company (SABIC). Cement production and industries are also analyzed jointly, while well testing is addressed under petroleum refining.

5.1. Electricity Generation

The Saudi Electricity Company’s (SEC) 2021 ESG report indicates that the total GHG emissions were 122.49 Mt of CO2eq for direct generation electricity in 2018 [37]. According to the Saudi General Authority for Statistics, 54.24% of electricity was produced by SEC’s generating plants [38]. Considering that the emissions from other organizations for electricity generation are similar to SEC’s, the total emissions from electricity generation would have been 225.83 Mt of CO2eq. In this study, the estimate for electricity generation is 200.56 Mt of CO2eq in 2018 (Figure 8). The variance between this study’s estimates of emissions from electricity generation and the estimate based on SEC’s audited figures is relatively small (~11%). This gives confidence in this study’s estimated emission distribution among various sectors.
SEC’s ESG report indicates that the total emissions in 2016 were 200.22 Mt of CO2eq from direct and purchased power generation [39]. Nevertheless, the Saudi 2016 inventory indicates that the emissions from power generation were 161 Mt of CO2eq [31]. This discrepancy could be due to the exclusion of electricity generated by desalination plants [31]. The Saudi 2016 national emission inventory classification of emission sources separate electricity generation from desalination, although the two sectors could overlap. Based on the announced emission-reduction measures, the following assumptions were considered to determine GHG emissions from the power industry in 2030:
  • 50% of the power will be from renewable sources by 2030 [20].
  • 50% of the power will be from natural gas by 2030 [30].
  • Currently, renewable energy represents less than 1% of the power industry.
  • Currently, 40% of electricity comes from oil, and 60% comes from gas [18].
  • Natural gas produces 52.91 kg of CO2 per million British thermal units (BTU), while residual heating fuel produces 75.09 kg of CO2 per million BTU [40]. In addition, the standard emission factors based on the average carbon content of crude oil and natural gas are 3.07 tons of CO2 and 2.35 tons of CO2 per ton of oil equivalent, respectively [4]. Many factors determine the reduction in replacing oil with gas for power generation. Nevertheless, it is estimated as a ~30% reduction in CO2 emissions. This means that currently, oil (including diesel and heavy fuel) represents 40% of power generation, while gas accounts for the rest (60%), and the contribution of oil to the total CO2 emissions is approximately 52% in the power industry.
  • The growth in demand until 2030 will remain at approximately 2%. Even if the demand increases by more than 2%, the contribution of the initiatives (e.g., energy efficiency initiatives) would adjust the results. For example, the initiative calls for replacing more than 2.7 million higher-energy sodium vapor light bulbs that illuminate the Kingdom’s roads with modern, more efficient LED units that comply with the energy efficiency standards [41]. The government established the Energy Efficiency Program, which is responsible for the development of new energy efficiency standards in power generation, water desalination, and electricity transmission and distribution [42]. On the contrary, the statistics over the past few years show an annual increase in demand for electricity of <2% [37].
Table 1 shows the forecast of GHG emissions from electricity generation under a BAU scenario.
Per the plans, electricity generated from oil will be replaced by renewable energy by 2030. At the same time, the contribution of gas to generating electricity will decrease from 60% to 50%, meaning that approximately 20% of the gas will also be replaced by renewable energy. Therefore, by 2030, CO2 from oil will be zero, and that from gas will be reduced by 16.67%. This lowers the GHG emissions from 254.36 Mt of CO2eq under BAU to 101.6 Mt of CO2eq.
From 2030 to 2060, the Saudi government will most likely continue to expand the replacement of electricity generated from gas with renewable or sustainable resources. The Saudi government is planting seeds to introduce more sustainable energy resources, such as nuclear energy.
The government allocated huge investments (384 billion USD) in renewable energy to reach a capacity of 123 GW by 2032. Solar energy will contribute 52 GW; nuclear energy will contribute 46 GW, concentrated solar power will represent 5 GW, and wind power 2 GW [43]. In addition, the government will continue to replace heavy fuel power generators with combined cycle gas turbines, gas turbine cogeneration, steam, steam cogeneration, and open cycle gas turbines until 2032 [43]. Saudi Arabia’s National Renewable Energy Program aims to achieve 58.7 GW of renewable energy capacity by 2030. The Sudair Solar Voltaic power plant will be the largest solar power plant globally and should result in reducing carbon emissions by 2.9 Mt annually [41].

5.2. Road Transport

Reducing GHG emissions from the transport sector is a challenging area. The country, as an importer of vehicles, depends on international technology when it comes to engine efficiency and EVs. Nevertheless, one of the strategies for reducing carbon emissions is to expand public transportation and railway networks to connect major cities and ports [42]. In 2022, Saudi Arabia announced its plan to expand the rail network by adding 8000 km of new tracks to the existing 3650 km of rail tracks [44]. In addition, the Riyadh Metro (electric train) is about to operate. It is projected that the Metro will decrease the number of car trips by 250,000 trips per day, reducing fuel use by approximately 400,000 L of fuel per day and further diminishing CO2 emissions [45].
Saudi Arabia used to subsidize domestic energy until 2018, when the government began reforming energy processing. The significant increase in gasoline and electricity prices provided both economic and environmental benefits [18].
Internal combustible engine vehicles are expected to still constitute most of the driven vehicles in the next 15 years [46]. Accordingly, CO2 emissions from the transport sector will remain almost the same until 2030 because the expansion in public transportation and the contribution of hybrid and EVs will offset any potential growth. In the worst-case scenario, in 2060, GHG emissions from the transport sector will not exceed 20% of 2020′s emissions (33.2 Mt per year) as a result of abandoning combustion engines and shifting to EVs.
The government’s measures to expand public transportation, the effect of deregulating gasoline prices, and the improvement of new vehicles’ fuel efficiency will most likely set off the growth of the number of vehicles as the population increases. After 2035, CO2 emissions from the transport sector will start declining as a result of ceasing the production of combustion engines by major vehicle manufacturers [47]. In addition, the European Union approved ending the sale of vehicles with combustion engines by 2035 in Europe, which will cause a worldwide domino effect, impacting the vehicle manufacturing industry [48]. Most likely, after 2040, combustion engine vehicles will be phased out globally and will be replaced by EVs. The period 2040–2060 is long enough to replace combustion engine vehicles with EVs in Saudi Arabia.

5.3. Desalination

In 2017, approximately 4 million m3 of desalinated water was produced daily using desalination technologies, including multi-stage flashing (MSF), multi-effect desalination (MED), and reverse seawater osmosis (SWRO). In 2020, around 77.5% of the seawater production was produced by MSF, 20.5% by reverse osmosis (RO), and 2% by MED-thermal vapor [49]. Both MFS and MED are energy-intensive technologies [4].
Saudi 2021 NDCs indicate the plan to deploy new desalination technologies to minimize GHG emissions, including:
  • RO technology.
  • Renewable energy for seawater desalination.
  • Minimizing leaks in the potable water distribution system.
  • Increasing the use of treated wastewater.
  • Rainwater harvesting.
  • Storage of surface water runoff.
  • New irrigation techniques.
The estimated GHG emissions from desalination were 129.5 Mt in 2018 (refer to Figure 8). The annual demand for desalinated water will continue to increase. It is difficult to quantify the impact of the measures that the Saudi government is pursuing on the reduction in CO2 emissions from desalination. By taking a conservative stance, the measures proposed in the 2021 NDC and the project to expand solar energy in desalination could at least set off any increase in demand.
In 2021, SWCC announced that it would successfully manage to reduce CO2 emissions by 28 Mt annually by gradually dispensing thermal desalination plants and replacing them with RO technology [50]. In addition to this reduction, the Saudi plan to generate more than 120 GW from renewables by 2032 will reduce the need for MSF and MED desalination plants [43] since there will be no need for by-product electricity.
By 2030, CO2 emissions from desalination could be lowered by more than 28 Mt, mainly from expanding the application of RO technology. This brings CO2 emissions from desalination to 101.5 Mt of CO2eq in 2030. By then, the nuclear energy program will be mature, playing an important role in employing nuclear energy in desalination plants. This could lead to the elimination of fossil fuels from the desalination industry and associated CO2 emissions, achieving NZE by 2060.

5.4. Petroleum, Refining, and Well Testing

The estimate of the petroleum refineries and well-testing emissions is 56.49 Mt of CO2eq (refer to Figure 8). This sector is dominated by the Aramco company. In October 2021, the company announced its goal to achieve NZE scopes 1 and 2 GHG emissions across its wholly-owned operating assets by 2050, which complements Saudi’s aim to reach NZE by 2060 [51]. In 2021, the company emitted 52.3 Mt of CO2eq pertaining to scope 1 and 15.5 Mt of CO2eq regarding scope 2 [51].
The company is planning to achieve its NZE goal through the following measures:
  • Energy efficiency through several approved initiatives, including gas turbine upgrades and boiler and heater efficiency improvement.
  • Methane and flaring. The company is committed to reaching zero routine flaring by 2030.
  • Renewables. The company is investing in 12 GW solar PV and wind projects. It is working with its affiliates in investing in renewables and is also evaluating contributing 2.3 GW to renewable projects.
  • CCUS. The company has set a goal of developing its CCUS capacity to capture up to 11 Mt of CO2eq by 2035.
  • Offsets. The company is planning to plant 300 million mangroves nationally and 350 million mangroves abroad by 2035.
Co-generation technology is employed to harness what could be wasted energy to fuel combustion and convert it into power and steam, ultimately improving thermal energy efficiency and reducing emissions. In addition, the company is working on low-carbon fuels, where CO2 captured from industrial processes or directly from the air is combined with green hydrogen, reducing CO2 emissions by at least 80%. This is another initiative in line with CCE [51]. The company is partnering with another energy company in a demonstration-scale project to explore the production of 2.6 million liters of low-carbon synthetic diesel and jet fuel per year for automobiles and aircraft.

5.5. Petrochemical, Fertilizer, and Ammonia Industries

The CO2 emissions from the petrochemical, fertilizer, and ammonia industries were 37.19 Mt of CO2eq, 21.31 Mt of CO2eq, and 11.48 Mt of CO2eq, respectively, in 2018 (refer to Figure 8). Rahman et al. [52] indicated that the total emissions of CO2 from the petrochemical industry were 25.19 Mt in 2020, representing direct emissions (scope 1). In addition, the year 2020 was an outlier due to the impact of COVID-19 on the industries. Rahaman et al. [52] calculated the emissions by applying the 2006 IPCC Guidelines for National Greenhouse Gas Inventories [5], where the protection of petrochemicals was multiplied by emission factors. This method provides a precise estimate with less uncertainty. Nevertheless, this study’s parametric estimate could be more appropriate for predicting future trends.
SABIC’s 2021 sustainability report indicates that the total CO2eq emissions (scope 1) in 2020 were 29.56 Mt without its affiliates and ~54 Mt with its affiliates [53]. Although SABIC is mainly a petrochemical company, it has full ownership of the Saudi iron and steel company, which is the largest steel producer in the Middle East with a capacity of around 6 Mt [54]. In 2020, the Saudi iron and steel company produced 4.5 Mt of steel [55]. For every ton of steel production, an average of 1.85 tons of CO2 is emitted [56]. This means that 8.33 Mt of CO2 emissions were not from the petrochemical industry.
In 2020, the International Energy Agency indicated that Saudi Arabia had reduced its electricity carbon emissions factor by 27% in one year, mainly due to SABIC’s scope 2 emissions (80%). Accordingly, SABIC managed to reduce scope 2 emissions by 2.39 Mt [53].
In 2021, SABIC committed to reaching NZE by 2050. As an interim goal, the company aims to reach a 20% reduction in GHG emissions (scopes 1 and 2) by 2030 [53].
In 2021, the company managed to lower emissions by 5.8% compared to 2020, with reductions of 2% in scope 1 and 13.7% in scope 2 emissions [53]. The latter was largely due to lowering the carbon emission from electricity [53].
In 2021, another major petrochemical company in Saudi Arabia managed to lower direct GHG emissions by 5.46% (scope 1) compared to 2020 and achieved a 29.94% reduction in indirect GHG emissions (scope 2) from grid electricity consumption [57].
By 2050, SABIC and other petrochemical companies will have successfully achieved their NZE target. Until 2030, the reduction will remain gradual since technological advancements are time-consuming. SABIC managed to lower its absolute GHG emissions by more than 3 tons from 2020 to 2021 [53]. This indicates that it will lower overall emissions by more than 15 Mt by 2030 and bring the total emissions to approximately 37 Mt. Some small petrochemical companies might have difficulties in reducing their emissions.
It is essential for Saudi petrochemical companies to have a high ESG rating to maintain their competitive edge since they sell their products in the international market.

5.6. Petrochemical Production

In 2018, the estimated emissions from petrochemical production were 30.77 Mt of CO2eq (refer to Figure 8. This industry is shared between SABIC and the private sector. The company will work on reducing emissions according to its pledge to reach NZE by 2050. The current regulations do not force the private sector to take serious steps in reducing emissions. The literature does not provide data regarding market share distribution among producers. As an estimate, the private sector could represent approximately 40% of the petrochemical production, and in the worst-case scenario, none of the private sector producers will work on reducing their emissions, with an average of 2% production growth per year. Applying those assumptions, the emissions from the petrochemical production industry could reach 28.27 Mt of CO2eq by 2060 (Figure 9).

5.7. Cement Production and Industries

In 2018, the estimated emissions from cement production and cement industries were 4.75% and 2.15%, respectively (refer to Figure 8) [31]. This study estimated CO2 emissions from cement production and cement industries in 2018 as 35.65 Mt of CO2eq and 16.14 Mt of CO2eq, respectively.
There are 17 cement manufacturers that have a capacity of over 71 Mt per year [52]. As for scope 1, the carbon emission factor for cement is 0.52 tons of CO2 per ton of produced cement [52]. The direct emissions of the cement manufacturers when they operate at full capacity is 36.92 Mt of CO2eq. Rahman et al. [52] indicated that CO2 emissions from the cement industry corresponding to scope 1 were 27.69 Mt in 2020.
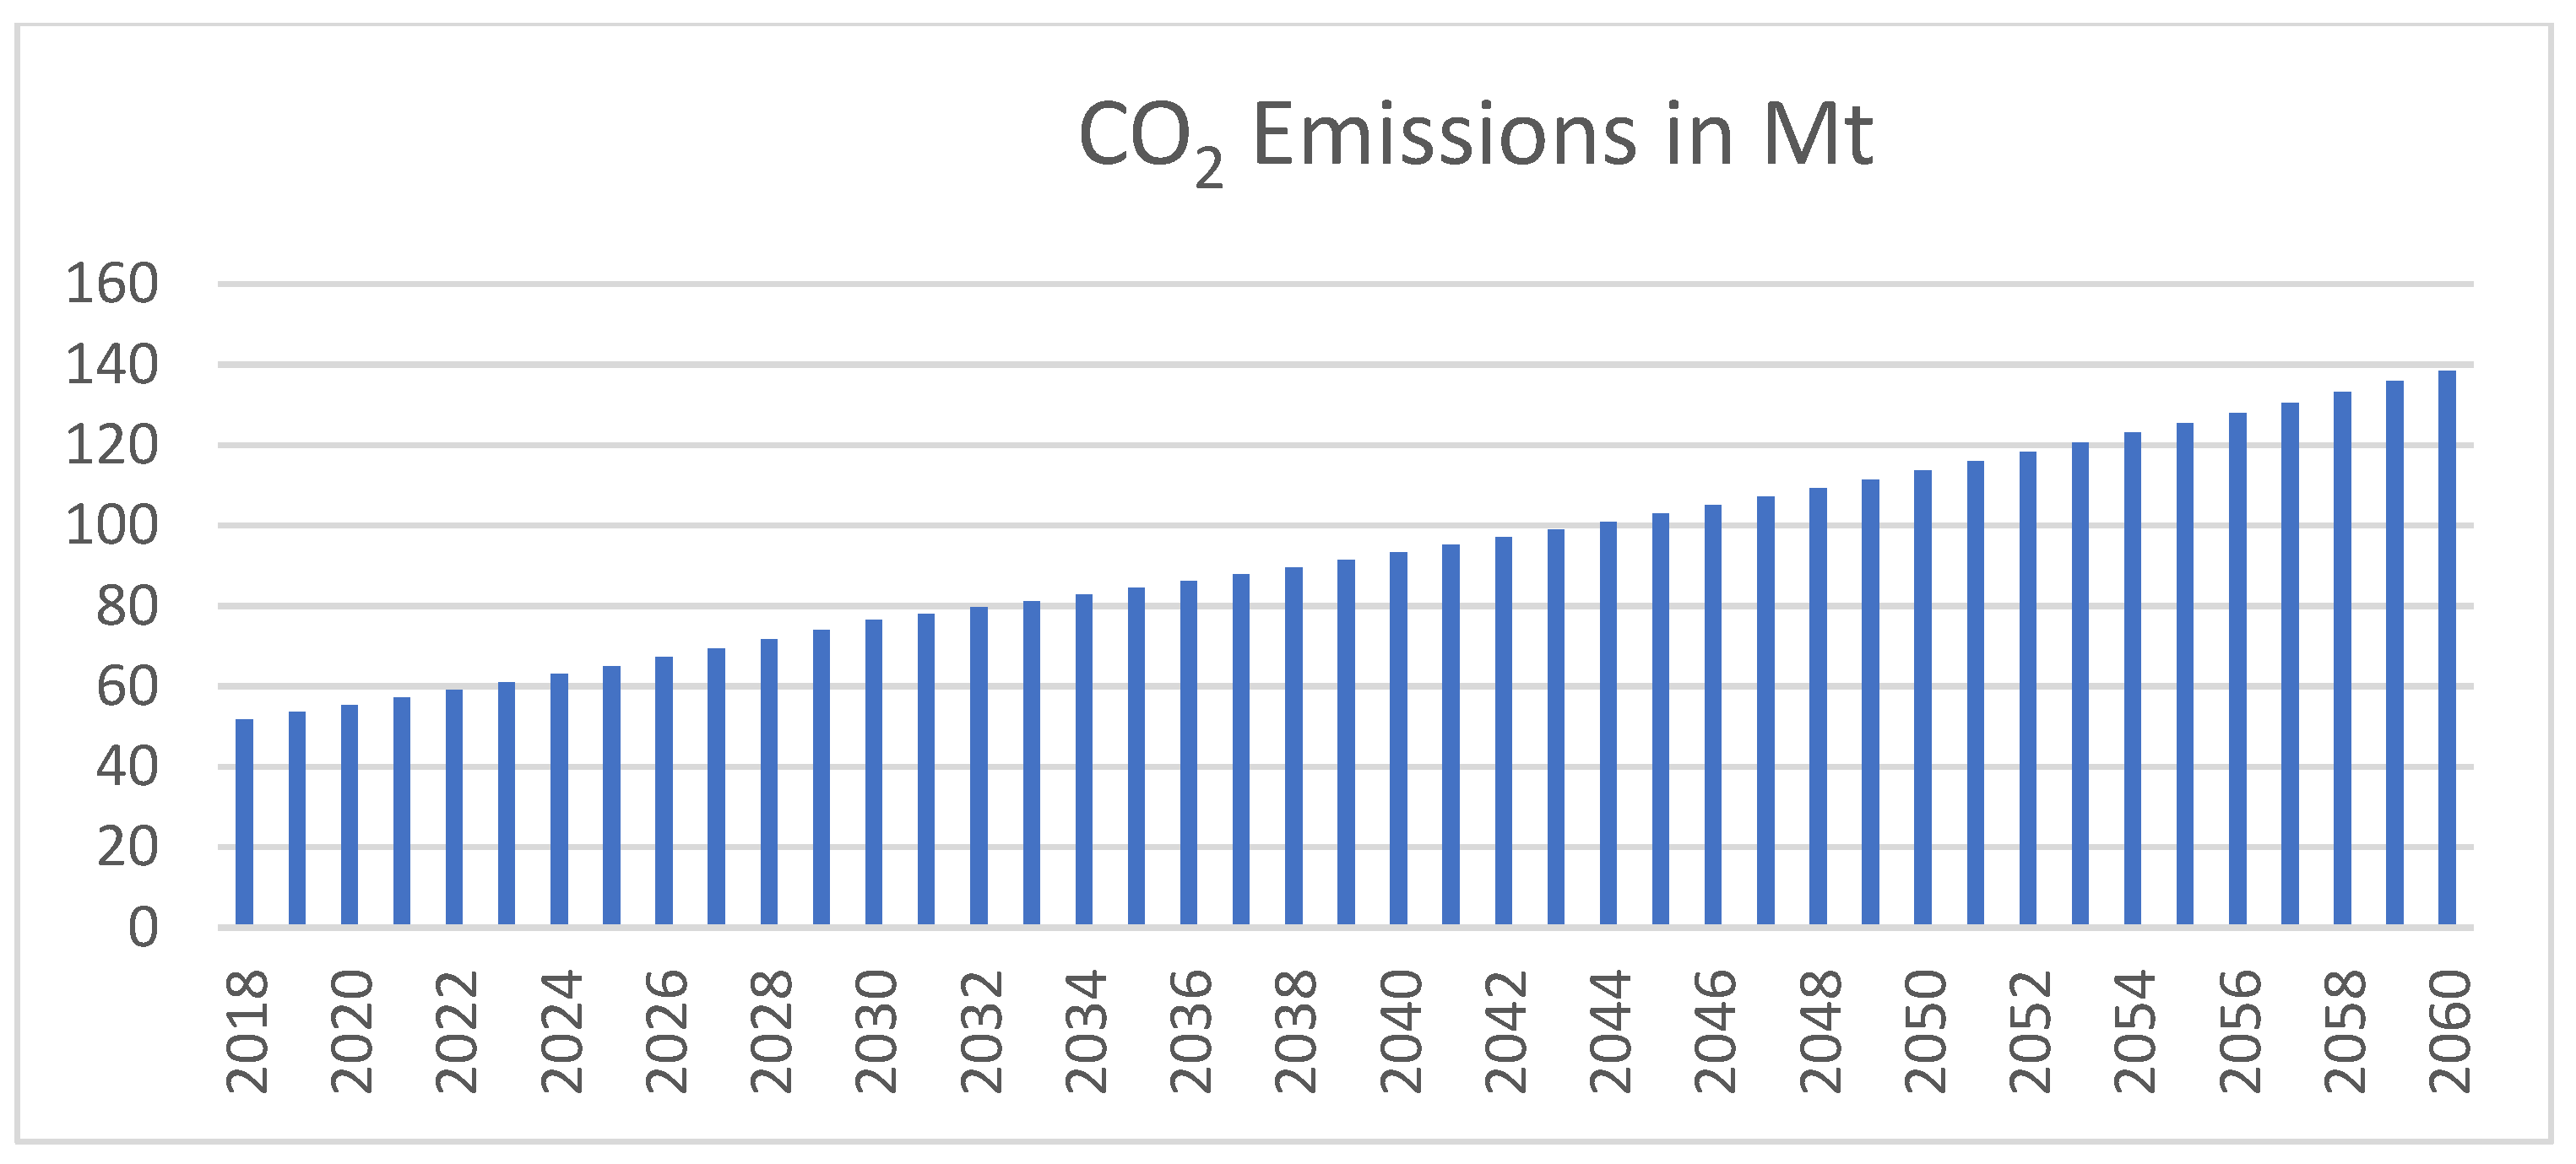
With the megaprojects that are currently under construction, the demand for cement will continue to grow until 2030. In 2022, the inflation trend capped the cement demand. Historically, the demand for cement fluctuated such as that for any other construction material [58]. The current cement manufacturers are not working at full capacity. It is predicted that the annual growth in demand will be, on average, 3.3% and most likely will drop to 2% after 2030 when the Saudi vision 2030′s projects will have been completed. These assumptions were used to forecast the emissions from the cement industry (including cement production). Accordingly, it is estimated that CO2eq emissions will reach 76.46 Mt of CO2eq in 2030 and ~138.5 Mt of CO2eq in 2060 (Figure 10).
The future increase in demand requires an expansion in production capacity, which will potentially introduce more environmentally friendly technology.

5.8. Steel and Iron

There are six major steel manufacturing companies across the country. This study estimated that CO2 emissions from the steel and iron industry were around 12.31 Mt in 2018 (Figure 8). Rahman et al. [52] estimated CO2 emissions of 13.104 Mt of CO2eq for the same industry in 2020, when the total steel production was 7.8 Mt [59].
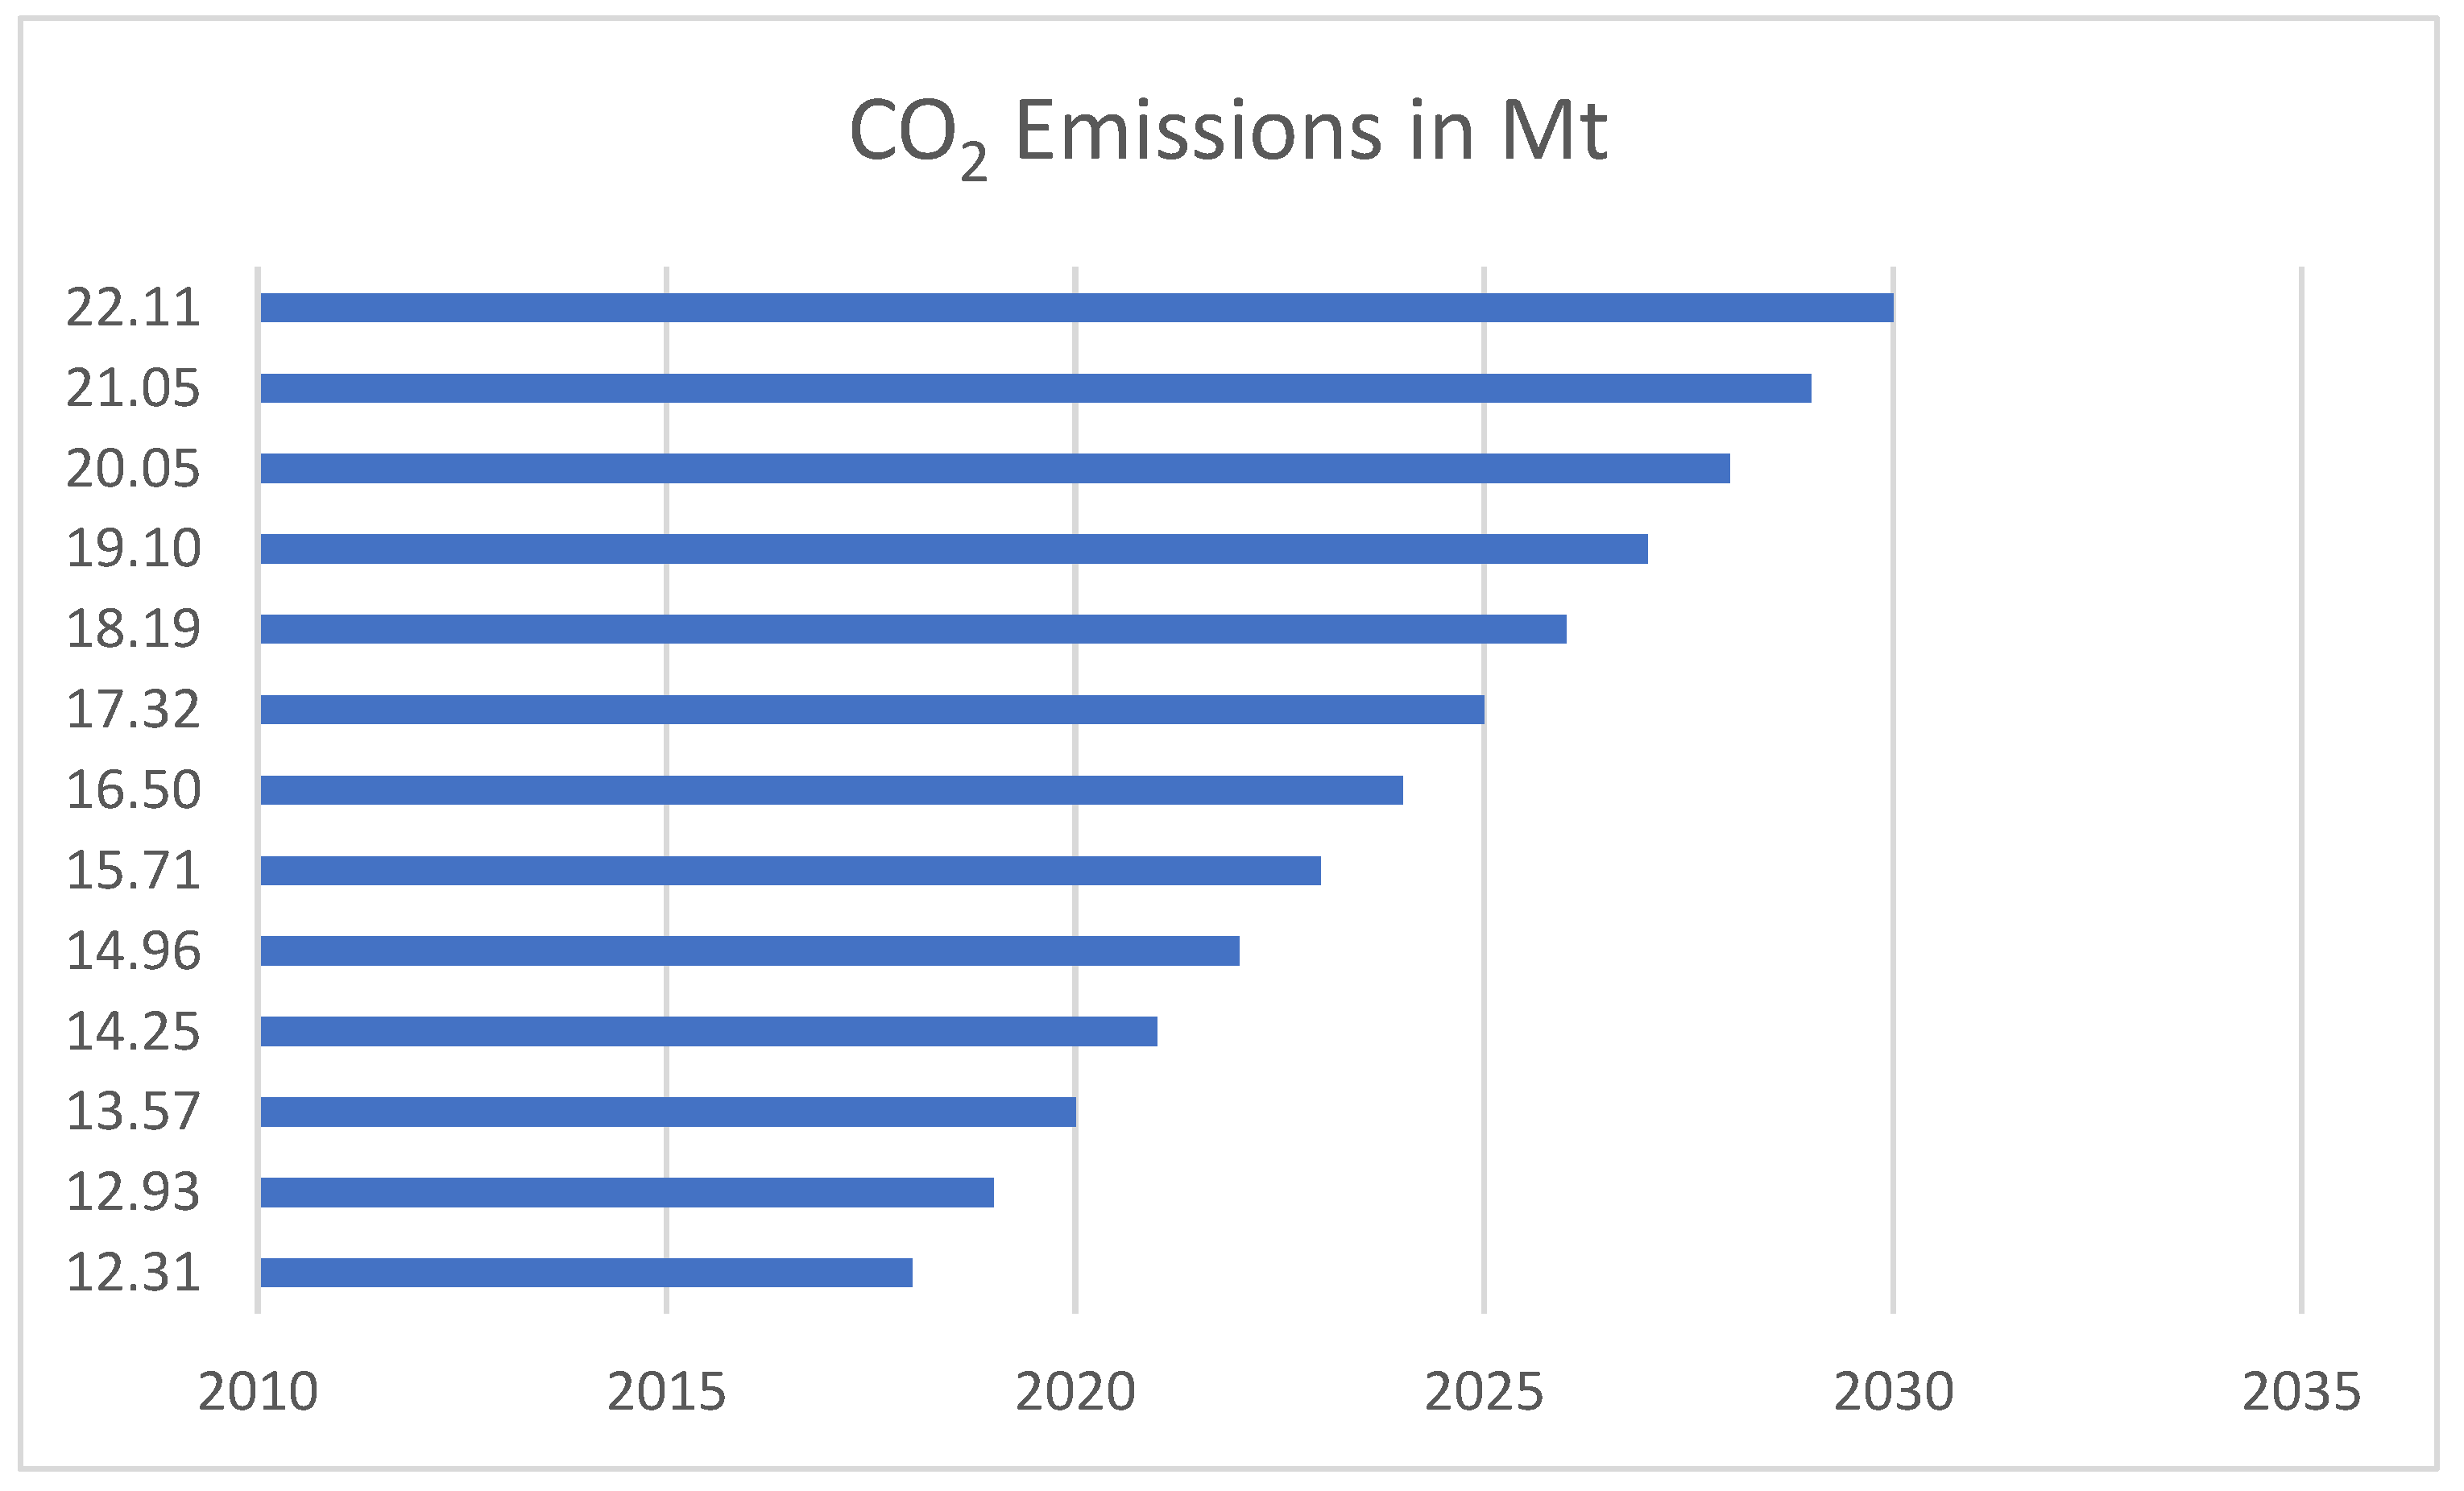
The steel demand will remain high until 2030 since many megaprojects are under construction. By taking the BAU scenario with the assumption of a 5% annual growth of demand, the total emissions from the iron and steel industry will reach 22.11 Mt by 2030 (Figure 11).
In the case of the largest iron and steel company, the emissions will decrease by 20% by 2030 following the SABIC’s group planned goals. Therefore, the estimated emissions from the iron and steel industries will be 16.59 Mt of CO2 by 2030.
After 2030, the annual growth of the demand for iron and steel will probably drop from 5% to 2%. In order to forecast the CO2 emissions of iron and steel companies after 2030, the following assumptions were made:
  • The growth in demand will be approximately 2%.
  • The Saudi iron and steel company added will still dominate 45% of Saudi production.
  • SABIC will fulfill its pledge and reach NZE by 2050. Subsequently, the Saudi iron and steel company, which is fully owned by SABIC, will reach NZE by 2050.
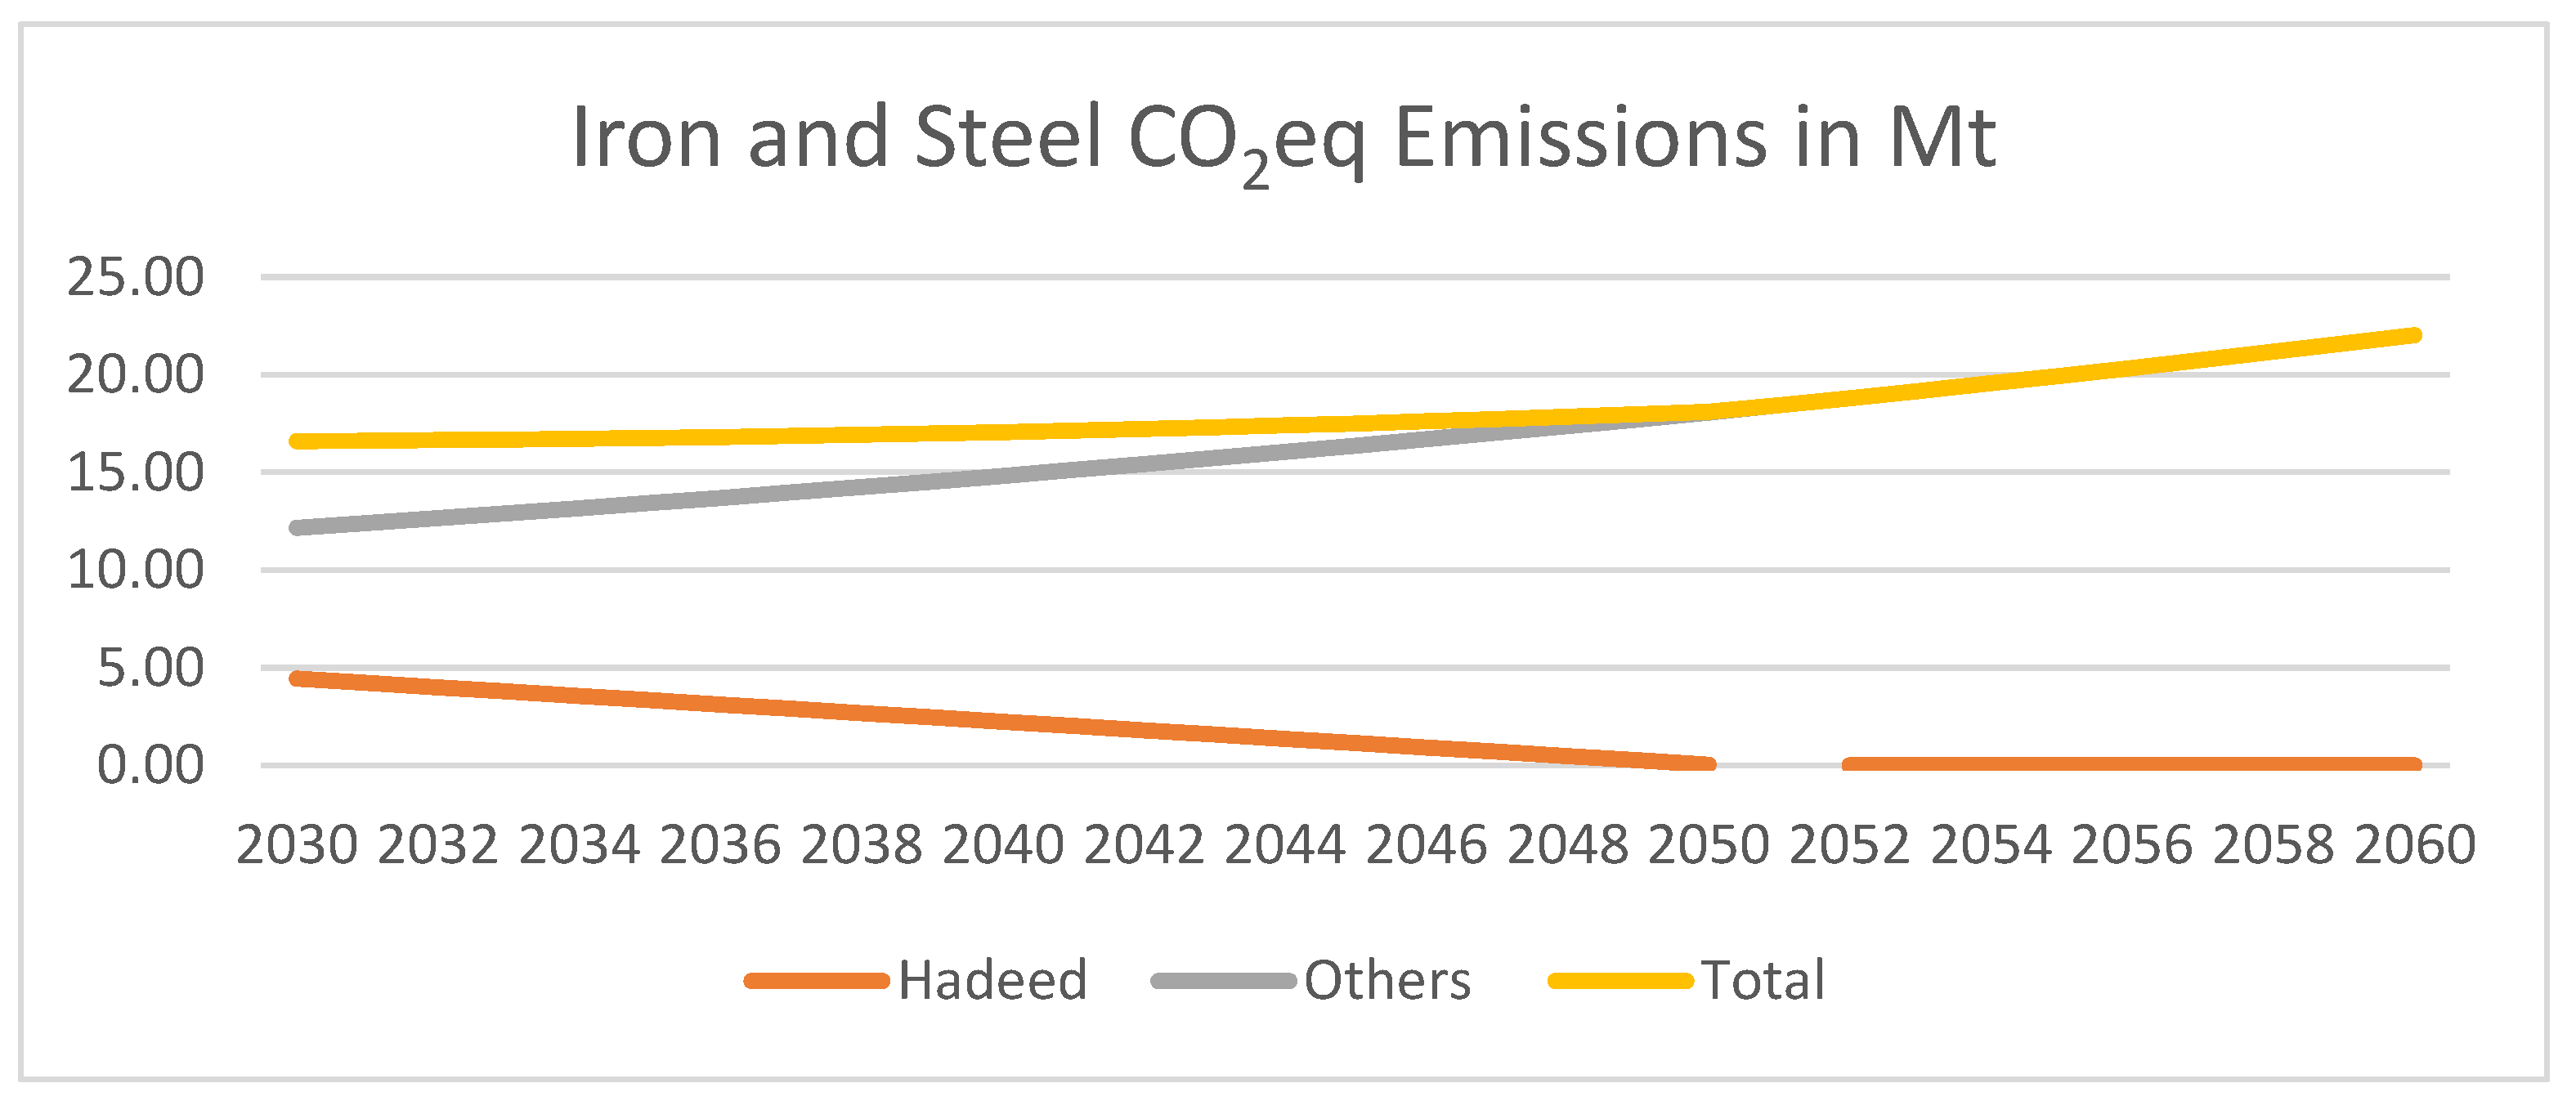
  • Hadeed (the largest steel company) emissions will decrease evenly from 2030 until reaching NZE by 2050. The other companies will not make a significant reduction in emissions.
Based on these assumptions, by 2060, GHG emissions of the iron and steel industry will reach 22.07 Mt of CO2eq. Figure 12 shows the trend of GHG emissions until 2060.

5.9. Other Sources (Miscellaneous)

Other sources of emissions include agriculture, navigation, the residential industry, aviation, aluminum production, and other industries [31]. The estimated CO2 emissions in 2018 that fall under this category were 34.23 Mt (refer to Figure 8). Under the BAU and worst-case scenarios, the increase will not exceed 2% per year due to government measures and public awareness. Accordingly, it is predicted that these emissions will reach 43.41 Mt of CO2eq in 2030 and 78.63 Mt of CO2eq in 2060.

5.10. Carbon Sink

Regardless of the efforts to reduce or eliminate emissions from sources and human activities, there will always be released from various sources that are beyond human control. Therefore, NZE cannot be achieved unless a carbon sink is created. Accordingly, Saudi 2021 NDC indicates that multiple adaptation measures will be taken with a mitigation co-benefit [20]. Among the adaption measures that will have a significant impact on mitigation are the following [20]:
  • Marine protection. Saudi Arabia is encouraging the plantation of mangrove seedlings along its coasts. Studies have been conducted to estimate the outtake of mangroves and other blue carbons for the Red Sea and the Arabian Gulf.
  • Reduced desertification and tree planting. As part of its green initiative, Saudi Arabia is planning to create a green carbon sink by planting trees and rehabilitating hectares of land.
In 2021, the government launched the Saudi Green Initiative. The activities that will be implemented under the Green Initiative will constitute a national carbon sink. The initiative aims to plant (afforestation) 10 billion trees and rehabilitate 40 million hectares of land [42]. Achieving this ambitious plan will provide multiple benefits, including improved air quality, reduced sandstorms and desertification, and a lowered temperature within the vicinity of the planted area. So far, over 10 million trees have been planted across the country [42].
By 2030, under the Saudi Green Initiative, 450 million trees will have been planted across Saudi Arabia [42]. Nevertheless, this study developed an estimate of the potential levels of sequestered carbon based on the number of trees under each initiative.
Some estimates of the carbon sequestered by a tree range between 10 kg to 40 kg per tree per year, and the average are ~25 kg/tree/year. As a parametric estimate and the assumption that each tree will sequester 2020 per year, the afforestation plan will result in a green carbon sink with a capacity of 9 Mt of CO2eq every year by 2030, and this capacity will reach 250 Mt of CO2eq sequestration once the journey toward 10 billion trees is completed. If the government succeeds in maintaining the current momentum, the 10-billion-trees journey will be completed before 2060.
In addition, Saudi Arabia plans to install Carbon Capture Utilization and Storage (CCUS) hubs at Jubail and Yanbu, homes for major industries in Saudi Arabia, such as petrochemicals, steel, and other heavy industries. CCUS started operating in 2015 to capture CO2 from natural gas processing with a capacity of 0.8 Mt of CO2 per year [13].

5.11. Overall Future Emissions

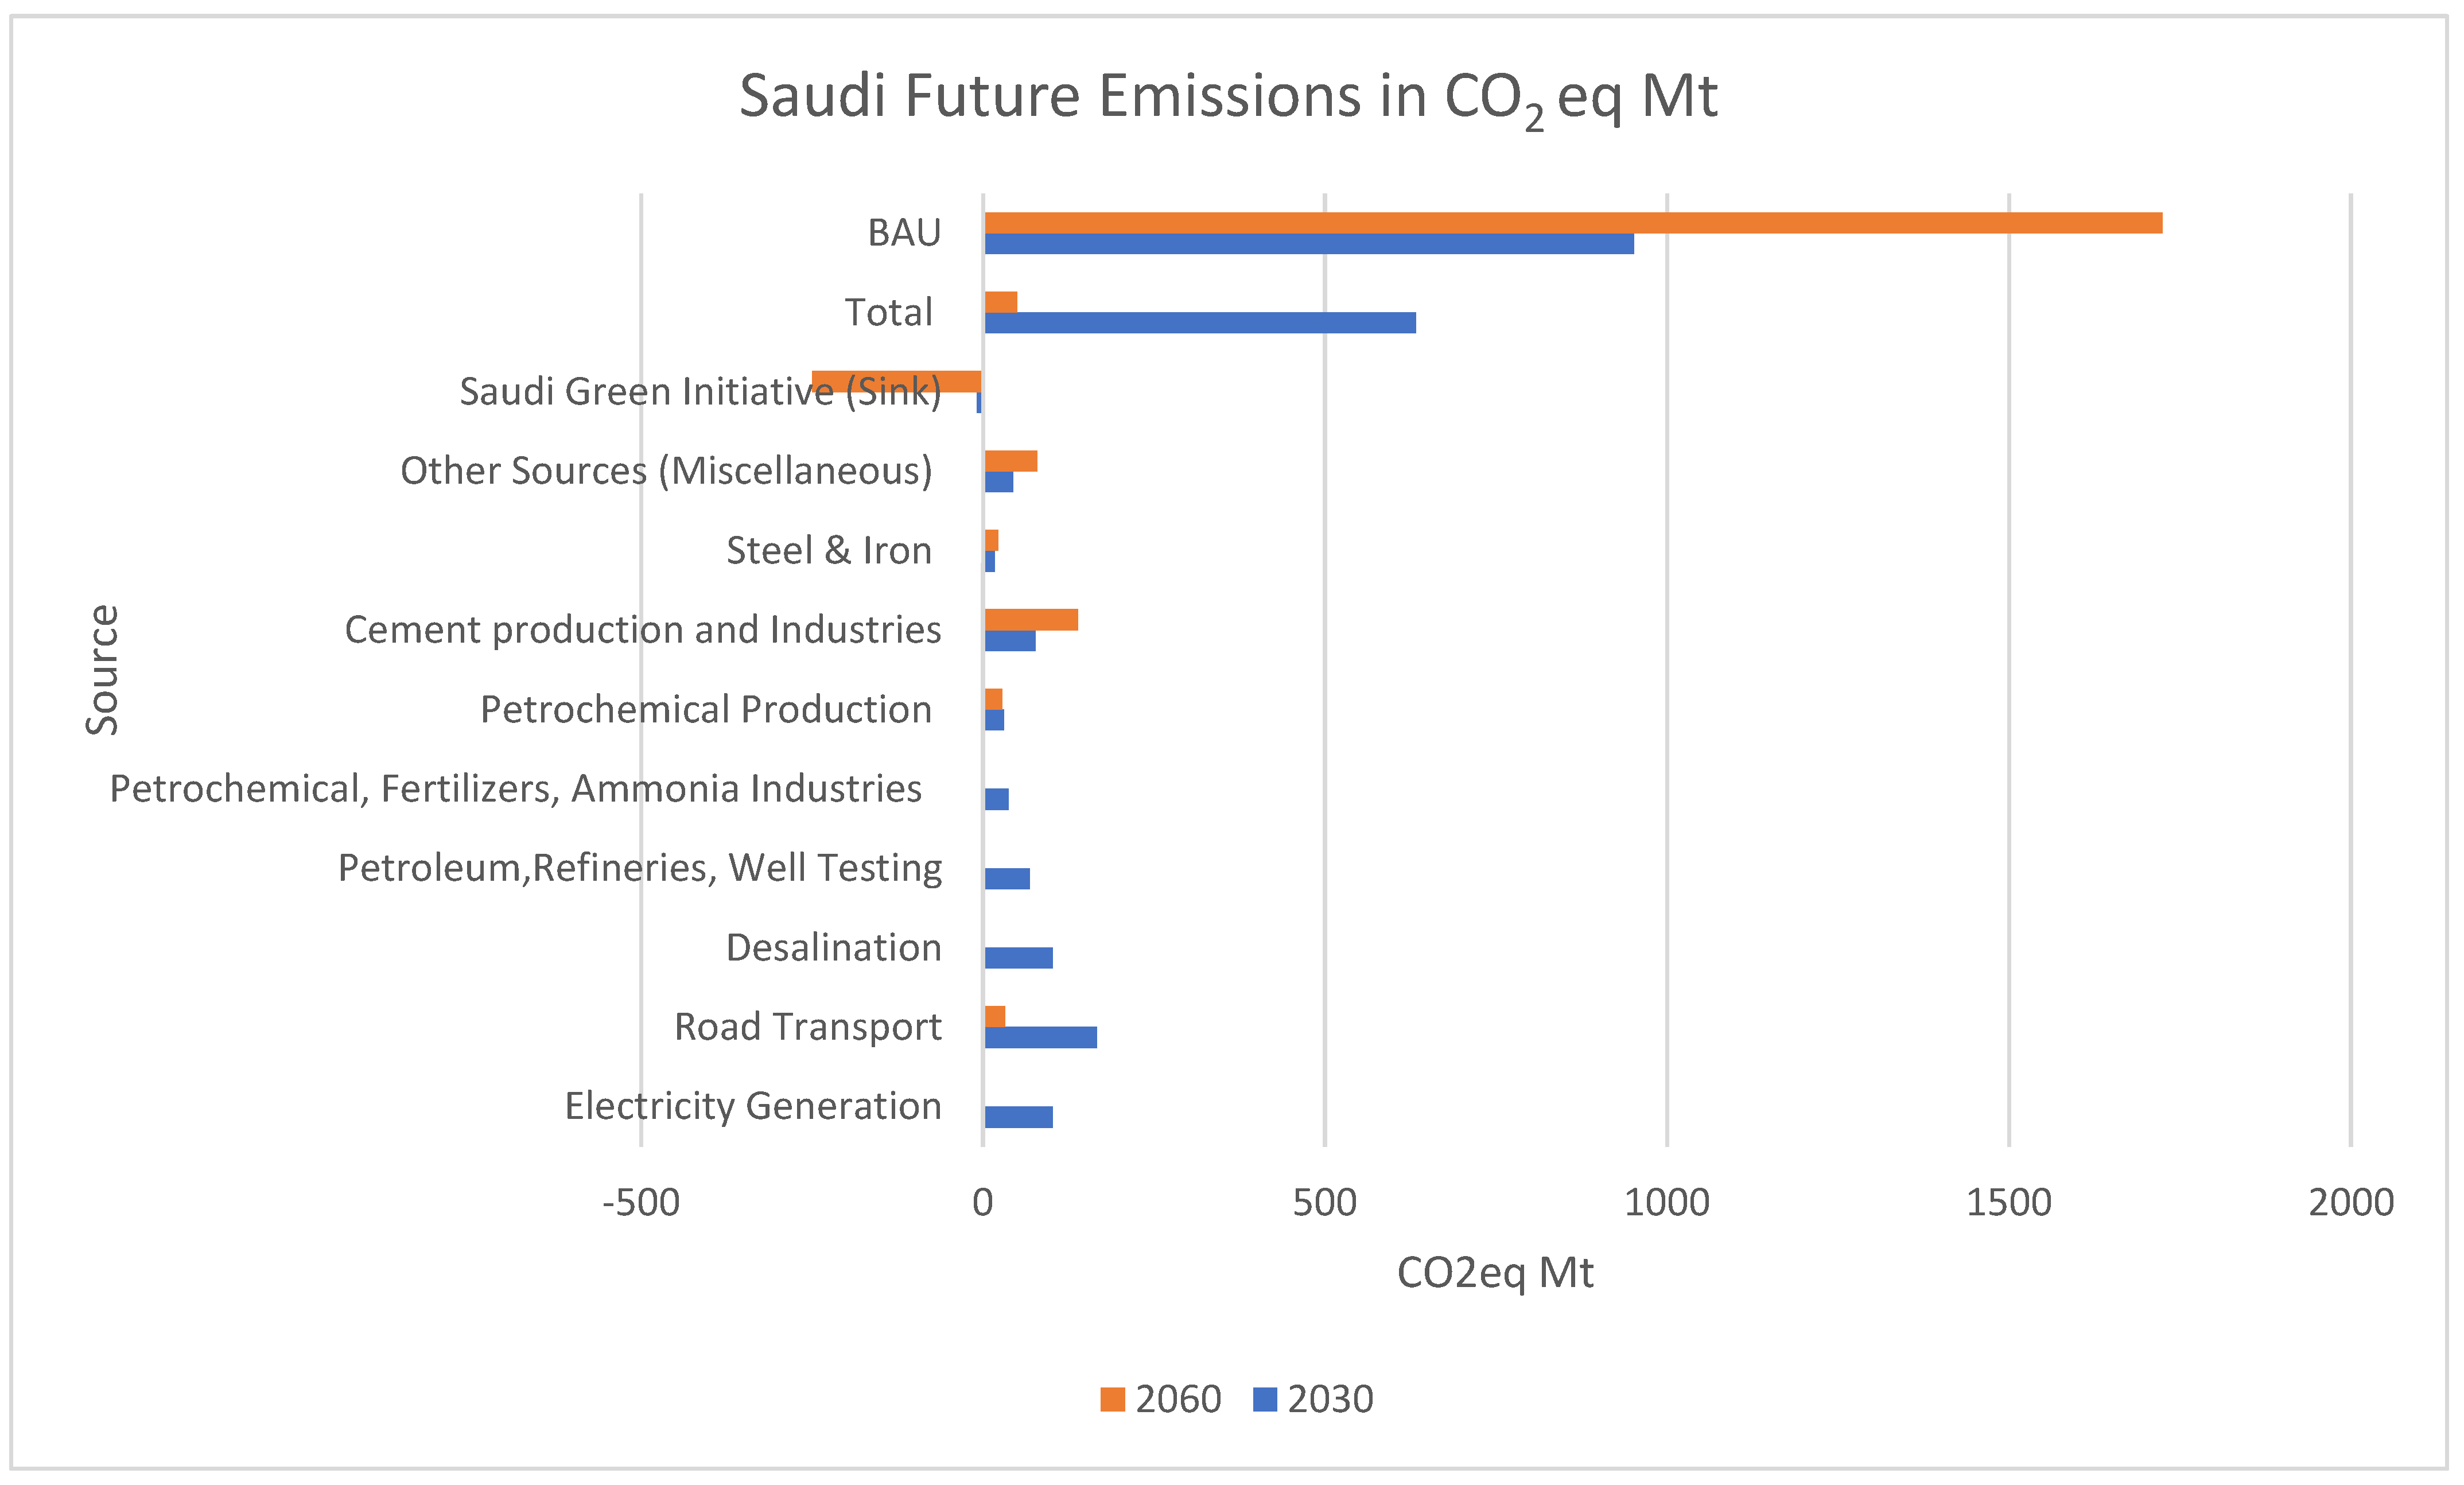
Based on the above analysis of the current emissions and approved measures, it is predicted that Saudi Arabia will have lowered its GHG emissions to 632.78 Mt of CO2eq by 2030, whereas under the BAU scenario, the emissions would have reached 951.94 Mt of CO2eq. By 2060, Saudi Arabia will have lowered its emissions to 49.76 Mt of CO2eq. Figure 13 shows the forecasted emissions in 2030 and 2060.

6. Discussion

Cement production is one of the major sources of emissions that will hinder Saudi Arabia from reaching NZE by 2060. The estimated CO2eq emissions from the cement industry and production will reach 138.5 Mt of CO2eq in 2060. Globally, the cement industry is the third largest industrial energy consumer, and it contributes approximately 7% of GHG emissions [60,61]. The emissions from the concrete industry are from the production of Portland cement particularly and the transportation of materials [62]. Unlike steel and other industries, CO2 emissions are inherent to the chemical reaction for producing cement (3CaCO3 + SiO2 = Ca3SiO5 + 3CO2), which makes CO2 unavoidable [60].
In order to reduce the emissions from these sources, various strategies are considered, including reducing the use of cement by adopting alternative and more sustainable construction materials, such as plastic sand blocks [63]. Improving the lifetime of concrete is another approach. Introducing CCUS technology could be effective; however, because of its current cost, it is a nonlucrative option. Innovative ideas should be considered, such as harnessing heat waste from cement manufacturing and using it to generate hydrogen. Graphene is another promising material that could reduce the amount of concrete and steel in reinforced concrete and improve its strength and durability.
There is emerging interest within Saudi Arabia to explore green cement and green concrete. A novel cementing blend that uses natural pozzolan and limestone to create concrete by replacing certain percentages of ordinary Portland cement, which produces large amounts of CO2, is under development locally. This could reduce CO2 emissions by approximately 80% over standard concrete using ordinary Portland cement [64].
The analysis revealed that CO2eq emissions of the iron and steel industry will reach 37.48 Mt of CO2eq by 2060. On average, 1.85 tons of CO2 are emitted for every ton of steel produced, representing approximately 8% of global CO2 emissions [56]. As for scope 1, according to the 2006 IPCC Guidelines, 1.06 tons of CO2 are emitted per ton of produced steel. One option to lower the emissions from the steel industry is to use electric arc furnace technology [56]. Another option is to adopt green hydrogen-based steel production [56]. The latter might be more suitable for the Saudi steel industry since there is an interest in investing and expanding in green hydrogen.
Most of the steel produced is utilized in the construction industry. Therefore, alternative materials should be considered, such as replacing the conventional steel bars used in reinforced concert with glass fiber-reinforced polymer bars that can be manufactured from plastic waste [65], supporting CCE. Moreover, graphene could be a replacement for steel mesh.
There are some potential adverse effects of injecting CO2. Its leakage in the freshwater aquifer could deteriorate the quality of water. The high investment cost of CCUS could make this option infeasible. Low oil prices make CO2-enhanced oil recovery CCUS a less favorable investment [14]. In general, the capital cost for carbon capture storage technology might make it unlucrative [66]. The cost to store emissions from natural-gas-fired plants ranges from $80 to $90 per ton [67]. Accordingly, it is important to implement innovative methods to utilize sequestered CO2. Aramco is one of the pioneers in this domain; for example, it is working on benefiting from the CO2 sequestered from CCUS by injecting CO2 instead of air to cure concrete. This curing technology for precast concrete materials can store up to 20% of the CO2 in the concrete while delivering superior mechanical strength and reducing the curing time by a third [51]. In addition, the company is working on using technology to convert captured CO2 into 12 tons of small-scale green methanol per day and capture more than 27 Mt of CO2 by producing 3 Mt of blue hydrogen and 1 Mt of green hydrogen per year.
The ambitious Green Initiative with the aim of planting 10 billion trees should be executed prudently. The selection of the tree species should focus on trees that can survive the Saudi climate and require little water. Considering harvesting trees after 20 years or at adequate ages to sustain the sequestering rating should be taken into consideration to benefit from harvesting old trees as well. Therefore, selecting trees that can be a suitable source of wood should also be considered. This could introduce a new industry in the long term and even assist in substituting concrete in construction [68].
During the UN global climate change summit (Conference of the Parties—COP27-2022), Saudi Arabia announced 66 new initiatives as part of its environmental plan and reiterated its commitment to reducing carbon emissions by 278 CO2eq Mt by 2030 [69].
Based on the analysis of the emissions and the measures that the government is implementing to achieve NZE, it is obvious that certain sectors are slow in their pace to achieve this goal by 2060. Those sectors, which are mainly private, will not have the incentive to take costly measures to reduce emissions. Unless the government promulgates some regulations, those sectors will remain a source of CO2 emissions.

7. Conclusions

The study offers an evaluation of Saudi Arabia’s efforts to achieve NZE. More importantly, an estimate for Saudi emissions by 2060 is provided based on an examination of the country’s present emissions and the actions being taken to reduce them. The article identifies the underdeveloped industries that might prevent Saudi Arabia from achieving NZE by 2060 and makes some practical contributions to the strategies for reducing emissions. In addition, the paper highlights the lagging sectors that could hinder Saudi Arabia from achieving NZE by 2060. This can help researchers and policymakers pinpoint and focus on these sectors. In addition, the findings can be used by policymakers in other countries.
The strategy to reach NZE is based on a multidimensional approach which includes expanding renewable energy, improving public transportation, implementing energy efficiency programs, investing in carbon capture technology, and investing in afforestation. Saudi Arabia has adopted all common and recommended measures to reduce emissions, except for carbon taxation and credit policies. The actions on the ground reflect Saudi Arabia’s persistence and enthusiasm to honor its pledge to achieve NZE by 2060. This is demonstrated by the Saudi 2021 NDC planning to reduce the annual GHG emissions by 278 Mt of CO2eq by 2030, which is a significant increase from the previous NDC, where the target was to reduce CO2eq annually by 130 Mt by 2030.
Electricity generation and water desalination that currently consume significant amounts of fossil fuels are under a structural shift toward more sustainable resources with lower emissions. Oil and petrochemical industries are also taking the lead and endeavoring to be even ahead of the government’s pledge to achieve NZE by 2060. The fact that the government is a substantial stakeholder in these sectors urges them to participate in the journey toward NZE. The ESG rating seems to be an effective monitoring tool that ensures continuous progress and management commitment toward lowering emissions.
Saudi Arabia’s measures toward achieving NZE by 2060 are promising. This study provided a forecast of Saudi emissions by 2060 based on the current measures and actions that have been undertaken. Based on this analysis, Saudi Arabia will witness a significant reduction in emissions after 2030, when renewable energy projects will have been completed. It is expected that GHG emissions will be 666.35 Mt of CO2eq by 2030, whereas under the BAU scenario, emissions would reach 951.94 Mt of CO2eq. By 2060, Saudi Arabia will have decreased its emissions to 95.07 Mt of CO2eq, contrary to the BAU scenario (1724 Mt of CO2eq).
The analysis revealed that cement, steel, and petrochemical production industries would emit 168.49 Mt of CO2eq, 37.48 Mt of CO2eq, and 28.27 Mt of CO2eq, respectively. Novel technology and new initiatives need to be adopted by these industries over the coming 35 years to have a positive impact on GHG emissions.
The following are recommendations based on the findings:
  • The Saudi government shall continue with its current investments and measures in the fields of energy efficiency, renewable energy, and nuclear energy to ensure achieving NZE from the electricity generation sector by 2060.
  • The government shall facilitate and proceed with more initiatives and investments in the fields of public and green transportation since the transportation sector is the second source of emissions (166.65 Mt of CO2eq per year).
  • Since the emissions from the cement sector are forecasted to be ~138.5 Mt of CO2eq by 2060, innovation and investments in new technologies for low-carbon, energy-efficient cement plants shall be developed and made to keep pace with a changing world, and the cement industry is encouraged to pursue zero carbon emissions. Additionally, a pertinent regulatory framework must be created.
  • The total carbon capture associated with afforestation and reforestation should be enhanced by substituting long-lived trees and using harvested wood products for construction materials since afforestation and reforestation are the carbon sink that shall provide 250 Mt of CO2eq sequestration.
  • Planting trees that would create value, such as trees that can be used in the pharmaceutical industry, should also be considered since the required investment in the green initiative is huge.
  • CO2 sequestered from CCUS should be used for the generation of products with high value to reduce the cost of CCUS. For example, more research should focus on manufacturing graphene from sequestered CO2.
  • The economic implications of imposing a carbon tax should be assessed.
  • Exporting blue and green hydrogen should be further studied in the context of Saudi Arabia.

Author Contributions

Conceptualization, M.A.A.-S. and A.A.B.; methodology, M.A.A.-S.; validation, M.A.A.-S., A.A.B. and F.A.; formal analysis, M.A.A.-S.; investigation, M.A.A.-S.; resources, M.A.A.-S.; data curation, F.A.; writing—original draft preparation, M.A.A.-S.; writing—review and editing, A.A.B.; visualization, M.A.A.-S., A.A.B. and F.A.; supervision, A.A.B. All authors have read and agreed to the published version of the manuscript.

Funding

This research received no external funding.

Data Availability Statement

Not applicable.

Conflicts of Interest

The authors declare no conflict of interest.

References

  1. Binyam, A. The Role of Forest and Soil Carbon Sequestrations on Climate Change Mitigation. J. Environ. Earth Sci. 2014, 4, 98–111. [Google Scholar]
  2. The Royal Society; Royal Academy of Engineering. Greenhouse Gas Removal Report. The Royal Society, September 2018. Available online: https://royalsociety.org/-/media/policy/projects/greenhouse-gas-removal/royal-society-greenhouse-gas-removal-report-2018.pdf(accessed on 28 August 2022).
  3. Streck, C.; Keenlyside, P.; von Unger, M. The Paris Agreement: A New Beginning. J. Eur. Environ. Plan. Law 2016, 13, 3–29. [Google Scholar] [CrossRef] [Green Version]
  4. Hamieh, A.; Rowaihy, F.; Al-Juaied, M.; Abo-Khatwa, A.N.; Alafifi, A.M.; Hoteit, H. Quantification and Analysis of CO2 Footprint from Industrial Facilities in Saudi Arabia. Energy Convers. Manag. X. 2022, 16, 100299. [Google Scholar] [CrossRef]
  5. IPCC. 2006 IPCC Guidelines for National Greenhouse Gas Inventories. Available online: https://www.ipcc-nggip.iges.or.jp/public/2006gl/ (accessed on 17 September 2022).
  6. OECD; IEA; NEA; ITF. Aligning Policies for a Low-Carbon Economy; OECD Publishing: Paris, France, 2015. [Google Scholar] [CrossRef]
  7. Xu, Z.; Elomri, A.; Pokharel, S.; Mutlu, F. The Design of Green Supply Chains under Carbon Policies: A Literature Review of Quantitative Models. Sustainability 2019, 11, 3094. [Google Scholar] [CrossRef] [Green Version]
  8. Kiss, T.; Popovics, S. Evaluation on the effectiveness of Energy Policies—Evidence from the Carbon Reductions in 25 Countries. Renew. Sustain. Energy Rev. 2021, 149, 111348. [Google Scholar] [CrossRef]
  9. Gurtu, A.; Vyas, V.; Gurtu, A. Emissions Reduction Policies and Their Effects on Economy. J. Risk Financ. Manag. 2022, 15, 404. [Google Scholar] [CrossRef]
  10. Ghazouani, A.; Xia, W.; Ben Jebli, M.; Shahzad, U. Exploring the Role of Carbon Taxation Policies on CO2 Emissions: Contextual Evidence from Tax Implementation and Non-Implementation European Countries. Sustainability 2020, 12, 8680. [Google Scholar] [CrossRef]
  11. Al-Sinan, M.A.; Bubshait, A.A. The Procurement Agenda for the Transition to a Circular Economy. Sustainability 2022, 14, 11528. [Google Scholar] [CrossRef]
  12. United States Environmental Protection Agency. Greenhouse Gas (GHG) Emissions and Removals. Available online: https://www.epa.gov/ghgemissions (accessed on 28 August 2022).
  13. Madejski, P.; Chmiel, K.; Subramanian, N.; Ku´s, T. Methods and Techniques for CO2 Capture: Review of Potential Solutions and Applications in Modern Energy Technologies. Energies 2022, 15, 887. [Google Scholar] [CrossRef]
  14. Liu, H.J.; Were, P.; Li, Q.; Gou, Y.; Hou, Z. Worldwide Status of CCUS Technologies and Their Development and Challenges in China. Geofluids 2017, 2017, 6126505. [Google Scholar] [CrossRef]
  15. Molina-Jirón, C.; Chellali, M.R.; Shyam Kumar, C.N.; Kübel, C.; Velasco, L.; Hahn, H.; Moreno-Pineda, E.; Ruben, M. Direct Conversion of CO₂ to Multi-Layer Graphene using Copper-Palladium Alloys. ChemSusChem 2019, 12, 3509. [Google Scholar] [CrossRef] [PubMed] [Green Version]
  16. Jeffery, L.; Höhne, N.; Moisio, M.; Day, T.; Lawless, B. Options for Supporting Carbon Dioxide Removal. NewClimate Institute, 28 July 2020. Available online: https://newclimate.org/sites/default/files/2020/07/Options-for-supporting-Carbon-Dioxide-Removal_July_2020.pdf(accessed on 7 September 2022).
  17. Kongsager, R.; Napier, J.; Mertz, O. The Carbon Sequestration Potential of Tree Crop Plantations. Mitig. Adapt. Strateg. Glob. Chang. 2013, 18, 1197–1213. [Google Scholar] [CrossRef]
  18. Babonneau, F.; Badran, A.; Haurie, A.; Schenckery, M.; Vielle, M. GCC Countries Strategic Options in a Global Transition to Zero-Net Emissions. Research Square, 11 May 2022. Available online: https://doi.org/10.21203/rs.3.rs-1618600/v1(accessed on 20 December 2022).
  19. Luomi, M.; Yilmaz, F.; Al Shehri, T. The Gulf Cooperation Council and the Circular Carbon Economy: Progress and Potential; King Abdullah Petroleum Studies and Research Center (KAPSARC): Riyadh, Saudi Arabia, 2022; Available online: https://doi.org/10.30573/KS--2022-DP06 (accessed on 20 December 2022).
  20. United Nations Climate Change, Saudi Arabia First NDC (Updated Submission). Available online: https://unfccc.int/documents/497886 (accessed on 14 August 2022).
  21. Mohajan, H.K. Greenhouse Gas Emissions Increase Global Warming. Int. J. Econ. Political Integr. 2011, 1, 21–34. [Google Scholar]
  22. International Plant Protection Convention (IPPC). B. Glossary of Terms. Available online: https://www.ipcc.ch/site/assets/uploads/2018/03/wg2TARannexB.pdf (accessed on 17 October 2022).
  23. Hertwich, E.G.; Wood, R. The Growing Importance of Scope 3 Greenhouse Gas Emissions from Industry. Environ. Res. Lett. 2018, 13, 104013. [Google Scholar] [CrossRef]
  24. Lippke, B.; Puettmann, M.; Oneil, E.; Chadwick, O. The Plant a Trillion Trees Campaign to Reduce Global Warming—Fleshing Out the Concept. J. Sustain. For. 2021, 40, 1–31. [Google Scholar] [CrossRef]
  25. United Nations. Paris Agreement. United Nations Climate Change. 2015. Available online: https://unfccc.int/sites/default/files/english_paris_agreement.pdf (accessed on 11 August 2022).
  26. Wogan, D.; Carey, E.; Cooke, D. Policy Pathways to Meet Saudi Arabia’s Contributions to the Paris Agreement; King Abdullah Petroleum Studies and Research Center (KAPSARC): Riyadh, Saudi Arabia, 2019. [Google Scholar] [CrossRef] [Green Version]
  27. DNA. First Biannual Update Report (BUR), Saudi Arabia. 2018. Available online: https://cdmdna.gov.sa/ (accessed on 7 August 2022).
  28. Rypdal, K.; Winiwarter, W. Uncertainties in Greenhouse Gas Emission Inventories—Evaluation, Comparability and Implications. Environ. Sci. Policy. 2001, 4, 107–116. [Google Scholar] [CrossRef]
  29. Zhang, J.; Liu, J.; Dong, L.; Qiao, Q. CO2 Emissions Inventory and Its Uncertainty Analysis of China’s Industrial Parks: A Case Study of the Maanshan Economic and Technological Development Area. Int. J. Environ. Res. Public Health 2022, 19, 11684. [Google Scholar] [CrossRef]
  30. Houghton, J.T.; Meira Filho, L.G.; Lim, B.; Treanton, K.; Mamaty, I.; Bonduki, Y.; Griggs, D.J.; Callander, B.A.; IPCC. Greenhouse Gas Inventory Reporting Instructions; Revised 1996 IPCC Guidelines for National Greenhouse Gas Inventories. Volumes 1, 2 and 3; Intergovernmental Panel on Climatic Change (IPCC), WGI Technical Support Unit: London, UK, 1997. [Google Scholar]
  31. Fourth National Communication (NC4) Kingdom of Saudi Arabia. Submitted to The United Nations Framework Convention on Climate Change (UNFCCC) March 2022. United Nations Climate Change. 2022. Available online: https://unfccc.int/sites/default/files/resource/7123846_Saudi%20Arabia-NC4-1-Fourth%20National%20Communication%20NC4%20Kingdom%20of%20Saudi%20Arabia%20March%202022.pdf (accessed on 5 August 2022).
  32. CO2 Emissions (Metric Tons per Capita)—Saudi Arabia. The World Bank. Available online: https://data.worldbank.org/indicator/EN.ATM.CO2E.PC?locations=SA (accessed on 1 September 2022).
  33. Carbon Footprint by Country 2022. World Population Review. Available online: https://worldpopulationreview.com/country-rankings/carbon-footprint-by-country (accessed on 7 September 2022).
  34. United Nations Environment Programme. State of the Climate. UN Environment Programme, 9 November 2021. Available online: https://www.unep.org/explore-topics/climate-action/what-we-do/climate-action-note/state-of-climate.html?gclid=EAIaIQobChMI7uqL_I28-gIVV-d3Ch2ZQQ76EAAY(accessed on 7 September 2022).
  35. Ritchie, H.; Roser, M. Saudi Arabia: CO2 Country Profile. Our World in Data (OWID). Available online: https://ourworldindata.org/co2/country/saudi-arabia (accessed on 15 August 2022).
  36. Saqib, N. Greenhouse Gas Emissions, Energy Consumption and Economic Growth: Empirical Evidence from Gulf Cooperation Council Countries. IJEEP 2018, 8, 392–400. [Google Scholar] [CrossRef]
  37. Sustainability Report: SEC Environmental, Social and Governance (ESG) Report 2021. Saudi Electricity Company. 2022. Available online: https://www.se.com.sa/en-us/invshareholder/Pages/sustainabilityreport.aspx (accessed on 26 September 2022).
  38. Electrical Statistic 2020. General Authority for Statistics, Kingdom of Saudi Arabia. Available online: https://www.stats.gov.sa/sites/default/files/Electrical%20Energy%20Statistics%202020EN_0.pdf (accessed on 10 October 2022).
  39. Sustainability Report: SEC Environmental, Social and Governance (ESG) Report 2019. Saudi Electricity Company. 2020. Available online: https://www.se.com.sa/en-us/invshareholder/Pages/sustainabilityreport.aspx (accessed on 9 October 2022).
  40. Carbon Dioxide Emissions Coefficients. US Energy Information Administration. 5 October 2022. Available online: https://www.eia.gov/environment/emissions/co2_vol_mass.php (accessed on 7 October 2022).
  41. Sustainability in Focus: Saudi Wealth Fund PIF’s Path to Net Zero Emissions. Al Arabiya News. 13 September 2022. Available online: https://english.alarabiya.net/business/energy/2022/09/13/Sustainability-in-focus-Saudi-wealth-fund-PIF-s-path-to-net-zero-emissions (accessed on 7 October 2022).
  42. Reducing Emissions. Saudi Green Initiative. Available online: https://www.saudigreeninitiative.org/targets/reducing-emissions/ (accessed on 3 September 2022).
  43. Amran, Y.A.; Amran, Y.M.; Alyousef, R.; Alabduljabbar, H. Renewable and Sustainable Energy Production in Saudi Arabia According to Saudi Vision 2030. Current Status and Future Prospects. J. Clean. Prod. 2020, 247, 119602. [Google Scholar] [CrossRef]
  44. Saudi Arabia to Triple Size of Its Rail Network. Arab News, 13 January 2022. Available online: https://www.arabnews.com/node/2003401/business-economy(accessed on 27 September 2022).
  45. Riyadh Metro Project Nearing Completion. Saudi Gazette, 16 December 2021. Available online: https://saudigazette.com.sa/article/614806/SAUDI-ARABIA/Riyadh-Metro-project-nearing-completion-nbsp(accessed on 7 October 2022).
  46. Saudi Arabia Registered Motor Vehicles. International Organization of Motor Vehicle Manufactures. Available online: https://www.ceicdata.com/en/indicator/saudi-arabia/motor-vehicle-registered(accessed on 15 September 2022).
  47. Plumer, B.; Tabuchi, H. 6 Automakers and 30 Countries Say They’ll Phase Out Gasoline Car Sales. The New York Times, 9 November 2021. Available online: https://www.nytimes.com/2021/11/09/climate/cars-zero-emissions-cop26.html(accessed on 7 October 2022).
  48. News Wires. The European Union Approved Ending the Sale of Vehicles with Combustion Engines by 2035 in Europe, the 27-Member Bloc Announced Early Wednesday, in a Bid to Reduce CO2 Emissions to Zero. France 24, 29 June 2021. Available online: https://www.france24.com/en/europe/20220629-eu-agrees-to-ending-sales-of-combustion-engine-vehicles-by-2035(accessed on 17 October 2022).
  49. Alnajdi, O.; Wu, Y.; Kaiser Calautit, J. Toward a Sustainable Decentralized Water Supply: Review of Adsorption Desorption Desalination (ADD) and Current Technologies: Saudi Arabia (SA) as a Case Study. Water 2020, 12, 1111. [Google Scholar] [CrossRef]
  50. Desalination Reduce Carbon Emissions by 22% of Saudi Arabia Total Targets. Asharq Al-Awsat, 19 March 2021. Available online: https://english.aawsat.com/home/article/2869251/desalination-reduces-carbon-emissions-22-saudi-arabia’s-total-targets(accessed on 10 October 2022).
  51. Saudi Aramco. Saudi Aramco Sustainability Report 2021. Available online: https://www.aramco.com/en/sustainability/sustainability-report (accessed on 4 September 2022).
  52. Rahman, M.M.; Rahman, M.S.; Chowdhury, S.R.; Elhaj, A.; Razzak, S.A.; Abu Shoaib, S.; Islam, M.K.; Islam, M.M.; Rushd, S.; Rahman, S.M. Greenhouse Gas Emissions in the Industrial Processes and Product Use Sector of Saudi Arabia—An Emerging Challenge. Sustainability 2022, 14, 7388. [Google Scholar] [CrossRef]
  53. SABIC. Reimaging ESG. Toward a Circular Economy. Sustainability Report 2021. SABIC, 2022. Available online: https://www.sabic.com/assets/en/Images/SABIC_Sustainability_Report_2021_EN_tcm1010-34677.pdf(accessed on 10 October 2022).
  54. Largest Steel Companies in Saudi Arabia. Marcopolis, 2 November 2015. Available online: https://marcopolis.net/largest-steel-companies-in-saudi-arabia.htm(accessed on 23 September 2022).
  55. SABIC. Metals (Hadeed). SABIC, 2022. Available online: https://www.sabic.com/en/reports/annual-2021/our-businesses/metals(accessed on 14 October 2022).
  56. Hoffmann, C.; van Hoey, M.; Zeumer, B. Decarbonization Challenges for Steel. McKinsey & Company, 3 June 2020. Available online: https://www.mckinsey.com/industries/metals-and-mining/our-insights/decarbonization-challenge-for-steel(accessed on 15 October 2022).
  57. Sadara. ESG Report 2021. Sadara, 2022. Available online: https://www.sadara.com/en/About/Citizenship(accessed on 11 October 2022).
  58. Alami, M.; Wael, S.; Alasaeed, A. Saudi Megaprojects Set to Revive Cement Industry in 2022 After a Disappointing Year. Arab News, 16 April 2022. Available online: https://www.arabnews.com/node/2064551/business-economy(accessed on 18 October 2022).
  59. Production of Crude Steel in Saudi Arabia from 2014 to 2021 (in Million Metric Tons). Statista, 13 September 2022. Available online: https://www.statista.com/statistics/718271/saudi-arabia-crude-steel-production/(accessed on 7 October 2022).
  60. Busch, P.; Kendall, A.; Murphy, C.W.; Miller, S.A. Literature Review on Policies to Mitigate GHG Emissions for Cement and Concrete. Resour. Conserv. Recycl. 2022, 182, 106278. [Google Scholar] [CrossRef]
  61. Technology Roadmap. Low-Carbon Transition in the Cement Industry. IEA. 2018. Available online: https://iea.blob.core.windows.net/assets/cbaa3da1-fd61-4c2a-8719-31538f59b54f/TechnologyRoadmapLowCarbonTransitionintheCementIndustry.pdf (accessed on 5 October 2022).
  62. Adesina, A. Recent Advances in the Concrete Industry to Reduce Its Carbon Dioxide Emissions. Environ. Chall. 2020, 1, 100004. [Google Scholar] [CrossRef]
  63. Al-Sinan, M.A.; Bubshait, A.A. Using Plastic Sand as a Construction Material toward a Circular Economy: A Review. Sustainability 2022, 14, 6446. [Google Scholar] [CrossRef]
  64. King Abdullah University of Science and Technology. Environmentally Friendly Cement Blend. King Abdullah University of Science and Technology. Available online: https://innovation.kaust.edu.sa/technologies/environmentally-friendly-cement-blend/ (accessed on 19 October 2022).
  65. Husain, S.F.; Shariq, M.; Masood, A. GFRP Bars for RC Structures—A Review. In Proceedings of the International Conference on Advances in Construction Materials and Structures (ACMS-2018), IIT Roorkee, Roorkee, Uttarakhand, India, 7–8 March 2018. [Google Scholar]
  66. Liu, H.; Garcia Tellez, B.; Atallah, T.; Barghouty, M. The role of CO2 capture and storage in Saudi Arabia’s energy future. Int. J. Greenh. Gas Control. 2012, 11, 163–171. [Google Scholar] [CrossRef]
  67. Schmelz, W.J.; Hochman, G.; Miller, K.G. Total Cost of Carbon Capture and Storage Implemented at a Regional Scale: North-Eastern and Midwestern United States. Interface Focus. 2020, 10, 20190065. [Google Scholar] [CrossRef]
  68. Girish, K.; Shankara Bhat, S. Neem—A Green Treasure. Electron. J. Biol. 2008, 4, 102–111. [Google Scholar]
  69. Arab News, Saudi Arabia Presents 66 Initiatives to Tackle Climate Change at COP27 in Egypt. Arab. News, 8 November 2022. Available online: https://www.arabnews.com/node/2195796/business-economy(accessed on 13 November 2022).
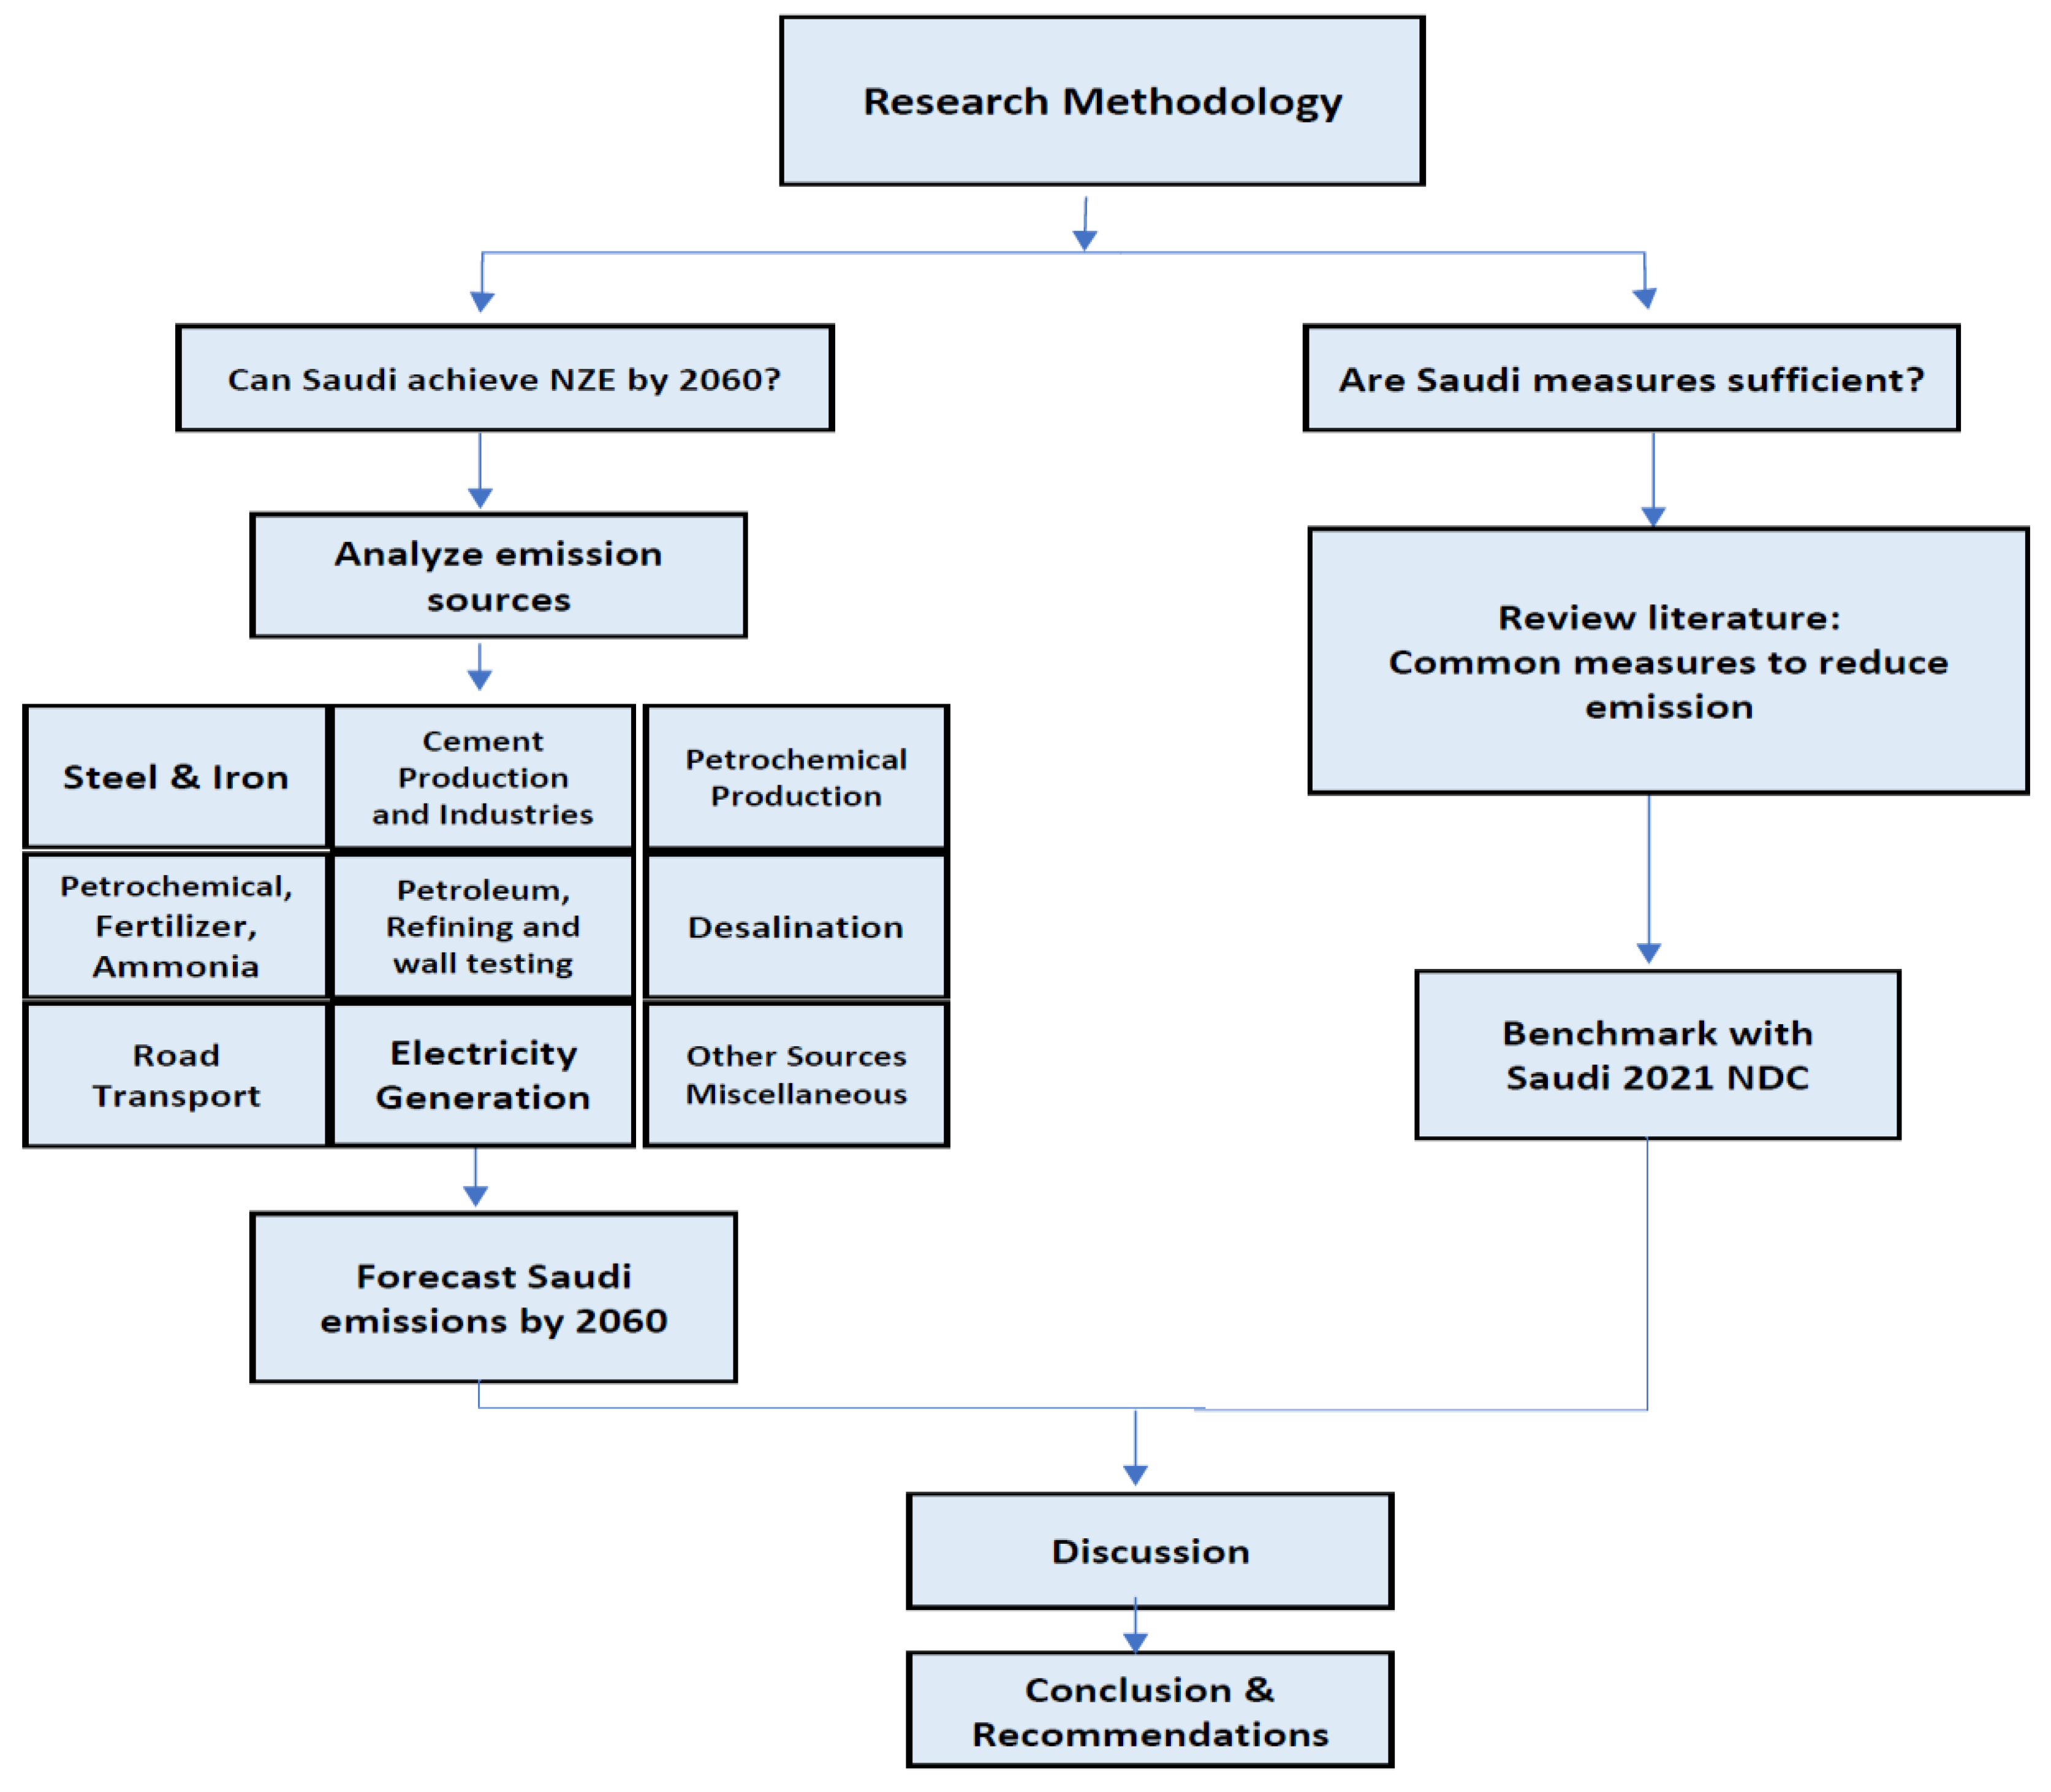
Figure 1. Research Methodology.
Energies 16 00978 g001
Figure 2. Circular carbon economy [19].
Energies 16 00978 g002
Figure 3. Saudi Arabia’s distribution of CO2 emissions by source in 2016 [31].
Energies 16 00978 g003
Figure 4. Saudi Arabia’s distribution of CH emissions by source in 2016 [31].
Energies 16 00978 g004
Figure 5. Saudi Arabia’s distribution of N₂O emissions by source in 2016 [31].
Energies 16 00978 g005
Figure 6. GHG emissions in 2019 by source (data from ref. [35]).
Energies 16 00978 g006
Figure 7. GHG emissions forecast under a business-as-usual (BAU) scenario.
Energies 16 00978 g007
Figure 8. GHG emissions estimate in 2018 by sector.
Energies 16 00978 g008
Figure 9. CO2eq emission forecast for the private sector of petrochemical (40% of all the producers).
Energies 16 00978 g009
Figure 10. CO2 emissions forecast: cement industry and cement production.
Energies 16 00978 g010
Figure 11. CO2eq emissions forecast: iron and steel industries.
Energies 16 00978 g011
Figure 12. GHG emissions forecast: iron and steel industries.
Energies 16 00978 g012
Figure 13. Forecast of Saudi emissions in 2030 and 2060.
Energies 16 00978 g013
Table 1. GHG emissions forecast from electricity generation under a BAU scenario.
Year BAU Mt of CO2eqOil Fuel Mt of CO2eqGas Mt of CO2eq
2018200.56104.2996.27
2019204.57106.3898.19
2020208.66108.50100.16
2021212.84110.67102.16
2022217.09112.89104.20
2023221.43115.15106.29
2024225.86117.45108.41
2025230.38119.80110.58
2026234.99122.19112.79
2027239.69124.64115.05
2028244.48127.13117.35
2029249.37129.67119.70
2030254.36132.27122.09
Disclaimer/Publisher’s Note: The statements, opinions and data contained in all publications are solely those of the individual author(s) and contributor(s) and not of MDPI and/or the editor(s). MDPI and/or the editor(s) disclaim responsibility for any injury to people or property resulting from any ideas, methods, instructions or products referred to in the content.