Review

Capacity Mechanisms in Europe and the US: A Comparative Analysis and a Real-Life Application for Greece

by
Christos K. Simoglou
1 and
Pandelis N. Biskas
2,*
1
Department of Mechanical Engineering, International Hellenic University, 62124 Serres, Greece
2
School of Electrical and Computer Engineering, Aristotle University of Thessaloniki, 54124 Thessaloniki, Greece
*
Author to whom correspondence should be addressed.
Energies 2023, 16(2), 982; https://doi.org/10.3390/en16020982
Submission received: 11 November 2022 / Revised: 5 January 2023 / Accepted: 10 January 2023 / Published: 15 January 2023
(This article belongs to the Special Issue Electricity Market Reform and Deregulation)

Abstract

:
This paper presents a comparative analysis of various capacity mechanisms that are either in force or under approval in key countries/regions in Europe and the US. A detailed analysis on the necessities that led to the establishment of the capacity mechanisms, along with various fundamental technical and operational features associated with the design and operation of different capacity mechanisms, mainly in Europe (Italy, France, Germany, Belgium, Poland, Great Britain, Ireland, Cyprus) and complementarily in the US (PJM, New England), are presented. This analysis is complemented by a real-life application regarding the long-term capacity remuneration mechanism that is expected to be established in Greece in the near future. A detailed simulation of the envisaged capacity mechanism auctions under differentiated scenarios has been performed, regarding the future Greek power system operating conditions during the forthcoming decade (2022–2031). Test results illustrate that the outcome of the auctions is heavily dependent on the future energy generation mix and the market participants’ bidding strategy. Whereas, the total cost that will have to be undertaken by the electricity supply companies and, ultimately, by the end-consumers for the financing of the proposed capacity mechanism lies in the range of 5.5–8.7 €/MWh for the entire study period.

1. Introduction

Since the 1990s, power systems worldwide have been subject to fundamental restructuring processes. Electricity market liberalization in both the generation and retail sectors has gradually led to the substitution of monopolistic environments by competitive markets [1]. Vertically integrated state-owned utilities have been unbundled, new private generation companies have emerged and compete with each other to maximize market shares and profits in the wholesale market, and end-consumers have been able to freely choose their retail suppliers. In the meantime, renewable energy sources have been gradually increasing their presence in the power systems and wholesale electricity markets. These institutional and technological developments have been accompanied by increased concerns about the security of supply. Policy makers and regulators quickly concluded that there is no guarantee that the wholesale electricity market could alert potential investors that the available generating and load resources are capable of fully covering demand constantly, especially during extreme conditions. Presumably, generation companies would invest in new generation capacity if they believed that the price they could be paid from selling electricity generation in the wholesale market would provide a satisfactory return on investment in the long-term. However, renewable generation with near-zero running costs has curbed the profitability of conventional generating units in the framework of the short-term wholesale electricity markets, and has reduced incentives to maintain existing power plants or invest in new ones. In this context, economists warned of a “missing money” problem, whereby wholesale market price caps and increased market price volatility due to increasing volumes of uncertain and intermittent renewable energy could suppress prices. The market would not be able to ensure the long-term viability of the existing conventional power plants and support sufficient new investments [2,3].
To address such resource adequacy issues, most deregulated electricity markets, first in the United States (US) and later in Europe, have reacted by introducing targeted measures to urge additional investments that are deemed essential to secure an acceptable level of security of supply. In general, such capacity mechanisms remunerate existing and/or new capacity providers for rendering their capacity available, usually through long-term contracts. In this sense, “capacity” became a valuable product that could produce revenues in addition to those originating from energy sales in the wholesale markets and would, thereby, solve the “missing money” problem. Capacity could be traded bilaterally (directly between capacity providers and load-serving entities) or in centralized markets, which are advantageous in terms of reducing transaction costs and increasing price transparency. However, when such capacity mechanisms are introduced prematurely, there is a risk that cross-border electricity trading and competition may be distorted. For instance, new investments only in certain types of electricity generation technologies may be eligible for participation, thus excluding innovative technologies such as demand response (DR). They may also motivate investments only within national territories, when it would be more effective to upgrade interconnection lines and allow for increased electricity imports in case it is necessary [4].
In the above framework, it is widely known that future power systems are going to notably differentiate compared to the current paradigm, given that renewable energy production is going to account for continuously increasing shares of system load demand, while demand is expected to substantially increase its price elasticity owing to the gradual implementation of DR schemes. In this context, storage is also going to increase its market share, thus posing new challenges regarding its actual contribution to capacity adequacy. It is already acknowledged that the recent developments on the global energy landscape following Russia’s military invasion in Ukraine are going to accelerate this energy system transition, which will be accompanied by new challenges in power system operation and planning. A premature discussion on the effectiveness of the current European Union (EU) wholesale electricity market design to properly address similar energy crises in the future has already started. However, the implications of such fundamental and structural wholesale electricity market changes on the design and operation of the various capacity mechanism schemes that are currently in force, or are going to be established in the future across Europe, have not been adequately evaluated yet. In any case, the necessity and core design parameters of the current capacity mechanisms across Europe may need to be revisited in the near future, however in combination with the possible restructuring of the electricity markets as a whole.
Further material is provided as follows: In Section 2, a literature review of various research works addressing the establishment and operation of capacity mechanisms from diverse perspectives is presented. Section 3 provides an in-depth analysis in terms of the necessities that led to the establishment of capacity mechanisms, along with various fundamental technical and operational features associated with the design and operation of different capacity mechanisms, mainly in Europe and complementarily in the US. In Section 4, a practical real-life application of the envisaged Long-Term Capacity Remuneration Mechanism (CRM) in Greece is presented in detail. In Section 5, valuable conclusions are drawn and prospects for future work are outlined. Finally, in the Appendix A the main input data that have been used for the replication of the Greek CRM are presented.

2. Literature Review

Since their introduction, capacity mechanisms have been the subject of controversy and misunderstanding among regulators, policy makers and electricity market stakeholders. This is mainly due to the variety of capacity market structures, products and financial burden undertaken by the end-consumers and, therefore, have attracted much interest by the research community. Various research works dealing with capacity mechanisms have been presented so far, which can be grouped in two categories, namely (a) research works that provide a comprehensive review of capacity markets that have been established in different countries/regions, mainly in Europe and the US, and (b) research works that provide in-depth analysis of the design, implications and potential proposals for improvement of capacity mechanisms, also in view of the on-going electricity market restructuring for the accommodation of new energy and capacity resources.
In the first category, a review of various capacity markets in the US, the challenges they faced and the lessons learnt from this experience over the first decade of their operation is given in [4], while a detailed description of how the resource adequacy issue is addressed in the US under three paradigms, namely traditional regulation, energy-only markets, and markets with resource adequacy policies is provided in [5]. Another survey of US capacity markets aimed at drawing lessons for the EU is presented in [6], where capacity market experts concluded that US capacity markets were considered to have achieved their targets with regards to reliability, yet inefficiently, and advised EU member states against implementing capacity markets. A recent research overview into different capacity market mechanisms of the US only, considering issues such as market power, risk attitudes, uncertainty, and pricing rules, is also presented in [7]. In the same context, a review of various US capacity markets in the context of increasing levels of variable RES generation that finds major differences with regards to the incentives for operational performance, methods to calculate qualifying capacity for variable RES units and energy storage facilities, and demand curves for capacity, is presented in [8]. A recent comprehensive review of the international experience of the interactions between capacity mechanisms and renewable energy support is presented in [9]. Focusing on capacity mechanism schemes of individual countries, a critical review of the Italian capacity remuneration mechanism that was recently established is given in [10], while the prospective economic outcomes of setting up a capacity market in Poland, where coal is the dominant fuel (and, therefore, was supposed to experience an energy transition), is presented in [11].
In the second category, a comprehensive review of the basic economics behind the capacity adequacy problem, along with a discussion on major aspects of the suitable capacity markets’ design, implications for risk and market power, and other approaches for the solution of the revenue adequacy problem is presented in [12]. The capacity markets’ effectiveness in the presence of high RES portfolio shares is investigated in [13], concluding that the implementation of a capacity market can improve supply adequacy and reduce consumer costs. In addition, a capacity market is found to be more effective than a strategic reserves scheme to ensure reliability. A recent extensive study that proposes a long-term resource adequacy mechanism that is expected to achieve a reliable electricity supply in a RES generation-dominated environment, and aims at maximizing electricity use for space heating and transport, is given in [14]. The impacts of DR participation in capacity markets are discussed in [15], where an innovative methodology for the estimation of a load-shifting DR resource’s contribution to the adequacy of the power system is presented, indicating that the DR resource has an inherent capacity value and can combat increased capacity prices, thus yielding consumer savings. A diligent theoretical work on why and how bundling a capacity mechanism with call options and the choice of a storage derating factor may affect the competitiveness of storage units against conventional power plants is presented in [16]. A recent theoretical framework addressing the problem of power system resource adequacy against the upcoming power sector operating challenges, along with recommendations for resilient reliability metrics and methods for the calculation of de-rating capacities, is given in [17]. An outline of the adequacy challenge, focusing exclusively on how wind power is handled in the capacity adequacy regulation and how wind power is treated in a set of regions mainly in Europe, is presented in [18]. A recent study arguing on the superiority of strategic reserves over market-wide capacity mechanisms, especially in energy markets that mostly depend on notable amounts of irregular energy injections, hydro energy, and storage is discussed in [19]. Finally, an analysis of the prerequisites for the proper design and implementation of a capacity mechanism in Europe is given in [20], whereas the distinct steps that need to be taken in order to check whether a new capacity mechanism is needed in a European country in view of the EU Clean Energy Package provisions and guidelines are discussed in [21].
In the above context, the paper falls within the first category, and the scope and main contributions of this work is twofold:
(a)
A comparative analysis of various capacity mechanisms that are either in force or under approval in key countries/regions in Europe and the US is provided. Although many works have been presented in the literature so far focusing on the principles and the challenges associated with the operation of capacity mechanisms, mostly in the USA or in particular European countries as described above, to the best of our knowledge there is no reported work that provides a detailed and in-depth analysis on the necessities that led to the establishment of capacity mechanisms, along with various fundamental technical and operational features associated with the design and operation of different capacity mechanisms, mainly in Europe and complementarily in the US.
(b)
A real-life example regarding the application of a long-term capacity remuneration mechanism that is going to be established in Greece in the near future is analytically presented. A detailed simulation of the envisaged capacity mechanism auction has been performed for the forthcoming decade (2022–2031). This is aimed at estimating the outcome of the auctions as well as the total annual cost that will have to be undertaken by the electricity supply companies and, ultimately, the end-consumers under differentiated scenarios regarding the future Greek power system operating conditions. To the best of our knowledge, there is no reported work in the literature so far that addresses the detailed setup and practical replication of a capacity mechanism that is formulated according to the Reliability Options scheme, not only for the Greek power system but also for any other power system. In addition, we could not find any similar study that provides detailed quantitative results regarding the auction clearing prices, as well as the annual total cost that has to be undertaken by the end-consumers for the financing of such a capacity mechanism under differentiated power system and market operating conditions.

3. Analysis of Capacity Mechanisms in Europe and the US

In this section, a critical analysis of various capacity mechanisms that either operate or are under approval in key countries/regions in Europe and the US is given. For the ease of presentation and for the sake of comparison, we have identified ten common technical and operational aspects of the capacity mechanisms that were analyzed for all countries/regions that were reviewed on the basis of publicly available information. The set of subjects includes the following:
  • Necessity of the capacity mechanism
  • Capacity mechanism product
  • Capacity mechanism design
  • Eligibility for participation
  • Auction frequency
  • Contract duration
  • Bid limits and awarded price
  • Capacity requirement and demand curve
  • Secondary market
  • Penalties
In the following subsections, the capacity mechanisms of the following countries/regions are analyzed:
Europe: Italy, France, Germany, Belgium, Poland, Great Britain, Ireland, Cyprus
United States: Pennsylvania, New Jersey, and Maryland (PJM) Interconnection, New England
In the last subsection, a comparative presentation of the main characteristics of all reviewed capacity mechanisms is given in tabular form.

3.1. Necessity of the Capacity Mechanism

In most countries, the need for the establishment of a capacity mechanism stems from the gradual retirement of conventional capacity, system load increase, inadequate new investments, aggressive penetration of Renewable Energy Sources (RES) generation and associated implications and failures in the short-term markets operation (high price volatility, “missing money” problem for conventional units).
In Italy, thermal generating capacity has notably decreased over the last ten years, while the RES generation has noticeably increased [22]. Electricity demand is highly correlated with temperature, especially during summer months due to the extensive use of A/C systems, thus putting pressure on the already stressed electricity system. During the last few years, three critical situations took place in Italy due to lack of capacity resources [23,24], while the frequency of reaching critical situations was expected to increase further [25], also considering the goal of decarbonization of the Italian electricity system. Finally, the inelastic demand as well as the well-known “missing money” issue were two additional crucial elements that pushed the country towards the establishment of a capacity market in February 2018 [26].
In France, the power system is characterized by particular consumption thermosensitivity, thus leading to electricity consumption peaks during winter cold spells. On the other hand, the rapid development of subsidized “non-market” renewable energy, which benefits from priority dispatch in the electricity grid, led to a sharp reduction of the profitability of conventional generating units. In this framework, unforeseen weather conditions lead to uncertain payments for peak capacities that are required to fully address this peak demand. The French capacity mechanism was established in November 2016 as one way to ensure that it is compliant, with a specific criterion laid down by the French authorities for safeguarding the security of supply. It aims at providing a means of changing consumption behavior during peak-load hours, as well as to encourage adequate investment in generating units and demand-side response capacity [27].
During recent years, Germany has aimed at increasing its environmental friendliness while ensuring cost efficiency as well as a high reliability of electricity supply. This energy transition is mainly based on the aggressive penetration of RES energy, in particular on-shore and off-shore wind farms and photovoltaic (PV) plants, the gradual phase-out of nuclear energy in the short-term and the phase-out of coal plants in the mid-term. The last two measures called for a premature yet substantial decommissioning of nuclear and coal-fired generating units already in the short-term. For the time period that the intensive restructuring of electricity infrastructure is progressing, it was considered that additional capacities will be needed, mainly during unforeseen or extreme events [28]. This necessity led to the establishment of the German capacity reserve mechanism in February 2018 [29], which safeguards the ongoing restructuring of the electricity system and serves as an additional reserve resource in extreme situations when all available market mechanisms have been exhausted.
In Belgium, the establishment of the capacity mechanism in September 2020 was due to the need to ensure security of supply. It was considered that Belgium would encounter a severe crisis regarding capacity adequacy after 2025 [30], owing to the forthcoming phase-out of nuclear units between 2022–2025 and the accelerated thermal generating units’ phase-out in neighboring countries. Certain market failures, such as inefficient market signals (market prices cannot reach Value of Lost Load (VOLL) levels), high price volatility, “missing money” problem, and lack of investments, are also key factors in the creation of the mechanism. Currently, a strategic reserve is implemented until 31 March 2022. However, according to Belgian authorities, strategic reserves are mainly focusing on maintaining existing baseload (mainly nuclear) generating units or DR facilities available so as to contribute to back-up capacity during peak times. Therefore, that mechanism is not appropriate to allow for the introduction of large amounts of new flexible resources [31].
According to the Polish authorities, the Polish electricity market would confront extensive temporary retirement and gradual withdrawal of existing ineffective generating units until 2020. This would render the electricity market unable to cover peak system load. Actually, Poland has already come up against electricity shortages in 2015, which led to restricted electricity supply to many industrial end-consumers. It was improbable that these concerns would be resolved only by the market itself, as the market in Poland suffered from the so-called “missing money” problem. The European Commission (EC) accepted the Polish arguments and approved the capacity market in February 2018 as a form of public aid compatible with the single market [32].
Great Britain’s electricity market was going to change significantly during the previous decade [33], jeopardizing the security of supply: It was estimated that 20% of total electricity production in 2011, mainly generated by coal plants, was about to stop by 2020. Demand for electricity was also supposed to notably increase in the forthcoming years, whereas Great Britain’s attempts at the decarbonization of electricity generation would increase the dependence of the electrical power system on less flexible forms of electricity generation, like nuclear and wind power. Such changes could introduce an investment issue, particularly with regards to gas-fired units [34]. These units would not be needed to be available so often, and would be dependent on rare high prices in order to compensate for their investment costs, resulting in a low investment rate and insufficient, reliable capacity in place in order to fully cover demand.
In Ireland, among the main market failures that have a negative effect on the capacity providers’ ability to earn sufficient revenues to compensate for their fixed and variable costs lie the “missing money” problem as well as the concept of reliability as a public good. This implies that suboptimal levels of reliability are going to be obtained owing to the consumers’ inability to communicate the maximum amount of money they would pay if they were individually disconnected, based on their individual value of lost load [35]. Additionally, the large and increasing levels of uncertain renewable injections, along with the restricted DR potential and the comparably insufficient interconnecting capacities (only two high-voltage direct current (‘HVDC’) lines with Great Britain) have led to a notable need for flexible resources that can commit themselves when renewable energy is unavailable.
Cyprus is highly dependent on fossil fuels for energy consumption (over 8% of its Gross Domestic Product (GDP) is spent on fossil fuel imports to cover its electricity needs), which renders it vital to develop both its own hydrocarbon and RES facilities. However, the Cypriot power system has specific restrictions affecting RES integration and power system reliability, like the absence of interconnecting lines with the trans-European power grids, an upper bound to the RES generation that can be injected to the power grid owing to the unforeseen production of RES units, and a lack of centralized storage framework. In this context, Cyprus is currently in the course of implementing a strategic (contingency) reserve mechanism to mitigate concerns related to short-term capacity adequacy.
In the US, the PJM’s capacity market was established to mitigate price volatility and provide stability for differentiated categories of capacity, recognizing the locational value of capacity. The aim of the capacity market is to ensure that there is adequate capacity to fully cover peak demand in the forthcoming years. PJM was operating a short-term electricity market model until 2007, which was indifferent for investors, given that the electricity market prices were not high enough and, therefore, investing in new capacities entailed a notable risk [36]. Owing to the absence of new investments, the moderate growth of electricity generation and the constantly increasing system load demand, the system ability to fully cover the future peak demand became questionable [37,38]. The said capacity mechanism was set in operation in 2007 so as to secure the amount of necessary capacity to meet demand through new investments in generating capacity.
Finally, in New England the two main factors that called for the establishment of the capacity market in 2008 were the increasing electricity production from intermittent generation sources that led to low wholesale market prices and high price volatility, thus rendering the investment in conventional generation sources rather unattractive due to the “missing money” problem [37], as well as concerns on the ability of the power system to meet future peak loads given the ever increasing demand for capacity.

3.2. Capacity Mechanism Product

The most common product that is traded in the various capacity mechanisms examined is the traditional capacity availability, as is the case in Poland, Great Britain, PJM and New England. In these countries, successful capacity resources sign a capacity contract according to which they must provide capacity as much as the contracted quantity for a specific time period, especially during stress events, in exchange for a fixed remuneration (in €/MW-y). Capacity resources are usually obligated to offer an amount of capacity, which is at least equal to their capacity contractual obligations, on both the Day-Ahead Market and the Real-Time Market.
A modern variation of capacity availability in the form of Reliability Options (ROs) is traded in Italy, Belgium, and Ireland. The successful capacity providers in the central auction sell the ROs to the central buyer (which is usually the Transmission System Operator (TSO)) and are compensated with a fixed capacity premium. When a reference price (which is usually calculated as a function of the respective day-ahead and/or balancing market clearing prices) exceeds a pre-defined level, the so-called “strike price”, the capacity provider is obliged to pay back the difference between the reference price and the strike price to the central buyer, which is computed on the basis of the contracted capacity quantities. In this way, on the one hand the capacity providers’ revenues from the energy market are upper-bounded to the strike price, but on the other hand capacity providers safeguard a fixed and certain capacity remuneration. Equivalently, the capacity resources cannot take advantage of unsure scarcity rents in exchange for being remunerated at a fixed amount. This considerably reduces the risk of uncertain revenues and, thus, the risks related to the prospective investment. The RO objective is twofold: First, the payback obligation sets an upper bound on the possibility for windfall profits, and second, incentivizes capacity market units to be available in moments relevant for security of supply [30].
The long-term availability of reserve capacity (strategic reserve) is the product traded in Germany and Cyprus, where capacity resources that are successful in the auctions do not participate in the wholesale market, and are called to get into operation only when the wholesale market has failed to clear and TSO has no other available balancing resources.
Finally, the product of the French capacity market is Capacity Guarantees. Each Capacity Guarantee represents 0.1 MW and can be traded either directly (over-the-counter) or in an organized market.
The locational value of capacity is recognized and appropriately remunerated in Italy, PJM and New England. In this case, the capacity of a single area can contribute to the adequacy of other areas, provided that the transmission grid limits between areas are not violated by usually implementing a market splitting algorithm similar to the one used for the clearing of the respective day-ahead markets [26,38].

3.3. Capacity Mechanism Design

Traditional capacity mechanisms and those organized in the form of ROs are volume-based and market-wide mechanisms, where central auctions administered by the TSO allow for capacity trading, and which aim at procuring the amount of capacity that is necessary to secure capacity adequacy. Each capacity auction is organized as a sealed-bid auction (Belgium, PJM), a sealed-bid combinatorial auction (Ireland) or a descending clock auction (Italy, Poland, Great Britain and New England).
In the auctions that follow the sealed-bid format, bids are placed by bidders anonymously and the auction is subsequently cleared in a single round. In Belgium, it was argued that the sealed-bid auction format mitigates the potential for market power exercise and, in contrast to descending clock auctions, bidders do not have to commit themselves for typically two to three daily intervals so that they are available to counteract on the information that is revealed during the auction procedure. Therefore, the sealed-bid auction is a simple and not time-consuming auction procedure that also allows for further lowering the barrier to entry, especially regarding newcomers and smaller players and DR capacity providers whose main business is not the electricity market [30].
In the sealed-bid combinatorial auction, one or more bids are submitted per capacity resource simultaneously, where each bid consists of a single pair of price and quantity for each delivery year. Each capacity resource may select to place more than one bids, but these bids are mutually exclusive, i.e., the auction operator cannot accept more than one bid submitted by the same capacity resource. The auction operator then decides which is the optimal bids’ combination to meet the predefined capacity requirement [35].
In the descending clock auctioning format, the auction operator sets a high price in the first round of the auction and eligible capacity providers place their bids to declare the amount of capacity they want to sell at that price. This is a repetitive procedure in consecutive rounds following a pre-defined schedule. In each round, capacity units can place their exit offer in order to withdraw from the following auction rounds, according to specific auction rules. Exit offers are finally sorted in order of increasing exit prices to formulate the supply curve. The procedure terminates when the auction finds the lowest price, at which the supply curve intersects with the demand curve [26,33].
In Germany and Cyprus, the TSOs procure the strategic reserve capacities by means of tenders, where capacity providers bid for the yearly remuneration they are willing to receive in order to maintain their own capacity available. The owners of the capacity units are neither allowed to submit their strategic reserve capacity quantities to the wholesale market, nor they are able to actively return to the wholesale market once their strategic reserve contract is terminated. Capacity providers do not have the right to sell on their obligations. Rights that arise from their participation in the Capacity Reserve to other entities must be at the disposal of the TSOs throughout the entire contract. The Capacity Reserve is called to be dispatched when the market is unable to clear, i.e., TSOs can call the Capacity Reserve as a last resort only, so that it can only be used once all other system services are unavailable [29].
In France, it is mandatory that all electricity suppliers, consumers (for consumption that is not served by a signed agreement with a supplier) and network operators (for the procurement of power grid losses in the power grid) contribute to the security of supply proportionately to the electricity consumption they represent. This obligation requires that on an annual basis, each of them must prove that they have a certain number of Capacity Guarantees to cover their own and their customers’ peak-period consumption. Suppliers can obtain Capacity Guarantees either directly from their own resources (generating units or DR entities) or from other holders (capacity operators, other suppliers, traders, consumers who are their own suppliers, etc.) either bilaterally (Over-The-Counter) or through centralized auctions. On the other hand, RTE must certify the generating units’ or DR entities’ (‘capacity operators’ or ‘operators’) capacity. RTE allocates capacity guarantees to capacity operators on the basis of the extent that their plants are estimated to contribute to reducing the risk of electricity shortage during peak-load demand periods [27].
In most cases, capacity mechanisms are financed through a charge that is imposed by the TSO on the final end-consumers, either directly or through their electricity suppliers on a monthly basis. The charging amount is usually computed on the basis of the user’s contribution to peak system load. Particularly for ROs, the amount of this charge corresponds to the aggregated premiums paid to the capacity providers, minus the amount that capacity providers return to the TSO, when capacity providers sell electricity to the short-term market above the strike price [26].

3.4. Eligibility for Participation

In most capacity mechanisms participation is voluntary. It is usual that capacity mechanisms are technology-neutral, i.e., all existing and new capacity units may take part, including energy storage entities and DR operators, provided that they prove that the capacity resource facility is within the country and fulfills an extended set of prerequisites (eligibility criteria). Interconnection capacity is also eligible to participate (Great Britain, Ireland, Belgium, Poland). The minimum participation threshold is usually very low and is set at 1 MW in Belgium, 2 MW in Poland and Great Britain, 0.1 MW in France, PJM and New England, whereas no minimum bid size exists in Ireland. Aggregation of units with installed capacity below the minimum threshold, so that these units become eligible to participate in the auction process, is allowed in some countries (Belgium, Great Britain).
In France, the participation in the capacity mechanism is voluntary for the capacity operators (generating units, demand response operators) but mandatory for electricity suppliers (retailers), network operators (representing system and network losses) and consumers, for consumption outside a supply contract. All these entities have to demonstrate that they possess a stated number of Capacity Guarantees in proportion to their own and their customers’ electricity consumption during peak times [27].
In PJM, the participation is obligatory for all Load Serving Entities (LSE) and all existing generating units, while it is voluntary for planned generating units, existing and new demand resources, and energy efficiency resources [39].

3.5. Auction Frequency

The auctioning process for traditional capacity auctions and ROs usually comprises main auctions followed by additional (adjustment) auctions. Adjustment auctions aim at fine-tuning the quantities awarded during the main auction in response to changing market conditions as the delivery period comes closer.
In Italy, the main auction has a lead time of four years (Y-4 auction). Typical adjustment auctions take place in years Y-3, Y-2, and Y-1 for the award of one-year contracts. A similar timeline is followed in Belgium, Great Britain, and Ireland, which are differentiated only in terms of the number and timing of the adjustment auctions (only one adjustment auction in Y-1 in Belgium and Great Britain, two adjustment auctions in Y-2 and Y-1 in Ireland). In Poland, the main auction is conducted during November/December of the year Y-5, while four extra simultaneous auctions (each corresponding to three month-period of the delivery year) are conducted from January to March of the year Y-1.
In PJM the main auction (Base Residual Auction) takes place each year in May and has a three-year lead time (Y-3 auction). Incremental Auctions take place after the Base Residual Auction and before each delivery year begins in months M-23, M-13, and M-3 [38,39]. A similar scheme is followed in New England, where the main auction is held 3 years prior to the delivery year (Y-3 auction), whereas annual (Y-1 auctions) and monthly (M-1 auctions) reconfiguration auctions are held.
In Germany the reserve capacity auctions take place every 2 years, while in Cyprus the auctions will take place annually, during November and December of year Y-1. Finally, in France auctions may be held in March, April, June, September, October and December of year Y-1.

3.6. Contract Duration

The duration of the capacity contracts depends on whether the successful capacity provider is an existing or new capacity unit (most mechanisms allow for longer contracts for new capacities) as well as on the associated capital expenditure, while they are technology-neutral. In Italy, capacity obligations last for 3 years for existing capacity resources and 15 years for new capacity [26]. In Ireland, existing capacity can acquire 1-year capacity contracts, whereas new capacity can acquire capacity contracts of up to 10 years [35]. In Belgium, the capacity contract duration is primarily 1 year. However, depending on the investment cost range, domestic capacity resources may request a longer contract duration up to 15 years, while new capacity units do not necessarily receive 15-year contracts [30]. In Poland, capacity contracts for existing generating units or demand side response operators range from 1 year (for those capacity providers not undertaking any particular capital expenditure) to 5 years, while new capacity providers are entitled from 5-year to 15-year capacity agreements. Capacity providers that are eligible to claim for 5-year and 15-year contracts will earn a contract extension by 2 years only if they are fully compliant with strict emission performance standards [32]. In Great Britain, existing capacity is entitled to 1-year contracts that can be extended to 3 years in case of plant refurbishment, while new capacity is entitled up to 15-year contracts [33]. In PJM and New England, only 1-year contracts are available [38,39].
Regarding strategic reserve schemes, in Germany the capacity contract duration is 2 years [29], while in Cyprus 1-year contracts will be provided. Finally, in France a Capacity Guarantee lasts for 1 year. Although contracts that exceed the 1-year duration were not allowed in the beginning, after many discussions, new capacity resources can claim 7-years contracts, provided that these resources remain competitive during the entire duration of the contract.

3.7. Bid Limits and Auction Clearing Price Mechanism

In general, capacity providers that participate in the capacity mechanisms may offer capacity in accordance with their de-rated capacity, which implicitly represents the unavailability rate of each unit, taking into account relevant unit technical data such as the maximum capacity, the forced outage rate, etc. The assessment of the de-rated capacities is usually carried out by the TSOs before each auction.
Bid caps are also usually set and their purpose is to protect consumers from unforeseen issues that could emerge in the auction, such as absence of competition or market power exercise. Bid caps are usually differentiated between existing and new capacity, whereas auction price caps can also be different. In Italy, the bid cap for offers submitted by existing capacity lies in the range from 25,000 €/MW-year to 45,000 €/MW-year, taking into account the yearly fixed operating costs of combined cycle gas-fired plants (not including depreciation). The bid cap for new capacity (which also serves as the auction price cap) lies in the range from 75,000 €/MW-year to 95,000 €/MW-year [26]. A similar differentiation between existing and new capacity takes place in Poland, where the bid cap for the price-making new capacity is set as 1.5 × Cost Of New Entry (CONE) and lies in the range 97,500–105,000 €/MW-y, while the bid cap for the existing capacity acting as price-takers is equal to 45,000 €/MW-y [32]. Similar price caps are established in Belgium (80,000–105,000 €/MW-y), Ireland (138,450 €/MW-y for new capacity and 46,150 €/MW-y for the existing capacity) and Great Britain (75,000 £/MW-y for new capacity and 25,000 £/MW-y for the existing capacity). In the US, the price cap in the PJM region is set as a function of the CONE minus the estimated revenues acquired by the energy and ancillary services markets, while in New England the price cap and price floor (which correspond to the starting and end price of the descending clock auction format, respectively) are calculated as a function of the CONE [39]. In Germany, the price cap has been set equal to 100,000 €/MW-y [29], while in Cyprus it is expected to be equal to 33,000 €/MW-y. Finally, in France the maximum and minimum bid limits are not defined on a permanent basis but change every year. The price cap in 2017 was equal to 20,000 €/MW-y, while in 2018 and 2019 was equal to 40,000 €/MW-y and 60,000 €/MW-y, respectively.
Regarding the auction clearing price mechanism, the “pay-as-clear” principle is the most popular among all mechanisms studied, since it is followed in all regions except from France, where the “pay-as-bid” clearing mechanism is applied, and Belgium (only for the first two delivery years).

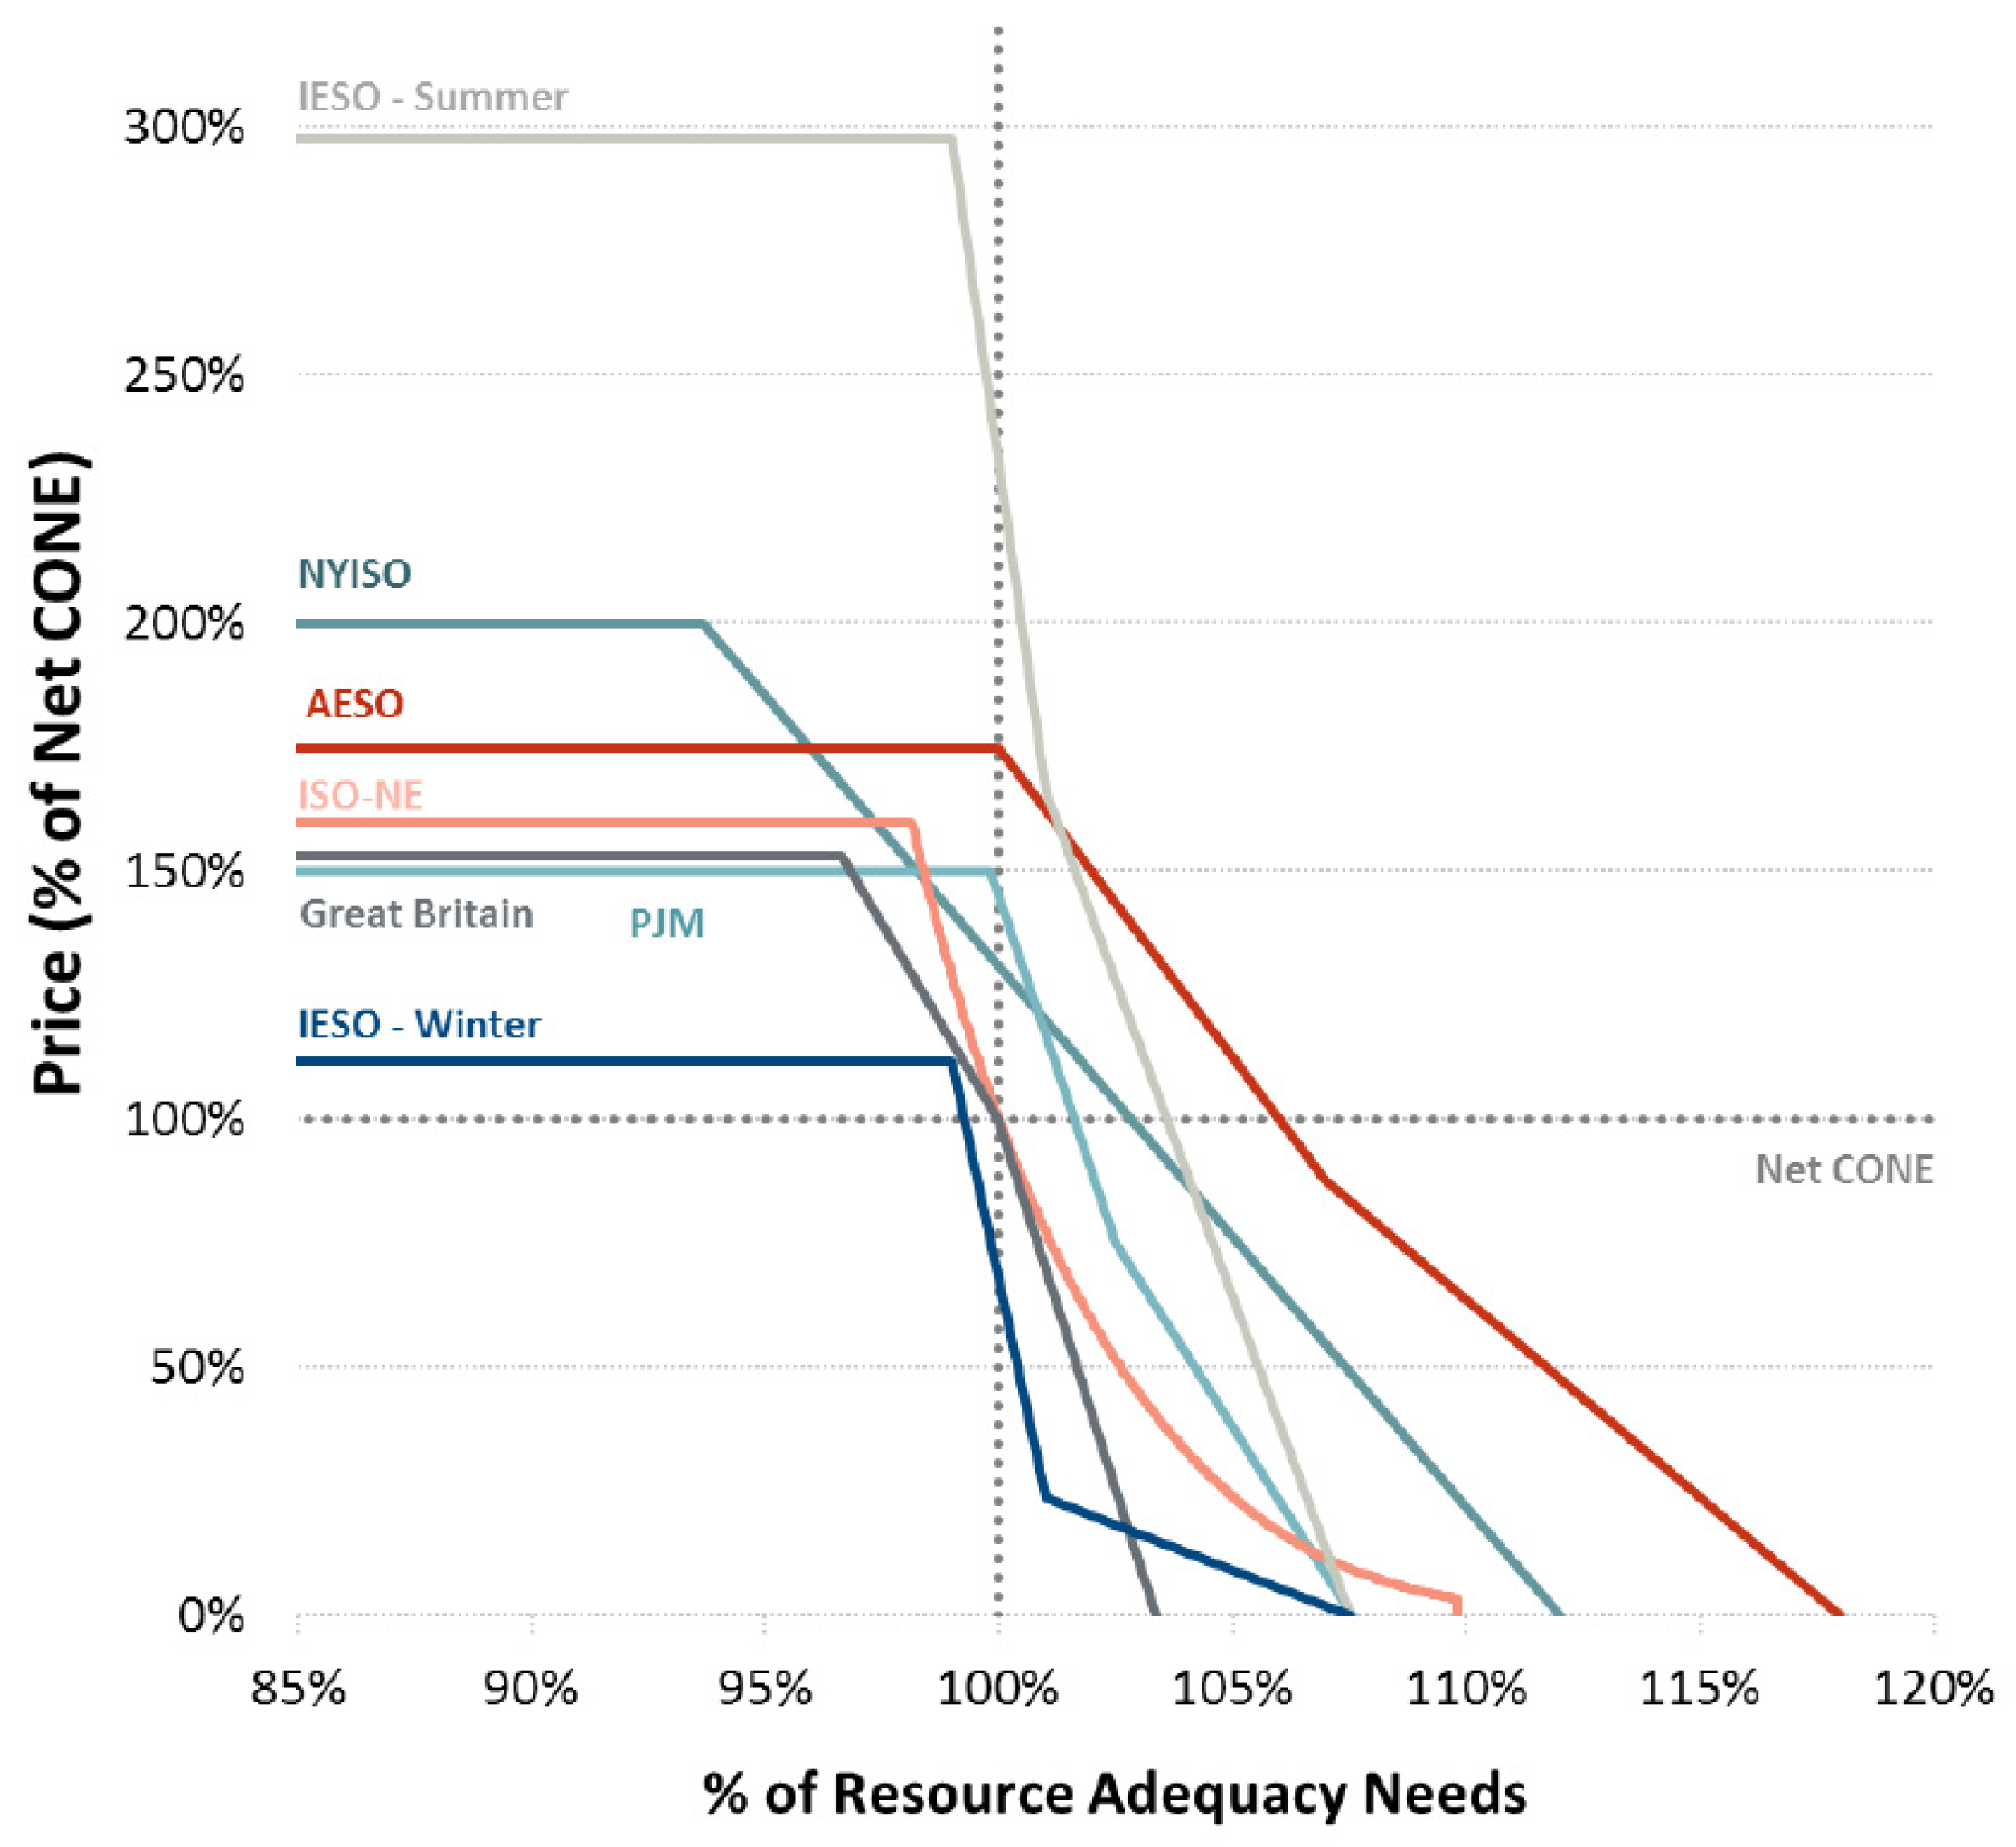
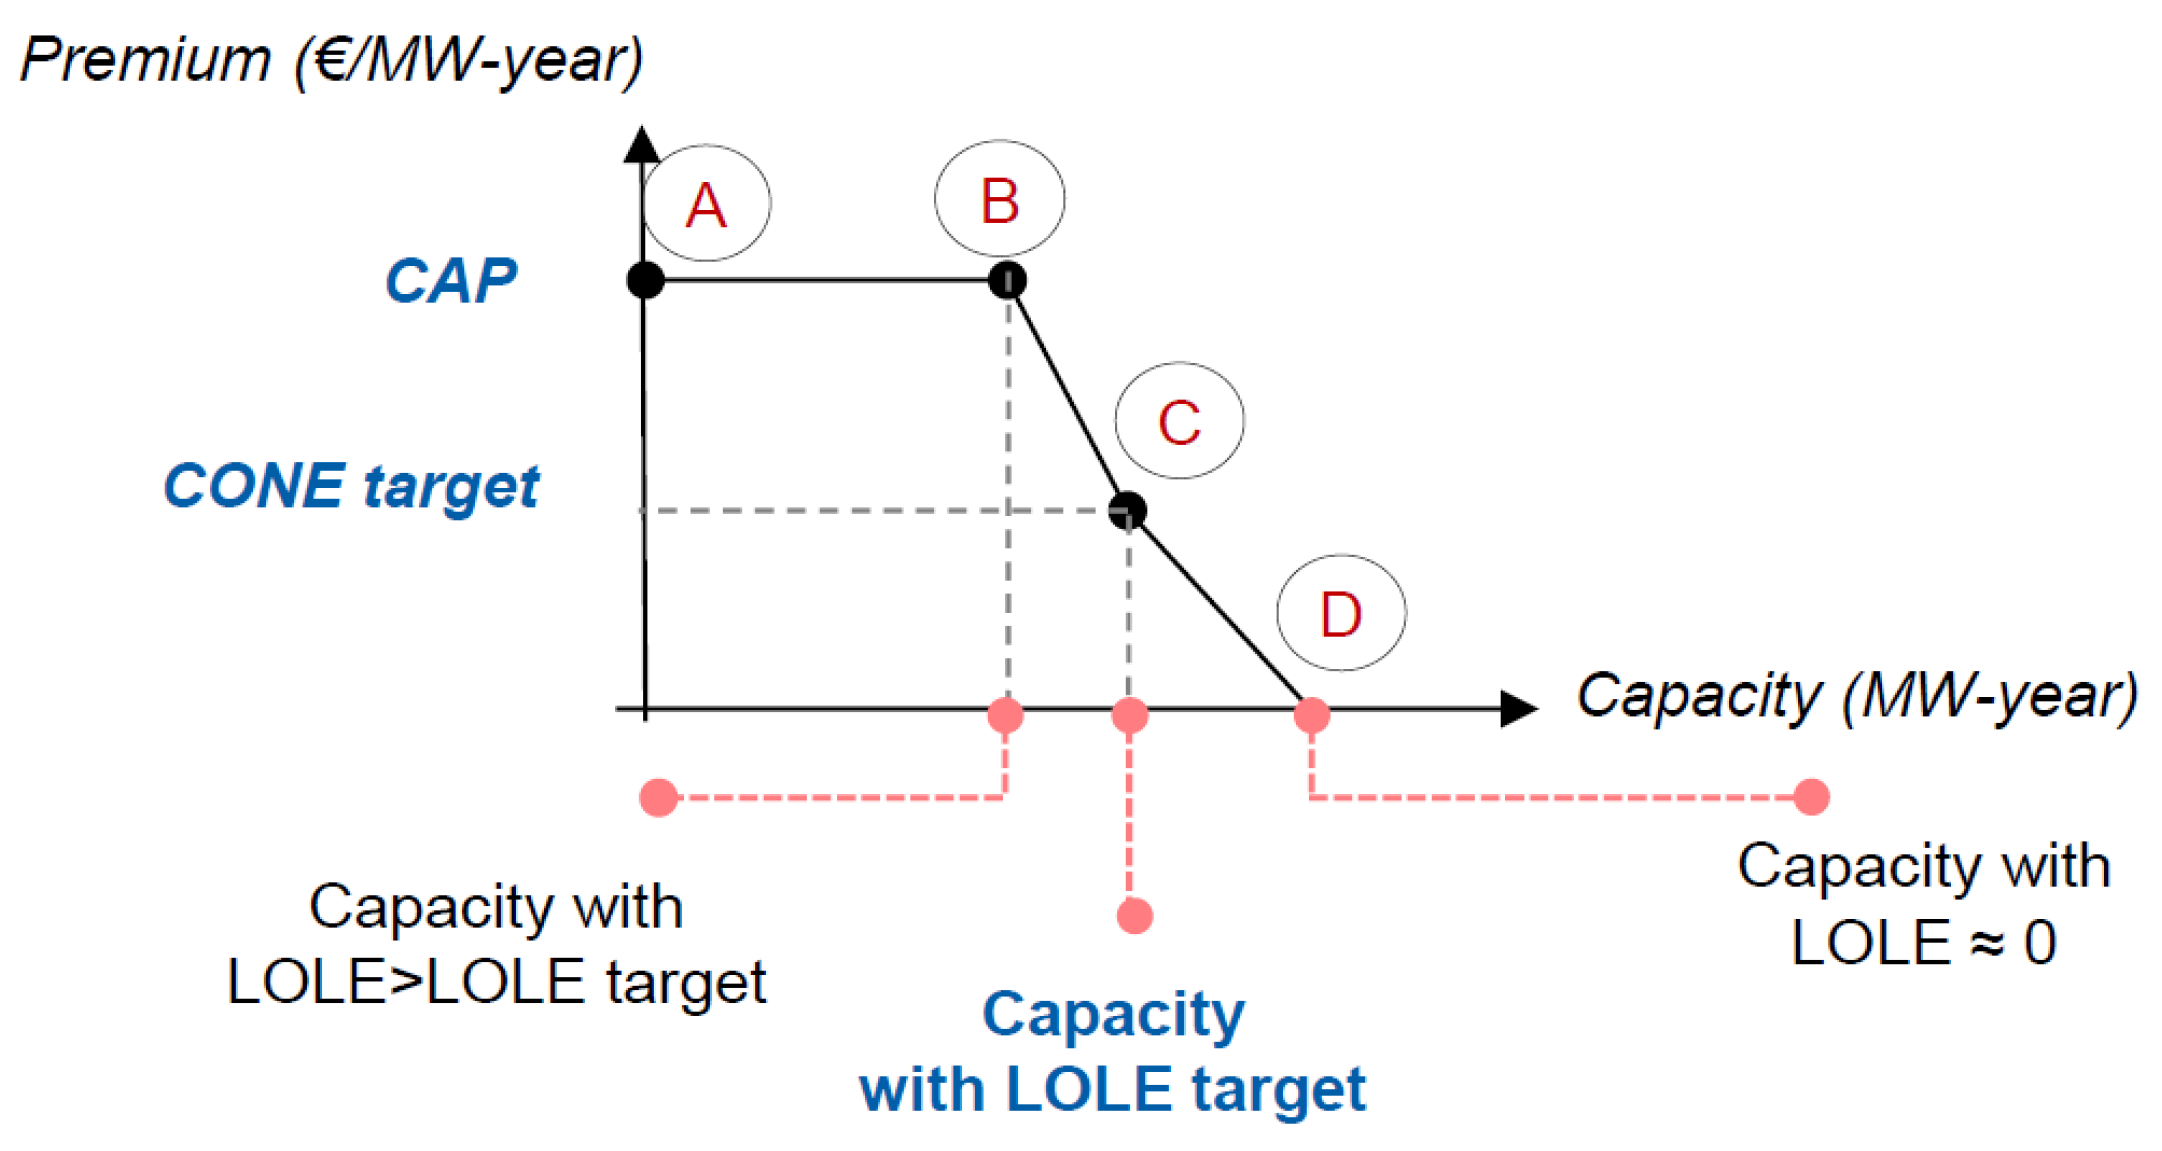
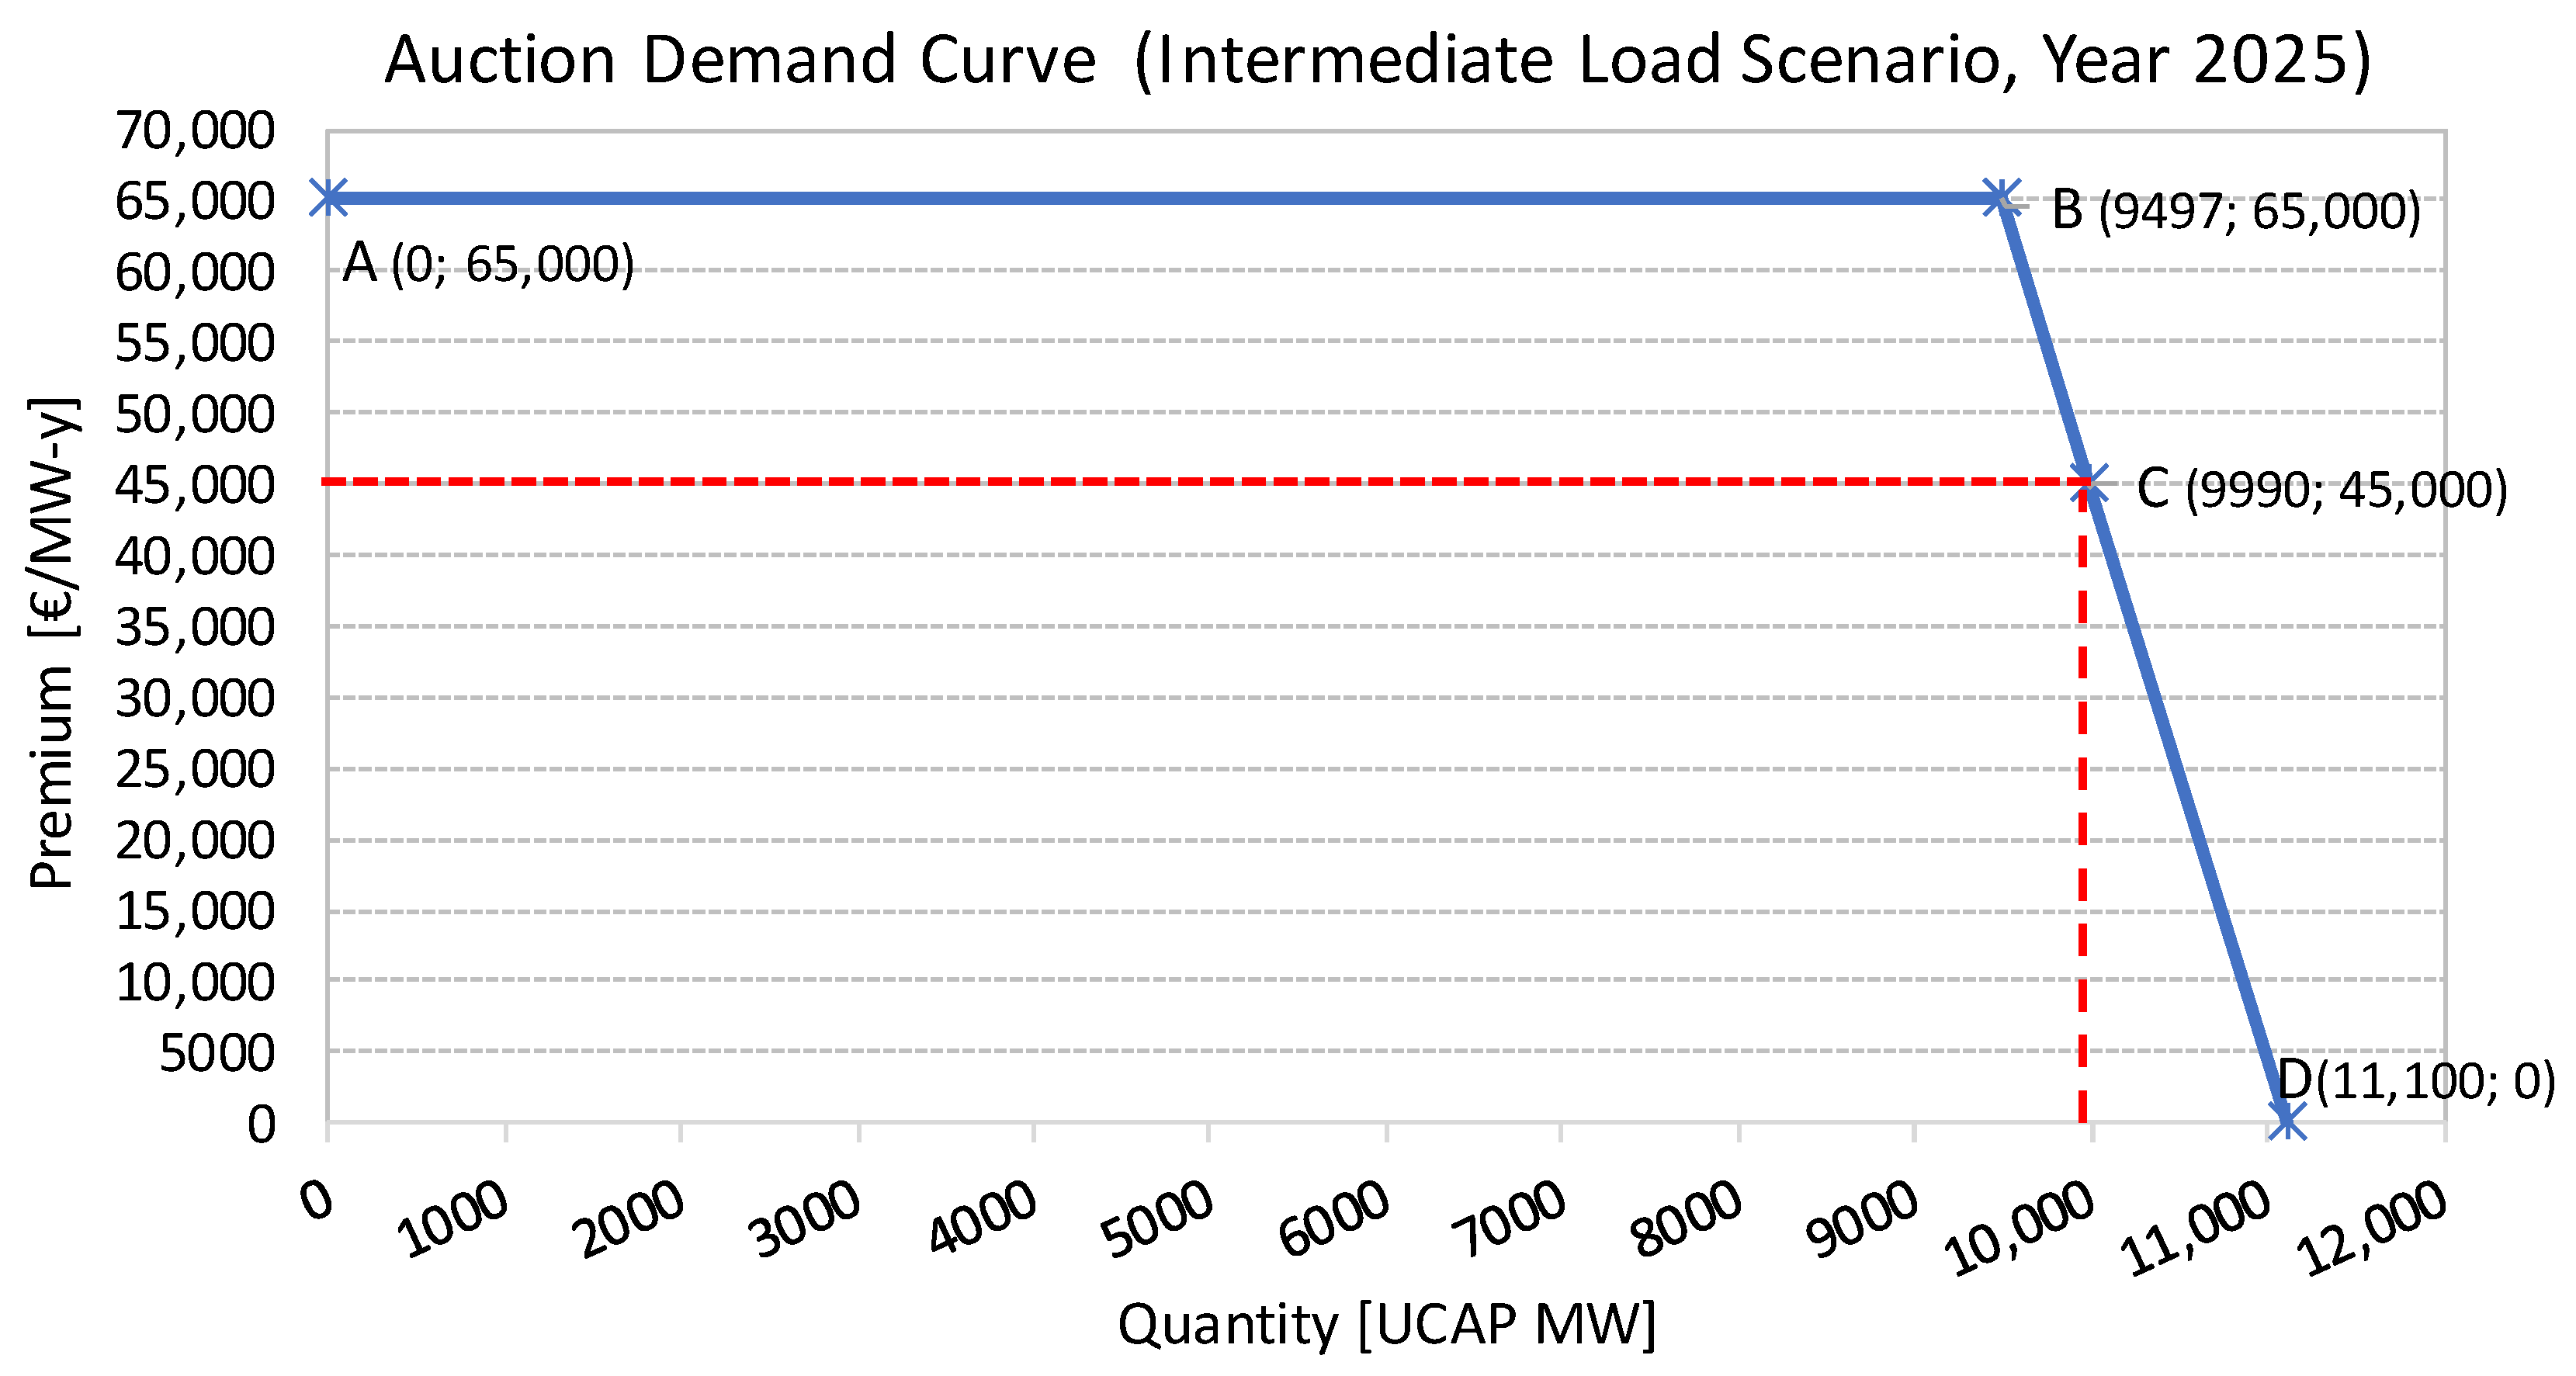
3.8. Capacity Requirement and Demand Curve

Traditionally, capacity adequacy is evaluated on the basis of the calculation of two widely known power system reliability indices, namely LOLP (Loss of Load Probability) and LOLE (Loss of Load Expectation. By definition, LOLP is a traditional index that measures the probability of not meeting demand owing to insufficient capacities, either because of a sequence of plant outages or because of under-investment. It is usually calculated on an hourly basis through power system and market simulations in conjunction with the implementation of sophisticated probabilistic methodologies, such as convolution (for more details, please refer to [40,41]. By definition, the LOLE metric represents the time (in hours) during which load is higher than the available generating capacity. In mathematical terms, LOLE is the sum of LOLPs during a study period (e.g., one year) and is defined as follows:   L O L E = t = 1 T L O L P t .
Capacity requirement is normally determined by the TSO. The amount of capacity to be procured though the capacity auction (known as target volume) is defined by LOLE, the Value of Lost Load (VOLL) and the Cost of New Entry (CONE) indicators. The target volume is quantified based on the legal reliability standard, which tally to a certain LOLE value. Apparently, the higher the LOLE is, the higher is the probability that the power system will be unable to fully meet demand at all times over a given time period (i.e., usually one calendar year) due to insufficient capacities. In the case that a country adopts an extremely low LOLE standard (e.g., 0.1 h/y), on the one hand the risk of load shedding is minimized, but on the other hand the need to construct and maintain excess and reliable available capacity is maximized. In turn, this will require more investments in reliable capacity resources, thus increasing the total cost to be undertaken by the end-consumers that will finally finance the required capacity mechanism scheme. In this context, each country is responsible to decide which target LOLE value is adopted (also known as “LOLE standard”) in order to balance effectively between guaranteed capacity availability and the risk of not fully meeting demand at all times. Most countries adopt a LOLE standard that is equal or close to the widely known “1 day of load loss during a 10-year period” criterion (or, equivalently, LOLE = 2.4 h/y) [40]. Italy, Belgium and Poland adopt a target LOLE equal to 3 h/y, while Ireland uses a significantly higher target LOLE (8 h/y). In Germany the capacity requirement is fixed to 2 GW, while in France the capacity obligation of each supplier is calculated on the basis of the 100–150 peak-load hours per delivery year, according to load forecasts performed by the TSO. In PJM, the target capacity is calculated as a multiple of the annual peak load forecast in order to ensure that there will be enough unforced capacity to provide an acceptable reliability level, whereas in New England the “1 day of load loss during a 10-year period” or, equivalently, the 2.4 h/y criterion is adopted.
Regarding the design of the demand curve, Figure 1 illustrates a comparison of various demand curves from different capacity mechanisms worldwide [42], while Figure 2 provides a detailed view of the demand curve of the Italian capacity mechanism [26]. A vertical demand curve for the procurement of a fixed quantity equal to the target requirement would be the easiest option. However, a vertical demand curve results in noteworthy capacity price volatility, is prone to market power exercise, and does not recognize the gradual change in marginal reliability value, as capacity requirements vary [42]. These inefficiencies are overcome by the downward-sloping design, which is the most popular and has been adopted in Italy, Poland, Great Britain, Ireland, PJM and Belgium only for the main auctions. A downward-sloping demand curve indirectly defines the precise volume that the central buyer purchases in the auction. In other words, if the offered price remains below a certain level (e.g., the value of CONE), the central buyer will buy additional capacity and, on the other hand, if the offered price of capacity lies above the CONE, the central buyer will procure less quantity.
Apparently, the value of the key parameters that define the exact shape of the demand curve (e.g., price cap, target capacity, CONE target, and excess capacity, see points A–D in Figure 2 [26]) may vary among the countries, as shown in Figure 1 [42].
A vertical demand curve is used in New England, Germany, Cyprus and Belgium (only for the Y-1 adjustment auctions), while no demand curve is used in France.

3.9. Secondary Market

Secondary markets allow capacity providers to perform secondary trading and volume reallocation to improve their risk management, once the primary market has cleared. In fact, in case a capacity provider faces a lower availability than its contractual capacity, it is able to compensate in the secondary market for the positive difference between its contractual quantity and its available capacity, without facing any sanctions for not being available. Transactions on the secondary market presuppose that all obligations (including the strike price of the initial obligation as far as an RO mechanism is concerned) are fully transferred. A secondary market is mostly organized as a centralized market (Italy, France, Belgium, Great Britain, Ireland). A bilateral market operates in PJM, while in New England relevant trades take place during the so-called “reconfiguration auctions”. In Poland, a secondary market functions in a decentralized manner (OTC contracts) or through organized third parties, such as commodity exchanges. Finally, in Germany and Cyprus no secondary market is available.

3.10. Penalties

Capacity providers that were awarded capacity in a capacity auction are subject to penalties for non-fulfilment of their contractual capacity obligations. In general, any positive difference between the contractual and available capacity during an hour is liable to an availability penalty.
In Italy, in case of temporary non-fulfilment, TSO suspends the payment of the capacity premium that corresponds to the time period in which the non-fulfilment occurs, while a penalty is applied for a definitive not-fulfilment, when the temporary non-fulfilment lasts for more than three months. In Belgium, a monthly penalty limit equal to 20% of the respective revenues is in force. In Poland, capacity providers that perform below the expected level of performance are penalized on the basis of a penalty regime that applies hourly, monthly and annual limits, while those that over-perform receive additional delivery payments. In this way, each capacity provider’s revenues widely reflect their actual performance. In Great Britain, the penalty rate is equal to 1/24th of the auction’s clearing price. The penalty cannot be higher than the 200% of a capacity resource’s monthly revenue from the corresponding capacity contract. In addition, the maximum monetary sanction for a capacity resource entity cannot exceed the 100% of its annual total revenues [43,44]. Capacity providers who deliver higher amounts of capacity than is contractually required during stress events enjoy additional revenues.
In Germany, the successful capacity providers are subject to trial calls without being notified in advance. If an installation does not fulfill the predefined requirements, a penalty equal to the 20% of the total fixed remuneration for the entire delivery period is imposed to the capacity unit.
In France, financial settlements are structured similarly to the mechanism that is implemented for energy, according to which suppliers are paid in the event of a positive imbalance and are charged for a negative imbalance.
A more complex penalty regime has been established in the PJM and New England regions, where penalties are imposed to generating units that fail to fulfill their contractual obligations in terms of capacity provision during the delivery year. The relevant penalty amounts are calculated on the basis of the auctions’ clearing prices in which the unit participated, while maximum daily, monthly and annual limits also apply.
Finally, no penalties apply in the Irish and Cypriot capacity mechanisms.

3.11. Comparative Presentation of Capacity Mechanisms

Table 1 presents a well-structured and concise summary of the main conceptual, technical and operational features of all examined country-wise capacity mechanisms. In fact, it constitutes an easy-to-follow and comparative view of the detailed and in-depth analysis that was already presented, since its content is organized in subjects/categories that follow exactly the structure of Section 3.1, Section 3.2, Section 3.3, Section 3.4, Section 3.5, Section 3.6, Section 3.7, Section 3.8, Section 3.9 and Section 3.10.

4. Long-Term Capacity Remuneration Mechanism in the Greek Electricity Market

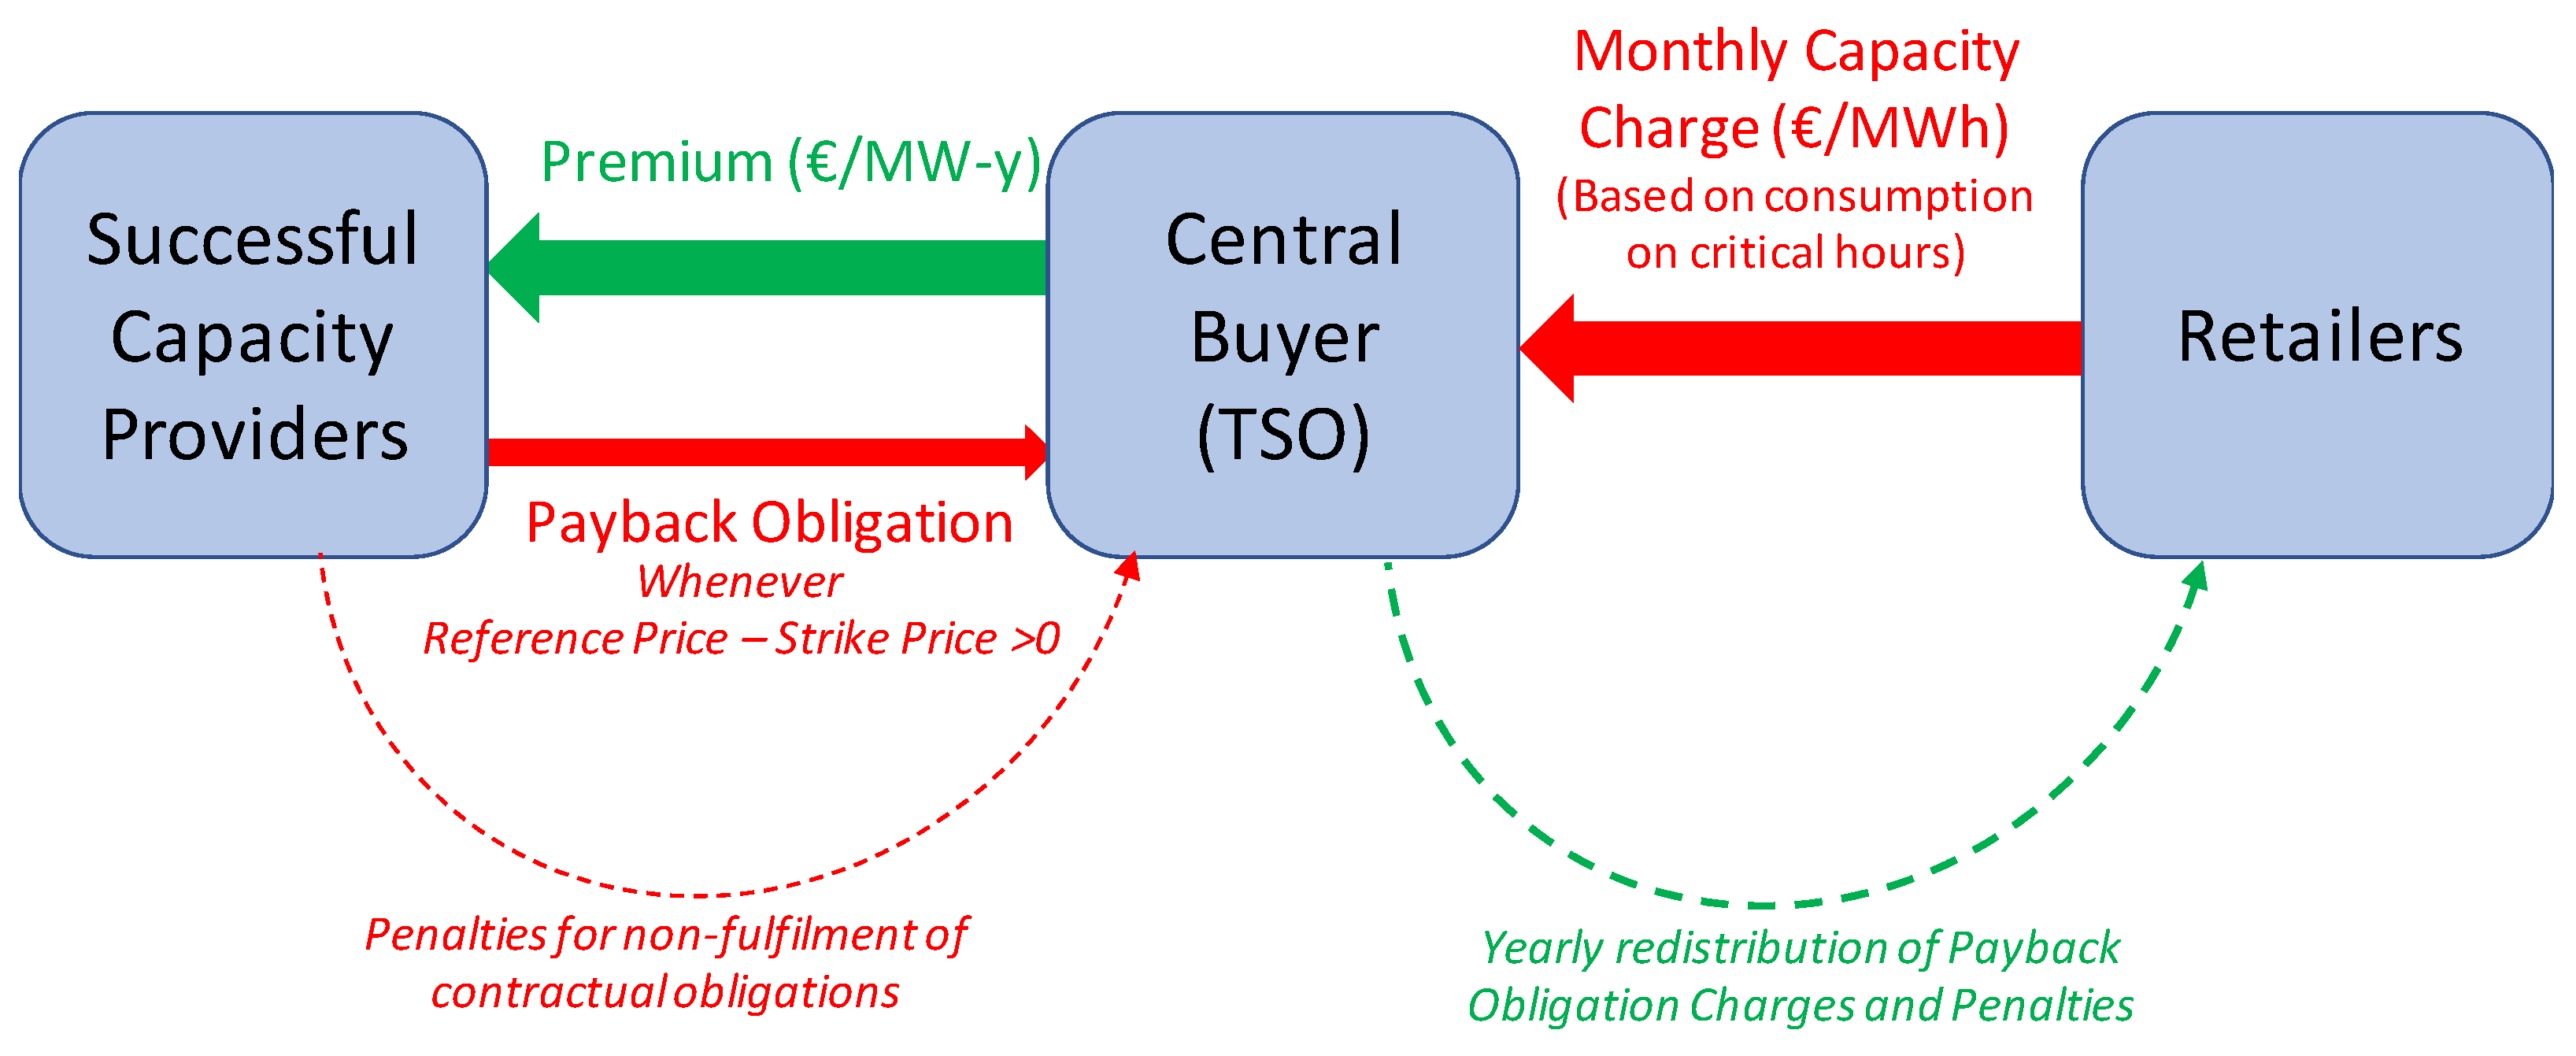
4.1. Overview of the Greek Capacity Remuneration Mechanism

A draft proposal for the establishment of the future Long-Term Capacity Remuneration Mechanism (henceforth “CRM”) was put to public consultation by Greek Authorities in April 2019 [45]. According to that scheme, CRM is expected to be formulated as a volume-based and market-wide mechanism, where Reliability Options (“ROs”) are traded in centralized auctions administered by the Greek Transmission System Operator (ADMIE). The goal is to procure the quantity of capacity required in order to ensure generation adequacy and protect consumers while the market evolves.
Following the discussion in Section 3, the proposed mechanism is volume-based, since ADMIE will define the quantity of capacity that is needed for satisfying the LOLE target (demand curve). It is also market-wide, since ADMIE is going to obtain that amount from all eligible capacity resources through a competitive auction. The compensation of capacity providers will be the outcome of a “pay-as-clear” auction in which supply (capacity availability provided by eligible resources) and demand (system peak load) will participate. Capacity providers that will be successful in the auction will receive fixed regular payments (“premium”) and will be required to:
(i)
comply with certain availability obligations during the delivery period
(ii)
pay any difference between the market Reference Price and the Strike Price whenever the Reference Price exceeds the Strike Price (‘Payback Obligation’) and
(iii)
incur penalties for non-availability.
Therefore, the successful capacity providers, which will be awarded capacity in the auctions, will enter into a Contract for Differences (CfD) with the TSO. In other terms, the contracts are an RO bought by the TSO in order to hedge suppliers from high prices in the reference markets. Figure 3 illustrates the high-level design of the proposed CRM. More details on the design of the proposed CRM can be found in [45]. We strongly believe that the Reliability Options scheme (ROs) that has been proposed for the Greek CRM and have already been approved and implemented in Italy [26] is a fair, transparent, efficient, technology-neutral, volume-based and market-wide capacity mechanism scheme that provides a competitive remuneration to the required guaranteed capacity availability, while at the same time it eliminates the risk of overcompensating the successful capacity providers through the payback obligation scheme.

4.2. Simulation of the Capacity Remuneration Mechanism

Based on the general provisions and guidelines of the aforementioned proposal for CRM, we conducted a simulation of this auction mechanism in order to estimate the outcome of the auction, as well as the total annual cost that will have to be undertaken by the electricity supply companies and, ultimately, the end-consumers under differentiated scenarios regarding the future power system operating conditions for the next 10-year period (2022–2031).
In the following sections, the methodology and tools used for the simulation of the CRM auction, the main assumptions and input data as well as the simulation results are analyzed.

4.2.1. Methodology and Tools

A sophisticated computational model was developed and properly executed in order to precisely replicate the auction clearing procedure of the said CRM, based on the requirements and specifications that are included in the draft proposal for the envisaged Greek CRM and which have been largely based on the detailed provisions of the approved Italian CRM. The emulated CRM auction was considered to follow the “sealed-bid” auction format, where all bidders (i.e., capacity resources) submit bids anonymously (following the detailed market assumptions, technicalities and assumed bidding behaviors that are analyzed in Section 4.2.2) and the capacity market auction is subsequently cleared in one single round for each year. The result of each auction clearing is the awarded quantity of the successful capacity providers (winning bids), along with the single auction clearing price (“premium”, in €/MW-y), given that the auction follows the “pay-as-clear” principle. It is noted that the computational model was formulated and implemented in the GAMS environment, along with Microsoft Excel for the input/output data handling.

4.2.2. Assumptions and Input Data

It is widely known that in computational modeling, the simulation results are dependent on the formulation of the core model as well as on the input data used.
In this study, the model configuration was exclusively dictated by the requirements and specifications that are included in the draft proposal for the envisaged CRM as well as in the Italian capacity mechanism, which was approved by the European Commission in February 2018 and the first auctions that took place in 2019 [26]. Given that the Italian and the Greek power systems and wholesale electricity markets structure and operation have several similarities (e.g., inability to select which electricity users to disconnect based on their willingness to be charged for adequacy during stress events, failure of energy-only market to provide adequate signals and ensure optimal security of supply, etc.), in this study we adopted certain provisions and assumptions appearing in the Italian mechanism for issues and parameters that were not adequately detailed in the draft Greek CRM proposal.
In order to model the inherent uncertainty with regards to the input data (since most of them represent the future power system and market conditions), we formulated three (3) main scenarios in order to capture the most possible realizations of the Greek power system configuration in the next 10 years. In addition, for each scenario, two different cases regarding the IPPs bidding behavior have been simulated (Base strategy, Aggressive strategy), also complemented by a sensitivity analysis to determine which is the optimal bidding strategy for the IPP capacity providers.
In the following paragraphs, the main specifications of the CRM as implemented in this study, along with the main input data used, are presented and discussed. It is underlined that apart from the restrictions posed by the provisions and detailed specifications of the said CRM itself (e.g., shape of the demand curve, bid caps, CONE value, etc.), we cannot locate any other restrictions on the implementation of the said capacity mechanism.
(a) Demand curve
Transmission System Operator defines the amount of capacity to be procured on the basis of the LOLE target and the cost of the new entry (CONE). The Greek authorities will set the target LOLE. In this study, the target LOLE has been considered equal to 3 hours/y, as this is the reliability threshold set by the Greek TSO in its latest Adequacy Study 2020–2030 [46].
Regarding the design of the demand curve, this is set administratively and its design aims at the procurement of enough capacity to meet reliability requirements. Following current practice in most capacity mechanisms worldwide, where the advantages of the downward-sloping demand curve are explicitly drawn [42], the administrative demand curve has been decided to be downward sloping, similar to the one that is adopted in the Italian mechanism and shown in Figure 2.
Based on the preliminary provisions of the Greek CRM proposal, the target CONE will be set at 45,000 €/ΜW-y (see Figure 2, point C), while the auction price cap is intended to be set at the level of 65,000 €/ΜW-y (≈1.5*CONE) (see Figure 2, points A and B, respectively). The Greek authorities intend to set bid caps in order to limit the cost impact to consumers and to help mitigating gaming risks. New capacity providers will be characterized as price-makers, and will have the right to offer their quantity up to the maximum price allowed (auction price cap). To mitigate market power in the auction, existing capacity providers will be classified as price takers i.e., they cannot bid above a specific threshold. The bid cap will also function as a pure price cap for these units for the first 5 years of the implementation. The Greek authorities preliminary intend to set the bid cap for offers submitted by existing capacity at the level of 40,000 €/MW-y. After this period, existing capacity will be able to receive a premium higher than their bid cap only if new capacity is contracted. More details on the considered bidding strategy of all eligible capacity providers in this study are provided in the next paragraphs.
Regarding the quantity points on the demand curve (i.e., x-axis values of points B, C and D in Figure 2), these are usually defined as a function of the target requirement, where one of the important considerations is the point where the demand curve falls at CONE target (target quantity corresponding to CONE, point C in Figure 2). As shown in Figure 1, Great Britain’s curve passes directly through the target quantity at net CONE, while almost all other markets are somewhat right-shifted relative to the target quantity. The determination of the shape (e.g., straight-line, convex, concave), and the slope and width of the demand curve is a rather complicated issue, which falls outside the scope of this study.
The determination of the absolute values of the aforementioned quantity points is critical for the outcome of the auction, since they indirectly define the awarded capacity. In our understanding and following the provisions of the Italian mechanism, quantity at point D corresponds to the capacity that leads to almost zero LOLE (see Figure 2). According to the results of the latest capacity adequacy study of the Greek power system [46], LOLE remains close to zero in all years. Therefore, for the purpose of this simulation, it is considered that the foot quantity of the demand curve for all years and scenarios is equal to the system peak load. For the sake of simplicity and taking into account the current best practices in various capacity markets worldwide [42], we assume a straight-line demand curve, where the target quantity is equal to 90% of the foot quantity. Considering Point C (90% of foot quantity, CONE) and Point D (100% of peak load, 0), we can formulate the auction capacity demand curve for all years and scenarios of the study. Figure 4 illustrates an indicative demand curve for the intermediate load scenario and year 2025.
(b) Eligible Resources
Eligible resources to participate in the capacity market include the following: (a) Dispatchable conventional power plants (thermal and hydro), (b) RES units, (c) Pumped storage plants, (d) Battery energy storage systems, (e) Demand response portfolios and (f) Interconnections. In accordance with the provisions of the CRM proposal, for all eligible resources a unit unavailability rate (de-rating factor) has been considered, as follows:
  • Thermal units: For each thermal unit, the de-rating factor was considered equal to the unit’s Demand Equivalent Forced Outage Rate (EFORd), as included in the most recent Long-Term Capacity Adequacy Study 2020–2030 conducted by ADMIE [46].
  • Hydro units: The current large hydro units total Net Capacity (NCAP) is equal to 3171 MW and is expected to increase to 3331 MW in 2022 and 3360 MW in 2025. Considering the limited availability of hydro units to fully serve system capacity needs, given the strong dependence of hydro generation on the available water reserves, especially when consecutive hours of water discharging are required and following the provisions of the Italian mechanism where expected de-rating factors for hydro units range from 40% to 60%, for hydro capacity an average derating factor equal to 50% is assumed for the entire study period.
  • Storage Units:
    Pumped Storage Plants: Three new pumped storage plants have been considered to enter commercial operation in 2025, with an aggregated eligible NCAP equal to 773 MW.
    Battery Energy Storage Systems (BESS): Two (2) BESS penetration scenarios have been considered, where the average annual projected installed capacity that is eligible to participate in the capacity auctions is shown in the Appendix A.
Given that no actual (historical) pumped storage hydro units and BESS operational data are currently available for the Greek power system, following the provisions of the Italian mechanism where respective de-rating factors range from 40% to 60%, for both storage technologies, a de-rating factor equal to 50% is assumed for both technologies in this study.
  • RES units: RES plants installed capacity are separated in two groups, as follows:
    The first group includes all RES plants that historically receive state aid (on the basis of feed-in-tariff or feed-in-premium schemes). It is assumed that this group comprises all existing RES plants, as well as all RES plants that will have been installed and enter commercial operation in the Greek interconnected power system until the end of 2024. These RES units are considered as subsidized RES capacity and, therefore, are ineligible to receive any remuneration from the capacity auction. However, the de-rated RES installed capacity of this group is implicitly considered to be offered at 0 €/MW-y in the auction.
    The second group includes all future RES plants that will be installed in the Greek power system from January 2025 onwards. It is supposed that these units will not receive any state aid and therefore will participate directly to the wholesale electricity market (merchant RES plants). These RES plants are considered eligible to participate explicitly in the capacity auctions on the basis of their de-rated capacity.
Two (2) RES penetration scenarios have been considered, where the average annual projected installed capacity that is eligible (and ineligible) to participate in the capacity auction is shown in the Appendix A. For both RES groups, an average de-rating factor for each RES technology has been considered on the basis of the simulation results presented in [47] and prior experience. These factors are kept constant throughout the study period (2022–2031) and are shown in Table 2.
It is noted that for RES, hydroelectric and storage units, a more detailed study on the basis of the well-known Effective Load Carrying Capability (ELCC) methodology must be performed in order to estimate their actual contribution to system adequacy for the foreseen power system conditions on an equal basis as thermoelectric units [47,48]. In any case, the derating factors that have been considered for all aforementioned technologies are expected to lead to average available capacities that are very close to their respective ELCC.
  • Interconnections: The participation of interconnections is differentiated on the basis of whether the interconnection connects Greece with an EU country or a non-EU (third) country, as follows:
    Interconnections with non-EU countries (implicit participation): The foreign capacity located outside Greece and EU (i.e., Albania, North Macedonia and Turkey) is ineligible to receive any remuneration from the capacity auction. However, an equivalent de-rated interconnection capacity will be used to decrease the level for generation needed to achieve the reliability standard, hence affecting the demand curve of the auction. A thorough analysis of historical electricity flows data in these interconnections resulted in an equivalent de-rated interconnection capacity equal to ~300 MW, which is considered to be offered at 0 €/MW-y in the auction and receive no remuneration.
    Interconnections with EU countries (explicit participation): Regarding the interconnections with EU member states (i.e., Italy and Bulgaria), cross-border participation is formulated on the basis of the “interconnector led” model, whereby interconnectors can explicitly participate in the capacity auctions (instead of foreign capacity providers), with the amount of their de-rated capacity (taking into consideration the technical availability and historical usage of the interconnection and commercial flows at times of stress) and are entitled to receive capacity payments for their awarded capacity (the respective revenues are considered to be split 50/50 between the TSOs). A thorough analysis of historical electricity flows data in these interconnections resulted in an equivalent de-rated interconnection capacity equal to ~200 MW, which is eligible to participate explicitly in the capacity auction.
  • Demand Response: The aggregated demand response Unforced Capacity (UCAP) that will participate explicitly in the CRM from 2022 onwards was considered equal to 750 ΜW, so that it is close to the latest auctioned capacity of the interruptibility scheme that is currently in force (800 MW). This way, it is assumed that the interruptibility scheme will no longer be extended from 2022 onwards and, therefore, all eligible demand portfolios will have the right to participate in the envisaged CRM.
(c) Bidding strategy
The outcome of the CRM auction is heavily dependent on the bidding strategy of all participating capacity resources. Given that no historical data exist, the following assumptions on the basis of the proposed CRM auction rules have been made:
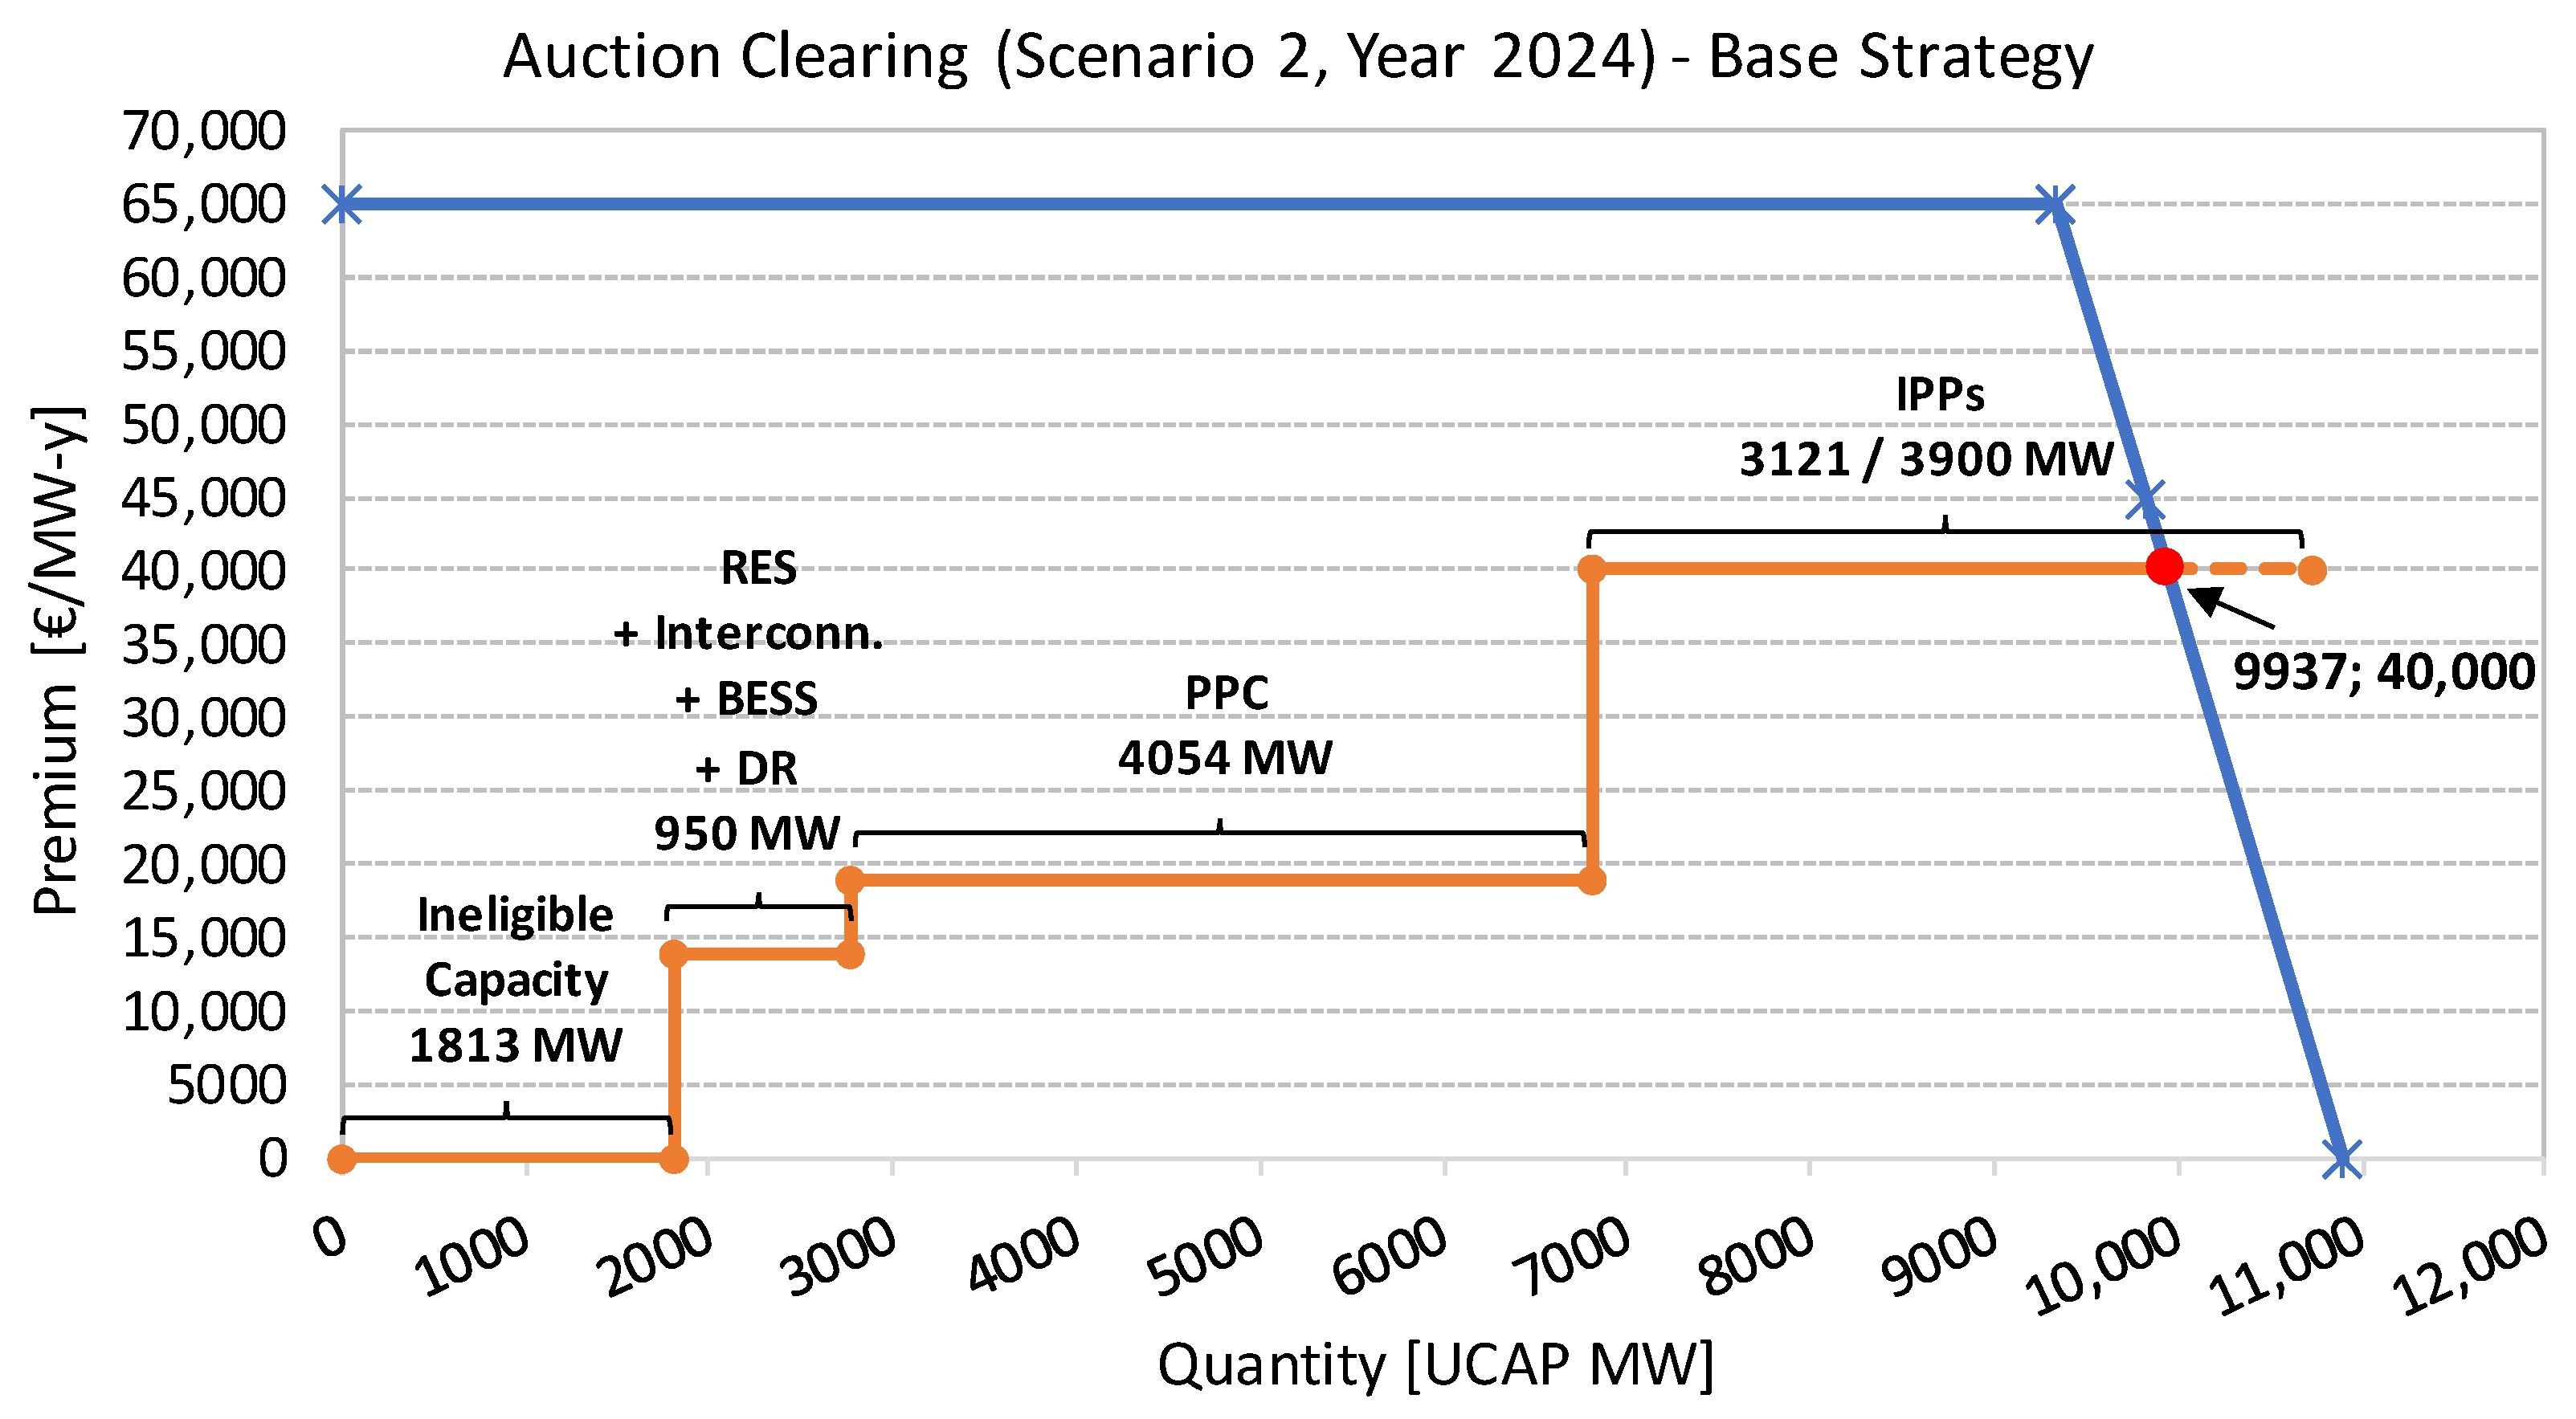
  • Ineligible capacity resources, which include subsidized RES capacity and capacity on the interconnection lines between Greece and non-EU countries, are considered to offer their entire (de-rated) capacity at 0 €/ΜW-y, while they do not receive any remuneration. In other words, these capacities affect only the auction demand curve (the latter is shifted to the left) and, therefore, they limit the eligible winning capacity, thus having an indirect, yet notable, impact on the auction outcome.
  • Eligible RES units and demand response portfolios are expected to act as price-takers and offer their entire de-rated eligible capacity at very low levels (close to 0 €/ΜW-y).
  • Given that the auction follows the “pay-as-clear” principle, and considering that the ex-monopolist Public Power Corporation (PPC) is expected to be a net buyer in the capacity market (similar to the wholesale electricity market), a rational bidding strategy is to offer its entire eligible capacity at low premiums (significantly lower than the pure price cap for existing capacity), aiming at the minimization of the total cost of the auction mechanism.
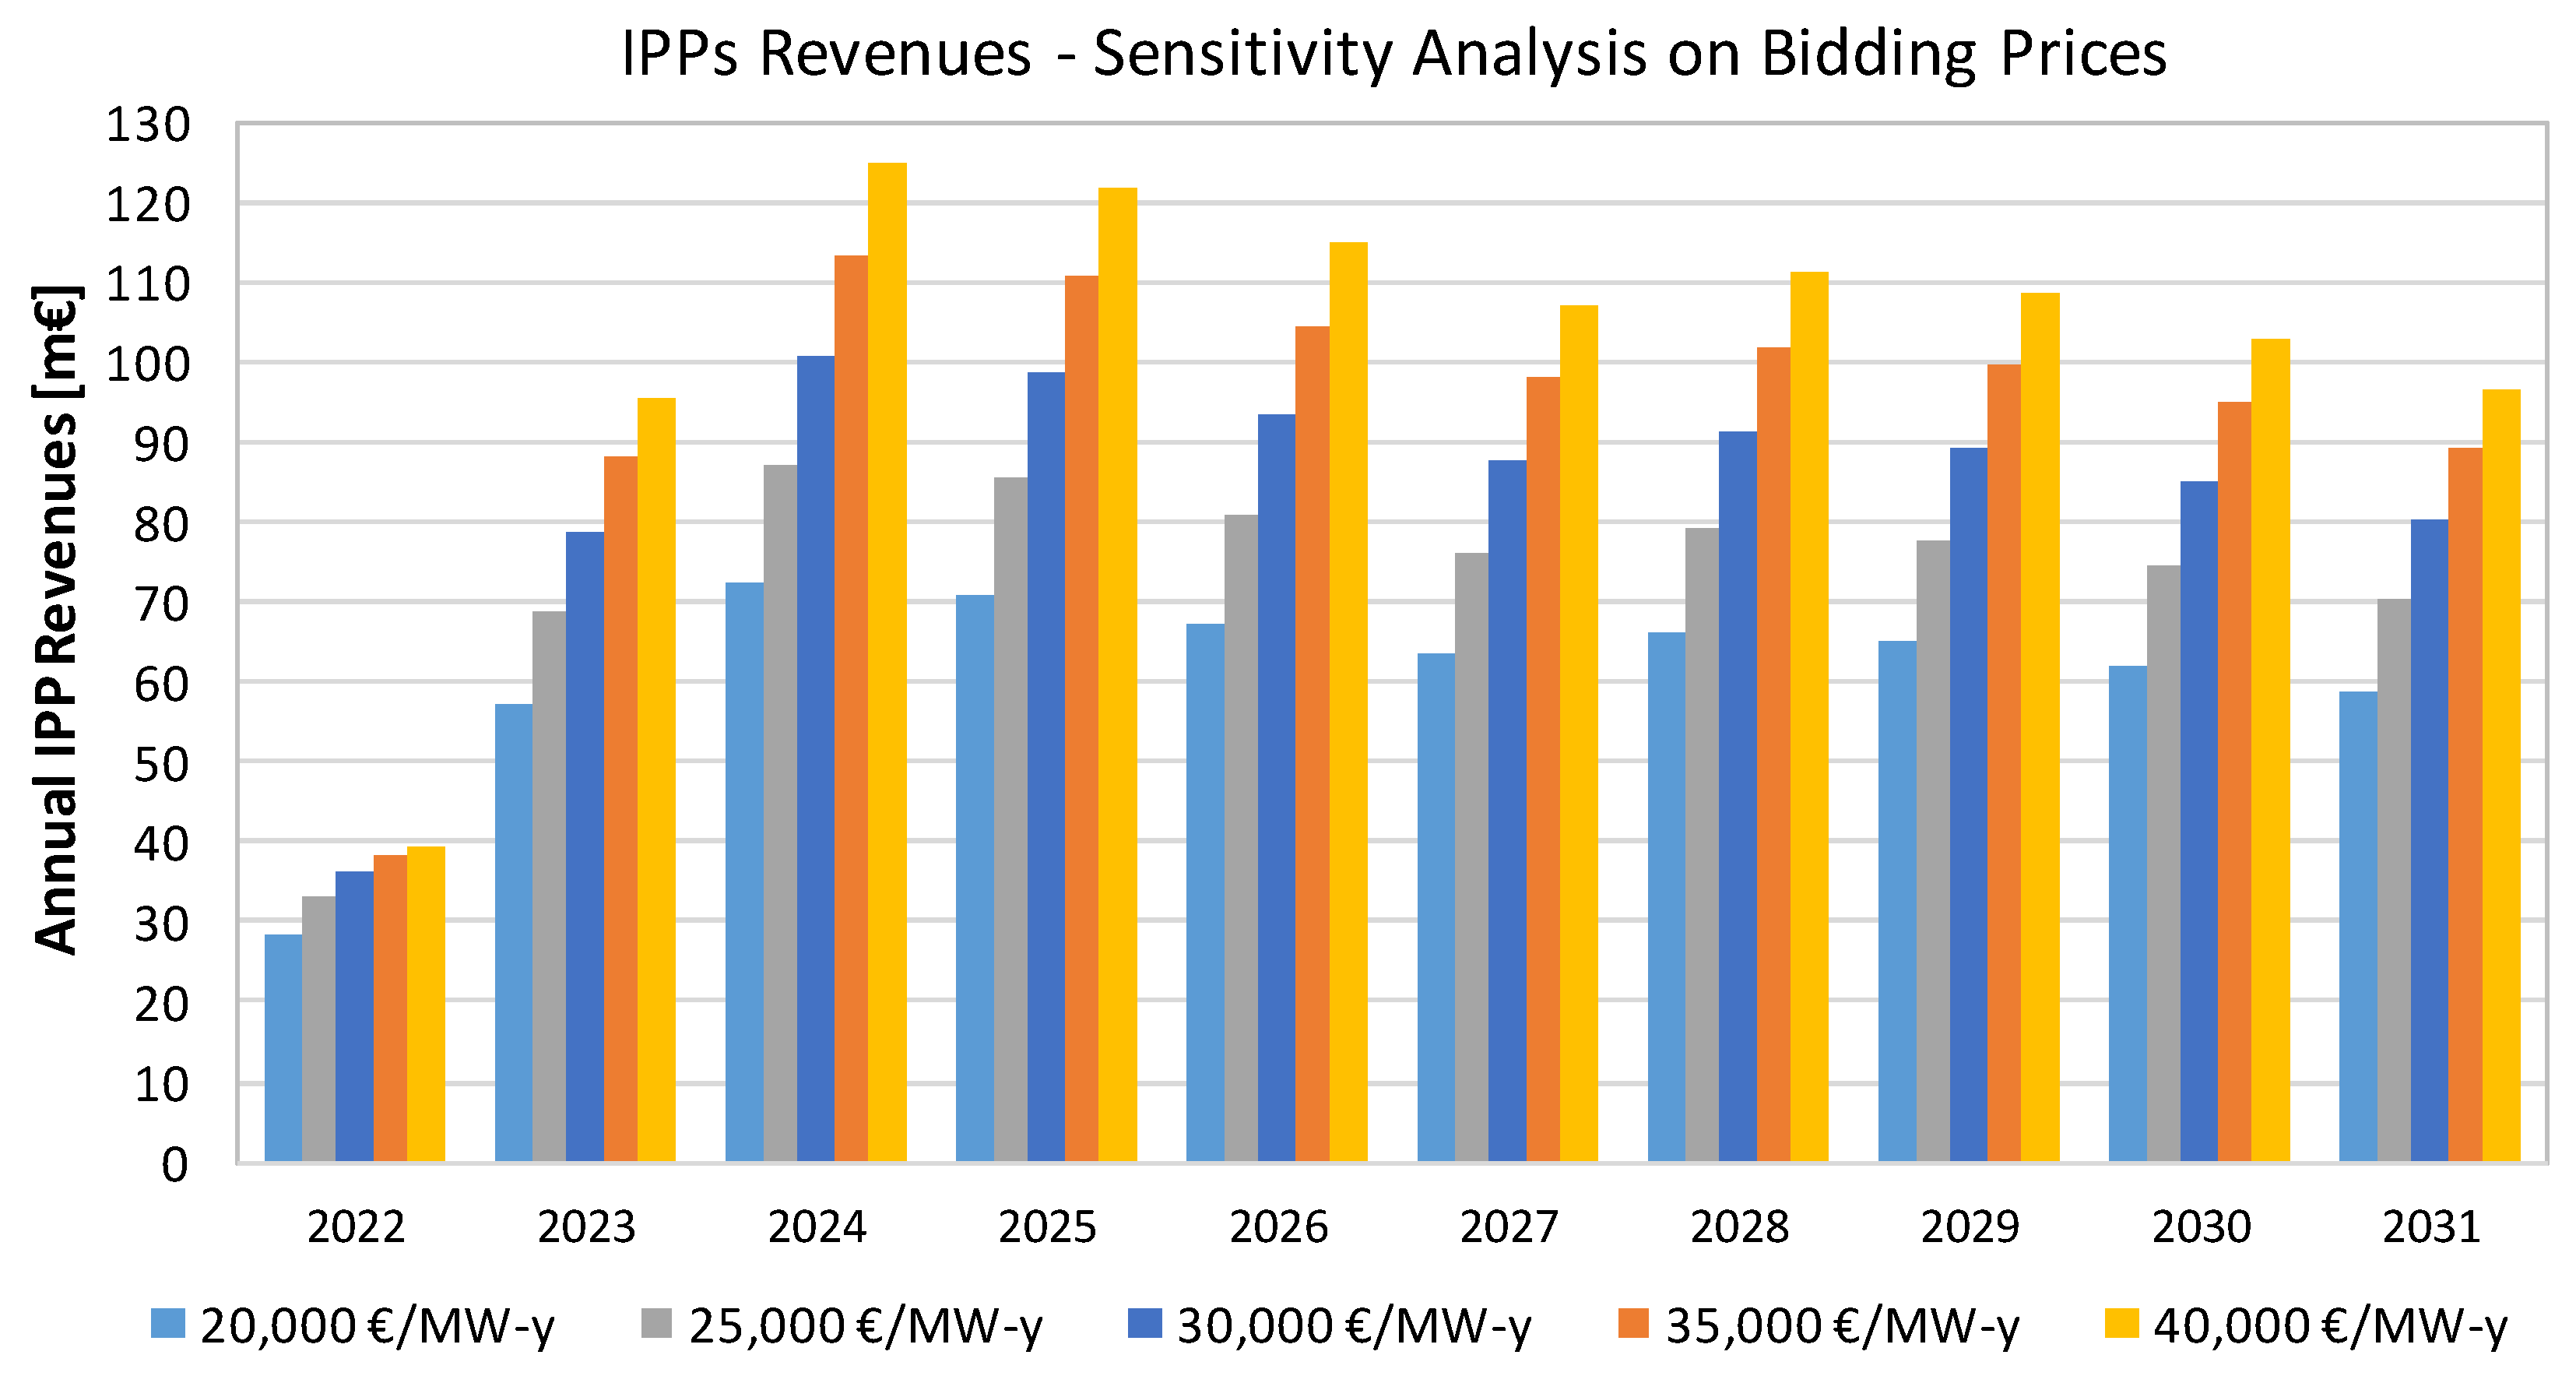
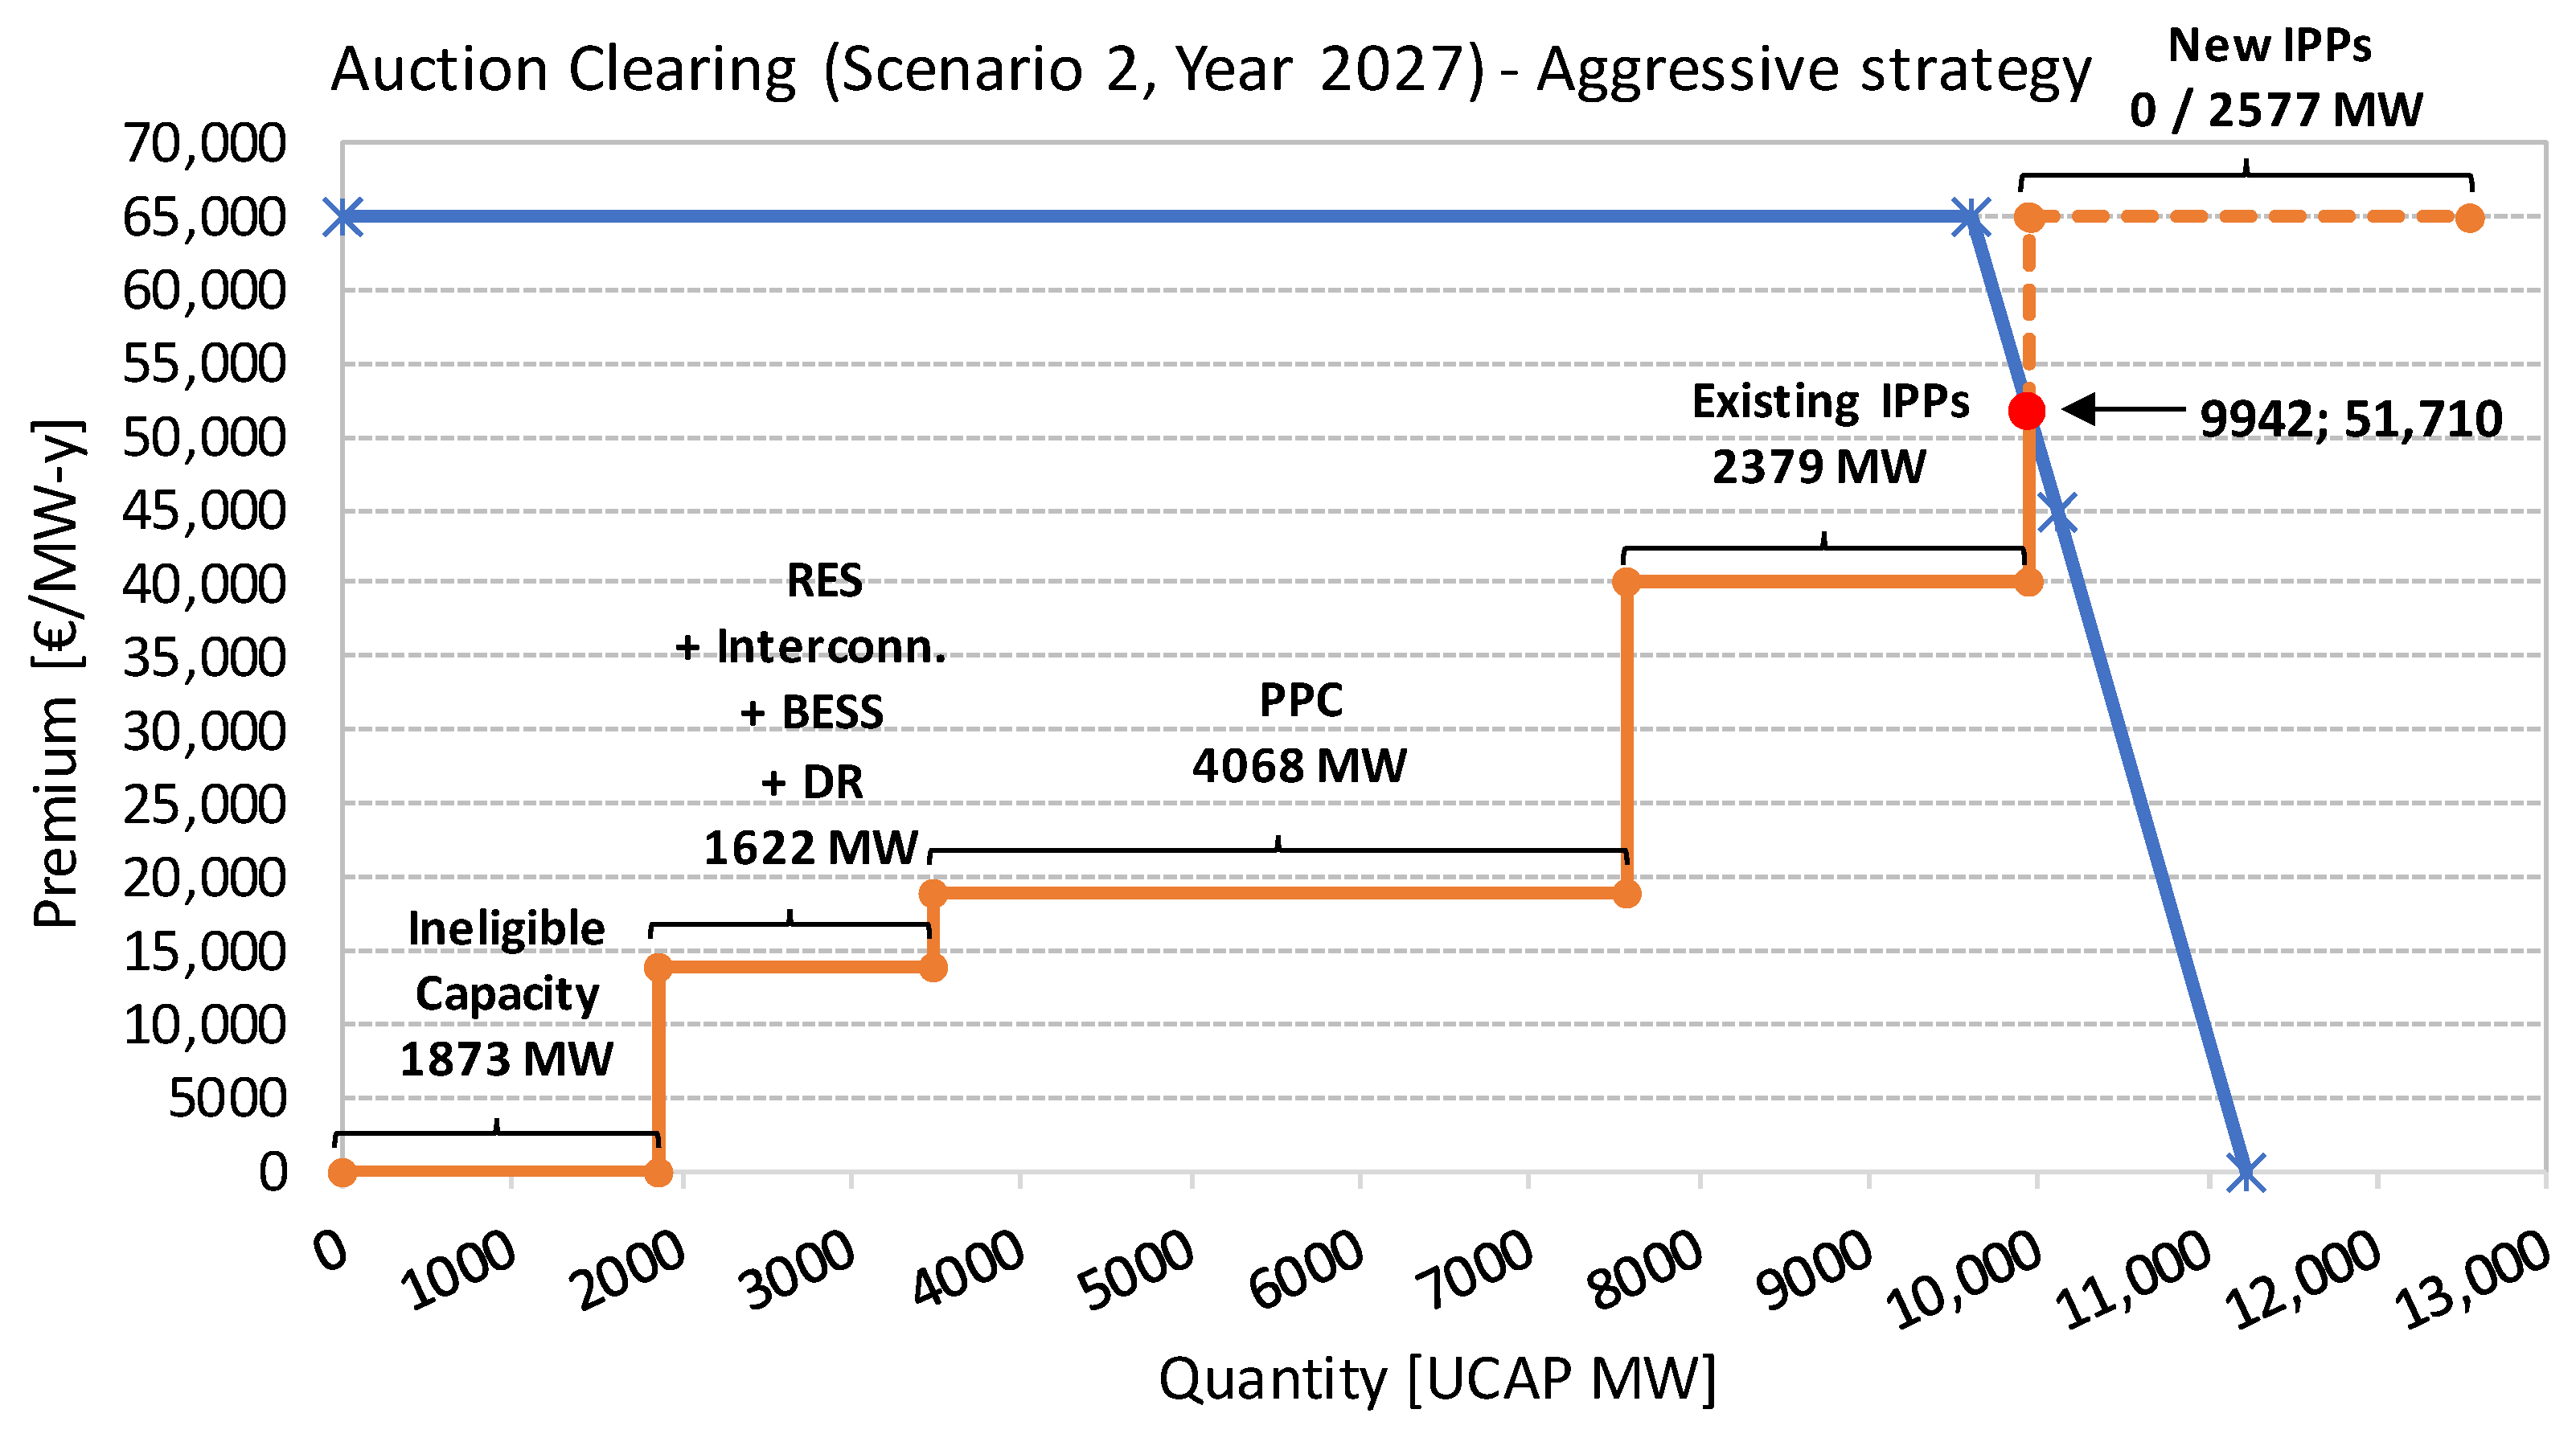
  • Independent Power Producers (IPPs) that represent existing and new capacity (both gas-fired and pumped storage units) are expected to follow a more aggressive bidding strategy, since they are expected to be net sellers in the capacity market and, therefore, they will try to maximize their net profits (revenues minus charges) from the auction. Regarding existing IPP capacity, these units have been considered to bid their entire (de-rated) capacity at 40,000 €/MW-y. Regarding new IPP units, two different cases have been considered, as described below.
Taking all the above input data into account, three (3) scenarios were simulated regarding the Greek power system configuration in the future, which are the following:
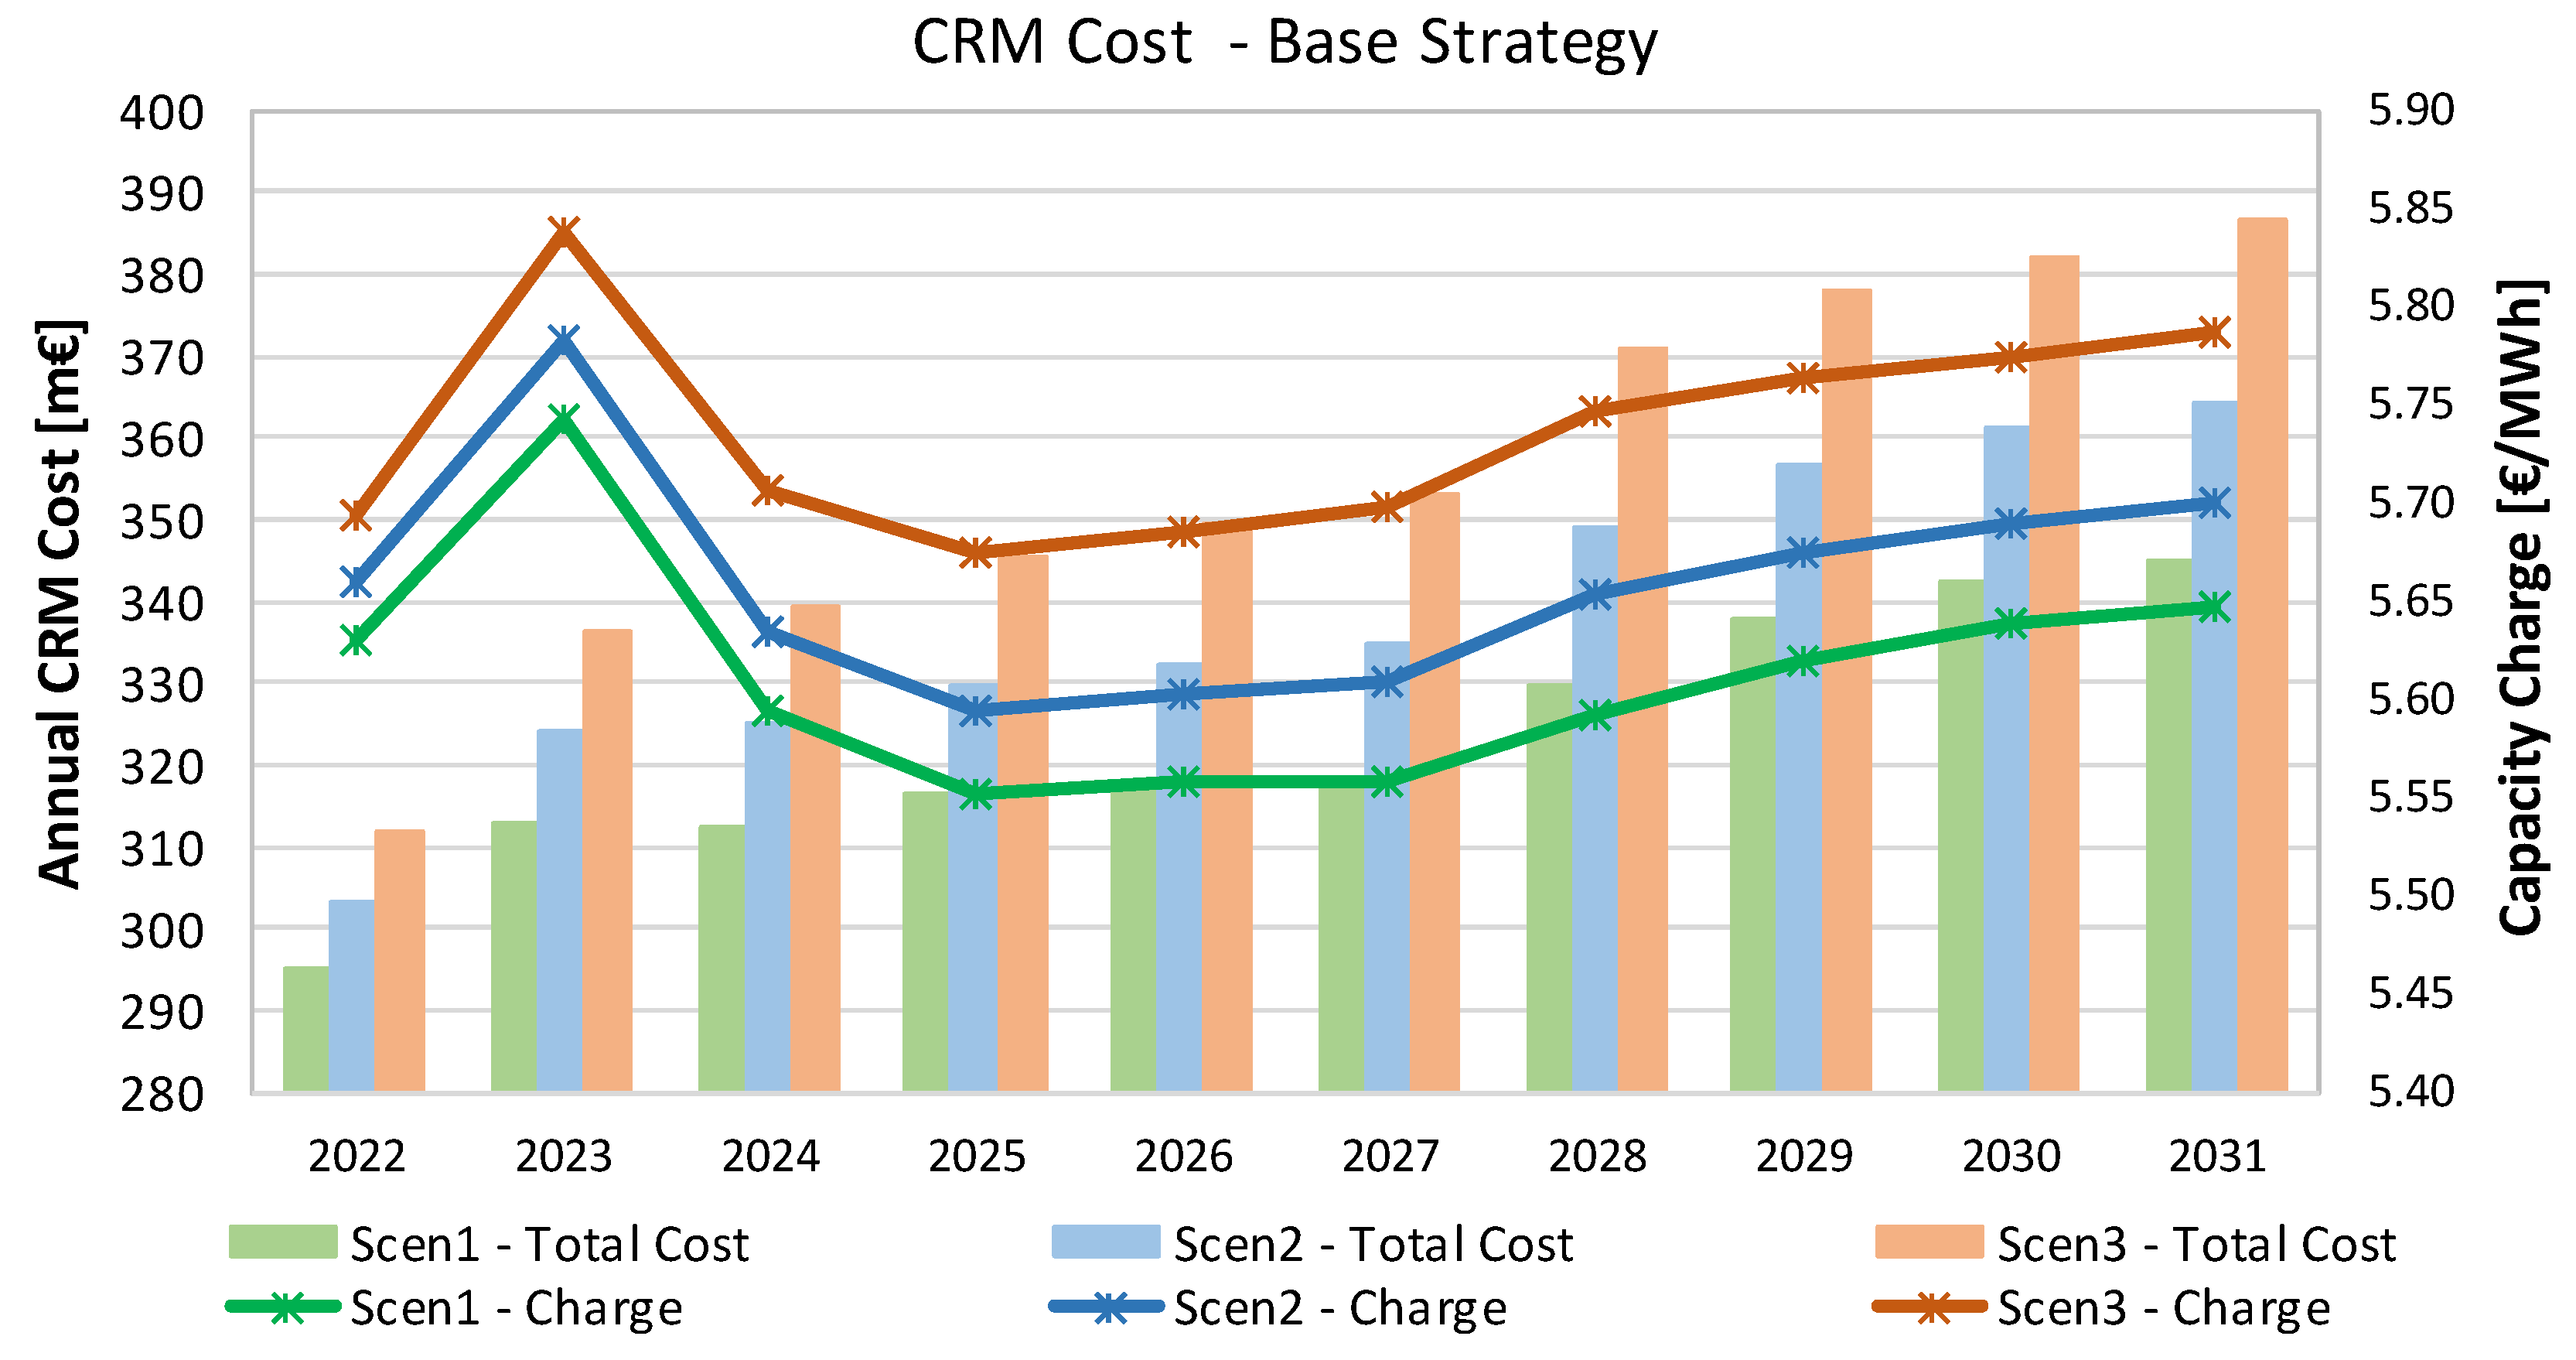
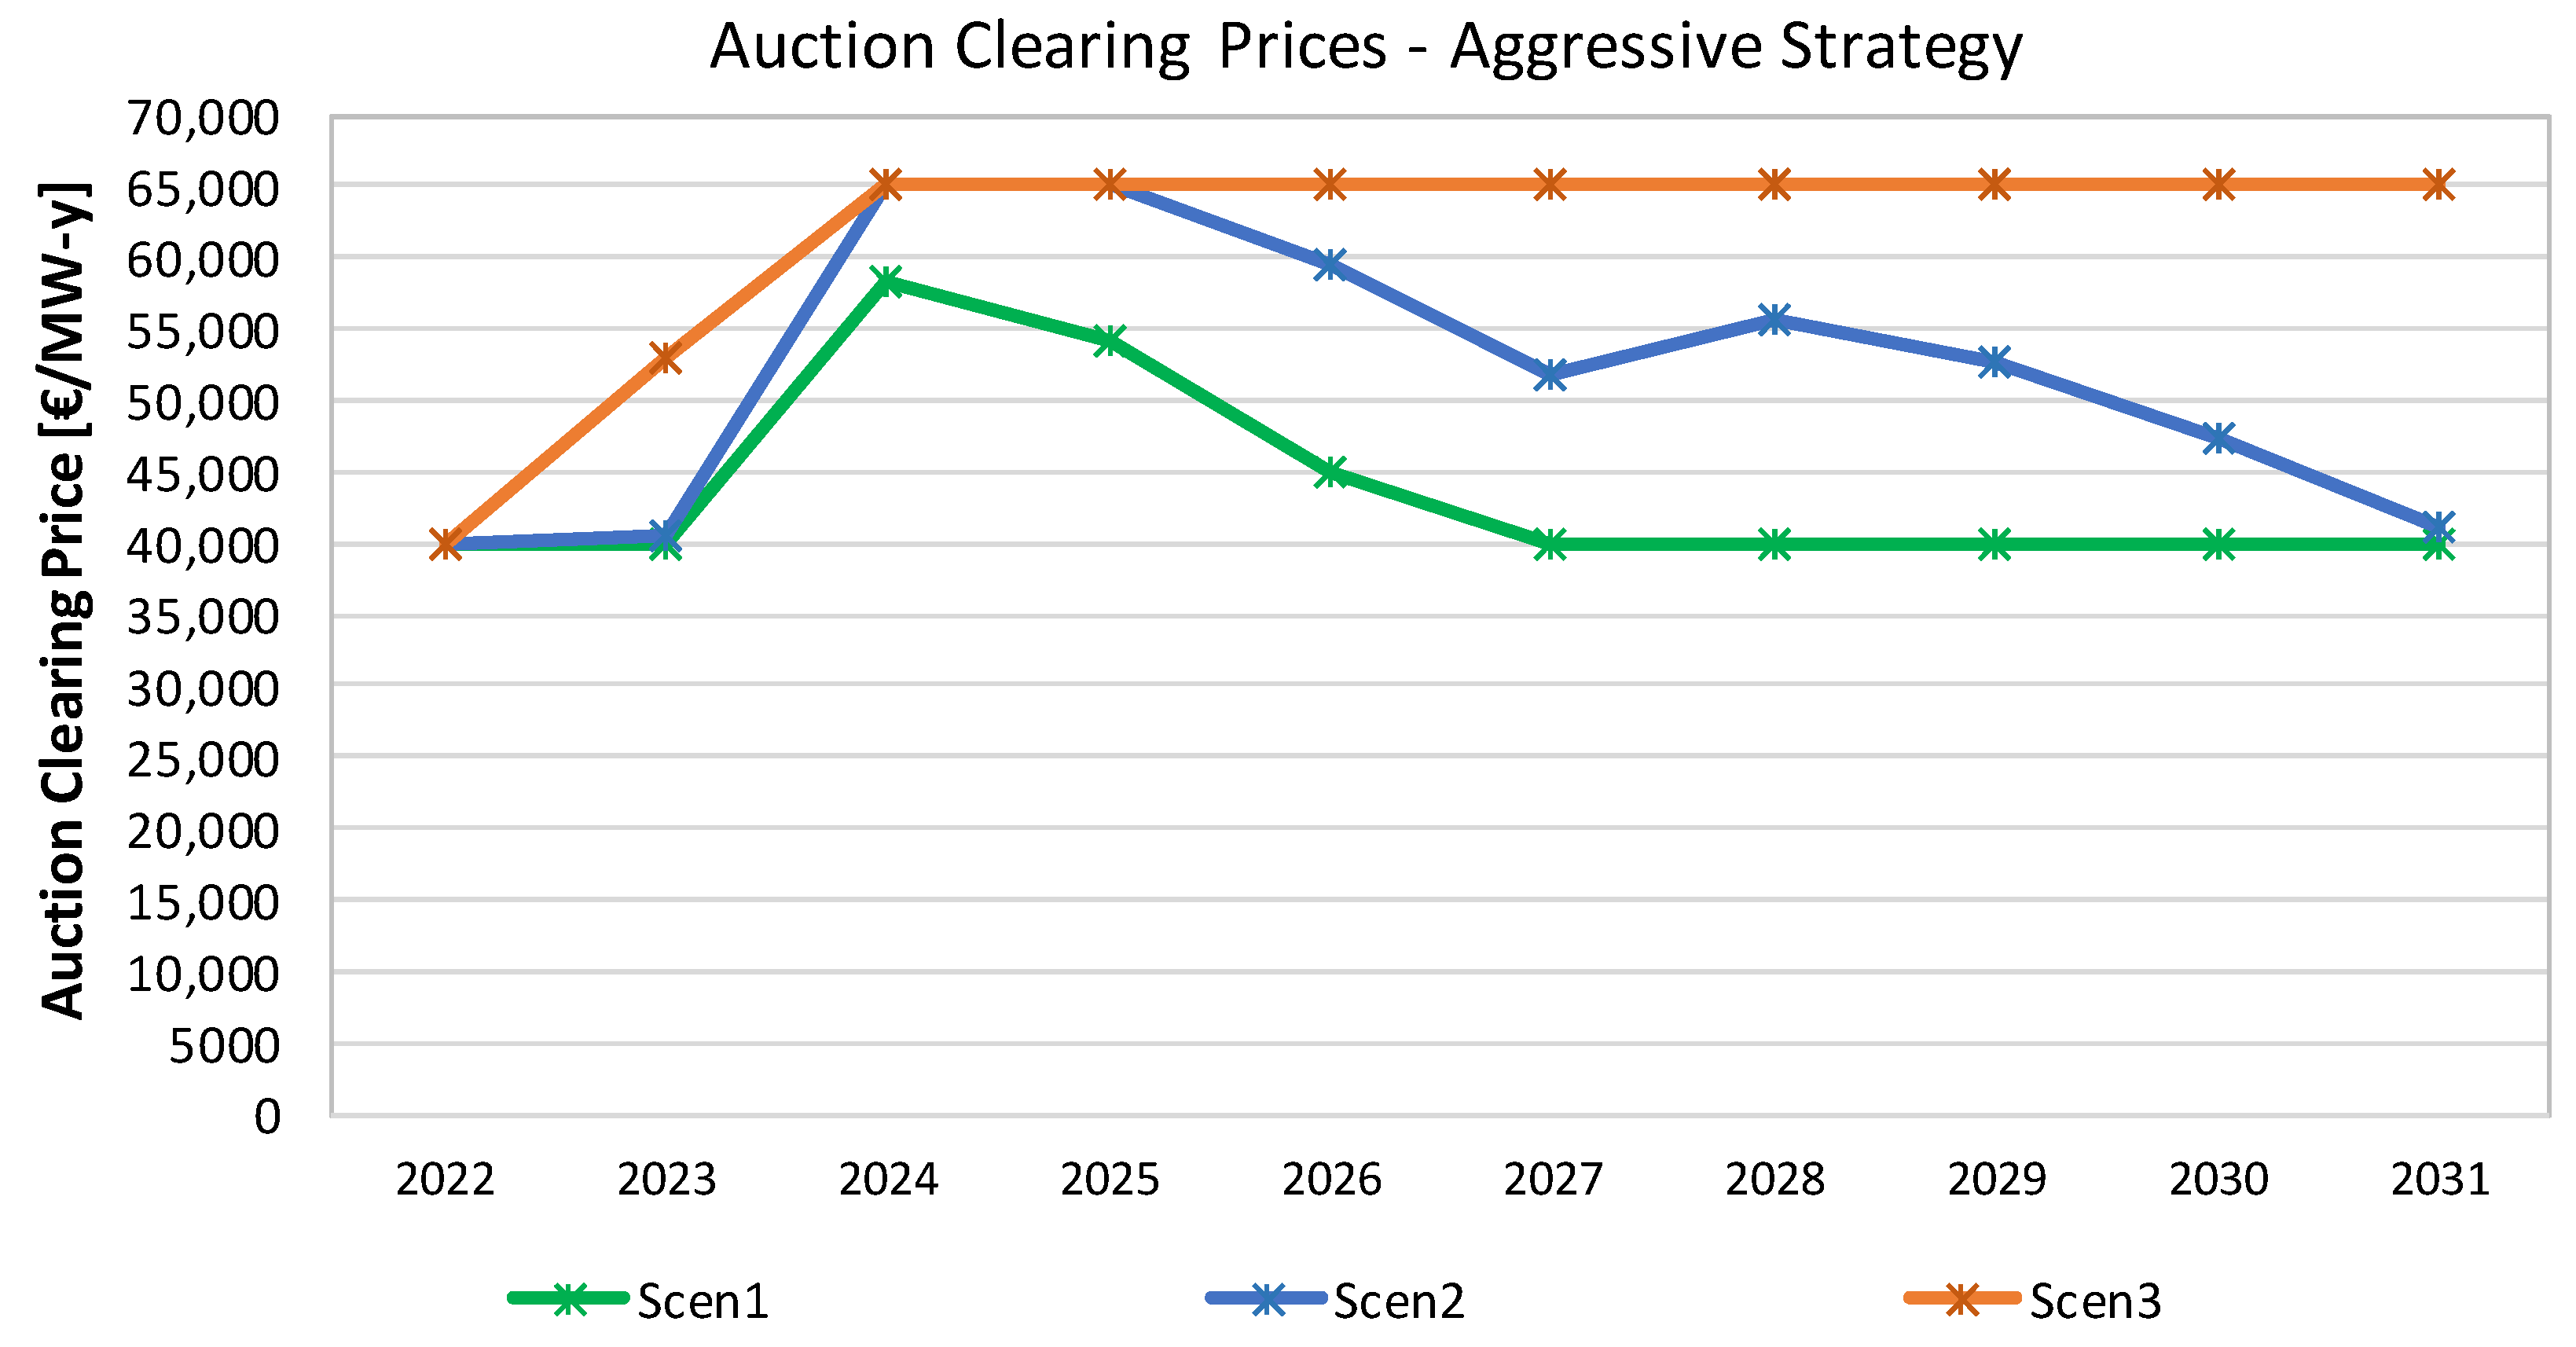
  • Scenario 1: Low system peak load & High RES and BESS penetration
  • Scenario 2: Intermediate system peak load & High RES and BESS penetration
  • Scenario 3: High system peak load & Low RES and BESS penetration
The analytical system peak load demand and the RES, hydro units, pumped storage units and BESS technologies input data for the entire study period (2022–2031) and all scenarios are presented in the Appendix A.
For each scenario, two different cases regarding IPPs bidding behavior have been simulated, as follows:
Base Strategy: All IPP units (existing and new gas-fired combined cycle thermal units and pumped storage hydro units) offer their entire (de-rated) capacity at 40,000 €/MW-y (bid cap for existing units).
Aggressive Strategy: Existing IPP units offer their entire (de-rated) capacity at 40,000 €/MW-y, while new IPP units offer their entire (de-rated) capacity at 65,000 €/MW-y. In this case, the provisions of the draft CRM proposal, according to which the bid cap for existing units will function as a pure price cap for these units for the first five (5) years of the implementation (period 2022–2026), while afterwards (period 2027–2031) existing capacity will be able to receive a premium higher than their bid cap only if new capacity is contracted, is also taken into account in the respective calculations.
The results from the application of the aforementioned bidding strategies are analytically presented and discussed in the next paragraph.

4.2.3. Simulation Results

In the following paragraphs, the main simulation results for all three scenarios and both bidding strategy cases are presented and discussed.
(a) Base strategy
Table 3 presents the CRM auction clearing results in the scenario that all IPP (existing and new) units bid at 40,000€/MW-y and all other capacity providers participate in the auction according to the aforementioned bidding strategy. In all scenarios, IPP units become price-makers and, therefore, the auction clearing price is equal to 40,000 €/MW-y in all years of the study, irrespective of the power system conditions of each simulation scenario.
For the sake of better understanding of the CRM auction clearing mechanism, Figure 5 illustrates the auction clearing for the year 2024 in Scenario 2. It is noted that the bid prices for all capacity resources except for IPP units (i.e., last price-quantity pair) have been selected arbitrarily and they have no effect on the auction clearing in terms of the total winning capacity and clearing price, provided that they remain below the respective IPP units bid.
Table 4 and Figure 6 present the total annual cost of the proposed CRM (in million €/y) and the average capacity charge (in €/MWh) that will be imposed on the Retailers for the Base strategy. Equivalently, the capacity charge corresponds to the aggregated RO fees paid by the Retailers to the capacity providers. It is noted that the final charge to the Retailers will be adjusted and may be improved (decreased), taking into account the yearly redistribution of payback obligation charges and penalties that may be imposed on the capacity providers in case they fail to comply with certain availability obligations during the delivery period.
Simulation results show that the total annual cost of the CRM increases significantly over the years in all scenarios, owing to the increasing eligible capacity resources required to serve the increasing peak load demand. It is noted that the ineligible RES capacity (that, in principle, receives no remuneration and partially counterbalances the increasing peak load demand at no cost) increases during the period 2022–2024 and then remains constant from 2025 onwards, as already discussed, thus allowing for the total CRM cost to further increase during the years 2025–2031.
Apparently, moving from Scenario 1–which represents the most favorable conditions for the Greek power system capacity adequacy (low load, high RES)–to Scenario 3 that represents the most adverse operating conditions (high load, low RES), the total annual cost (in €/y) also increases, since more capacity resources are required to serve the increased peak load requirements and to ensure resource adequacy. However, the simultaneous increase of total electricity consumption (in MWh) over the years in all scenarios maintains the average capacity charge almost stable in the range 5.55–5.84 €/MWh, independent of the power system conditions. The peak capacity charge observed for year 2023 in all scenarios is due to the full incorporation of the total system load of the largest Greek insular power system of Crete, where the increase of total electricity consumption from 2022 to 2023 is disproportionally lower than the respective increase of peak load demand.
Given that the capacity demand curve is a downward-sloping curve, a variation in the bidding prices auction supply offer curve (which is formulated by aggregating all capacity providers quantity (MW) - price (€/MW-y) offers in ascending order) may result in differentiated clearing results regarding both winning capacity and capacity premium. Specifically, lower bidding prices will result in higher awarded capacity, and vice versa (see also Figure 5). In order to investigate whether the adopted bidding strategy for IPPs is optimal for them, we performed a sensitivity analysis of the auction clearing, where all IPP units are supposed to bid at lower levels in the range 20,000–40,000 €/MW-y, while they continue to act as price-makers. Figure 7 illustrates indicative simulation results for Scenario 2 (Intermediate load, High RES), where it is clear that although a lower bidding price results in a higher IPP winning capacity, the adopted bidding strategy for IPP units (bid of entire capacity at their bid cap) is optimal in terms of total revenues obtained in all years of the study period. Similar conclusions are obtained for the other two simulation scenarios.
(b) Aggressive strategy
According to the proposed CRM auction rules, the bid cap for existing units will function as a pure price cap for these units for the first five (5) years of the implementation (period 2022–2026), while afterwards (period 2027–2031) existing capacity will be able to receive a premium higher than their bid cap, only if new capacity is contracted.
In the case that all new IPP units bid at 65,000€/MW-y and all other capacity providers bid according to their own bidding strategy, simulation results indicate that the auction clearing is differentiated as compared to the base strategy in terms of the total awarded capacity and, subsequently, the IPP units winning capacity, especially in Scenarios 2 and 3. Specifically, from 2023 onwards the Greek power system generation mix and operating conditions allow for the exercise of market power by new IPP units, as shown in Figure 8 that illustrates the CRM auction clearing prices for the three scenarios. It is clear that in all scenarios (especially in Scenarios 2 and 3), new IPP units act as price-makers and set the auction price significantly higher than 40,000 €/ΜW-y up to 65,000 €/MW-y. For instance, in Figure 9 where the auction clearing for Scenario 2 and year 2024 is illustrated, the winning capacity of all IPPs units is 2515 MW. Given that 2379 MW is the total installed capacity of existing IPP units (which are offered at 40,000 €/MW-y and are, therefore, fully accepted), it is concluded that the remaining 136 MW (=2515–2379 MW) correspond to the winning capacity of the new IPP units.
However, this is not the case for many years in Scenarios 1 and 2, where the aggressive bidding strategy of the new IPP units result in an auction price that lies in-between the existing units bid cap (40,000 €/MW-y) and the auction price cap (65,000 €/MW-y). This situation can occur if the cross-section of the downward-sloping demand curve and the increasing aggregated supply offer curve takes place in-between two consecutive supply offer blocks, as shown in Figure 10. In this case, the auction clearing price can climb at significantly higher levels than 40,000 €/MW-y, while no new IPP unit is awarded any capacity (e.g., in Figure 10 the last block of the supply offer curve corresponding to the new IPP eligible capacity, that is equal to 2577 MW, is fully rejected). Apparently, this is not a winning strategy for new IPP units, since even these IPPs also owning significant existing capacity can take advantage of the higher auction clearing prices and maximize their total revenues, only after the first five (5) years of the mechanism implementation and only if new capacity is contracted.
However, following the provisions of the draft CRM proposal, in this case all other new winning capacity providers (except for the new IPP units), such as new RES units, new BESS, new hydro units and new demand response portfolios are awarded the higher premiums shown in Figure 8, which in turn leads to slightly increased annual CRM total cost within the first five years of the mechanism implementation (2022–2026) with respect to the Base Strategy, especially in Scenarios 2 and 3, as shown by the comparison of Table 4 and Table 5, respectively.
Table 5 and Figure 11 present the total annual cost of the proposed CRM (in million €/y) and the average capacity charge (in €/MWh) that will be imposed on the Retailers in the case that the new IPP units follow the aggressive bidding strategy.
Summarizing the aforementioned discussion, it is observed that the total annual cost of the mechanism deteriorates (increases) significantly with respect to the Base Strategy for Scenario 2 and 3 after the 5-year transition period (i.e., from 2027 onwards, see shaded cells in Table 5), since in those years the auction clearing price is significantly higher than 40,000 €/MW-y and the entire winning capacity (existing and new units) is remunerated according to this premium.

5. Conclusions and Prospects for Further Work

In this paper, a comprehensive review of various capacity mechanisms that currently operate or are under approval in European countries and the US was first presented, focusing on the power system needs for the establishment of such mechanisms and their key technical and operational aspects. It is concluded that the underlying reasons that led all regions under study to the establishment and operation of a capacity mechanism include the gradual retirement of conventional capacity, system load increase, inadequate new investments, aggressive penetration of RES generation and associated implications and failures in the short-term markets operation, such as the high price volatility and the “missing money” problem. Centralized auctions performed by the TSO for the procurement of long-term capacity availability, either in its traditional form or in the modern form of reliability options are the most common design, followed by strategic reserves. In most capacity mechanisms the participation is voluntary, while capacity mechanisms are technology-neutral so that they allow for the participation of emerging forms of capacity, including among others renewable energy sources, storage facilities, and demand response, provided that these resources fulfill certain eligibility criteria. The duration of the capacity contracts is usually differentiated for existing and new capacity, while the technicalities of the participation of eligible capacity resources in the auctions in terms of the bid cap and minimum size also vary. In most cases, a secondary market is available to allow for volume reallocation and risk management improvement, while on the other hand strict penalty schemes are imposed to capacity resources that have been awarded long-term capacity for non-fulfillment of their contractual obligations.
In the second part of this paper, a detailed simulation of the envisaged Greek long-term capacity remuneration mechanism has been performed for the forthcoming decade (2022–2031) and is analytically presented. Acknowledging that the power system and electricity market uncertainties in the long-term may have a notable effect on the outcome of the capacity auctions, three distinct scenarios were formulated regarding the Greek power system configuration during the forthcoming decade, while two distinct bidding strategies were considered regarding the participation of the IPP generating units in the said capacity mechanism. It is concluded that the implementation of the proposed capacity mechanism is expected to maintain the annual capacity charge for Retailers in the range 5.5–5.9 €/MWh, as long as the existing capacity is not entitled to premiums higher than its bid cap for the first 5-year implementation period. Under moderate and adverse power system capacity adequacy conditions and after 2027 when specific market power mitigation rules expire, the capacity charge may increase significantly up to almost 9 €/MWh, thus posing an additional economic burden to the electricity supply companies and, subsequently, to the end consumers. Before the outbreak of the ongoing energy crisis that raised the electricity supply cost to unimaginable heights, average wholesale market clearing prices in Greece (and Europe) were in the range of 50–80 €/MWh and, therefore, capacity charges in the range of 5.5–9.0 €/MWh would account for more than 10% of the total electricity charge imposed to the end-consumers. In other words, this would be a notable cost component that should be recognized and factored in the retail tariffs offered by the electricity suppliers to the end consumers.
Our future work will focus on the implementation of different capacity mechanism schemes in the same country (e.g., Greece) in order to compare their effectiveness and/or propose a novel capacity mechanism that could combine the advantages, properties and design parameters from a pool of capacity mechanisms that are already in force in Europe. In this context, a relevant research and discussion regarding the necessity and possible proposals for re-designing core parameters of the current capacity mechanisms across Europe, in combination with the possible restructuring of the electricity markets as a whole in view of the latest developments in the global energy landscape, could also be included in our future work.

Author Contributions

Conceptualization, C.K.S. and P.N.B.; methodology, C.K.S. and P.N.B.; resources, C.K.S. and P.N.B.; writing—original draft preparation, C.K.S.; writing—review and editing, C.K.S. and P.N.B.; visualization, C.K.S.; supervision, P.N.B.; project administration, P.N.B. All authors have read and agreed to the published version of the manuscript.

Funding

This research received no external funding.

Data Availability Statement

Not applicable.

Conflicts of Interest

The authors declare no conflict of interest.

Appendix A

The analytical system load demand data and the RES, hydro units, pumped storage units and BESS technologies input data for the entire study period (2022–2031) and all scenarios are presented in Table A1, Table A2 and Table A3.
It is noted that the annual system load forecasts for the Low and High Scenario were based on the respective scenarios that are included in the Ten-Year Network Development Plan (TYNDP) 2021–2030 of the Greek Transmission System Operator (ADMIE) [49], appropriately adjusted downwards during the first three-year period (2022–2024) to account for: (a) the negative effect that the on-going global energy crisis is expected to have on the forecasted system load demand in the mid-term, and (b) the urgent EU measures to promote energy efficiency in order to ensure short-/mid-term security of energy supply in the entire EU. Intermediate scenario was formulated by the authors as the average value of the respective load demand values of the two extreme scenarios, namely Low and High Scenario.
Regarding Hydro, Pumped Storage, RES and BESS capacity forecasts, all annual projections per technology were based on the respective forecasts that have been included in the Greek National Energy and Climate Plan (NECP) [50] that was prepared by the competent Greek Authorities and was approved by the European Union.
Table A1. System Load Data.
YearTotal Electricity Consumption [TWh]System Peak Load [MW]
LowIntermediateHighLowIntermediateHigh
202252.3853.5854.779750997910,207
202354.4556.0357.6010,42010,73111,041
202455.8657.6759.4710,56510,90711,248
202557.0058.9360.8510,74011,10011,460
202657.1559.3161.4610,77011,17311,575
202757.2859.6361.9810,79011,23311,675
202858.9461.7364.5111,10011,63012,160
202960.0862.8165.5411,32011,83512,350
203060.7363.4566.1611,45011,96012,470
203161.0663.9266.7811,51512,05312,590
Table A2. Eligible resources capacity.
YearEligible Resources Capacity [MW]
HydroPumped-StorageBESS
LowHigh
20221666000
20231666000
20241666000
2025168038775100
20261680387100200
20271680387150300
20281680387200400
20291680387250500
20301680387300600
20311680387363725
Table A3. RES capacity.
YearLow ScenarioHigh Scenario
Ineligible Capacity
[MW]
Eligible Capacity
[MW]
Ineligible Capacity
[MW]
Eligible Capacity
[MW]
20221204012120
20231354013770
20241465015130
2025151058157380
202615101561573225
202715102591573372
202815103681573523
202915104811573678
203015105951573834
203115106921573959

References

  1. Stoft, S. Power Systems Economics: Designing Markets for Electricity; John Wiley and Sons: New York, NY, USA, 2002. [Google Scholar]
  2. Crampton, P.; Stoft, S. “The Convergence of Market Designs for Adequate Generating Capacity with Special Attention to the CAISO’s Resource Adequacy Problem”, MIT-CEEPR (Series) 06-007WP. 2006. Available online: https://drum.lib.umd.edu/bitstream/handle/1903/7056/cramton-stoft-market-design-for-resource-adequacy.pdf?sequence=1&isAllowed=y (accessed on 10 November 2022).
  3. Joskow, P.L. Capacity payments in imperfect electricity markets: Need and design. Util. Policy 2008, 16, 159–170. [Google Scholar] [CrossRef]
  4. Spees, K.; Newell, S.A.; Pfeifenberger, J.P. Capacity Markets—Lessons Learned from the First Decade. Econ. Energy Environ. Policy 2013, 2, 1–26. [Google Scholar] [CrossRef]
  5. Bushnell, J.; Flagg, M.; Mansur, E. Capacity Markets at a Crossroads; Energy Institute at Hass Working Paper; University of California: Berkeley, CA, USA, 2017. [Google Scholar]
  6. Bhagwat, P.C.; de Vries, L.J.; Hobbs, B.F. Expert survey on capacity markets in the US: Lessons for the EU. Util. Policy 2016, 38, 11–17. [Google Scholar] [CrossRef] [Green Version]
  7. Duggan, J.E. Capacity Market Mechanism Analyses: A Literature Review. Curr. Sustain. Energy Rep. 2020, 7, 186–192. [Google Scholar] [CrossRef]
  8. Byers, C.; Levin, T.; Botterud, A. Capacity market design and renewable energy: Performance incentives, qualifying capacity, and demand curves. Electr. J. 2018, 31, 65–74. [Google Scholar] [CrossRef]
  9. Kozlova, M.; Overland, I. Combining capacity mechanisms and renewable energy support: A review of the international experience. Renew. Sustain. Energy Rev. 2022, 155, 111878. [Google Scholar] [CrossRef]
  10. Mastropietro, P.; Fontini, F.; Rodilla, P.; Batlle, C. The Italian capacity remuneration mechanism: Critical review and open questions. Energy Policy 2018, 123, 659–669. [Google Scholar] [CrossRef]
  11. Komorowska, A.; Benalcazar, P.; Kaszyński, P.; Kamiński, J. Economic consequences of a capacity market implementation: The case of Poland. Energy Policy 2020, 144, 111683. [Google Scholar] [CrossRef]
  12. Crampton, P.; Ockenfels, A.; Stoft, S. Capacity market fundamentals. Econ. Energy Environ. Policy 2013, 2, 27–46. [Google Scholar]
  13. Bhagwat, P.C.; Iychettira, K.K.; Richstein, J.C.; Chappin, E.J.; De Vries, L.J. The effectiveness of capacity markets in the presence of a high portfolio share of renewable energy sources. Util. Policy 2017, 48, 76–91. [Google Scholar] [CrossRef]
  14. Wolak, F. Long-Term Resource Adequacy in Wholesale Electricity Markets with Significant Intermittent Renewables; Working paper 29033; National Bureau of Economic Research: Cambridge, MA, USA, 2021. [Google Scholar]
  15. Lynch, M.; Nolan, S.; Devine, M.T.; O’Malley, M. The impacts of demand response participation in capacity markets. Appl. Energy 2019, 250, 444–451. [Google Scholar]
  16. Fraunholz, C.; Keles, D.; Fichtner, W. On the role of electricity storage in capacity remuneration mechanisms. Energy Policy 2021, 149, 112014. [Google Scholar] [CrossRef]
  17. Brito-Pereira, P.; Mastropietro, P.; Rodilla, P.; Barroso, L.A.; Batlle, C. Adjusting the aim of capacity mechanisms: Future-proof reliability metrics and firm supply calculations. Energy Policy 2022, 164, 112891. [Google Scholar] [CrossRef]
  18. Söder, L.; Tómasson, E.; Estanqueiro, A.; Flynn, D.; Hodge, B.-M.; Kiviluoma, J.; Korpås, M.; Neau, E.; Couto, A.; Pudjianto, D.; et al. Review of wind generation within adequacy calculations and capacity markets for different power systems. Renew. Sustain. Energy Rev. 2020, 119, 109540. [Google Scholar] [CrossRef]
  19. Holmberg, P.; Tangerås, T.P. Strategic Reserves versus Market-wide Capacity Mechanisms; EPRG Working Paper 2109; Research Institute of Industrial Economics: Stockholm, Sweden, 2021. [Google Scholar]
  20. Roques, F. Hybrid Electric Market Models: Key Principles and Possible Approaches; Presentation to CEEM Conference. June 2021. Available online: https://www.iaee.org/proceedings/article/16944 (accessed on 10 November 2022).
  21. Schittekatte, T.; Meeus, L. Capacity Remuneration Mechanisms in the EU: Today, T, and a Look Further Ahead; RSC Working Paper 2021/71; Florence School of Regulation: Florence, Italy, 2021. [Google Scholar]
  22. Terna. Analisi dei dati elettrici 2016. 2016. Available online: https://download.terna.it/terna/0000/0994/85.PDF (accessed on 10 November 2022).
  23. European Network of Transmission System Operators for Electricity (ENTSO-E). Mid-term Adequacy Forecast 2017 edition. 2017. Available online: https://www.entsoe.eu/Documents/SDC%20documents/MAF/20170918_MAF_2017_FOR_CONSULTATION.pdf (accessed on 10 November 2022).
  24. European Commission. Italian Implementation Plan. 2020. Available online: https://www.mise.gov.it/images/stories/documenti/Piano_di_implementazione_Reg_UE_943_2019-Mercato_elettrico.pdf (accessed on 10 November 2022).
  25. Ministero dello sviluppo economico and Ministero dell’ Ambiente e della Tutela del Territorio e del Mare, Italy. Strategia Energetica Nazionale 2017. 2017. Available online: https://www.mite.gov.it/comunicati/strategia-energetica-nazionale-2017 (accessed on 10 November 2022).
  26. European Commission. State Aid SA.42011 (2017/N)—Italian Capacity Mechanism. 2018. Available online: https://ec.europa.eu/competition/state_aid/cases/270875/270875_1979508_218_2.pdf (accessed on 10 November 2022).
  27. European Commission. State Aid: Commission Approves Revised French Market-wide Capacity Mechanism. 2016. Available online: https://ec.europa.eu/commission/presscorner/api/files/document/print/en/ip_16_3620/IP_16_3620_EN.pdf (accessed on 10 November 2022).
  28. R2b Energy Consulting. Effects of the German Capacity Reserve on Neighbouring Member States; Technical Report; Federal Ministry for Economic Affairs and Climate Action: Berlin, Germany, 2021. [Google Scholar]
  29. European Commission. State Aid SA.45852 (2017/C)—German Capacity Reserve. 2018. Available online: https://ec.europa.eu/competition/state_aid/cases/269083/269083_1983030_171_13.pdf (accessed on 10 November 2022).
  30. European Commission. State Aid SA. 54915 (2019/N)—Belgium Capacity Remuneration Mechanism. 2020. Available online: https://eur-lex.europa.eu/legal-content/EN/TXT/PDF/?uri=CELEX:52020AS54915&from=GA (accessed on 10 November 2022).
  31. European Commission. SA.48648 (2017/NN)—Belgium—Strategic Reserve. 2018. Available online: https://ec.europa.eu/competition/state_aid/cases/272020/272020_1964726_118_2.pdf (accessed on 10 November 2022).
  32. European Commission. State aid No. SA.46100 (2017/N)—Planned Polish Capacity Mechanism. 2018. Available online: https://ec.europa.eu/competition/state_aid/cases/272253/272253_1977790_162_2.pdf (accessed on 10 November 2022).
  33. Department of Energy & Climate Change, UK. Capacity Market: Design and Implementation Update, Annex C. 2012. Available online: https://assets.publishing.service.gov.uk/government/uploads/system/uploads/attachment_data/file/65637/7104-emr-annex-c-capacity-market-design-and-implementat.pdf (accessed on 10 November 2022).
  34. University of Cambridge. UK Electricity Market Reform and the Energy Transition: Emerging Lessons. 2018. Available online: https://www.eprg.group.cam.ac.uk/wp-content/uploads/2018/06/1817-Text.pdf (accessed on 10 November 2022).
  35. European Commission. State aid No. SA.44464 (2017/N)—Irish Capacity Mechanism. 2017. Available online: https://ec.europa.eu/competition/state_aid/cases/267880/267880_1948214_166_2.pdf (accessed on 10 November 2022).
  36. Batlle, C.; Pérez-Arriaga, I.J. Design criteria for implementing a capacity mechanism in deregulated electricity markets. Util. Policy 2008, 16, 184–193. [Google Scholar] [CrossRef] [Green Version]
  37. Cramton, P.; Ockenfels, A. Economics and Design of Capacity Markets for the Power Sector. In Interdisziplinäre Aspekte der Energiewirtschaft. Energie in Naturwissenschaft, Technik, Wirtschaft und Gesellschaft; von Weizsäcker, C., Lindenberger, D., Höffler, F., Eds.; Springer Vieweg: Wiesbaden, Germany, 2016. [Google Scholar]
  38. Benedettini, S. PJM and ISO-NE forward Capacity Markets: A Critical Assessment. 2013. Available online: https://simonabenedettini.files.wordpress.com/2015/01/report.pdf (accessed on 10 November 2022).
  39. PJM Interconnection. PJM Manual [18]: PJM Capacity Market. 2021. Available online: https://www.pjm.com/-/media/documents/manuals/m18.ashx (accessed on 10 November 2022).
  40. Billinton, R.; Allan, R. Reliability Evaluation of Power Systems, 2nd ed.; Plenum: New York, NY, USA, 1996. [Google Scholar]
  41. Simoglou, C.K.; Bakirtzis, E.A.; Biskas, P.N.; Bakirtzis, A.G. Probabilistic evaluation of the long-term power system resource adequacy: The Greek case. Energy Policy 2018, 117, 295–306. [Google Scholar] [CrossRef]
  42. The Brattle Group. Singapore Forward Capacity Market—High-Level Design Straw Proposal. 2019. Available online: https://www.ema.gov.sg/cmsmedia/Annex%20A%20-%20High-Level%20Design%20Straw%20Proposal%20v1.pdf (accessed on 10 November 2022).
  43. Department of Energy & Climate Change, UK. Implementing Electricity Market Reform (EMR). 2014. Available online: https://assets.publishing.service.gov.uk/government/uploads/system/uploads/attachment_data/file/324176/Implementing_Electricity_Market_Reform.pdf (accessed on 10 November 2022).
  44. McNamara, F. Capacity Market, Department of Energy & Climate Change, UK. 2014. Available online: https://assets.publishing.service.gov.uk/government/uploads/system/uploads/attachment_data/file/335760/capacity_market_policy_presentation.pdf (accessed on 10 November 2022).
  45. Proposal of the Ministry of Energy and Environment for the Submission of the Final Notification to DG Competition for the Establishment of a Long-Term Capacity Remuneration Mechanism in the Greek Electricity Market. April 2019. Available online: https://www.clientearth.org/media/mc3asmzl/clientearth-response-to-the-consultation-of-the-long-term-capacity-remuneration-mechanism-in-the-greek-electricity-market-ce-en.pdf (accessed on 10 November 2022).
  46. Long-Term Capacity Adequacy Study 2020–2030, December 2019, ADMIE. Available online: https://www.admie.gr/sites/default/files/users/dssas/meleti-eparkeias-ishyos-2020-2030.pdf (accessed on 10 November 2022).
  47. Simoglou, C.K.; Biskas, P.N.; Bakirtzis, E.A.; Matenli, A.N.; Petridis, A.I.; Bakirtzis, A.G. Evaluation of the Capacity Credit of RES: The Greek Case. In Proceedings of the 2013 IEEE Grenoble Conference, Grenoble, France, 16–20 June 2013. [Google Scholar]
  48. Garver, L.L. Effective Load Carrying Capability of Generating Units. IEEE Trans. Power Appar. Syst. 1966, 85, 910–919. [Google Scholar] [CrossRef]
  49. Greek Independent Transmission Operator. Ten-Year Network Development Plan 2021–2030. 2021. Available online: https://www.admie.gr/en/grid/development/ten-year-development-plan (accessed on 10 November 2022).
  50. National Energy and Climate Plan (NECP) 2020–2030, Greek Ministry of Environment and Energy. December 2019. Available online: https://www.e-nomothesia.gr/kat-periballon/apophase-kubernetikou-sumbouliou-4-2019.html (accessed on 10 November 2022). (In Greek).
Figure 1. Comparison of demand curves.
Energies 16 00982 g001
Figure 2. Typical demand curve in the Italian capacity market.
Energies 16 00982 g002
Figure 3. High-level design of the proposed CRM.
Energies 16 00982 g003
Figure 4. Auction demand curve/intermediate load scenario/Year 2025.
Energies 16 00982 g004
Figure 5. Auction clearing (Scenario 2, Year 2024)–Base strategy.
Energies 16 00982 g005
Figure 6. CRM annual cost and capacity charge–Base strategy.
Energies 16 00982 g006
Figure 7. IPP revenues sensitivity analysis–Base strategy.
Energies 16 00982 g007
Figure 8. Auction clearing prices–Aggressive strategy.
Energies 16 00982 g008
Figure 9. Auction clearing (Scenario 2, Year 2024)–Aggressive strategy.
Energies 16 00982 g009
Figure 10. Auction clearing (Scenario 2, Year 2027)–Aggressive strategy.
Energies 16 00982 g010
Figure 11. CRM annual cost and capacity charge–aggressive strategy.
Energies 16 00982 g011
Table 1. Overview of examined capacity mechanisms.
SubjectItalyFranceGermanyBelgiumPoland
NecessityRetirement of conventional
thermal capacity
Winter peak load increaseRES developmentNuclear phase-out
in 2022–2025
Mothballing and phasing-out of old inefficient power units by 2020
System load increaseRES growthRetirement of nuclear power plants in 2022Thermal capacity phase-out in neighboring countriesMarket failures (“missing money”, high price volatility)
DecarbonizationInadequate investments,
“missing money”
Market failures (“missing money”, high price volatility)Lack of investments
Inadequate investments,
“missing money”
Strategic reserve mechanism not successful
ProductCapacity Availability (ROs)Capacity GuaranteesReserve Capacity AvailabilityCapacity Availability (ROs)Capacity Availability
Location
TypeDescending clock central auctionsOver-The-Counter & AuctionsAuctionsSingle-round central auctionsDescending clock central auctions
EligibilityExisting and new generating units (conventional & RES)Certified generating unitsGenerating unitsExisting and new generating unitsExisting and new generating units
Demand ResponseCertified DR operatorsStorageDemand ResponseDemand Response
Storage Demand response operatorsStorageStorage
Foreign capacity Foreign capacityForeign capacity
Auction FrequencyMain auction: Y-4Auctions in March, April, June, Sept., Oct. and Dec. of Y-1Every 2 years for two-year delivery periodMain auction: Y-4Main auction: Y-5
Adjustment Auctions:
Y-3, Y-2, Y-1
Additional auction:
Y-1
Four additional auctions, one for each quarter of delivery year: Y-1
Auction
clearing
Pay-as-clearPay-as-bidPay-as-clearPay-as-bid (first two delivery periods),
Pay-as-clear (next delivery periods)
Pay-as-clear
Bid limits /
Price cap
New capacity:
75,000–95,000 €/ΜW-y
Change every year100,000 €/MW-y80,000–105,000 €/ΜW-yAuction price cap (new units): 1.5 × CONE (97,500–105,000€/MW-y)
Existing capacity:
25,000–45,000 €/ΜW-y
20,000 €/MW-y (2017), 40,000 €/MW-y (2018), 60,000 €/MW-y (2019) Intermediate price cap for first Y-4 auction for 1-year contract:
20,800–31,200 €/ΜW-y
Existing capacity (price-takers):
45,000 €/MW-y
Minimum bid quantity: 1 MWMinimum bid quantity: 2 MW
Contracts DurationExisting capacity:
3 years
Existing capacity:
1 year
2 years1, 3, 8 or 15 years depending on
CAPEX range
Existing capacity: 1 year (5 years for increased CAPEX)
New capacity:
15 years
New capacity:
7 year
New capacity: 5 or 15 years, depending on CAPEX range.
5 and 15-year agreements:
Possible extension by 2 years for low-carbon capacity and district heating
Capacity RequirementAccording to target LOLE (3 h/y)Capacity Guarantees requirement for 100–150 peak hours per delivery year2 GWAccording to target LOLE (3 h/y), reservation of 2–3 GW for Y-1 auctionsAccording to target LOLE (3 h/y)
Demand
Curve
Downward sloping curveNo demand curveNo demand curveDownward sloping curve for Y-4 auctions, vertical curve for Y-1 auctionsDownward sloping curve
Secondary marketYesYesNot allowedYesYes
(OTC or organized market)
PenaltiesYes (for temporary and definitive non-fulfilment)Imbalance settlement between forecasts and actual resultsYes
(up to 20% of total remuneration)
Yes (monthly limit equal to 20% of respective revenues)Yes (hourly, monthly and annual limits) & bonus for over-performance
SubjectGreat BritainIrelandCyprusUSA-PJMUSA–New England
NecessityCoal power plants retirement“Missing money” problemHigh dependence on fossil fuelsSystem load increaseRES generation increase
System load increaseDecarbonizationSystem load increaseLow and volatile market pricesLow and volatile market prices
DecarbonizationLimited interconnectionsLack of interconnectionsLack of investments“Missing money” problem
Lack of investments, “missing money” problemLimited potential for demand responseSystem limitations to accommodate high RES shares Lack of investments
ProductCapacity AvailabilityCapacity Availability (ROs)Reserve Capacity AvailabilityCapacity AvailabilityCapacity Availability
Location Locational value of capacityLocational value of capacity
TypeDescending clock central auctionsCentral auctionsCentral auctionsCentral auctionsDescending clock central auctions
EligibilityExisting and new generating unitsExisting and new generating units (conventional & RES)Existing and new generating unitsLoad serving entities (mandatory)Existing and new generating units
Demand ResponseDemand ResponseDemand ResponseExisting generating units (mandatory) & planned units (voluntary)Existing and new Demand Response
StorageStorageStorageExisting and new demand response resources (voluntary)Existing and new imports
Foreign capacityForeign capacity Qualifying transmission upgrades (voluntary)
Energy efficiency resources (voluntary)
Auction FrequencyMain auction: Y-4Main auction: Y-4Main auction: Y-1Base Residual Auction: Y-3Main Auction: Y-3
Additional auction:
Y-1
Adjustment Auctions:
Y-2, Y-1
Incremental Auctions: M-23, M-13, M-3Reconfiguration Auctions: Y-1, M-1
Auction
clearing
Pay-as-clearPay-as-clearPay-as-clearPay-as-clear Adjustment for locationPay-as-clear
Adjustment for location
Bid limits/
Price cap
Price cap:
75,000 £/MW-y,
Existing capacity: 25,000 £/MW-y
New capacity:
138,450 €/ΜW-y
Price cap:
33,000 €/MW-y
Price cap: Max [CONE; 1.5 (CONE-Energy & Ancillary Services Revenue)]Price cap (starting price): 2 × CONE
Minimum bid price: £0/kWExisting capacity: 46,150 €/ΜW-yBid quantity: Full capacityBid cap for existing unitsPrice floor (end price): 0.6 × CONE
Minimum bid quantity: 2 MW Minimum bid quantity: 0.1 MWMinimum bid quantity: 0.1 MW
Contracts DurationExisting capacity: 1 year, (up to 3 years for plant refurbishment)Existing capacity:
1 year
1 year1 year1 year
New capacity:
up to 15 years
New capacity:
10 years
Capacity RequirementAccording to target LOLEAccording to target LOLE (8 h/y)Based on resource adequacy studiesTarget capacity: FPR x Peak load ForecastAccording to target LOLE (0.1 day/y)
Demand
Curve
Downward sloping curveDownward sloping curveNo demand curveDownward sloping curveVertical demand curve
Secondary marketYesYesNoYes
(Bilateral Market)
Yes (Reconfiguration auctions)
PenaltiesYes
(1/24th of the relevant auction’s clearing price, in £/MWh)
N/AN/AYes
[=Shortage capacity x Auction price + Max (20$/MW-day, 0.2*Auction price)]
Yes
(maximum daily, monthly and annual penalties)
Table 2. RES units’ de-rating factor.
RES TechnologyDe-Rating Factor [%]
Wind85.0%
PV90.0%
Small Hydro65.0%
Biomass-Biogas50.0%
Cogeneration80.0%
Solar Thermal90.0%
Table 3. CRM auction clearing results–Base Strategy.
Scenario 1
YearAuction Winning Capacity [MW]
(A)
Ineligible Capacity [MW]
(B)
Awarded Eligible Capacity [MW]
(C) = (A) − (B)
&
(C) = (D) + (E) + (F)
RES + Interconn. + BESS + DR
Awarded Capacity [MW]
(D)
PPC
Total UCAP [MW]
PPC Awarded Capacity [MW]
(E)
IPPs
Total UCAP [MW]
IPPs
Awarded Capacity [MW]
(F)
2022888315127371950564456442781777
20239494167778179504759475931372107
20249626181378139504054405439002809
202597851873791211304068406849132714
202698131873794013754068406849342497
202798311873795816224068406849562268
202810,1131873824018734068406849712299
202910,3141873844121284068406849772245
203010,4321873855923844068406849772107
203110,4911873861826344068406849771917
Scenario 2
2022909215127580950564456442781986
20239777167781009504759475931372391
20249937181381249504054405439003121
202510,1131873824011304068406849133042
202610,1801873830713754068406849342864
202710,2351873836216224068406849562672
202810,5961873872318734068406849712782
202910,7831873891021284068406849772714
203010,8971873902423844068406849772572
203110,9821873910926344068406849772407
Scenario 3
20229300150477969505644564427811201
202310,060165484069504759475931372696
202410,248176584839504054405439003479
202510,4411810863110834068406849133480
202610,5461810873612064068406849343462
202710,6371810882713594068406849563400
202811,0791810926915184068406849713683
202911,2521810944216814068406849773693
203011,3621810955218454068406849773639
203111,4711810966120054068406849773588
Table 4. CRM Cost–Base Strategy.
YearScenario 1Scenario 2Scenario 3
Total Cost [m€]Capacity Charge [€/ΜWh]Total Cost [m€]Capacity Charge [€/ΜWh]Total Cost [m€]Capacity Charge [€/ΜWh]
2022294.95.63303.25.66311.85.69
2023312.75.74324.05.78336.25.84
2024312.55.59325.05.64339.35.71
2025316.55.55329.65.59345.35.67
2026317.65.56332.35.60349.45.69
2027318.35.56334.55.61353.15.70
2028329.65.59348.95.65370.85.75
2029337.65.62356.45.67377.75.76
2030342.45.64361.05.69382.15.77
2031344.75.65364.35.70386.45.79
Table 5. CRM Cost–Aggressive Strategy.
YearScenario 1Scenario 2Scenario 3
Total Cost
[m€]
Capacity Charge [€/ΜWh]Total Cost
[m€]
Capacity Charge [€/ΜWh]Total Cost
[m€]
Capacity Charge [€/ΜWh]
2022294.95.63303.25.66311.85.69
2023312.75.74323.95.78334.35.80
2024310.55.56324.95.63347.05.83
2025317.55.57331.75.63355.85.85
2026319.15.58337.75.69362.25.89
2027318.35.56417.37.00531.68.58
2028329.65.59462.67.49558.68.66
2029337.65.62452.27.20569.18.68
2030342.45.64417.36.58575.88.70
2031344.75.65372.55.83582.58.72
Disclaimer/Publisher’s Note: The statements, opinions and data contained in all publications are solely those of the individual author(s) and contributor(s) and not of MDPI and/or the editor(s). MDPI and/or the editor(s) disclaim responsibility for any injury to people or property resulting from any ideas, methods, instructions or products referred to in the content.

