1. Introduction
Enhancement of power conversion efficiency is essential for photovoltaic (PV) devices. Various concepts have been realized to date to surpass the Shockley–Queisser (SQ) limit, such as tandem (multi-junction) solar cells, multiple exciton generation, intermediate bands, and metallic nano-concepts (plasmonic) [
1,
2,
3,
4,
5].
Multiple exciton generation solar cells (MEGSCs) are promising PV devices that surpass the SQ limit [
1,
2]. Ideally, one incident photon with an energy (E
ph) greater than the bandgap energy (E
g) can generate multiple electron-hole pairs (EHPs), where excess energy (E
ph-E
g) contributes to the creation of additional EHPs by impact ionization [
2,
3]. The number of generated and recombined EHPs should be conserved under the conditions of substantial blackbody radiation. Since Kolondinski et al. [
6] first reported the multiple exciton generation (MEG) effect with internal quantum efficiency (IQE) of over 100% at 3.4 eV in Si solar cells, where the excess energy of ultraviolet radiation created hot carriers via impact ionization, the advanced theoretical research proposed the use of nanostructures (e.g., quantum dots) owing to their excellent quantum confinement. Quantum efficiency is the ratio of the number of charges collected by the solar cell to the incoming or absorbed photon energy. Typically, the IQE relies on the absorption of light to create EHP. Bulk Silicon has an indirect transition from Γ point to X point (~1.12 eV) and a direct transition Γ point (~3.4 eV) due to an indirect bandgap material. The IQE over 100% occurred at Γ point, as the absorbed photon energy (more than 3.4 eV, the near ultraviolet region) and its excess energy (3.4 − 1.12 = 2.28 eV) could create another hot carrier by impact ionization [
3,
6]. Furthermore, various studies reported the efficiency limit of MEG and the possibility of its occurrence in nanostructures based on the quantum yield (QY) and threshold energy (E
th) [
7,
8,
9,
10,
11,
12,
13,
14]. Notably, the QY and E
th are critical parameters that determine the ideality of MEGSCs [
12,
13]. E
th refers to the photon energy at which the QY exceeds 100%. In theory, ideal QY (IQY) increases in accordance with a staircase (step) function. However, the experimental QY data deviate from the ideal case: QY increases linearly after E
th [
12,
13,
14,
15,
16,
17,
18,
19,
20,
21]. More specifically, the QY can show the loss of carriers corresponding to each energy state in quantum dot structures, depending on the material properties (ex. surface states) [
16,
17,
18,
19,
20,
21]. The non-ideal QY (NQY) was experimentally extracted using pump-probe measurements by comparing the peaks corresponding to the excited and ground states [
12,
13,
16,
17,
18,
19,
20,
21]. Moreover, it was modeled theoretically using the MEG efficiency (E
g/the additional energy required to create further EHPs) for the slope calculation of NQY. Additionally, E
th has been defined in terms of the effective mass and MEG efficiency [
21,
22]. Furthermore, NQY and its theoretical of efficiency limit have been extensively studied [
12,
13,
16,
17,
18,
23,
24,
25,
26,
27,
28]. However, most experimental data depend on specific materials, and the QY cannot be generalized [
15].
First, this paper discusses the Dirac delta function and unit step function based on their mathematical relationship. The integration of the Heaviside unit step function under a shift of m∙E
g results in IQY, and its derivative yields a group of delta functions. Furthermore, the deviation exhibited by the delta function can describe NQY [
29,
30]. Most QY extractions are performed by fitting certain parameters from the experimental results [
12,
13,
16,
17,
18,
19,
20]. In contrast, this study employed a purely theoretical approach by adjusting the delta function to obtain both IQY and NQY and analyzed the non-idealities of MEGSCs. These aspects have not been thoroughly addressed in the previous research. NQY is a good indicator of the material status in quantum dot MEGSCs, as it includes material information. Even though substantial QY can be achieved experimentally, it will be difficult to implement efficient MEGSCs without a near-perfect solar cell material [
31]. The conventional detailed balance (DB) limit considers only one radiative recombination to predict the maximum theoretical efficiency limit. However, NQY includes material information such as non-radiative recombination (NR: Auger recombination, surface defects, and phonons) and describes the loss of carriers, incomplete light absorption, incomplete photo-generated current, and its low practical efficiency [
31,
32,
33,
34,
35]. Thus, we use the proposed QY extraction method in the DB limit of MEGSC to predict higher practical efficiency limit by comparing peak intensities (maximum peak at E
g and second maximum peak at 2E
g) while considering the NR impact. This approach is similar to QY extraction by pump-probe measurement because of the comparison of the peak intensities. However, this QY extraction approach explains the carrier occupancy rate at each energy state, where a low occupancy rate indicates carrier loss owing to non-radiative recombination, incomplete light absorption, and insufficient photo-generated current [
35]. In other words, the ratio of the peak intensities describe the status of radiative recombination, including NR and its correlated ideal reverse saturation current density. Therefore, the variation in the ideal saturation current can determine the performance of the MEGSC.
2. Theory
We applied mathematical approaches to derive a generalized QY. In theory, the derivative of the unit step function is a Dirac delta function. Thus, the staircase function can be expressed as follows [
30,
36]:
where H denotes the Heaviside step function, m is a positive integer.
Furthermore, the derivative of each step function is
where δ denotes the delta function.
For this simulation, we assumed that if multiple electrons corresponding to each energy state m∙E
g certainly exist, the Dirac delta function at m∙E
g can represent the occupancy status of electrons to exhibit ideal qualities. To demonstrate the delta functions, we employed a Gaussian distribution function (GDF), as expressed in Equation (3), primarily because the delta function can represent a form of the GDF limit. The GDF is the probability density function of a normal distribution. In the limit form of the GDF case, the delta function presents a high probability density; otherwise, it displays a low probability density. We set the mean or expected value of the variable to correspond to the distribution shown in Equation (3) as m∙E
g, to represent multiple energy states.
where σ indicates the standard deviation (=0.004, 0.1, 0.2, 0.3, 0.4, 0.5…), E represents an arbitrary energy, E
g denotes the bandgap energy, and m = 1, 2, 3, ….
First, we calculated the GDF at m∙E
g, where m = 1, 2, 3∙∙∙ (from Equations (3)–(5)) to obtain the Dirac delta function corresponding to each energy state as follows: f
1(E) is the GDF at E
g corresponding to the generation of one EHP. Following that, we employed cumulative integration and normalized the value of E (Equation (5)) for each energy state. Finally, we added the values to obtain the QY (Equation (7)).
Figure 1 illustrates the procedure for IQY.
Figure 2 and
Figure 3 represent the procedure for NQY.
where f
1 indicates the GDF at E
g, f
m(E) indicates GDF at m∙E
g, −∞ < x
n < ∞, σ denotes the standard deviation corresponding to the energy state (=m∙E
g), m = 1, 2, 3∙∙∙, and f
n represents the calculation of the unit-step function from f
m (Equation (3)) at each energy state. E
i indicates the initial energy state, E
f indicates the final energy state, and x
n is 0.01, 0.02, …, 10 eV.
As σ decreases, the GDF exhibits a very sharp peak, like a delta function. By contrast, increasing σ increases the width and lowers the peak of the GDF distribution. Therefore, the deviation from the ideal condition (i.e., the non-ideal condition) can be effectively determined by varying σ. Therefore, we chose a small value of σ and a high peak at Eg to explain the generation of one EHP. Subsequent integration of each delta function yields the unit step function for each energy state. Finally, the cumulative sum of each step function yields the IQY.
For the value of σ for each energy state, we referred to the value of the external radiative recombination efficiency (the ratio of radiative to non-radiative recombination). The fraction of radiative recombination, f
C, can be considered to determine the peak intensity corresponding to each energy state [
1,
37,
38]. A small external radiative efficiency (ERE) or f
C, such as 10
−5–10
−10, indicates a high non-radiative recombination rate, which results in a low power conversion efficiency [
37]. Thus, we set the ratio of the second to first peak to represent the non-radiative recombination rate.
For IQY, we assumed σ to be 4 × 10
−3 and normalized at each energy state, such as the delta function in a zero-dimensional structure (see
Figure 1a and Equation (5)). The normalized cumulative integration of this function yields an individual step function for each state (
Figure 1b, Equation (6)), and the summation of each step function yields: the staircase function (
Figure 1c, Equation (7)). By contrast, NQY has an increased E
th and a different shape in the QY curve. The increase in E
th necessitates a higher photon energy to generate multiple EHPs.
Figure 1.
Conversion from the Gaussian distribution function to the IQY. (
a) The delta function by normalized GDF of each energy state, (
b) the step function of each energy state, and (
c) the corresponding QYs. The units are arbitrary for (
a–
c) [Reprinted/Adapted from Ref. [
39], 2021, Jongwon Lee, CC BY 4.0].
Figure 2.
Conversion from the GDF to the NQY at σ
1 = 0.004 at E
g and σ
m = 0.1 at m∙E
g (m = 2, 3, 4,…). (
a) Normalized and redistributed GDF, (
b) the corresponding GDF distribution for E
th calculation, (
c) the results of Equation (7) representing the deviation from the ideal case, and (
d) the corresponding QY. The units were normalized for (
a,
b) [Reprinted/Adapted from Ref. [
39], 2021, Jongwon Lee, CC BY 4.0].
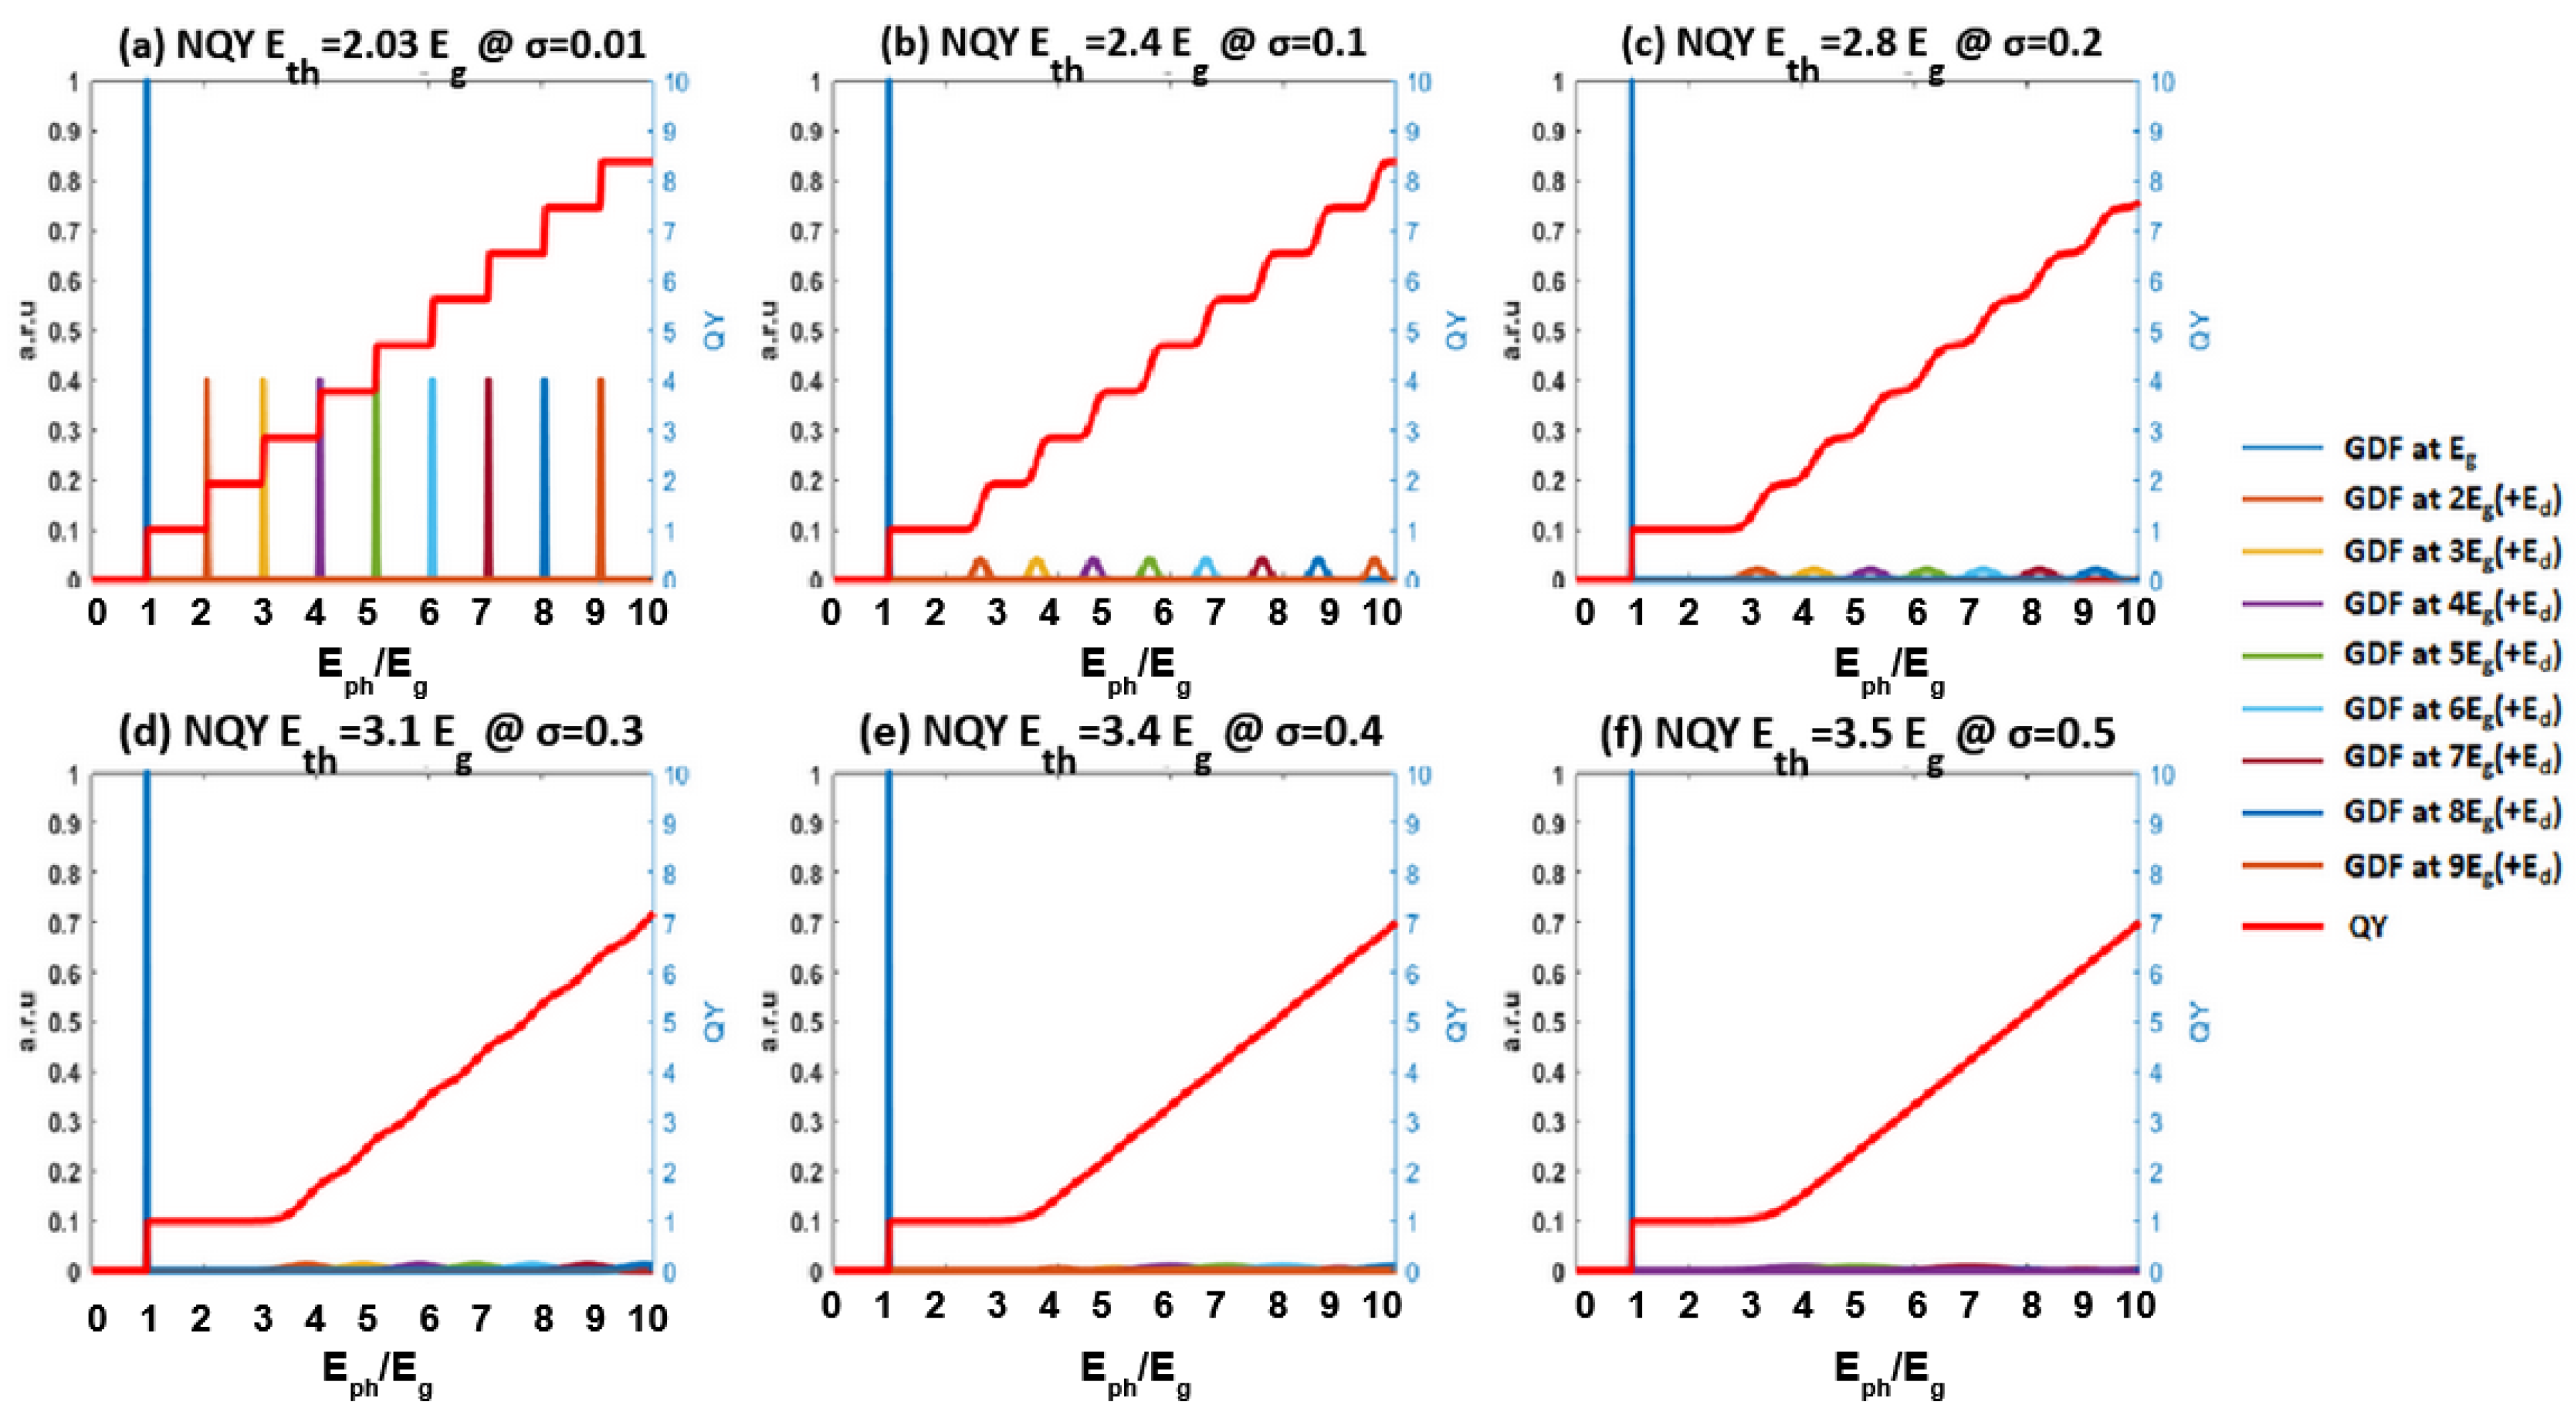
Figure 3.
QY extraction from GDF distribution with variation of σ. From (
a–
f), we normalized the value of GDF to present the probability of carrier occupancy. The increase in σ, reduced the peak intensity and extended the width of GDF, which indicates increase in the low occupancy rate of carriers at each energy state and its threshold energy [Reprinted/Adapted from Ref. [
39], 2021, Jongwon Lee, CC BY 4.0].
In addition, NQY involves the loss of carriers corresponding to each energy state owing to non-radiative recombination. To mathematically describe the NQY, we initially assumed that the generation of one EHP occurs at E
g, corresponding to the sharp peak (σ
1 = 4 × 10
−3) of the GDF. Following that, we chose σ
m = 0.1 at m∙E
g (m = 2, 3, 4∙∙∙) to account for the low occupancy of each energy state (
Figure 2a, Equation (8)). As σ
m increases, the delta function lost its characteristics because the peak widens and decreases. In this study, we set the value σ
2 = 0.1 to present non-radiative recombination such as ERE and f
C [
1,
30,
31]. In this case, the ratio “peak intensity at 2E
g/peak intensity at E
g” was approximately 0.04, which represents the high non-radiative recombination rate of MEGSCs. To calculate the delayed E
th, a point corresponding to f(E) ≥ 0 at 2E
g, on the left side of the GDF distribution (=E
d = 2E
g − x), was selected (
Figure 2b). We appended this point to m∙E
g; therefore, the peaks redistributed at m∙E
g + E
d. Thus, σ modification represents a deviation from ideality, and its peak shift shows an adjusted point for the occupancy of carriers for MEG. It represents a higher photon energy (m∙E
g + E
d) to excite the m
th exciton at m∙E
g and shifted E
th for the carrier multiplications.
Further, we reorganized the DB of the MEGSC by adjusting the reverse saturation current density (J
0) by including the non-radiative recombination ratio. In fact, f
NR represents the ratio of the radiative to non-radiative recombination rates. For this approach, we defined f
NR as the ratio of the maximum value of f
1(E
g) (for radiative recombination) to f
2′(2E
g + E
d) (for non-radiative recombination) to represent the status of radiative recombination while including the NR term, as given in Equations (11)−(16).
where ϕ denotes the particle flux given by Planck’s equation for temperature T with the chemical potential µ in the photon energy range between E
1 and E
2. In the above expressions, h denotes Planck’s constant, c indicates the speed of light, and μ denotes the CP of a single-junction solar cell (q·V) at the operating voltage V, μ
MEG denotes the CP of the MEG (q·QY(E)·V), k denotes the Boltzmann constant, J corresponds to the current density of the solar cell, q denotes the charge, C indicates the optical concentration, f
S denotes the geometry factor (1/46,200), T
S indicates the temperature of the sun (6000 K), and T
C denotes the solar cell temperature (300 K).
According to the DB limit theory [
1,
31], non-radiative and radiative generation and recombination should be conserved by controlling the non-radiative recombination ratio. The balanced equation is given by Equation (15), and its organized form is shown in Equation (16) [
1,
31].
where F
S,MEG and F
C,MEG(V) denote the generation and recombination for the radiative term, respectively, and R
MEG(0) and R
MEG(V) indicate non-radiative generation and recombination, respectively [
31].
where F
S,MEG = C∙f
S∙ϕ
MEG(E
g,∞,T
S,0) + C∙(1 − f
S)∙ϕ
MEG(E
g,∞,T
C,0), F
C0,MEG = ϕ
MEG(E
g,∞,TC,0).
Further, fNR = 1 describes the ideal condition of the MEGSC because it considers only radiative recombination. In addition, fNR is inversely proportional to J0. For instance, fNR = 0.04 means the increase in the ideal saturation current by 25 times of J0 because of the NR term and decrease in its theoretical efficiency. We discuss this in more detail in the Results section.
3. Results and Discussion
In this section, we discuss the variation in σ and the non-idealities of QY and its corresponding DB limit of MEGSC. In ideal nanostructured MEGSCs, the QY is given by the staircase function because there are no carrier losses owing to the near-ideal material quality. However, most of the measurement data showed that QY exhibits a linear increase once E
th exceeds 2E
g because of material defects (e.g., surface traps) [
16,
17,
18,
19,
20].
Figure 3 presents the results of the QY calculations based on the GDF distribution (occupancy of carriers). When σ = 4 × 10
−3 for every energy state, the QY exhibited a staircase curve analogous to the IQY (
Figure 1). However, as σ increases, the delta function started losing its characteristic shape owing to the loss of carriers in the zero-dimensional structures. In other words, the probability of the occupation of energy states by carriers decreased for every energy state. Therefore, this can be regarded as an effect of the delayed energy states. Finally, the QY plot exhibited linear shape with an increase in E
th. (
Figure 3a–f). For instance, as shown in
Figure 3, the QY shapes for σ = 0.01, 0.1, and 0.2 (
Figure 3a–c) did not accurately correspond to a step function, and E
th was below 3E
g. For σ = 0.3 (
Figure 3d), E
th equaled to 3.1E
g, and the characteristic shape of the staircase function disappeared. Typically, for σ = 0.01 (
Figure 3a), the staircase step function existed; however, its maximum value of QY was less than 9 in the IQY case. Furthermore, for σ = 0.4 and 0.5 (
Figure 3e,f), QY increased linearly, exhibiting a slope slightly less than 1, and E
th = 3.4 − 3.5E
g. This indicates that MEGSCs’ behavior changing to conventional single-junction solar cells was owed to increased E
th. Thus, the width and height of the peak of the GDF distribution for each energy state indicate the status of non-ideality, describing the characteristics of the delta function that relates to material imperfections in the nanostructures.
In other words, the IQY case entails a high possibility of carriers occupying the energy levels or maintaining a sharp peak for each energy state (m∙E
g). In addition, the material quality of the nanostructure was maintained without carrier loss. However, NQY describes the imperfections of MEGSCs owing to NR, such as those arising from the occurrence of surface traps inside nanostructures [
16,
17,
18,
19,
20]. The peak intensity exhibited by the GDF is a key parameter in determining the quality of the nanostructures. Except for the IQY case, the peaks (from 2E
g) indicated low carrier occupancies. For instance, when the highest peak at E
g corresponded to one, the second highest peak was below 0.04 (at σ = 0.1). The intensity of the highest peak at E
g was approximately 25 times higher than that of the second-highest peak at 2E
g, indicating that the carrier generation rate at m∙E
g was not sufficiently high owing to NR or material defects. This difference gives rise to a substantial reverse saturation current because of the increased non-radiative recombination rate, thereby degrading electrical parameters such as the open-circuit voltage and short-circuit current losses. Thus, the curve exhibited by QY starts losing its staircase shape; furthermore, it became linear owing to the carrier losses at each energy state. Therefore, the NR ratio increased.
To successfully demonstrate the advantages of the nanostructure in MEGSCs, the solar cell material should be nearly perfect with negligible non-radiative recombination to surpass the SQ limit. To verify the NR model in the DB, we tested the relationships between the Heaviside step and Dirac delta function in the DB limit (Equations (11)–(16)) under one sun illumination. We organized the simulation results in
Figure 4 and
Figure 5,
Table 1 and
Table 2 to compare the different cases of QYs. Without NR, the efficiency of the IQY case was nearly the same as that of the ideal MEGSC. For NQY without NR, the performance of the MEGSC approached to a conventional single-junction solar cell after E
th = 3E
g, whose calculated efficiency was same as the range of the SQ limit. However, after comparing the peak intensities by calculating f
NR, the overall efficiencies with NR were lower than the SQ limit, except for the case of σ = 0.01. For instance, the theoretical maximum efficiency at σ = 0.1 was 34.5% without NR and 30.8% with NR, where J
0 should be lower than 25 times that of J
0 to maintain the performance of the MEGSC. Optimum bandgap with NR was 1.14 eV, which is nearly same as that of Si (
Figure 4 and
Table 1). In other words, while regarding MEGSC with NR, the basic requirement for generating MEG is that E
th should be lower than 2.4 E
g with a corresponding bandgap energy of 1.14 eV. Furthermore, to compare the different slopes of NQY, we performed additional tests by doubling σ
1. In this case, except for σ = 0.01, all exhibited a negligible MEG effect, where the theoretical efficiencies were below the SQ limit. Even if the calculated efficiency of NQY without NR at E
th = 3E
g was slightly higher than the SQ limit, its recombination term in the DB limit considered only the radiative recombination limit. Therefore, for a practical MEGSC with E
th = 3E
g, the efficiency could be lower than 31.8%, which is same as the conventional single-junction solar cells.
To compare the different slopes of NQY, we performed calculations with σ
1 = 2 × 10
−3 (
Figure 5a,b,
Table 2). For this simulation, after increasing σ twice, the corresponding slope at σ = 0.5 was 0.49. This value was approximately 50% lower than that obtained for σ = 4 × 10
−3. Except for σ
1 = 0.01, the other theoretical efficiencies were lower than 30%, which did not surpass the SQ limit (
Figure 5b). In other words, even if the QY is greater than 100% after E
th = 2E
g, the MEGSC loses its performance owing to NR impact by the increased reverse saturation current densities. Only the E
th = 2.03E
g case provided the expected results of MEGSC, where E
th was nearly close to 2E
g and its QY exhibited a staircase step function, although the value was not ideal.


