Article

Fractal Characteristics of the Low-Gas Permeability Area of a Fully Mechanized Up-Dip Working Face under Different Dip Angles of Rock Strata

1
College of Safety Science and Engineering, Xi’an University of Science & Technology, Xi’an 710054, China
2
Key Laboratory of Western Mine Exploitation and Hazard Prevention Ministry of Education, Xi’an University of Science and Technology, Xi’an 710054, China
3
Xinjiang Uygur Autonomous Region Coal Science Research Institute, Urumqi 830091, China
*
Author to whom correspondence should be addressed.
Energies 2023, 16(20), 7055; https://doi.org/10.3390/en16207055
Submission received: 31 August 2023 / Revised: 5 October 2023 / Accepted: 10 October 2023 / Published: 12 October 2023
(This article belongs to the Section H: Geo-Energy)

Abstract

:
The low-gas permeability area of a fully mechanized up-dip working face was quantitatively studied using a physical similarity simulation test and theoretical analysis under varying dip angles of rock strata. Based on the theory of fractal geometry, this study obtained the fractal dimensions of the low-gas permeability area, the boundary area of the low-gas permeability region, and various layer areas of the low-gas permeability area by increasing the dip angle of rock strata. The findings reveal that the goaf’s high penetration area moved from a symmetrical shape to an asymmetrical one as the dip angle of rock strata increased. The high penetration area on the open-off cut side is notably larger than that on the working face side, due to the effects of advancement at the working face. In the goaf, the lateral length of the cavity decreases as the rock strata’s dip angle increases, while the longitudinal width expands and then contracts until it vanishes because of sliding. In the goaf, the lateral length of the cavity decreases as the rock strata’s dip angle increases, while the longitudinal width expands and then contracts until it vanishes because of sliding. In the goaf, the lateral length of the cavity decreases as the rock strata’s dip angle increases, while the longitudinal width expands and then contracts until it vanishes because of sliding. Moreover, the low-gas permeability area has a larger fractal dimension. The fractal dimension of the area with low gas permeability steadily decreased as periodic weighting emerged, ultimately reaching values of 1.24, 1.27, and 1.34. Moreover, the area’s fractal dimension was greater on the open-off cut side in comparison to the working face side. As the distance from the rock strata floor decreased, the fractal dimension of the area with low gas permeability increased. According to the gradient evolution law, the low-gas permeability area may be divided from bottom to top into three areas: strongly disturbed, moderately disturbed, and lowly disturbed. Based on the theory of mining fissure elliptic paraboloid zones and experimental findings, a mathematical model has been developed to analyze the fractal characteristics of low-gas permeability areas that are influenced by the rock strata’s dip angle. Finally, this study established a dependable theoretical foundation for precisely examining the development of cracks in the area of low gas permeability and identifying the storage and transportation region of pressure relief gas, which is affected by various dip angles of rock strata. It also offered assistance in constructing a precise gas extraction mechanism for pressure relief.

1. Introduction

Under the restrictions of mining, the original equilibrium of the overlying rock is changed. The overlying rock collapse formed the mining fissure field. Accompanied by the advancement of the working face, leading to the development of a mining fissure field.
The fracture development and structural morphology evolution patterns of the mining fissure field have a significant positive influence on the study of pressure relief gas extraction [1,2,3], surface subsidence [4,5,6,7,8], roadway support [9], and fracture seepage [10,11,12,13]. Qian et al. [14] established the O-ring theory to describe the morphological characteristics of the development of mining fissures in long wall faces. Yuan et al. [15] suggested a high-level fracture annulus model applicable for gas extraction from a low-permeability coal bed group. Li et al. [16] proposed the theory of mining fissures in an elliptical paraboloid zone.
Fractal theory is an objective nonlinear discipline that presents basic attributes, including self-similarity, to depict different types of non-regular occurrences found in the natural world. A new algorithm for multicore parallel processing has been proposed by Husain et al. [17] to calculate the fractal dimension of the Australian coastline. Fractal dimension has been utilized by Cui et al. [18] as a quantitative parameter to assess the persistence and complexity of typhoon wind speed fluctuations. Wu et al. [19] utilized the fractal dimension to investigate the evolution features of pore-fracture structures and permeability behaviors of coal under high temperatures and nitrogen atmospheres. Cui et al. [20] utilized the fractal method to analyze the micro-heterogeneity of reservoirs.
In order to obtain a reasonable quantitative description of the evolution of mining fracture, many scholars have combined fractal theory with physical simulation and numerical simulation and have achieved many results [21,22,23,24]. Based on the fractal theory, Liang et al. [25] derived the fractal percolation formula for fractured rock and obtained the evolution law of the overburden permeability coefficient in the mining area as the development of overburden fractures. Based on comparable simulation experiments and fractal theory, Gou et al. [26] analyzed the fracturing evolution law and network fractal characteristics of surrounding rock formations being shallowly buried in coal beds and perturbed by mining in karst terrain. They determined that the alteration of the fractal dimension with the degree of progression of the working face can be classified into four phases. Liu et al. [27] discovered that the fractal dimension of overburden rock mining fractal underwent a two-cycle change process as the working face progressed, and the relationship between the mining step and the fractal dimension followed a cubic curve function. Miao et al. [28] utilized the fractal dimension to investigate the growth height of the hydraulic fracture region. They identified that the mining height is the primary factor affecting the fracture zone’s height, and the emergence and cessation of the off-set fracture correspond to the fluctuation of the fractal dimension. Lu et al. [29] researched the porosity distribution in goafs of inclined extra-thick rock strata using UDEC numerical simulation software and obtained its three-dimensional spatial distribution law. By numerical simulation and physical simulation, Feng et al. [30] studied the conditions of the overburden fracture development law under large dip mining and established the relationship equation between fractal dimension and mining depth. Li et al. [31] combined physical similarity simulation tests and fractal theory to study the overburden fractures under repeated mining and found that the fractal dimension of mining cracks was positively correlated with the mining width in the upper layer, while the lower layer showed a parabolic relationship. Cao et al. [32] proposed four stages of evolution for the fractal dimension in repeatedly mined fissures: slow rise, rapid rise, stabilization, and secondary rise. The study revealed the fracture development characteristics of each stage. Xue et al. [33] and Li et al. [34] quantitatively evaluated the evolutionary characteristics of mining fractures using fractal and percolation theories. Li et al. [35] combined physical similarity simulation experiments, mathematical statistics, and fractal theory to quantitatively describe the fracture field evolution of the mining overburden and divide it into four regions. Wang et al. [36] studied the evolution of fracture extension in the mined rock with initial fractures using RFPA numerical simulation software and combined it with fractal theory to derive the evolution of fractal dimension with the number of initial fractures. Using a combination of simulation experiments, digital image processing, and fractal theory, Zhao et al. [37] investigated the evolution of mining fractures at the ultra-large mining height face and subdivided the mining overburden area into six areas according to the final development form of fractures. Wang et al. [38] used the industrial CT scanning system to scan the coal sample compression process in real time and found that the fractal dimension change pattern of the fracture is consistent with the fracture dynamic change pattern. Zhou et al. [39] used a similar material simulation test to calculate the fractal dimension of the fissure under different mining scales and found that the change in fractal dimension is consistent with the change in pressure peak, which can reflect the overburden rock transportation and pressure manifestation change rule.
This paper used a high-gas coal miner’s 302 working face in Heshun, Shanxi Province, as a test prototype to study the fractal evolution of the overburden low-gas permeability area of the fully mechanized up-dip working face under different dip angles of rock strata. Combining with the theory of mining the fissure elliptic paraboloid zone, the model of mining the overburden low-gas permeability area considering rock strata inclination was built. It provided recommendations for further research on mining fracture evolution laws and the subdivision of areas for storing and transporting pressure relief gas.

2. Two-Dimensional Simulation Experiment

2.1. Experiment Background

The main working face considered for the field-testing site has been chosen with the conditions of 1150 m altitude, 410 m average buried depth, and a 5.1 m coal seam using the long-wall fully mechanized mining method. The immediate roof and the main roof are composed of mudstone containing sand and medium sandstone. The overlying strata and the mechanical parameters of the coal seam are presented in Table 1 and Table 2.

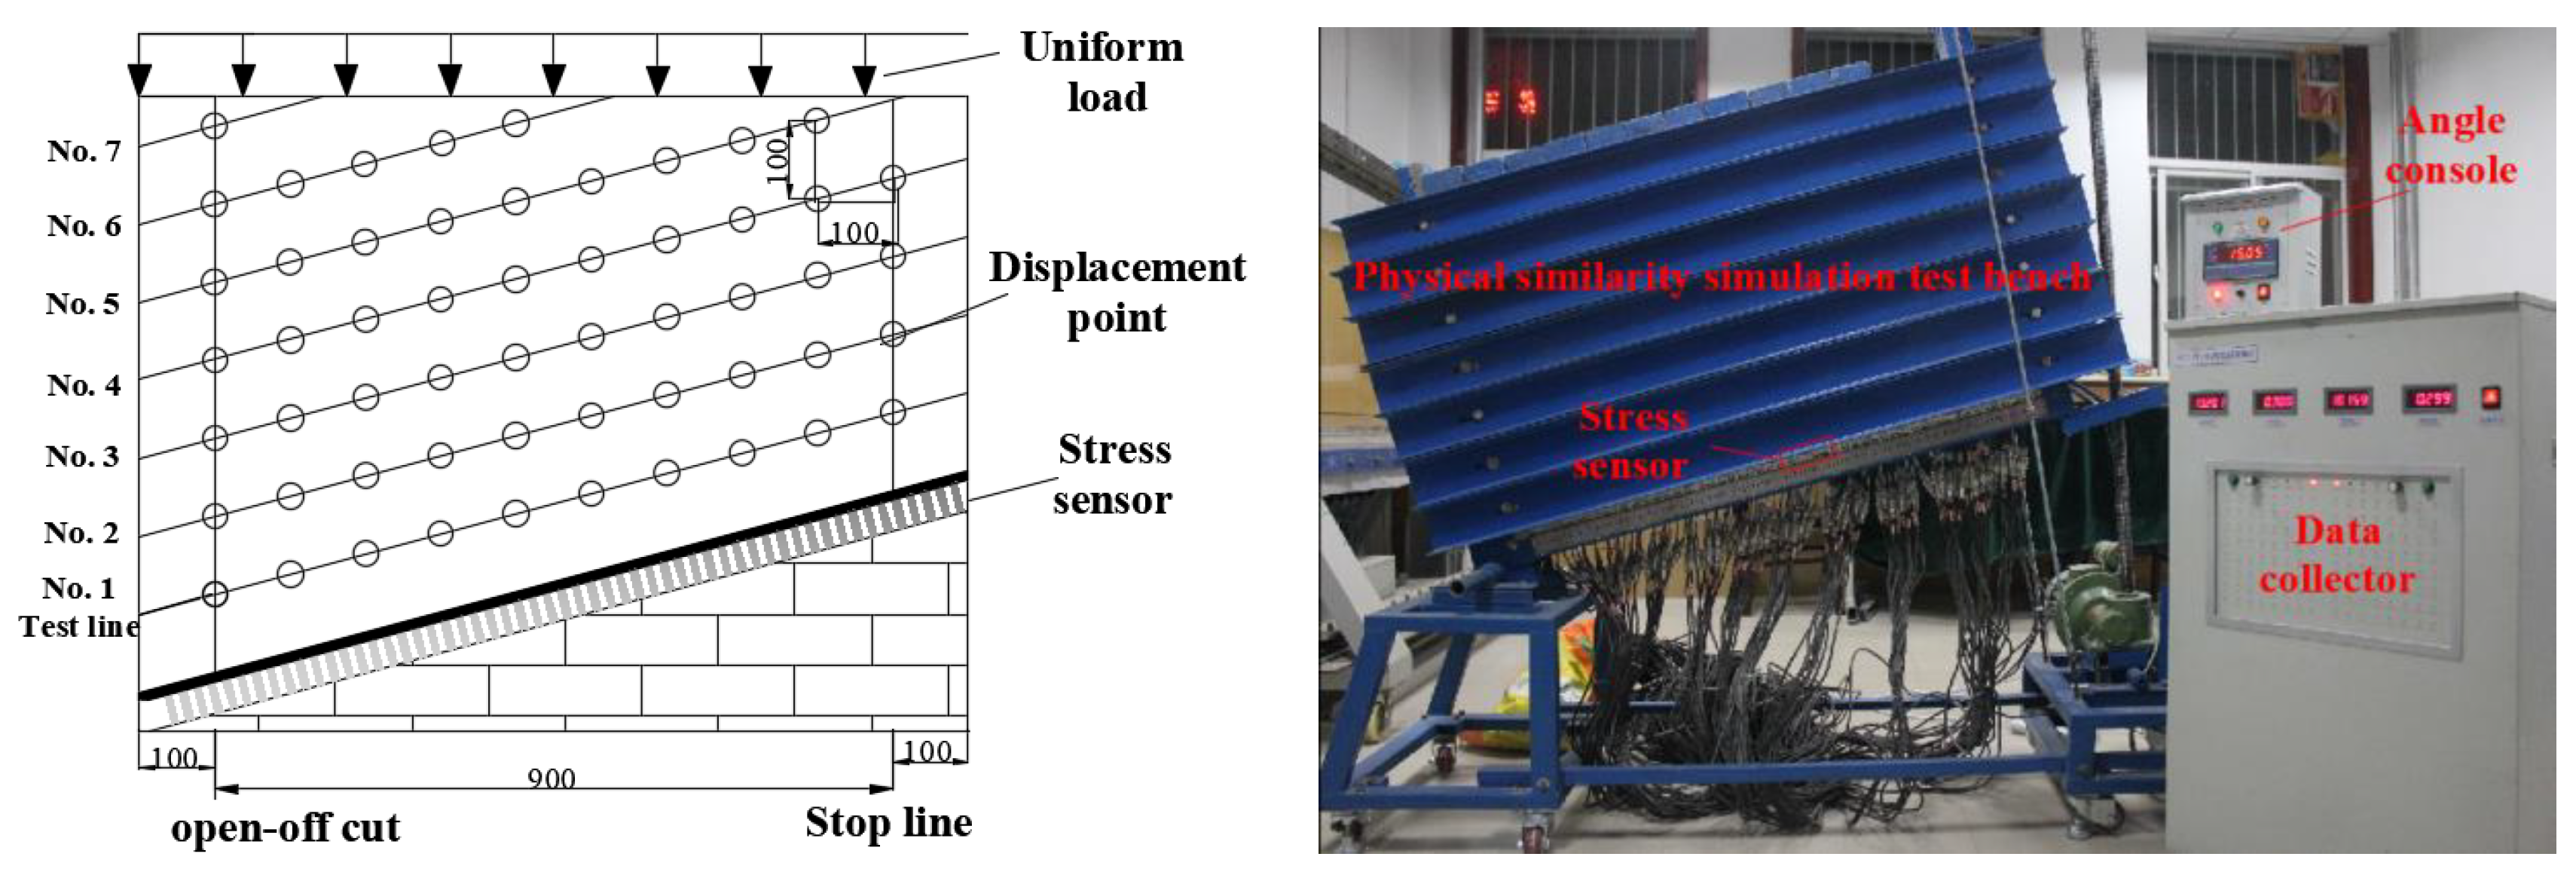
2.2. Experiment Design and Preparation

A self-angled physical similarity simulation test bench, as presented in Figure 1, has been used in the experiment to build a physical model made of similar materials with a similar ratio of 1:100. Firstly, stress sensors were evenly placed along the bottom of the test bench, and the test model was built on top of them. Secondly, the test model was set to air dry, and the corresponding displacement measuring points and the top counterweight were arranged. Finally, the test model needs to meet similar conditions of geometry, bulk density, stress, time, strength, and Poisson ratio according to the characteristics of the physical similarity simulation, as presented in Table 3.
The three test models with different inclinations were built by adjusting the angle of the test bench by 0°, 15°, and 30°. The reasons for choosing these three angles were as follows: Firstly, the adjustable angle of the test bench was 0° to 45°; Secondly, the difference between adjacent angles was guaranteed to be the same; Thirdly, the coal seams under these three angles reflected a flat coal seam, a gently inclined coal seam, and an inclined coal seam, respectively. Both sides of the model are left with 10-m-high coal pillars to reduce the boundary effect before mining. Further, the up-dip mining is considered to simulate the working face advancement in a repeated order of 2 m and 3 m along the strike of the coal seam. Finally, photographs were taken along with the measurement of each displacement point and the separation of strata after the completion of each mining activity and the stabilization of strata activities, while the stress value of the coal seam floor was obtained by the pre-embedded stress sensors.

2.3. Fractal Dimension of Overburden Fractures

Based on the above test, the low-gas permeability area in the overburden fracture field of mining was analyzed. In addition, the overburden fracture development law in the range of low-gas permeability areas under different dip angles of rock strata was studied. The photos taken by the high-speed camera after each simulated mining operation were pre-processed with the image processing software Photoshop to extract the area of the low-gas permeability area. The processed photos were imported into the fractal processing software FracLab to derive the box dimension of the low-gas permeability area. The main calculation principle of FracLab is shown in the following equation:
D = lim r 0 log N ( r ) log ( 1 / r )
where, D is the box dimension. r is the length of the side of the square grid dividing the calculation area. N means the calculation area is partitioned into N small cells with a side length of r.

3. Results and Analysis

3.1. Distribution Rule of Overburden Penetration in Goaf

Due to factors such as small turning spaces and large rock thickness and hardness, the longitudinal breaking fractures of the overlying rock layer in goaf did not completely break through the rock layer. This has led to variations in the difficulty of unloading gas transport in different areas. To be able to quantitatively describe the degree of fracture breakage in the rock layer, the penetration degree was introduced, as shown in Equation (2). According to the results of the test, the contour map of the overlying rock layer penetration in goaf was drawn as shown in Figure 2.
D i = a i h i
where, Di is the penetration of the fracture of layer rock i, hi is the thickness of the rock layer, m. ai is the length of the broken fracture, m.
As shown in Figure 2, the distribution pattern of overburden penetration in goaf under different dip angles of rock strata was obviously different. As the dip angle of the rock strata increased, the high penetration area gradually shifted from a relatively symmetrical pattern to the side of the open-off cut. For the open-off cut side, the height of the high penetration area gradually increased, while the height on the working face side gradually decreased. With the increase in the dip angle of rock strata, the angle between the direction of the working face and the direction of gravity gradually increased. When the overlying rock layer on the side of the open-off cut collapsed downward under the influence of mining, it was squeezed by the rock layer near the working face side, which increased its breaking degree. Some of the rock layers were also shaped by the rotary space, forming a reverse articulation structure. This resulted in a significantly greater degree of fracture and expansion of the collapsed overburden on the side of the open-off cut than on the side of the working face. It also squeezed the rotation space of the overburden on the working face side, further reducing the degree of overburden breakage on the working face side and causing a significant contraction in its high penetration area.

3.2. Evolution Rule of Cavity in Goaf

The cavity in the goaf refers to the strong, confined space that can store a large amount of pressure relief gas. It was formed by the collapsed overburden rock and the upper hard rock layer under the influence of coal mining activities. Its formation is marked by a direct top collapse.
As shown in Figure 3, the lateral length of the cavity in the goaf decreased overall with the increased advancement distance of the working face. The greater the dip angle of rock strata, the smaller the rate of reduction in lateral length. After the advancement distance of 40 m and the appearance of the first periodic pressure, it was observed that the dip angle of rock strata increased as the lateral length increased. This was due to the fact that, as the advancement distance increased, the articulated beam structure at the boundary of the goaf played a supporting role for the upper rock layer. The overburden fractures gradually developed upward in the form of a terrace belt, and the collapse angle gradually decreased. The gas transport advantage channels on both sides of the goaf boundary were gradually approaching each other, so the lateral length of the cavity was gradually decreasing. The larger the dip angle of rock strata, the smaller the part of the gravity force on the hard rock seam at the top of the cavity in the direction perpendicular to the roof. The lateral length required to reach the seam breakage limit increased, so the lateral length of the cavity increased with the increase in the dip angle of the rock strata.
The collapse overburden of the goaf has broken expand characteristics, so the longitudinal width of the cavity was gradually reduced with the increase in advancement distance. In addition, it was numerically smaller than the mining height. However, it was found that after the formation of the cavity, the width of the cavity would be increased to a certain extent within a short period of time. More importantly, with the increased rock strata dip angle, the range increases, even exceeding the mining height, as shown in Figure 4. Influenced by the dip angle of the rock strata, the immediate roof and the main roof slipped down along the bottom plate of the rock strata to the side of the open-off cut. They were piled up in the lower goaf, resulting in a large reduction of collapsed overburden in the central goaf and an increase in the longitudinal width of the cavity. The larger the dip angle of the rock strata is, the stronger the sliding effect is, and the larger the cavity longitudinal width increases.

3.3. Periodic Weighing Rule of the Working Face

The stress of the original surrounding rock was constantly changing during mining. The span of the immediate roof was constantly increasing. The overlying rock in the goaf had a large collapse, which formed the first weight. Subsequently, the stress on the surrounding rock was rebalanced. However, mining did not stop, and the surrounding rock stress changed again. After reaching the tensile strength limit of the immediate roof for the second time, a large area of overburden collapse occurred again in the goaf, forming the first periodic weighting. The reason for each periodic weighting was similar to the above, as shown in Figure 5. However, due to the unevenness of rock layers, special geological structure, and other reasons, the periodic weighting distance would be different for each display time.
As shown in Figure 6, taking the average periodic weighting distance of 30° as the standard, the specific value of the displayed distance of each periodic weighting under different inclinations to the standard value was obtained. Obviously, the advance distances were different when the periodic weighting was displayed at different tilt angles. The average weighting of 0° was 12.5 m, which is 1.08 and 1.20 times larger than that of 15° and 30° inclinations, respectively. Moreover, it can be observed that the low-gas permeability area is formed after the large collapse in the goaf. The low-gas permeability area was more difficult than the gas migration dominant channel in terms of gas permeation and migration capacity, as it was generally formed after one or two times of periodic weighting. Therefore, it can be concluded that the larger the dip, the shorter the advance distance required for periodic weighting, and the shorter the development cycle of the low-gas permeability area provided more sufficient times for development.

3.4. Morphological Distribution Characteristics of the Low-Gas Permeability Area

The low-gas permeability area is a local area within the fracture zone where pressure relief gas permeation and migration are significantly more difficult. The literature [23] shared the same set of physically similar simulation tests as this paper. According to the low-gas permeability area extent discrimination method in the literature, which combined the overburden separation amount, bottom plate stress distribution, and periodic pressure manifestation in the goaf, the low-gas permeability area evolution patterns under different dip angles of rock stratas were drawn as shown in Figure 7. From the analysis of the figure, it can be seen that the height of the low-gas permeability area basically coincided with the height of the fracture zone in the „three zones” of the overburden rock in the goaf. The height reached 51.1 m, 55.9 m, and 60.9 m, respectively, with the increase in the dip angle of the rock strata. Affected by the dip angle of the rock strata, the low-gas permeability area gradually shifted from the symmetrical elliptical belt form to the working face side, and its width gradually increased to 52.6 m, 60.2 m, and 65.8 m.
Combined with the analysis of Figure 2 and Figure 7, it was found that the low-gas permeability area whose bottom was located within the caving zone had a large degree of chaos from overburden collapse accumulation and a high degree of broken fracture penetration. The collapsed overburden only formed an advantageous gas migration channel belt at the boundary of both sides of the goaf, providing space for pressure relief gas to be migrated to the upward float. The caving zone in the middle of the goaf was far away from the dominant gas migration channel belt on both sides, while its upper collapse overburden and fracture penetration were poor. The pressure-relief gas was blocked from floating upward, and the migration capacity was reduced, so the area was divided into low-gas permeability areas. The low-gas permeability area located in the range through the caving zone and the fractured zone and its different locations and gas migration advantageous channel belt distance varied. The form of the low-gas permeability area was shifted and changed by the dip angle of the rock strata. Therefore, the fractal dimension software was used to quantify the fracture complexity at different locations in the low-gas permeability area so as to understand the fracture evolution pattern and gas penetration and migration capacity at different locations in the low-gas permeability area in more detail.

4. Discussion

4.1. Evolutionary Law of the Fractal Dimension of the Low-Gas Permeability Area

4.1.1. Periodic Pressure Effect of the Fractal Dimension of the Low-Gas Permeability Area

The low-gas permeability area was usually formed after 1–2 times of periodic pressure had occurred. Combined with physically similar simulation tests, the extended low-gas permeability area obtained after each period of periodic pressure was used for fractal analysis. The dynamic evolution of the dimension of the low-gas permeability area fractal with the appearance of periodic pressure was plotted as shown in Figure 8.
The fractal dimension of the low-gas permeability area decreased gradually with the increase in the number of periodic pressures. The larger the dip angle of the rock strata, the larger the fractal dimension. The low-gas permeability area had the largest fractal dimension at the early stage of formation. The fractal dimension decreased rapidly after the 3rd and 4th instances of period pressure appeared as the working face advanced and finally stabilized. This was due to the small height at the beginning of the formation of the low-gas permeability area and the larger area located within the caving zone, making the initial fractal dimension the largest. The extent of the collapse area formed by the overlying rock layer after the 3rd and 4th cycles came to pressure was significantly larger than before, resulting in the rapid expansion of the low-gas permeability area at this stage. The percentage of the low-gas permeability area within the fracture zone increased rapidly, and the fractal dimension decreased rapidly. After the 5th periodic pressure, the height of the low-gas permeability area basically overlapped with the height of the fracture zone. The low-gas permeability area stopped developing upward, and its fractal dimension decreased, slowed down, and gradually stabilized. The height of the caving zone increases with the increase in strata dip angle. When the overburden collapse was affected by the sliding effect, the degree of breakage increased. Therefore, the fractal dimension of low-gas permeability areas increased as the dip angle of rock strata increased.
The tests showed that the fractal dimension of the low-gas permeability area decreased rapidly from its initial maximum value after two periods of periodic pressure. As the overall height of the low-gas permeability area reached the height of the fracture zone, it led to the stabilization of the fractal dimension in the subsequent development. The fractal calculation of the low-gas permeability area after subsequent periodic pressure was unavailable due to the size of the physically similar simulation test platform. Therefore, curve fittings were performed according to the existing evolutionary laws, and the results were obtained as shown in Table 4. The fractal dimension can be found to be stable at 1.24, 1.27, and 1.34, respectively, with an increase in the dip angle of the rock strata. Based on this, the controlling equation for the increase in fractal dimension with the dip angle of the rock strata when the height of the low-gas permeability area no longer changed significantly was fitted, as shown in Figure 9 and Equation (3).
D d = 1.233 + 0.003 θ R 2 = 0.949
where, Dd is the fractal dimension value of the low-gas permeability area when the height of the low-gas permeability area is initially stabilized. θ is the dip angle of the rock strata, °.

4.1.2. The Fractal Dimension of the Boundaries of the Low-Gas Permeability Area

There were temporal sequences and spatial differences in the order of boundary formation on both sides of the low-gas permeability area. According to the phenomenon that the low-gas permeability area appeared to be significantly expanded after each periodic pressure, the average pressure step was chosen based on the width of the boundaries on both sides of the low-gas permeability area. The fractal calculation of the boundaries on both sides of the low-gas permeability area was carried out, and the results are shown in Figure 10.
The fractal dimension of the boundaries on both sides of the low-gas permeability area gradually decreased with the appearance of successive periods of periodic pressure. In addition, on the open-off cut side, the fractal dimension of the boundaries of the low-gas permeability area was larger than that on the working face side. This was due to the fact that, as the low-gas permeability area gradually developed to a higher level with the advancement of the working face, the proportion of the caving zone in the area where the boundary on both sides was located gradually decreased. The overall complexity of the fracture decreased, resulting in a reduction of the fractal dimension. In the initial stage of overburden collapse, the larger the dip angle of the rock strata, the more obvious the influence of the sliding effect. The overburden accumulation on the side of the open-off cut was more chaotic. It increased the expansion effect of the broken rock in the initial caving zone and reduced the slip space in the later-forming area of the caving zone. This made the fractal dimension value of the low-gas permeability area on the side of the working face smaller than that on the side of the open-off cut.

4.1.3. Gradient Evolutionary Effect of the Fractal Dimension of the Low-Gas Permeability Area

The low-gas permeability area is located in the caving zone as well as the fracture zone. In order to further clarify the fracture development law of its different seams, fractal calculations were performed every 5 m from the direction perpendicular to the rock strata floor. The fractal dimension gradient distribution law of the low-gas permeability area at different dip angles of rock strata was obtained, as shown in Figure 11.
The greater the distance from the rock strata floor, the smaller the value of the fractal dimension of the low-gas permeability area. When the overlying rock layers broke down, collapsed, and piled up above the rock strata floor, the lower free space was gradually reduced due to the expansion effect. The higher layers were supported by the collapsed rock in the lower layers. The rock gradually changed from a chaotic pile-up to a sequential arrangement in the order of the pre-breakup sequence, resulting in a gradual decrease in the fractal dimension. The stacking patterns of the rock layers in the caving zone and the fracture zone were obviously different, and the complexity of fracture development varied greatly. As a result, the fractal dimension value abruptly decreased in the transition area between them. Accordingly, the low-gas permeability area was further subdivided into a strongly disturbed area, a moderately disturbed area, and a low disturbed area. Compared with the traditional „three zones” area, it was found that the strongly disturbed area was located within the cave zone. The moderately disturbed area was mostly located in the area below the middle of the fracture zone. The low-disturbed area was located in the upper part of the fracture zone, accounting for about 45% of the fracture zone. According to the trend of the fractal dimension of the low-gas permeability area, the curve was fitted to obtain the gradient evolution law of the fractal dimension of the low-gas permeability area under different dip angles of the rock strata, as shown in Table 5.

4.2. Construction of a Fractal Dimensional Control Model for the Low-Gas Permeability Area

The physically similar simulation test model was rotated according to the angle of the respective dip angle of the rock strata, so that the floor of its rock strata was all in a horizontal state. According to the theory of mining fissure elliptic paraboloid zones, the spatial morphology evolution control equation of the low-gas permeability area influenced by the dip angle of rock strata and advancing distance was constructed, as shown in Equation (4) [3].
{ { y 1 2 { L k A 1 A 2 2 } 2 + ( x 1 L a L α i ) 2 L α i 2 = z 1 H K c H ( x 1 < L a + L α i )   y 1 2 { L k A 1 A 2 2 } 2 + ( x 1 L a L α i ) 2 L β i 2 = z 1 H K c H ( x 1 > L a + L α i ) { x = x 1 c o s θ z 1 s i n θ y = y 1 z = x 1 s i n θ + z 1 c o s θ
where x1, y1, and z1 are the coordinates of the low-gas permeability area after the model is rotated to the horizontal state. A1 and A2 are the distances between the bottom boundary of the low-gas permeability area and the intake and return airways, respectively, in m. Lk is the width of the working face, m. Kc is the broken expansion coefficient of the rock layer within the low-gas permeability area. La is the distance from the bottom boundary of the low-gas permeability area to the open-off cut, m. H is the height of the low-gas permeability area, m. L α i is the width of the open-off cut side of the low-gas permeability area formed at the time of i, m. L β i is the width of the working face side of the low-gas permeability area formed at the time of i, m. θ is the dip angle of the rock strata.
Among the „three zones” of the overburden, the heights of the caving zone and the fracture zone can be expressed by the empirical Equations (5) and (6).
Height   of   caving   zone :   H m = 100 M 0.49 M + 19.12 ± 4.71
Height   of   the   fracture   zone :   H lie = 100 M 0.26 M + 6.88 ± 11.49
Combined with Equations (3)–(6), Table 5, and the position correspondence between the low disturbed area, moderately disturbed area, and strongly disturbed area in the low-gas permeability area and the overburden “three zones”, the fractal dimension control model of the low-gas permeability area affected by the dip angle of the rock strata can be established, as shown in Equations (7)–(10).
D a = 0 100 M 0.49 M + 19.12 ± 4.71 [ A 1 1 + e ( h A 2 ) / A 3 + A 4 ] d h 100 M 0.49 M + 19.12 ± 4.71
D b = 100 M 0.49 M + 19.12 ± 4.71 ( 100 M 0.26 M + 6.88 ± 11.49 ) · 55 % [ A 5 1 + e ( h A 6 ) / A 7 + A 8 ] d h ( 100 M 0.26 M + 6.88 ± 11.49 ) · 55 %
D c = ( 100 M 0.26 M + 6.88 ± 11.49 ) · 55 % 100 M 0.26 M + 6.88 ± 11.49 [ A 9 1 + e ( h A 10 ) / A 11 + A 12 ] d h ( 100 M 0.26 M + 6.88 ± 11.49 ) · 45 %
D d = 1.233 + 0.003 θ
where Da, Db, and Dc are the fractal dimension values of the low disturbed area, moderately disturbed area, and strongly disturbed area in the low-gas permeability area, respectively. h is the distance of the low-gas permeability area from the rock strata floor, m. Ai (i = 1, 2, … 12) is the constant measured by the specific simulation test. Dd is the fractal dimension value of the low-gas permeability area when the height of the low-gas permeability area is initially stabilized. θ is the dip angle of the rock strata, °. M is the mining height, m.

5. Field Testing

Field testing was conducted to verify the experimental findings.

5.1. The Parameters of High-Level Boreholes

The parameters of the 5# and 6# drilling fields in Hesun Tianchi Coal Mine are adjusted based on the fractal dimension control model of the low-gas permeability area, as shown in Equations (7)–(10). It was noticed that each drilling field has 10 drill holes, which are evenly arranged in two rows. Firstly, the first holes in the upper and lower rows are located 0.8 m and 0.4 m away from the edge of the drilling field, respectively. The spacing between each of the two rows was 0.8 m, as presented in Figure 12. Secondly, the arrangement parameters of the two rows of boreholes are described in Table 6 and Figure 12. Finally, the two drilling fields are separated by 65 m, with an overlap of 35 m.

5.2. Analysis of the Effect of High-Level Drilling Field

The analysis of the effect of a high-level drilling field on reducing gas concentration was performed based on the 5# drilling field. Firstly, gas extraction work started when the working face advanced to the effective extraction range of the 5# drilling field. Secondly, the 6# drilling field also began to extract gas after 10 days. The compositions of the gas extracted from the high-level boreholes and return airway were monitored, and the result indicated that the ratios of the amount of gas discharged from the ventilation and the amount of gas extracted from the high-level boreholes to the absolute outflow of gas can be obtained, as presented in Figure 10. As shown in Figure 13, the gas extraction from the high-level borehole accounts for 71.2–85.5% of the absolute outflow of gas, with an average of 80.5%, whereas the gas discharged by the ventilation is observed between 14.5% and 28.8%.
In addition, the amount of gas extracted from the high-level boreholes increases as the amount of gas discharged from the ventilation decreases, as presented in Figure 13. It can be concluded that the high-level drilling field plays a vital role in reducing the gas concentration of the mine, and the low-gas permeability area also constantly evolves towards the working face with the advancement of the working face. Furthermore, the area where the 5# drilling field is extracted is gradually changed from the fractured zone to the low-gas permeability area, which increases the complications of gas migration. Hence, it can be concluded that the proportion of gas extracted from the high-level boreholes was significantly improved when both the 5 and 6 drilling fields were in operation.

5.3. The Practical Effect of Gas Extraction in the High-Level Drilling Field

The practical effect of gas extraction in the high-level drilling field has been analyzed. Under the influence of the high-level drilling field, the gas volume fractions of the two areas can be obtained based on the real-time monitoring of gas contents in the upper corner and return airway, as presented in Figure 14. It was noticed from the results that the gas volume fractions of the two areas are 0.35% and 0.36%. Hence, the safety of the working face was effectively ensured, provided that the observation was less than the upper limit of 1% of the gas volume fraction.

6. Conclusions

Theoretical analyses were conducted in this study to investigate fractures in low-gas-permeability areas under varying rock strata dip angles. A mathematical model was developed to describe the fractal dimension of fractures. The paper concludes with the following findings:
(1)
Under the mining condition where the slope is upward, as the rock strata’s dip angle increases, the area of the overburden rock with high penetration in the goaf shifts gradually from a symmetrical form to an asymmetrical one on the side of the open-off cut. The overall trend towards a decrease in the lateral length of the cavity in the goaf area persists. The slumping effect affects the longitudinal width. There is a reverse growth evidenced in the early stage of mining that surpasses the height of mining before declining to the point of disappearance.
(2)
As the dip angle of the rock strata increases (0° < 15° < 30°), so does the fractal dimension of the low-gas permeability area. Periodic pressure causes the fractal dimension to gradually decrease until it stabilizes at 1.24, 1.27, and 1.34. Additionally, the fractal dimension of the low-gas permeability area is smaller on the working face side than on the side of the open-off cut. The gradient evolution rule suggests that the area of low gas permeability can be further classified into three zones: the strongly disturbed, the moderately disturbed, and the low disturbed areas.
(3)
A fractal dimension control equation for the low-gas permeability area affected by the dip angle of rock strata has been established using the theory of fracture elliptical paraboloid zone mining. This equation provides a framework for analyzing the development of overburden fractures in low-gas permeability areas and for establishing an accurate pressure relief gas extraction system.

Author Contributions

Formal analysis, L.L. and P.Z.; Resources, P.Z. and H.L.; Data curation, Y.J.; Writing—original draft, S.L.; Writing—review & editing, L.L. and H.L.; Project administration, Y.J. All authors have read and agreed to the published version of the manuscript.

Funding

This research was funded by National Natural Science Foundation grants from China (5207-4217, 5197-4237, and 5217-4205).

Data Availability Statement

Data not currently available due to confidentiality requirements.

Conflicts of Interest

The authors declare no conflict of interest.

References

  1. Zhao, P.X.; Kang, X.P.; Li, S.G.; Lin, H.F.; Gan, L.J.; An, X.B. Optimization of “hole-drift” collaborative drainage layout parameters and high efficient drainage in pressure relief gas migration area. Coal Sci. Technol. 2022, 50, 137–146. [Google Scholar]
  2. Ding, Y.; Zhu, B.; Li, S.G.; Lin, H.F.; Wei, Z.Y.; Li, L.M.; Long, H.; Yi, Y. Accurate identification and efficient drainage of relieved methane in goaf of high outburst mine. Coal Sci. Technol. 2021, 46, 3565–3577. [Google Scholar]
  3. Zhao, P.X.; Liu, L.D.; Li, S.G.; Xu, P.Y.; Li, G.; Wei, Z.Y.; Jia, Y.Y. Dip angle effect of evolution coal seam in overburden low-gas permeability area of fully mechanized mining face. Coal Sci. Technol. 2021, 49, 65–72. [Google Scholar]
  4. Kashnikov, Y.A.; Musikhin, V.V.; Lyskov, I.A. Radar interferometry-based determination of ground surface subsidence under mineral mining. J. Min. Sci. 2012, 48, 649–655. [Google Scholar] [CrossRef]
  5. Sahu, P.; Lokhande, R.D.; Pradhan, M.; Jade, R. The influence of geotechnical parameters on sinkhole subsidence and its model development for underground coal mines in central India. J. Min. Sci. 2021, 57, 220–228. [Google Scholar] [CrossRef]
  6. Zhang, J.X.; Shi, X.C. Failure of overburden rock under large mining height in shallow buried goaf area. Chin. J. Geol. Hazard Control. 2019, 30, 92–97. [Google Scholar]
  7. Cheng, J.G. Numerical simulation research on “Three Zones” distribution rule in overlying strata of fully mechanized working face in upper protective seam with god-side entry retaining. Min. Saf. Environ. Prot. 2015, 42, 31–34+56. [Google Scholar]
  8. Li, X.; Jiao, Y.Y.; Zhou, J.P.; Zhang, X.F.; Wang, C. Study on overlying strata movement and ground subsidence in deep coal mining. Saf. Environ. Eng. 2022, 29, 32–38+56. [Google Scholar]
  9. Guo, D.; Wang, N.; Fan, L.; Lu, Z.; Li, K. Study on new type of roadway side support technology in coal mines. J. Min. Sci. 2020, 56, 603–615. [Google Scholar] [CrossRef]
  10. Khurshid, I.; Fujii, Y. Geomechanical analysis of formation deformation and permeability enhancement due to low-temperature CO2 injection in subsurface oil reservoirs. J. Pet. Explor. Prod. Technol. 2021, 11, 1–9. [Google Scholar] [CrossRef]
  11. Khurshid, I.; Afgan, I. Geochemical investigation of CO2 injection in oil and gas reservoirs of middle east to estimate the formation damage and related oil recovery. Energies 2021, 14, 7676. [Google Scholar] [CrossRef]
  12. Khurshid, I.; Afgan, I. Investigation of water composition on formation damage and related energy recovery from geothermal reservoirs: Geochemical and geomechanics insights. Energies 2021, 14, 7415. [Google Scholar] [CrossRef]
  13. Wang, D.K.; Wei, Q.; Wei, J.P.; Bai, X.; Yu, C.; Zhang, P. Fractal characteristics of fracture structure and fractal seepage model of coal. J. China Univ. Min. Technol. 2020, 49, 103–109+122. [Google Scholar]
  14. Qian, M.G.; Xu, J.L. Study on the “O-shape” circle distribution characteristics of mining-induced fractures in the overlaying strata. J. China Coal Soc. 1998, 23, 466–469. [Google Scholar]
  15. Yuan, L.; Guo, H.; Shen, B.T.; Qu, Q.D.; Xue, J.H. Circular overlying zone at longwall panel for efficient methane capture of mutiple coal seams with low permeability. J. China Coal Soc. 2011, 36, 357–365. [Google Scholar]
  16. Li, S.G.; Lin, H.F.; Zhao, P.X.; Xiao, P.; Pan, H.Y. Dynamic evolution of mining fissure elliptic paraboloid zone and extraction coal and gas. J. China Coal Soc. 2014, 39, 1455–1462. [Google Scholar]
  17. Husain, A.; Reddy, J.; Bisht, D.; Sajid, M. Fractal dimension of coastline of Australia. Sci. Rep. 2021, 11, 6304. [Google Scholar] [CrossRef] [PubMed]
  18. Cui, B.; Huang, P.; Xie, W. Fractal dimension characteristics of wind speed time series under typhoon climate. J. Wind. Eng. Ind. Aerodyn. 2022, 229, 105144. [Google Scholar] [CrossRef]
  19. Wu, M.; Li, H.; Wang, L.; Yang, X.; Dai, C.; Yang, N.; Li, J.; Wang, Y.; Yu, M. μCT quantitative assessment of the pore–fracture structures and permeability behaviors of long-flame coal treated by infrared rapid heating. Energy 2023, 274, 127308. [Google Scholar] [CrossRef]
  20. Cui, H.; Zhu, S.; Wang, J.; Gao, Y.; Wan, C.; Tong, H. Physical Properties, Pore-Throat Structure, Fractal Characteristics and Their Effects on the Gas-Bearing Capacity of Tight Sandstone: A Case Study from the Northern Tianhuan Depression, Ordos Basin, China. Nat. Resour. Res. 2022, 31, 1559–1584. [Google Scholar] [CrossRef]
  21. Xie, H.P.; Yu, G.M.; Yang, L.; Zhang, Y.Z. Fractal fracture network of mining-induced rock mass. Chin. J. Rock Mech. Eng. 1999, 2, 29–33. [Google Scholar]
  22. Yu, G.M.; Xie, H.P.; Zhou, H.W.; Zhang, Y.Z.; Yang, L. Experimental study on distribution law and fractal property of mining-induced fracture in structured rock mass. J. Exp. Mech. 1998, 13, 145–153. [Google Scholar]
  23. Zhao, P.X.; Zhuo, R.S.; Li, S.G.; Lin, H.F.; Shu, C.M.; Lai, W.B.; Jia, Y.Y.; Suo, L. Fractal characteristics of gas migration channels at different mining heights. Fuel 2020, 271, 117479. [Google Scholar] [CrossRef]
  24. Miao, T.J.; Yang, S.S.; Long, Z.C.; Yu, B.M. Fractal analysis of permeability of dual-porosity media embedded with random fractures. Int. J. Heat Mass Transf. 2015, 88, 814–821. [Google Scholar] [CrossRef]
  25. Liang, T.; Liu, X.L.; Wang, S.J. Fractal study on the crack network evolution and permeability change in mining rock mass. J. China Coal Soc. 2019, 44, 3729–3739. [Google Scholar]
  26. Gou, R.T.; Jiang, C.Y.; Liu, Y.; Wang, C.; Li, Y.L. Study on fractal characteristics of evolution of mining-induced fissures in karst landform. Energies 2022, 15, 5372. [Google Scholar] [CrossRef]
  27. Liu, C.; Xue, J.H.; Yu, G.F.; Cheng, X.Y. Fractal characterization for the mining crack evolution process of overlying strata based on microseismic monitoring technology. Int. J. Min. Sci. Technol. 2016, 2, 295–299. [Google Scholar] [CrossRef]
  28. Miao, K.J.; Tu, S.H.; Tu, H.S.; Liu, X.; Li, W.L.; Zhao, H.B.; Tang, L.; Ma, J.Y.; Li, Y. Research on Fractal Evolution Characteristics and Safe Mining Technology of Overburden Fissures under Gully Water Body. Fractal Fract. 2022, 6, 486. [Google Scholar] [CrossRef]
  29. Lu, F.C.; Zhang, X.B. Research on porosity distribution laws of goaf in inclined extra-thick coal seam. J. Saf. Sci. Technol. 2020, 16, 119–124. [Google Scholar]
  30. Feng, J.Y.; Liu, X.H.; Yu, Z.Q. Numerical simulation study on the mining-induced fracture evolution of steep coal seam. J. China Coal Soc. 2017, 42, 1971–1978. [Google Scholar]
  31. Li, S.G.; Qin, W.B.; Li, Z.L.; Ding, Y.; Lin, H.F. Research on fractal characterization of mined crack network evolution repeated coal mining. J. Liaoning Tech. Univ. 2016, 35, 1384–1389. [Google Scholar]
  32. Cao, J.; Shi, S.T. Evolution law of mining-induced fractures in shallow buried close coal seams mining. Geotech. Geol. Eng. 2023, 4, 2665–2676. [Google Scholar] [CrossRef]
  33. Xue, D.J.; Zhou, H.W.; Ren, W.G.; Zhang, B.F.; Liu, Y.Q.; Zhao, Y.F. Stepped shearing-induced failure mechanism and cracks propagation of overlying thin bedrocks in shallow deep coal seams mining. J. China Coal Soc. 2015, 40, 1746–1752. [Google Scholar]
  34. Li, D.P.; Zhou, H.W.; Xue, D.J.; Yi, H.Y.; Gao, H.L. Relationship between percolation and fractal properties of mining-induced crack network in coal and rock masses. Rock Soil Mech. 2015, 36, 1135–1140. [Google Scholar]
  35. Li, H.Y.; Wang, W.H.; Qi, Q.X.; Zhang, L. Study on fissure development rule of overlying strata influenced by mining based on fractal theory. J. China Coal Soc. 2014, 39, 1023–1030. [Google Scholar]
  36. Wang, G.Y.; Yu, G.M.; Yu, Y.J.; Lu, S.B.; Kang, Y. Study on Cracks Fractal Evolution Laws of Mining Rock Mass. J. Min. Saf. Eng. 2012, 29, 859–863. [Google Scholar]
  37. Zhao, Y.X.; Ling, C.W.; Liu, B.; He, X. Fracture evolution and energy dissipation of overlying strata in shallow-buried underground mining with ultra-high working face. J. Min. Saf. Eng. 2021, 38, 9–18+30. [Google Scholar]
  38. Wang, D.K.; Zeng, F.C.; Wang, J.G.; Wei, J.P.; Jiang, Z.G.; Wang, X.B.; Zhang, P.; Yu, C. Dynamic evolution characteristics and fractal law of loaded coal fractures by micro industrial CT. Chin. J. Rock Mech. Eng. 2020, 39, 1165–1174. [Google Scholar]
  39. Zou, E.L.; Li, Z.H.; Ma, J.; He, X.; Geng, Q. Study on the quantitative analysis of dynamic evolution of mining fracture and its application. Min. Res. Dev. 2023, 7, 101–107. [Google Scholar]
Figure 1. Physically similar simulation test model design and test bench.
Energies 16 07055 g001
Figure 2. Contour map of overlying rock layer in goaf under different dip angles of rock strata. (a) Contour map of overburden penetration in 0° goaf; (b) Contour map of overburden penetration in 15° goaf; (c) Contour map of overburden penetration in 30° goaf.
Energies 16 07055 g002
Figure 3. Evolution law of lateral length of goaf cavity under different dip angles of rock strata.
Energies 16 07055 g003
Figure 4. Evolution law of longitudinal width of goaf cavity under different dip angles of rock strata.
Energies 16 07055 g004
Figure 5. Displacement of overlying strata in goaf. (a) The stress in the surrounding rock begin to concentrate; (b) Massive collapse of overlying rock; (c) Rebalancing of stress in the surrounding rock.
Energies 16 07055 g005aEnergies 16 07055 g005b
Figure 6. The periodic weighting distance.
Energies 16 07055 g006
Figure 7. The evolution pattern of low-gas permeability area with different dip angles of coal seam. (a) The evolution pattern of the 0° low-gas permeability area; (b) The evolution pattern of the 15° low-gas permeability area; (c) The evolution pattern of the 30° low-gas permeability area.
Energies 16 07055 g007
Figure 8. Evolution law of fractal dimension of low-gas permeability area under different dip angles of rock strata.
Energies 16 07055 g008
Figure 9. Fractal dimension of compacted area at different dip angle of the rock strata.
Energies 16 07055 g009
Figure 10. Evolution law of fractal dimension of the low-gas permeability area’s boundaries.
Energies 16 07055 g010
Figure 11. Evolution law of fractal dimension of the low-gas permeability area’s different layers.
Energies 16 07055 g011
Figure 12. Layout of the borehole in the high-level drilling field. (a) The top view of high-level boreholes; (b) The side view of high-level boreholes; (c) The front view of high-level boreholes.
Energies 16 07055 g012
Figure 13. Extraction effect of high-level drilling field.
Energies 16 07055 g013
Figure 14. Gas concentrations at the upper corner and return airway.
Energies 16 07055 g014
Table 1. Stimulation height of overlying strata.
Order NumberLithologyBulk Density/kN·m−3Elastic Modulus/GPaCompressive Strength/MPaPoisson Ratio
1mudstone20.82020.50.195
2sandy mudstone26.45648.80.278
3medium sandstone26.65065.10.28
4fine sandstone26.24369.00.26
5siltstone26.05458.50.253
6limestone26.54791.20.23
7AL mudstone13.04016.00.25
8coal14.61413.50.275
Table 2. Physical parameters of coal and rock layers.
Order NumberLithologyThickness/mOrder NumberLithologyThickness/m
1sandy mudstone2.41613# coal0.5
2AL mudstone0.217K3 limestone3.0
315# coal5.118sandy mudstone1.0
4mudstone0.519fine sandstone0.8
5medium sandstone7.120AL mudstone0.5
6siltstone3.021fine sandstone2.2
7sandy mudstone3.722sandy mudstone4.5
810# coal0.82312# coal1.0
9siltstone1.024sandy mudstone3.4
10mudstone1.725siltstone0.9
1114# coal0.82611# coal0.3
12K2 limestone5.527K4 limestone4.65
13siltstone2.828sandy mudstone7.75
14fine sandstone6.129fine sandstone4.0
15sandy mudstone2.030sandy mudstone2.7
Table 3. Similarity constant ratio of the model.
Geometry RatioBulk Density RatioStress RatioTime RatioStrength RatioPoisson Ratio
1:1001:1.51:1501:101:1501:1
Table 4. Periodic pressure effect of fractal dimension of low-gas permeability area.
The Dip Angle of the Rock StrataMathematical Expressions for Curve FittingR2
D t = 0.2 1 + e ( t 3.615 ) / 0.15 + 1.24 0.878
15° D t = 0.23 1 + e ( t 3.273 ) / 0.15 + 1.27 0.853
30° D t = 0.2 1 + e ( t 3.018 ) / 0.045 + 1.34 0.960
Where Dt is the fractal dimension of the low-gas permeability area after t times of periodic pressure; t is the times of periodic pressure.
Table 5. Gradient evolutionary effect of fractal dimension of low-gas permeability area.
The Dip Angle of the Rock StrataMathematical Expressions for Curve FittingR2
D h = 0 . 720 1 + e ( h 27.420 ) / 10.528 + 0 . 907 0.928
15° D h = 0.634 1 + e ( h 29.220 ) / 8.458 + 0.970 0.961
30° D h = 0.593 1 + e ( h 33.511 ) / 6.690 + 1.006 0.933
Where Dh is the fractal dimension of the low-gas permeability area in a certain height range, h is the height of the low-gas permeability area to the rock floor, m.
Table 6. Parameters of high-level boreholes.
No.Distance to the Floor (m)Depth (m)Angle with the Centerline of the RoadwayFinal Position (m)Diameter (m)
1-1#1.0100.04left to 3.5°30.133
1-2#1.0100.07left to 1.8°60.133
1-3#1.0100.1190.133
1-4#1.0100.15right to 1.7°120.133
1-5#1.0100.20right to 3.5°150.133
2-1#1.5100.09left to 2.4°60.133
2-2#1.5100.13left to 0.6°90.133
2-3#1.5100.18right to 1.1°120.133
2-4#1.5100.25right to 2.9°150.133
2-5#1.5100.31right to 4.6°180.133
Disclaimer/Publisher’s Note: The statements, opinions and data contained in all publications are solely those of the individual author(s) and contributor(s) and not of MDPI and/or the editor(s). MDPI and/or the editor(s) disclaim responsibility for any injury to people or property resulting from any ideas, methods, instructions or products referred to in the content.

