Abstract
The HVAC (Heating, Ventilation, and Air Conditioning) system is an important component of a building’s energy consumption, and its primary function is to provide a comfortable thermal environment for occupants. Accurate prediction of occupant thermal comfort is essential for improving building energy utilization as well as health and work efficiency. Therefore, the development of accurate thermal comfort prediction models is of great value. Deep learning based on data-driven techniques has excellent potential for predicting thermal comfort due to the development of artificial intelligence. However, the inability to obtain large quantities of detailed thermal comfort labeling data from residents presents a substantial challenge to the modeling endeavor. This paper proposes a building-to-building transfer learning framework to make deep learning models applicable in data-limited interior building environments, thereby resolving the issue and enhancing model predictive performance. The transfer learning method (TL) is applied to a novel technology dubbed the Transformer model, which has demonstrated outstanding performance in data trend prediction. The model exploits the spatiotemporal relationship of data regarding thermal comfort. Experiments are conducted using the source dataset (Scales project dataset and ASHRAE RP-884 dataset) and the target dataset (Medium US office dataset), and the results show that the proposed TL-Transformer achieves 62.6% accuracy, 57% precision, and a 59% F1 score, and the prediction performance is better than other existing methods. The model is useful for predicting indoor thermal comfort in buildings with limited data, and its validity is verified by experimental results.
1. Introduction
Buildings account for roughly 40% of the globe’s energy consumption and 30% of its greenhouse gas emissions [1]. In the built environment, heating, ventilation, and air conditioning (HVAC) systems are crucial in producing comfortable and healthy living conditions [2], even in environments without HVAC systems, and the choice of heating system is particularly important for energy and thermal comfort [3]. They are a significant contributor to building energy consumption. Despite their high energy consumption, HVAC systems frequently fail to provide residents with ideal thermal comfort [4]. In various building areas, occupants may experience vastly different localized temperatures due to differences in personal preferences and environments. Even under identical thermal conditions, occupants’ thermal preferences can vary. There is a significant divergence between energy consumption and occupant satisfaction. Not only that, but thermal storage systems in buildings can have a significant impact on thermal comfort and energy consumption [5]. For example, utilizing latent heat storage in phase change materials (PCMs) can provide thermal comfort and achieve sufficient energy savings even in the absence of an HVAC system [6]. Indeed, inefficient HVAC control systems are now in place to regulate environmental comfort [7]. However, the implementation of such tactics necessitates a substantial energy expenditure.
Thermal comfort prediction modeling for HVAC control fills the comfort and energy efficiency gap. In actuality, thermal comfort prediction modeling uses occupant comfort as a criterion for the energy output saved by controlling HVAC equipment [8]. In addition, accurate comfort prediction increases residents’ productivity and health indices. Extensive experiments have been performed to predict the thermal comfort of building occupants, with Fanger et al.’s Predicted Mean Vote (PMV) model being one of the most prominent [9]. The PMV model is devised based on the theory of human heat balance and a large corpus of experimental data, incorporating six variables to calculate the state of human heat balance (see Figure 1).
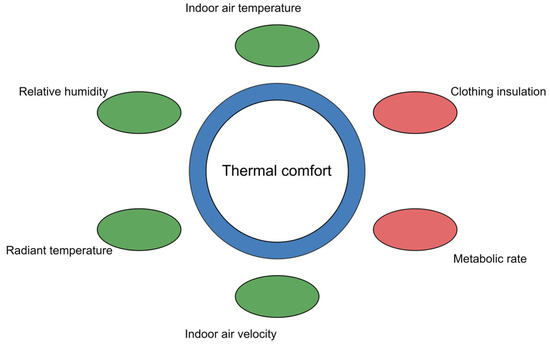
Figure 1.
Factors influencing the PMV model.
However, there are disparities between the predicted mean vote and the actual thermal comfort of occupants [10]. This disparity may be attributable to the lack of diversity of factors considered by PMV models, including time variables (e.g., hours, days, and seasons) [11,12], individual variables (e.g., heart rate, age, and gender) [13], environmental variables (light and outdoor climate) [14], and psychological factors (e.g., being in a bad mood and in good condition) [15], which may influence thermal comfort. Consequently, additional parameters are necessary to enhance the efficacy of thermal comfort prediction.
The development of wireless and sensor technologies has made data collection for deep learning models more practical and inexpensive [16]. Deep learning models are trained on collected datasets, and the acquired knowledge can be applied to previously unseen datasets. However, the efficacy and generalization ability of the models are also affected by factors such as the data’s quality and quantitative diversity [17]. For deep learning models to be effectively trained and optimized, sufficient high-quality training data and appropriate model selection and calibration are required [18].
In recent decades, thermal comfort prediction has been a prominent research topic. Numerous researchers have discussed it using conventional techniques and models based on deep learning [18]. Methods such as support vector machines (SVM), k-nearest neighbors (KNN), and random forests (RF) are frequently utilized in conventional techniques. Due to their reliance on linear functions to manage the relationship between historical and predicted data, these methods are quick and straightforward to implement. Compared to Fanger’s PMV model, the accuracy of these methodologies is 5 to 8 % higher [19]. However, these models’ predictive results are only occasionally adequate. As a result of the development of deep learning, deep learning models now rely on vast amounts of historical data to make predictions, resulting in improved solutions.
The Transformer model is widely applicable and is regarded as one of the most promising models recently proposed. Wen et al. [20] explored the performance of Transformer in time series forecasting tasks. They discovered that the Transformer, which relies on large amounts of training data, can handle long-range dependencies and is readily extensible to other tasks.
In this study, a model called Transfer Learning Transformer (TL-Transformer) is proposed that captures temporal and spatial correlations in the data and uses transfer learning to train the model on the source dataset to improve the performance of thermal comfort prediction on the target dataset when the target dataset is limited. The ASHRAE RP-884 and Scales Project datasets were selected as source datasets, while the Medium US Office dataset [18] was chosen as the target dataset. The advantages of the proposed method are the low cost of prediction (low-cost data) and easy scalability to built environments with limited data sets. Numerous tests on each of these publicly available datasets demonstrate that the proposed thermal comfort model outperforms well-known knowledge-based and data-driven models. The following are some contributions to this study:
- This is the first time a Transfer Learning-based Transformer (TL-Transformer) model has been used to accurately predict the thermal comfort of a building in the presence of limited modeling data from diverse climate zones.
- The TL-Transformer model employs a particular data succession strategy to capture the temporal and spatial relationships within the input data, thereby facilitating effective modeling.
- We investigate the effect of different feature sets on thermal comfort modeling. The most accurate predictive performance for the transfer learning-based thermal comfort model was achieved by combining personal factors, outdoor environmental factors, and the six PMV model factors.
- The experiments demonstrate that the proposed TL-Transformer model for predicting thermal comfort surpasses the knowledge-driven and data-driven models and can be applied to buildings with less labeled thermal comfort data.
2. Related Work
In this portion, we enumerate the relevant prior literature on traditional thermal comfort modeling approaches, transfer learning applications, and Transformer model applications that demonstrate the value of this study.
2.1. Traditional Thermal Comfort Modeling Methods
The PMV model proposed by Fanger and his team and the adaptive model developed by de Dear et al. [21] are among the most well-known models in thermal comfort research. Under the adaptive model, occupants can modify temperatures based on the time of day, and they can adjust their comfort by reducing their physical activity and changing their clothing. Ana et al. [22] investigated the impact of intelligent monitoring technologies on an individual’s thermal comfort, noting that with the continued development of camera technology, wearable devices, and connected sensor systems, it has become easier and less costly to collect data on the indoor environment and to monitor the physiological condition of the occupants. This trend promises to create more environmentally friendly and livable built environments.
In recent years, investigators have utilized data-driven machine learning to model thermal comfort. Researchers like Fard et al. [23] thoroughly investigated machine learning (ML) in the field of thermal comfort research. Their findings suggest that machine learning models outperform PMV and adaptive models in performance. Additionally, using control models based on machine learning can cut the energy used for thermal comfort in buildings by up to 58.5%. Xiong et al. [24] created a personalized thermal comfort model based on K-Nearest Neighbors (KNN) that can adapt to changes in the environment and an individual’s thermal comfort preferences. In this experiment, they asked 34 participants to test the model’s performance. The results reveal that the model’s predictive performance can satisfy the actual needs of the occupants while also assisting in the establishment of individualized indoor thermal comfort environments for diverse individuals. Similarly, Peng et al. [25] created a platform to mimic distinct thermal feelings in occupants and developed a hybrid SVM-LDA thermal comfort classifier. They compared their classifier to various machine learning methods for thermal comfort prediction, and the findings revealed that the model performed the best. One reason for this conclusion is that SVMs perform well with small sample sizes, which is one of the key reasons why SVMs are so popular. Zhang et al. [26] proposed an improved random forest algorithm-based indoor thermal comfort model for offices. They used data from an intelligent building monitoring system to assess thermal comfort in various thermal environments. The researchers used the K-means algorithm to select decision trees with low similarity and combined them into a new random forest model based on the experimental results. This new model performed well on the test set, and the random forest-based prediction model outperformed other machine learning algorithm models regarding generalization. Hu et al. [27] successfully applied emerging machine learning techniques and extensive IoT-based sensing technologies to create a black-box MLP neural network for thermal comfort modeling. Excitingly, this network demonstrated superior predictive performance compared to PMV and traditional white-box machine learning models. The reason for this success can be summarized by the fact that the MLP neural network has a powerful expressive capability that can be trained by back-propagation algorithms, which enables automatic learning of features and patterns, further enhancing its effectiveness in thermal comfort prediction. However, the aforementioned thermal comfort modeling approaches require occupants’ private information, such as physiological and environmental data, which may result in a privacy breach. Compared to, for instance, conventional PMV models, machine learning algorithms have enhanced performance in predicting thermal comfort and are more adaptable.
Deep learning models have distinct advantages over machine learning in thermal comfort prediction. Deep learning can automatically learn features in complex thermal comfort environments, handle complex unstructured data, adapt to multiple tasks and data distributions, and have a highly flexible model structure that can efficiently handle large-scale data and achieve high-precision predictions. Deep learning can now excel at predicting thermal comfort.
Artificial Neural Networks (ANN), as a non-traditional algorithm to learn and represent data via a multi-level neural network structure, excel at predicting thermal comfort. Sanjeev et al. [28] proposed a new Bayesian optimization algorithm based on neighborhood component analysis for developing a heat index prediction model. The study’s findings show that the artificial neural network (ANN) model accurately and reliably predicts heat perception in real-time environments. Furthermore, because building thermal comfort data exhibits spatiotemporal relationships, time series prediction models in deep learning have become a powerful tool for building thermal comfort prediction. Chennapragada et al. [29] designed the thermal preference prediction task as a multivariate, multi-class classification problem and used deep learning and time series methods for prediction via an LSTM network. The results show that this approach outperforms state-of-the-art machine learning methods for heat preference prediction when applied to the same task. This highlights the significant advantages of deep learning time series models when dealing with spatially and temporally related building thermal comfort data. Similarly, Furkan et al. [30] introduced a Convolutional Neural Network-Long Short-Term Memory (CNN-LSTM) architecture that combines the specific feature extraction of the convolutional layer with the ability of Long Short-Term Memory (LSTM) to learn sequential dependencies, with significantly improved prediction performance compared to the comparison model.
2.2. Transfer Learning Techniques
Although machine learning algorithms and deep learning algorithms have contributed significantly to thermal comfort prediction problems, machine learning algorithms require large quantities of training data to model effectively, and data quality and coverage are crucial to performance. Obtaining comprehensive and accurate training data can be challenging in thermal comfort prediction. Transfer learning can reduce the need for large amounts of labeled data by transferring knowledge from existing tasks to new ones. Utilizing data and models from the source domain can lead to better performance on the target domain, even if the target domain has relatively little data. With transfer learning, a model can learn common feature representations or patterns from one or more related tasks, thus improving generalization on new tasks. Transfer learning can help models better comprehend and capture shared structure in the data, thereby improving predictive performance. Hansaem et al. [31] developed a deep learning model based on transfer learning to address the issue of poor generalization performance due to insufficient datasets of individual target subjects. The study’s findings show that the model performs better on the target dataset after training on the source dataset. Furthermore, the transfer learning-based model can maintain high prediction accuracy even when the target building’s dataset is imbalanced. To address the difficulty of generalizing their developed model to other building occupants, Das et al. [32] proposed a transfer learning framework that employs Adversarial Domain Adaptation (ADA) techniques to develop thermal comfort predictors personalized for the target occupants in an unsupervised manner. The study’s findings show that the model trained using transfer learning can accurately predict thermal comfort for most populations. Similarly, Somu et al. [33] proposed a Convolutional Neural Network-Long-Term Short-Term Memory Neural Network (TL CNN-LSTM) based on transfer learning to model spatio-temporal relationships in thermal comfort data. They also used the transfer learning technique to address the issue of insufficient data. The study’s findings show that this model has good accuracy in thermal comfort prediction, highlighting the effectiveness of transfer learning in dealing with spatio-temporal relationships and data insufficiency issues in thermal comfort data.
2.3. Transformer Model Application
Transfer learning techniques enhance generalization performance over the target domain by transferring knowledge and feature representations learned in the source domain to the target domain. As a result, models can better comprehend and capture shared data structures and patterns. Through transfer learning, some models that require large-scale datasets for pre-training can be applied to data-sparse tasks. Transformer, one of the most popular models, has demonstrated tremendous potential for time-series-related tasks. Transformer is a self-attention-based neural network architecture that has become an effective instrument for processing sequence data due to its parallel computation, long-range dependency modeling, encoder-decoder structure, self-attention mechanism, and scalability. Sun et al. [34] used two operational real-world datasets from two regions covering 6 weeks in their experiments and applied the Transformer algorithm for predicting building occupancy. On these two datasets, the study’s findings demonstrate that the Transformer-based occupancy prediction algorithm performs better than other machine learning algorithms. This emphasizes the Transformer’s outstanding performance in handling the task of predicting building occupancy. Similarly, Wang et al. [35] proposed a Transformer-based energy load forecasting method that employs a single encoder and multiple decoder structures. When the same encoder encodes all input data, multiple decoders perform their respective prediction tasks. The results show that this proposed model outperforms other prediction models in terms of load prediction accuracy and generalization ability. In thermal comfort prediction, thermal comfort is influenced by both temporal and spatial factors; therefore, incorporating time series characteristics can more accurately capture the comfort changes of building occupants. Due to their robust modeling capabilities and self-attention mechanism, the Transformers will have great potential when applied to predicting thermal comfort.
Based on the previous research on thermal comfort prediction models, the transfer learning-based Transformer model proposed in this paper is novel in thermal comfort prediction. First, the combination of transfer learning and the Transformer model solves the problem of poor model performance due to insufficient data, which is a significant innovation. Second, the Transformer model is used innovatively to capture the spatio-temporal relationship of thermal comfort data, improving prediction accuracy and reliability. Finally, the model uses data that is more readily available, less expensive to collect, and takes full account of user privacy, making it more feasible and acceptable for practical applications.
3. Methodology
3.1. Problem Statement
Thermal comfort refers to the level of comfort or discomfort the human organism perceives. The thermal sensations of residents are measured on a 7-point scale, which includes ‘Very cold’ (−3), ‘Cold’ (−2), ‘Slightly cool’ (−1), ‘Neutral’ (0), ‘Slightly warm’ (+1), ‘Hot’ (+2), and ‘Very hot’ (+3) [36]. Due to the small number of occurrences for −3 and +3, we merged with −2 and +2, respectively, reducing the thermal comfort scale from 7 to 5 points. This transformation seeks to enhance the precision of thermal measurements and equalize the distribution of data across categories.
After numerically representing the thermal comfort sensation, it is possible to reduce the thermal comfort prediction problem to a numerical classification problem. The thermal comfort prediction model for transfer learning [37] proposed in this paper consists of multiple source domains and a single target domain , with the source and target domains expressed as follows:
where a is the feature space, is the marginal probability distribution, is the class label, and is the predictive/conditional function learned from the training data. In this work on thermal comfort prediction, the source and target domains have the same feature space and learning task, so the concept of isomorphic transfer learning is used. Figure 2 illustrates the detailed architecture of transfer learning, where the knowledge is acquired by learning the source domain, and then the learned knowledge is used to predict the target domain.
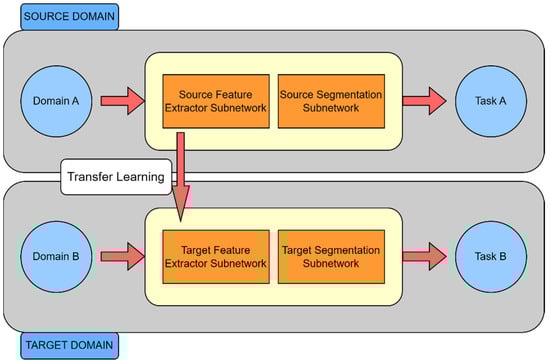
Figure 2.
Architecture of transfer learning.
3.2. Datasets Introduction
This study employs a total of three datasets, with the ASHRAE RP-884 dataset and the Scales project dataset serving as the source domain and the Medium US office dataset serving as the target domain, as detailed in Table 1. The description of the datasets appears below.

Table 1.
Information on the experimental dataset.
ASHRAE RP-884 dataset: Comprises 25,000 raw thermal comfort data sets containing data from various climates and buildings in various regions of the world.
Scales project dataset: This data set includes thermal comfort ratings from 8225 participants in 57 localities and 30 countries. It contains 137 variables related to thermal comfort.
Medium US Office dataset: This data set contains information regarding thermal comfort compared to twenty-four people at the Friend Center office building in Philadelphia, Pennsylvania, United States. The data were recorded three times daily (morning, noon, and afternoon) over two weeks for each of the four seasons.
Figure 3 displays the thermal sensation distribution of the datasets. The three aforementioned datasets have a similar distribution of thermal sensations, with occupants feeling comfortable, slightly dry, or uncomfortable with the thermal environment the majority of the time and uncomfortable very infrequently, which is consistent with our lived experience. The Scales Project dataset and the ASHRAE dataset exhibit greater diversity compared to the Medium US Office dataset due to their inclusion of a broad range of data originating from various climatic zones across the globe. In contrast, the dataset pertaining to the Medium US Office comprises exclusively data derived from a solitary building.
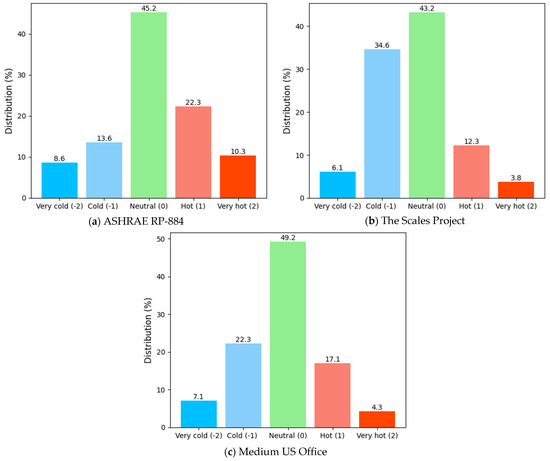
Figure 3.
Distribution of thermal sensation over different datasets.
The air temperature is among the most influential factors in residents’ thermal comfort. Figure 4 illustrates the correlation between the scale of thermal feeling and the temperature of the inside environment, with higher indoor air temperatures correlating to higher thermal sensation ratings and other factors that influence thermal sensation, including age, gender, relative humidity, and outdoor weather. Therefore, we should use as much information as possible to build more accurate and reliable models for predicting thermal comfort.
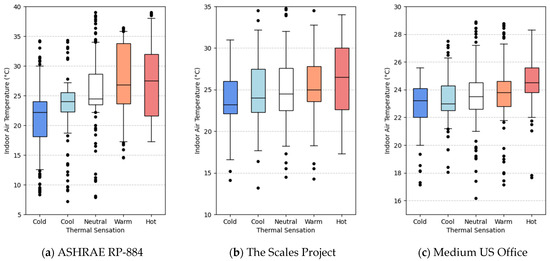
Figure 4.
Boxplots of thermal sensation and the indoor temperature.
According to the analyses of the above datasets, the Medium US Office datasets and the ASHRAE Scales Project differ significantly. This is because the buildings in each of the datasets are situated in different climatic regions (which contain temperate climate zones, tropical climate zones, subtropical climate zones, and Mediterranean climate zones), and these different climatic regions result in different perceptions, activities, and personal preferences, which all influence how thermally comfortable a building’s occupants feel.
3.3. Feature Selection
The thermal comfort of the human body is affected by a number of complex factors. Time factors, environmental conditions, psychological factors, health conditions, personal preferences, and environmental routines must be considered when evaluating thermal comfort. This study focuses on the following variables that predict thermal comfort and are detailed in Table 2.
Table 2.
Selected features of the experimental dataset.
- (1)
- Indoor environmental factors: wind speed, air temperature, relative radiant temperature, and relative humidity are the indoor factors that influence thermal comfort the most directly. Wind velocity is the airflow rate relative to a stationary point in a chamber; the mean temperature of the air in a room is the air temperature; relative humidity is the ratio between the saturated water vapor pressure and the air’s water vapor pressure at the same temperature; and relative radiant temperature is a comparison of the radiant temperature of the human body’s surface to the ambient temperature, which is used to assess the body’s ability to regulate its temperature.
- (2)
- Outdoor environmental factors: The outdoor air temperature and relative humidity substantially impact the thermal comfort of indoor occupants. For instance, during the frigid winter months, the outdoor environment has a direct effect on the thermal comfort of a building.
- (3)
- Individual factors: age, gender, clothing insulation coefficient, and metabolic rate are crucial factors that affect thermal comfort; they have a substantial effect on the regulation of the human body’s thermal balance and the generation of thermal sensation. Different ages and genders will have different metabolic rates, and according to personal preferences, they will wear different clothing insulation coefficients. The individual differences will have an impact on thermal comfort.
3.4. Imbalanced Class Distribution
The thermal sensation values in the dataset are classified into five classes. Figure 3 depicts the distributions of the three datasets, and it is evident that the three distributions are disproportionate, with the number of thermal sensation cases extending from −1 (cool) to 1 (warm) vastly exceeding the number of other cases. To train an equitable classifier, resolving the class disparity in the data regarding thermal comfort is necessary. In this study, we employ a synthetic oversampling method, ADASYN (Adaptive Synthetic Sampling), which can adjust the generation of synthetic samples based on the sample density and focus on samples that are further from the minority category samples that are further from the majority category samples. By increasing the number of these less dense samples, ADASYN is better able to cope with data imbalances and recognize minority categories. The ADASYN algorithm process is shown in Figure 5.
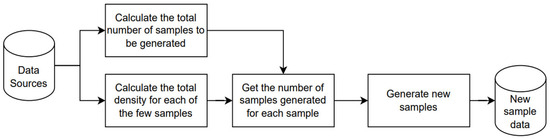
Figure 5.
Principles of the Adaptive Synthetic Sampling (ADASYN) algorithm.
Initially, an evaluation was conducted to determine the extent of category imbalance by calculating the proportion between the number of minority group samples and the number of majority category samples. If the degree of imbalance exceeds a pre-established threshold, the quantity of synthetic data generated is decided to achieve data balance. After calculating the ratios between samples belonging to each minority category and samples belonging to the majority category, these ratios are normalized to generate a density distribution. The determination of the quantity of synthetic data to be generated for each sample is achieved by integrating the normalized ratios with the overall amount of synthetic data. During the generation phase, synthetic data is produced by calculating a weighted difference vector. This is achieved by picking samples closest to the minority category samples, thereby maintaining the essential attributes of the original data. This approach has the potential to enhance the uneven distribution of data and offer more comprehensive data for the model, hence enhancing the model’s generalization capability and performance.
3.5. Evaluation Criteria
This experiment explores using a Transformer based on transfer learning for modeling thermal comfort prediction. Three evaluation metrics, including accuracy, precision, and F1 score, are employed to compare the performance of the proposed model with other models [38].
Accuracy: Accuracy is one of the most frequently employed evaluation metrics in classification prediction, which calculates the proportion of samples correctly predicted by a model. Accuracy measures how accurately the model predicts the classification task as a whole. However, accuracy is less effective in predicting a few categories when dealing with unbalanced datasets.
where TP represents the number of true positive predictions, TN represents the number of true negative predictions, FP represents the number of false positive predictions, and FN represents the number of false negative predictions.
Precision: Precision measures the proportion of true positive predictions among the samples predicted as positive. It helps identify the occurrence of false positives in the model’s positive predictions. Precision is an important evaluation metric in scenarios where reducing false positives is crucial.
F1 score: The F1 score provides a balanced assessment by considering the compromise between recall and precision. It is the harmonic average of precision and recall, making it suitable as an evaluation metric when precision and recall are equally important.
3.6. Architecture of the TL-Transformer
Transfer learning is a machine learning technique that improves learning performance on different but related tasks by transferring learned knowledge or model parameters to a new task. It can be applied to the thermal comfort prediction task to solve the problem of insufficient data in the target building. The transfer learning-based thermal comfort model developed in this study comprises two independent source domains, a target domain, and the TL-Transformer classifier, which adheres to the initial transformer’s encoder and decoder layers. The structure of the Transformer model is shown in Figure 6.
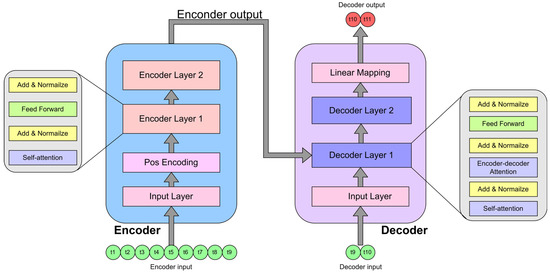
Figure 6.
Architecture of the Transformer model.
Encoder: The encoder architecture consists of an input layer, a positional coding layer, and four coding layers that are identical. Initially, the input layer transforms the symbols or tokens (e.g., words, characters, etc.) of the input sequence into a compact, continuous vector representation. In this experiment, the input data is the data collected by the sensor, and the letter ‘t’ in the figure denotes the input data, where the application of a multi-attention mechanism is necessary to completely capture the multifaceted characteristics of the input data. The position encoding layer then transmits the position information by embedding a set of position encoding vectors within the embedded representation of the input sequence, where the dimensions of these vectors correspond to sine and cosine functions of varying frequencies. Four encoder layers are supplied with the position-encoding vectors that are generated. Internally, each encoder layer comprises a multi-head self-attentive sublayer and a feedforward, entirely connected sublayer. Each sublayer is followed by a normalization layer and residual connectivity to assure information flow and training stability. The encoder ultimately outputs a vector of model dimensions for the decoder to further process. This structure demonstrates a high level of hierarchical logic and sequence data processing specialization.
Decoder: The decoder comprises an input layer, four overlapping decoder layers, and an output layer. The initial input is derived from the last data point in the encoder output sequence. By mapping the input of the decoder to a vector representation of the model’s dimensions, the embedding layer is represented. The decoder layer is comprised of three sub-layers: the self-attention layer and the feed-forward neural network layer, which are shared components. In contrast, each decoder layer contains an additional sub-layer for focusing on the encoder output and capturing pertinent information during the generation process. The output layer maps the output of the final decoder layer to the time series of interest. A look-ahead mask limits exposure to only forward data at each time step and introduces a positional bias between decoder inputs and target outputs to ensure that future data points are not used for time series prediction. Such a design allows the decoder to generate the desired sequence efficiently.
4. Experiment
4.1. Data Processing
In this research, a collection of publicly accessible datasets was utilized. The dataset was processed as follows: (1) Data preparation: data columns of non-key features in the dataset were deleted, followed by the deletion of rows containing null data; data of gender feature columns in the dataset were replaced with ‘1’ for males and ‘2’ for females; and four classifications of age (18, 19–30, 31–45, and 45+) were created. In addition, merge −3 (very cold) with −2 (cold) and +2 (hot) with +3 (very hot) in the dataset’s thermal sensation vote column. (2) Outlier management: Z-Score is a commonly used outlier detection method that determines whether a data point is an outlier by calculating the standard deviation between the data point and its mean. The Z-Score method can be used to detect outliers in both univariate and multivariate data. Standardization is a frequently employed data scaling method that modifies the data according to the mean and standard deviation to exhibit a normal distribution with a mean of 0 and a standard deviation of 1. Standardization eliminates magnitude differences between distinct characteristics, rendering the data comparable and unaffected by outliers.
4.2. Experimental Setup
In our study, we used two source domain datasets (the Scales Project dataset and the ASHRAE RP-884 dataset) for training and learning. The datasets contained four environmental variables (relative humidity, air temperature, indoor air velocity, and mean radiant temperature) and four individual variables (age, gender, metabolic rate, and clothing insulation). The target domain has the same characteristics as the source domain, and the acquired knowledge from the source domain is applied to the target domain. Our target region, Beijing, has a temperate climate based on the climate classification system, whereas the source domain contains 31,236 instances of the same climate in 37 cities (such as Tokyo, Sydney, and Berkeley).
As mentioned previously, to solve the problem of data imbalance, we combine the minimal classes −3 (very cold) and +3 (very hot) with −2 (cold) and +2 (hot) to reduce the original 7-classification problem to a 5-classification one. We then apply the over-sampling method ADASYN to solve the data imbalance problem and normalize the dataset to improve the performance of our classifier. Furthermore, we select Transformer as the classifier for the datasets; there are eight Transformer blocks in the model, the word embedding feature dimension is 512, and the feature dimension of the input data is 10; we train the classifier with the categorical cross-entropy loss function, and we train the learning rate with the Adam optimizer = 0.001. The collection size is set to eight, and the maximum number of ephemeral elements is set to two hundred. In addition, preset random seeds are chosen for the dataset’s mixing and training.
In the investigations, Accuracy, Precision, and F1 scores were used as performance metrics that precisely reflected the model’s accuracy performance. The greatest concern is the overall accuracy of thermal comfort prediction. Therefore, the Accuracy metric is the most essential, and the precision rate is used to test the false alarms in the case of a positive prediction to measure the model’s accuracy in the case of a positive prediction. The F1 Score metric is used as one of the performance metrics to achieve a better equilibrium between precision and recall. The F1 score metric balances the accuracy of the model with underreporting.
In this study, the PMV model, several random forest models, and deep learning models are chosen as baselines to compare with the proposed method. The PMV model is the most well-known thermal comfort model, and it has been extensively implemented in a variety of indoor environmental design disciplines. KNN is uncomplicated and straightforward to implement, making it ideal for multi-classification tasks. Support Vector Machine is appropriate for high-dimensional datasets, while random forest is more efficient for large-scale datasets due to its relatively rapid training time. AdaBoost is quick, straightforward, user-friendly, and requires no parameter tuning. The machine learning algorithms have more input features than the PMV model and are better able to account for individual differences. Similarly, we compare our model to the neural network models LSTM and CNN-LSTM, which are applied to time series data. We also compare the proposed TL-Transformer model to the Transformer model without transfer learning, using the Scales Project databases and ASHRAE as source domains and the Medium US Office dataset as the target domain.
4.3. Results and Discussion
4.3.1. Overall Prediction Result
In this experiment, the considered thermal comfort dataset is divided into a training dataset and a test dataset using the k-fold cross-validation technique, and the model’s performance is evaluated using the quality metrics described in Section 3.5. The efficacy of various thermal comfort modeling algorithms is displayed in Table 3.
Table 3.
Prediction performance for different algorithms on the target dataset.
Table 3 demonstrates that the PMV model outperforms the SVM algorithm in machine learning regarding accuracy and F1 score metrics. However, the SVM model is more accurate than the PMV model because machine learning employs more features. In addition, all machine learning algorithms outperformed the PMV model, with random forest performing the best, consistent with previous findings that random forest is one of the best classification algorithms for limited datasets [39]. The prediction performance of deep learning models is superior to that of machine learning models because LSTM and CNN-LSTM can capture the spatial and temporal relationships in the thermal comfort dataset [33]. However, the deep learning model that incorporates transfer learning performs better, primarily because it can preserve and transfer the source domain’s higher-order relationships to the target domain. In conclusion, the performance metrics of the TL-Transformer model significantly outperform those of the PMV model and the machine learning model, and its ability to handle long series data and capture long-term dependencies, as well as its ability to use pre-training knowledge and parameters to accelerate the model training process, reduce the data requirements, and improve generalization in the target domain, are the primary reasons for the TL-Transformer’s superior performance [40].
4.3.2. Impact of Different Feature Combinations
However, other variables, such as the user’s metabolic status, which cannot be assessed, and the age of the occupants, may not be accessible due to the cost of data collection and user privacy. In addition, weather stations placed outside the building are more precise in gathering external environmental data than official meteorological data, but buildings lack the necessary equipment due to cost and other factors. The nine essential thermal comfort parameters are classified into the following three feature sets to examine the effect of combining various feature sets on the performance of the thermal comfort model:
- FS1: Indoor air velocity, indoor air temperature, indoor radiant temperature, indoor relative humidity, metabolic rate, and clothing insulation.
- FS2: FS1 and two individual factors (gender and age).
- FS3: FS2 and outdoor environmental factors (outdoor humidity and outdoor temperature).
Table 4 displays the prediction performance of various feature sets on the target dataset. As feature parameters increase, TL-Transformer’s efficacy in terms of accuracy, precision, and F1 score improves across all feature sets.
Table 4.
Prediction performance on random forest and deep learning models with different feature sets.
For feature set , the PMV model has better accuracy than Transformer but poorer precision and F1 score; TL-Transformer achieves the highest level of precision; and the data-driven thermal comfort-based model outperforms on feature set , indicating that personal information (age and gender) can be utilized to enhance thermal comfort prediction. Random forest, Transformer, and TL-Transformer performed best in feature set when compared to feature sets and , highlighting the importance of personal factors and external environmental factors in accurate thermal comfort modeling.
In addition, the confusion matrix of the TL-Transformer and the Transformer models and the best-performing machine learning (random forest) were analyzed (see Figure 7) to further investigate the performance of the TL-Transformer.
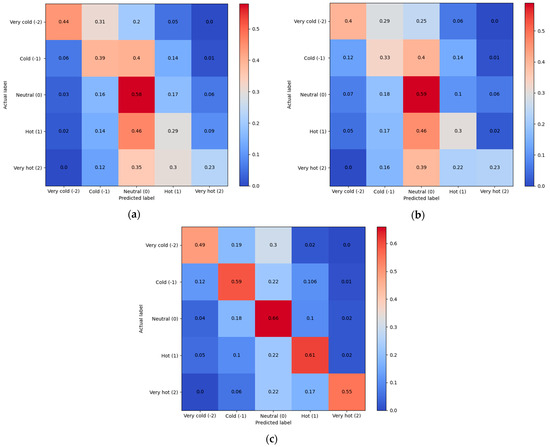
Figure 7.
Confusion matrix: (a) random forest, (b) Transformer, and (c) Transfer learning (TL)-Transformer.
The random forest model predicts a probability of 0.58 for labels in the “0” category, whereas the Transformer model predicts probabilities of 0.59 and 0.40, respectively, for labels in the “0” and “−2” categories. However, there is a high probability that both models will classify the remaining three labeled data points as “0” labels.
In contrast, TL-Transformer has high accuracy for each category, with 49% accuracy for category “−2”, 59% accuracy for category “−1”, and 66% accuracy for category “0”. Category “1” has an accuracy of 61%, and category “2” has an accuracy of 55%, which is consistent with common sense as the prediction accuracy of the majority category is slightly higher than the minority category.
The Receiver Operating Characteristic (ROC) curves for the TL-Transformer model, random forest model, and Transformer model are depicted in Figure 8. From a to e are the ROC curves for five different prediction labels. The ROC comprises a graph with True Positive Rate (FPR) and False Positive Rate (TPR) as the horizontal and vertical coordinates, respectively. AUC denotes the area under the ROC curve, which is mainly used to measure the generalization performance of the model, i.e., how good the classification is, and the larger the AUC is, the better the model effect is. Based on the ROC curve graphs, it is known that TL-Transformer has higher AUC values for each class compared to the random forest and Transformer models, which indicates that TL-Transformer is accurately categorizing all types.
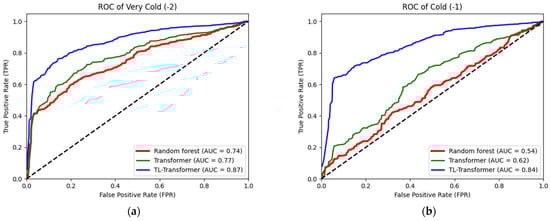
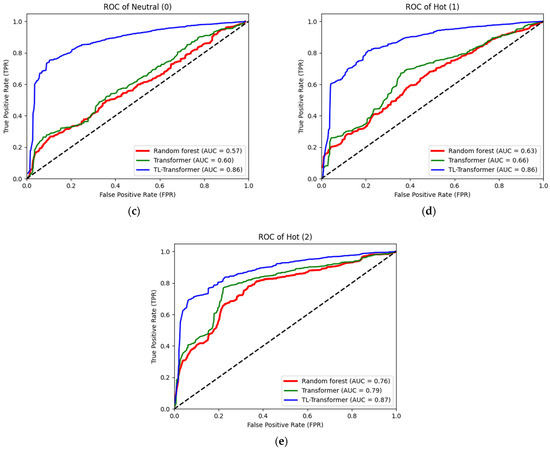
Figure 8.
Receiver Operating Characteristic (ROC) curves of random forest, Transformer, and Transfer learning (TL)-Transformer.
4.3.3. Impact of the Size of the Target Dataset
We have examined Transformer and Transfer Learning-Transformer (TL-Transformer) in depth on target datasets of varying sizes. Figure 9 shows the accuracy performance of Transformer and TL-Transformer on different proportions of the training set, and the accuracy of TL-Transformer is consistently higher than that of Transformer on different proportions of the data, indicating that Transformer based on migration learning performs better. This finding validates the suitability of the TL-Transformer for thermal comfort modeling of fresh construction and demonstrates the potential for enhanced building management efficiency.
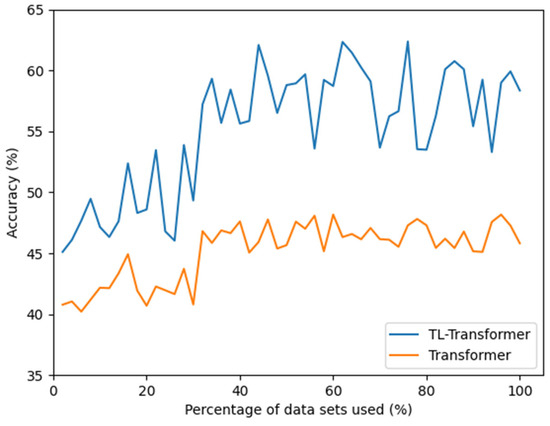
Figure 9.
Performance of Transformer and Transfer learning (TL)-Transformer on different percentage training sets.
5. Conclusions
Thermal comfort has developed into a prominent field of study, and credible thermal comfort prediction is necessary for optimizing building design, enhancing indoor environmental comfort, increasing productivity, reducing energy costs, and enhancing the user experience. However, building design and construction, individual differences in occupants, and the difficulty of obtaining high-quality data present several challenges in predicting thermal comfort indices in buildings. Therefore, the proposed TL-Transformer model makes an important contribution to the field of thermal comfort prediction.
- The proposed Transformer model based on deep transfer learning provides relatively accurate thermal comfort predictions with higher accuracy for prediction than traditional PMV models and machine learning models.
- This study tackles the issue of inadequate data leading to models that cannot be adequately trained, affecting model performance. Additionally, the study compared various feature combinations in the dataset to find the best feature combination.
- In the meantime, the category imbalance issue was addressed using the ADASYN (Adaptive Synthetic Sampling) method. Resolving these issues offers trustworthy solutions and approaches to get around the target dataset’s limitations and raise the predictive accuracy of thermal comfort models.
Experiments on three datasets confirmed that the TL-Transformer model is superior to existing technical algorithms, and evaluation metrics, including accuracy, F1 score, and precision, demonstrated our model’s high performance and dependability. This study demonstrates the prospect of predicting thermal comfort using small datasets by increasing the scale of the training data through the transfer learning technique and using climate-like region data for modeling the thermal comfort of target buildings. In the context of new construction and limited sensor equipment, this model utilizes easily accessible and low-cost data to achieve accurate thermal comfort predictions, thus providing users with a higher indoor comfort experience. This innovative approach not only helps to improve thermal comfort for users but also significantly improves energy efficiency.
Nevertheless, there are limitations to our study: (1) The characteristics of our experimental data are insufficiently varied, and the data size is insufficient, which may influence the model’s performance. (2) The target regional climate for this experiment was “temperate climate”. Future research should be conducted on buildings in more diverse climate zones. (3) In the case of non-equilibrium thermal comfort data, we have relatively low predictive accuracy for very few categories (e.g., −2 (cold) and 2 (hot)). In future research, we need to delve deeper into the impact of more characterization data on model accuracy, and in addition, investigating more data imbalance techniques on model predictions is an area worth exploring. We also need to further investigate data transfer between climate and buildings to better understand its impact on thermal comfort predictions.
Author Contributions
Conceptualization, X.Z. and P.L.; methodology, X.Z.; software, X.Z.; validation, X.Z. and P.L.; formal analysis, X.Z.; investigation, X.Z.; resources, P.L.; data curation, X.Z.; writing—original draft preparation, X.Z.; writing—review and editing, X.Z.; visualization, X.Z.; supervision, P.L.; project administration, X.Z.; funding acquisition, P.L. All authors have read and agreed to the published version of the manuscript.
Funding
This research received no external funding.
Data Availability Statement
This data comes from the DRYAD.
Acknowledgments
This experimental research project was supported by the Institute of Intelligent Building Research at Henan University of Technology, and the open access to experimental data is gratefully acknowledged.
Conflicts of Interest
The authors declare no conflict of interest.
References
- Huang, H.; Wang, H.; Hu, Y.-J.; Li, C.; Wang, X. The development trends of existing building energy conservation and emission reduction—A comprehensive review. Energy Rep. 2022, 8, 13170–13188. [Google Scholar] [CrossRef]
- Che, W.W.; Tso, C.Y.; Sun, L.; Ip, D.Y.; Lee, H.; Chao, C.Y.; Lau, A.K. Energy consumption, indoor thermal comfort and air quality in a commercial office with retrofitted heat, ventilation and air conditioning (HVAC) system. Energy Build. 2019, 201, 202–215. [Google Scholar] [CrossRef]
- Szczepanik-Scislo, N.; Scislo, L. Dynamic Real-Time Measurements and a Comparison of Gas and Wood Furnaces in a Dual-Fuel Heating System in Order to Evaluate the Occupants’ Safety and Indoor Air Quality. Buildings 2023, 13, 2125. [Google Scholar] [CrossRef]
- Wu, Z.; Li, N.; Peng, J.; Cui, H.; Liu, P.; Li, H.; Li, X. Using an ensemble machine learning methodology-Bagging to predict occupants’ thermal comfort in buildings. Energy Build. 2018, 173, 117–127. [Google Scholar] [CrossRef]
- Musiał, M.; Lichołai, L.; Katunský, D. Modern Thermal Energy Storage Systems Dedicated to Autonomous Buildings. Energies 2023, 16, 4442. [Google Scholar] [CrossRef]
- Momeni, M.; Fartaj, A. Numerical thermal performance analysis of a PCM-to-air and liquid heat exchanger implementing latent heat thermal energy storage. J. Energy Storage 2023, 58, 106363. [Google Scholar] [CrossRef]
- Castilla, M.; Álvarez, J.; Berenguel, M.; Rodríguez, F.; Guzmán, J.; Pérez, M. A comparison of thermal comfort predictive control strategies. Energy Build. 2011, 43, 2737–2746. [Google Scholar] [CrossRef]
- Lin, C.J.; Wang, K.-J.; Dagne, T.B.; Woldegiorgis, B.H. Balancing thermal comfort and energy conservation—A multi-objective optimization model for controlling air-condition and mechanical ventilation systems. Build. Environ. 2022, 219, 109237. [Google Scholar] [CrossRef]
- Fanger, P.O. Thermal Comfort: Analysis and Applications in Environmental Engineering; McGraw-Hill: New York, NY, USA, 1970. [Google Scholar]
- Luo, M.; Xie, J.; Yan, Y.; Ke, Z.; Yu, P.; Wang, Z.; Zhang, J. Comparing machine learning algorithms in predicting thermal sensation using ASHRAE Comfort Database II. Energy Build. 2020, 210, 109776. [Google Scholar] [CrossRef]
- Höppe, P. Different aspects of assessing indoor and outdoor thermal comfort. Energy Build. 2002, 34, 661–665. [Google Scholar] [CrossRef]
- Du, X.; Cai, Y.; Wang, S.; Zhang, L. Overview of deep learning. In Proceedings of the 2016 31st Youth Academic Annual Conference of Chinese Association of Automation (YAC), Wuhan, China, 11–13 November 2016; pp. 159–164. [Google Scholar]
- Gorbachev, Y.; Fedorov, M.; Slavutin, I.; Tugarev, A.; Fatekhov, M.; Tarkan, Y. Openvino deep learning workbench: Comprehensive analysis and tuning of neural networks inference. In Proceedings of the IEEE/CVF International Conference on Computer Vision Workshops, Seoul, Republic of Korea, 27–28 October 2019. [Google Scholar]
- Raja, I.A.; Nicol, J.F.; McCartney, K.J.; Humphreys, M.A. Thermal comfort: Use of controls in naturally ventilated buildings. Energy Build. 2001, 33, 235–244. [Google Scholar] [CrossRef]
- Wagner, A.; Gossauer, E.; Moosmann, C.; Gropp, T.; Leonhart, R. Thermal comfort and workplace occupant satisfaction—Results of field studies in German low energy office buildings. Energy Build. 2007, 39, 758–769. [Google Scholar] [CrossRef]
- Scislo, L.; Szczepanik-Scislo, N. Air quality sensor data collection and analytics with iot for an apartment with mechanical ventilation. In Proceedings of the 2021 11th IEEE International Conference on Intelligent Data Acquisition and Advanced Computing Systems: Technology and Applications (IDAACS), Cracow, Poland, 22–25 September 2021; pp. 932–936. [Google Scholar]
- Rodriguez-Galiano, V.; Mendes, M.P.; Garcia-Soldado, M.J.; Chica-Olmo, M.; Ribeiro, L. Predictive modeling of groundwater nitrate pollution using Random Forest and multisource variables related to intrinsic and specific vulnerability: A case study in an agricultural setting (Southern Spain). Sci. Total Environ. 2014, 476, 189–206. [Google Scholar] [CrossRef] [PubMed]
- Feng, Y.; Liu, S.; Wang, J.; Yang, J.; Jao, Y.-L.; Wang, N. Data-driven personal thermal comfort prediction: A literature review. Renew. Sustain. Energy Rev. 2022, 161, 112357. [Google Scholar] [CrossRef]
- Martins, L.A.; Soebarto, V.; Williamson, T. A systematic review of personal thermal comfort models. Build. Environ. 2022, 207, 108502. [Google Scholar] [CrossRef]
- Wen, Q.; Sun, L.; Yang, F.; Song, X.; Gao, J.; Wang, X.; Xu, H. Time series data augmentation for deep learning: A survey. arXiv 2020, arXiv:2002.12478. [Google Scholar]
- de Dear, R.J.; Brager, G.S. Developing an adaptive model of thermal comfort and preference. ASHRAE Trans. 1998, 104, 145–167. [Google Scholar]
- Čulić, A.; Nižetić, S.; Šolić, P.; Perković, T.; Čongradac, V. Smart monitoring technologies for personal thermal comfort: A review. J. Clean. Prod. 2021, 312, 127685. [Google Scholar] [CrossRef]
- Fard, Z.Q.; Zomorodian, Z.S.; Korsavi, S.S. Application of machine learning in thermal comfort studies: A review of methods, performance and challenges. Energy Build. 2022, 256, 111771. [Google Scholar] [CrossRef]
- Xiong, L.; Yao, Y. Study on an adaptive thermal comfort model with K-nearest-neighbors (KNN) algorithm. Build. Environ. 2021, 202, 108026. [Google Scholar] [CrossRef]
- Peng, B.; Hsieh, S.-J. Data-driven thermal comfort prediction with support vector machine. In Proceedings of the International Manufacturing Science and Engineering Conference, Los Angeles, CA, USA, 4–8 June 2017; p. V003T004A044. [Google Scholar]
- Zhang, H.; Yang, X.; Tu, R.; Huang, J.; Li, Y. Thermal Comfort Modeling of Office Buildings Based on Improved Random Forest Algorithm. In Proceedings of the 2022 IEEE 11th Data Driven Control and Learning Systems Conference (DDCLS), Chengdu, China, 3–5 August 2022; pp. 1369–1376. [Google Scholar]
- Hu, W.; Wen, Y.; Guan, K.; Jin, G.; Tseng, K.J. iTCM: Toward learning-based thermal comfort modeling via pervasive sensing for smart buildings. IEEE Internet Things J. 2018, 5, 4164–4177. [Google Scholar] [CrossRef]
- Kumar, T.S.; Kurian, C.P. Real-time data based thermal comfort prediction leading to temperature setpoint control. J. Ambient Intell. Humaniz. Comput. 2023, 14, 12049–12060. [Google Scholar] [CrossRef]
- Chennapragada, A.; Periyakoil, D.; Das, H.P.; Spanos, C.J. Time series-based deep learning model for personal thermal comfort prediction. In Proceedings of the Thirteenth ACM International Conference on Future Energy Systems, Virtual, 28 June–1 July 2022; pp. 552–555. [Google Scholar]
- Elmaz, F.; Eyckerman, R.; Casteels, W.; Latré, S.; Hellinckx, P. CNN-LSTM architecture for predictive indoor temperature modeling. Build. Environ. 2021, 206, 108327. [Google Scholar] [CrossRef]
- Park, H.; Park, D.Y. Prediction of individual thermal comfort based on ensemble transfer learning method using wearable and environmental sensors. Build. Environ. 2022, 207, 108492. [Google Scholar] [CrossRef]
- Das, H.P.; Schiavon, S.; Spanos, C.J. Unsupervised personal thermal comfort prediction via adversarial domain adaptation. In Proceedings of the 8th ACM International Conference on Systems for Energy-Efficient Buildings, Cities, and Transportation, Coimbra, Portugal, 17–18 November 2021; pp. 230–231. [Google Scholar]
- Somu, N.; Sriram, A.; Kowli, A.; Ramamritham, K. A hybrid deep transfer learning strategy for thermal comfort prediction in buildings. Build. Environ. 2021, 204, 108133. [Google Scholar] [CrossRef]
- Sun, K.; Qaisar, I.; Khan, M.A.; Xing, T.; Zhao, Q. Building Occupancy Number Prediction: A Transformer Approach. Build. Environ. 2023, 244, 110807. [Google Scholar] [CrossRef]
- Wang, C.; Wang, Y.; Ding, Z.; Zheng, T.; Hu, J.; Zhang, K. A transformer-based method of multienergy load forecasting in integrated energy system. IEEE Trans. Smart Grid 2022, 13, 2703–2714. [Google Scholar] [CrossRef]
- Rijal, H.; Humphreys, M.; Nicol, J. Adaptive model and the adaptive mechanisms for thermal comfort in Japanese dwellings. Energy Build. 2019, 202, 109371. [Google Scholar] [CrossRef]
- Torrey, L.; Shavlik, J. Transfer learning. In Handbook of Research on Machine Learning Applications and Trends: Algorithms, Methods, and Techniques; IGI global: Hershey, PA, USA, 2010; pp. 242–264. [Google Scholar]
- Sokolova, M.; Japkowicz, N.; Szpakowicz, S. Beyond accuracy, F-score and ROC: A family of discriminant measures for performance evaluation. In Proceedings of the Australasian Joint Conference on Artificial Intelligence, Hobart, Australia, 4–8 December 2006; pp. 1015–1021. [Google Scholar]
- Hu, W.; Luo, Y.; Lu, Z.; Wen, Y. Heterogeneous transfer learning for thermal comfort modeling. In Proceedings of the 6th ACM International Conference on Systems for Energy-Efficient Buildings, Cities, and Transportation, New York, NY, USA, 13–14 November 2019; pp. 61–70. [Google Scholar]
- Jin, Z.; Kim, J.; Yeo, H.; Choi, S. Transformer-based map-matching model with limited labeled data using transfer-learning approach. Transp. Res. Part C Emerg. Technol. 2022, 140, 103668. [Google Scholar] [CrossRef]
Disclaimer/Publisher’s Note: The statements, opinions and data contained in all publications are solely those of the individual author(s) and contributor(s) and not of MDPI and/or the editor(s). MDPI and/or the editor(s) disclaim responsibility for any injury to people or property resulting from any ideas, methods, instructions or products referred to in the content. |
© 2023 by the authors. Licensee MDPI, Basel, Switzerland. This article is an open access article distributed under the terms and conditions of the Creative Commons Attribution (CC BY) license (https://creativecommons.org/licenses/by/4.0/).