
Automation of the Photobioreactor Lighting System to Manage Light Distribution in Microalgae Cultures


Abstract
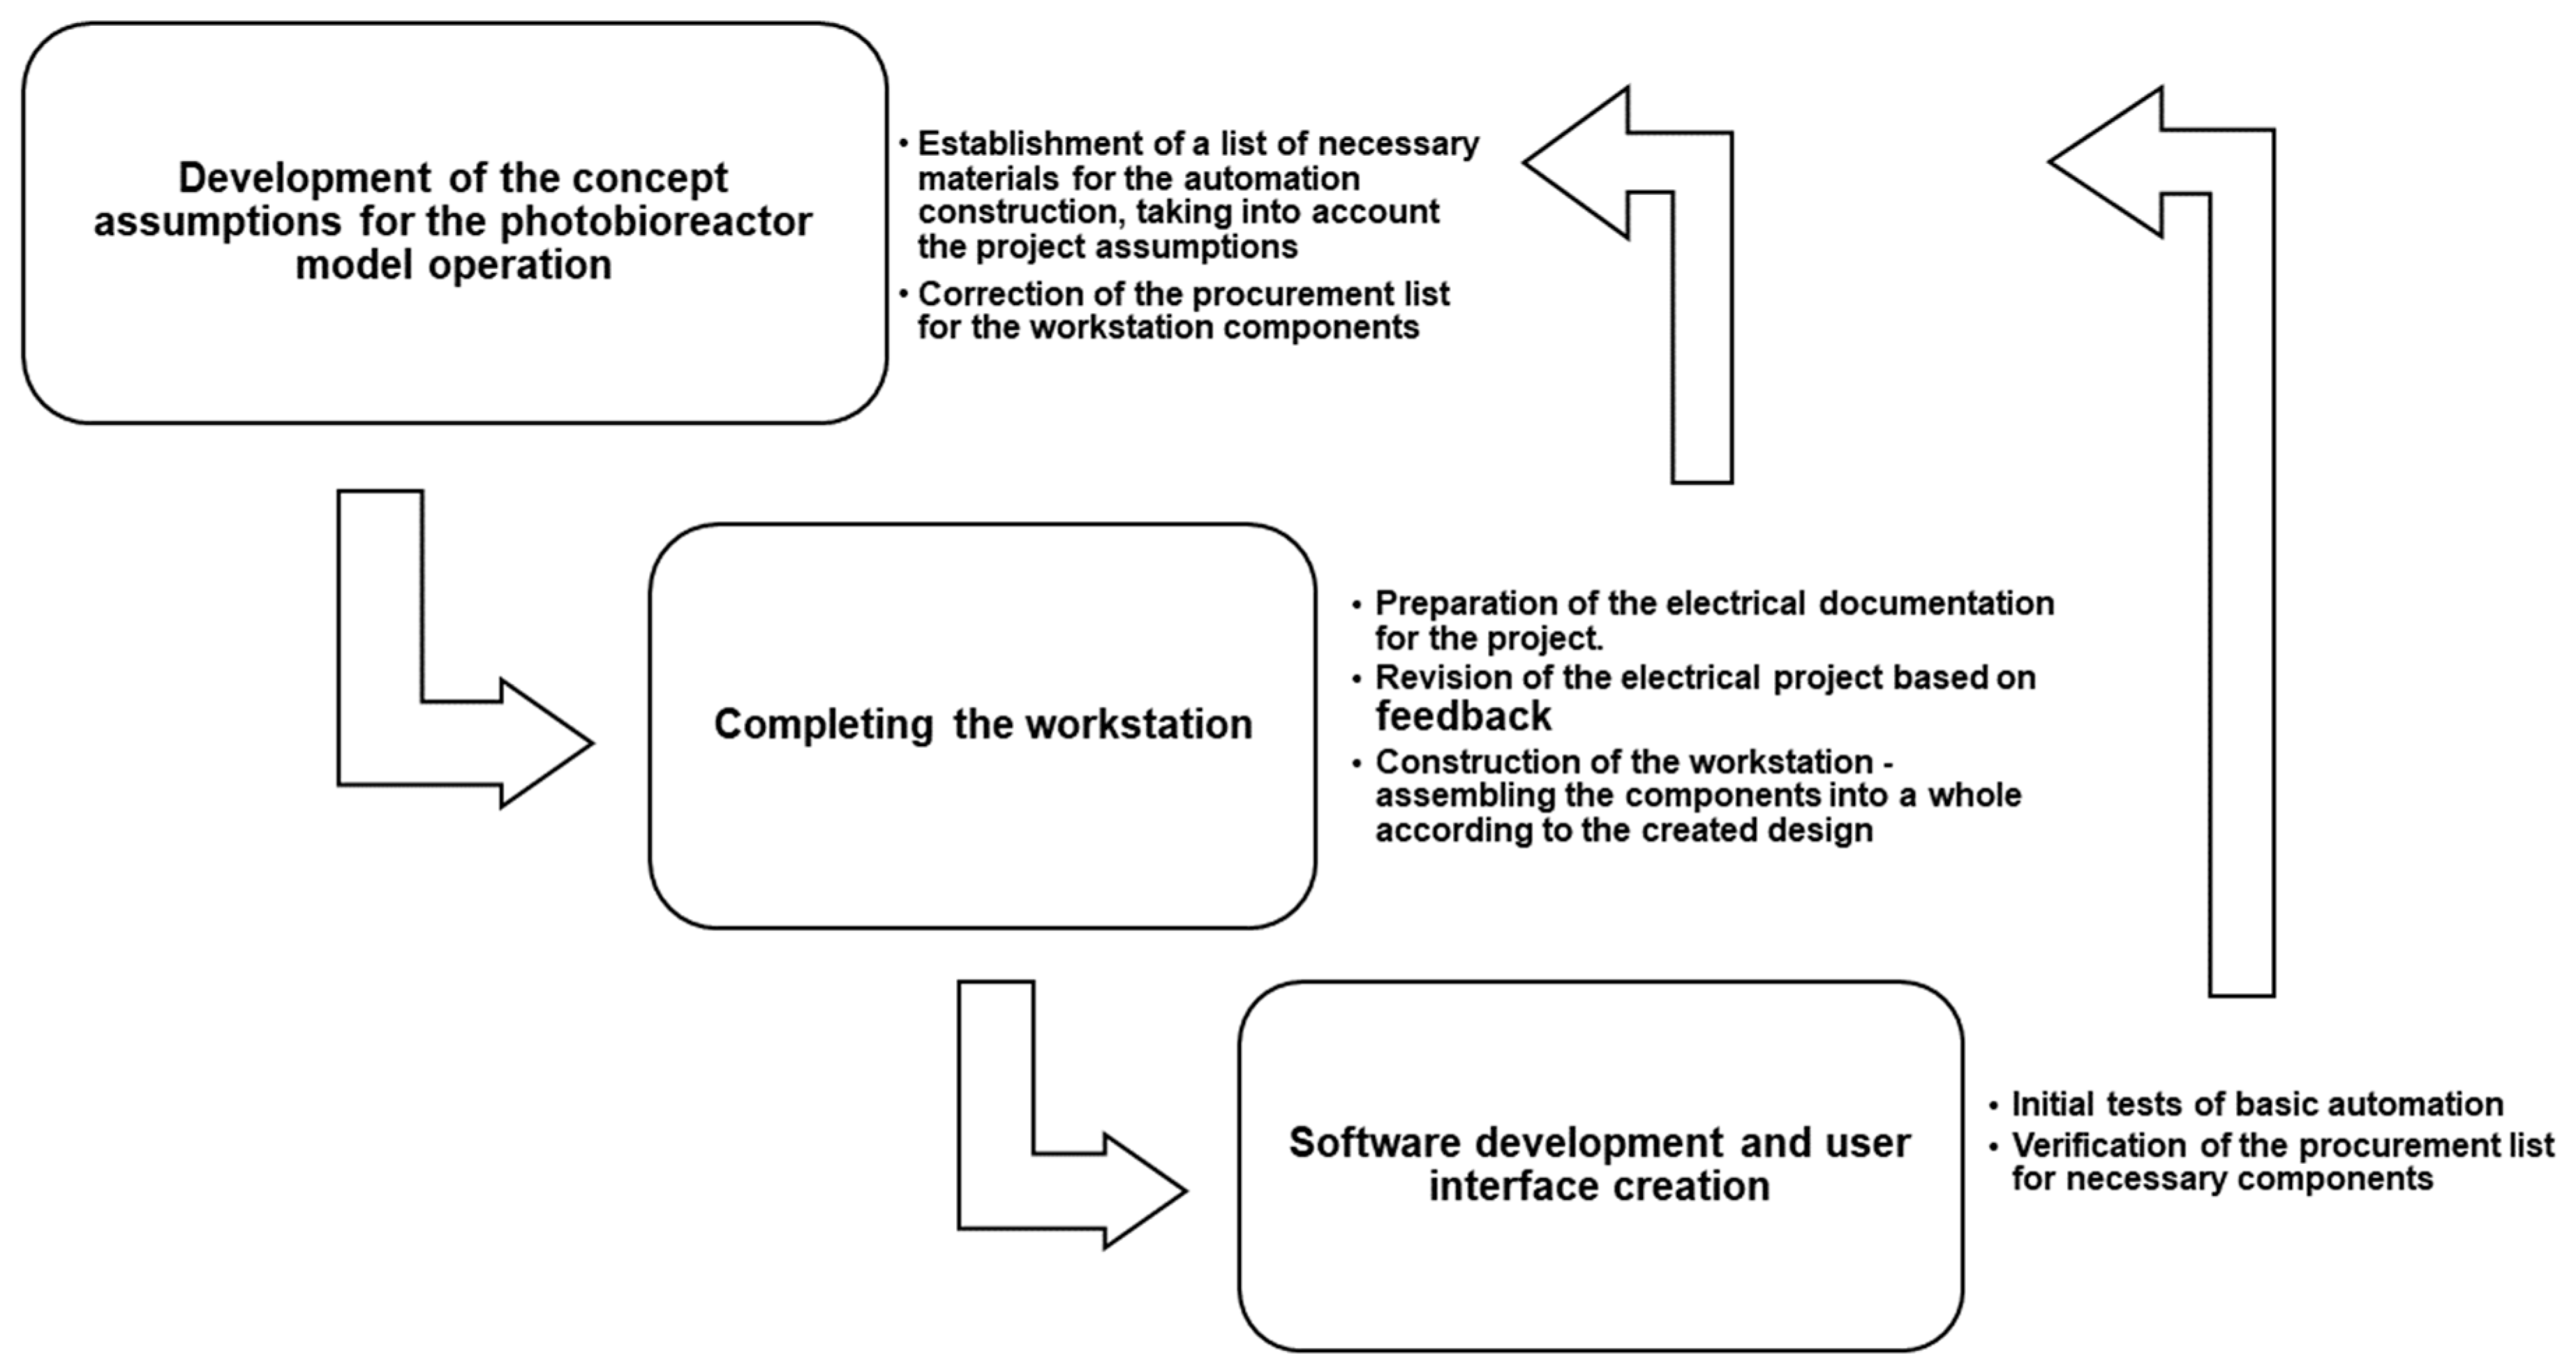
:1. Introduction
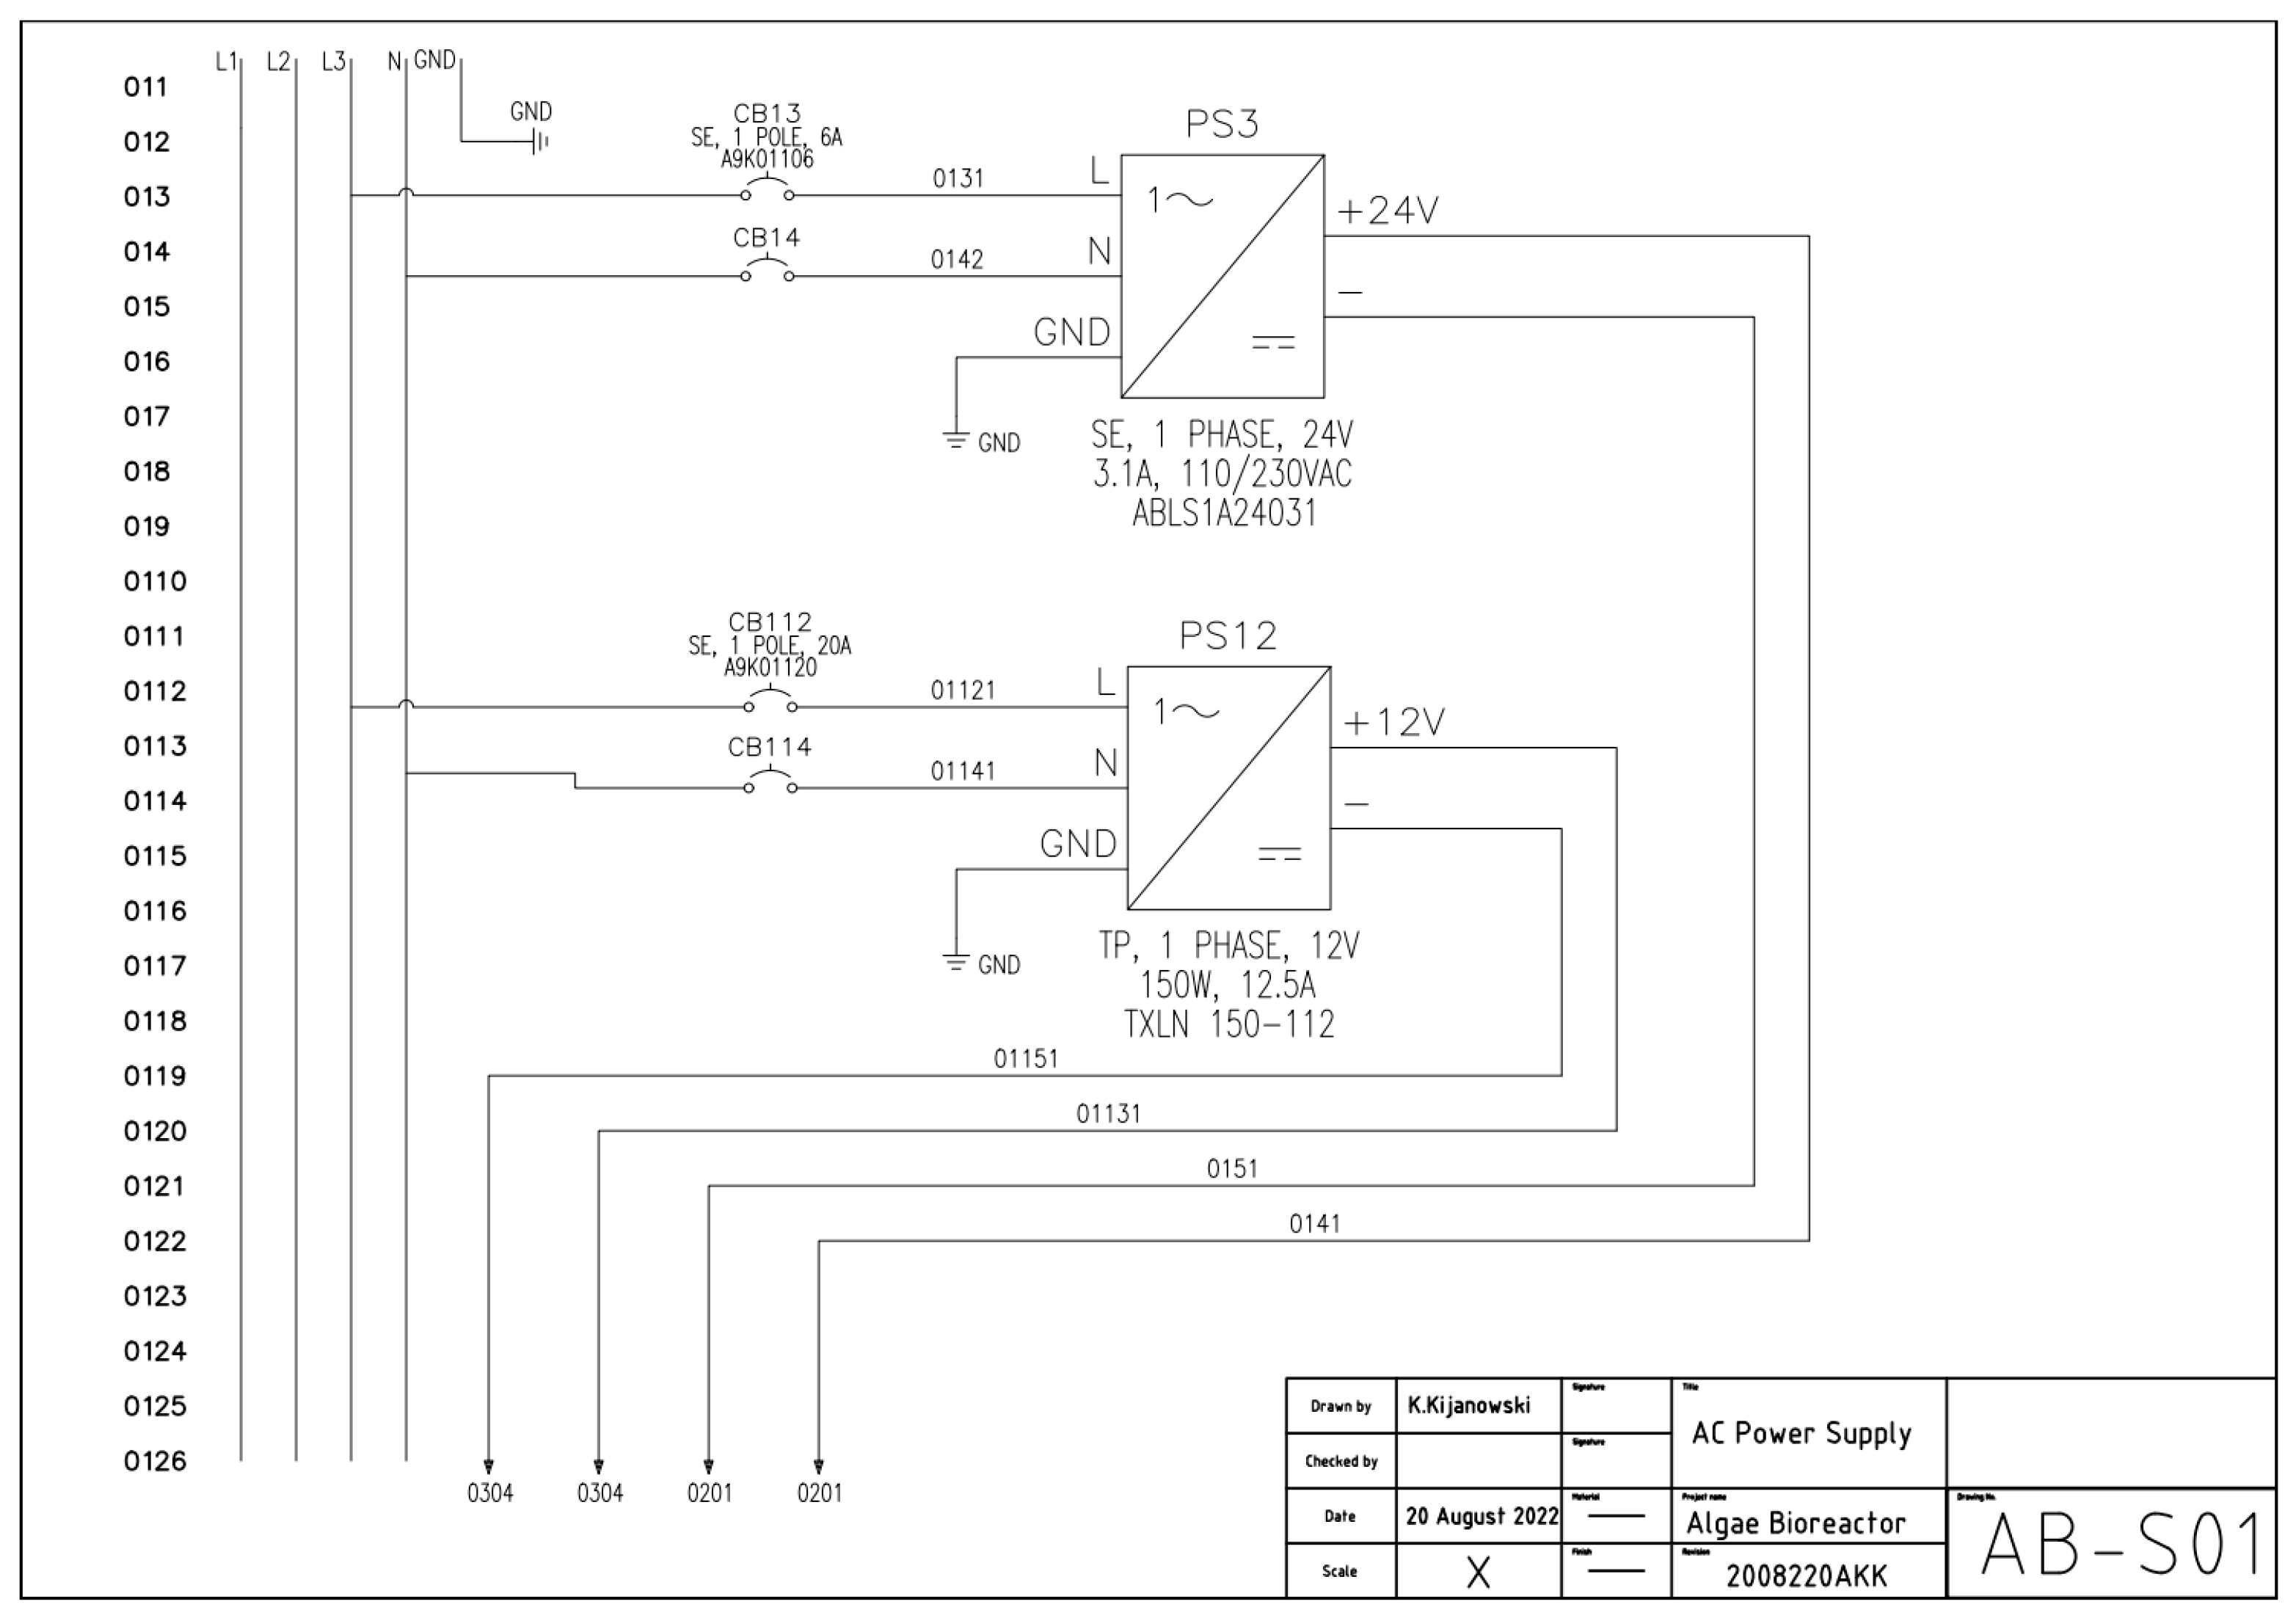
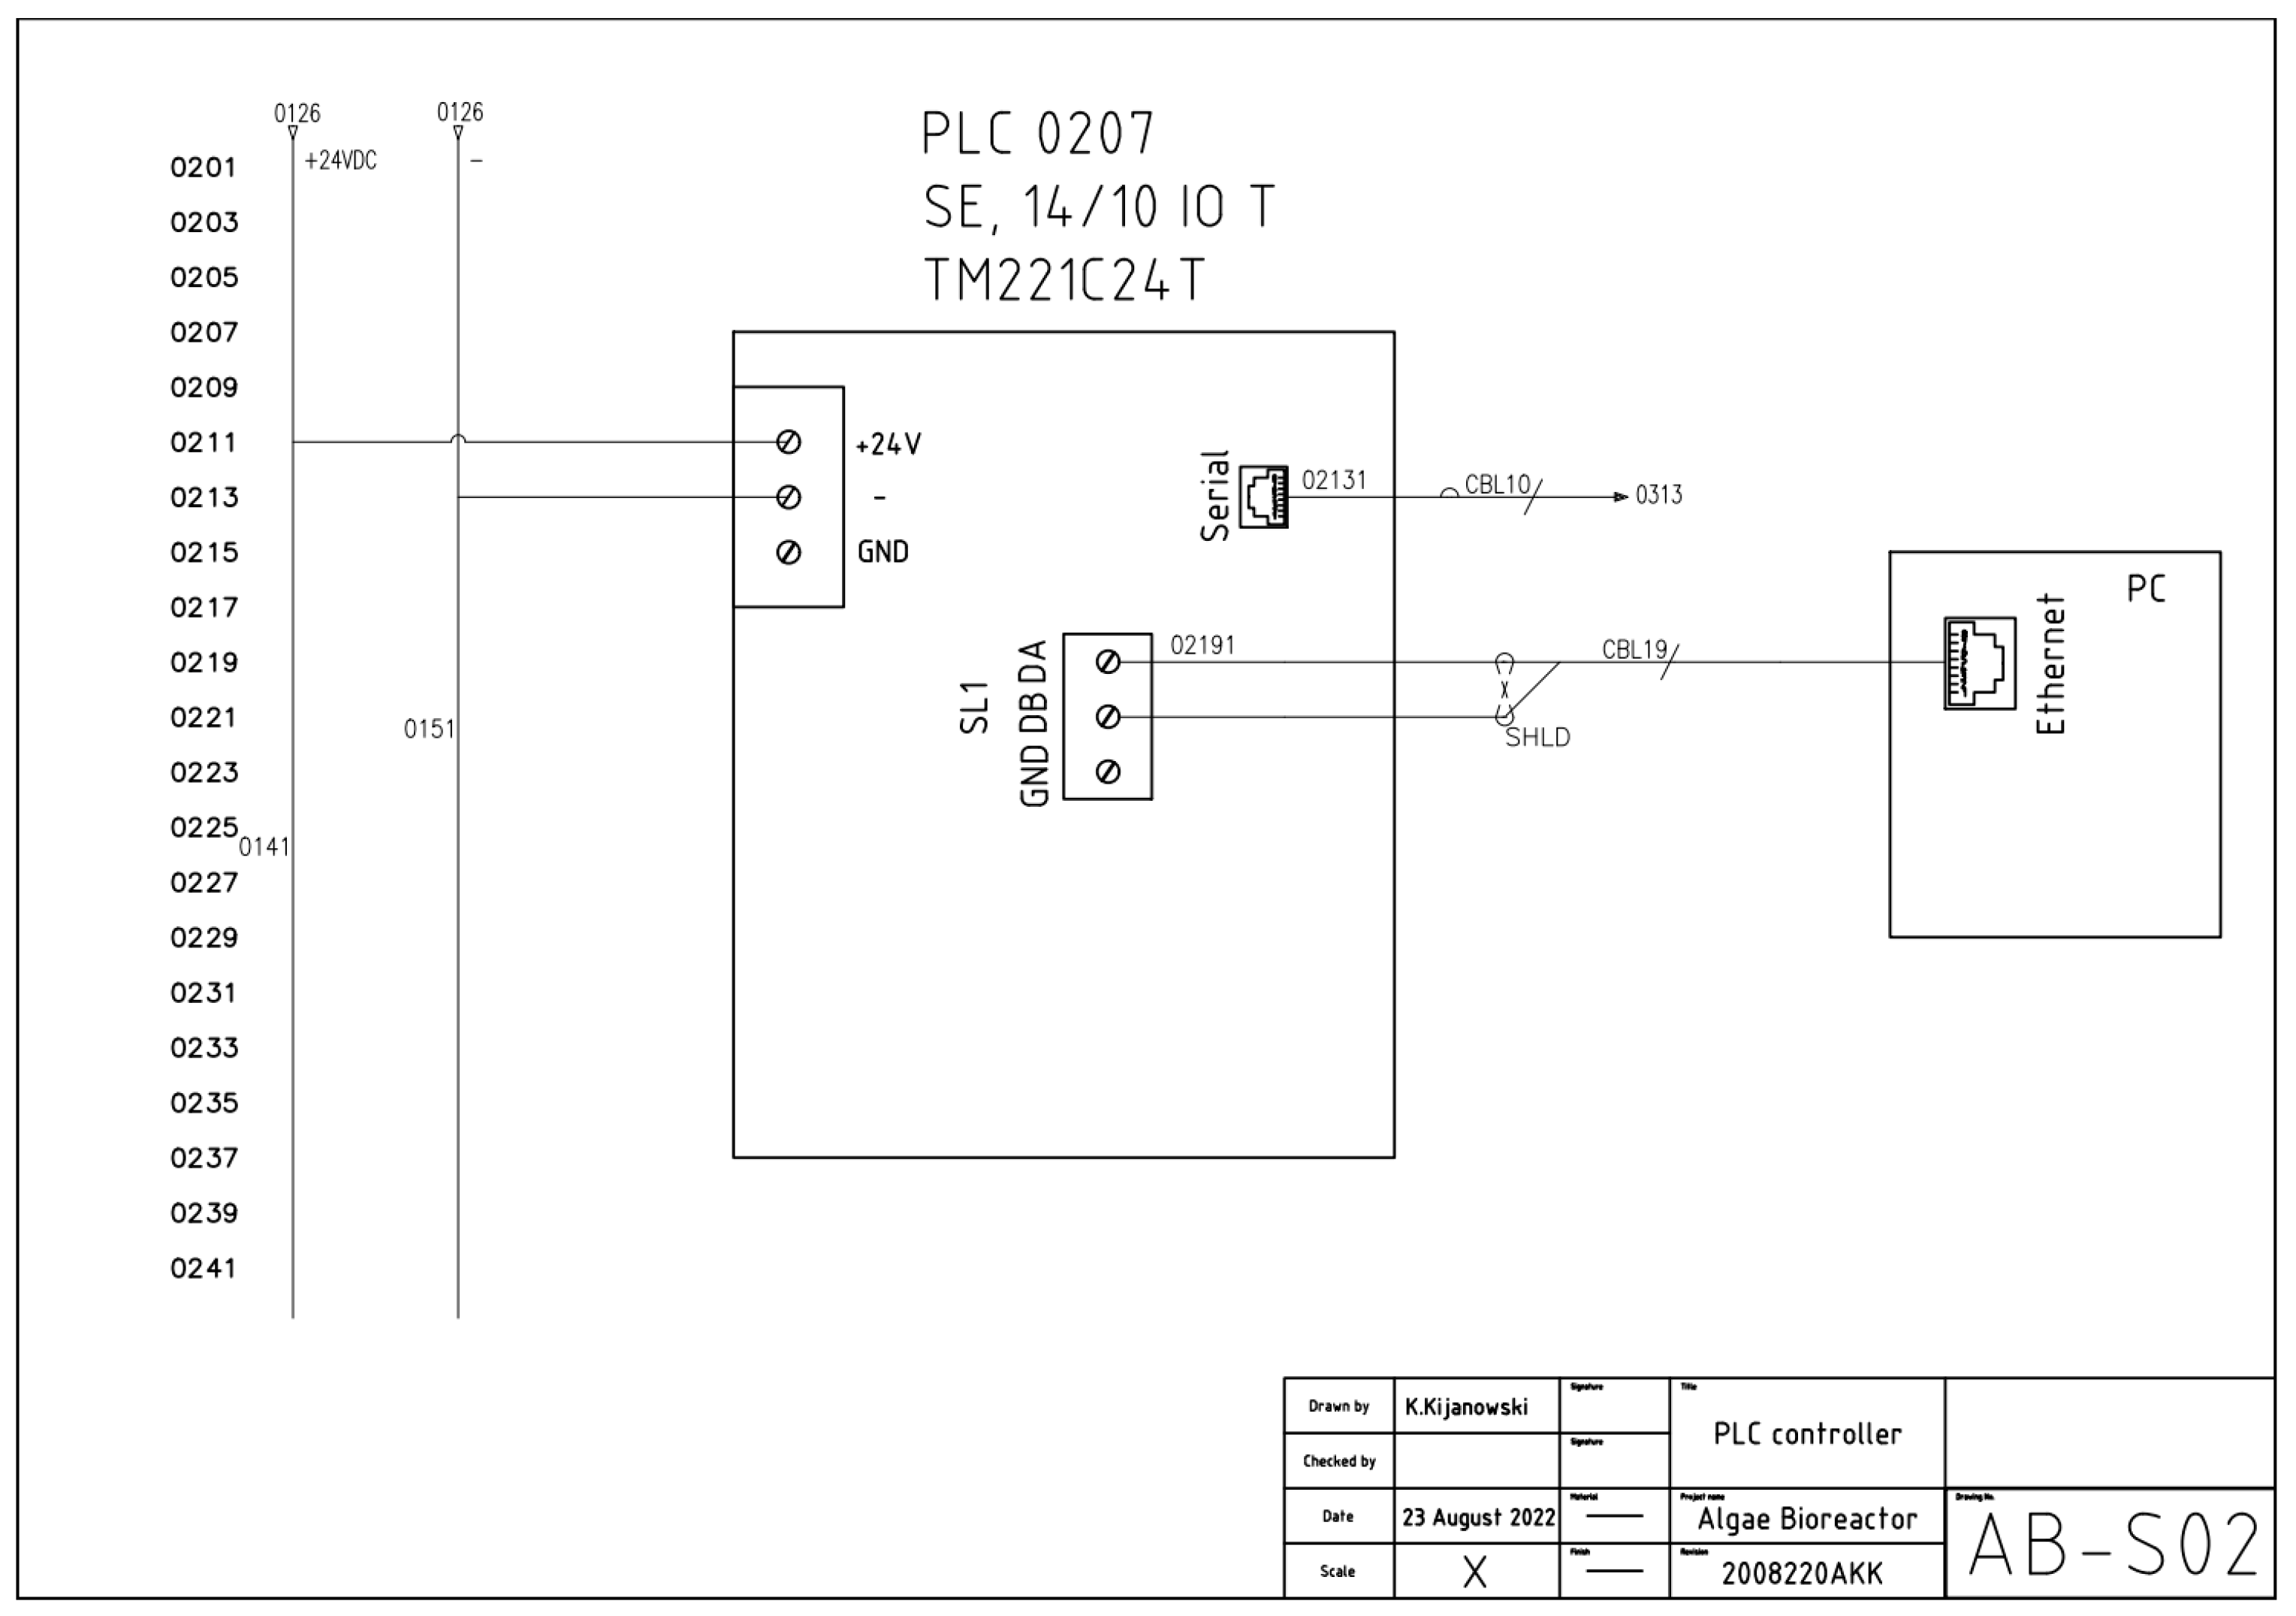
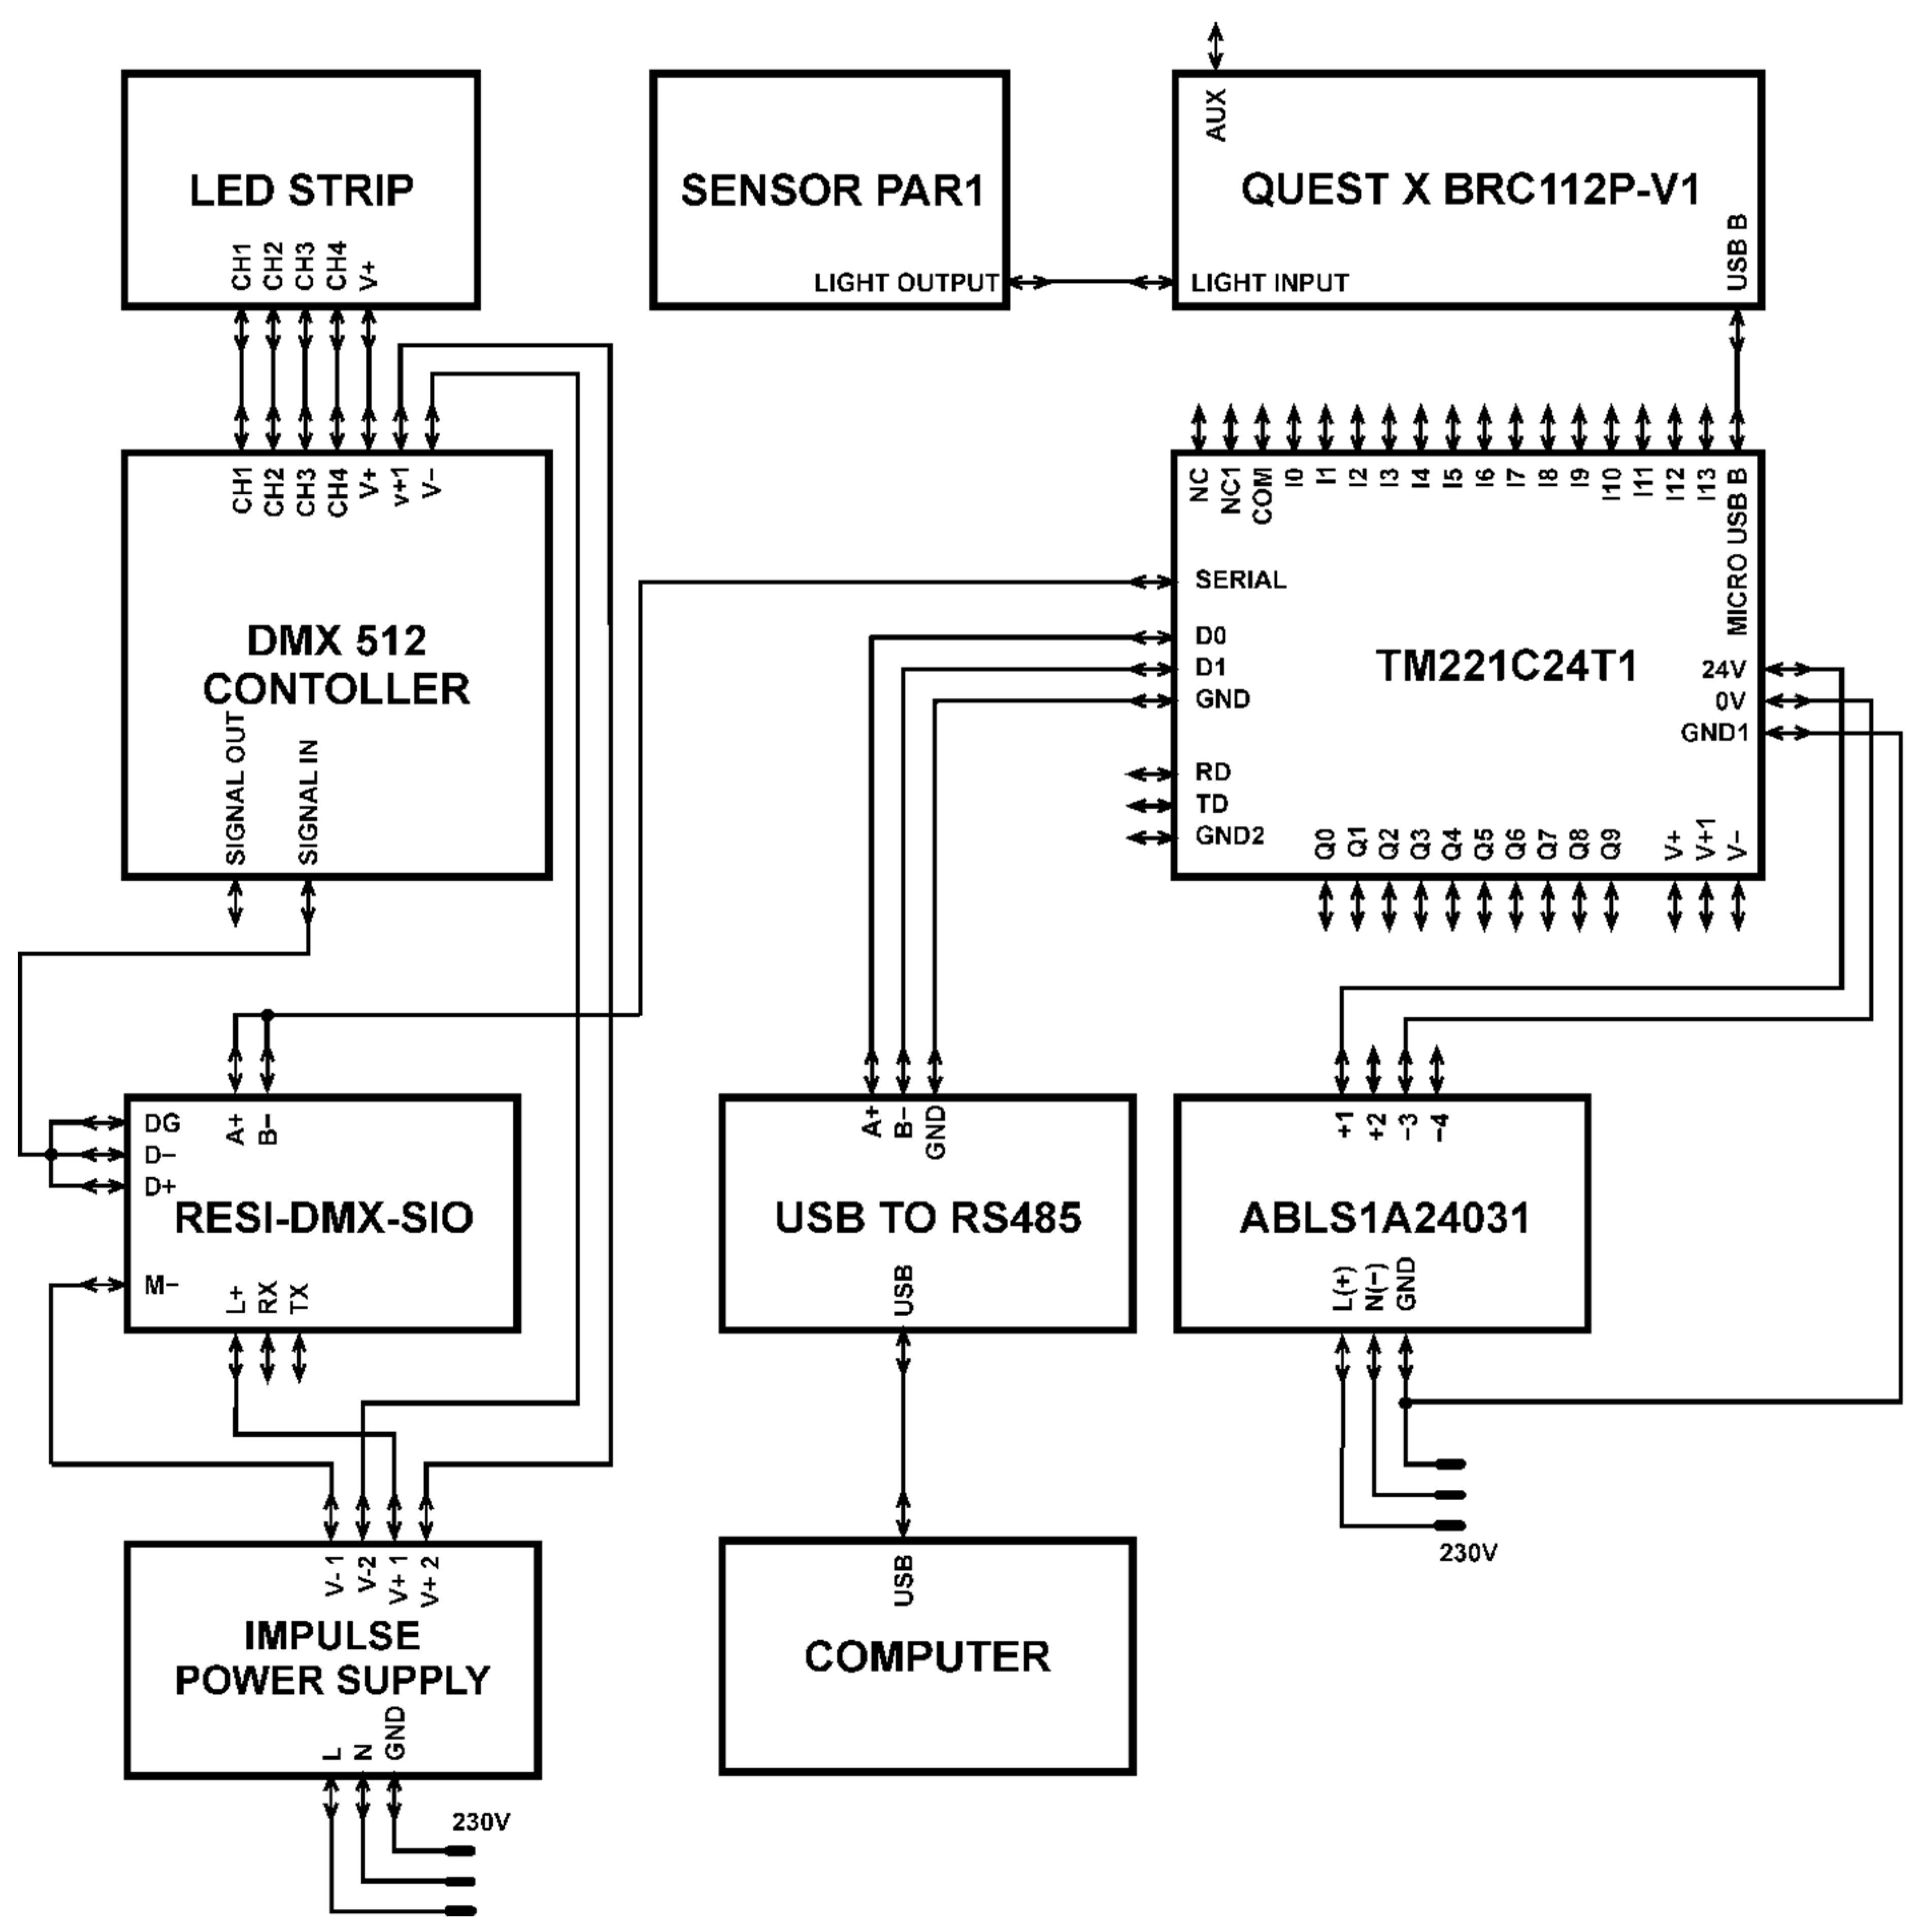
2. Electrical Documentation
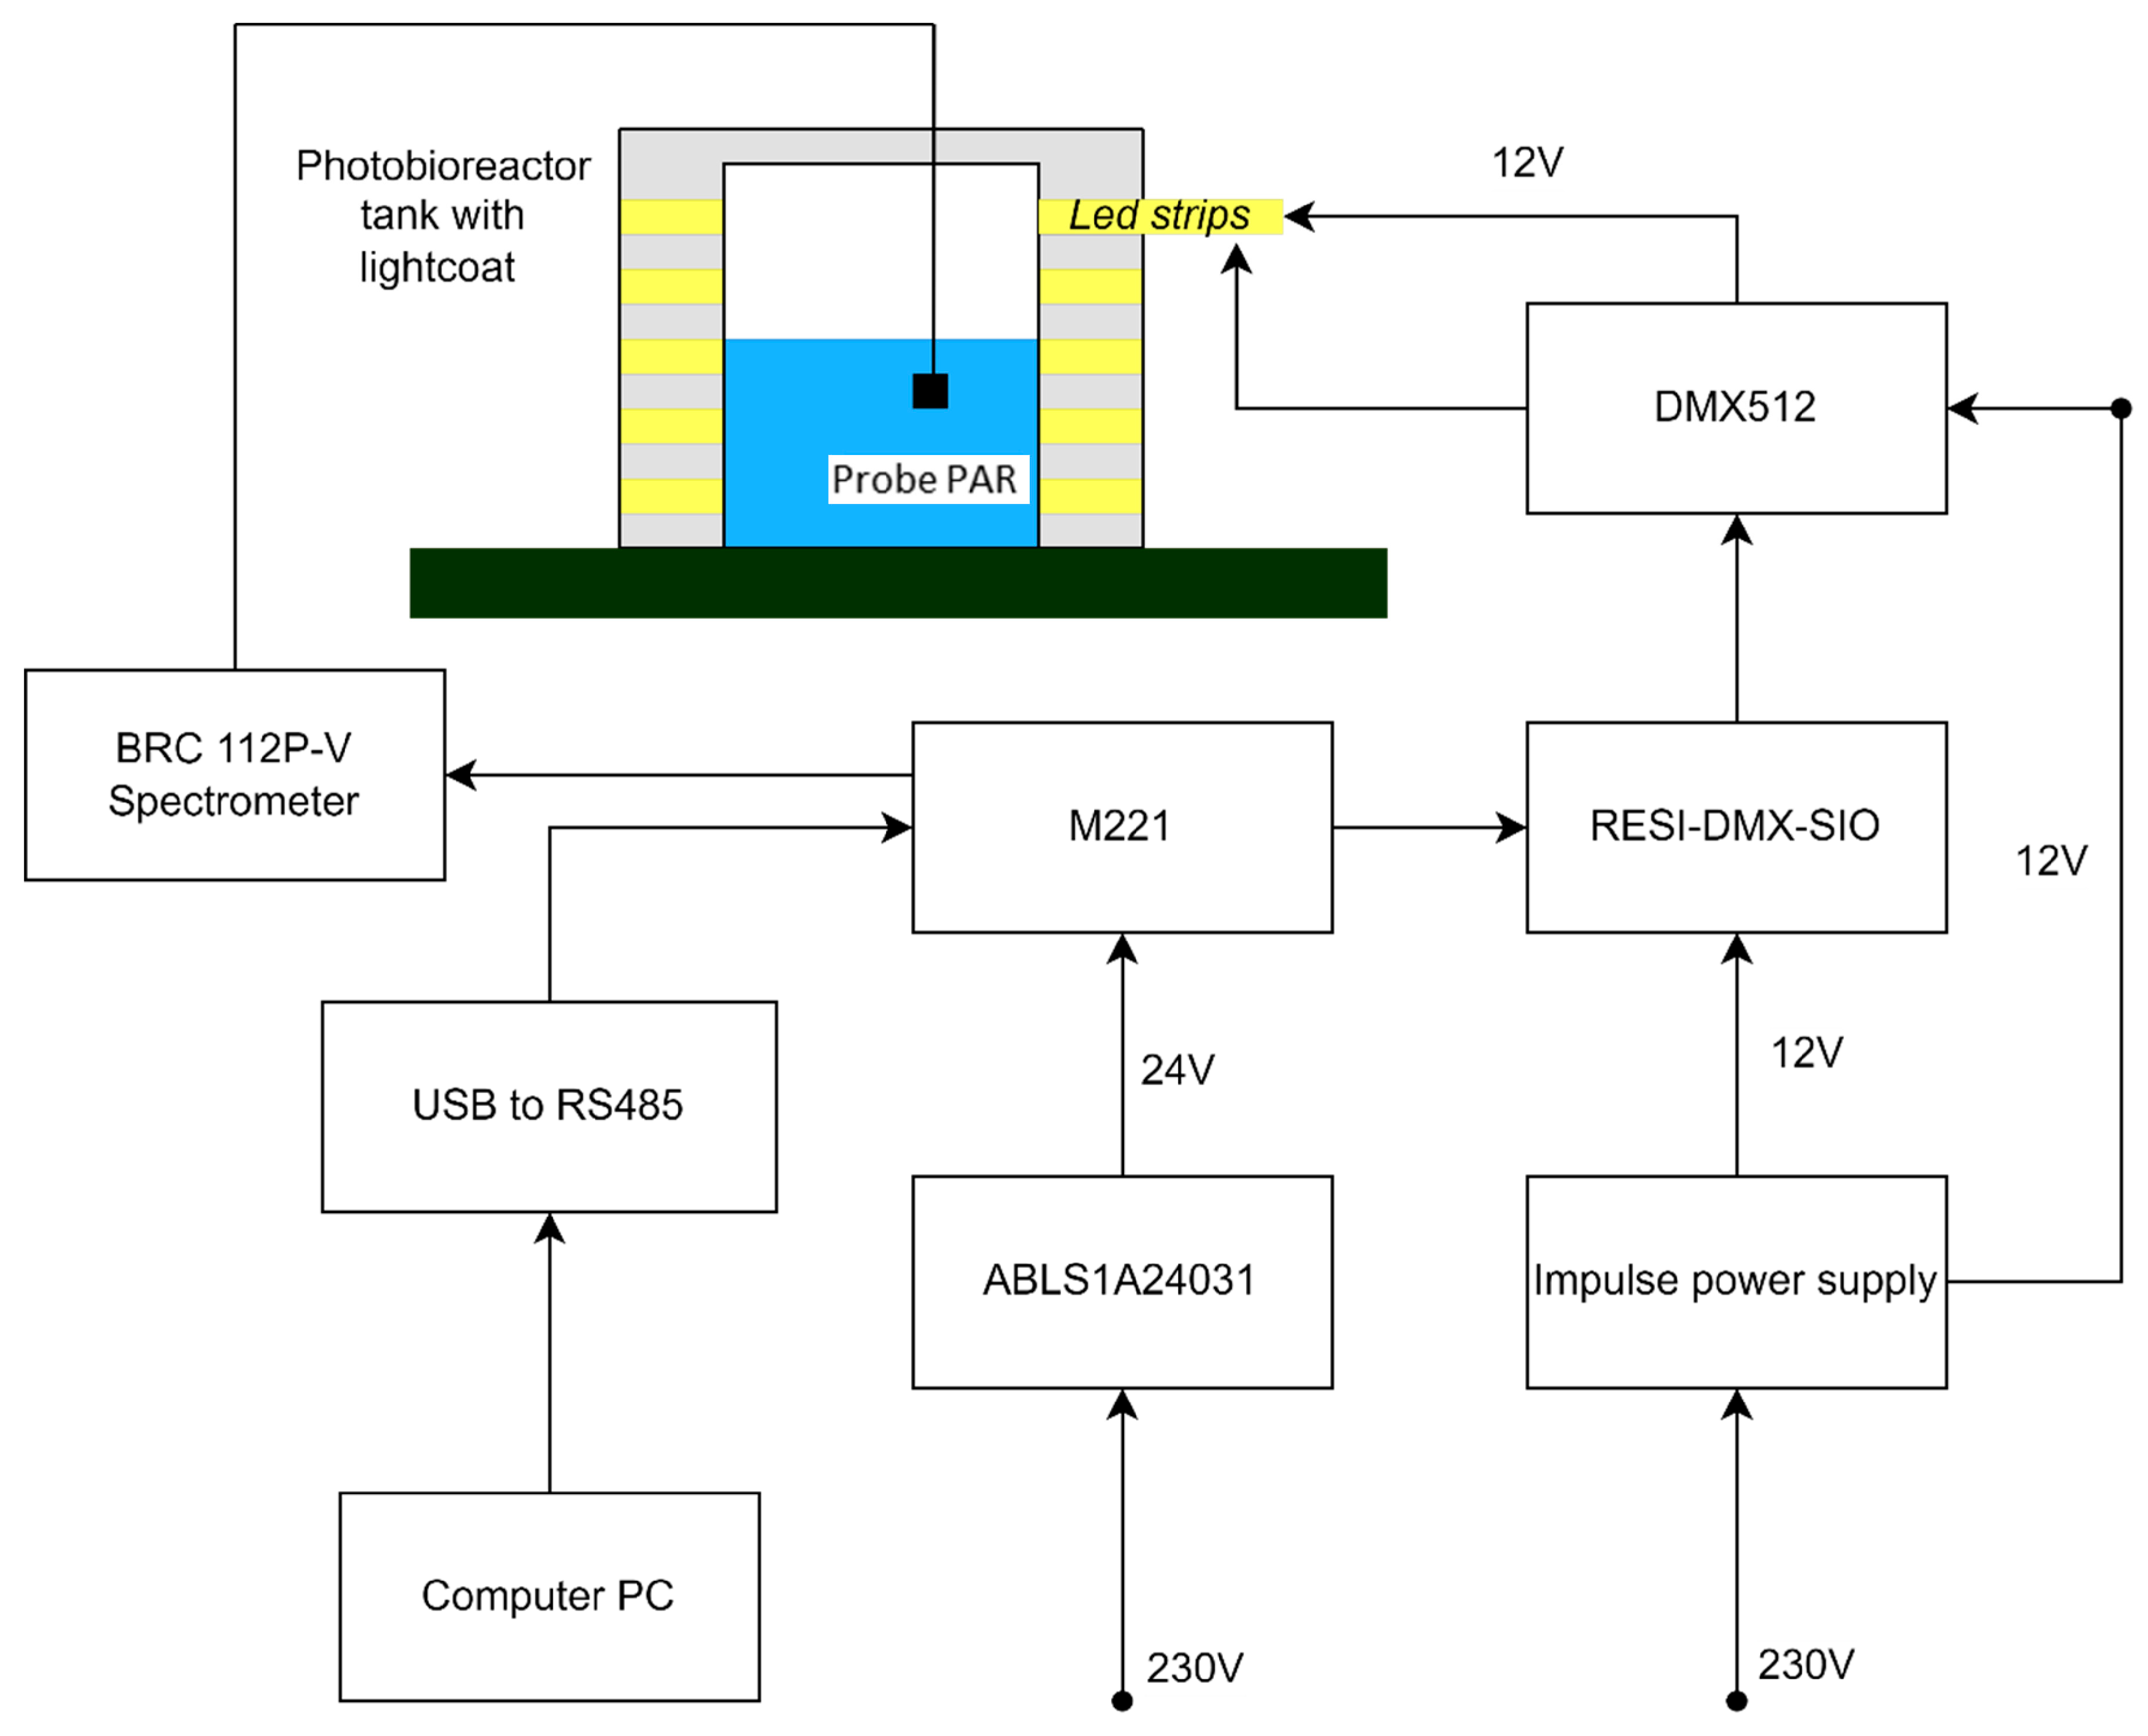
3. Automation
4. Elements of the Lighting System
5. The Results of the Pilot Works
6. Conclusions
Author Contributions
Funding
Data Availability Statement
Conflicts of Interest
Acronyms and Abbreviations
| PAR | Photosynthetically active radiation |
| PPFD | Photosynthetic Photon Flux Density |
| DLI | Daily Light Integral |
| PLC | Programmable Logic Controller |
| DMX | Digital Multiplex is a communication protocol that allows for precise control of individual parameters of light sources, such as brightness, colour, or special effects. |
| EcoStruxure™ Machine Expert | Basic software for programming the Modicon M221 logic controller—modular controller. |
| Tape LED RGBW SMD 5050 | Lighting Emitting Diode, SMD Surface Mount Technology LED—denotes the installation variant of the type diode LED. |
| RTU | Remote Terminal Unit |
| LD | Ladder Diagram |
| LI | Instruction List |
| GRAFCET | Graphic language—a functional diagram showing the operation of the system step by step, detailing the conditions that must be met for the system to be at a given stage (fr. Graphe Fonctionnel de Commande des Étapes et Transitions). |
| EcoStruxure Machine Expert | Basic engineering design platform for machine automation systems. |
| SCADA | Supervisory Control And Data Acquisition—IT system supervising the technological or production process. The system enables the collection of data from devices and machines, their analysis, and visualization over time. |
| Modbus | Communication protocol is used to communicate with programmable controllers Daisy Chain—a computer network topology in which devices are connected one after the other in a single line to form a chain; in electrical and electronic engineering many devices are connected to each other in sequence or in a ring. |
| Norm IEC61131 | Programmable Logic Controllers—INTERNATIONAL STANDARD IEC 61131-3, Second edition 2003-01—an international standard that specifies standards for programmable logic controllers (PLC). |
References
- Jin, J.; Dupré, C.; Legrand, J.; Grizeau, D. Extracellular hydrocarbon and intracellular lipid accumulation are related to nutrient-sufficient conditions in pH-controlled chemostat cultures of the microalga Botryococcus braunii SAG 30.81. Algal Res. 2016, 17, 244–252. [Google Scholar] [CrossRef]
- Sharma, J.; Kumar, S.S.; Bishnoi, N.R.; Pugazhendhi, A. Enhancement of lipid production from algal biomass through various growth parameters. J. Mol. Liq. 2018, 269, 712–720. [Google Scholar] [CrossRef]
- Mathimani, T.; Beena Nair, B.; Ranjith Kumar, R. Evaluation of microalga for biodiesel using lipid and fatty acid as a marker—A central composite design approach. J. Energy Inst. 2016, 89, 436–446. [Google Scholar] [CrossRef]
- He, P.J.; Mao, B.; Shen, C.M.; Shao, L.M.; Lee, D.J.; Chang, J.S. Cultivation of Chlorella vulgaris on wastewater containing high levels of ammonia for biodiesel production. Bioresour. Technol. 2013, 129, 177–181. [Google Scholar] [CrossRef]
- Pancha, I.; Chokshi, K.; Maurya, R.; Trivedi, K. Salinity induced oxidative stress enhanced biofuel production potential of microalgae Scenedesmus sp. CCNM 1077. Bioresour. Technol. 2015, 189, 341–348. [Google Scholar] [CrossRef] [PubMed]
- Damiani, M.C.; Popovich, C.A.; Constenla, D.; Leonardi, P.I. Lipid analysis in Haematococcus pluvialis to assess its potential use as a biodiesel feedstock. Bioresour. Technol. 2010, 99, 3389–3396. [Google Scholar] [CrossRef]
- Ratomski, P.; Hawrot-Paw, M.; Koniuszy, A.; Golimowski, W.; Kwaśnica, A.; Marcinkowski, D. Indicators of Engine Performance Powered by a Biofuel Blend Produced from Microalgal Biomass: A Step towards the Decarbonization of Transport. Energies 2023, 16, 5376. [Google Scholar] [CrossRef]
- Alfonsín, V.; Maceiras, R.; Gutiérrez, C. Bioethanol production from industrial algae waste. Waste Manag. 2019, 87, 791–797. [Google Scholar] [CrossRef] [PubMed]
- Da Rosa, M.D.H.; Alves, C.J.; dos Santos, F.N.; de Souza, A.O.; Zavareze, E.d.R.; Pinto, E.; Noseda, M.D.; Ramos, D.; de Pereira, C.M.P. Macroalgae and Microalgae Biomass as Feedstock for Products Applied to Bioenergy and Food Industry: A Brief Review. Energies 2023, 16, 1820. [Google Scholar] [CrossRef]
- Kesharvani, S.; Dwivedi, G.; Verma, T.N.; Verma, P. The Experimental Investigation of a Diesel Engine Using Ternary Blends of Algae Biodiesel, Ethanol and Diesel Fuels. Energies 2023, 16, 229. [Google Scholar] [CrossRef]
- Huerlimann, R.; de Nys, R.; Heimann, K. Growth, lipid content, productivity, and fatty acid composition of tropical microalgae for scale-up production. Biotechnol. Bioeng. 2010, 107, 245–257. [Google Scholar] [CrossRef] [PubMed]
- Hussain, F.; Shah, S.Z.; Ahmad, H.; Abubshait, S.A.; Abubshait, H.A.; Laref, A.; Manikandan, A.; Kusuma, H.S.; Iqbal, M. Microalgae an ecofriendly and sustainable wastewater treatment option: Biomass application in biofuel and bio-fertilizer production. A review. Renew. Sustain. Energy Rev. 2021, 137, 110603. [Google Scholar] [CrossRef]
- Alazaiza, M.Y.D.; Albahnasawi, A.; Al Maskari, T.; Abujazar, M.S.S.; Bashir, M.J.K.; Nassani, D.E.; Abu Amr, S.S. Biofuel Production Using Cultivated Algae: Technologies, Economics, and Its Environmental Impacts. Energies 2023, 16, 1316. [Google Scholar] [CrossRef]
- Kleiman, R.M.; Characklis, G.W.; Kern, J.D.; Gerlach, R. Characterizing weather-related biophysical and financial risks in algal biofuel production. Appl. Energy 2021, 294, 116960. [Google Scholar] [CrossRef]
- Vadiveloo, A.; Kosternik, N.R.; Cosgrove, J.J.; Parlevliet, D.; Gonzalez-Garcia, C.; Lubian, L.M. Phptosynthetic performanceof two Nannochloropsis spp. under different filtered light spectra. Algal Res. 2016, 19, 168–177. [Google Scholar] [CrossRef]
- Anto, S.; Mukherjee, S.S.; Muthappa, R.; Mathimani, T.; Deviram, G.; Kumar, S.S.; Verma, T.N.; Pugazhendhi, A. Algae as Green Energy Reserve: Technological Outlook on Biofuel Production. Chemosphere 2020, 242, 125079. [Google Scholar] [CrossRef]
- Qiang, H.; Richmond, A. Productivity and photosynthetic efficiency of Spirulina platensis as affected by light intensity, algal density and rate of mixing in a flat plate photobioreactor. J. Appl. Phycol. 1996, 8, 139–145. [Google Scholar] [CrossRef]
- Dogaris, I.; Welch, M.; Meiser, A.; Walmsley, L.; Philippidis, G. A novel horizontal photobioreactor for high-density cultivation of microalgae. Bioresour. Technol 2015, 198, 316–324. [Google Scholar] [CrossRef]
- Singh, R.N.; Sharma, S. Development of Suitable Photobioreactor for Algae Production—A Review. Renew. Sustain. Energy Rev. 2012, 16, 2347–2353. [Google Scholar] [CrossRef]
- Jabłońska-Trypuć, A.; Wołejko, E.; Ernazarovna, M.D.; Głowacka, A.; Sokołowska, G.; Wydro, U. Using Algae for Biofuel Production: A Review. Energies 2023, 16, 1758. [Google Scholar] [CrossRef]
- Ullah, K.; Ahmad, M.; Sofia; Sharma, V.K.; Lu, P.; Harvey, A.; Zafar, M.; Sultana, S. Assessing the Potential of Algal Biomass Opportunities for Bioenergy Industry: Review. Fuel 2015, 143, 414–423. [Google Scholar] [CrossRef]
- Sukačová, K.; Lošák, P.; Brummer, V.; Máša, V.; Vícha, D.; Zavřel, T. Perspective Design of Algae Photobioreactor for Greenhouses—A Comparative Study. Energies 2021, 14, 1338. [Google Scholar] [CrossRef]
- Brzychczyk, B.; Hebda, T.; Pedryc, N. The Influence of Artificial Lighting Systems on the Cultivation of Algae: The Example of Chlorella vulgaris. Energies 2020, 13, 5994. [Google Scholar] [CrossRef]
- Brzychczyk, B.; Hebda, T.; Fitas, J.; Giełżecki, J. The Follow-up Photobioreactor Illumination System for the Cultivation of Photosynthetic Microorganisms. Energies 2020, 13, 1143. [Google Scholar] [CrossRef]
- Zhang, Y.; Bao, K.; Wang, J.; Chao, Y.; Hu, C. Performance of mixed LED light wavelengths on nutrient removal and biogas upgrading by different microalgal-based treatment technologies. Energy 2017, 130, 392–401. [Google Scholar] [CrossRef]
- Hosseini, N.S.; Shang, H.; Scott, J.A. Optimization of microalgae-sourced lipids production for biodiesel in a top-lit gas-lift bioreactor using response surface methodology. Energy 2018, 146, 47–56. [Google Scholar] [CrossRef]
- Nwoba, E.G.; Parlevliet, D.A.; Laird, D.W.; Alameh, K.; Moheimani, N.R. Light management technologies for increasing algal photobioreactor efficiency. Algal Res. 2019, 39, 101433. [Google Scholar] [CrossRef]
- Schnurr, P.J.; Espie, G.S.; Allen, G.D. The effect of photon flux density on algal biofilm growth and internal fatty acid concentrations. Algal Res. 2016, 16, 349–356. [Google Scholar] [CrossRef]
- Kumar, A.; Ergas, S.; Yuan, X.; Sahu, A.; Zhang, Q.; Dewulf, J.; Malcata, F.X.; van Langenhove, H. Enhanced CO2 fixation and biofuel production via microalgae: Recent developments and future directions. Trends Biotechnol. 2010, 28, 371–380. [Google Scholar] [CrossRef]
- Chisti, Y. Biodiesel from microalgae. Biotechnol. Adv. 2007, 25, 294–306. [Google Scholar] [CrossRef]
- Wei, L.; Huang, X.; Huang, Z. Temperature effects on lipid properties of microalgae Tetraselmis subcordiformis and Nannochloropsis oculata as biofuel resources. Chinese J. Oceanol. Limnol. 2014, 33, 99–106. [Google Scholar] [CrossRef]
- Solovchenko, A.E.; Khozin-Goldberg, I.; Didi-Cohen, S.; Cohen, Z.; Merzlyak, M.N. Effects of light intensity and nitrogen starvation on growth, total fatty acids and arachidonic acid in the green microalga Parietochloris incisa. J. Appl. Phycol. 2008, 20, 245–251. [Google Scholar] [CrossRef]
- Gim, G.H.; Ryu, J.; Kim, M.J.; Kim, P., II; Kim, S.W. Effects of carbon source and light intensity on the growth and total lipid production of three microalgae under different culture conditions. J. Ind. Microbiol. Biotechnol. 2016, 43, 605–616. [Google Scholar] [CrossRef]
- Cheirsilp, B.; Torpee, S. Enhanced growth and lipid production of microalgae under mixotrophic culture condition: Effect of light intensity, glucose concentration and fed-batch cultivation. Bioresour. Technol. 2012, 110, 510–516. [Google Scholar] [CrossRef]
- Liu, Z.Y.; Wang, G.C.; Zhou, B.C. Effect of iron on growth and lipid accumulation in Chlorella vulgaris. Bioresour. Technol. 2008, 99, 4717–4722. [Google Scholar] [CrossRef]
- Gordillo, F.J.L.; Goutx, M.; Figueroa, F.L.; Niell, F.X. Effects of light intensity, CO2 and nitrogen supply on lipid class composition of Dunaliella viridis. J. Appl. Phycol. 1998, 10, 135–144. [Google Scholar] [CrossRef]
- Iqbal, M.; Zafar, S.I. Effects of photon flux density, CO2, aeration rate, and inoculum density on growth and extracellular polysaccharide production by Porphyridium cruentum. Folia Microbiol. 1993, 38, 509–514. [Google Scholar] [CrossRef]
- Durairaj, B.; Muthu, S.; Xavier, T. Antimicrobial activity of Aspergillus niger synthesized titanium dioxide nanoparticles. Adv. Appl. Sci. Res. 2015, 6, 45–48. [Google Scholar]
- Chen, P.; Min, M.; Chen, Y.; Wang, L.; Li, Y.; Chen, Q.; Wang, C.; Wan, Y.; Wang, X.; Cheng, Y.; et al. Review of the biological and engineering aspects of algae to fuels approach. Int. J. Agric. Biol. Eng. 2009, 2, 64. [Google Scholar]
- Markou, G. Effect of Various Colors of Light-Emitting Diodes (LEDs) on the Biomass Composition of Arthrospira Platensis Cultivated in Semi-Continuous Mode. Appl. Biochem. Biotechnol. 2014, 172, 2758–2768. [Google Scholar] [CrossRef] [PubMed]
- McGee, D.; Archer, L.; Fleming, G.T.A.; Gillespie, E.; Touzet, N. Influence of Spectral Intensity and Quality of LED Lighting on Photoacclimation, Carbon Allocation and High-Value Pigments in Microalgae. Photosynth. Res. 2020, 143, 67–80. [Google Scholar] [CrossRef]
- Ho, S.-H.; Chan, M.-C.; Liu, C.-C.; Chen, C.-Y.; Lee, W.-L.; Lee, D.-J.; Chang, J.-S. Enhancing Lutein Productivity of an Indigenous Microalga Scenedesmus Obliquus FSP-3 Using Light-Related Strategies. Bioresour. Technol. 2014, 152, 275–282. [Google Scholar] [CrossRef] [PubMed]
- Singh, S.P.; Singh, P. Effect of temperature and light on growth of algae species: A review. Renevable Sustain. Energy Rev. 2015, 18, 431–444. [Google Scholar] [CrossRef]
- Patyna, A.; Witczak, S. Overview of photobioreactors for biodiesel production. Chemik 2016, 10, 634–643. [Google Scholar]
- Łaska, G.; Och, B. Microalgae as a Substrate for Biofuel Production. 2013. Available online: www.eko-dok.pl/2013/55.pdf (accessed on 13 February 2023).
- Mohler, D.T.; Wilson, M.H.; Fan, Z.; Groppo, J.G.; Crocker, M. Beneficial Reuse of Industrial CO2 Emissions Using a Microalgae Photobioreactor: Waste Heat Utilization Assessment. Energies 2019, 12, 2634. [Google Scholar] [CrossRef]
- Deme, M.; Garg, S.; Li, Y.; Narala, R.; Schenk, P.; Sharma, K.; Thomas-Hall, S. Comparison of Microalgae Cultivation in Photobioreactor, Open Raceway Pond, and a Two-Stage Hybrid System. Front. Energy Res. 2016, 4, 29. [Google Scholar]
- Available online: www.tme.eu/Document/411c552e8cee3b44c06a65d5c18c2386/HH-RGBWOK-5050GWA.pdf (accessed on 2 April 2023).
- Available online: https://www.tme.eu/Document/edc36e305377cbccff0054b95a5edd68/INB-MN-LED-PL.pdf (accessed on 19 July 2023).
- Available online: https://led-power.pl/en/kontrolery-dmx/348-kontroler-dekoder-dmx-512-rgb-288576w-12-24v.html (accessed on 17 October 2023).
- Available online: www.se.com/pl/pl/product/ABLS1A24031/phaseo-regulowany-zasilacz-impulsowy-100-240-v-ac-24v-3-1-a-1-fazowy-optimized/ (accessed on 7 January 2023).
- Available online: https://www.se.com/pl/pl/product/TMC2SL1/modicon-m221-kaseta-komunikacyjna-dodatkowe-%C5%82%C4%85cze-szeregowe-na-bloku-zacisk%C3%B3w-%C5%9Brubowych/ (accessed on 17 October 2023).
- Available online: https://www.se.com/ww/en/product/TMC2SL1/serial-line-cartridge-modicon-m221-1-communication-extension/ (accessed on 13 January 2023).
- ABLS1A24050—Phaseo, Regulowany Zasilacz Impulsowy, 100...240 V AC, 24V 5 A, 1 fazowy, Optimized|Schneider Electric Polska. Available online: https://www.se.com/pl/pl/product/ABLS1A24050/phaseo-regulowany-zasilacz-impulsowy-100-240-v-ac-24v-5-a-1-fazowy-optimized/ (accessed on 19 July 2023).
- Available online: https://https://www.dpstele.com/modbus/rs485-rs232-protocol-data-flow.php (accessed on 17 October 2023).
- Available online: https://https://www.apogeeinstruments.com/sq-522-ss-modbus-digital-output-full-spectrum-quantum-sensor/ (accessed on 17 October 2023).
- Gebäude Management Folder D10 (resi.cc). Available online: https://www.resi.cc/resipdfdocs/DDC/RESI-DS-RESI-T2-D10.pdf (accessed on 17 October 2023).
- RESI Data Sheets. Available online: https://help.resi.io/hc/en-us/articles/4412788142235-Encoder-Setup-and-Data-Sheets (accessed on 17 October 2023).
- INTERNATIONAL STANDARD IEC61131. Available online: https://d1.amobbs.com/bbs_upload782111/files_31/ourdev_569653.pdf (accessed on 17 October 2023).
- Available online: https://ewyszukiwarka.pue.uprp.gov.pl/search/pwp-details/P.429507?lng=en (accessed on 17 October 2023).


| Drawing/Photo | Information/Description | HH-SRGBW96F012W24-5050 RGBW |
|---|---|---|
 | Led tape | Combination of 5050 RBG + 5050 white colour in one strip |
| 12 mm wide strip-96 LEDs per meter | ||
| compatible with most controllers | ||
| input voltage 24 V CD | ||
| Maximum power 23 W·m−1 | ||
| Colour: | ||
| WW/NW (3000 K/4000 K/5000 K) | ||
| R (635 nm) G (515 nm) B (465 nm) | ||
| 4in1 (6000 K) | ||
| Efficiency WW/NW 68 lm·W−1 | ||
| 4in1 40 lm·W−1 | ||
| Brightness WW/NW 1564 lm | ||
| 4in1 920 lm | ||
| Length 5 m | ||
| Size 5000 mm.12 mm | ||
| IP65 protection class |
| Drawing/Photo | Information/Description | PWM-120-24 | |
|---|---|---|---|
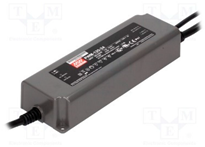 | Power supply for LEDs | PSU type | pulsed |
| Application | for LED strips | ||
| Power supply type | DC | ||
| Properties | PWM output; rated performance at full load | ||
| Tightness class | IP67 | ||
| Number of outputs | 1 | ||
| Electrical connection | wires 300 mm | ||
| Power consumption without load | <0.5 W | ||
| Drawing/Photo | Information/Description | Controller DMX 512 RGBW Decoder |
|---|---|---|
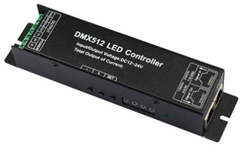 | DMX 512 LED controller | Controller Decoder DMX 512 RGBW 192 W/384 W 12–24 V |
| Support 512 independent channels | ||
| Support for RGBW Strips or other 12–24 V RGBW light sources | ||
| DMX 512 signal output input | ||
| RJ45 signal connection interface | ||
| Voltage supported: 12–24 V | ||
| Maximum power: 16 A (4 × 4 Amps) | ||
| Operating temperature: −20–60 °C | ||
| Dimensions (L/W/H): (177 × 42 × 33) mm | ||
| to the PWM signal to control the lighting. |
| Drawing/Photo | Information/Description | TM221C24T |
|---|---|---|
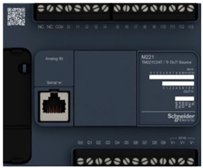 | PLC driver | TM221C24T (screw) 14 sink/source inputs, 10 transistor outputs (0.5 A), 2 logic inputs, 1 serial line port, 24 VDC power controller with removable terminal blocks: 5 V: 520 mA/24 V: 200 mA |
| Drawing/Photo | Information/Description | TMC2SL1 |
|---|---|---|
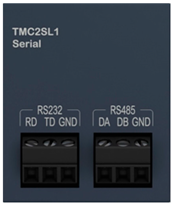 | Modicon M221 serial insert | TMC2 cassette with 1 serial line (RS 232 or RS 485) |
| Drawing/Photo | Information/Description | ABLS1A24031 |
|---|---|---|
 | Adjustable switching power supply for PLC | Adjustable switching mode rated input voltage 100 V to 240 V AC single phase 100 … 240 VAC 2 phase 140 … 340 VDC rated power 75 W output voltage 24 V DC power supply output current 3.13 A |
| Drawing/Photo | Information/Description | SQ-522-SS |
|---|---|---|
 | Immersion photosynthetically active PAR sensor | The SQ-522-SS model is based on the Modbus RTU communication protocol input voltage 5.5 V to 24 V DC average maximum current consumption RS 232 37 mA; RS 485 quiescent 37 mA, active 42 mA 180° field of view spectral range 389 nm to 692 ± 5 nm working environment −40 to 70 °C; 0% to 100% relative humidity; can be submerged in water to a depth of 30 m dimensions diameter 30.5 mm, height 37.0 mm 5 m shielded twisted pair cable; TPR jacket (high water resistance, high UV stability, flexibility at low temperatures); pigtail wires; stainless steel (316), M8 connector |
| Drawing/Photo | Information/Description | Serial IO ULTRA SLIM Module |
|---|---|---|
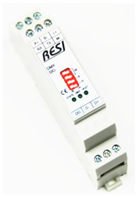 | Serial module for controlling the DMX-512 lighting system | dimensions: (17.5 × 90 × 58) mm protocols: MODBUS/RTU subprotocol simple ASCII text protocol baud rates: from 300 bd to 256,000 bd none/even/odd—parity one or two stop bits power supply: 12–48 V power consumption: 0.5 W |
Disclaimer/Publisher’s Note: The statements, opinions and data contained in all publications are solely those of the individual author(s) and contributor(s) and not of MDPI and/or the editor(s). MDPI and/or the editor(s) disclaim responsibility for any injury to people or property resulting from any ideas, methods, instructions or products referred to in the content. |
© 2023 by the authors. Licensee MDPI, Basel, Switzerland. This article is an open access article distributed under the terms and conditions of the Creative Commons Attribution (CC BY) license (https://creativecommons.org/licenses/by/4.0/).
Share and Cite
Brzychczyk, B.; Giełżecki, J.; Kijanowski, K.; Hebda, T.; Rzepka, F. Automation of the Photobioreactor Lighting System to Manage Light Distribution in Microalgae Cultures. Energies 2023, 16, 7183. https://doi.org/10.3390/en16207183
Brzychczyk B, Giełżecki J, Kijanowski K, Hebda T, Rzepka F. Automation of the Photobioreactor Lighting System to Manage Light Distribution in Microalgae Cultures. Energies. 2023; 16(20):7183. https://doi.org/10.3390/en16207183
Chicago/Turabian StyleBrzychczyk, Beata, Jan Giełżecki, Krzysztof Kijanowski, Tomasz Hebda, and Filip Rzepka. 2023. "Automation of the Photobioreactor Lighting System to Manage Light Distribution in Microalgae Cultures" Energies 16, no. 20: 7183. https://doi.org/10.3390/en16207183