Cycling Stability of Calcium-Impregnated Vermiculite in Open Reactor Used as a Thermochemical Storage Material


Abstract
:1. Introduction
2. Materials and Method
2.1. Salt in Matrix Preparation
2.2. Thermal Gravimetric Analysis
2.3. Calcium and Chloride Ion Analysis Using Ion Selective Electrode
2.4. Microscopy
2.5. Humidity Visualisation Analysis
2.6. Stability Testing
3. Results
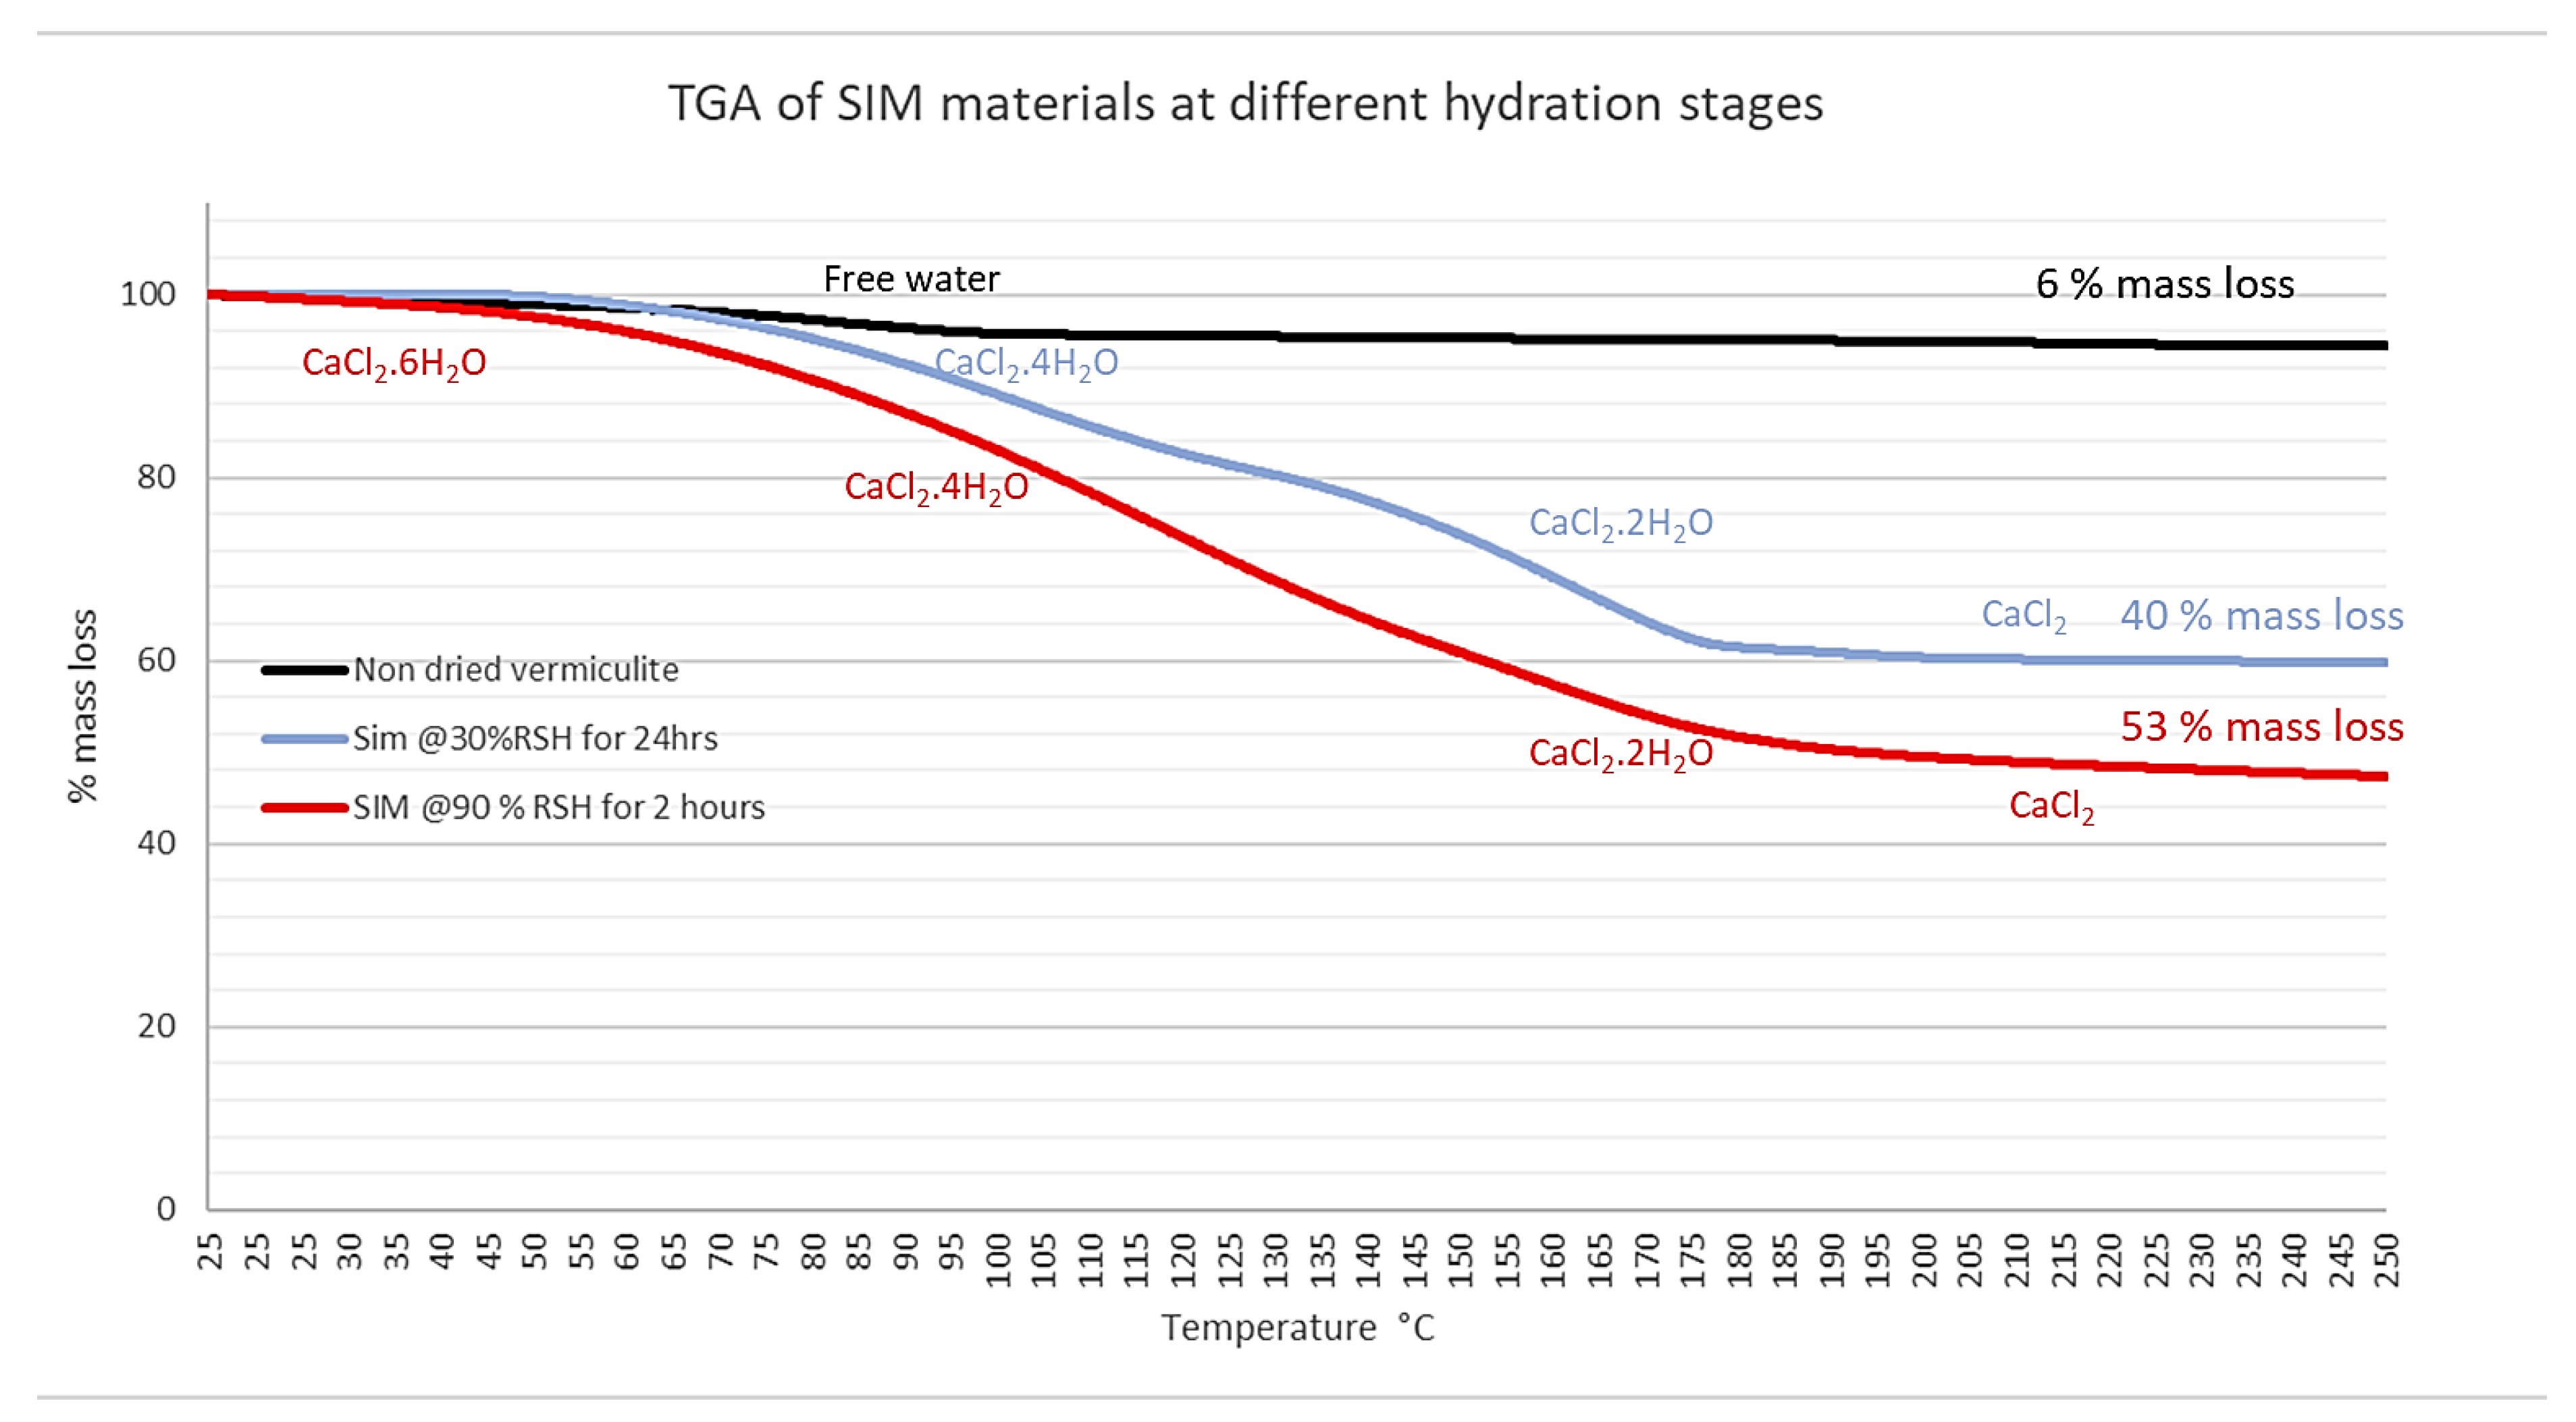
3.1. TGA Analysis
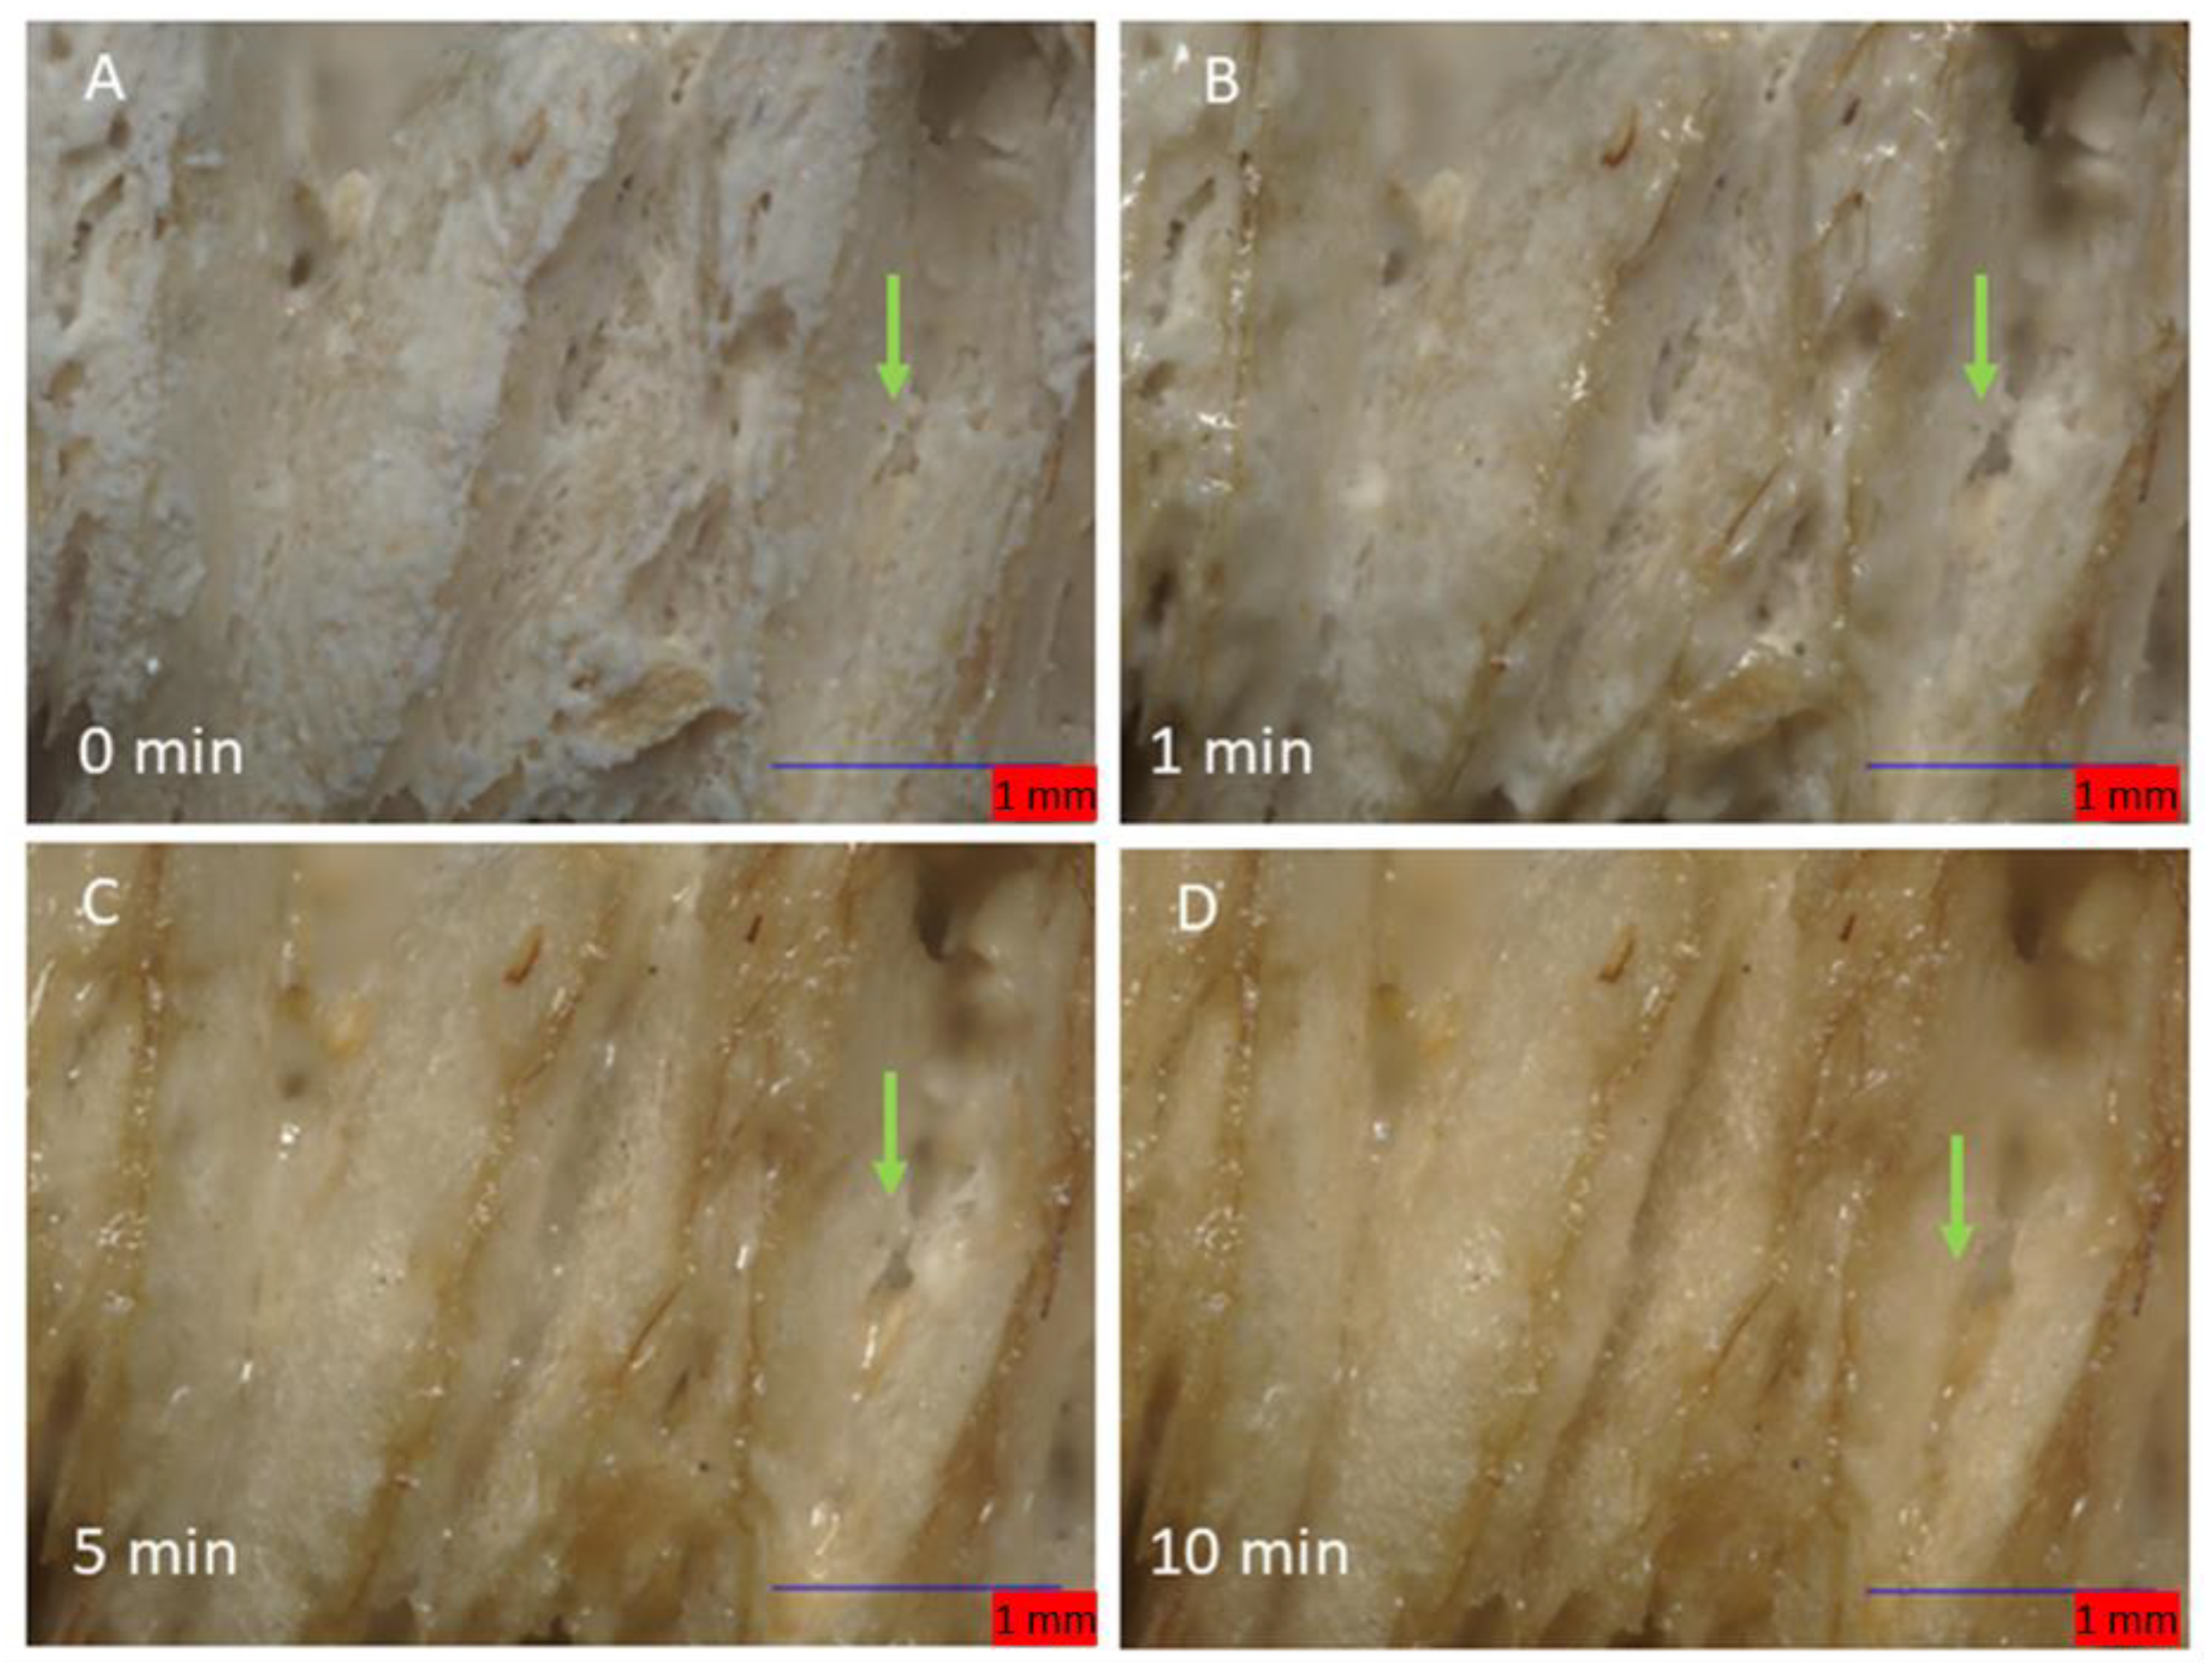
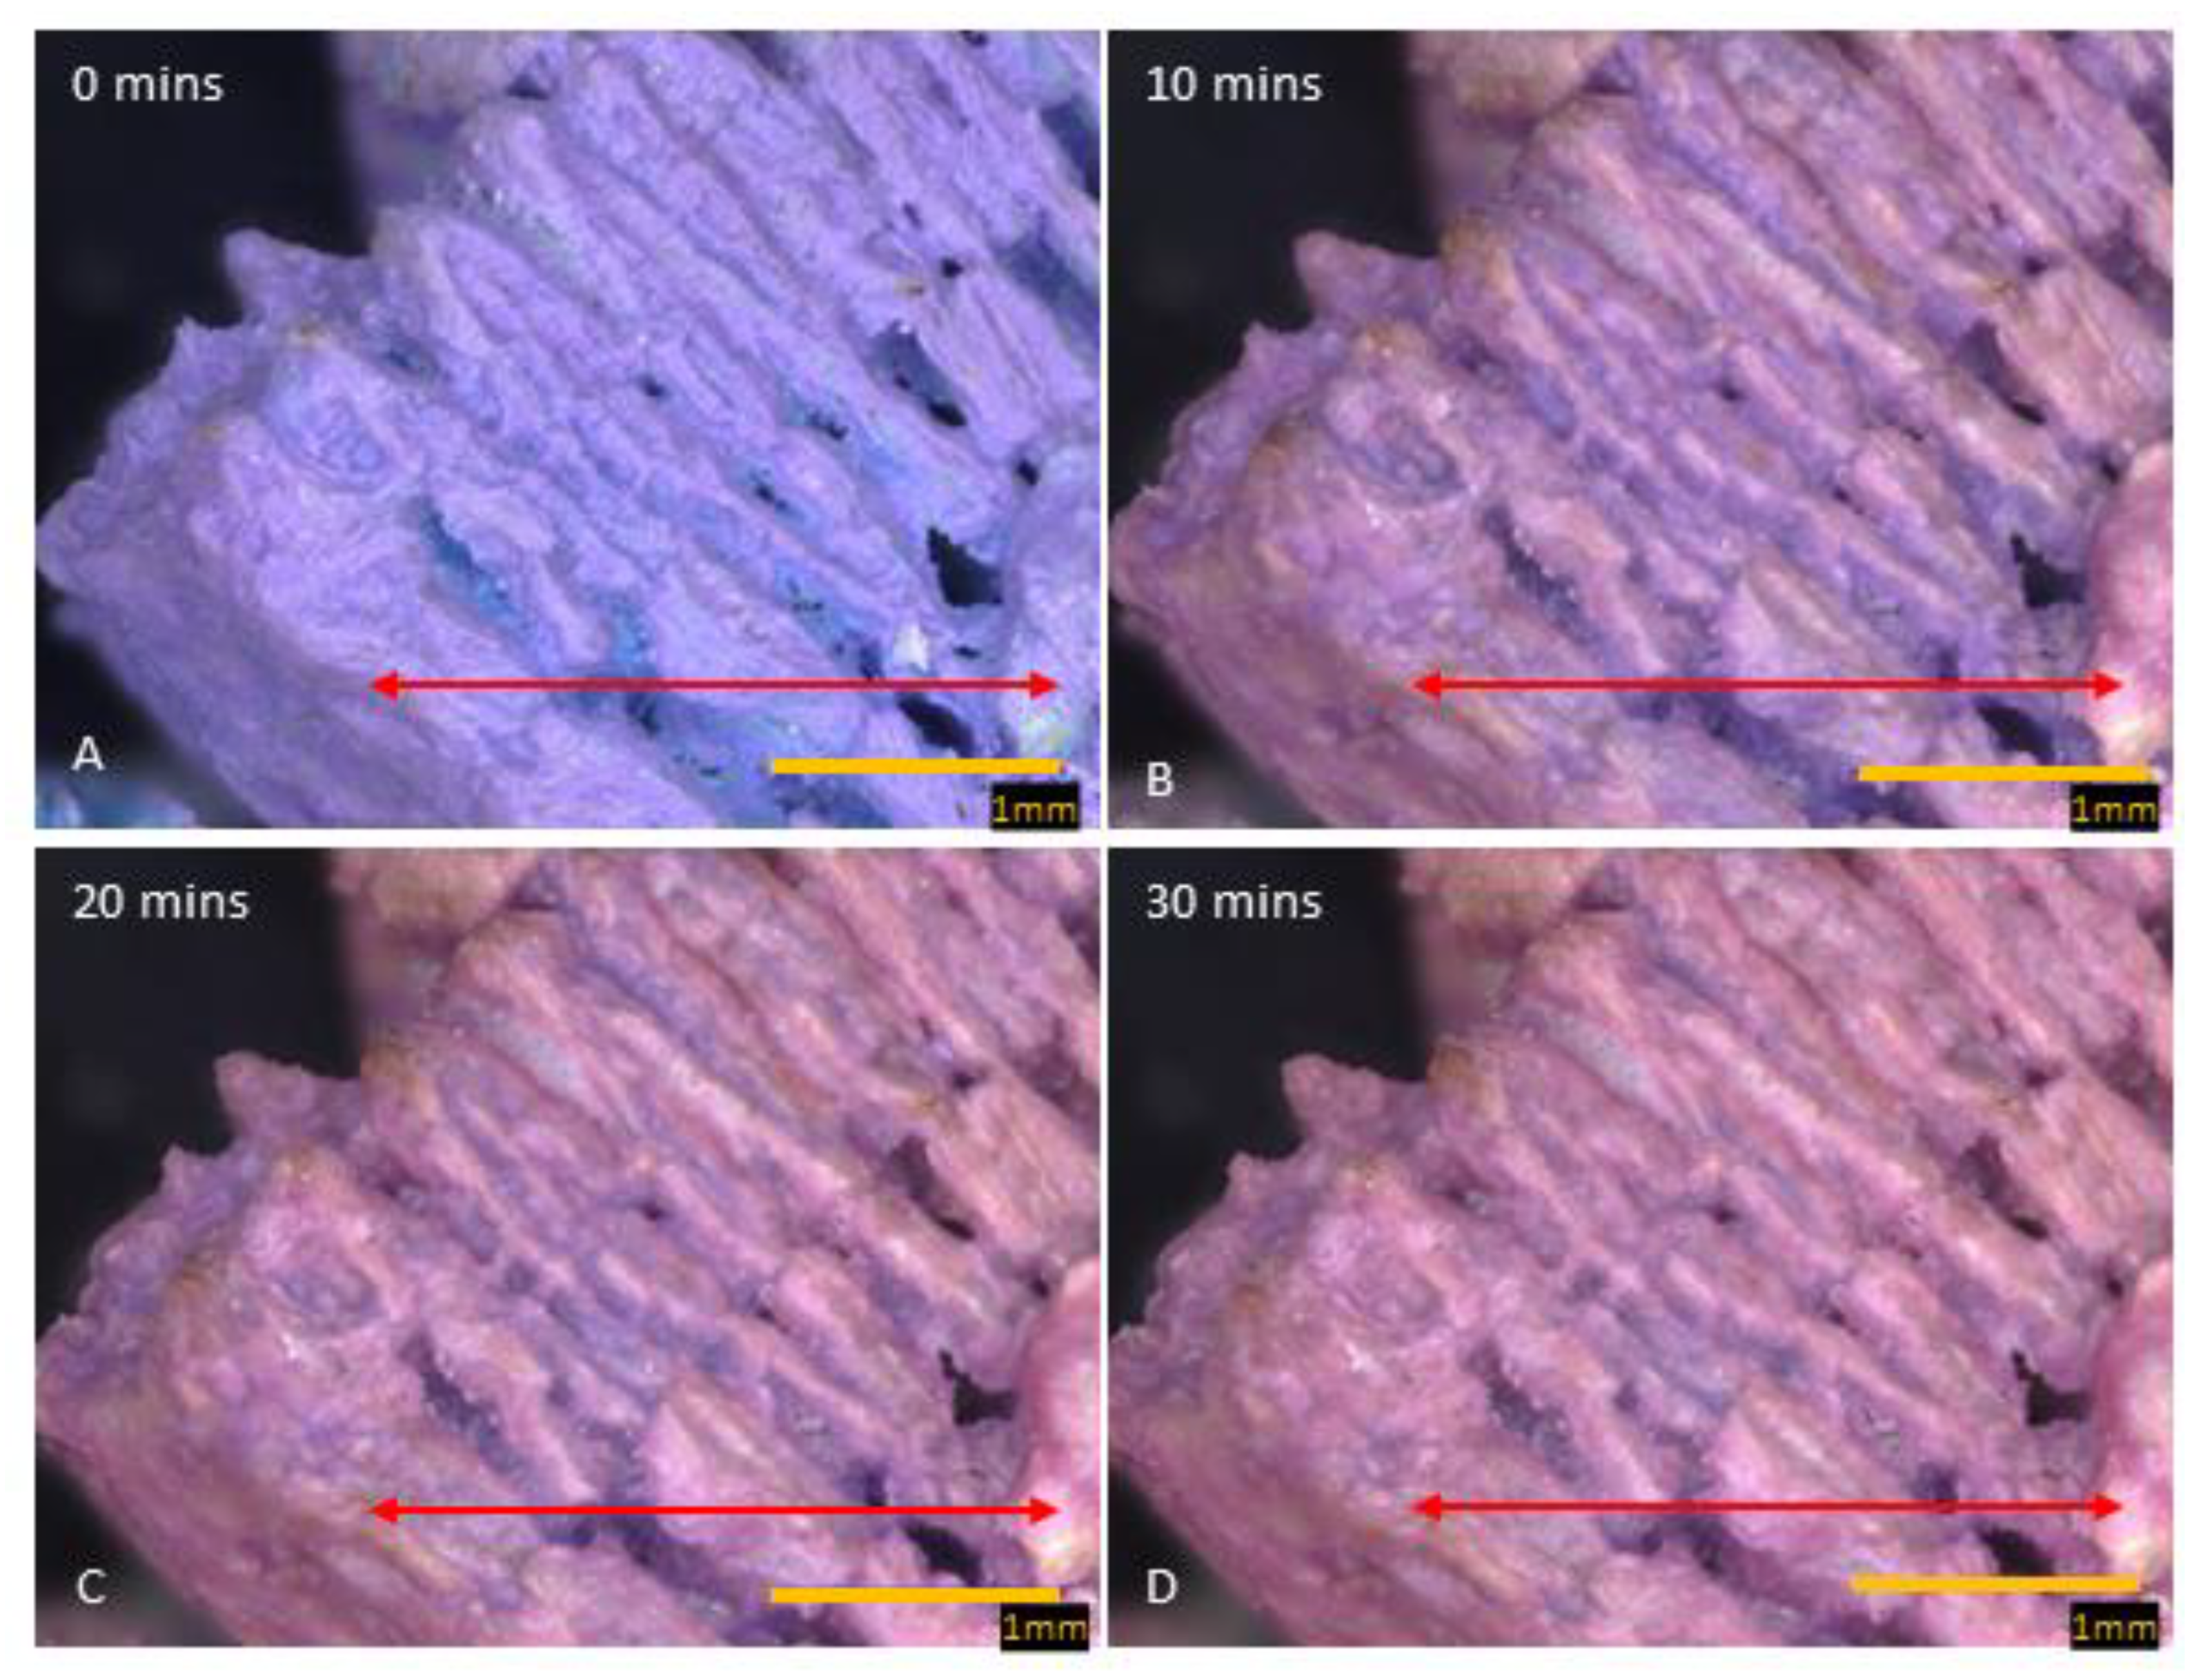
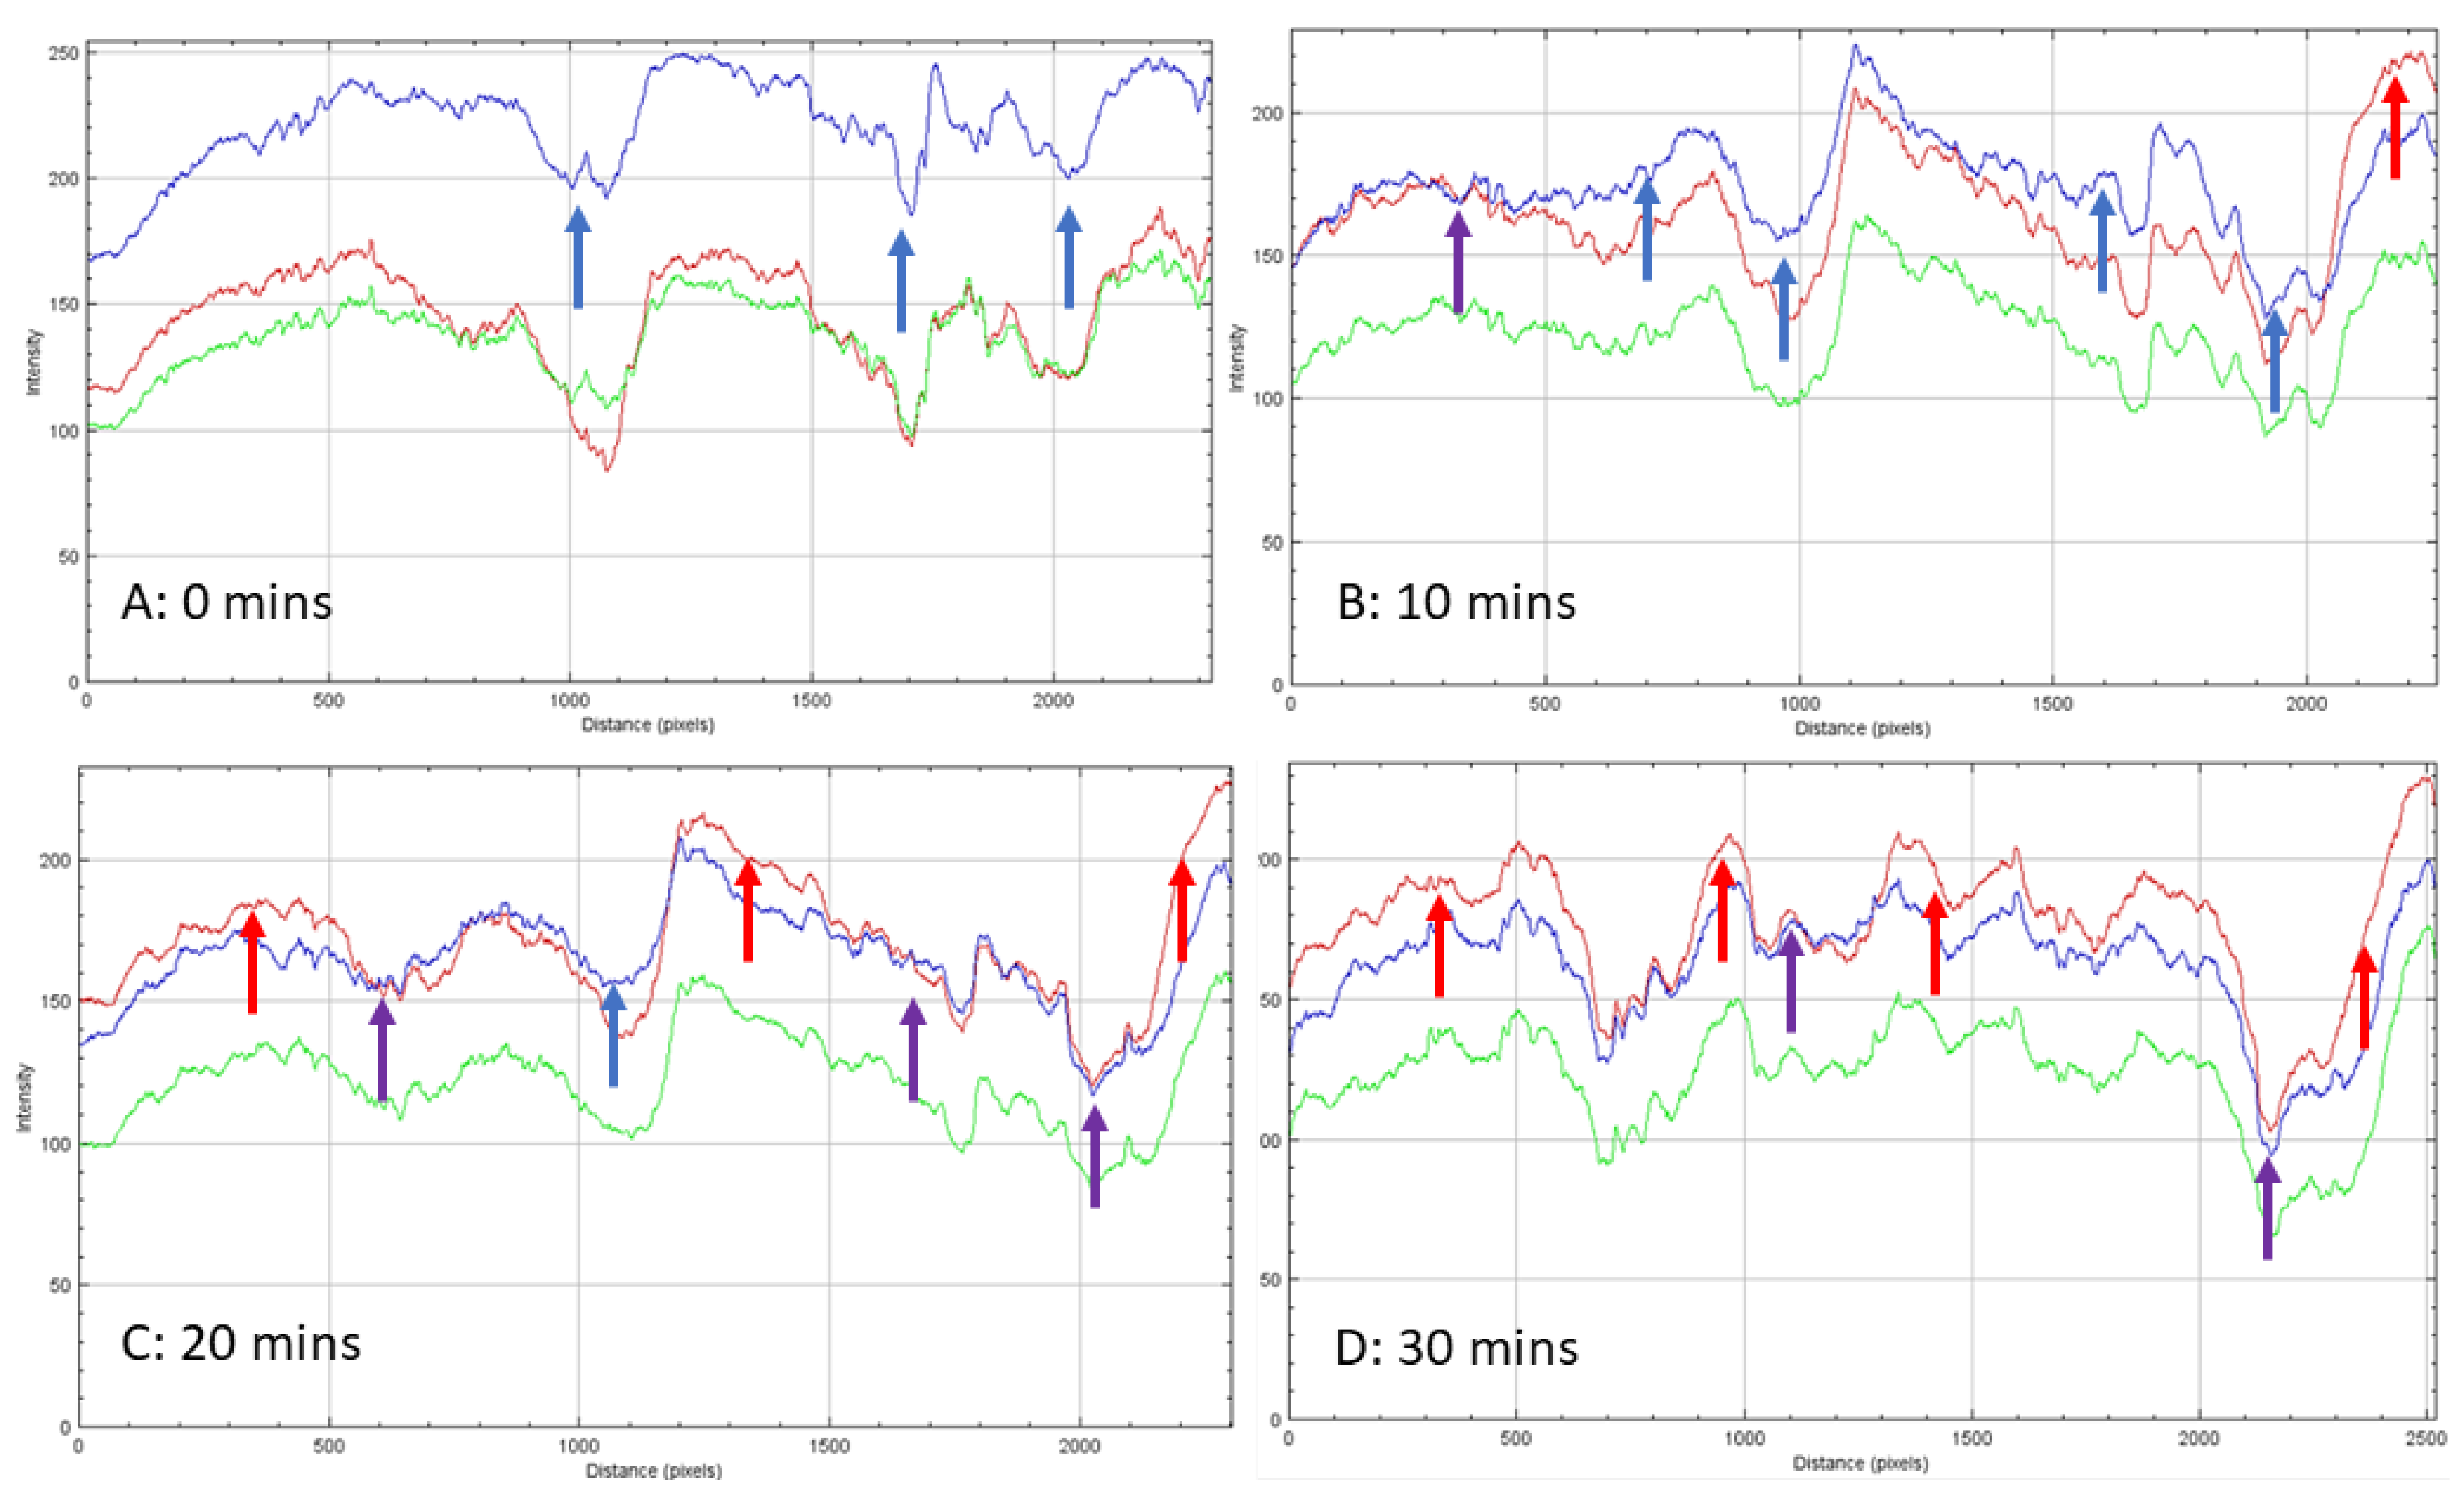
3.2. Visualization of SIM during Hydration
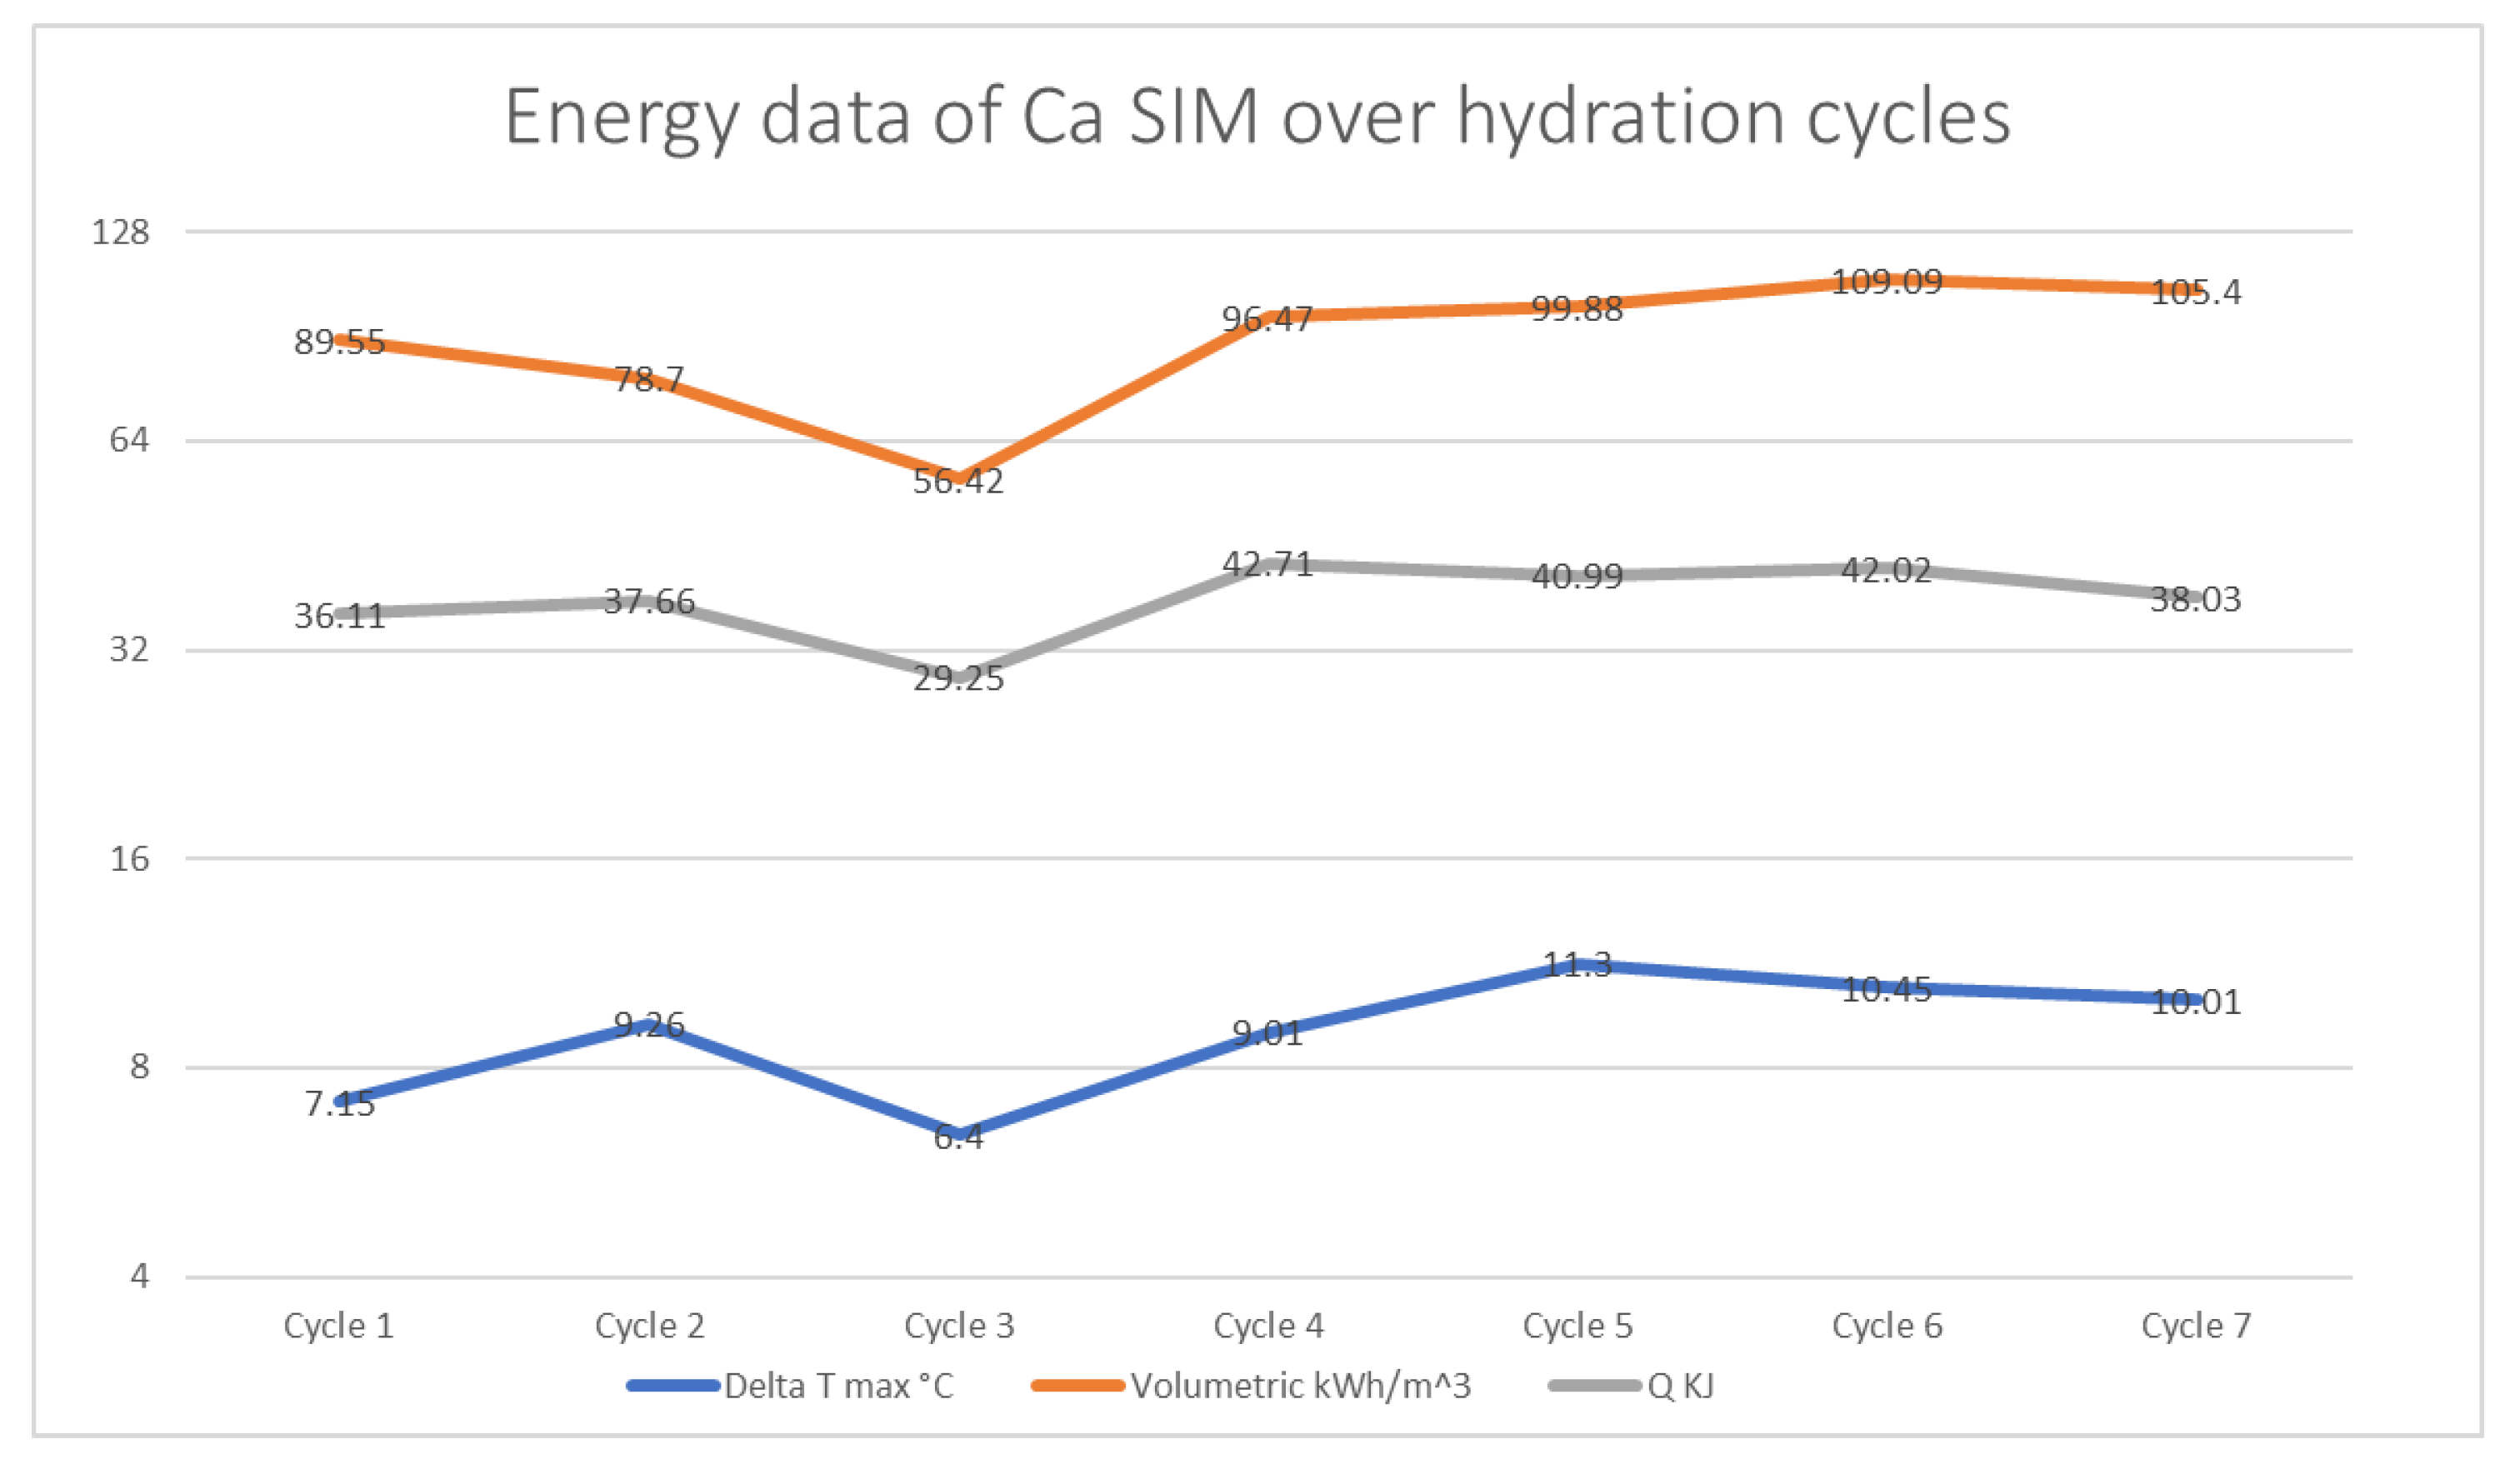
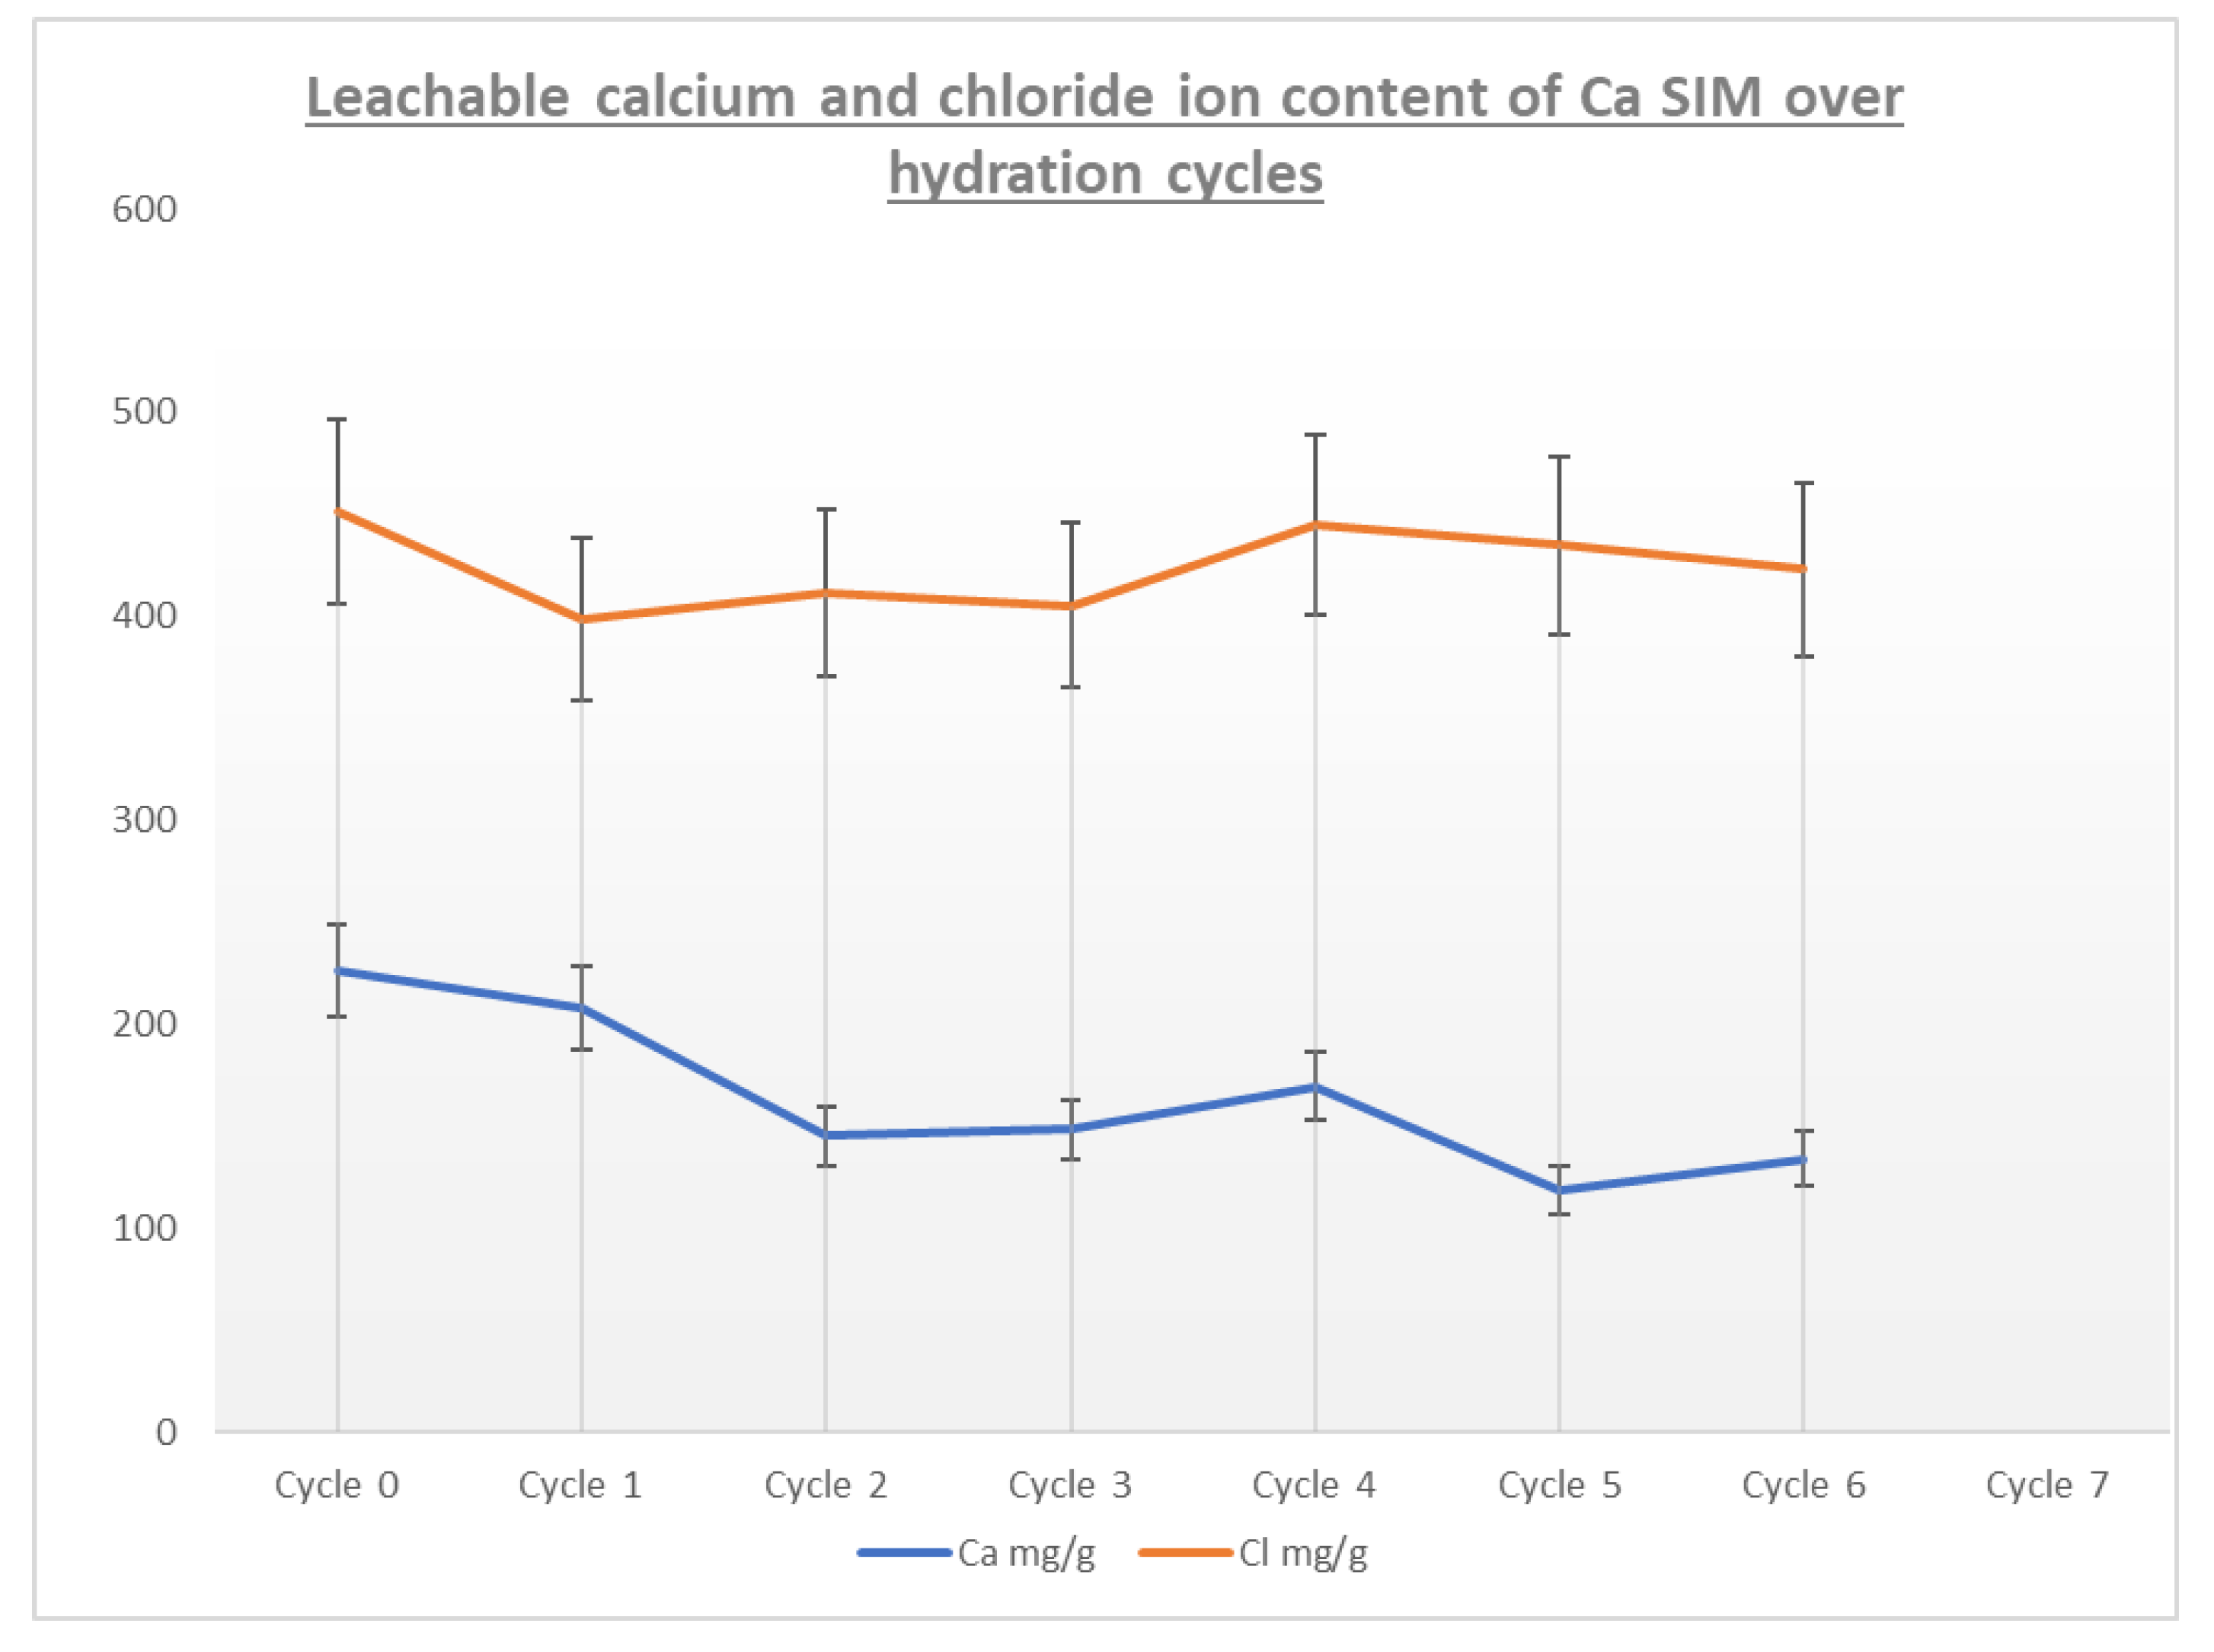
3.3. Cycling and Discharge Stability
4. Conclusions
Supplementary Materials
Author Contributions
Funding
Acknowledgments
Conflicts of Interest
References
- International Energy Agency. Review 2021 Assessing the Effects of Economic Recoveries on Global Energy Demand and CO2 Emissions in 2021 Global Energy. Available online: www.iea.org/t&c/ (accessed on 9 October 2023).
- International Energy Agency. Global Energy Review: CO2 Emissions in 2021 Global Emissions Rebound Sharply to Highest Ever Level. 2021. Available online: https://www.iea.org/reports/global-energy-review-co2-emissions-in-2021-2 (accessed on 11 October 2023).
- Institute for Government. Cost of Living Crisis. 2022. Available online: https://www.instituteforgovernment.org.uk/explainer/cost-living-crisis (accessed on 11 October 2023).
- Mitchell, R.; Natarajan, S. UK Passivhaus and the Energy Performance Gap. Energy Build. 2020, 224, 110240. [Google Scholar] [CrossRef]
- Energy Tutorial: Energy and Sustainability What’s Energy Used for? Available online: https://www.gov.uk/government/collections/energy-consumption-in-the-uk (accessed on 9 October 2023).
- Gielen, D.; Boshell, F.; Saygin, D.; Bazilian, M.D.; Wagner, N.; Gorini, R. The Role of Renewable Energy in the Global Energy Transformation. Energy Strategy Rev. 2019, 24, 38–50. [Google Scholar] [CrossRef]
- Aydin, D.; Casey, S.P.; Riffat, S. The Latest Advancements on Thermochemical Heat Storage Systems. Renew. Sustain. Energy Rev. 2015, 41, 356–367. [Google Scholar] [CrossRef]
- Trausel, F.; de Jong, A.J.; Cuypers, R. A Review on the Properties of Salt Hydrates for Thermochemical Storage. Energy Procedia 2014, 48, 447–452. [Google Scholar] [CrossRef]
- Donkers, P.A.J.; Sögütoglu, L.C.; Huinink, H.P.; Fischer, H.R.; Adan, O.C.G. A Review of Salt Hydrates for Seasonal Heat Storage in Domestic Applications. Appl. Energy 2017, 199, 45–68. [Google Scholar] [CrossRef]
- Zhang, Y.; Chen, Z.; Kutlu, C.; Su, Y.; Riffat, S. Investigation on a Vermiculite-Based Solar Thermochemical Heat Storage System for Building Applications. Future Cities Environ. 2022, 8, 1–14. [Google Scholar] [CrossRef]
- Jarimi, H.; Devrim, A.; Zhang, Y.; Ding, Y.; Ramadan, O.; Chen, X.; Dodo, A.; Utlu, Z.; Riffat, S. Materials Characterization of Innovative Composite Materials for Solar-Driven Thermochemical Heat Storage (THS) Suitable for Building Application. Int. J. Low-Carbon Technol. 2018, 13, 30–42. [Google Scholar] [CrossRef]
- N’Tsoukpoe, K.E.; Rammelberg, H.U.; Lele, A.F.; Korhammer, K.; Watts, B.A.; Schmidt, T.; Ruck, W.K.L. A Review on the Use of Calcium Chloride in Applied Thermal Engineering. Appl. Therm. Eng. 2015, 75, 513–531. [Google Scholar] [CrossRef]
- Manente, G.; Ding, Y.; Sciacovelli, A. A Structured Procedure for the Selection of Thermal Energy Storage Options for Utilization and Conversion of Industrial Waste Heat. J. Energy Storage 2022, 51, 104411. [Google Scholar] [CrossRef]
- Ait Ousaleh, H.; Sair, S.; Zaki, A.; Faik, A.; Mirena Igartua, J.; el Bouari, A. Double Hydrates Salt as Sustainable Thermochemical Energy Storage Materials: Evaluation of Dehydration Behavior and Structural Phase Transition Reversibility. Sol. Energy 2020, 201, 846–856. [Google Scholar] [CrossRef]
- Tetteh, S.; Yazdani, M.R.; Santasalo-Aarnio, A. Cost-Effective Electro-Thermal Energy Storage to Balance Small Scale Renewable Energy Systems. J. Energy Storage 2021, 41, 102829. [Google Scholar] [CrossRef]
- Aarts, J.; van Ravensteijn, B.; Fischer, H.; Adan, O.; Huinink, H. Polymeric Stabilization of Salt Hydrates for Thermochemical Energy Storage. Appl. Energy 2023, 341, 121068. [Google Scholar] [CrossRef]
- Bird, J.E.; Humphries, T.D.; Paskevicius, M.; Poupin, L.; Buckley, C.E. Thermal Properties of Thermochemical Heat Storage Materials. Phys. Chem. Chem. Phys. 2020, 22, 4617–4625. [Google Scholar] [CrossRef] [PubMed]
- Ramadan, O.; Zhang, Y.; Ding, Y.; Jarimi, H.; Dodo, A.; Riffat, S. Synthesis and Characterization of Salt in Matrix Composite Materials for Open Cycle Thermochemical Heat Storage for Building Applications. 2017. Available online: https://www.researchgate.net/publication/326190703 (accessed on 11 October 2023).
- Mohapatra, D.; Nandanavanam, J. Salt in Matrix for Thermochemical Energy Storage—A Review. Mater. Today Proc. 2023, 72, 27–33. [Google Scholar] [CrossRef]
- Chen, Z.; Zhang, Y.; Zhang, Y.; Su, Y.; Riffat, S. A Study on Vermiculite-Based Salt Mixture Composite Materials for Low-Grade Thermochemical Adsorption Heat Storage. Energy 2023, 278, 127986. [Google Scholar] [CrossRef]
- Xie, N.; Huang, Z.; Luo, Z.; Gao, X.; Fang, Y.; Zhang, Z. Inorganic Salt Hydrate for Thermal Energy Storage. Appl. Sci. 2017, 7, 1317. [Google Scholar] [CrossRef]
- Vainio, E.; Demartini, N.; Hupa, L.; Åmand, L.E.; Richards, T.; Hupa, M. Hygroscopic Properties of Calcium Chloride and Its Role on Cold-End Corrosion in Biomass Combustion. Energy Fuels 2019, 33, 11913–11922. [Google Scholar] [CrossRef]
- Casey, S.P.; Elvins, J.; Riffat, S.; Robinson, A. Salt Impregnated Desiccant Matrices for “open” Thermochemical Energy Storage—Selection, Synthesis and Characterisation of Candidate Materials. Energy Build. 2014, 84, 412–425. [Google Scholar] [CrossRef]
- Aydin, D.; Casey, S.P.; Chen, X.; Riffat, S. Novel “Open-Sorption Pipe” Reactor for Solar Thermal Energy Storage. Energy Convers. Manag. 2016, 121, 321–334. [Google Scholar] [CrossRef]
- Gordeeva, L.G.; Aristov, Y.I. Composites “salt inside Porous Matrix” for Adsorption Heat Transformation: A Current State-of-the-Art and New Trends. Int. J. Low-Carbon Technol. 2012, 7, 288–302. [Google Scholar] [CrossRef]
- Walsh, S.; Reynolds, J.; Abbas, B.; Woods, R.; Searle, J.; Jewell, E.; Elvins, J. Assessing the Dynamic Performance of Thermochemical Storage Materials. Energies 2020, 13, 2202. [Google Scholar] [CrossRef]
- Schramm, C.; Kitzke, A.; Tessadri, R. Cobalt Chloride-Based Humidity Sensor Attached to SOL-GEL Modified Cellulosic Material. Cellul. Chem. Technol. 2017, 51, 273–282. [Google Scholar]
- Ferreira, D.R.; Thornhill, J.A.; Roderick, E.I.N.; Li, Y. The Impact of PH and Ion Exchange on 133 Cs Adsorption on Vermiculite. J. Environ. Qual. 2018, 47, 1365–1370. [Google Scholar] [CrossRef] [PubMed]
- Huang, K.; Rowe, P.; Chi, C.; Sreepal, V.; Bohn, T.; Zhou, K.G.; Su, Y.; Prestat, E.; Pillai, P.B.; Cherian, C.T.; et al. Cation-Controlled Wetting Properties of Vermiculite Membranes and Its Promise for Fouling Resistant Oil–Water Separation. Nat. Commun. 2020, 11, 1097. [Google Scholar] [CrossRef]
- Hailu, Y.; Tilahun, E.; Brhane, A.; Resky, H.; Sahu, O. Ion Exchanges Process for Calcium, Magnesium and Total Hardness from Ground Water with Natural Zeolite. Groundw. Sustain. Dev. 2019, 8, 457–467. [Google Scholar] [CrossRef]
- Levy, R.; Shainberg, I. Calcium-Magnesium Exchange in Montmorillonite and Vermiculite; Pergamon Press: Oxford, UK, 1972; Volume 20, Available online: https://www.researchgate.net/publication/237661151 (accessed on 11 October 2023).
- Feng, J.; Liu, M.; Fu, L.; Zhang, K.; Xie, Z.; Shi, D.; Ma, X. Enhancement and Mechanism of Vermiculite Thermal Expansion Modified by Sodium Ions. RSC Adv. 2020, 10, 7635–7642. [Google Scholar] [CrossRef] [PubMed]

Disclaimer/Publisher’s Note: The statements, opinions and data contained in all publications are solely those of the individual author(s) and contributor(s) and not of MDPI and/or the editor(s). MDPI and/or the editor(s) disclaim responsibility for any injury to people or property resulting from any ideas, methods, instructions or products referred to in the content. |
© 2023 by the authors. Licensee MDPI, Basel, Switzerland. This article is an open access article distributed under the terms and conditions of the Creative Commons Attribution (CC BY) license (https://creativecommons.org/licenses/by/4.0/).
Share and Cite
Sullivan, G.; Griffiths, C.; Jewell, E.; Searle, J.; Elvins, J. Cycling Stability of Calcium-Impregnated Vermiculite in Open Reactor Used as a Thermochemical Storage Material. Energies 2023, 16, 7225. https://doi.org/10.3390/en16217225
Sullivan G, Griffiths C, Jewell E, Searle J, Elvins J. Cycling Stability of Calcium-Impregnated Vermiculite in Open Reactor Used as a Thermochemical Storage Material. Energies. 2023; 16(21):7225. https://doi.org/10.3390/en16217225
Chicago/Turabian StyleSullivan, Geraint, Chris Griffiths, Eifion Jewell, Justin Searle, and Jonathon Elvins. 2023. "Cycling Stability of Calcium-Impregnated Vermiculite in Open Reactor Used as a Thermochemical Storage Material" Energies 16, no. 21: 7225. https://doi.org/10.3390/en16217225
APA StyleSullivan, G., Griffiths, C., Jewell, E., Searle, J., & Elvins, J. (2023). Cycling Stability of Calcium-Impregnated Vermiculite in Open Reactor Used as a Thermochemical Storage Material. Energies, 16(21), 7225. https://doi.org/10.3390/en16217225