Article

Experimental Research on the Gas-Solid Flow Characteristics in Large-Scale Dual Fluidized Bed Reactor

1
State Key Laboratory of Clean Energy Utilization, Zhejiang University, Hangzhou 310027, China
2
Institute for Thermal Power Engineering, Zhejiang University (Yuquan Campus), 38 Zheda Road, Hangzhou 310027, China
3
School of Mechanical and Energy Engineering, Zhejiang University of Science and Technology, Hangzhou 310023, China
4
School of Mechanical Engineering, Shanghai Jiao Tong University, Shanghai 200240, China
*
Author to whom correspondence should be addressed.
Energies 2023, 16(21), 7239; https://doi.org/10.3390/en16217239
Submission received: 4 September 2023 / Revised: 17 October 2023 / Accepted: 20 October 2023 / Published: 25 October 2023
(This article belongs to the Topic Clean and Low Carbon Energy)

Abstract

:
A dual fluidized bed (DFB) reactor is the main operating system of various energy-efficient and clean utilization technologies. The gas-solid flow characteristics of the DFB reactor greatly affect the efficiency of various technologies. A large-scale DFB reactor with a maximum height of 21.6 m was built and relevant cold mode tests were carried out in this study. The effects of the superficial gas velocity of both beds, static bed height and particle size on the distribution of both pressure and solid suspension density, solid circulation rate, solid inventory distribution ratio and other characteristics were studied. For 282 μm-particles, the solid suspension density in the dense phase zone of the two beds was 100–400 and 400–800 kg/m3, respectively, when the static bed height was 0.65 m; the solid circulation rate was about 0.87–1.75, 1.04–3.04 and 1.13–3.69 kg/(m2s) when the static bed height was 0.65, 0.95 and 1.25 m, respectively. The solid circulation rate was positively correlated with the static bed height and the superficial gas velocity of both beds, yet negatively correlated with the particle size. Additionally, the empirical equation of solid circulation rate and the empirical equation of solid inventory distribution ratio were proposed, respectively. The material control method of the DFB reactor is put forward.

Graphical Abstract

1. Introduction

A dual fluidized bed (DFB) reactor refers to a reactor system where two fluidized beds are coupled together [1]. In the reactor, material particles are fluidized and circulated between two fluidized beds, which facilitate the heat and mass transfer within the system. In the context of carbon neutrality, as the main operating system of various energy-efficient and clean utilization technologies, including polymerization processes [2], chemical looping combustion technology [3], carbon-capture utilization and storage technology [4] and biomass gasification technology [5], the DFB reactor is of self-evident importance. The specific roles of the two fluidized beds within the DFB reactor used in various technologies are shown in Table 1 [3,4,5]. The gas-solid flow characteristics of the DFB reactor, including the particle circulation characteristics, greatly affect the heat and mass transfer of various technologies, thus affecting their performance and efficiency. Therefore, it is of great necessity to carry out research on the DFB reactor to understand its gas-solid flow characteristics.
Experimental research on the DFB reactor has been reported by many researchers. Tobias Proll et al. built a 120 kW DFB reactor and carried out cold mode tests, and found that the reactor had good circulation performance [6]. Chunbao Zhou et al. conducted a pilot study of interconnected pyrolysis and gasification in a 50 kg/h DFB reactor designed by themselves, and preliminarily verified the feasibility of the reactor in the field of biomass utilization and carbon capture [7]. A. Charitos et al. conducted tests on a hydrodynamically-scaled cold model of the 10 kWth calcium-looping DFB facility and identified a stable operating region bordered by two unstable regions [8]. Saurabh Gupta et al. investigated the hydrodynamics of a DFB gasifier designed for high-ash coal and found that secondary aeration is more effective in maintaining a proper balance between the solid holdup and the solid circulation rate when the bottom riser bed is operated in the fast-fluidized bed regime for in-bed solids discharge [9].
There are also many researchers carrying out numerical simulation studies on the DFB reactor. Yang Liu et al. analyzed gas-solid fluidization and coal-gasification reactions in a DFB unit by using the full-loop numerical simulation method, which provides a basis for industrial application [10]. Yangjun Wei et al. adopted an analysis approach considering gas-solid hydrodynamics, reaction kinetics and reacting species nonuniformity together in a dual-reactor system, and drew a conclusion that energy balance has a close relationship with the mass transfer in the DFB reactor system [11]. Peter Ohlemuller et al. and Asad H. Sahir et al. used Aspen to simulate the chemical-looping combustion process based on a DFB reactor under scales of 0.1, 1, 10 and 100 MWth [12,13,14].
The types and scales of the above research are summarized in Table 2. As can be seen from Table 2, existing research on DFB reactors are divided into experimental research and numerical simulation research. On the one hand, most experimental studies are based on small DFB reactor systems, which are far from the actual production scale. This will lead to complex, unforeseen changes during the process of scaling up the device from the laboratory scale to the actual production scale, thus making the results of the research unable to provide theoretical experience for the design and operation of actual production. On the other hand, the existing numerical simulation research can be divided into Aspen simulations and CFD simulations. Aspen simulations focus on the economic evaluation of the efficiency and yield of various processes at the macro level but neglect various gas-solid flow characteristics inside the reactor. CFD simulations focus on various gas-solid flow characteristics inside the reactor, however, due to the lack of support from experimental data, the research results cannot be directly used to guide the actual production.
The distribution of pressure and solid suspension density in the furnace are the most basic gas-solid flow characteristics of a DFB reactor. These two characteristics have a great influence on the heat and mass transfer inside the reactor. Chengliang Han et al. studied the effect of bed material size on the distribution of pressure and the solid suspension density in a CFB (Circulating Fluidized Bed) reactor at low solid recirculation rates [16]. The solid circulation rate is another important gas-solid flow characteristic of the DFB system, which represents the degree of solid circulation between two fluidized beds, and is usually expressed by Gs [17,18]. It not only affects the gas-solid flow in the furnace but also has a significant impact on the furnace temperature, gas-solid heat transfer efficiency, solid fuel pyrolysis efficiency and component wear. Hu et al. studied the solid circulation rate of a pressurized CFB and an internal CFB [17,19] while Atipong Armatsombat et al. and Mona Mary Varghese et al. tried to investigate or predict the solid circulation rate of different kinds of CFB [20,21].
Apparently, it is of great significance to master the influencing factors and changing rules of the distribution of both pressure and solid suspension density and the solid circulation rate in the DFB system. However, the subjects of the above research were all single fluidized beds. In a DFB reactor system, two fluidized beds are coupled to each other and, consequently, the flow field of two fluidized beds will influence each other, which may bring unknown changes to the gas-solid flow characteristics of the DFB reactor. This means that the gas-solid flow characteristics of a DFB reactor cannot be described simply by that of a single fluidized bed.
All in all, the types and scales of the existing studies on DFB reactors cannot provide effective theoretical experience for actual production. At the same time, the coupling of two fluidized beds will make the existing research on gas-solid flow characteristics based on single beds fail to serve as a reference point. In view of this, a large-scale DFB reactor with a maximum height of 21.6 m was built and relevant cold mode tests were carried out in this study. The effects of superficial gas velocity of both beds, static bed height and particle size on the distribution of both pressure and solid suspension density, solid circulation rate, solid inventory distribution ratio and other characteristics were studied. Additionally, the empirical equation of solid circulation rate and the empirical equation of solid inventory distribution ratio were proposed. The material control method of a DFB reactor is put forward, and the research on DFB reactors is improved, so as to provide guidance and demonstration for industrial production.

2. Experiment

2.1. Experiment System

In this study, a large-scale DFB reactor cold mode test system was built with polymethyl methacrylate as the main material. As shown in Figure 1, the experimental system is mainly divided into 1# fluidized bed (1#FB for short) and 2# fluidized bed (2#FB for short), with two risers, four cyclones and four loop-seals. The whole system utilizes remote control through a distant control system.
The size and structure design of each part of the system are shown in Table 3.
The fluidizing air of the riser, the return air and the loose air of the loop-seal are provided by a Roots blower, and an induced draft fan is connected to the exit of the cyclone at the top of the riser to maintain the internal pressure balance. A digital flowmeter is connected to the inlet of 1#FB and the inlet of 2#FB to obtain the superficial gas velocity of air at the inlet of the two risers. The two risers are divided into 12 and 18 sections with 1.2 m as the unit, and there are measuring points in the middle of each section for measuring the pressure at specific positions in the riser.
There are two grades of cyclones on the top of 2#FB, and two groups of cyclones are symmetrically arranged on the top of 1#FB. The outlet of the two cyclones on 1#FB and the secondary cyclone on 2#FB is connected to the induced draft fan.
Loop-seals are widely used in CFB systems to achieve a closed solid circulation loop [22]. Its biggest advantage is that it can not only realize solid circulation loop but also prevent or minimize airflow interference between different areas within the system. The system has four loop-seals. One of them is located at the bottom of 2#FB, and the other three are connected with the secondary cyclone of 2#FB and the two cyclones of 1#FB, respectively.

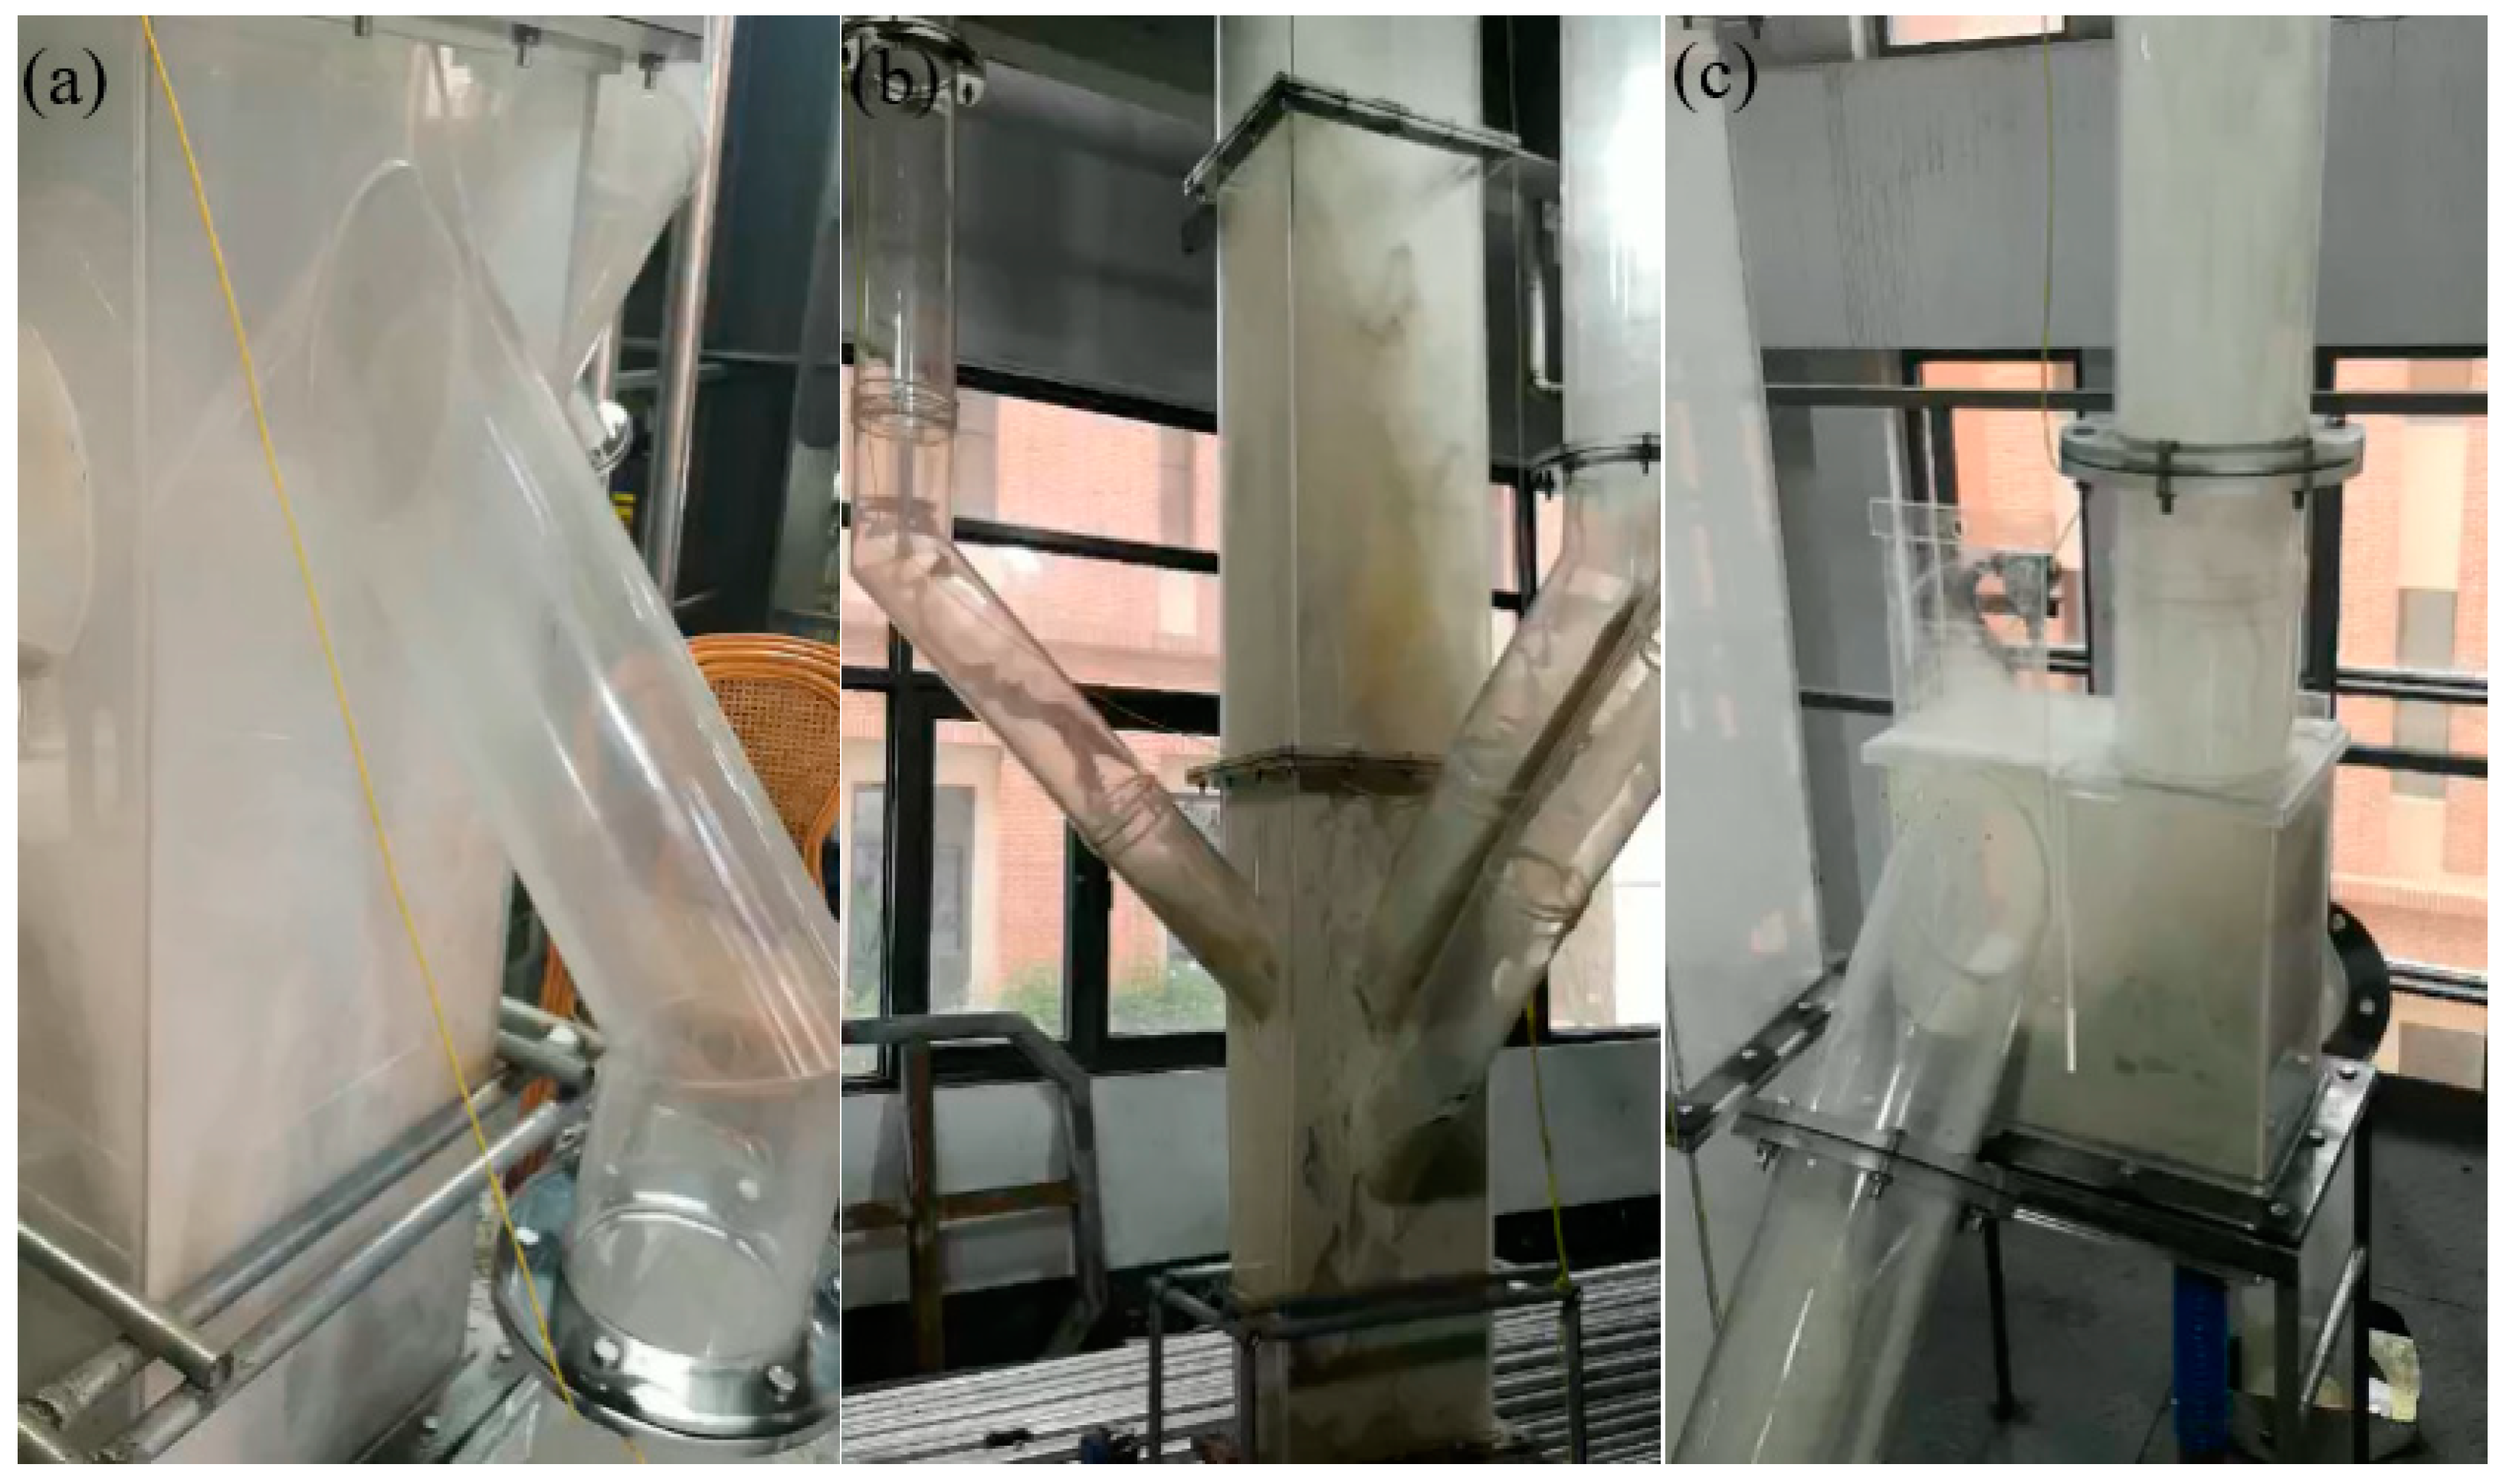
2.2. Material Circulation and Typical Operation State

In the operation process, quartz sand is used as the material in the experiment, and the internal material balance is achieved by adjusting the air volume. Part of the quartz sand in 2#FB is transported from the outlet to the upper loop-seal of 2#FB, through the two-grade cyclone, and then is sent back to 1#FB; the other part directly exits from the overflow port at the bottom of 2#FB to the bottom loop-seal of 2#FB, and then is sent back to 1#FB. The quartz sand in 1#FB reaches the corresponding loop-seal through the cyclone arranged symmetrically at the top and then is sent back to 2#FB. Figure 2 shows the typical operating state of each major component of the system during normal operation.

2.3. Test Condition and Data Processing

2.3.1. Test Condition

The experimental parameters are shown in Table 4. According to the Geldart particle classification method [23], the particles used in the experiment are all class B particles.
The static bed height of 1#FB refers to the height of the initial bed inventory in the 1#FB. The particle size distribution of the two kinds of sand used in the experiment is shown in Figure 3.

2.3.2. Pressure Distribution

This system uses a differential pressure transmitter to measure the pressure of a preset testing point in real-time. As the pressure fluctuates continuously during the experiment, a computer (distant control system) is used to record the pressure measured by the differential pressure transmitter, and the mean value is taken after reaching a stable state. In order to maintain normal operation of the system, a slight negative pressure is maintained at the top outlet of the riser during the test. However, due to the frequent fluctuation of pressure, the negative pressure cannot be set to a definite value accurately. Therefore, in actual operation, the power of the induced draft fan and blower is adjusted to maintain the pressure at the top outlet of the riser between −50 Pa and −200 Pa. When comparing the pressure distribution under different working conditions, this range error will significantly affect the comparability of different series of data. In order to enhance the comparability between the data of different working conditions, the pressure value of each height of the riser is different from the outlet pressure under the same working condition. By comparing this relative value, the influence of different experimental parameters on the system pressure balance is explored.

2.3.3. Solid Suspension Density

Solid suspension density is calculated by the following process.
According to the overall pressure drop formula of the riser:
Δ P = mg A
That is:
m = Δ P · A g
Therefore, the solid suspension density is:
ρ = m V = Δ P g · Δ h
where, ΔP is the overall pressure drop in the riser, in Pa; m is the amount of material in the riser, in kg; A is the cross-sectional area of the riser, in m2; and Δh is the height difference between two test points.

2.3.4. Solid Circulation Rate

The importance of solid circulation rate is discussed in the introduction. The solid circulation rate can be calculated as follows:
G s = Δ m t A
where, Gs is the solid circulation rate, in kg/(m2s); Δm is the accumulated mass of solid in the standpipe within a period of time, obtained by multiplying the change of stack height in the standpipe within a period of time by the standpipe area and bulk density of solid, in kg; t is time, in s; and A is the cross-sectional area of the riser, in m2.

2.3.5. Solid Inventory Distribution Ratio

The solid inventory distribution ratio is the ratio of materials in the two risers and is used to describe the difference in the distribution of solids between two reactors during steady-state operation. Its formula is given by the following procedure.
According to Equation (2), the solid inventory distribution ratio is:
I = m 1 m 2 = Δ P 1 · A 1 Δ P 2 · A 2
where, ΔP is the overall pressure drop in the riser, in Pa; m is the amount of material in the riser, in kg; A is the cross-sectional area of the riser, in m2; I is the solid inventory distribution ratio; and the subscripts 1 and 2 represent the 1#FB and 2#FB, respectively.

3. Results and Discussion

3.1. The Effects of Different Parameters on the Distribution of Pressure along the Riser Height

Figure 4 and Figure 5 show the distribution of pressure drop along the riser height relative to the outlet in each riser when 282-μm particles are running in a steady state. In the figure, the abscissa is the relative height, and the ordinate is the pressure drop. Generally speaking, the pressure in 1#FB and 2#FB reaches a relatively balanced state. Both the superficial gas velocity and the static bed height have a comprehensive influence on the pressure balance of the two risers. The pressure drop distribution in both risers presents the same rule. The pressure drop is very high at the bottom due to the mass accumulation of the materials. The pressure drop decreases sharply upon entering the dilute phase zone and subsequently decreases slowly with the increase in the riser height.
Within the dense phase zone, the superficial gas velocity of 1#FB has a positive effect on the pressure drop of 2#FB and yet has a negative effect on that of 1#FB. Figure 4 shows the effect of the superficial gas velocity of 1#FB on the distribution of the pressure drop along the riser height. In 1#FB, the pressure drop in the bottom dense phase zone is between 3000 and 5000 Pa, while that in the dilute phase zone is between 0 and 600 Pa. In 2#FB, the pressure drop in the bottom dense phase zone is between 500 and 3000 Pa, while that in the dilute phase zone is between 0 and 300 Pa. As can be seen in the figure, when the superficial gas velocity of 2#FB remains unchanged, the pressure drop in the bottom dense phase zone of 1#FB decreases with the increase in the superficial gas velocity of 1#FB. This is because the increase in the superficial gas velocity of 1#FB enhances its transporting capacity, which will transport a large number of materials gathered at the bottom to the dilute phase zone of 1#FB and whereafter reach 2#FB through circulation, resulting in the decrease of the pressure drop at the bottom dense phase zone of 1#FB. On the contrary, the pressure drop in the bottom dense phase zone of 2#FB increases with the increase in the superficial gas velocity of 1#FB, which is because of the accumulation of materials at the bottom of 2#FB. The relationship between the pressure drop in the dense phase zone of the two risers presents a reverse equilibrium. At the same time, when the superficial gas velocity of 1#FB increases, the pressure drop in the dilute phase zone of both beds increases slightly.
The static bed height has a positive effect on the pressure drop, which is more reflected in the dense phase region. Figure 5 shows the effect of the static bed height on the distribution of the pressure drop along the riser height when the superficial gas velocity of 1#FB and 2#FB is 4.5 m/s and 2.5 m/s, respectively. In 1#FB, the pressure drop in the bottom dense phase zone is between 3000 and 5500 Pa, while that in the dilute phase zone is between 0 and 1200 Pa. In 2#FB, the pressure drop in the bottom dense phase zone is between 2500–5500 Pa, while that in the dilute phase zone is between 0 and 300 Pa. As can be seen in the figure, when other conditions remain unchanged, the pressure in the two risers increases as a whole with the increase in the static bed height, which is caused by the gradually increasing number of materials in the riser. Additionally, it can be clearly seen in the figure that when the static bed height increases, the pressure drop at the bottom of 1#FB rises significantly, which implies that the height of the dense phase zone also increases. At the same time, the pressure drop at the bottom of 2#FB increased. However, the pressure drop in the dilute phase zone of 2#FB almost did not change. This can be explained by the low superficial gas velocity of 2#FB, which only transports a limited quantity of material to the dilute phase zone, leaving most of the material gathered in the bottom dense phase zone.

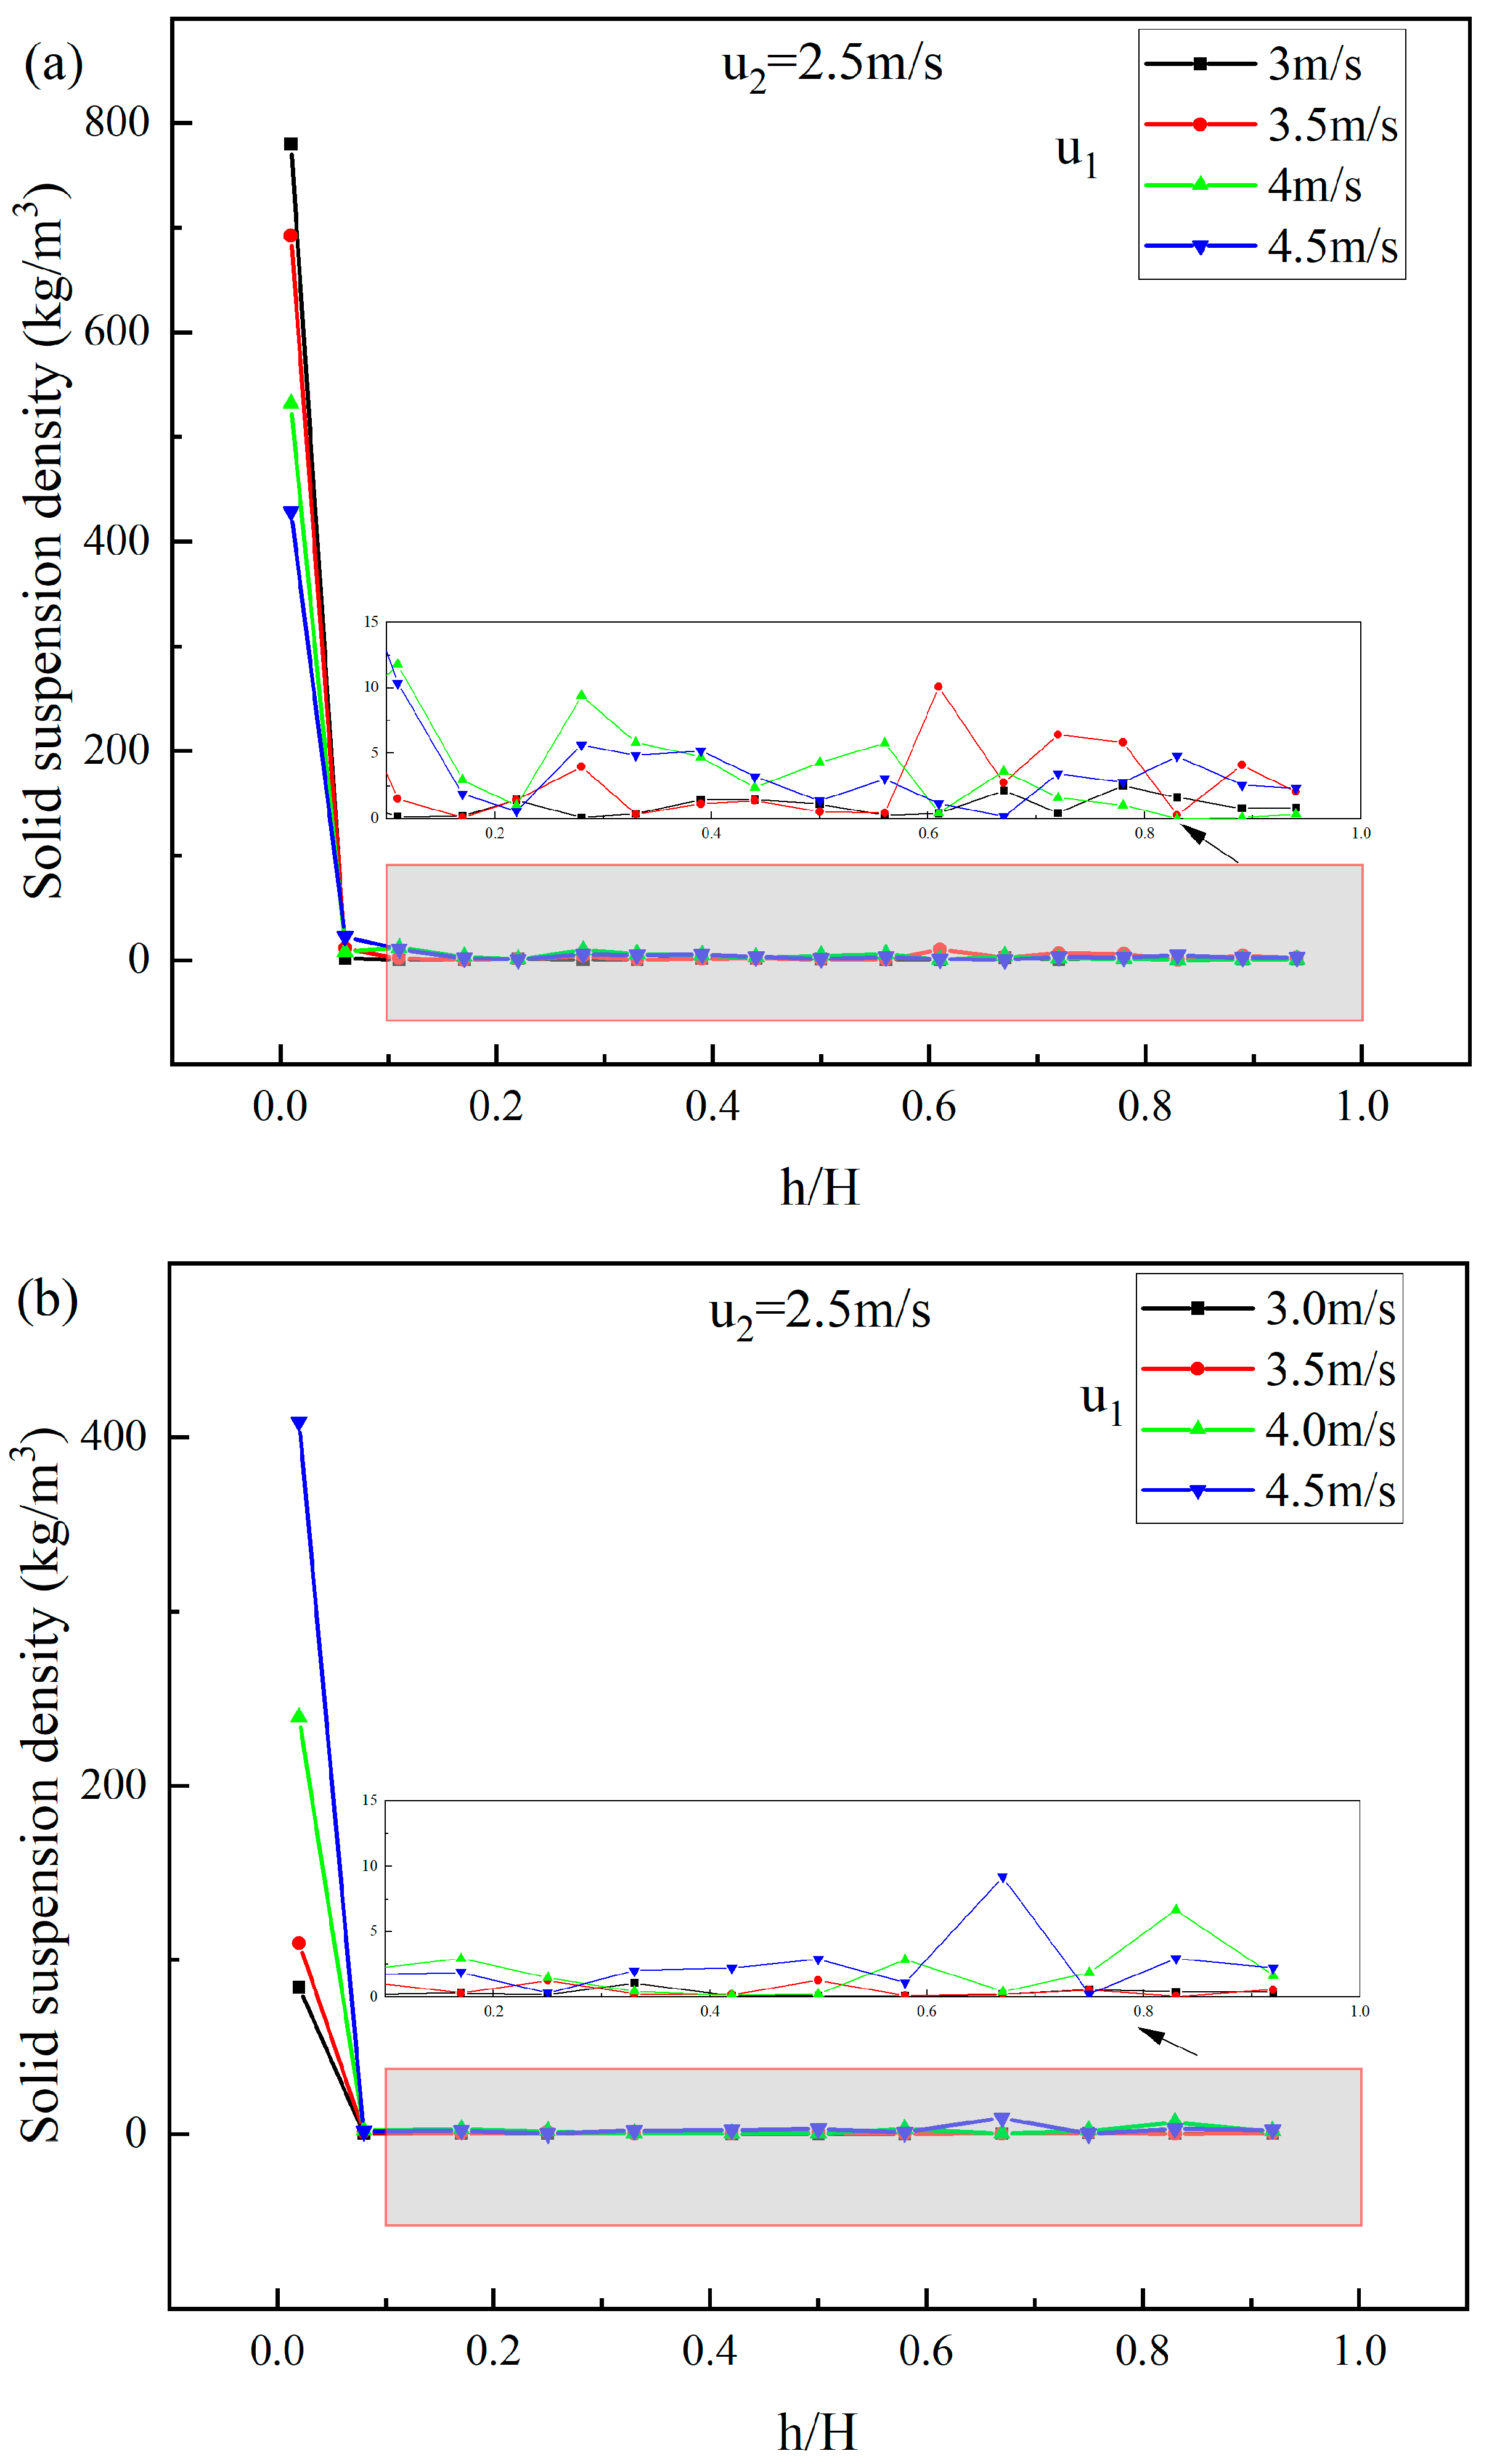
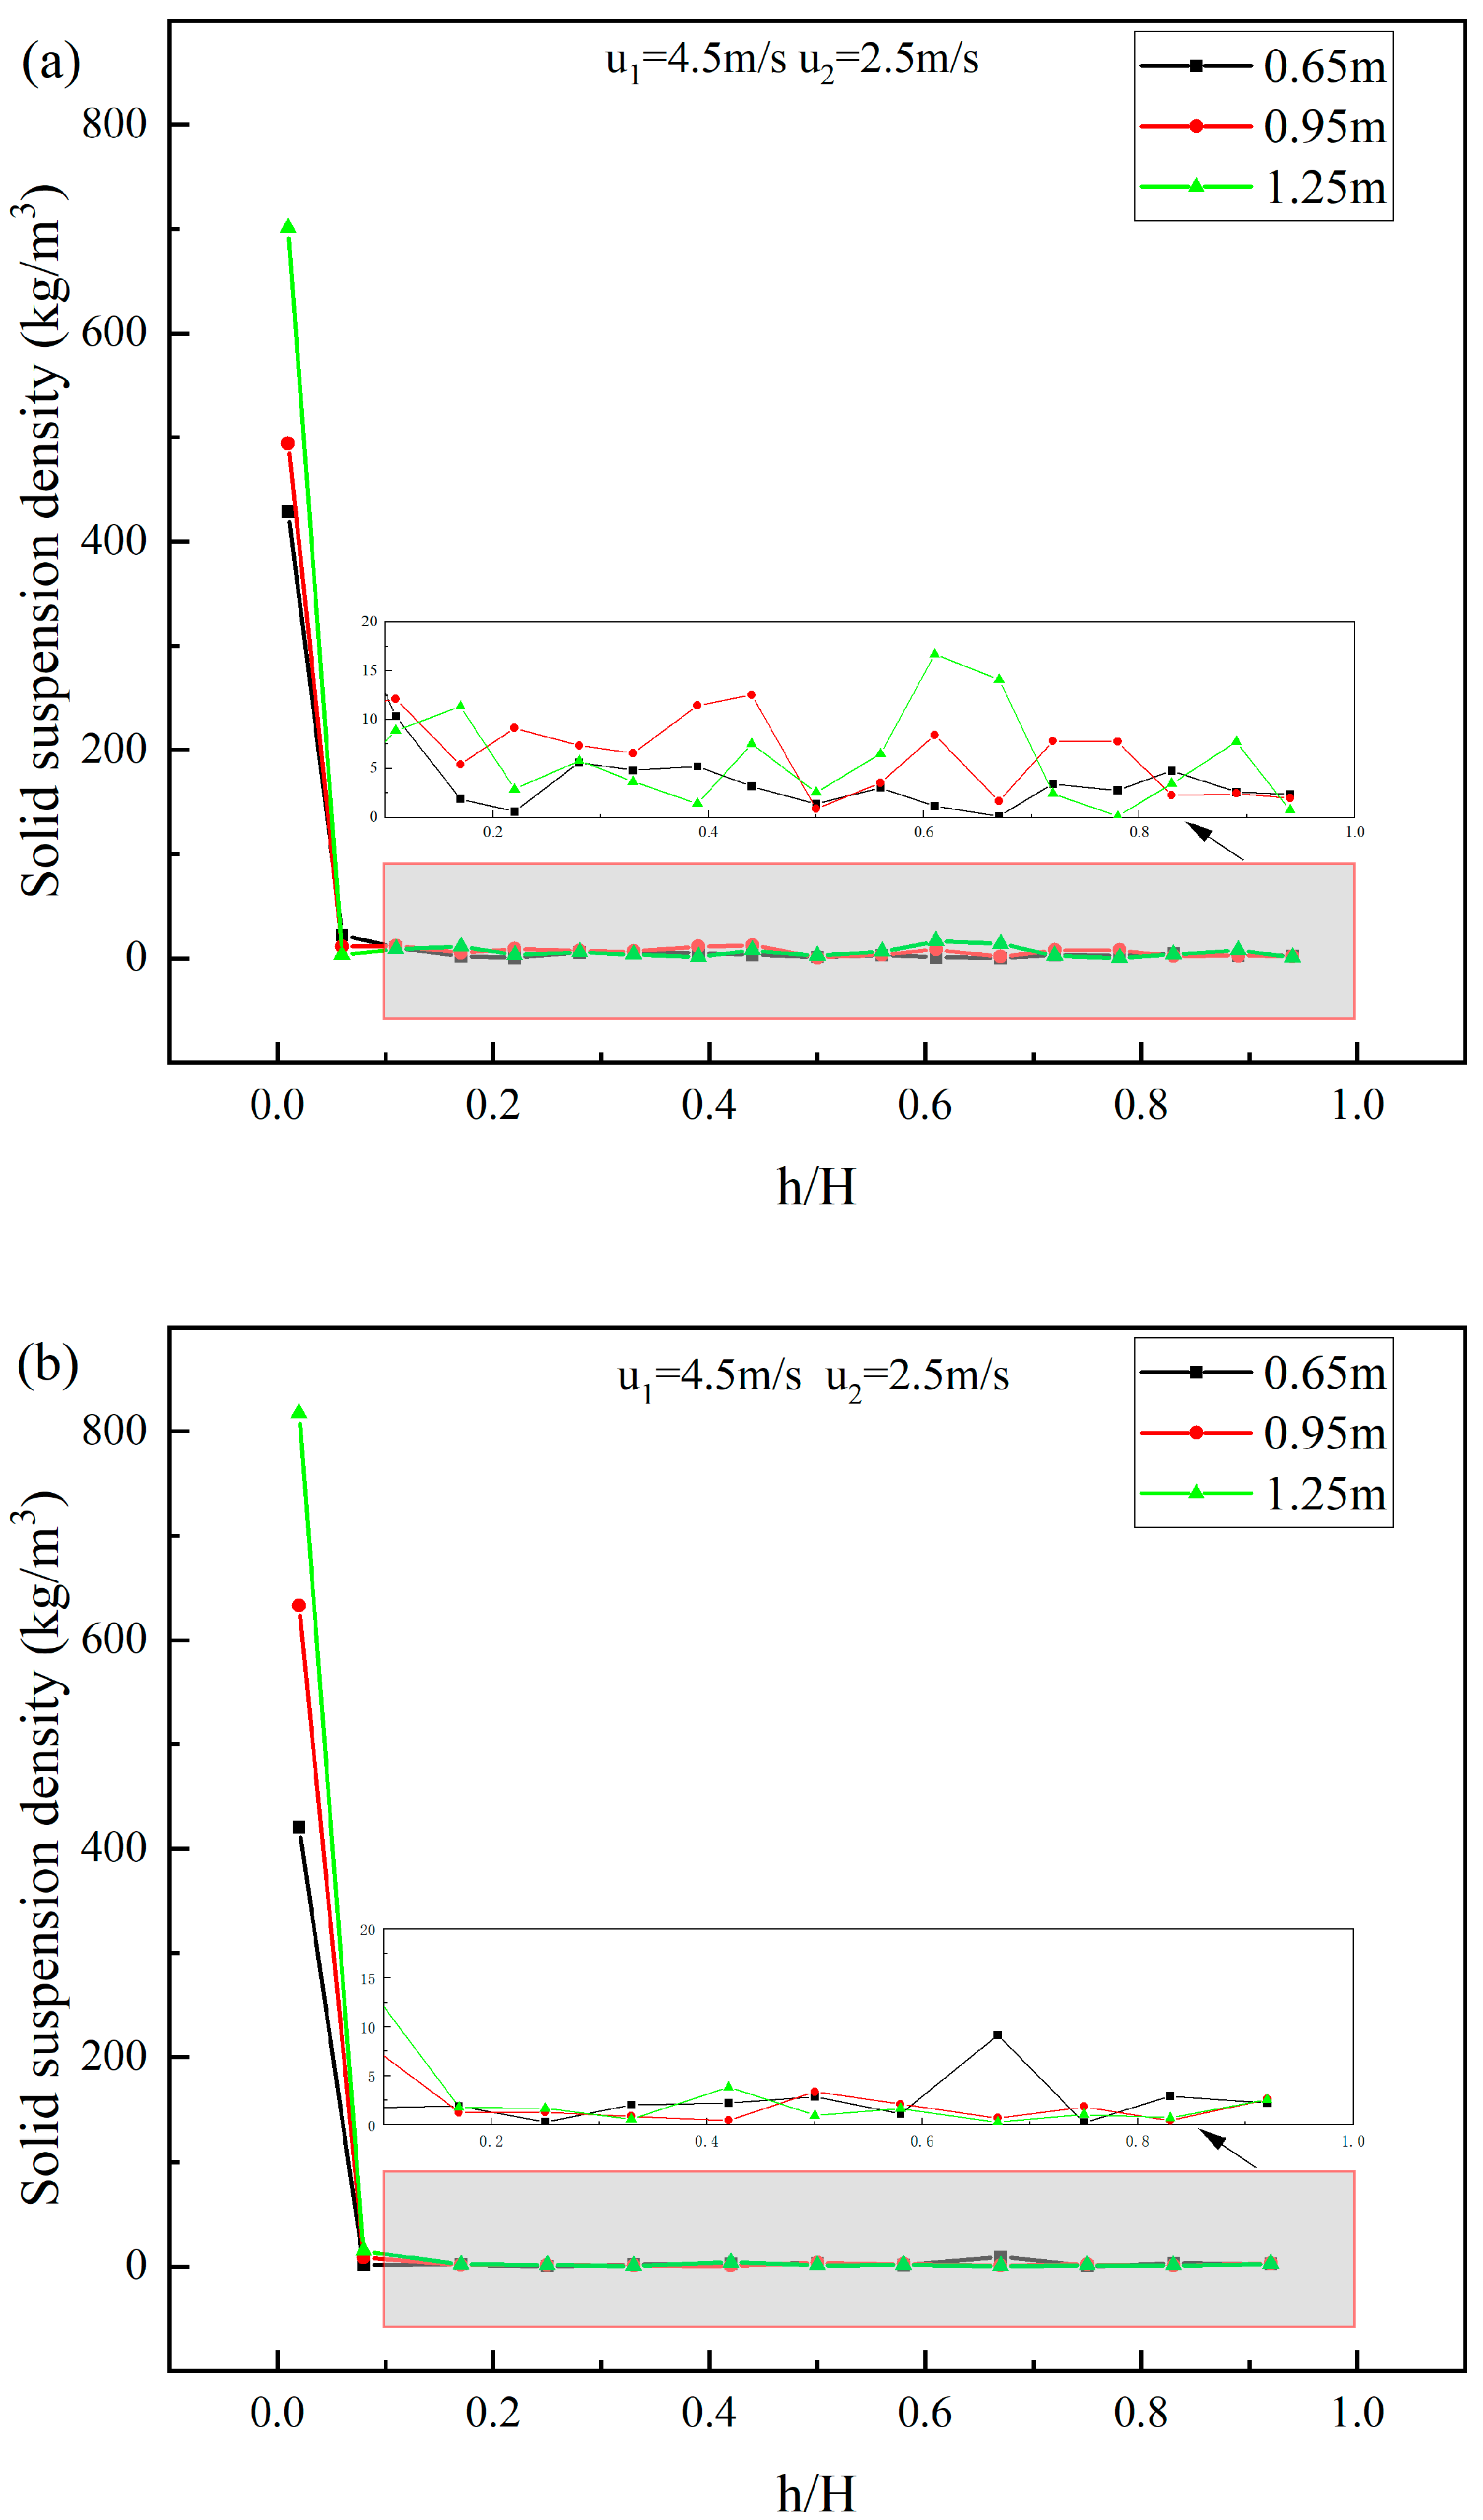
3.2. The Effects of Different Parameters on the Distribution of Solid Suspension Density along the Riser Height

Figure 6 and Figure 7 show the distribution of the solid suspension density along the riser height during steady-state operation. In the figure, the abscissa is the relative height, and the ordinate is the solid suspension density. In general, whether it is 1#FB or 2#FB, the distribution of solid suspension density in the riser shows the same rule. Specifically, the solid suspension density at the bottom is very high, and the height of the dense phase zone is about one-tenth of the total height of the riser (h/H = 0.1). Upon entering the dilute phase zone, the solid suspension density decreases rapidly and remains relatively stable along the riser height. At the same time, there are some differences between the two risers. In terms of spatial arrangement, the bottom of 1#FB is 7.2 m lower than that of 2#FB. Therefore, when the superficial gas velocity of the two beds is close, the solid suspension density at the bottom of 1#FB is much larger than that of 2#FB. This difference can be reduced by increasing the superficial gas velocity of 1#FB or the static bed height.
Within the dense phase zone, the superficial gas velocity of 1#FB has a positive effect on the solid suspension density of 2#FB and yet has a negative effect on that of 1#FB. Figure 6 shows the effects of the superficial gas velocity of 1#FB on the distribution of solid suspension density along the riser height. In 1#FB, the solid suspension density in the bottom dense phase zone is roughly between 400–800 kg/m3, while that in the dilute phase zone is between 0–15 kg/m3. In 1#FB, with the increase in the superficial gas velocity of 1#FB, the solid suspension density in the dense phase zone decreases while the solid suspension density in the dilute phase zone increases slightly on the whole, and vice versa. This is because the distribution of solids between the two risers reaches a certain degree of balance in steady operation. However, the increase in the superficial gas velocity of 1#FB breaks this balance, leading to the transfer of solids from 1#FB side to 2#FB side, and the decrease of solid suspension density in the bottom dense phase zone of 1#FB. Meanwhile, the increase in the superficial gas velocity improves the entraining effect on the solid, resulting in a slight increase in the solid suspension density in the dilute phase zone on the whole. In 2#FB, the solid suspension density at the bottom is roughly between 100 and 400 kg/m3, while that in the dilute phase zone is between 0 and 20 kg/m3. With the increase in the superficial gas velocity of 1#FB, the solid suspension density at the bottom increases and the solid suspension density in the dilute phase zone increases slightly on the whole, and vice versa. The reasons have been explained above.
Increasing the superficial gas velocity of 1#FB will cause the material balance to shift to the 2#FB side, which will enhance the heat and mass transfer of the 2#FB side. Meanwhile, the solid suspension density in the dilute phase zone of both risers is simultaneously increased and thus enhances the heat and mass transfer in the dilute phase zone. The effect of the superficial gas velocity of 2#FB on the material balance of two risers is opposite to that of 1#FB.
The static bed height has a positive effect on the solid suspension density, which is more reflected in the dense phase region. Figure 7 shows the effects of static bed height on the distribution of solid suspension density along the riser height when the superficial gas velocity of 1#FB and 2#FB is 4.5 m/s and 2.5 m/s, respectively. In 1#FB, the solid suspension density in the bottom dense phase zone is roughly between 400 and 800 kg/m3, while that in the dilute phase zone is between 0 and 15 kg/m3. In 2#FB, the solid suspension density in the bottom dense phase zone is roughly between 400 and 800 kg/m3, while that in the dilute phase zone is between 0 and 20 kg/m3. When the static bed height increases, more solids participate in the solid circulation loop in the reactor, which leads to the increase in the solid suspension density of the dense phase zone of the two risers, and thus intensifies the heat and mass transfer in this region. The influence of static bed height on the solid suspension density of the dilute phase zone is limited.

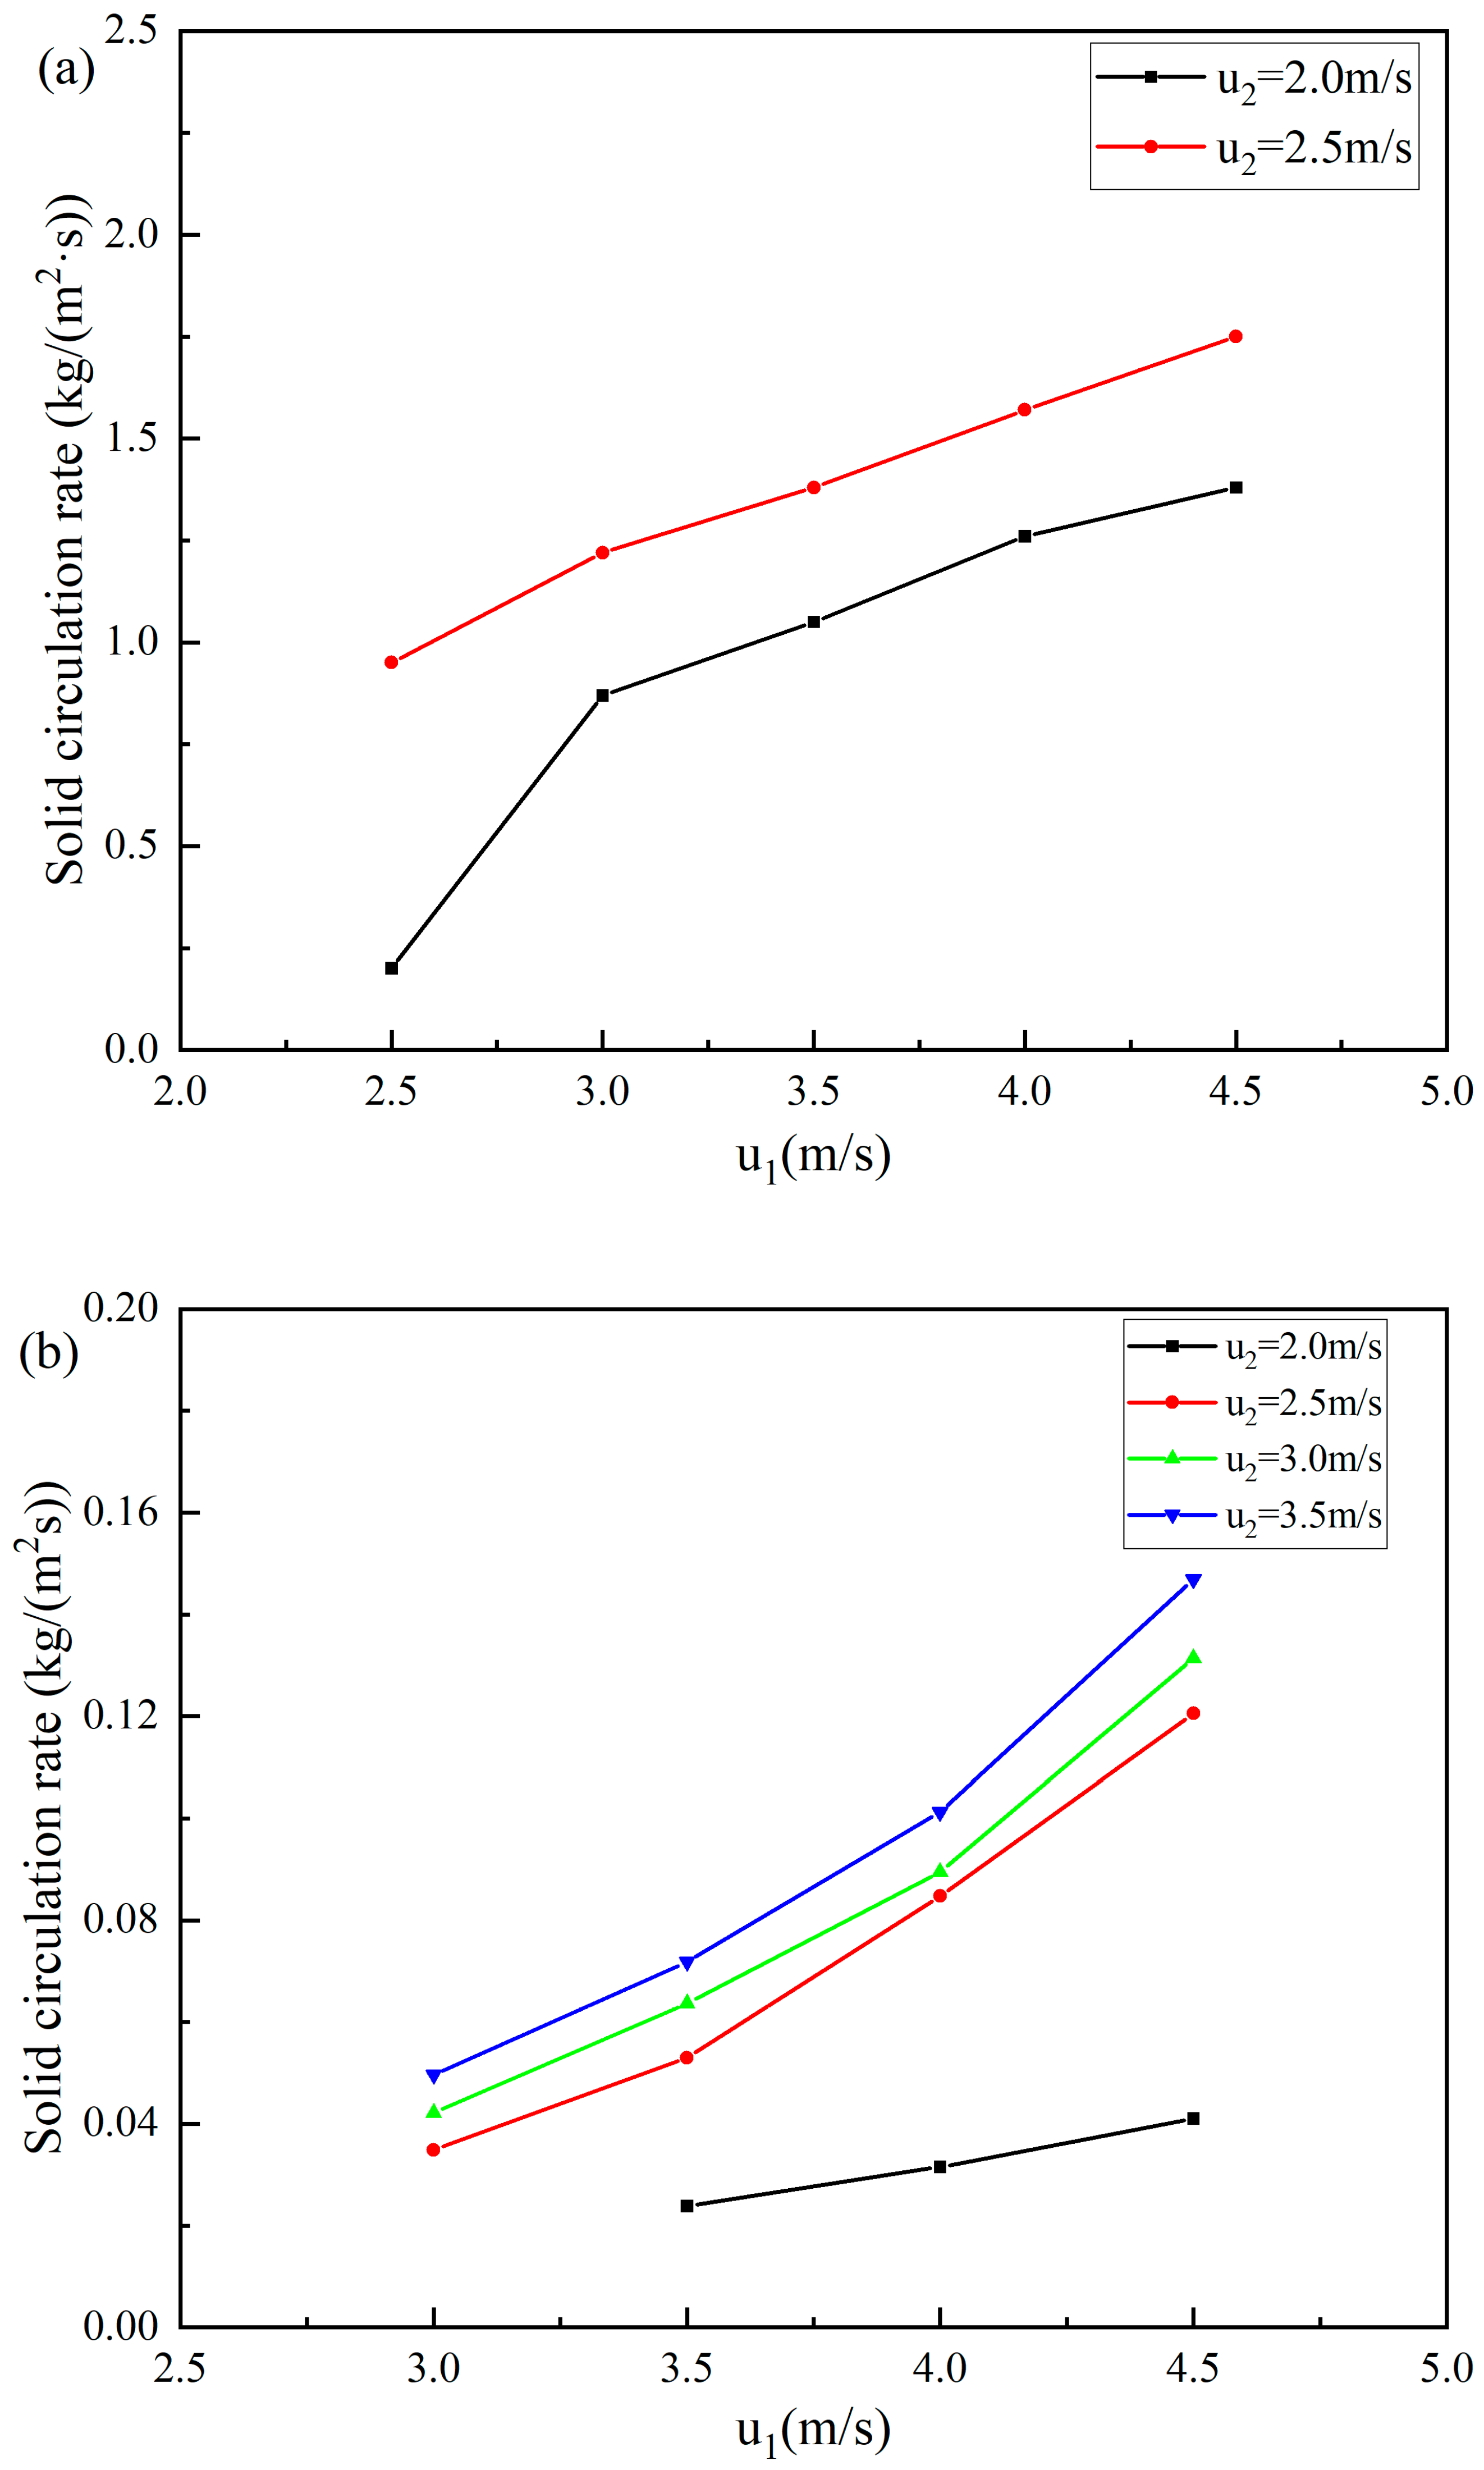
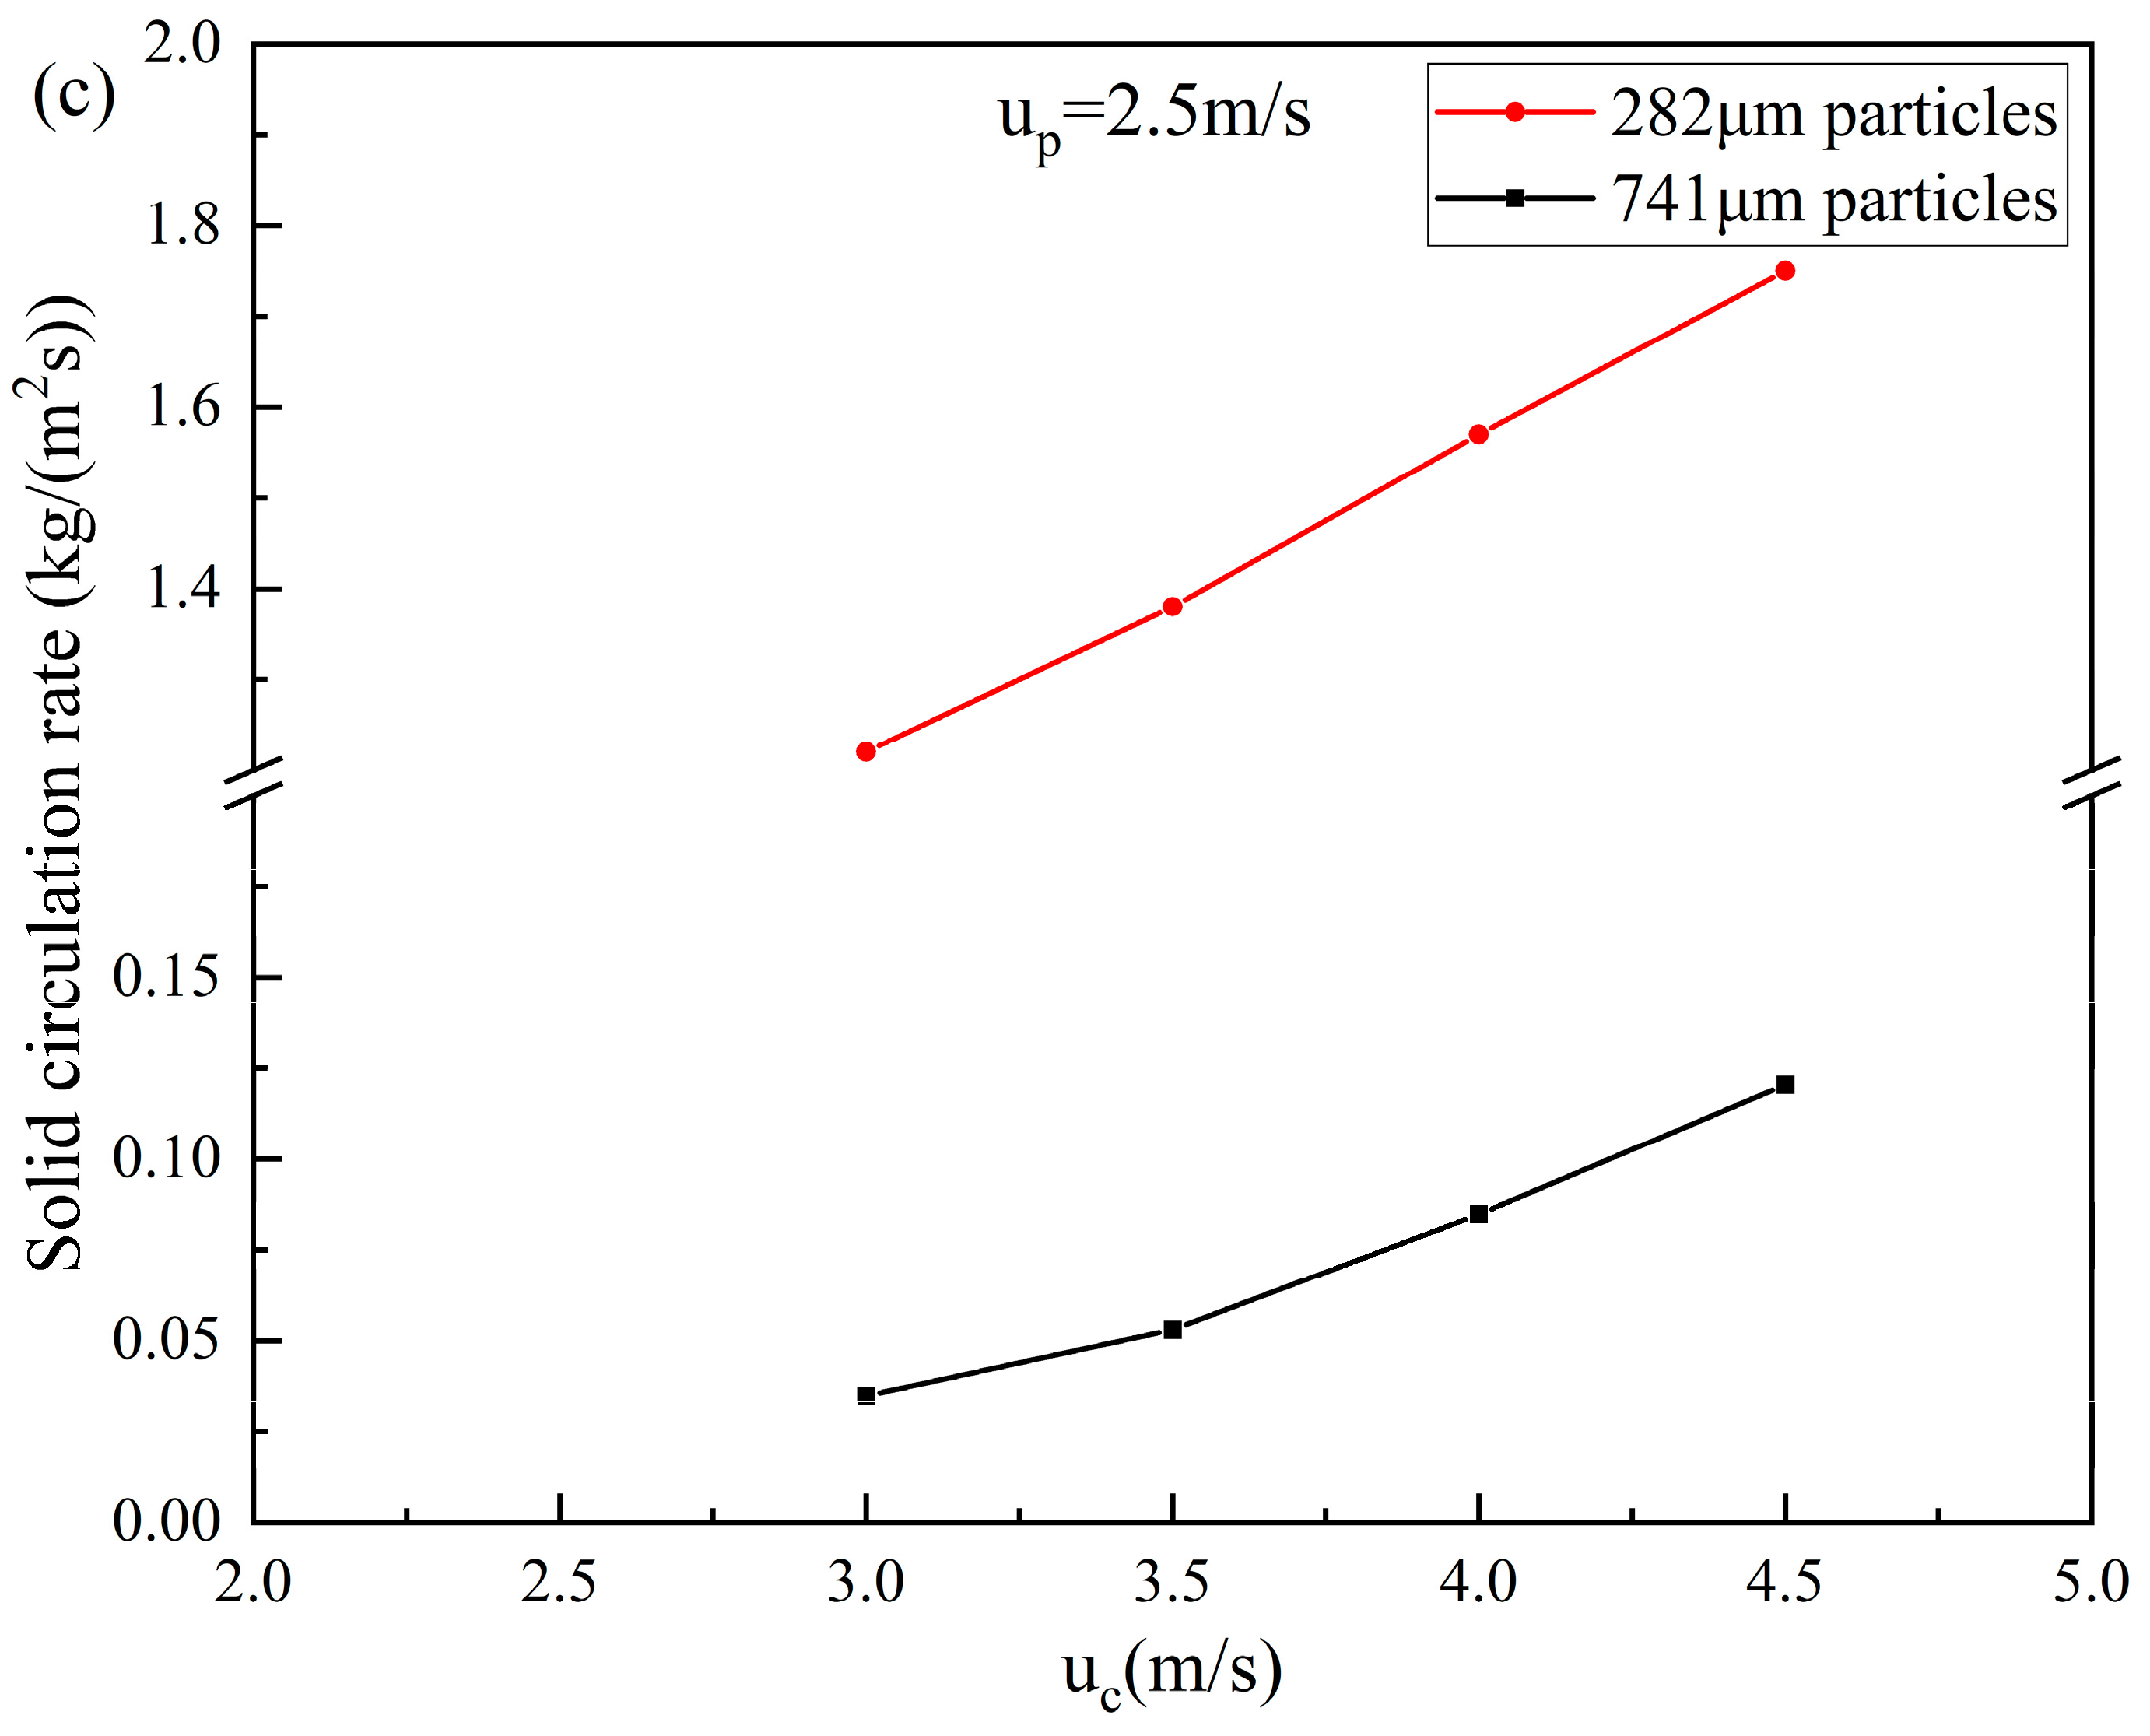
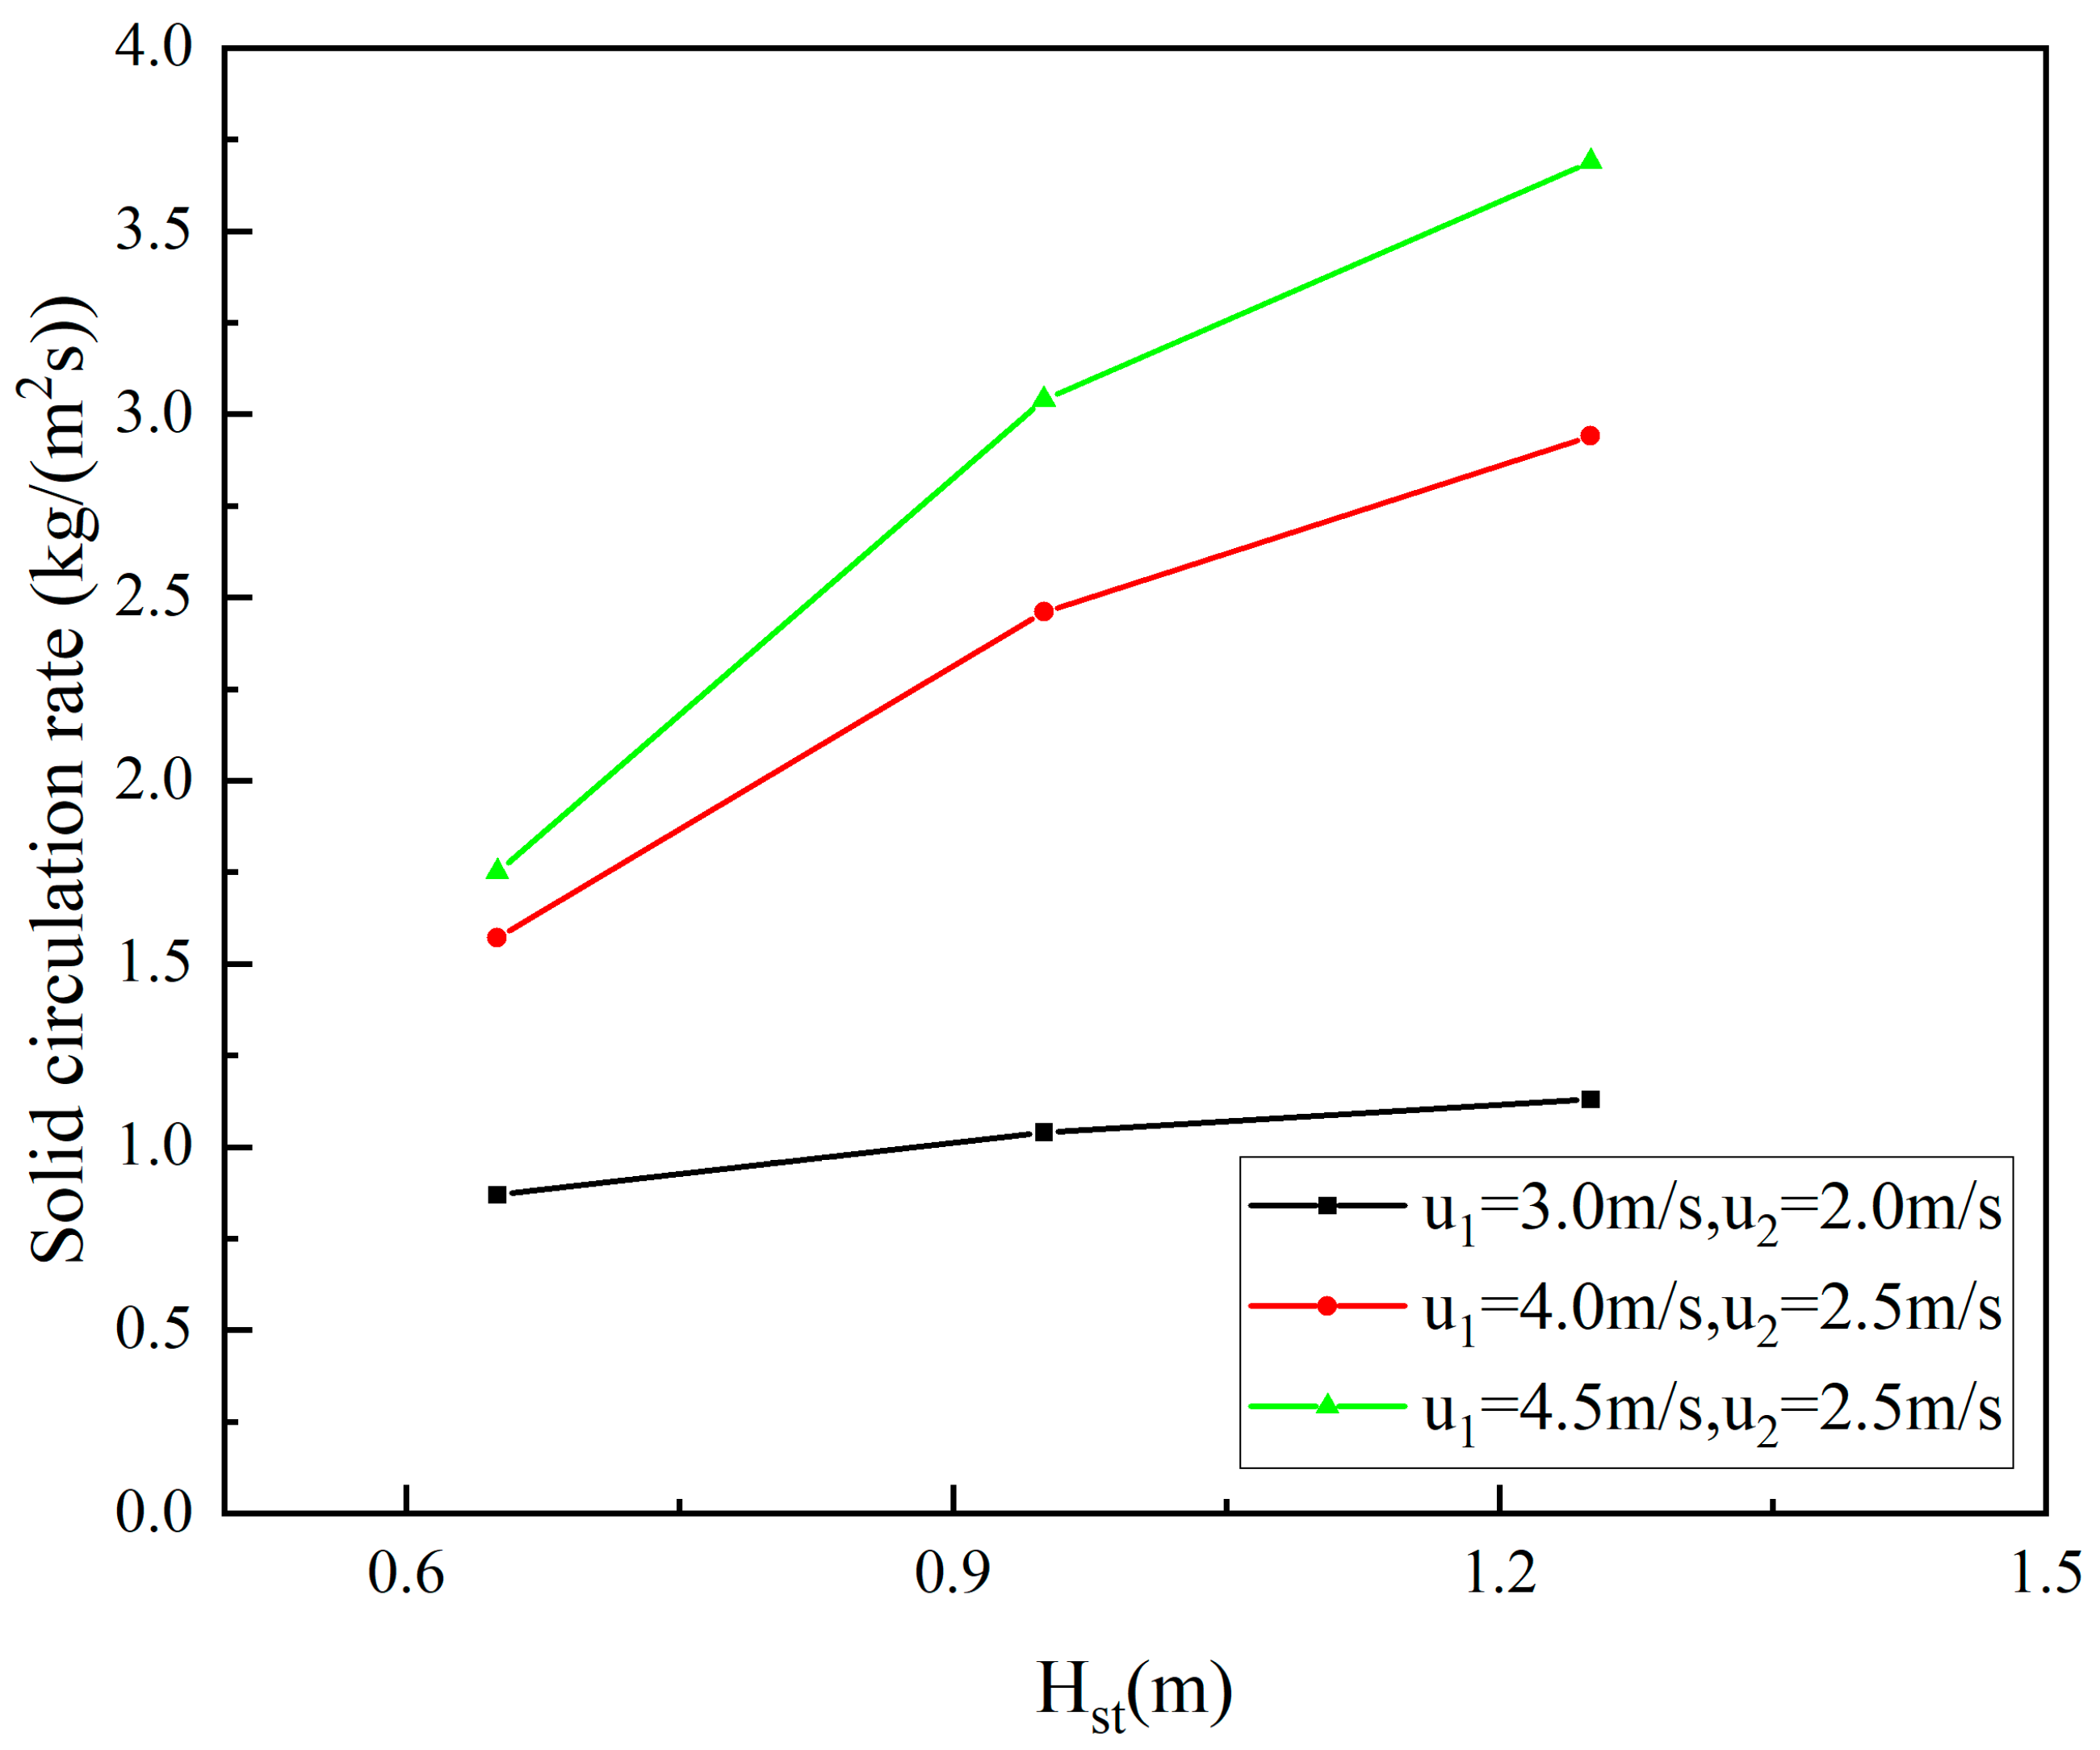
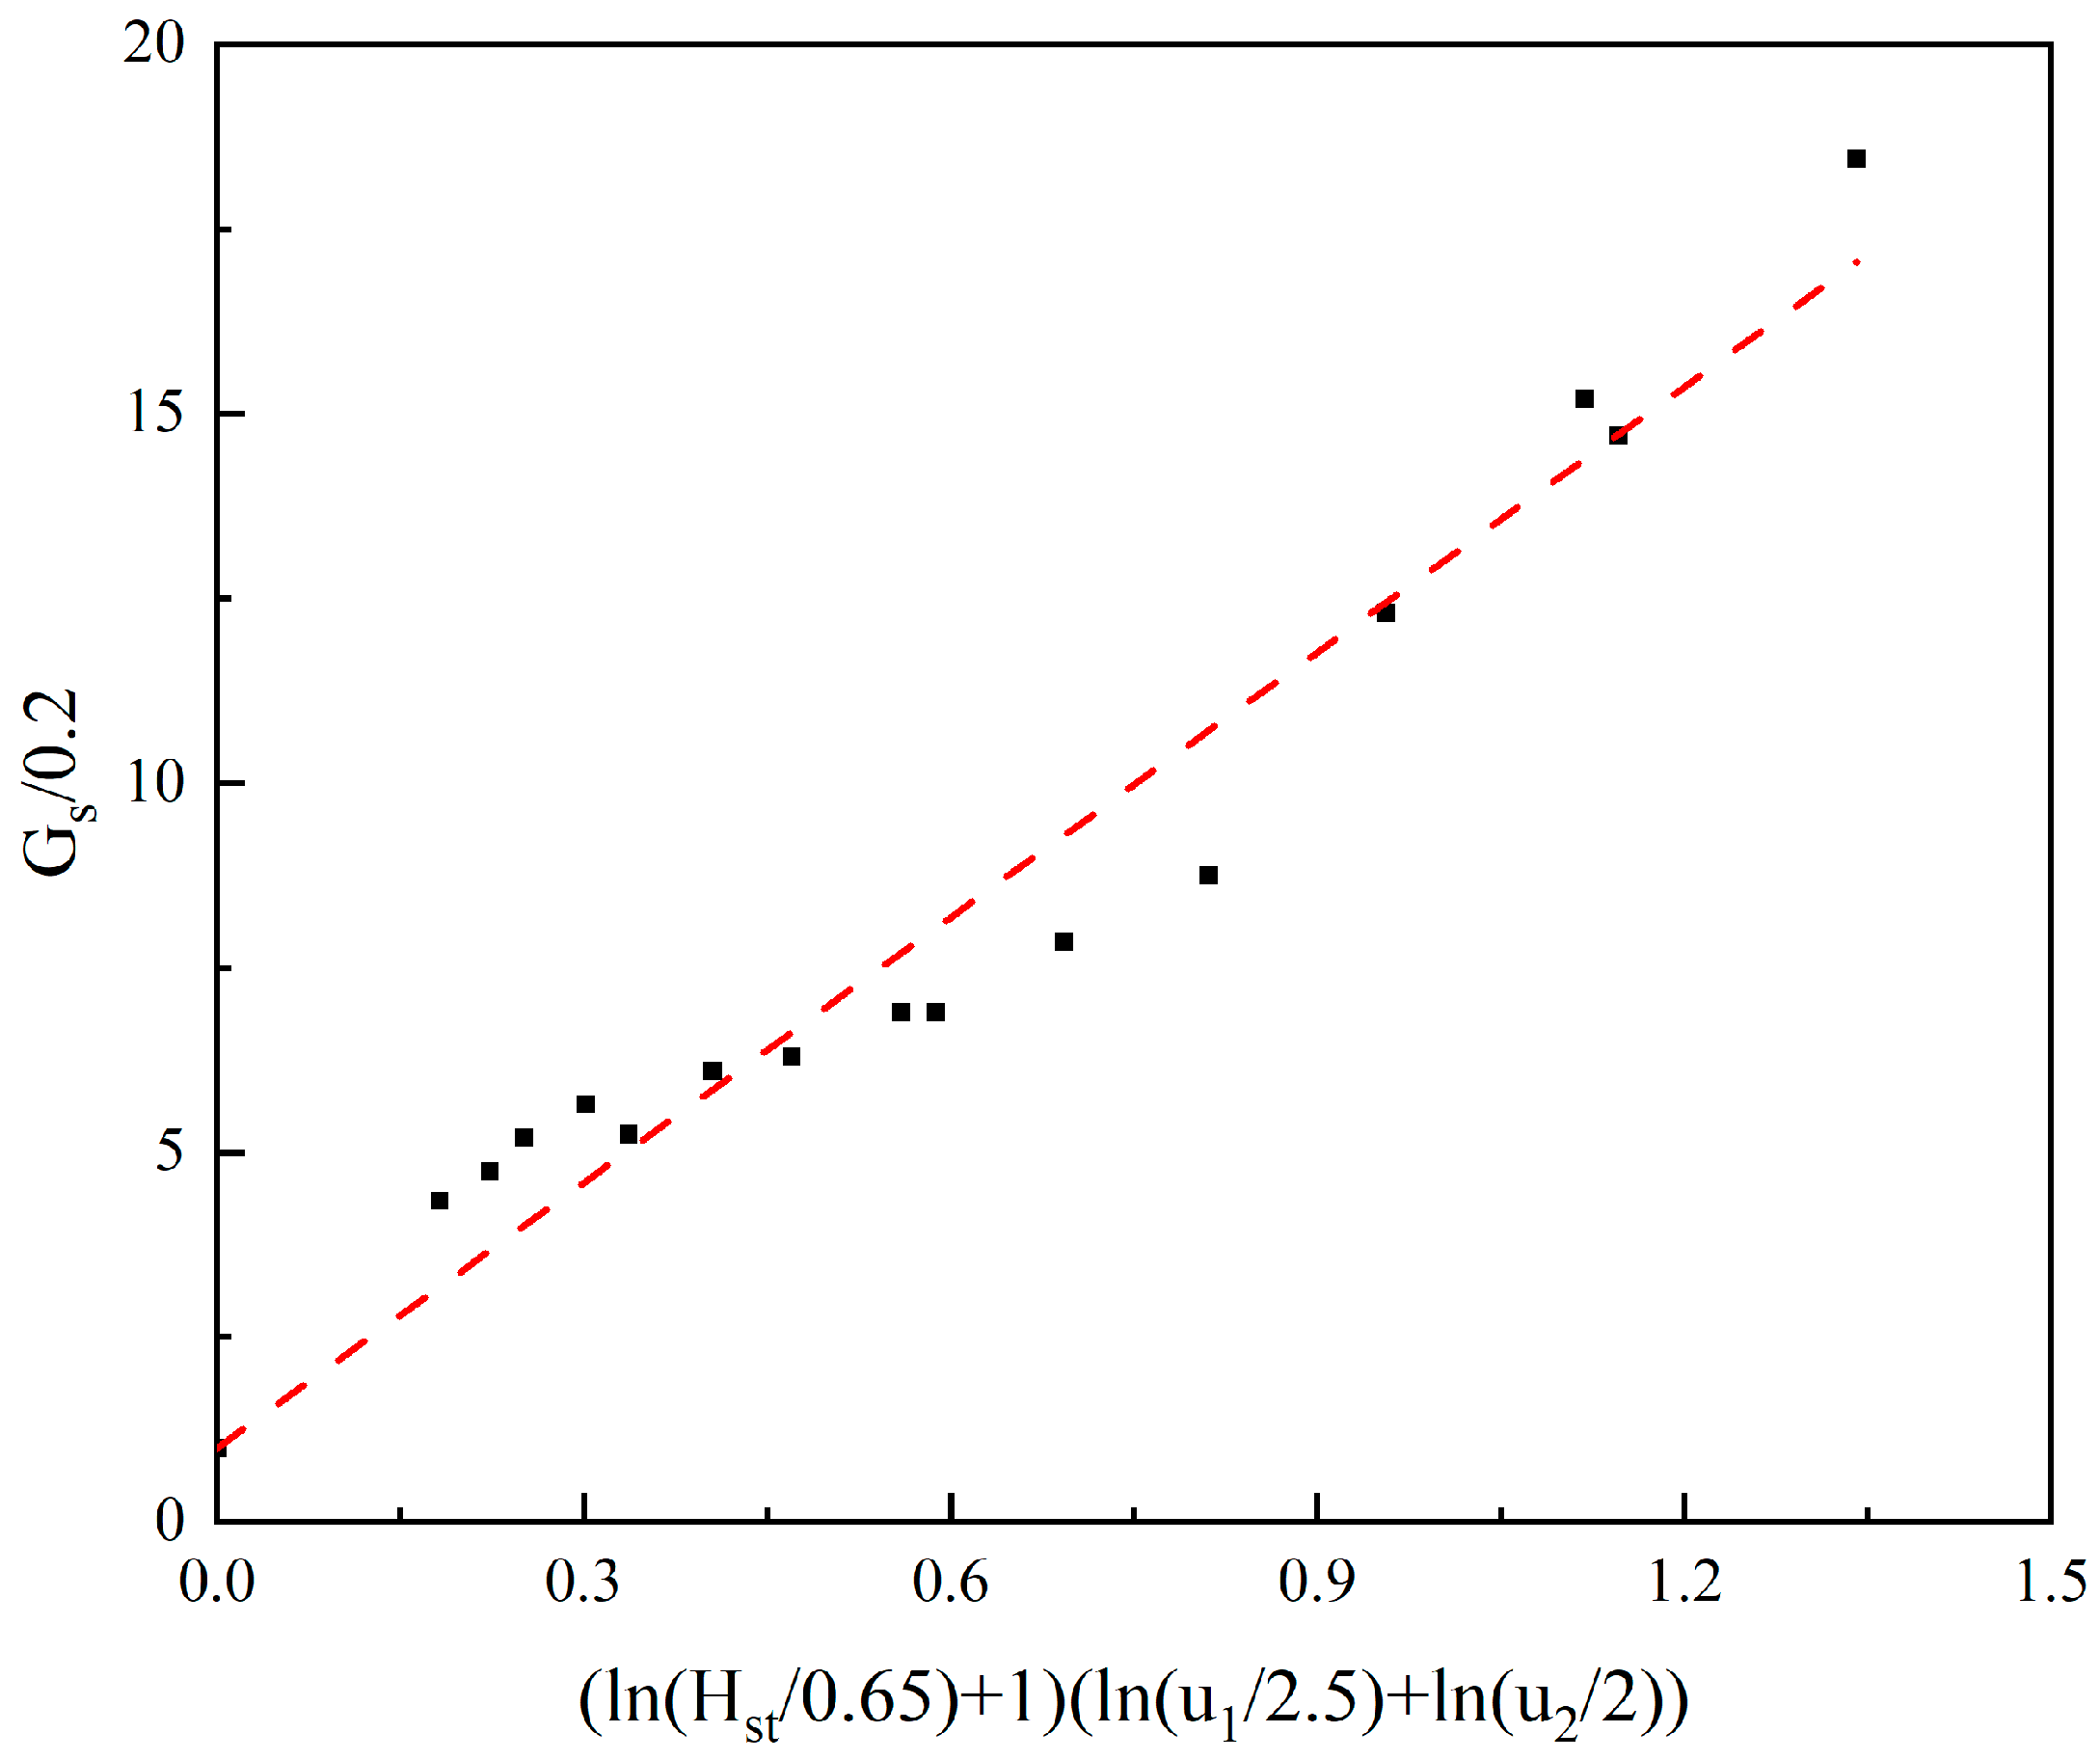
3.3. The Effects of Different Parameters on the Solid Circulation Rate

The solid circulation rate is positively correlated with the superficial gas velocity of both beds and yet negatively correlated with the particle size. Figure 8a shows the effects of the superficial gas velocity on the solid circulation rate when the static bed height is 0.65 m for 282-μm particles. In the figure, the abscissa is the superficial gas velocity of 1#FB, and the ordinate is the solid circulation rate. The two curves are the results when the superficial gas velocity of 2#FB is equal to 2 m/s and 2.5 m/s, respectively. As can be seen in the figure, for 282-μm particles, the solid circulation rate during steady operation is about 0.75–1.75 kg/(m2s), which is positively correlated with the superficial gas velocity of both two beds. Therefore, increasing the superficial gas velocity of two risers is conducive to the solid circulation between the two risers, ensuring the heat and mass transfer between the two risers and improve the efficiency of the system. It is worth mentioning that when the superficial gas velocity of 1#FB and 2#FB is 2.5 m/s and 2 m/s, respectively, the solid circulation rate deviates significantly from the normal range, indicating that the solid circulation loop in the reactor is not normal at this time. In conclusion, for 282-μm particles, the system can operate normally only when the superficial gas velocity of 1#FB and 2#FB is greater than 2.5 m/s and 2 m/s, respectively.
Figure 8b shows the effects of the superficial gas velocity on the solid circulation rate when the static bed height is 0.65 m for 641-μm particles. The four curves in the figure are the results when the superficial gas velocity of 2#FB is equal to 2, 2.5, 3 and 3.5 m/s respectively. It can be seen in the figure that for 641-μm particles, the solid circulation rate during steady-state operation is about 0.02–0.16 kg/(m2s), and its correlation with the superficial gas velocity is the same as that of 282-μm particles. When the superficial gas velocity of 1#FB and 2#FB is 3 m/s and 2 m/s respectively, it is hard to obtain the solid circulation rate during the experiment, which indicates that the reactor is not in a normal working state at this time. Apparently, the minimum superficial gas velocity required for normal operation is higher than 282-μm particles (2.5 m/s in 1#FB and 2 m/s in 2#FB).
Comparing the solid circulation rate of two types of particles in steady-state operation, it can be seen in Figure 8c that the increase in particle size greatly improves the difficulty of airflow carrying solid particles, which makes the solid circulation rate decrease by one order of magnitude, which seriously affects the solid circulation between the two risers. Therefore, the particle size should be reasonably low to enhance the efficiency of the system.
The static bed height has a positive influence on the solid circulation rate. The solid circulation rate is about 0.87–1.75, 1.04–3.04, and 1.13–3.69 kg/(m2s) when the static bed height is 0.65, 0.95, and 1.25 m, respectively. Figure 9 shows the effects of the static bed height on the solid circulation rate under different superficial gas velocity settings for 282-μm particles. In the figure, the horizontal coordinate is the static bed height, and the vertical coordinate is the solid circulation rate. The three curves are the results of three different superficial gas velocity settings. As can be seen in the figure, the solid circulation rate under the three steady-state operating conditions is about 1–4 kg/(m2s) and is positively correlated with the static bed height. Two more results can be observed in the figure. Firstly, when the static bed height is equal to 0.65 m, the effect of the increase in the superficial gas velocity on the solid circulation rate of the two risers is much lower than when the static bed height is equal to 0.95 m or 1.25 m. This shows that the influence of the superficial gas velocity has a marginally decreasing effect on the solid circulation rate. When the superficial gas velocity reaches a certain degree, the static bed height becomes the main factor restricting the solid circulation rate. Secondly, when the superficial gas velocity of 1#FB and 2#FB is equal to 3 m/s and 2 m/s, respectively, the effect of the increase in the static bed height on the solid circulation rate is much lower than that of the other two superficial gas velocity settings. This indicates that the static bed height also has a marginally decreasing effect. When the static bed height continuously increases until the amount of circulating solid in the reactor reaches the maximum transporting capacity of the given superficial velocity, the solid circulating rate of the reactor reaches its limit. Therefore, during the actual operation in production, it is necessary to fully consider the relationship between the static bed height (reflecting the total amount of materials in the reactor) and the superficial gas velocity of the two risers (reflecting the transporting capacity), so as to effectively increase the solid circulation rate of the reactor, consequently improving the heat and mass transfer effect and in the end improve the efficiency of the reactor.
Figure 10 shows the fitting between the solid circulation rate of 282-μm particles and the superficial gas velocity of 1#FB, the superficial gas velocity of 2#FB, and the static bed height. During fitting, the parameters in the fitting formula were nondimensionalized based on the situation that the static bed height is 0.65 m, the superficial gas velocity of 1#FB is 2.5 m/s and the superficial gas velocity of 2#FB is 2 m/s when the solid circulation rate is 0.2 kg/(m2s). Since the three parameters comprehensively affect the solid circulation rate and their effects all have marginally diminishing effect, the following form is adopted for fitting:
G s 0.2 = a ln H st 0.65 + 1 ln u 1 2.5 + ln u 2 2 + 1
where, Gs is the solid circulation rate, in kg/(m2s); a is a constant defined after fitting; Hst is the static bed height in m; u1 is the superficial gas velocity of 1#FB, in m/s; and u2 is the superficial gas velocity of 2#FB, in m/s.
Table 5 shows the specific values of the solid circulation rate under different parameters and the processing results according to the above formula. After fitting using the above data, a = 11.81 is obtained, and the empirical equation is as follows:
G s = 2.362 ln H st 0.65 + 1 ln u 1 2.5 + ln u 2 2 + 0.2 ,   R 2 = 0.9816
In this work, the solid circulation rate is about 0.87–1.75, 1.04–3.04, and 1.13–3.69 kg/(m2s) when the static bed height is 0.65, 0.95, and 1.25 m respectively. The results of different works are compared in Table 6. It can be easily seen that both the particle diameter and the maximum height of the riser have a significant influence on the solid circulation rate.

3.4. The Effects of Different Parameters on the Solid Inventory Distribution Ratio

Figure 11 shows the fitting between the solid inventory distribution ratio of 282-μm particles and the superficial gas velocity of 1#FB, the superficial gas velocity of 2#FB, and the static bed height. The following form is used for fitting [15]:
I = a u 2 u 1 bH st H
where, I is the solid inventory distribution ratio; u1 is the superficial gas velocity of 1#FB, in m/s; u2 is the superficial gas velocity of 2#FB, in m/s; Hst is the static bed height, in m; H is the height of 1#FB, which is 21.6 m; and a and b are constants defined after fitting.
Table 7 shows the specific values of the solid inventory distribution ratio under different parameters and the processing results according to the above formula. After fitting using the above data, a = 21.85 and b = 123.38 are obtained by fitting, and the R2 of the empirical equation was 0.9698.
It can be concluded from this empirical equation that the higher the superficial gas velocity of 1#FB or the higher the static bed height, the smaller the ratio (the closer it is to one). This can be explained in the following two ways. On the one hand, as mentioned above, when other conditions remain unchanged, the increase in the superficial gas velocity of 1#FB makes the material in the 1#FB side transfer to the 2#FB side, which apparently makes the ratio smaller. On the other hand, when other conditions remain unchanged, the higher the static bed height is, with the absolute difference of material amount between the two risers almost unchanged, the smaller the relative difference is, which makes the ratio smaller. Therefore, the material balance between the two risers can be adjusted by reasonably setting the superficial gas velocity of the two risers and the static bed height.

4. Conclusions

In this paper, a DFB cold mode test system with a maximum height of 21.6 m was built independently and relevant experiments were carried out. The results show that the system can operate normally and stably. The research results in this paper can provide a reference for the design and operation of large-scale DFB reactor systems. Relevant conclusions are summarized as follows:
  • The pressure in the two risers reaches a relatively balanced state, with the superficial gas velocity and the static bed height having a comprehensive influence on the pressure balance of the two risers. The increase in the superficial gas velocity of 1#FB will decrease the bottom pressure of 1#FB and increase that of 2#FB, and also have a positive effect on the pressure of the dilute phase zone of the two risers. The increase in the static bed height can significantly increase the pressure in the risers.
  • Increasing the superficial gas velocity on one side will cause the material balance to shift to the other side and enhance the heat and mass transfer in the other side. Meanwhile, the solid suspension density in the dilute phase zone of the two risers is increased to enhance the heat and mass transfer in the dilute phase zone. With the increase in the static bed height, the solid suspension density of the dense phase zone increases, which intensifies the heat and mass transfer in this zone. The influence of static bed height on the solid suspension density of the dilute phase zone is limited.
  • Increasing the superficial gas velocity of the two risers or the static bed height is helpful to promote the material circulation between the two risers, so as to ensure heat and mass transfer between the two risers and improve the efficiency of the system and yet the effects of both have diminishing, marginal effect. The particle size has a significant effect on the solid circulation rate. Different particle sizes require different minimum operating conditions. The empirical equation of solid circulation rate proposed in this paper can provide a reference for production operations.
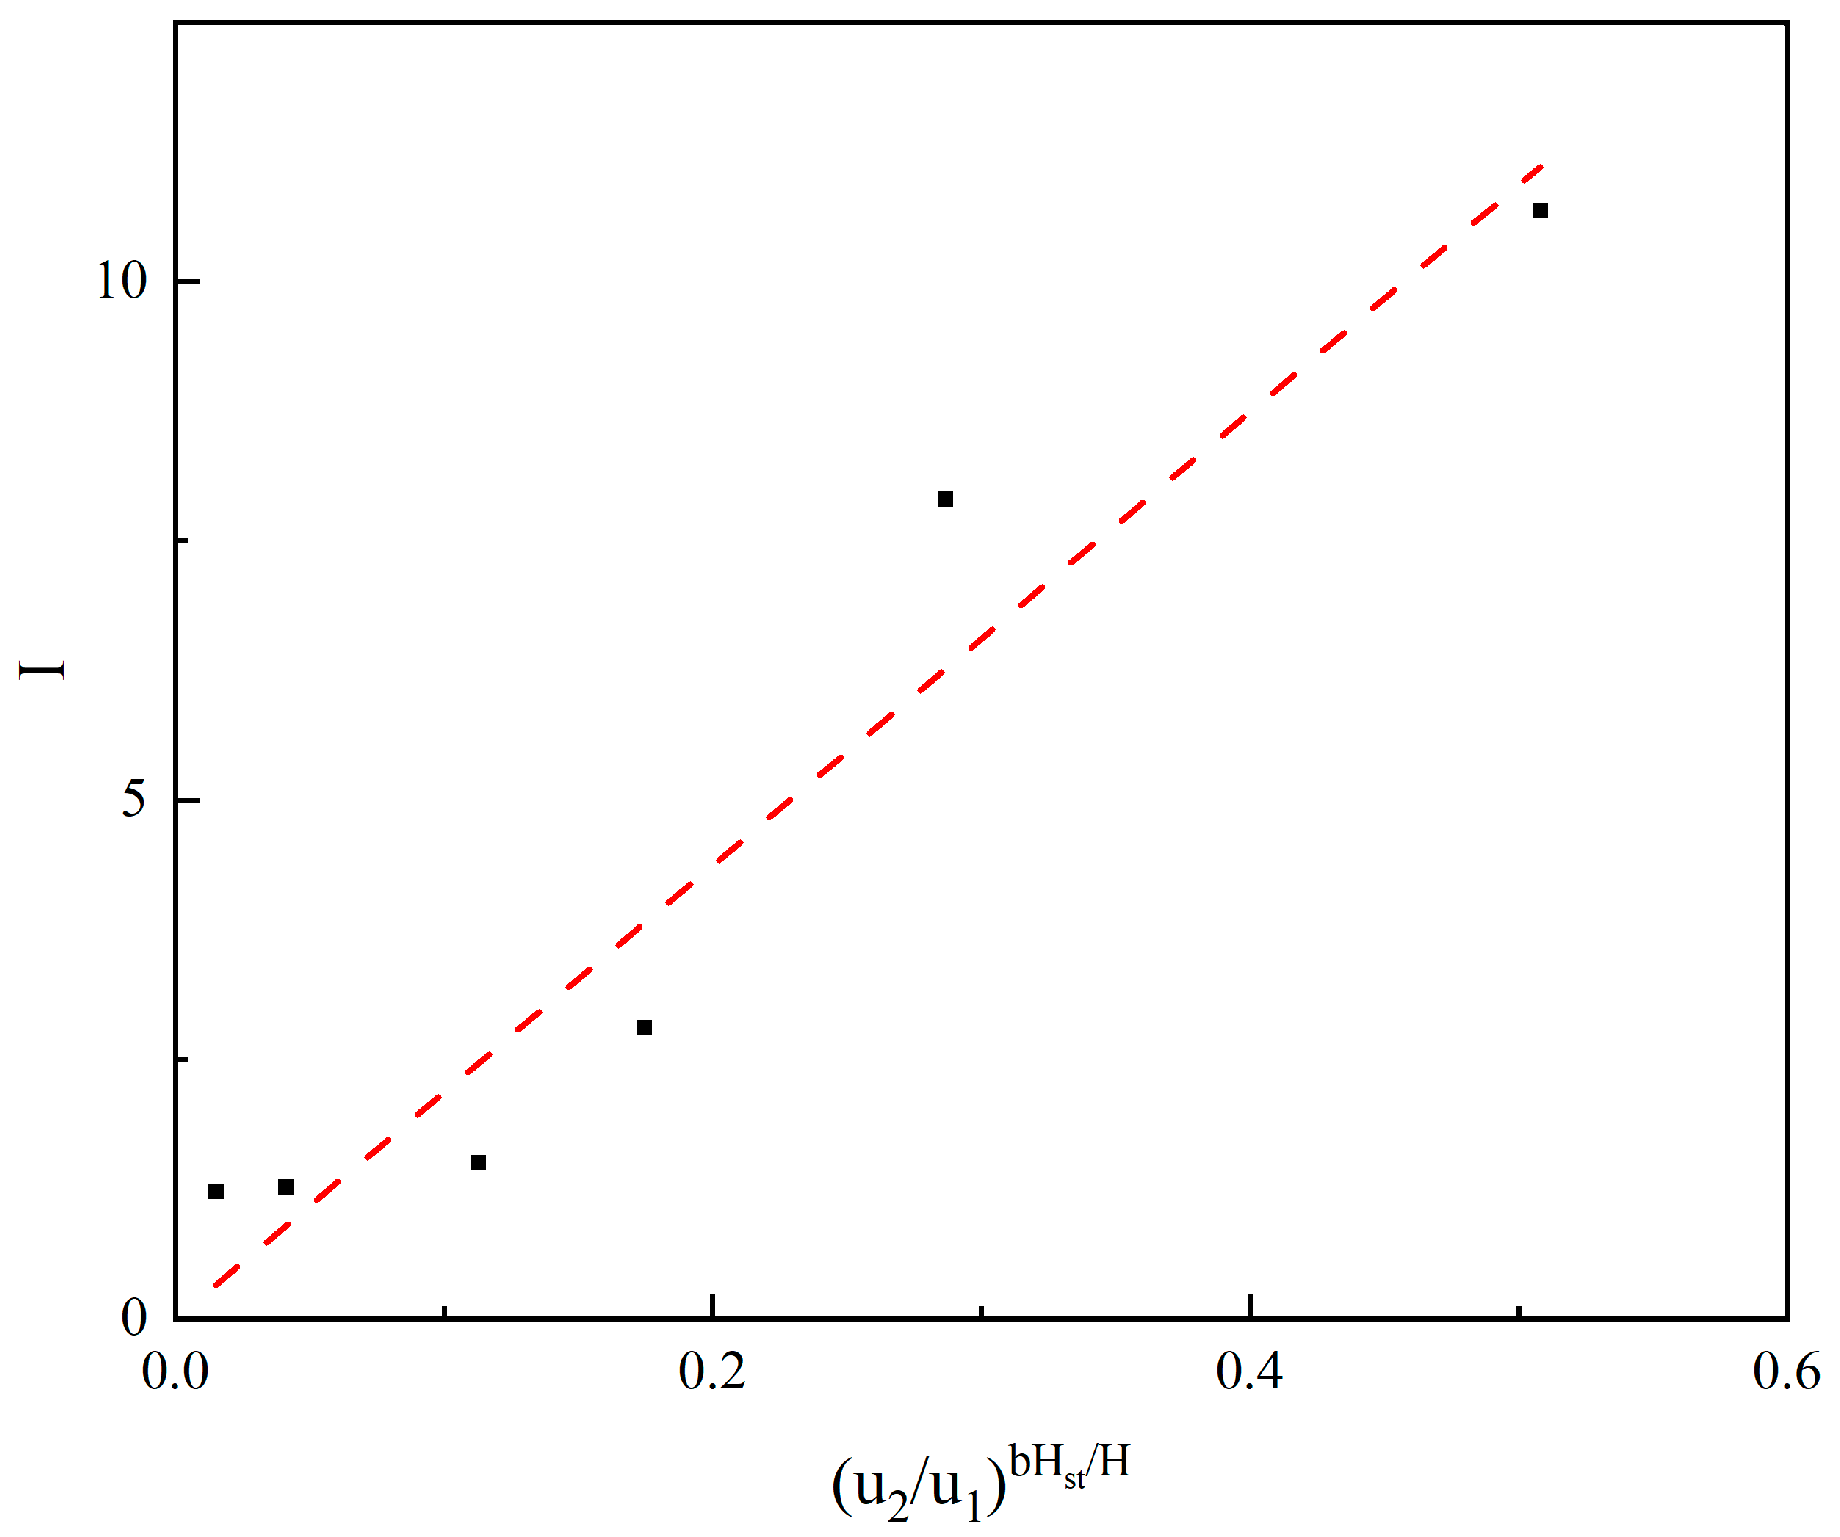
  • The empirical equation of the solid inventory distribution ratio proposed in this paper shows that the material balance between two risers can be adjusted by reasonably setting the superficial gas velocity of the two risers and the static bed height.

Author Contributions

Conceptualization, Q.W. and H.F.; Methodology, Y.L., Q.W. and C.Y.; Investigation, Y.L. and C.Y.; Writing—original draft, Y.L.; Writing—review & editing, Y.Z. All authors have read and agreed to the published version of the manuscript.

Funding

This work was supporting by the Chinese National Natural Science Fund [No.52076138] and the Fundamental Research Funds for the Central Universities [2022ZFJH004].

Data Availability Statement

The data presented in this study are available on request from the corresponding author. The data are not publicly available due to privacy.

Conflicts of Interest

The authors declare that they have no known competing financial interests or personal relationships that could have appeared to influence the work reported in this paper.

Nomenclature

Symbols
Δmaccumulated mass of solid in the standpipe within a period of time (kg)
ΔPoverall pressure drop in the riser (Pa)
Across-sectional area of the riser (m2)
Gssolid circulation rate (kg/m2s)
ggravity constant (m/s2)
Hststatic bed height (m)
Isolid inventory distribution ratio (-)
msolid mass in riser (kg)
ttime (s)
usuperficial gas velocity (m/s)
ρsolid suspension density (kg/m3)
Subscripts
11#FB
22#FB
Abbreviations
1#FB1# fluidized bed
2#FB2# fluidized bed

References

  1. Hanchate, N.; Ramani, S.; Mathpati, C.S.; Dalvi, V.H. Biomass gasification using dual fluidized bed gasification systems: A review. J. Clean. Prod. 2021, 280, 123148. [Google Scholar] [CrossRef]
  2. Ghasem, N.M.; Ang, W.L.; Hussain, M.A. Dynamics and stability of ethylene polymerization in multizone circulating reactors. Korean J. Chem. Eng. 2009, 26, 603–611. [Google Scholar] [CrossRef]
  3. Daneshmand-Jahromi, S.; Sedghkerdar, M.H.; Mahinpey, N. A review of chemical looping combustion technology: Fundamentals, and development of natural, industrial waste, and synthetic oxygen carriers. Fuel 2023, 341, 127626. [Google Scholar] [CrossRef]
  4. McLaughlin, H.; Littlefield, A.A.; Menefee, M.; Kinzer, A.; Hull, T.; Sovacool, B.K.; Bazilian, M.D.; Kim, J.; Griffiths, S. Carbon capture utilization and storage in review: Sociotechnical implications for a carbon reliant world. Renew. Sustain. Energy Rev. 2023, 177, 113215. [Google Scholar] [CrossRef]
  5. Schmid, J.C.; Benedikt, F.; Fuchs, J.; Mauerhofer, A.M.; Müller, S.; Hofbauer, H. Syngas for biorefineries from thermochemical gasification of lignocellulosic fuels and residues—5 years’ experience with an advanced dual fluidized bed gasifier design. Biomass Convers. Biorefinery 2021, 11, 2405–2442. [Google Scholar] [CrossRef]
  6. Pröll, T.; Rupanovits, K.; Kolbitsch, P.; Bolhàr-Nordenkampf, J.; Hofbauer, H. Cold Flow Model Study on a Dual Circulating Fluidized Bed (DCFB) System for Chemical Looping Processes. Chem. Eng. Technol. 2009, 32, 418–424. [Google Scholar] [CrossRef]
  7. Zhou, C.; Chen, L.; Liu, C.; Wang, J.; Xing, X.; Liu, Y.; Chen, Y.; Chao, L.; Dai, J.; Zhang, Y.; et al. Interconnected pyrolysis and gasification of typical biomass in a novel dual fluidized bed. Energy Convers. Manag. 2022, 271, 116323. [Google Scholar] [CrossRef]
  8. Charitos, A.; Hawthorne, C.; Bidwe, A.R.; Korovesis, L.; Schuster, A.; Scheffknecht, G. Hydrodynamic analysis of a 10 kWth Calcium Looping Dual Fluidized Bed for post-combustion CO2 capture. Powder Technol. 2010, 200, 117–127. [Google Scholar] [CrossRef]
  9. Gupta, S.; De, S. Investigation of cold flow hydrodynamics in a dual fluidized bed for gasification of high-ash coal. Powder Technol. 2021, 384, 564–574. [Google Scholar] [CrossRef]
  10. Liu, Y.; Huo, P.; Li, X.; Qi, H. Numerical study of coal gasification in a dual-CFB Plant based on the generalized drag model QC-EMMS. Fuel Process. Technol. 2020, 203, 106363. [Google Scholar] [CrossRef]
  11. Wei, Y.; Cheng, L.; Li, L. An analysis approach of mass and energy balance in a dual-reactor circulating fluidized bed system. Chin. J. Chem. Eng. 2021, 40, 18–26. [Google Scholar] [CrossRef]
  12. Ohlemüller, P.; Alobaid, F.; Gunnarsson, A.; Ströhle, J.; Epple, B. Development of a process model for coal chemical looping combustion and validation against 100 kWth tests. Appl. Energy 2015, 157, 433–448. [Google Scholar] [CrossRef]
  13. Ohlemüller, P.; Alobaid, F.; Abad, A.; Adanez, J.; Ströhle, J.; Epple, B. Development and validation of a 1D process model with autothermal operation of a 1 MW th chemical looping pilot plant. Int. J. Greenh. Gas Control 2018, 73, 29–41. [Google Scholar] [CrossRef]
  14. Sahir, A.H.; Dansie, J.K.; Cadore, A.L.; Lighty, J.S. A comparative process study of chemical-looping combustion (CLC) and chemical-looping with oxygen uncoupling (CLOU) for solid fuels. Int. J. Greenh. Gas Control 2014, 22, 237–243. [Google Scholar] [CrossRef]
  15. Wei, Y.; Cheng, L.; Wu, E.; Li, L. Experimental research on steady-state operation characteristics of gas–solid flow in a 15.5 m dual circulating fluidized bed system. Chin. J. Chem. Eng. 2021, 32, 70–76. [Google Scholar] [CrossRef]
  16. Han, C.; Hu, L.; Song, T.; Zhang, Y.; Lyu, J.; Zhang, H.; Liu, Q.; Ma, S. Effect of bed material size on gas-solid flow characteristics in a CFB at low solid recirculation rates. Fuel 2023, 333, 126354. [Google Scholar] [CrossRef]
  17. Hu, J.; Liu, D.; Li, H.; Liang, C.; Chen, X. Experimental study of the solid circulation rate in a pressurized circulating fluidized bed. Particuology 2021, 56, 207–214. [Google Scholar] [CrossRef]
  18. Rahman, M.H.; Bi, X.T.; Grace, J.R.; Lim, C.J. Comparison of techniques for measuring CFB solids circulation rates at low and high temperatures. Powder Technol. 2020, 360, 43–54. [Google Scholar] [CrossRef]
  19. Hu, J.; Liu, D.; Liang, C.; Ma, J.; Chen, X.; Zhang, T. Solids flow characteristics and circulation rate in an internally circulating fluidized bed. Particuology 2021, 54, 69–77. [Google Scholar] [CrossRef]
  20. Armatsombat, A. An investigation of the aeration proportion effect at the supply and recycle chambers on the optimal operation point of the U-type loop seal and the maximum solid circulation rate in a fluidized bed reactor. Adv. Powder Technol. 2023, 34, 104196. [Google Scholar] [CrossRef]
  21. Varghese, M.M.; Vakamalla, T.R.; Gujjula, R.; Mangadoddy, N. Prediction of solid circulation rate in an internal circulating fluidized bed: An empirical and ANN approach. Flow Meas. Instrum. 2022, 88, 102274. [Google Scholar] [CrossRef]
  22. Kim, D.; Won, Y.; Hwang, B.W.; Kim, J.Y.; Kim, H.; Choi, Y.; Lee, Y.-R.; Lee, S.-Y.; Jo, S.-H.; Park, Y.C.; et al. Loop-seal flow characteristics of a circulating fluidized bed for 3 MWth scale chemical looping combustion system. Energy 2023, 274, 127271. [Google Scholar] [CrossRef]
  23. Geldart, D. Types of gas fluidization. Powder Technol. 1973, 7, 285–292. [Google Scholar] [CrossRef]
  24. Karl, J.; Pröll, T. Steam gasification of biomass in dual fluidized bed gasifiers: A review. Renew. Sustain. Energy Rev. 2018, 98, 64–78. [Google Scholar] [CrossRef]
Figure 1. Schematic of the experiment system.
Energies 16 07239 g001
Figure 2. Typical operating state: (a) 2#FB; (b) 1#FB; (c) Loop-seal.
Energies 16 07239 g002
Figure 3. Particle size distribution.
Energies 16 07239 g003
Figure 4. The effects of superficial gas velocity of 1#FB on the distribution of pressure drop along the riser height of (a) 1#FB and (b) 2#FB.
Energies 16 07239 g004
Figure 5. The effects of static bed height on the distribution of pressure drop along the riser height of (a) 1#FB and (b) 2#FB.
Energies 16 07239 g005
Figure 6. The effects of superficial gas velocity of 1#FB on the distribution of solid suspension density along the riser height of (a) 1#FB and (b) 2#FB.
Energies 16 07239 g006
Figure 7. The effects of static bed height on the distribution of solid suspension density along the riser height of (a) 1#FB and (b) 2#FB.
Energies 16 07239 g007
Figure 8. The effects of the superficial gas velocity on the solid circulation rate: (a) 282-μm particles; (b) 641-μm particles; (c) Comparison.
Energies 16 07239 g008aEnergies 16 07239 g008b
Figure 9. The effects of the static bed height on the solid circulation rate.
Energies 16 07239 g009
Figure 10. The solid circulation rate versus operating parameters.
Energies 16 07239 g010
Figure 11. The solid inventory distribution ratio I versus operating parameters.
Energies 16 07239 g011
Table 1. The specific roles of DFB reactors in various technologies.
Technology1# Fluidized Bed2# Fluidized Bed
Chemical-Looping CombustionAir reactorFuel reactor
Carbon-Capture Utilization and StorageCarbonatorRegenerator
Biomass GasificationCombustorGasifier
Table 2. The types and scales of the existing researches.
ResearchersTypeScale
Tobias Pröll et al. [6]Experiment1.80 m
Chunbao Zhou et al. [7]Experiment4.00 m
A. Charitos et al. [8]Experiment5.30 m
Saurabh Gupta et al. [9]Experiment2.25 m
Yang Liu et al. [10]CFD simulation60.0 m
Yangjun Wei et al. [11,15]Experiment & CFD simulation15.5 m & 11.2 m
Peter Ohlemuller et al. [12,13]Aspen simulation0.1 & 1 MWth
Asad H. Sahir et al. [14]Aspen simulation1, 10 & 100 MWth
Table 3. Size and structure design of main parts.
ItemValue
The height of 1#FB21.60 m
The cross-sectional area of 1#FB0.30 m × 0.40 m
The height of 2#FB14.40 m
The cross-sectional area of 2#FB0.25 m × 0.40 m
The relative height difference of the inlets7.20 m
The design of riser inletTapered
Table 4. Test condition.
ItemValueUnit
Superficial gas velocity of 1#FB2.5/3/3.5/4/4.5m/s
Superficial gas velocity of 2#FB2/2.5/3/3.5m/s
Static bed height of 1#FB0.65/0.95/1.25m
Average particle size282/641μm
Table 5. The specific values of the solid circulation rate under different parameters and the processing results.
Hst
(m)
u1
(m/s)
u2
(m/s)
Gs
(kg/m2s)
ln (Hst/0.65) + 1ln (u1/2.5)ln (u2/2)Gs/0.2
0.652.502.000.201.000.000.001.00
0.653.002.000.871.000.180.184.35
0.653.502.001.051.000.340.345.25
0.654.002.001.261.000.470.476.30
0.654.502.001.381.000.590.596.90
0.652.502.500.951.000.220.224.75
0.653.002.501.221.000.410.416.10
0.653.502.501.381.000.560.566.90
0.654.002.501.571.000.690.697.85
0.654.502.501.751.000.810.818.75
0.953.002.001.041.380.250.185.20
0.954.002.502.461.380.960.6912.30
0.954.502.503.041.381.120.8115.20
1.253.002.001.131.650.300.185.65
1.254.002.502.941.651.150.6914.70
1.254.502.503.691.651.340.8118.45
Table 6. Results of different work.
ResearchersMaximum Height of Riser (m)Particle Diameter (μm)Gs (kg/m2s)
Tobias Pröll et al. [24]1.8054/16140–60
Saurabh Gupta et al. [9]2.253226–24
This work21.602820.87–3.69
Table 7. The specific values of the solid inventory distribution ratio under different parameters and the processing results.
u1 (m/s)u2 (m/s)Hst (m)u2/u1Hst/HI
3.002.500.650.830.03010.69
3.502.500.650.710.0307.90
4.002.500.650.630.0302.81
4.502.500.650.560.0301.51
4.502.500.950.560.0441.27
4.502.501.250.560.0581.23
Disclaimer/Publisher’s Note: The statements, opinions and data contained in all publications are solely those of the individual author(s) and contributor(s) and not of MDPI and/or the editor(s). MDPI and/or the editor(s) disclaim responsibility for any injury to people or property resulting from any ideas, methods, instructions or products referred to in the content.

