Abstract
This article presents a novel model for the management of air cargo shipment screening. Previous research has focused solely on making the air cargo screening process as efficient as possible. These scientific papers did not look at the costs generated by the improper selection of technical equipment for the cargo handled. The challenge is to be able to complete the entire screening process in the expected time with the lowest possible energy consumption. This article presents a discrete-event simulation model for the balanced planning of air cargo screening. The innovation of this solution is the parallel analysis of process performance and energy consumption. The user receives two variables (energy consumption and process execution time) in relation to the number of cargo shipments handled. The user can therefore control the process by taking these variables into account. This will allow the user to find the right system configuration for the preferences desired. It is possible to strike a balance between achieved process efficiency and energy consumption. This approach has not been considered so far. Given that energy consumption constitutes 15% of operating costs at airports, this is an important issue that needs to be addressed.
1. Introduction
Cargo transport in aviation follows a complex cargo handling process. According to the current regulations [1], these tasks are carried out by a registered handling agent, who is also responsible for carrying out cargo security checks. The selection of screening equipment is strictly regulated, and screening methods are adapted to the type of cargo being screened. Cargo and mail are screened using one or more of the methods: manual inspection, X-ray screening, explosives detection system, explosives detection dog, explosive trace detection, visual inspection and metal detection. This means that, depending on the type of cargo and its complexity, one of the available screening methods can be used to ensure that the contents of the screened cargo do not raise safety concerns. Each of these methods has different labor hour consumptions, energy consumptions and process capacities. The improper selection of equipment and mismanagement of the cargo handling process are incurring significant losses for airports and cargo terminals.
Energy consumption costs airports as much as 15% of their operating expenses [2]. More than 75% of energy is consumed by terminal buildings and their equipment [3]. This equipment is dedicated precisely to the process of handling cargo. The remainder of the costs are for the maintenance of navigation infrastructure, runway lighting, taxiways, aprons, etc.
This article presents a novel simulation model that helps select a sustainable strategy when scheduling X-ray equipment for screening air cargo. The model returns cargo handling time and energy consumption by the type of device deployed as outputs. In practical terms, by knowing the stream of cargo handled (its size and level of consolidation), it is possible to select a suitable X-ray device that will provide a balance between process efficiency and electricity consumption. This newly developed model will help answer the research question: is it possible to control the baggage screening process at the airport to achieve the expected efficiency, reducing energy consumption?
The remainder of the article is divided as follows: Section 2 presents a research gap, demonstrating that the current literature has focused solely on process performance and not on costs from energy consumption. Section 3 presents a novel simulation model for X-ray equipment selection. Section 4 discusses the application of the model to a real system and presents model validation. Section 5 presents the analysis performed and discusses the results. Section 6 summarizes the achievements made.
2. State of the Art
Air cargo handling has been addressed many times in the literature. A very broad review of state-of-the-art approaches and studies on this topic until 2015 was conducted by Feng et al. [4]. More than 70 scientific papers were analyzed for the topics they covered in this review. It was noted that past research focused on several main topics: air cargo service operations/key players, revenue management, air cargo fleet planning and scheduling, aircraft loading, container loading, air cargo terminal operations and industrial strategy. The conclusion of this review was that energy consumption during cargo handling at the airport terminal was not considered as a research topic until 2015. According to the findings of this article, the category of air cargo terminal operations was crucial. This literature review has been expanded to include new content from 2016–2023.
Nobert and Roy [5] focused on minimizing process costs by selecting the correct number of employees. The same issue was addressed in several other works [6,7,8]. Hall [9] worked on reducing the time to complete an operation, and a similar issue was addressed by Lee et al. [10], where they reduced the overall duration of operations. Ou et al. [11] looked at the possibility of reducing costs arising from cargo storage. Xu et al. [12] focused on minimizing costs arising from cargo handling congestion.
The issue of sustainability has not been addressed so far. Research on terminal cargo handling so far has been one-sided, based on the desire to perform the process in the most efficient way and provide an adequate number of technical resources. The screening process was also not addressed as a pre-flight cargo handling step. Amorim da Cunha et al. [13] note that smaller and medium-sized airports incur higher security costs than larger airports due to low cargo and passenger traffic. Brandt and Nickel [14] summarized in their review that studies that address air cargo scheduling issues focus on aircraft configuration, built-up scheduling, air cargo palletization, weight and balance problems. They did not address the topic of security in their review.
It is important to note a change in trends within recent research work. Recent analyses have focused more on preventive and corrective actions when disruptions occur, rather than on process planning, as before. Delgado and Mora [15] studied the problem of rescheduling flights to respond to disruptions in cargo demand in the short term. To increase flexibility, they considered two different cargo allocation policies. Anguita and Olariaga [16] were of a similar opinion that the volatility of aviation cargo demand must be taken into account when planning the development or expansion of infrastructure. Delgado et al. [17] studied the problem of recovering the air traffic schedule to adapt to last-minute changes in demand caused by various disruptions. Lange [18] pointed out in his research that changing transportation policies and the increasing combination of cargo and passenger shipments were having a negative impact on the punctuality of passenger shipments.
In the scientific literature, there have been papers addressing energy consumption savings in air terminals. However, they have not directly addressed the implementation of the cargo handling process. For example, a thermal simulation for Greek airports was carried out by [19,20]. The simulation predicted up to 35% in potential gains. Ma et al. [21] established the relationship between indoor air flow and interior space to improve indoor comfort. Parker et al. [22] reduced the carbon footprint by improving the envelope of a glazed roof at a selected airport. Gowresuunker et al. [23] analyzed the efficiency of displacement ventilation for an airport terminal. Selected papers have looked at the prediction of power consumption in airport terminals. Chen [24] used an unbiased gray Markov model, whereas Huang et al. [25] relied on neural networks. Fan et al. [26] built a model based on probability density functions. Only [27] presented an analysis that explored the possibility of reducing energy consumption in the airport screening process. However, this was applied to passenger screening.
Summarizing the current state of the literature, it should be noted that there is a research gap on the possibility of reducing energy consumption in air cargo handling. This is especially true for the topic proposed in this work related to the planning and design of security control systems. The next chapter will propose a novel method dedicated to estimating energy consumption in the process of cargo screening at an air cargo terminal.
3. Methodology
This article proposes a discrete event simulation model. Such a method was chosen because of the random nature of the process, which can be described by probability density functions. According to the law of large numbers, the Monte-Carlo method will be applied. This method, through repeated simulation experiments, will allow us to obtain the expected values of the model output variables.
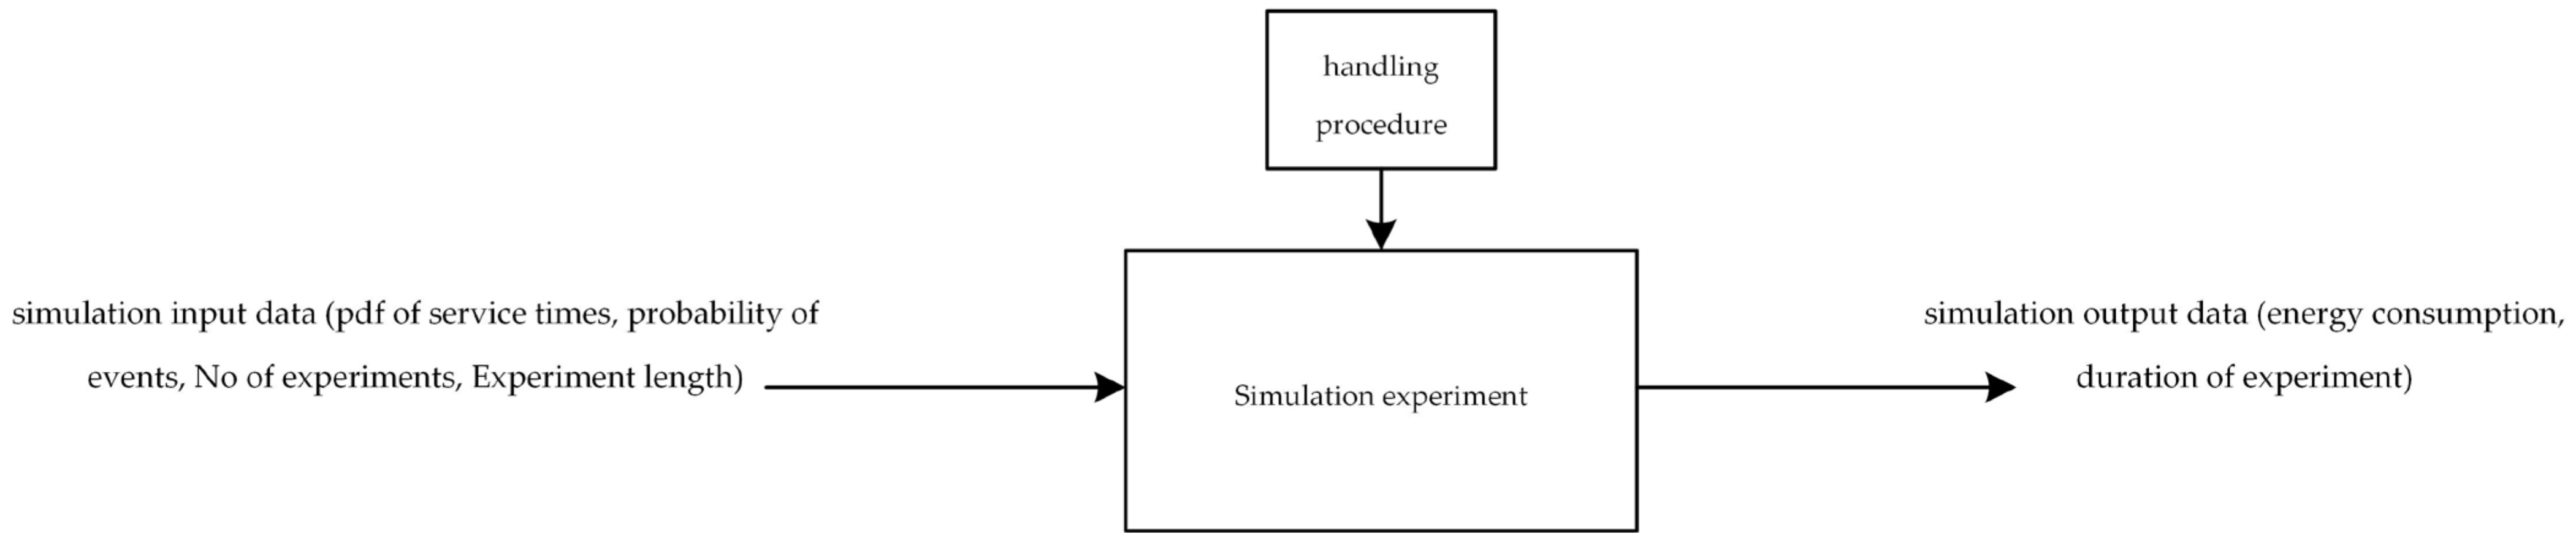
The general assumptions of the model are shown in Figure 1. The simulation model is based on an integrated process execution algorithm (handling procedure module). The user enters the input variables for each experiment that will determine the paths of event execution and times of occurrence of each event. These are probability density functions for the durations of individual events and the probabilities of their occurrence. The user also indicates how long the experiment should last by indicating the number of loads to be handled. The user is given the option to enter the number of repetitions for each experiment. As output variables, a vector of three variables is stored at the end of each load’s service: the load number, the time the service ended and the system’s current energy consumption.
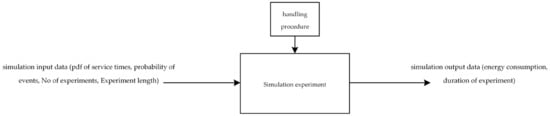
Figure 1.
Concept of the methodology adopted.
This simulation experiment module implements a Monte-Carlo simulation. By continuously repeating the simulation experiment, the expectation value of the data output vector is determined. The user decides how many times (N) the experiment will be repeated. Starting with the first repetition I = 1, the algorithm performs a simulation and calculates the expected value of the output variables for the I-th repetition. Then, the final output matrix is computed and the index I is changed to the next repetition. The procedure repeats until N repetitions are reached (Figure 2).
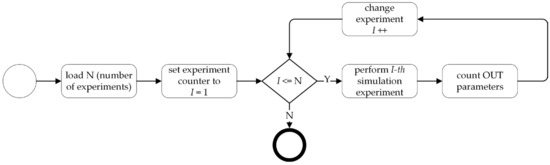
Figure 2.
Monte-Carlo simulation.
The data output matrix for each iteration of the simulation consists of rows, from i = 1 to n, which represent consecutive consolidated cargo loads that have been screened. The first column j = 1 of the matrix will denote the index of the next cargo shipment. The second column j = 2 will denote the current simulation time that the shipment screening was completed. The third column j = 3 will denote the current power consumption of the system, at the time the screening of the i-th cargo shipment was completed.
The actual iteration I of the experiment calculates the expected value of the output variables outij and generates the final output matrix OUT (2).
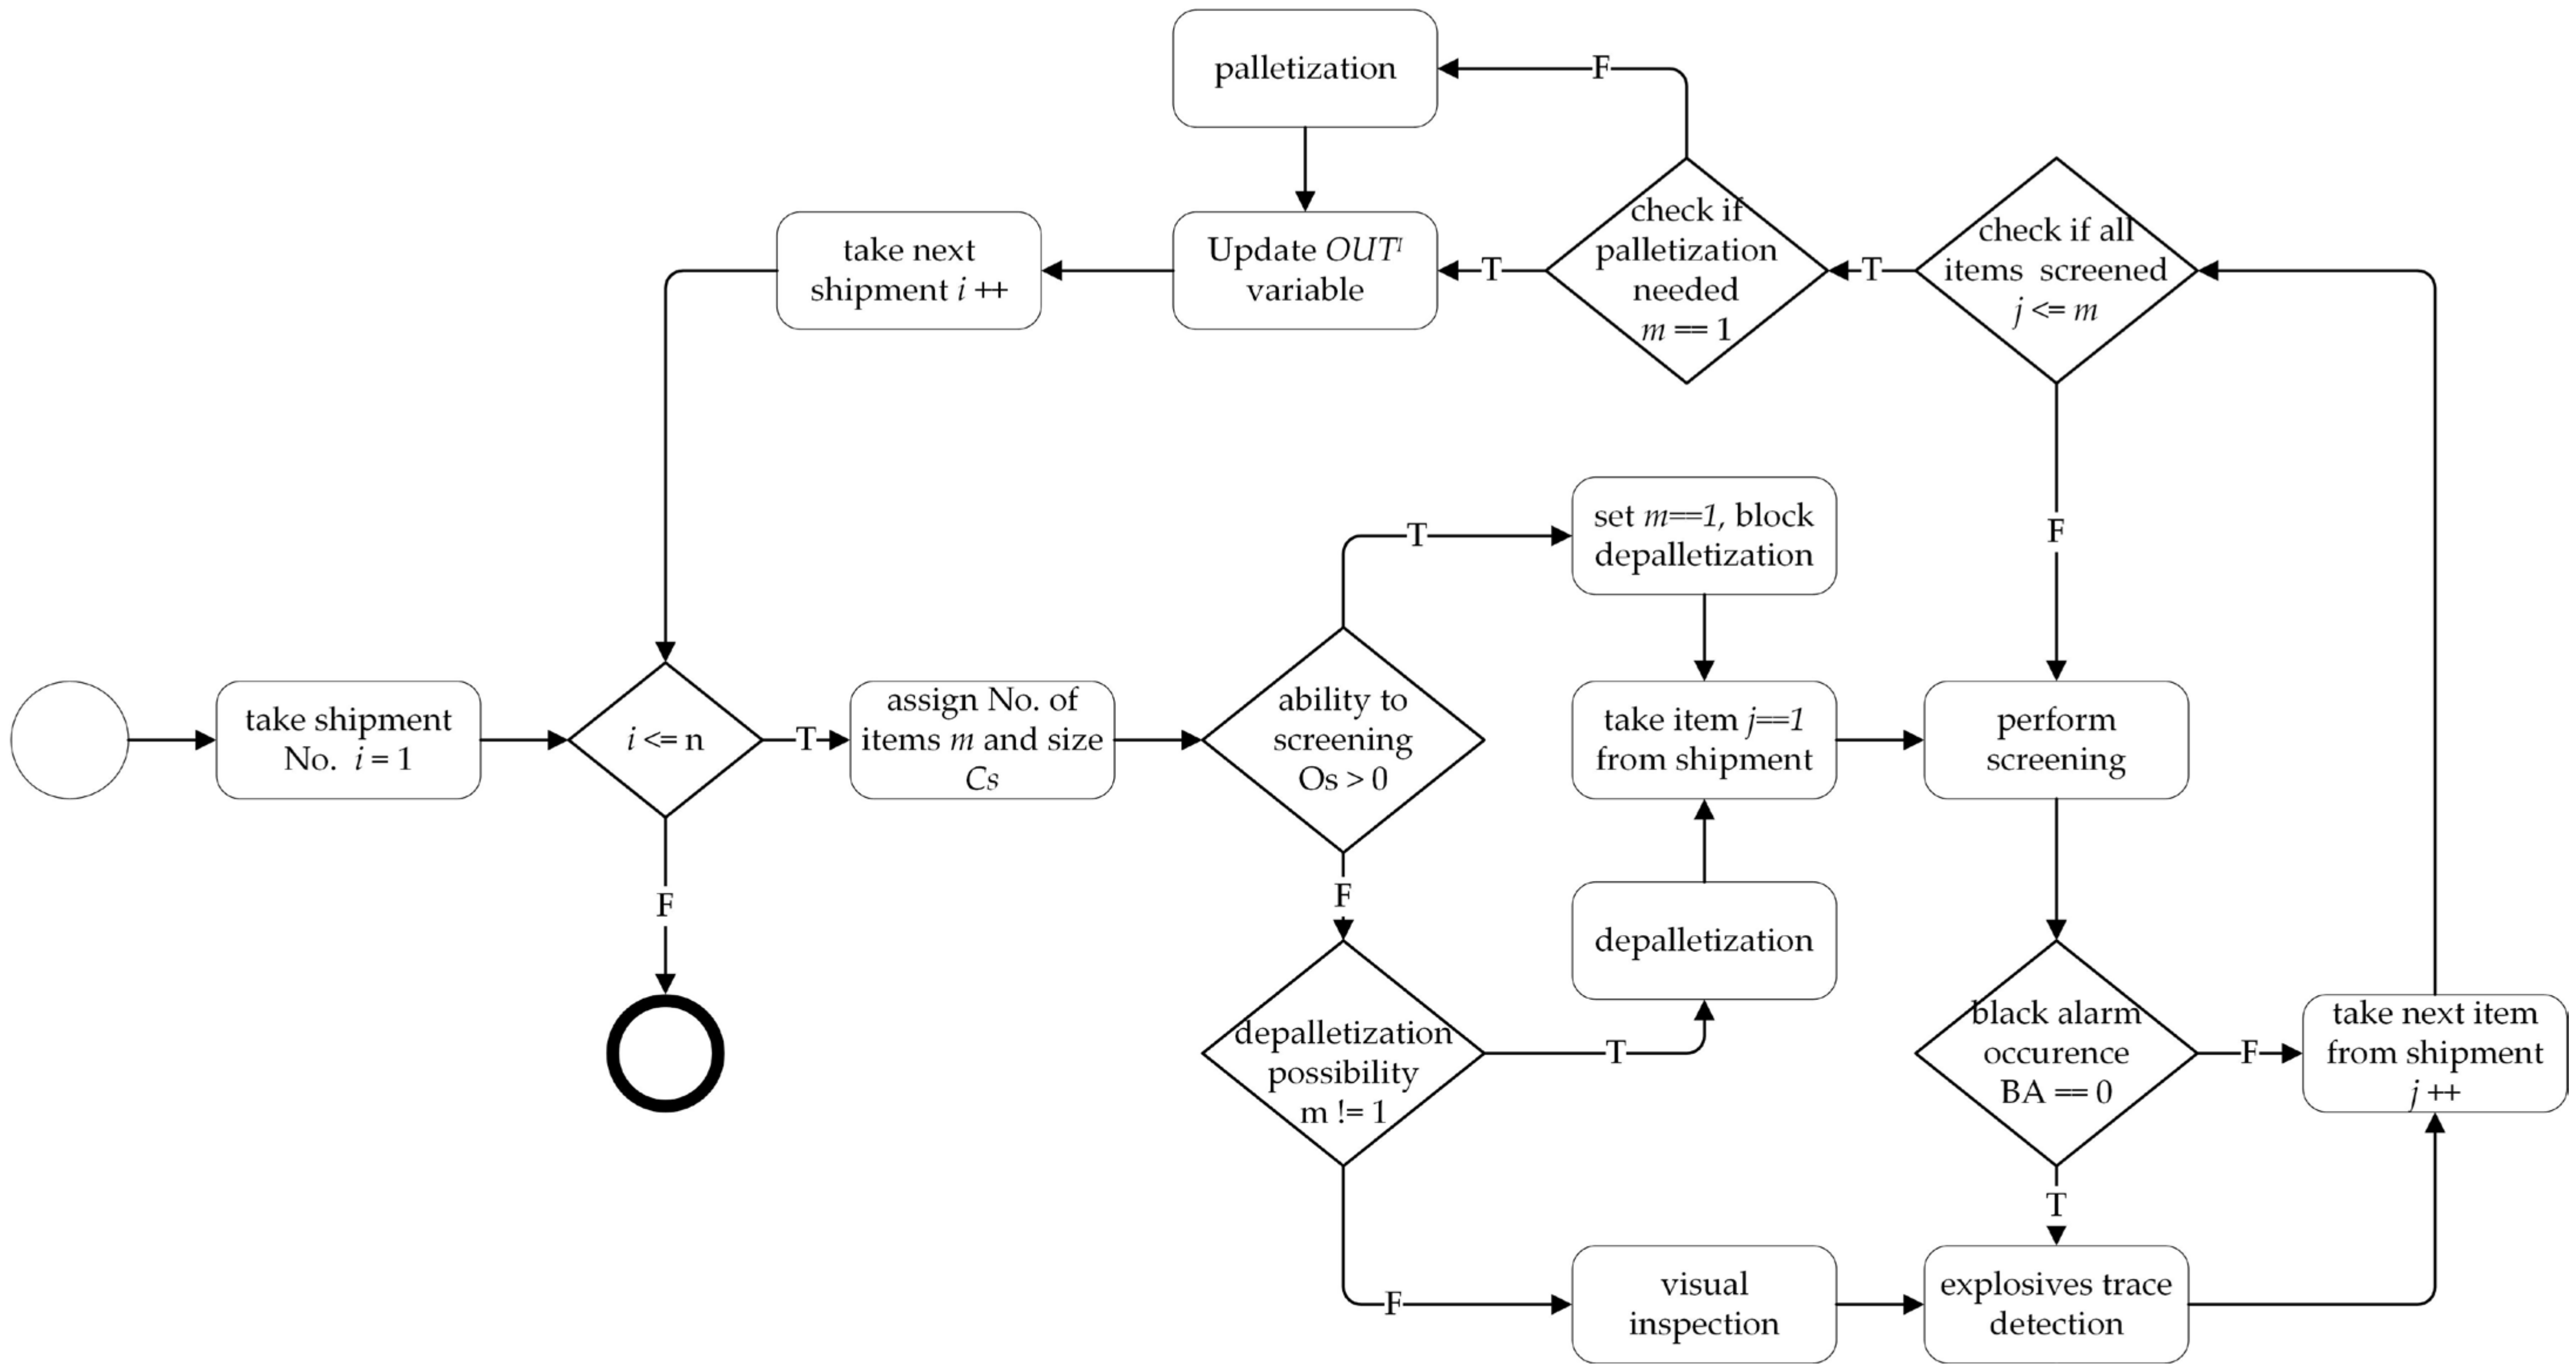
This simulation experiment involves a screening process for all cargo shipments from i = 1 to n. A simplified algorithm of the simulation model in BPMN notation is shown in Figure 3. In the beginning, the number of items m in the shipment and the dimension of shipment Cs = [W H] are drawn. The number of shipments is given by the user of the model on a deterministic basis. Dimensions are given randomly according to the P(w), P(h) and P(l) functions entered by the user. Next, it is checked whether the size of the shipment is adequate for the tunnel size of the X-ray device Xs = [W H]. The dimensions of the tunnel are set deterministically by the user. When the value of the Os (3) formula is greater than 0, this means that none of the dimensions exceeds the allowable value. Only the height and width are checked. The device, through continuous screening, can measure shipments of any length. If the shipment is suitable for screening, the screening is performed. The screening time is given by a probability density function specified as input variable P(txray). If its dimensions do not meet the requirements, then the number of items m in the shipment is checked. Variable m is determined according to a probability distribution P(m). This is an input variable set by the user. When m is equal to 1, ETD (Explosives Trace Detection) and visual inspection should be performed. This is because the shipment is too large and cannot be deconsolidated into smaller items. When m is greater than 1, deconsolidation (depalletizing) can be performed to m items. Then, each item from j = 1 to m is screened by X-ray. After screening, all items from the shipment needs to be consolidated (palletized) again. The depalletization time is given by the probability density function P(tdep). The palletization time is given by the probability density function P(tpn). ETD control time is given by the probability density function P(tetd). Visual inspection time is given by the probability density function P(tvl). These are user-specified input variables.

Figure 3.
A simplified algorithm of the simulation model.
When a black alarm BA occurs during screening, an additional explosives trace detection is required for the shipment. The probability of a black alarm is dependent on the ability of rays to penetrate the steel. This probability must be specified as input variable Pba.
During the simulation experiment, the simulation time and energy consumption of the X-ray equipment are continuously measured. For each load, after its inspection, the cumulative values of the results are recorded. For the time-of-service completion, the times of service of previous loads and the currently completed inspection ts are summed (4). For energy consumption, the previous energy consumption is summed up with the energy consumption due to idle time Ei, roller conveyor workload Ecb and screening workload Exray (5).
The algorithm executes the loop for all shipments from i = 1 to n, and then, according to Figure 2, repeats the experiment N times. The expected values of the OUT matrix (2) are then determined. After completing the experiments, an analysis of the obtained results should be carried out.
4. Model Application and Validation
4.1. Input Data
The model application was carried out for the air cargo screening system at one of Poland’s regional airports. The analysis was carried out for the possibility of using one of four devices in the screening process (Table 1).

Table 1.
Attributes of the analyzed devices.
X-ray 1 was characterized by an inspection tunnel size of 100 cm × 100 cm, generator voltage of 160 kv and standard penetration of 35 mm. This solution implies the necessity of so-called depalletization of items already built on the cargo pallet, which, due to the size of the entire shipment, cannot be X-rayed in its entirety. This way of organizing work negatively affects the performance of the cargo terminal and its operational capabilities. Preparation of cargo for safety inspection and re-building a shipment for air transport can have a measurable impact on the cost of cargo handling organization. Such a solution could be applied to the handling of cargo of relatively small size or a small volume of shipments in the cargo terminal. The advantage of using this type of device is its small size and limited demand in electricity consumption.
X-ray 2 and 3 devices had an increased inspection tunnel size of 130 cm × 130 cm and 145 cm × 180 cm, respectively, and an X-ray voltage of 160 kV with a standard penetration of 35 mm. The operator was able to X-ray full-pallet shipments without having to adjust the size of the cargo to the size of the inspection tunnel. Such a solution has a positive effect on time-of-flight operations and the capacity of the cargo terminal. The risk, on the other hand, may be the need for more frequent use of additional ETD-type and visual inspection methods. However, this will only occur if, due to the content of the cargo being screened, the screening operator is unable to determine its security status.
X-ray 4 had an inspection tunnel size of 180 cm × 180 cm (sign X-ray 4), an X-ray tube voltage of 300 kV and a standard penetration of 70 mm). The operator had an X-ray device with the maximum available size of the inspection tunnel. This meant that with this device, full-pallet cargo could also be X-rayed, but the nearly doubled depth of gamma ray penetration compared with earlier X-ray machines allowed for a clearer image of the cargo being X-rayed. This, in turn, had a measurable effect on the number of so-called “black alarms” that resulted in the need for time-consuming manual inspections or cargo inspections using an explosive trace device (ETD).
The exploitation of different X-ray equipment also affects other values of parameters characterizing the process of cargo handling. The inspection time on the X-ray device depends on the quality of the device’s parameters, which directly affects the quality of the received image of the inspected shipment. When the operator is not able to unambiguously assess the image, it is necessary to carry out additional inspection. Table 2 shows the set of input data for the simulation model. The screening time (ts) and ETD inspection time (tetd) variables in the simulation model are randomized from a probability density function f(x) fitted to a lognormal distribution. The distribution parameters were estimated with the ExpertFit tool at a significance level of α = 0.05 for a sample of 1000 data points collected from the real system. The manual inspection time (tvl) variable in the simulation model was randomized from the probability density function f(x) for a Weibull distribution. The distribution parameters were fitted with the ExpertFit tool at a significance level of α = 0.05 for a sample of 1000 data points from the real system. Black alarm probability (PBA) was determined from the data collected by the X-ray machine by dividing the number of alarms by the number of all scanned items. PBA was estimated on a sample of tens of thousands of items.
Table 2.
Input parameters—screening characteristics.
Another group of input variables were random variables dedicated to activities accompanying the shipment screening process. They are necessary when the loads are too large in relation to the tunnel of the X-ray machine. They describe the process of depalletizing and palletizing (splitting the shipment into smaller items and reassembling them into a single pallet). These variables, also determined from research conducted at the same airport, are shown in Table 3. The variable depalletization time (tdep) in the simulation model was randomized from a probability density function f(x) fitted to a Weibull distribution. The distribution parameters were estimated with the ExpertFit tool at a significance level of α = 0.05 for a sample of 1000 data points collected from the real system. The palletization time (tpn) variable in the simulation model was randomized from the probability density function f(x) for a lognormal distribution. The distribution parameters were fitted with the ExpertFit tool at a significance level of α = 0.05 for a sample of 1000 data points from the real system.
Table 3.
Input variables—accompanying operations.
The purpose of the analysis being carried out was to see which X-ray device would be most suitable for the cargo stream to be handled. The necessary input data included the size of the shipments and the number of items inside the shipments that could be unpacked. The determined values from the conducted tests are presented in Table 4. The variable width (Cs(1,1)) in the simulation model was randomized from a probability density function f(x) fitted to a Weibull distribution. The distribution parameters were estimated with the ExpertFit tool at a significance level of α = 0.05 for a sample of 1000 data points collected from the real system. The height (Cs(1,2)) variable in the simulation model with a probability of 0.78 was a constant value, and the remaining probabilities were randomized from the probability density function f(x) for a Weibull distribution. The distribution parameters were fitted with the ExpertFit tool at a significance level of α = 0.05 for a sample of 1000 data points from the real system. The variable number of items (m) in the simulation model was randomized from a probability density function f(x) fitted to a normal distribution. The distribution parameters were fitted with the ExpertFit tool at a significance level of α = 0.05 for a sample of 1000 data points from the real system.
Table 4.
Input variables—shipment stream.
4.2. Model Validation
Validation of the model was carried out on a real system, in which the system operated with X-ray 3. A 100-fold measurement for 100 loads was collected from the real system and the energy consumptions of the X-ray and ETD devices were measured. In parallel, a simulation model was built in the FlexSim environment, and 100 experiments were conducted for the same conditions. The T-test was conducted at a significance level of α = 0.05 to verify that the model functioned properly. A T-value of 0.76 (1) was obtained, which was less than the critical value of 1.97. This meant that there was no basis for rejecting the null hypothesis, which states that there are no differences between the mean values.
The simulation model was therefore positively verified for the input variables introduced. This can be applied to the analysis carried out in Section 5.
5. Results and Discussion
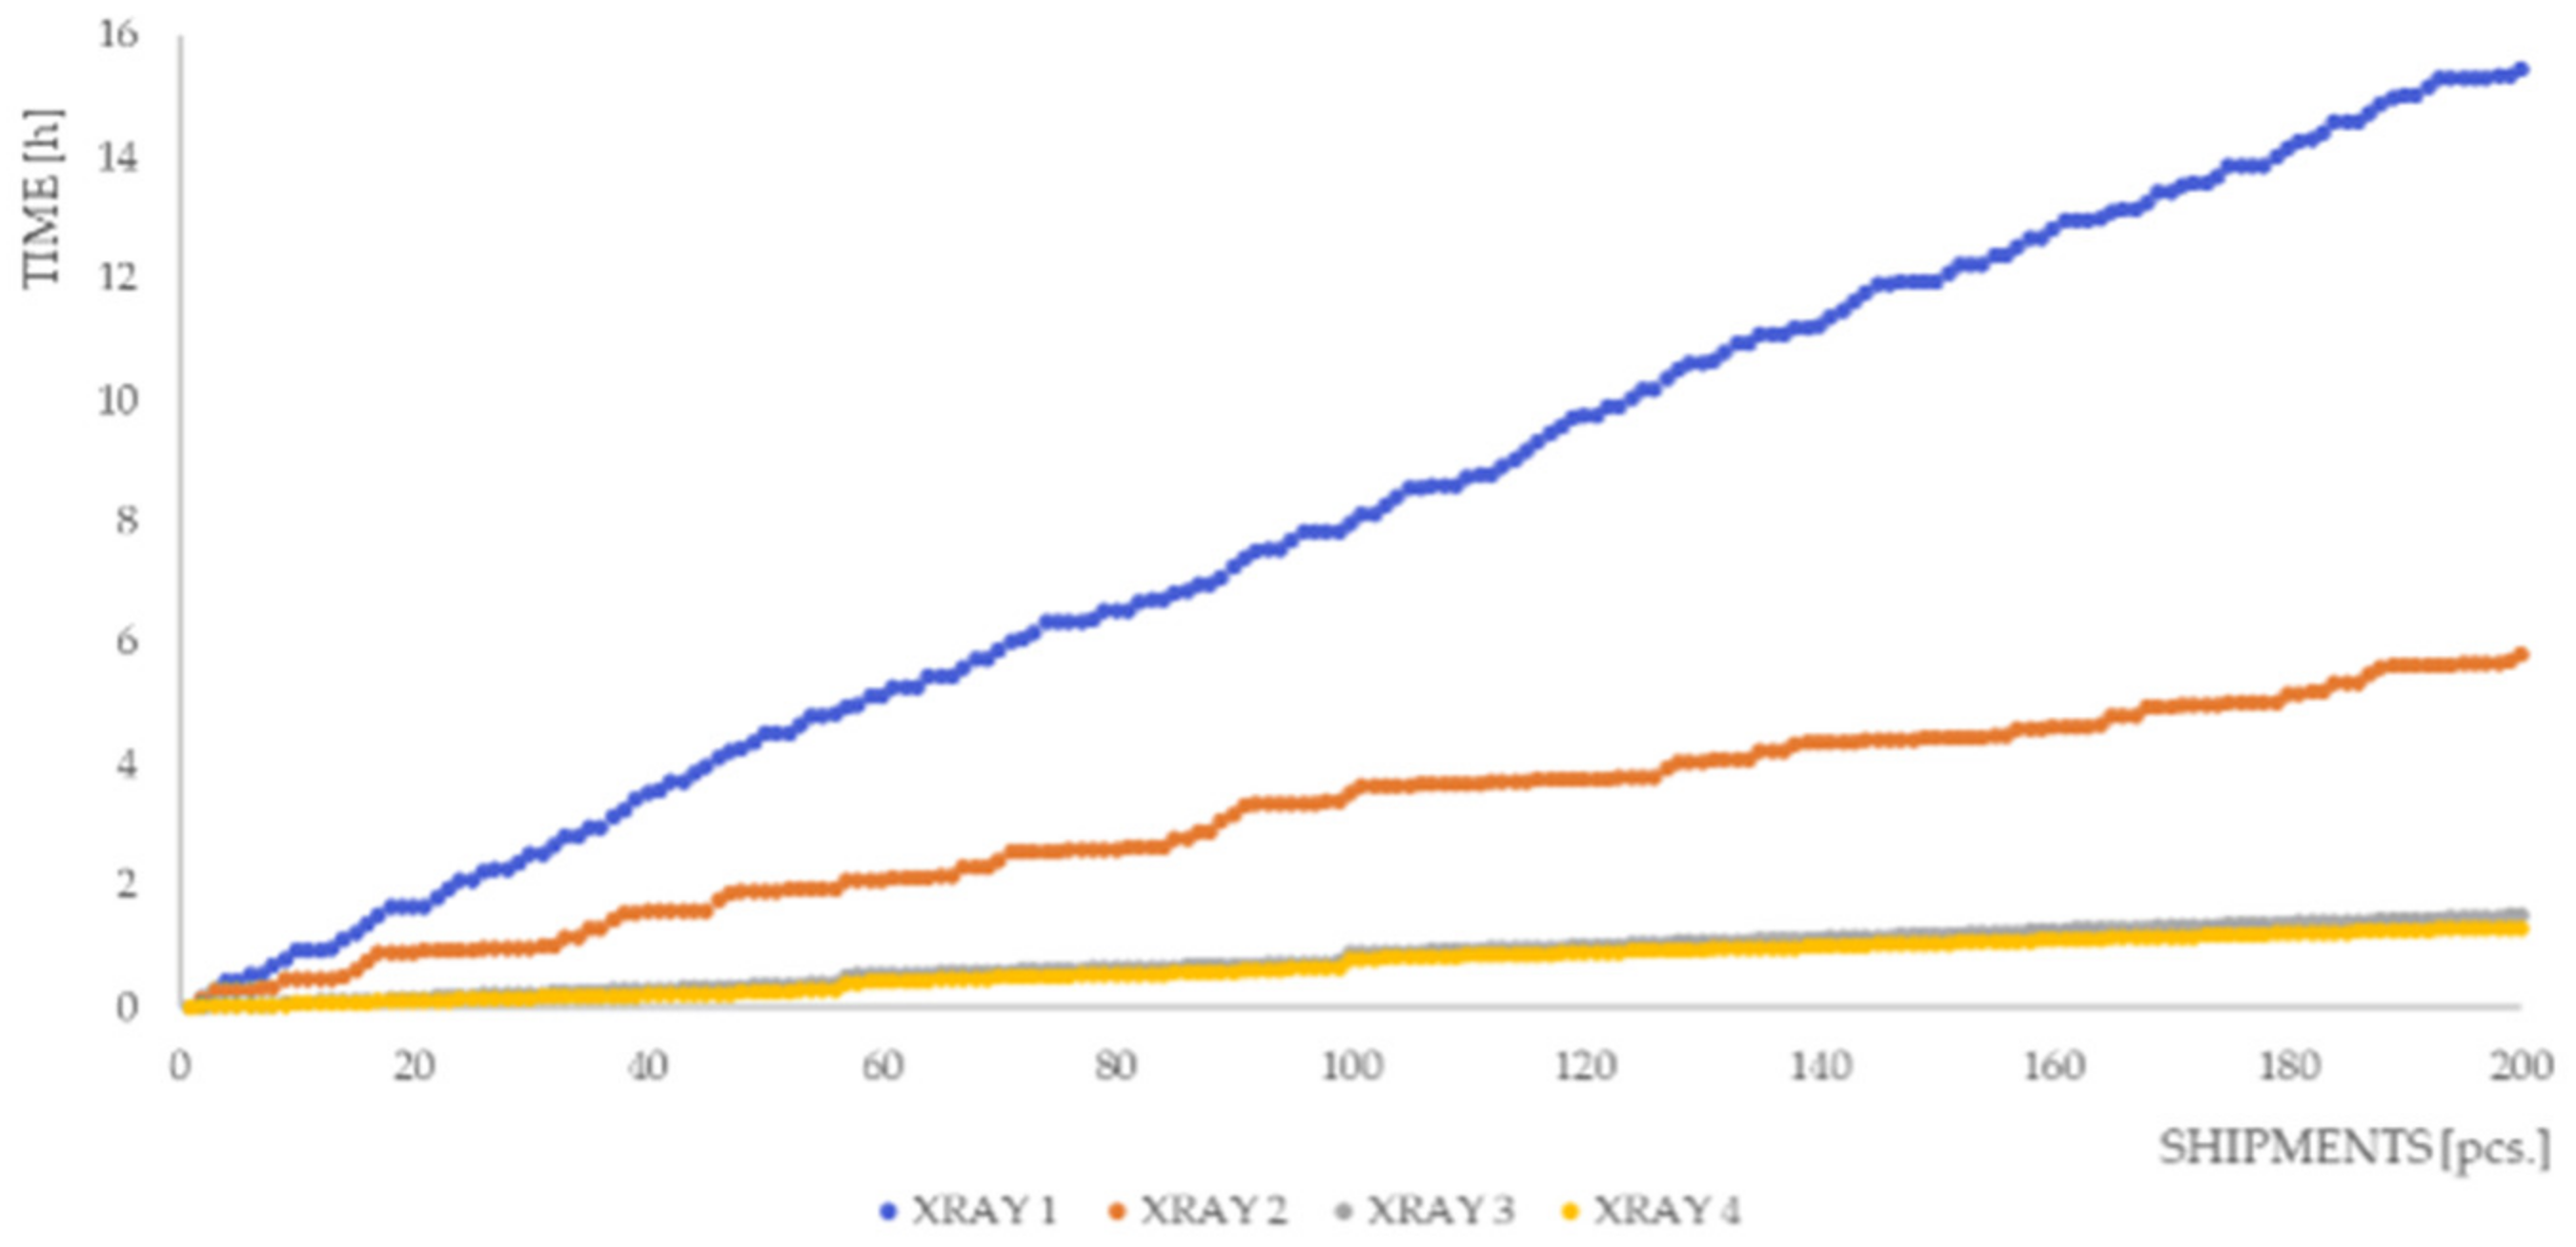
For the data indicated in Section 4, the handling of 200 cargo shipments was simulated separately for different X-ray equipment. One hundred experiments were conducted for each of the four system configurations. In each configuration, a different X-ray device was analyzed. Mean values of the output variables were calculated for each configuration. These values were taken as the output data for the analysis. The function of the time of screening 200 pieces of air shipments as a function of the number of shipments screened is indicated in Figure 4.
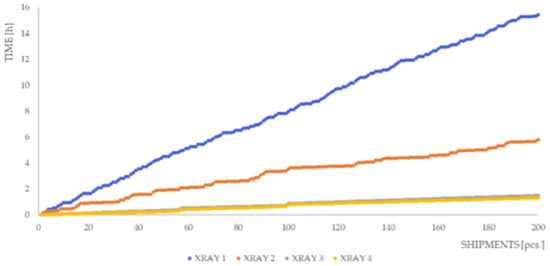
Figure 4.
Function of shipment inspection time depending on the number of pieces to be inspected.
It should be noted that the inspection of 200 pieces of cargo shipments for RTG 3 and RTG 4 devices was carried out in a similar amount of time. Due to the ability to inspect larger shipments using the RTG 4 device, the inspection time was slightly less than for the RTG 3 device. For the RTG 3 and RTG 4 devices, only 1% of shipments needed to be deconsolidated. The inspection time for cargo shipments using RTG 2 was more than three times longer than for RTG 3 and RTG 4. The increased inspection time was due to the higher number of shipments that needed to be deconsolidated. For RTG 2, 17.5% of shipments had to be deconsolidated and then consolidated. The longest inspection time for 200 pieces of air shipments was executed by RTG 1. This time was almost 16 h, which is almost 10 times higher than inspection times with RTG 3 and RTG4, and almost four times longer than in the case of security screening executed by RTG 2. About 53.5% of shipments needed to be deconsolidated due to their dimensions. The functions of the relationship between energy consumed in the number of shipments inspected are presented in Figure 5.
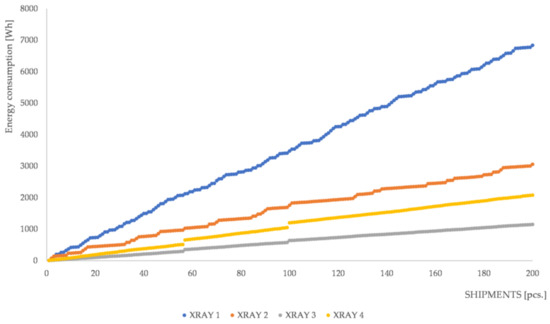
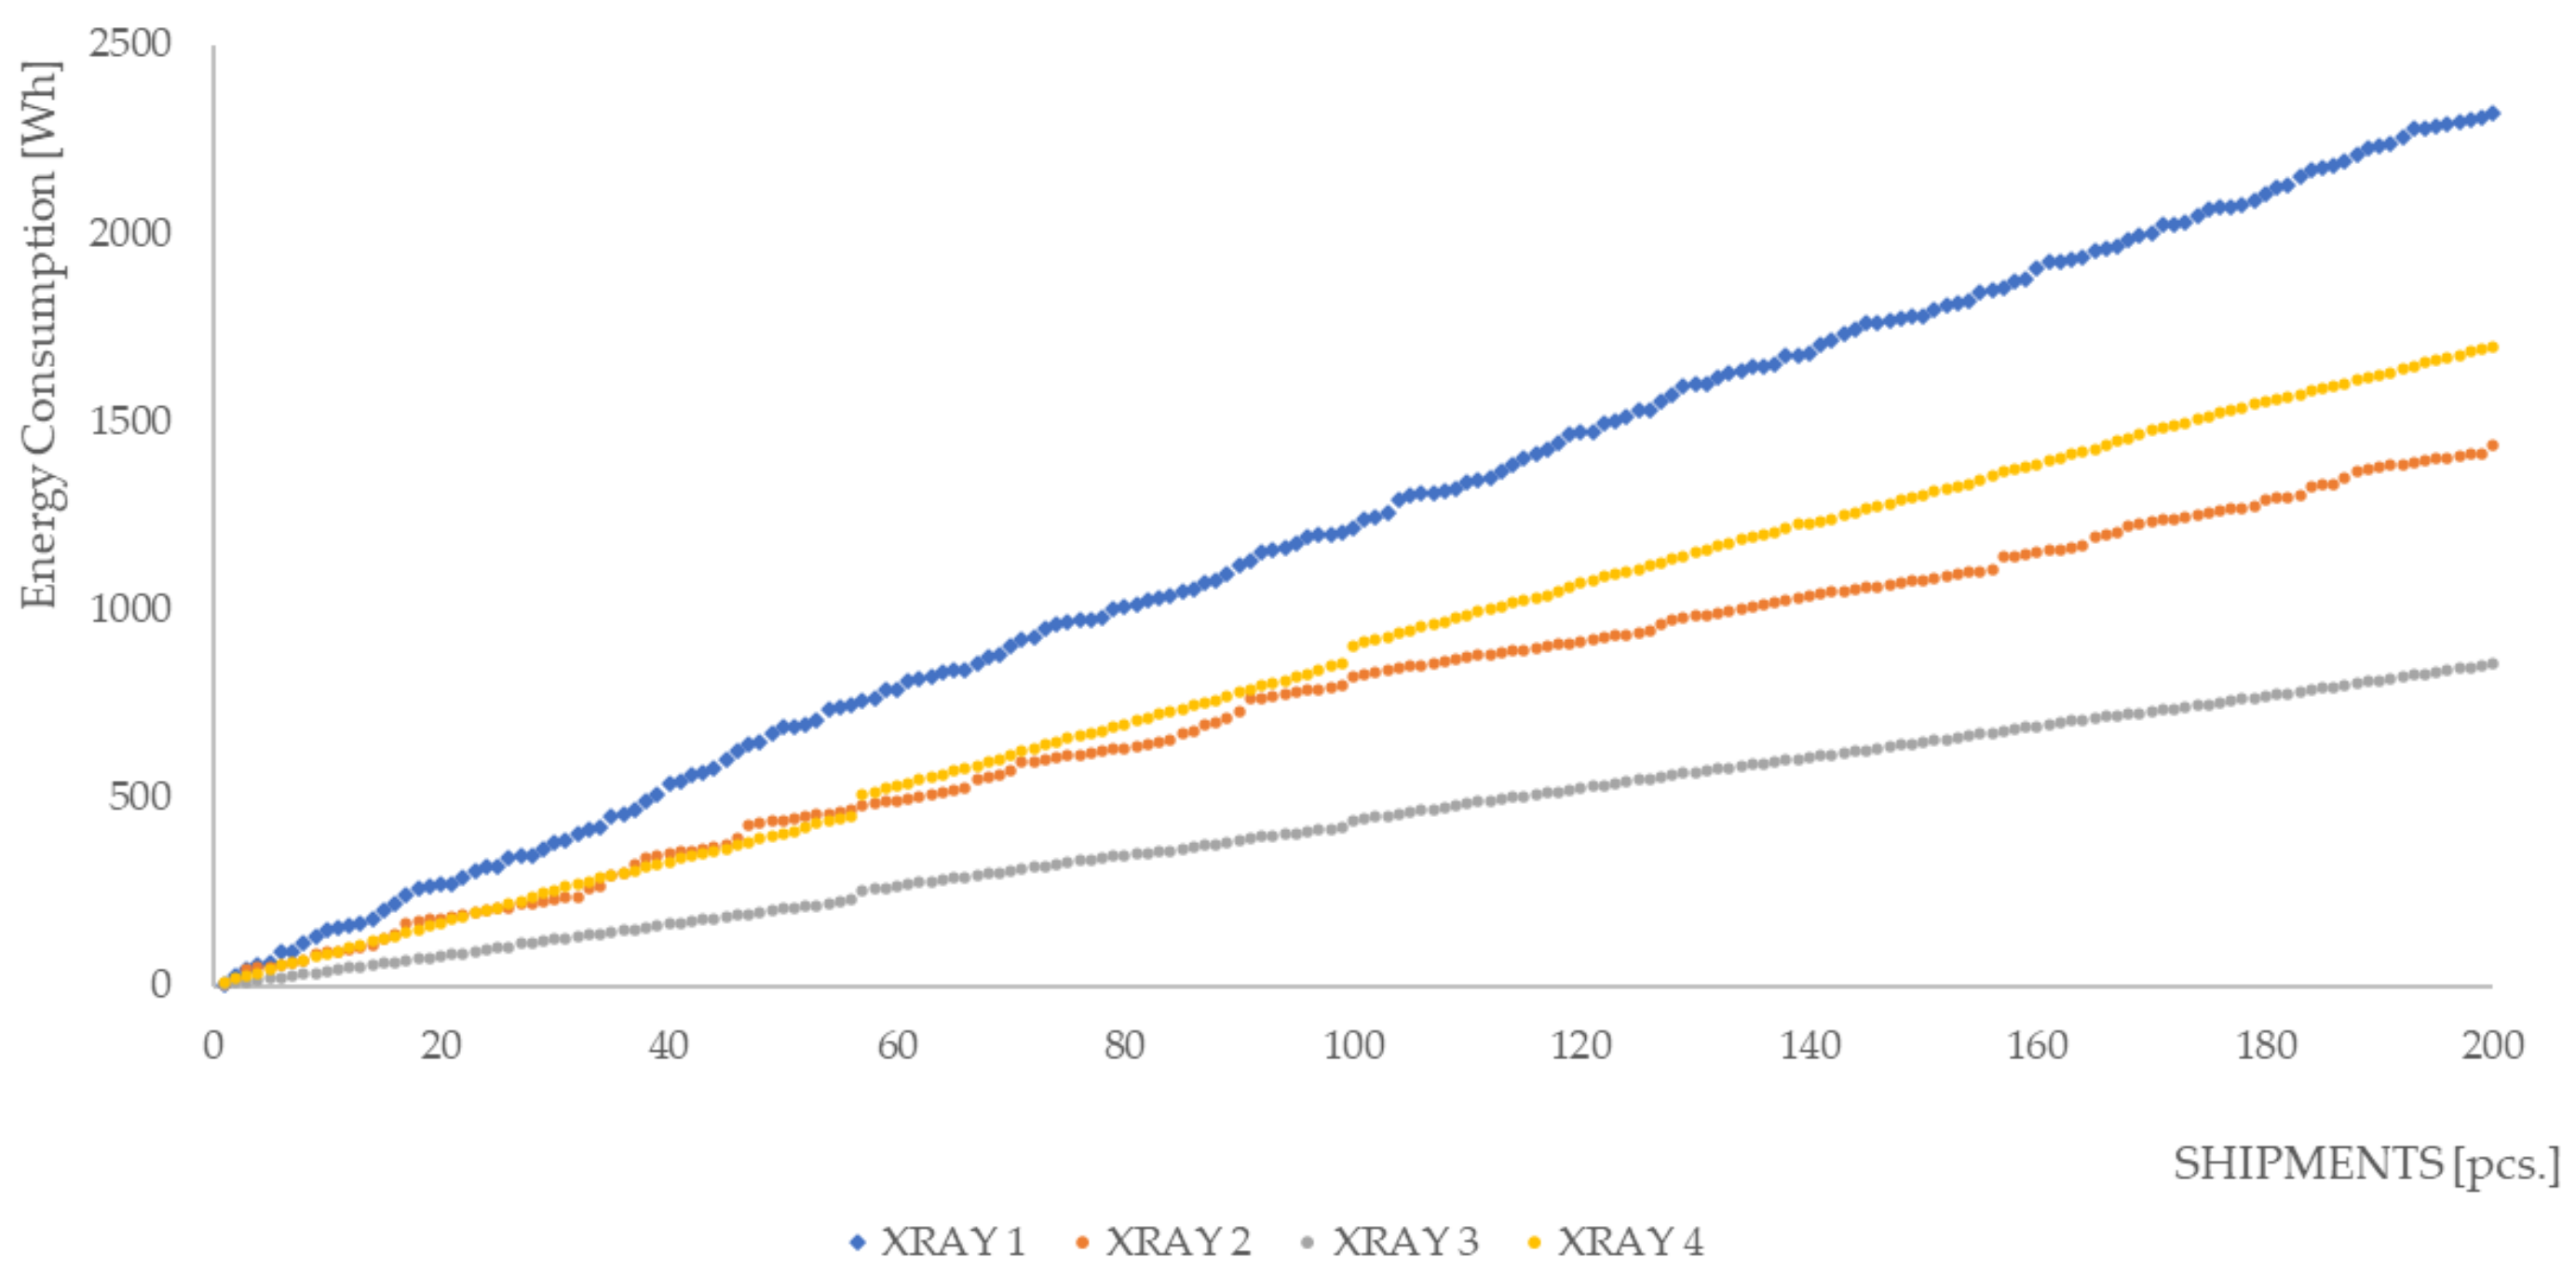
Figure 5.
The relationship between energy consumption and the number of inspected cargo shipments.
The lowest energy consumption for 200 air shipments was by RTG 3. RTG 3 consumed nearly half the energy consumed by RTG 4. This was due to: RTG 3’s lower energy consumption and the same number of shipments that had to undergo consolidation and deconsolidation processes. For RTG 1, the value of energy consumption for carrying out the process of the same number of shipments was seven times higher than for RTG 3. Similarly, for RTG 2, the energy consumption was almost three times higher than for RTG 3. To a large extent, energy consumption was used by the equipment waiting for inspection. Figure 6 presents a function of energy consumption values depending on the number of air shipments inspected, but only looking at the time of effective inspection by equipment. Deconsolidation and consolidation losses were not considered.
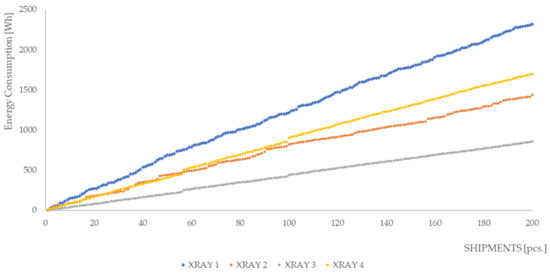
Figure 6.
The relationship between effective inspection energy consumption and the number of inspected cargo shipments.
The lowest value of energy consumption for an effective air shipment screening process was obtained for RTG 3. Twice the energy consumption was obtained for RTG 2 and RTG 4. The highest value of energy consumption for an effective screening process was obtained for RTG 1.
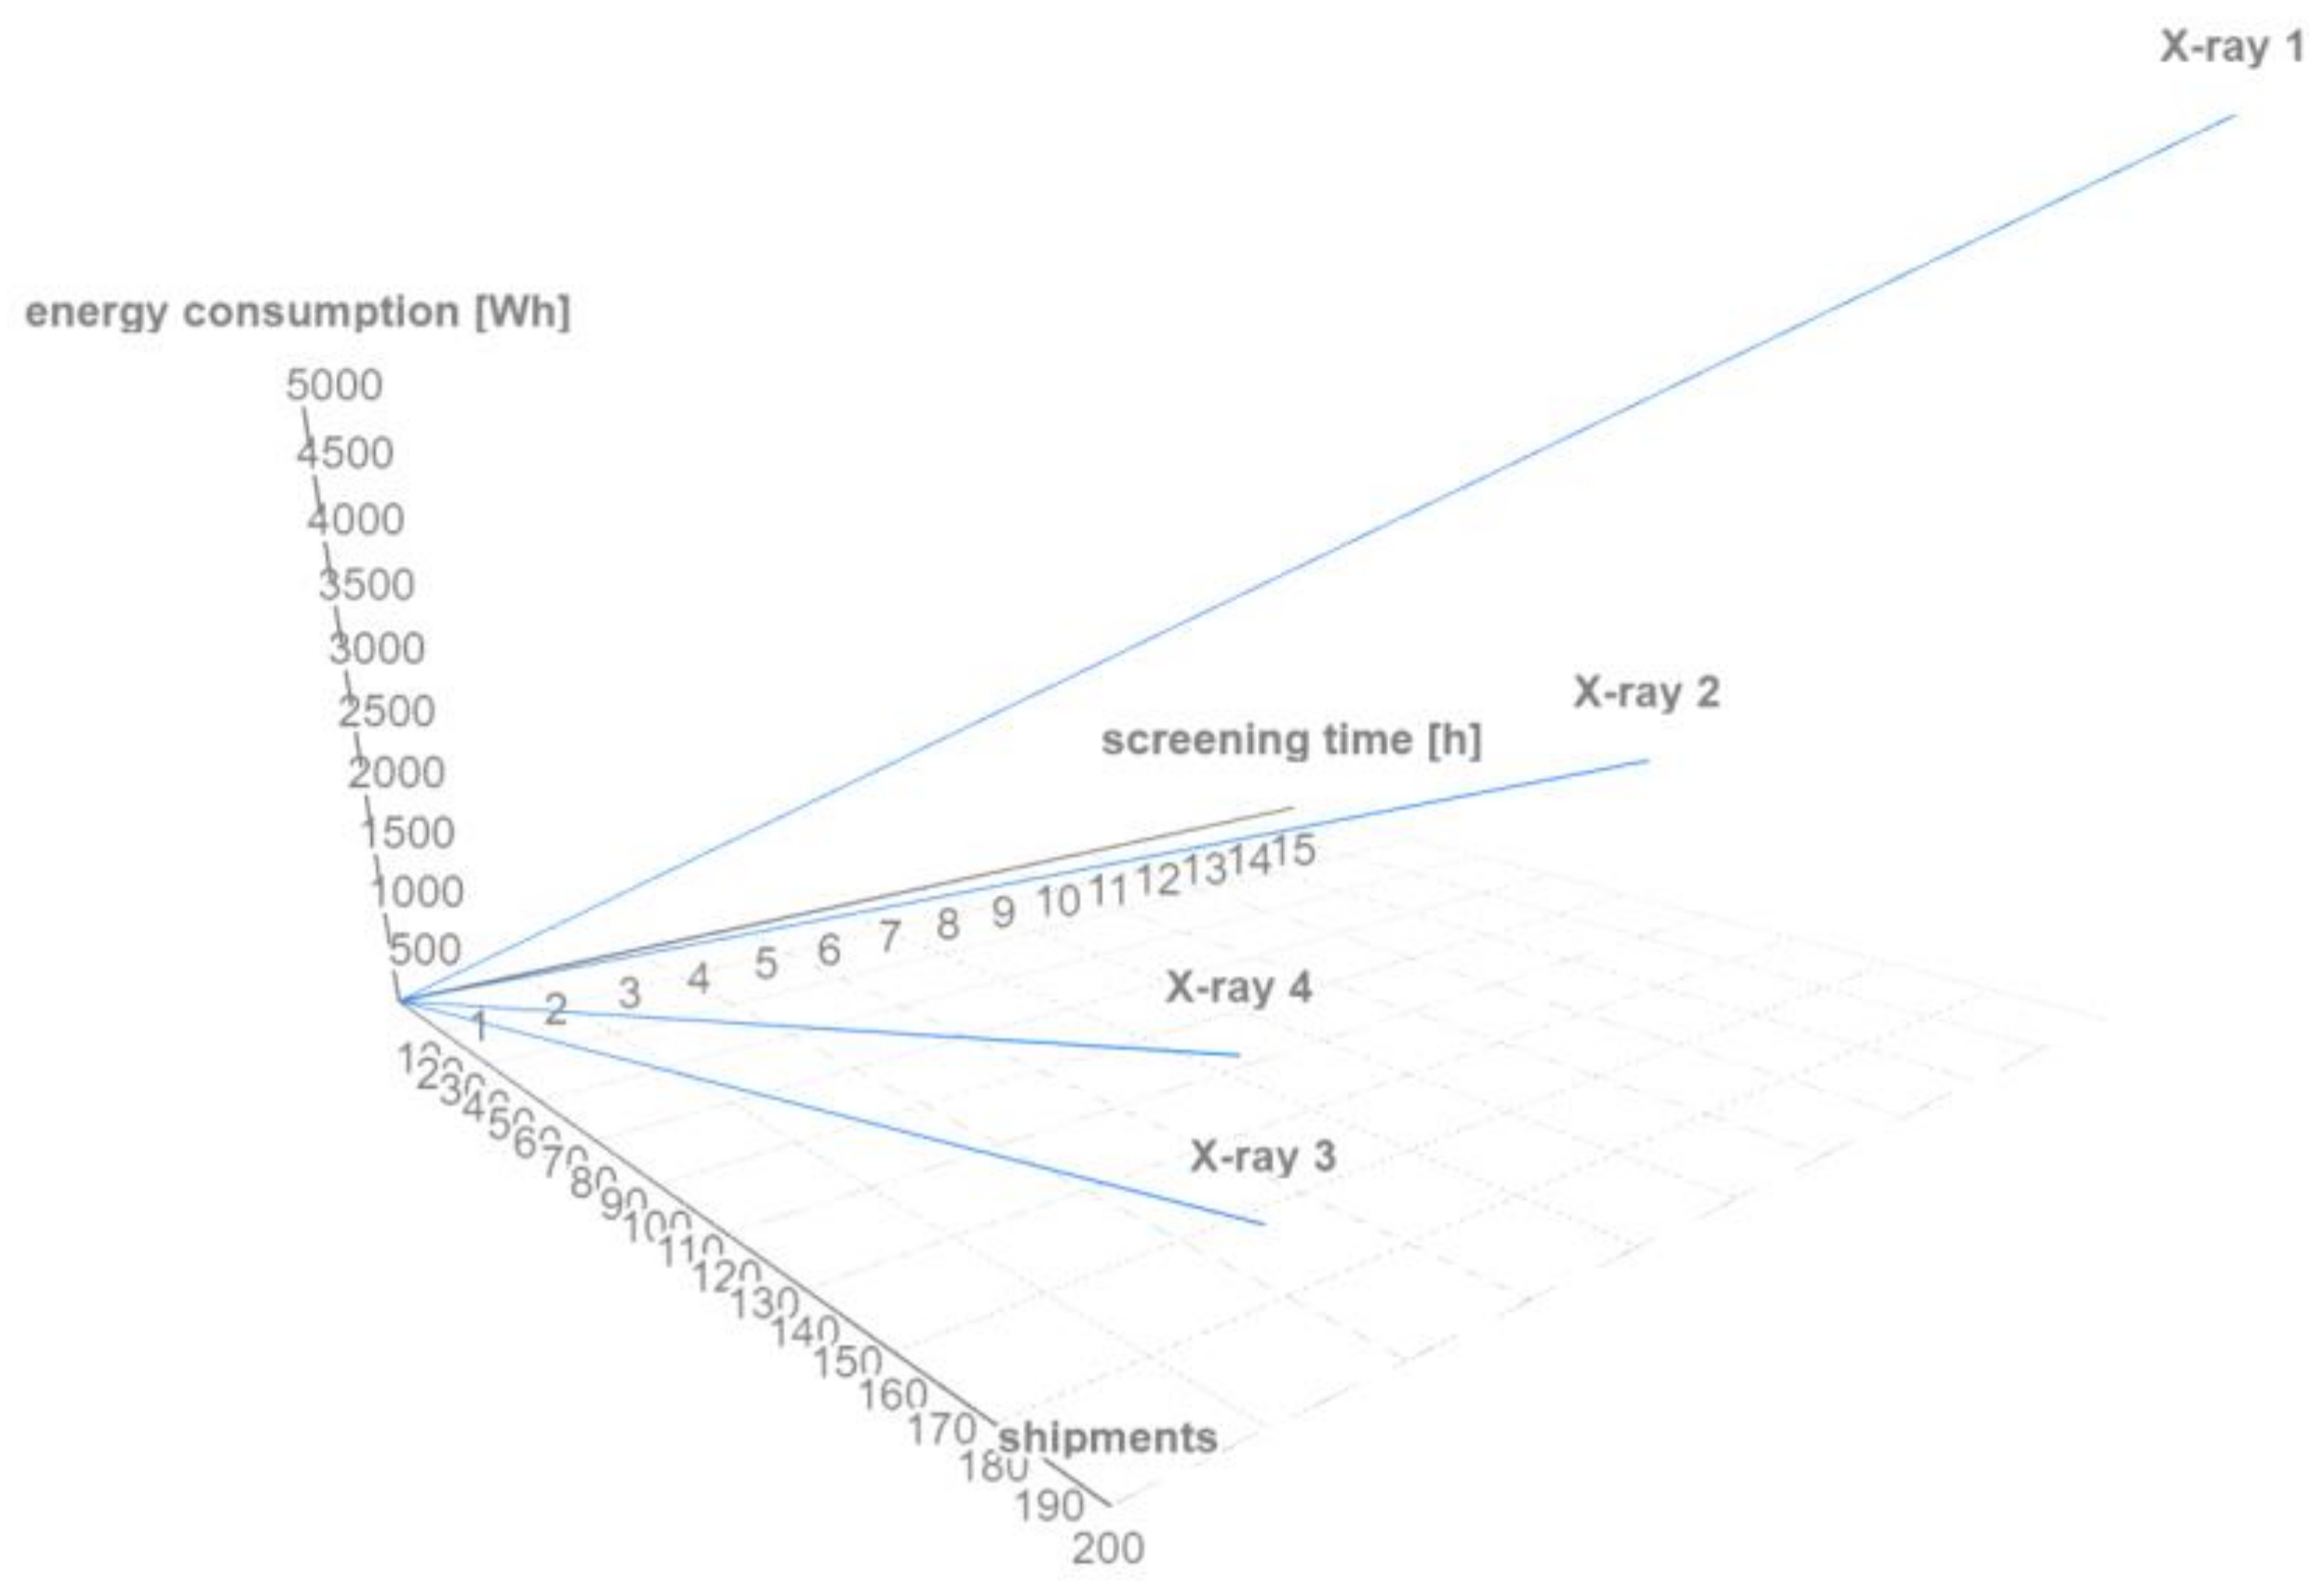
The most favorable choice for the air cargo terminal in this case would be to use the X-ray 3 device, as the inspection time of 200 pieces was short and similar to the X-ray 4 device (less than 2 h). The X-ray 3 device, however, consumed much less power compared with the X-ray 4 device. The X-ray 4 device consumed almost twice as much energy as X-ray 3. Due to the shipment inspection time, X-ray 1 and 2 devices should not be used. It took more than 8 times longer to inspect the same stream of shipments using the X-ray 1 device than the X-ray 3 and 4 devices, and energy consumption was more than 3.5 times higher compared with those devices. One could consider using X-ray 2 as a device to support the screening process, but only for shipments of certain dimensions. It would then be necessary to direct smaller shipments to the X-ray 2 device and larger shipments to the X-ray 3 device (if the screening system could consist of two devices). The correlation between energy consumption and screening completion time from the number of shipments being screened is shown in Figure 7. In the case of guidelines for the screening system, it would be necessary to develop an evaluation model for the screening system for air shipments, which would clearly define the evaluation of such a system.
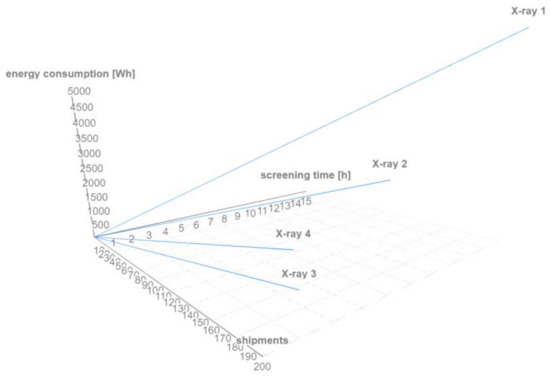
Figure 7.
Correlation between energy consumption and screening completion time from the number of shipments.
6. Summary
The choice of equipment for air cargo inspection should depend on the type and size of shipments handled at a given terminal. Underestimating the size of the device in relation to the stream of cargo handled results in substantial losses in time or energy consumed. This is often due to the need to deconsolidate shipments, which consequently increases inspection time as well as electricity consumption. Increased inspection time can negatively affect the shipment handling process, as it can also cause air traffic delays or delivery delays. Increased electricity consumption increases the cost of handling air shipments, which consequently transfers to the total cost of the logistics of handling the shipment.
This article presents a simulation model to assess what performance the system would achieve from the use of different cargo shipment screening equipment. Cargo operators know the current distribution of handled shipments and know the development forecasts. Thus, they can estimate whether their system is working properly or whether reconfiguration is necessary.
Future scientific work should address further developments of the presented simulation model. The entire process of air cargo handling should be taken into account. The development of this model would allow for the strategic planning of implementation of the cargo handling process at airports.
Author Contributions
Conceptualization, A.K.; methodology, A.K. and T.K.; software, A.K. and T.K.; validation, T.K.; formal analysis, A.K. and T.K.; investigation, P.U.; resources, P.U.; writing—original draft preparation, A.K., T.K. and A.V.; writing—review and editing, A.K., T.K. and A.V.; visualization, T.K.; supervision, A.K. All authors have read and agreed to the published version of the manuscript.
Funding
The project is funded under the program of the Minister of Education and Science titled “Regional Initiative of Excellence” in 2019–2023, project number 018/RID/2018/19, the amount of funding PLN 10 788 423,16.
Data Availability Statement
Not applicable. All relevant data are presented in this paper.
Conflicts of Interest
The authors declare no conflict of interest.
Correction Statement
This article has been republished with a minor correction to the Funding statement. This change does not affect the scientific content of the article.
References
- Commission Implementing Regulation (EU) 2015/1998 of 5 November 2015 Laying down Detailed Measures for the Implementation of the Common Basic Standards on Aviation Security. Available online: https://eur-lex.europa.eu/legal-content/EN/TXT/HTML/?uri=CELEX:32015R1998&qid=1690273144185 (accessed on 25 July 2023).
- Airports. Available online: https://www.esource.com/ams-1700034-001/airports (accessed on 25 July 2023).
- Ortega Alba, S.; Manana, M. Energy Research in Airports: A Review. Energies 2016, 9, 349. [Google Scholar] [CrossRef]
- Feng, B.; Li, Y.; Shen, Z.-J.M. Air cargo operations: Literature review and comparison with practices. Transp. Res. Part C 2015, 56, 265–280. [Google Scholar] [CrossRef]
- Nobert, Y.; Roy, J. Freighth and ling personnel scheduling at air cargo terminals. Transp. Sci. 1998, 32, 295–301. [Google Scholar] [CrossRef]
- Yan, S.Y.; Chen, C.H.; Chen, C.K. Long-term manpower supply planning for air cargo terminals. J. Air Transp. Manag. 2006, 12, 175–181. [Google Scholar] [CrossRef]
- Yan, S.Y.; Chen, C.H.; Chen, C.K. Short-term shift setting and manpower supply in gunder stochastic demands for air cargo terminals. Transportation 2008, 35, 425–444. [Google Scholar] [CrossRef]
- Yan, S.Y.; Chen, C.H.; Chen, M.J. Stochastic models for air cargo terminal manpower supply planning in long-term operations. Appl. Stoch. Model. Bus. Ind. 2008, 24, 261–275. [Google Scholar] [CrossRef]
- Hall, R.W. Truck scheduling for ground to air connectivity. J. Air Transp. Manag. 2001, 7, 331–338. [Google Scholar] [CrossRef]
- Lee, C.; Huang, H.C.; Liu, B.; Xu, Z. Development of timed Colour Petri net simulation models for air cargo terminal operations. Comput. Ind. Eng. 2006, 51, 102–110. [Google Scholar] [CrossRef]
- Ou, J.; Hsu, V.N.; Li, C.L. Scheduling truck arrivals at an air cargo terminal. Prod. Oper. Manag. 2010, 19, 83–97. [Google Scholar] [CrossRef]
- Xu, D.; Zhang, C.W.; Miao, Z.; Cheung, R.K. A flow allocation strategy for routing over multiple flow classes with an application to air cargo terminals. Comput. Oper. Res. 2014, 51, 1–10. [Google Scholar] [CrossRef]
- Da Cunha, D.A.; Macário, R.; Reis, V. Keeping cargo security costs down: A risk-based approach to air cargo airport security in small and medium airports. J. Air Transp. Manag. 2017, 61, 115–122. [Google Scholar] [CrossRef]
- Brandt, F.; Nickel, S. The air cargo load planning problem–a consolidated problem definition and literature review on related problems. Eur. J. Oper. Res. 2019, 275, 399–410. [Google Scholar] [CrossRef]
- Delgado, F.; Mora, J. A matheuristic approach to the air-cargo recovery problem under demand disruption. J. Air Transp. Manag. 2021, 90, 101939. [Google Scholar] [CrossRef]
- Anguita, J.G.M.; Olariaga, O.D. Air cargo transport demand forecasting using ConvLSTM2D, an artificial neural network architecture approach. Case Stud. Transp. Policy 2023, 2, 101009. [Google Scholar] [CrossRef]
- Delgado, F.; Sirhan, C.; Katscher, M.; Larrain, H. Recovering from demand disruptions on an air cargo network. J. Air Transp. Manag. 2020, 85, 101799. [Google Scholar] [CrossRef]
- Lange, A. Does cargo matter? The impact of air cargo operations on departure on-time performance for combination carriers. Transp. Res. Part A 2019, 119, 214–223. [Google Scholar] [CrossRef]
- Balaras, C.A.; Dascalaki, E.; Gaglia, A.; Droutsa, K. Energy conservation potential, HVAC installations and operational issues in Hellenic airports. Energy Build. 2003, 35, 1105–1120. [Google Scholar] [CrossRef]
- Liu, J.; Yu, N.; Lei, B.; Rong, X.; Yang, L. Research on Indoor Environment for the Terminal 1 of Chengdu Shuangliu Inter-national Airport. In Proceedings of the 11th International IBPSA Conference, Glasgow, UK, 27–30 July 2009. [Google Scholar]
- Ma, J.S.; Liu, X.T.; Zhuang, D.M.; Wang, S.G. CFD-based design of the natural ventilation system of the traffic center of T3 Beijing International Airport. Adv. Mater. Res. 2011, 291–294, 3292–3295. [Google Scholar] [CrossRef]
- Parker, J.; Cropper, P.; Shao, L. Using Building Simulation to Evaluate Low Carbon Refurbishment Options for Airport Buildings. In Proceedings of the 12th Conference of International Building Performance Simulation Association, Sydney, Australia, 14–16 November 2011. [Google Scholar]
- Gowreesunker, B.L.; Tassou, S.A.; Kolokotroni, M. Coupled TRNSYS-CFD simulations evaluating the performance of PCM plate heat exchangers in an airport terminal building displacement conditioning system. Build. Environ. 2013, 65, 32–145. [Google Scholar] [CrossRef]
- Chen, J.; Xie, K. A Prediction Model Based on Unbiased Grey Markov for Airport Energy Consumption Prediction. In Proceedings of the 2013 Chinese Automation Congress (CAC), Changsha, China, 7–8 November 2013. [Google Scholar]
- Huang, H.; Chen, L. A new model predictive control scheme for energy and cost saving in commercial buildings: An airport terminal building study. Build. Environ. 2015, 89, 203–216. [Google Scholar] [CrossRef]
- Fan, B.; Jin, X.; Du, Z. Optimal control strategies for multi-chiller system based on probability density distribution of cooling load ratio. Energy Build. 2011, 43, 2813–2821. [Google Scholar] [CrossRef]
- Kierzkowski, A.; Kisiel, T.; Uchroński, P. Simulation Model of Airport Security Lanes with Power Consumption Estimation. Energies 2021, 14, 6725. [Google Scholar] [CrossRef]


Disclaimer/Publisher’s Note: The statements, opinions and data contained in all publications are solely those of the individual author(s) and contributor(s) and not of MDPI and/or the editor(s). MDPI and/or the editor(s) disclaim responsibility for any injury to people or property resulting from any ideas, methods, instructions or products referred to in the content. |
© 2023 by the authors. Licensee MDPI, Basel, Switzerland. This article is an open access article distributed under the terms and conditions of the Creative Commons Attribution (CC BY) license (https://creativecommons.org/licenses/by/4.0/).