Abstract
For vertical axis wind turbines (VAWTs), the increase of the incoming wind speed higher than the rated value will make the tip speed ratio (TSR) lower and lower, resulting in the blade fatigue load becoming more and more severe and the power coefficient weakening gradually. This paper explores whether varying the pitch with the TSR decrease is necessary for improving the power coefficient and reducing the fatigue load. Specifically, the pitch angle effect on the power coefficient and fatigue load of a VAWT at different TSRs was studied by the computational fluid dynamics method. The results show that the optimal pitch angle in terms of the power coefficient varies with the TSR, which means that varying the pitch with the TSR decrease can improve the power coefficient. Meanwhile, the principle to guide the pitch variation is to avoid flow separation in the downwind zone and minimize the angles of attack (AoAs) in the upwind zone. At the lowest TSR of 1.7 in the present work, varying the pitch from the optimal one in terms of the power coefficient reduced the blade normal force amplitude significantly, which is mainly attributed to avoiding the vortex–blade encounter and minimizing the AoAs in the downwind zone. The vortex–blade encounter at the lowest TSR is an important phenomenon related to the variation of the blade torque and blade normal force and will weaken and disappear with the pitch angle increase.
1. Introduction
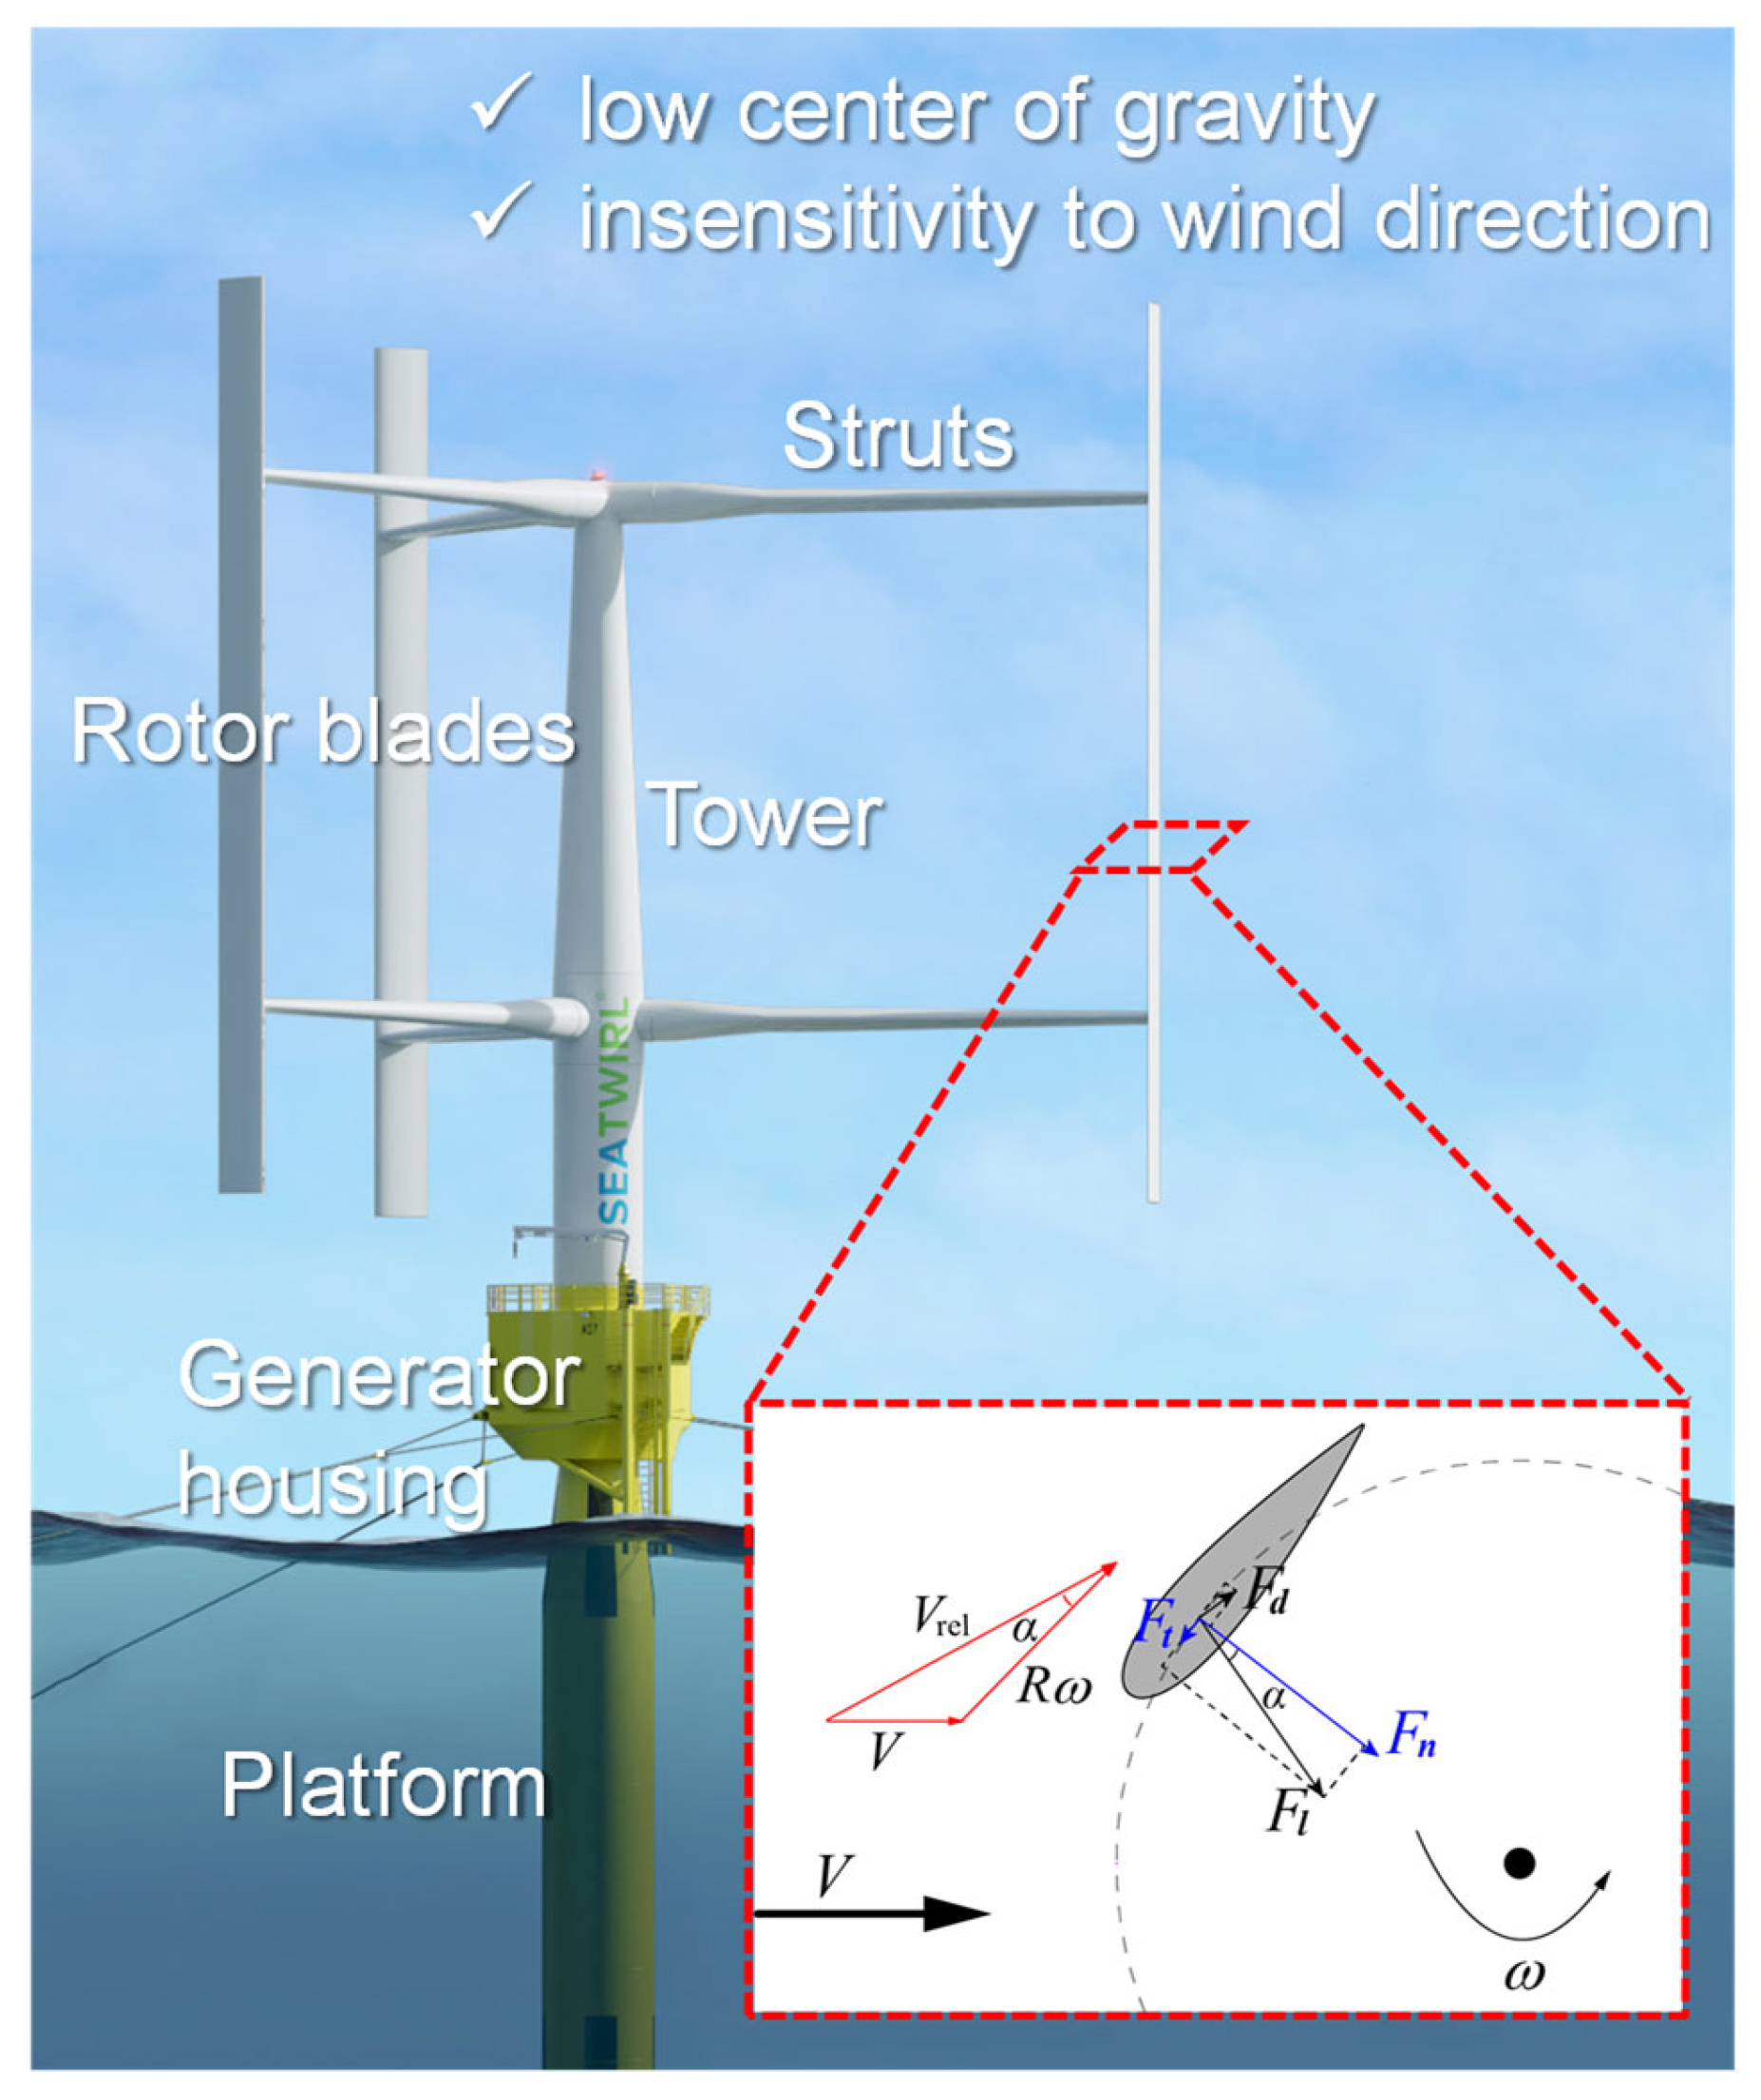
In the process of achieving the goal of global carbon neutrality, efficiently developing and utilizing wind energy in the ocean plays a key role. There have been two main types of wind turbines adopted to extract energy from wind for many years: Horizontal Axis Wind Turbines (HAWTs) and Vertical Axis Wind Turbines (VAWTs). In the past decade, VAWTs (especially the H-type Darrieus VAWT shown in Figure 1) have attracted much attention because they can cope with the harsh offshore environment better than HAWTs, relying on their features of a low center of gravity and insensitivity to wind direction [1].
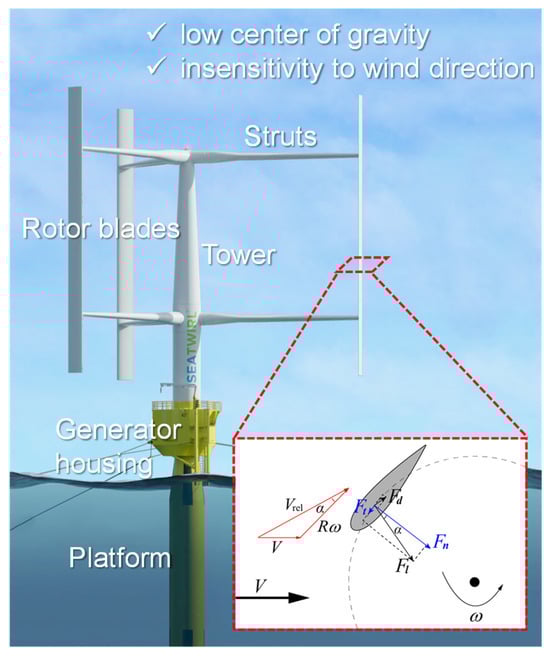
Figure 1.
Diagram of VAWT in terms of structure and aerodynamic forces on blades (VAWT is from SeaTwirl®).
However, VAWTs have not achieved as large-scale commercial development as HAWTs. Mollerstrom et al. [2] reviewed the development history of VAWTs in the past 50 years and summarized that the main factor hindering the development of VAWTs is the fatigue load acting on the blades and then extending to the entire structure. Unlike common fluid machinery, the VAWTs have an angle of attack (AoA) of the blade which continuously changes between being positive and negative during the blade rotation, resulting in a fatigue normal force on the blade Fn, as shown in Figure 1. Fiedler et al. [3] mentioned that the blade normal force is the main load that leads to the blade fatigue and turbine vibration. When the incoming wind speed is higher than the rated value and continuously grows, a lower and lower tip speed ratio (TSR) will be caused as the rotor speed is generally limited. At this point, the amplitude of the AoA will increase and the blade normal force fluctuation will be more and more severe. Meanwhile, the power coefficient will be reduced gradually as the blade tangential force Ft (shown in Figure 1) or the blade torque (Ft R) is reduced by the flow separation occurring at large AoAs [4].
It can be seen that when it comes to the blade fatigue load and power coefficient, the conditions of a high incoming wind speed with a low TSR are more worthy of attention. Assuming that the rated wind speed of a wind turbine is 10 m/s and a higher wind speed is considered as a high wind speed, the probability of the high wind speed is 7.2% based on wind speed Weibull distributions [5]. Although this probability may not seem high, it poses a significant threat to the wind turbine structure.
Varying the pitch with blade azimuth to reduce the amplitude of the AoA is a direct way to improve the power coefficient and reduce the fatigue load [6], which has been confirmed by some research. Melani et al. [7] investigated a variable pitch system based on a double-cam desmodromic structure and optimized the pitching parameters at the TSR optimal for the original VAWT. Their results showed that the power coefficient was increased by 35%, with some unsteady loads also reduced significantly. Moreover, Peng [8] proposed an optimal variable pitch law and confirmed that the tangential force was increased almost in the entire rotational cycle with the blade normal force amplitude reduced by 15.7%. However, as the alternating variation of the AoA in VAWTs determines that the variable pitch mechanism has to act reciprocally with the blades’ rotation, it tends to bring fatigue or wear problems to the mechanism [9]. In addition, the optimal variable pitch law is generally difficult to be obtained and realized as the aerodynamic characteristics of VAWTs are complex [10].
As a comparison, the HAWTs generally vary the pitch with the TSR while keeping the pitch angle almost constant in one revolution cycle of the blade to control the power and load, which is friendly to the structure. Therefore, this paper intends to explore if the structure-friendly variable pitch strategy, that is, the TSR-based variable pitch, can also improve the power coefficient and reduce the fatigue load for VAWTS, especially in conditions of a high incoming wind speed with a low TSR.
In the authors’ survey, Bundi et al. [11] used a TSR-based variable pitch strategy with the rotor speed regulation to control the power coefficient of a VAWT. Boanchini et al. [12] have also realized the structural failure problem of the reciprocating variable pitch and proposed a variable pitch method changing the pitch only with the wind speed, which is similar to the TSR-based variable pitch in the case of a constant rotor speed. Further, they used the BEM (Blade Element Method) theory to explore the effect of the variable pitch method on the power coefficient. They pointed out that the increment of the power coefficient is more pronounced at low wind speeds for medium–high solidities. However, neither of the above studies focused on the blade fatigue load problem.
To confirm the performance of the TSR-based variable pitch in terms of both the power coefficient and blade fatigue load for VAWTs, the pitch angle effect on the power coefficient and blade normal force at different TSRs should be clarified first. For the pitch angle effect, the improvement of the power coefficient is the main concern for existing research, although high wind speed conditions are rarely involved. Li et al. [13] have studied the variations of the power coefficient along with the TSR for three pitch angles of 4°, 6° and 8° (the positive values indicate the leading edge of the blade outward), and the results showed that the optimal power coefficients for each TSR were all reached by a pitch angle of 6°. Asr et al. [14] studied the influence of the pitch angle on the start-up performance of a VAWT with a process of free acceleration. The results showed that a pitch angle of 1.5° with the blade’s leading edge going outward made the best start-up performance. They also emphasized that the connection position of the support rod to the blade also affects the pitch angle. Fiedler et al. [3] further confirmed that the variation of the blade offset, that is, the change of the connection position, is equivalent to the variation of the pitch angle. In addition, they found that the maximum power coefficient increases with the decrease of the pitch angle (outward deflection of the blade’s leading edge) until the pitch angle is −7.8°. From the above, it can be seen that the pitch angle making the blade’s leading edge outward is usually beneficial to improving the power coefficient.
Focusing on the blade normal force, the results from the work of Rezaeiha et al. [15] showed that a negative pitch angle, best for the power coefficient, reduced the normal force in the upwind zone but increased the normal force in the downwind zone, resulting in no obvious effect on the overall normal force amplitude. Note that the research was only conducted at a high TSR. Moreover, Nguyen et al. [16] hoped to maximize the power coefficient and minimize the hydrodynamic load of a low-solidity vertical axis water turbine by presetting the pitch angle. Their results showed that the pitch angle of 2° (the blade’s leading edge is also outward) provided the best performance in terms of the power coefficient for all the TSRs involved. However, the blade’s normal force was studied only at the TSR of 3.1 and the amplitude was not mitigated significantly.
Although the above research has studied the pitch angle effect on the power coefficient and the blade’s normal force, there are still two inadequacies. The first is that the optimal pitch angle was confirmed mainly based on the rated TSR or the scope of the TSR considered was narrow. The second is that the research on the blade’s normal force was rare and mainly involved high TSRs, but the normal force is generally more severe at low TSRs with high incoming wind speeds. Overall, the existing research still cannot confirm whether the TSR-based variable pitch can improve the power coefficient and reduce the blade fatigue load in high incoming wind speed conditions.
Therefore, in the present work, based on a two-blade H-type VAWT, the power coefficient and the blade normal force with different pitch angles under different TSRs will be studied with the computational fluid dynamics (CFD) method. In particular, the variations of the blade torque and normal force will be analyzed, combined with the flow field around the blade. To compare the two-dimensional (2D) computational values with the experimental values more reasonably, a correction method will be proposed for 2D computational results. Finally, the mechanism of the TSR-based variable pitch in improving the power coefficient and reducing the blade fatigue load will be discussed.
2. Computational Model
2.1. Model of the VAWT
For the convenience of comparing the computational results in the present work with experimental results to verify the accuracy of the computational model, a VAWT model that has been tested by Li et al. [17] was adopted. In their experiments, the surface pressure at the middle section of the blade, which is almost not affected by the flow near the blade tips, was obtained by the pressure taps, providing a reliable benchmark for the 2D computational model in the present work. The VAWT model is a two-blade turbine with a diameter of the rotor D of 1.7 m. The NACA0015 airfoil was adopted by the blades and the chord length of the blade c is 0.225 m. The above parameters determine a solidity (Nc/D) of 0.265 for the VAWT. The base structure parameters of the VAWT are listed in Table 1.

Table 1.
The base structure parameters of the VAWT.
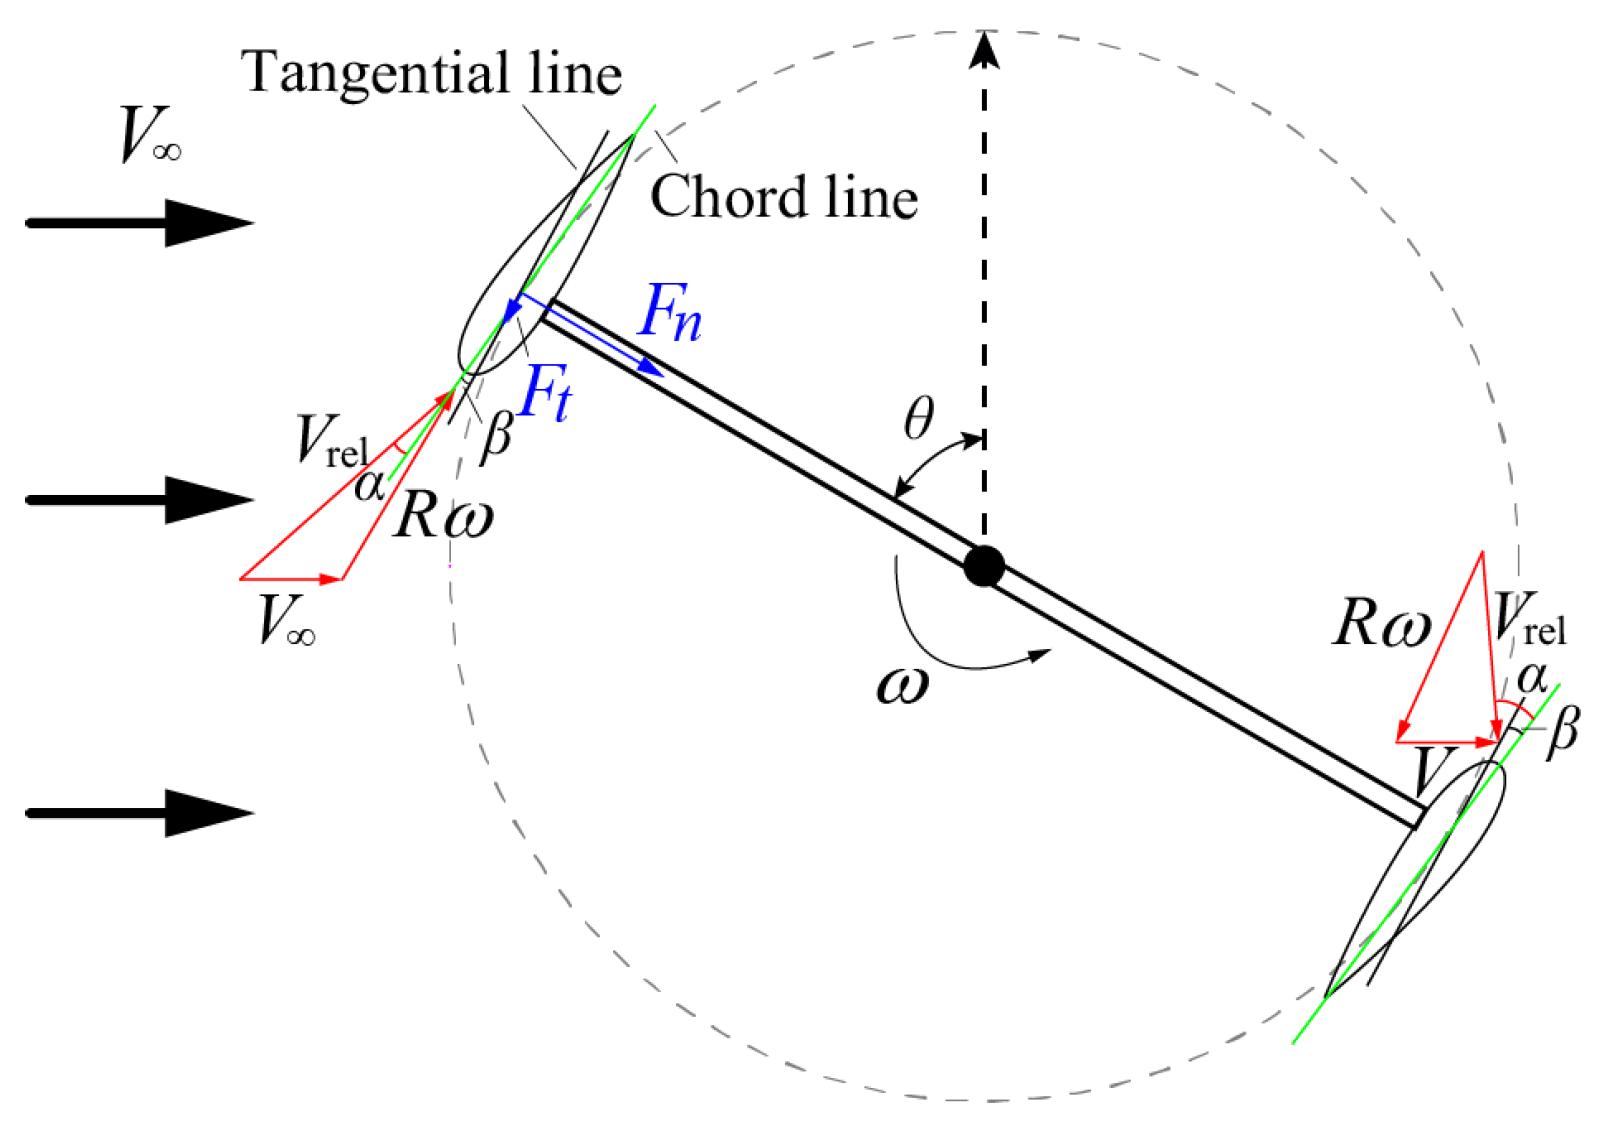
Figure 2 shows the parameters of the blade structure and aerodynamics. In the figure, the V∞ is the incoming wind velocity; the θ is the azimuth angle with the values of 0~180° corresponding to the upwind zone and the values of 180~360° corresponding to the downwind zone; the ω is the rotor speed (rotating angular velocity); the α denotes the AoA, which is the angle between the relative wind velocity and the chord line of the airfoil; and the pitch angle β denotes the angle between the blade chord line and the tangent line of the blade track. When the leading edge of the blade is outward, the pitch angle is defined as positive. It can be seen from the figure that when the pitch angle increases in the positive direction, the AoA tends to decrease in the upwind zone and increase in the downwind zone.
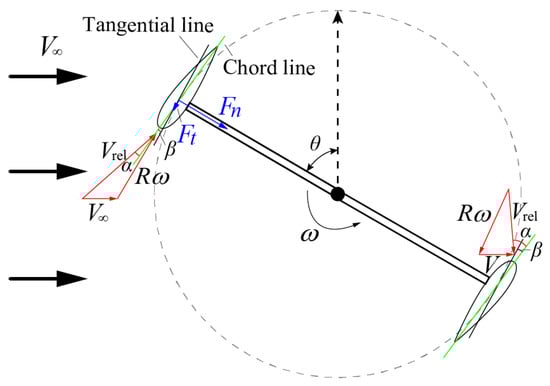
Figure 2.
Parameters about the blade structure and aerodynamics.
In the present work, the original VAWT with a pitch angle of 6° is calculated first at the TSRs consistent with the experiment to illustrate the accuracy of the computational model. Then, keeping the rotor speed unchanged, the wind speed is gradually increased to get different TSRs. For different TSRs of 1.7, 2.0, 2.3 and 2.6, the pitch angle varies from 0° to 10° in a step of 2° and for different pitch angles, the blade torque and the blade normal force are calculated. Therefore, the influences of the pitch angle on the power coefficient and blade normal force will be clarified and then the feasibility of the TSR-based variable pitch used to improve the power coefficient and reduce the blade fatigue load will be confirmed.
Specifically, the power coefficient is the macroscopic reflection of the variation of the blade torque, which is calculated by Equation (1).
where the T represents the rotation period of the wind turbine rotor; the ρ denotes the air density; and the A represents the windward area of the wind turbine rotor. Moreover, A = DH. For 2D computational models, the value of H is 1 m.
2.2. Computational Method
As the flow around VAWTs is generally of low speed (Mach number is less than 0.1), the air compression can be ignored and the heat transfer is not involved. Therefore, the fluid flow was mainly governed by the Navier–Stokes equations without the energy equation considered. In addition, as the dominant flow state in VAWTs changes little along the spanwise of the blade, a 2D model was established and thus the Reynolds-Averaged Navier–Stokes (RANS) method was adopted to deal with the turbulence fluctuation effect. In particular, the 2D RANS governing equations were discretized (in the fluid domain) and solved by the CFD software ANSYS fluent 19.0 with the finite volume method.
Some previous works [18,19] have developed 2D approaches for the calculation of VAWTs and they have recommended some key calculation settings, shown in Table 2. These recommendations provide great help for the establishment of computational models for VAWTs. Based on this, the governing equations were solved using the pressure-velocity coupling method with the 2nd-order upwind discretization in the spatial domains and 2nd-order implicit for the time differencing. For the RANS method, the shear-stress transport (SST) k-ω model [20] was used to calculate the turbulence viscosity with the Intermittency Transition Model, Production Limiter and Curvature Correction features enabled [21]. The SST k-ω model incorporates the advantage of the k-ω model [22] in dealing with the boundary layer flow and the advantage of the k-ε model [23] in handling the free stream, making itself suitable for the calculation of the flow around VAWTs [24].
Table 2.
Key CFD calculation settings suggested by some references.
For the discretization of the spatial domain, the definition of the computational domain and the distribution of the grid are shown in Figure 3. The computational domain size referred to the suggestion of Table 2. The boundary condition on the left side of the computational domain was set as the velocity inlet and the right-side boundary condition was set as the pressure outlet with a pressure value of the atmospheric pressure (101.325 kPa). The upper and lower boundaries were both set as slip wall type and the surfaces of the blades were all set as no-slip wall type. The computational domain was divided into four regions, namely, the two inner regions, the transition region and the outer region. The four regions were nested by the boundary interfaces without overlapping and allowed to slide with one another under the interface geometric constraints. Specifically, the inner regions and the transition region will rotate with the turbine rotor, so that the grids do not need to deform during the movement of the blades. In addition, the inner regions can also rotate around the pitching centers of the blades, respectively, which makes it easier to change the pitch angles of the blades without regenerating the grids.
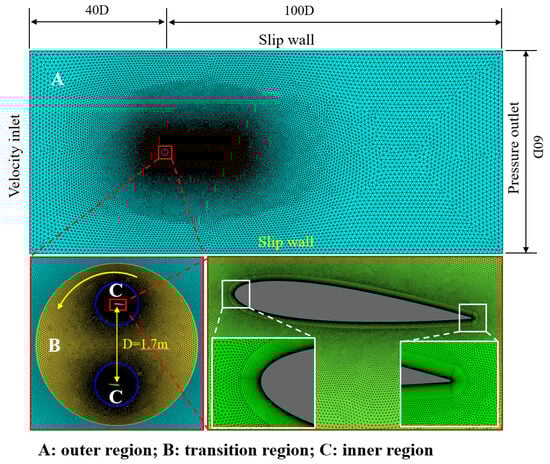
Figure 3.
Definition of the computational domain and the grid distribution.
The outer region is static and filled by triangular grids. The inner regions and the transition region are also divided by triangular grids. Generally, triangular grids have better adaptability to irregular boundaries and better transition from the blades to the far-field boundaries than quadrilateral or polygon grids. Moreover, by some trial calculations, we found that the triangular mesh has better computational stability. It should be noted that multi-layer orthogonal grids were arranged on the blade’s surfaces to capture the boundary layer flow.
Balduzzi et al. [19] conducted detailed research on the grid granularity and time step size based on the aforementioned grid distribution strategy. Fortunately, the geometry of their tested wind turbine with a blade chord of 0.246 m and radius of 0.85 m is close to that of our present work, which enhances the reference value of their conclusions for the present work. In their research, the number of nodes on the blade surface of 1794 at TSRs of 1.7 and 2.2 was recommended, which is also enough for other higher TSRs (although it is not necessary). Accepting this recommendation and considering the blade curvature, in the present work, more grids were arranged near the leading edges and trailing edges of the blades. In the boundary layer, 40 layers of orthogonal grids with a growth rate of 1.1 were used for the discretization and the height of the first layer grids was set as 5 × 10⁻⁵c to ensure that the corresponding maximum y+ was not greater than 1 [20]. The first layer grid height was determined based on the maximum incoming wind speed and the maximum TSR (corresponding to the maximum Reynolds number) involved in this paper. As a higher Reynolds number requires a smaller height of the first layer grids, the current height of the first layer grids also satisfies the flow conditions with other Reynolds numbers involved in this paper. In addition, the above boundary layer grid parameters resulted in a grid thickness of about 0.029c, which is usually enough to cover the boundary layer flow.
In VAWT calculations, the length of the time step is usually represented by the blade azimuth angle increment per time step. The azimuth increment of 0.5° was recommended by Rezaeiha et al. [25] and Edwards et al. [26]. However, on the premise that all the calculation residuals in each time step reach 2 × 10⁻⁶ with enough iterations, we found that the azimuth increment of 0.5° cannot meet the convergence requirement, especially for the working conditions of low TSRs. Balduzzi et al. [19] have suggested that the azimuth increment should be less than 0.0675° for TSR of 1.7. Based on this and by some trial calculations, we found that the increment of the blade azimuth of 0.075° (it is more friendly for post-processing) can also meet the convergence requirement for the lowest TSR of 1.7 and other higher TSRs involved in this paper. In addition, to obtain a periodically stable flow field around the rotating blades, multiple cycles are calculated for each TSR until the relative deviation of the force fluctuations for two adjacent cycles does not exceed 0.1%.
3. Verification and Validation of the Computational Model
3.1. Grid Independence Verification
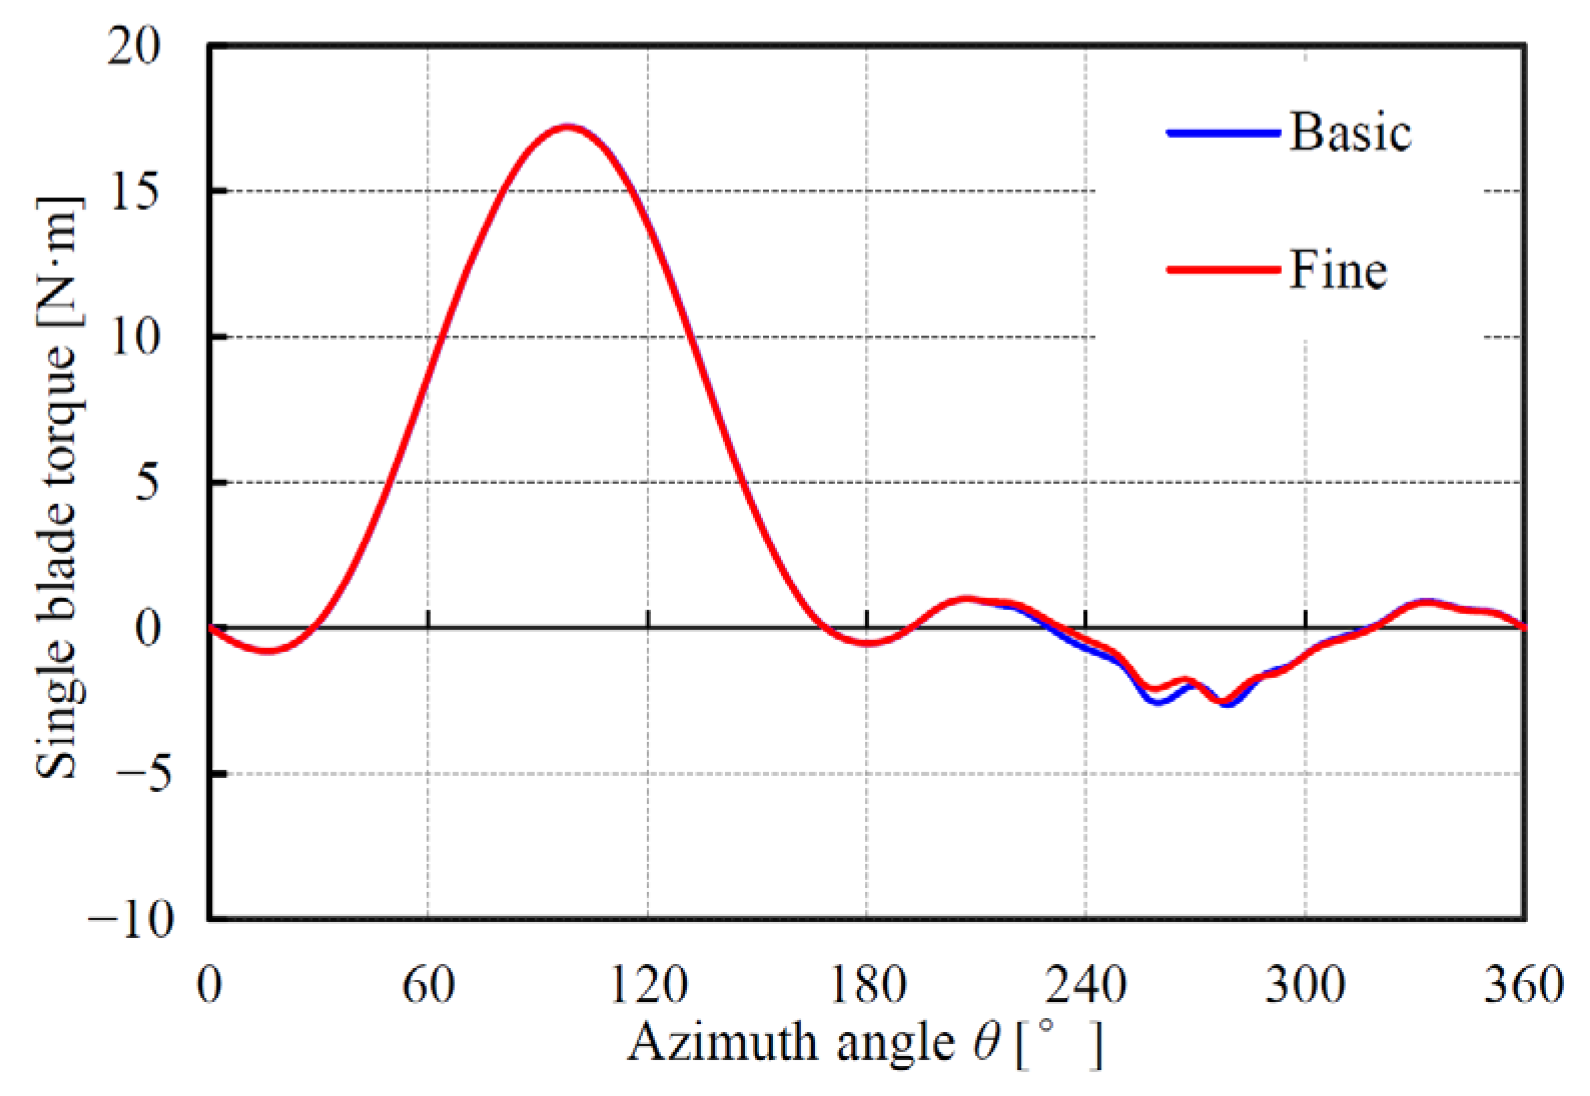
Grid independence verification is an important part of the verification of the computational model. Although the key parameters used to establish the basic mesh presented in the previous section have been verified by the relevant literature, it is still necessary to establish a more refined mesh to verify the basic mesh. Therefore, a fine mesh with 2698 nodes on the surface of one blade was established with the growth ratios in the boundary layer and other triangular grid regions unchanged. Figure 4 shows the variations of the single blade torque calculated with the two meshes. As the grid quality is good enough even for the basic mesh, the results from the two sets of grids are very close with the two torque curves, almost coincidental. Therefore, we confirmed that the basic mesh can meet the requirement of reliability for calculation.
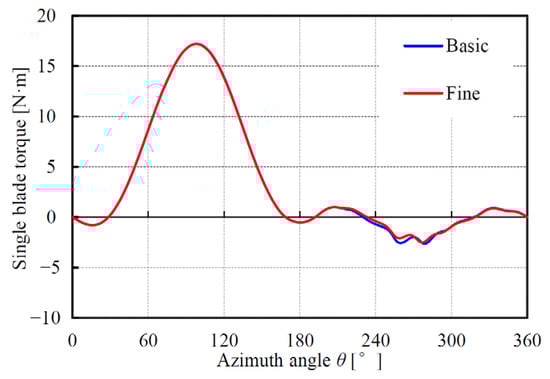
Figure 4.
Variations of the single blade torque from different meshes.
3.2. Validation Based on a Correction Method for 2D Calculations
To verify the accuracy of the computational model by comparing it to the experiment, the inlet velocity and the TSRs consistent with that of the experiment were used for calculation. In addition, considering that the experimental model has a thick shaft, the shaft boundary was added to the computational model, although the formal calculation will be still based on the model without the shaft.
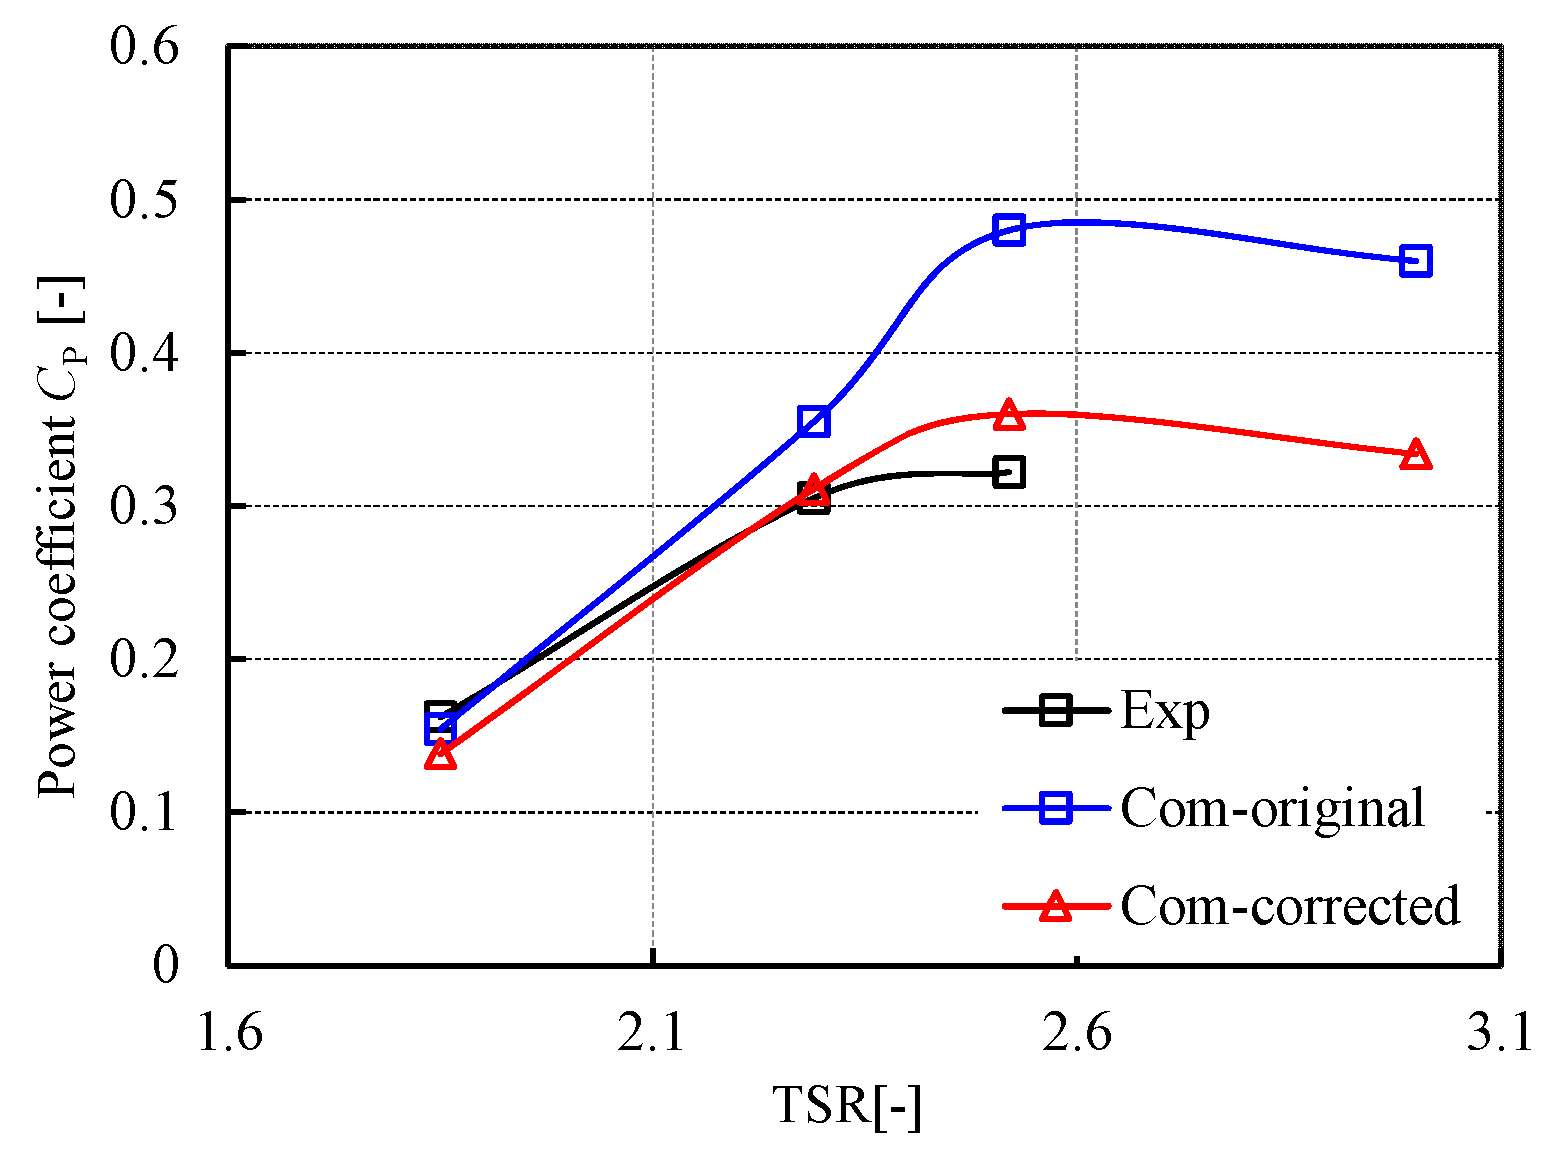
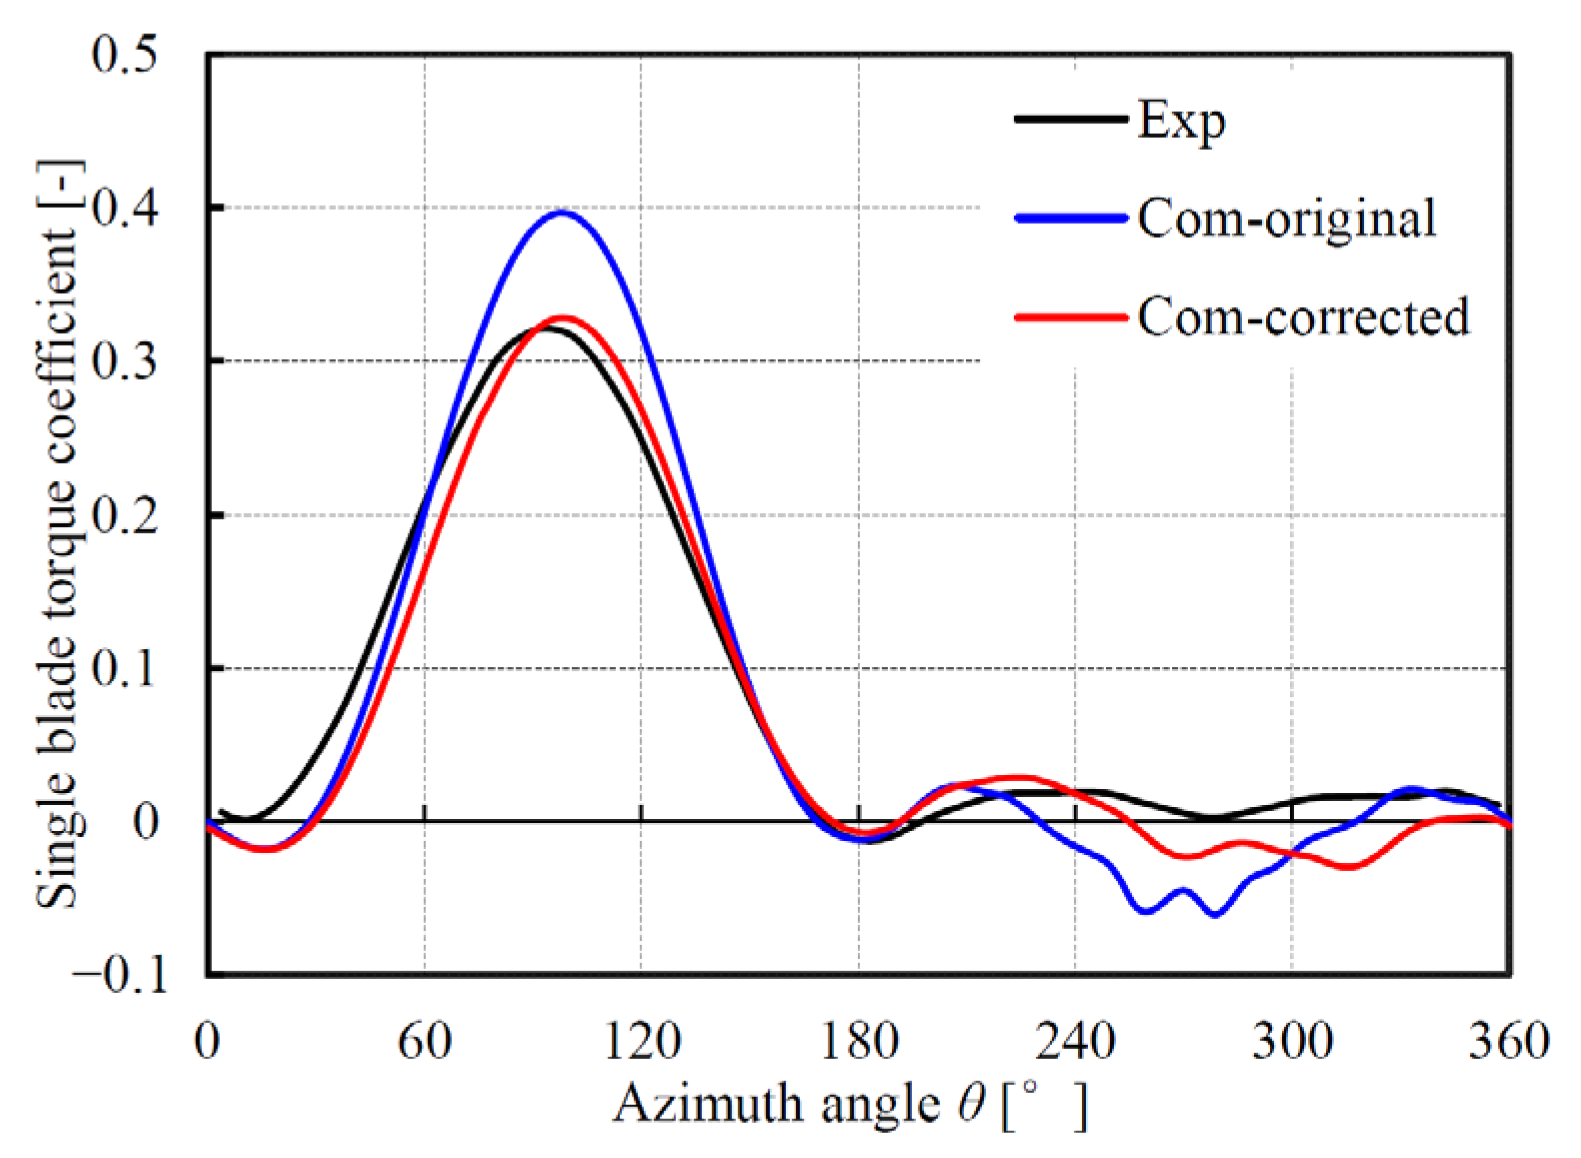
Figure 5 shows the comparison between the computational and the experimental power coefficients with different TSRs. It is found that the computational values (original) are generally greater than the experimental values for different TSRs, especially for high TSRs. From the comparison of the single blade torque coefficients at a TSR of 2.29, shown in Figure 6, it is also found that the computational curve (original) has a larger peak value in the upwind zone than the experimental one; in the downwind zone, the computational torque (original) fluctuates greatly and the valley value is smaller than the experimental one, indicating a stronger flow separation and corresponding vortex shedding.
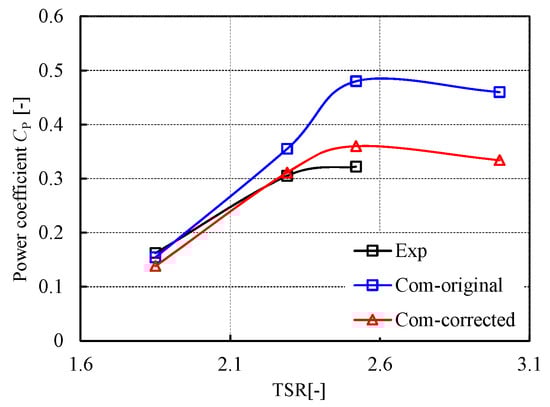
Figure 5.
Comparison between the computational and the experimental power coefficients with different TSRs.
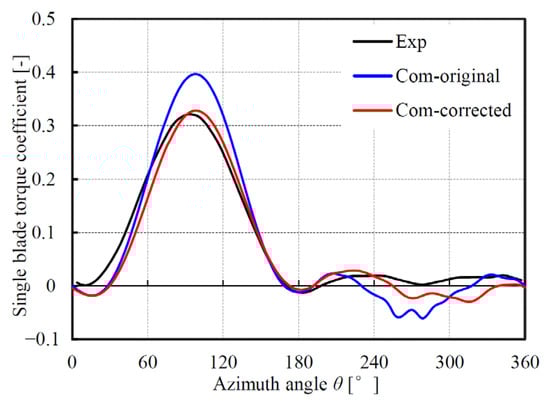
Figure 6.
Comparison between the computational and the experimental single blade torque coefficients at TSR of 2.29.
It is a common phenomenon that 2D computational models of VAWT have larger power coefficients than that of experiments, especially at high TSRs [27,28,29]. Howell et al. [27] concluded that the 2D models are unable to capture the effect of the tip vortices in real turbines which tends to reduce the power coefficient. Li et al. [28] pointed out that the poor accuracy of the URANS method in 2D models is mainly due to its inherent limitation in vortex modeling. Even so, a 2.5D computational model with high-precision large eddy simulation (LES) conducted by them also showed an unsatisfactory agreement with the experiment, especially at high TSRs. Mclaren [29] attributed this discrepancy to the effect of the flow divergence which is different for 2D models and 3D real models. As the 2D models do not have spanwise space for flow divergence, the flow divergence is weaker in 2D computational VAWTs than that in real VAWTs. The weaker flow divergence tends to make the wind speed encountered by rotors higher, thus leading to a higher power coefficient in 2D models.
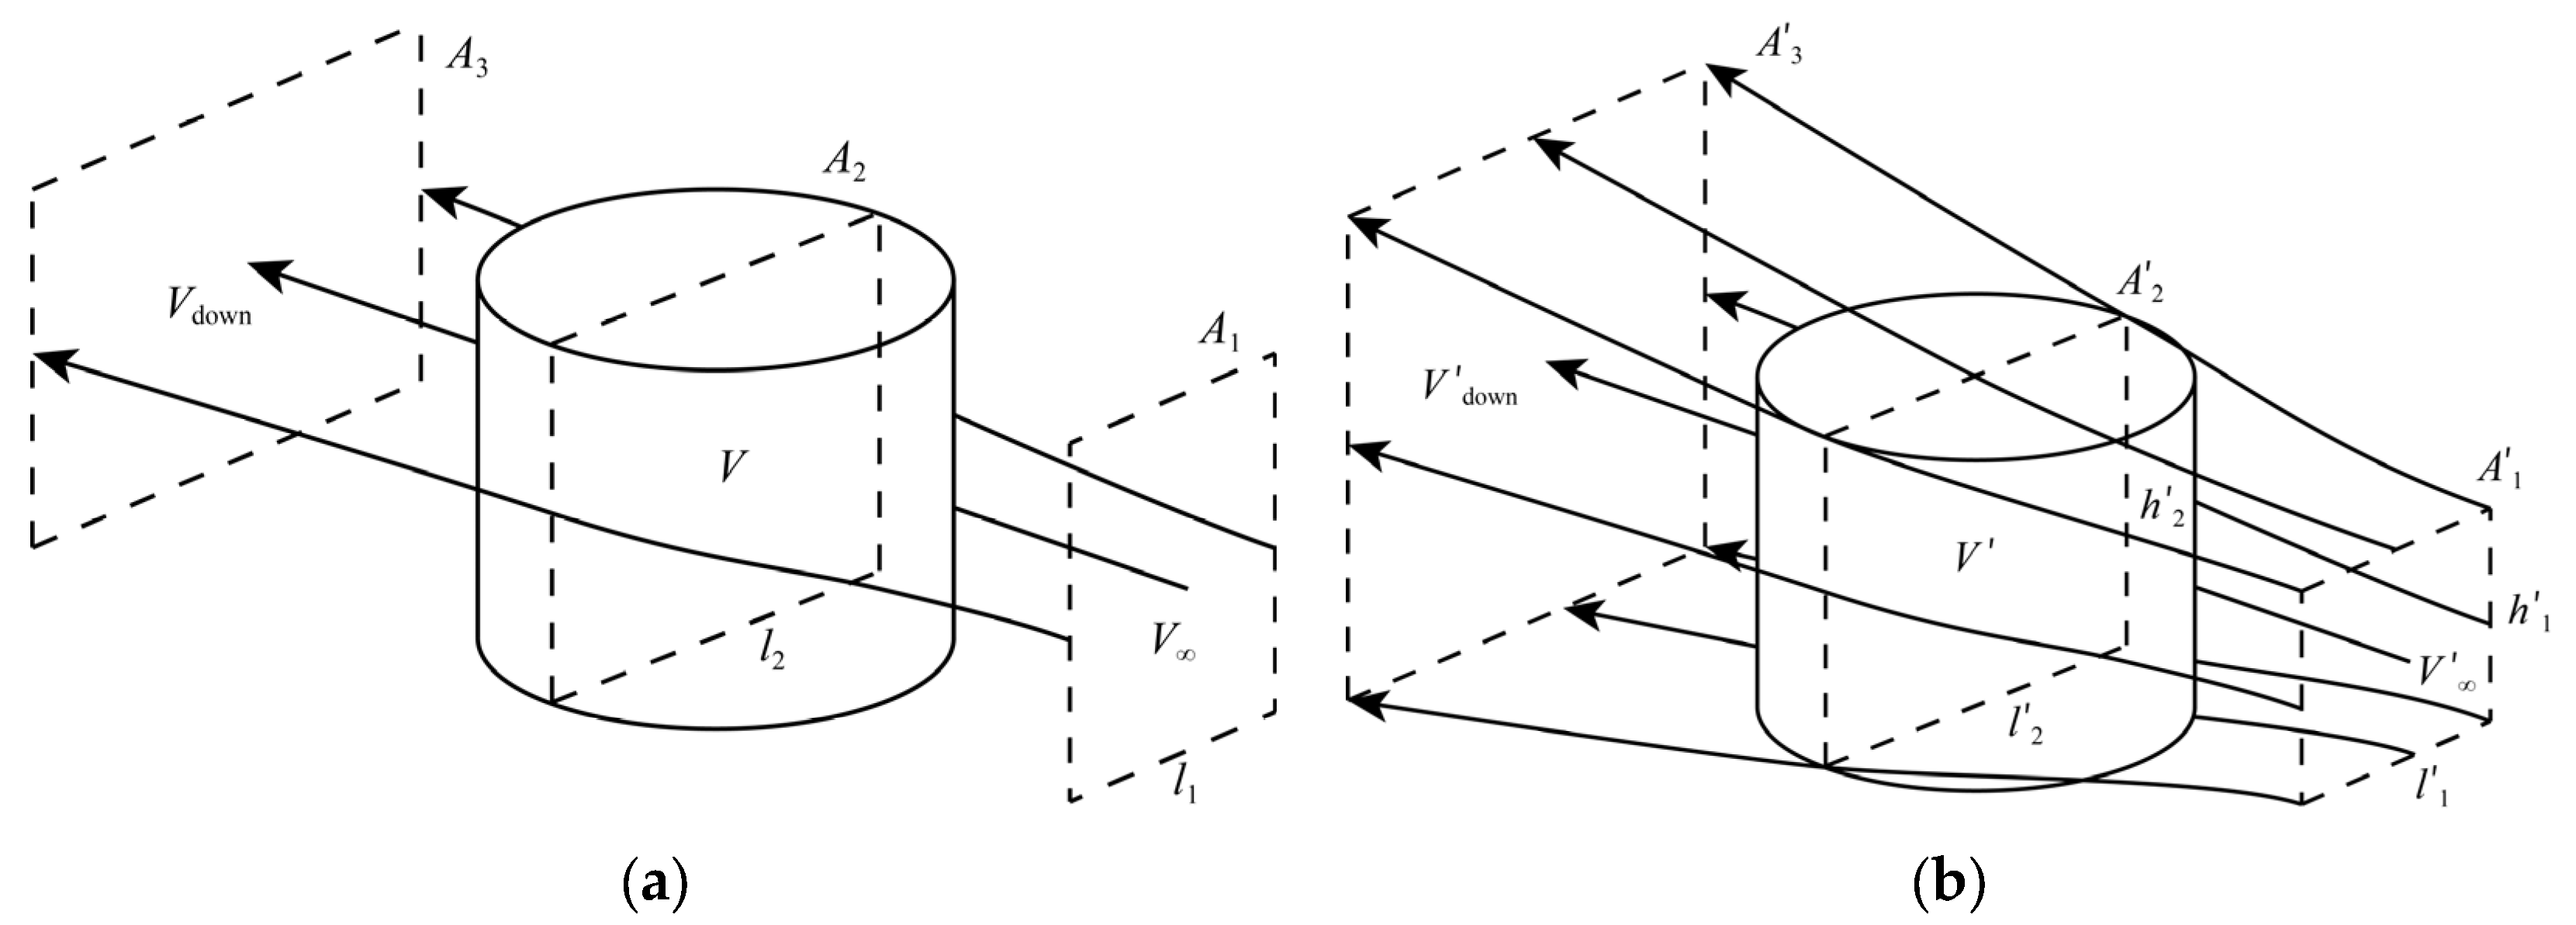
In the present referenced experiment, as the experimental values came from the integral of the surface pressure in the middle of the blade, the influences of the tip vortices and parasitic drag on the power coefficient have basically been eliminated. In addition, when the blade has a small azimuth angle in the upwind zone corresponding to a small AoA, the computational model gives a higher single blade torque coefficient, as if experiencing a greater wind turbine. Therefore, we tend to believe that the insufficiency of the 2D model in taking into account the flow divergence in real scenes causes the gaps between the 2D computational results and the 3D experimental results. The flow divergences in the 2D computational model and the 3D real model are shown in Figure 7.

Figure 7.
Flow divergences in the 2D computational model and the 3D real model. (a) A 2D computational model; (b) 3D real model.
Based on the flow divergence effect, if the computational results can be corrected to be consistent with the experimental results, the reliability of the present computational model will be verified and using 2D computational models to calculate VAWT aerodynamics will be approved. Therefore, Mclaren [29] modified the reference wind speed in the 2D model to a larger value, so that the computational results, such as the power coefficient, were corrected and closer to the experimental values. However, this modification lacks intuitiveness and the research has not given the modification details for reference.
In this paper, considering that the wind turbine in the 2D model is subject to a larger wind speed, we intend to reduce the incoming wind speed for calculation, but keep the reference wind speed consistent with the experiment. For the TSR of 2.29 and by several trial calculations, we found that when the incoming wind speed is reduced to 6.5 m/s (the reference wind speed is 7 m/s), the computational power coefficient is almost equal to the experimental values, as shown in Figure 5. In addition, the variation of the corrected torque coefficient is also very close to the experimental results, which means that reducing the incoming wind speed to correct the computational results is feasible.
To reduce the incoming wind speed for other TSRs more easily, we intend to propose a method to establish the relationship between the target incoming wind speed and the reference wind speed (the real incoming wind speed in the experiment). Firstly, the relationship between the flow divergence ratios from the 2D and 3D models should be determined. Therein, the flow divergence ratio can be represented by the ratio of the incoming flow area to the windward area of VAWTs, that is, A1/A2 for the 2D model and A′1/A′2 for the 3D model, as shown in Figure 7. In theory, when wind turbines provide very small flow resistance, the two area ratios will both approach 1, and when wind turbines provide large flow resistance, the area ratio of the 3D model is significantly less than that of the 2D model. Based on this characteristic, we can have
where k is generally less than 1 and mainly related to the geometry of the wind turbine, especially the ratio of the span-wise length to the rotor diameter.
According to the fluid continuity equation in integral form, and , we can get
Note that the purpose of reducing the incoming wind speed in the 2D model is to make the wind speed encountered by the 2D rotor V equal to the wind speed encountered by the 3D rotor V′. Therefore, we derived Equation (3) to express the relationship between the target incoming wind speed and the reference wind speed, as shown in Equation (4).
According to the single actuator disc theory of VAWTs [30], can be expressed as , where is the induction factor which is assumed to be uniformly distributed on the windward section of the wind turbine. In addition, the power coefficient can be expressed by Equation (5).
Based on Equations (4) and (5), the induction factor can be obtained according to the power coefficient of the VAWT in the experiment and then the target incoming wind speed in the 2D model can be further calculated. But before this, the coefficient k in Equation (2) needs to be confirmed. As we have confirmed that the target incoming wind speed at the TSR of 2.29 is 6.5 m/s, we can get the value of the coefficient k as 0.26.
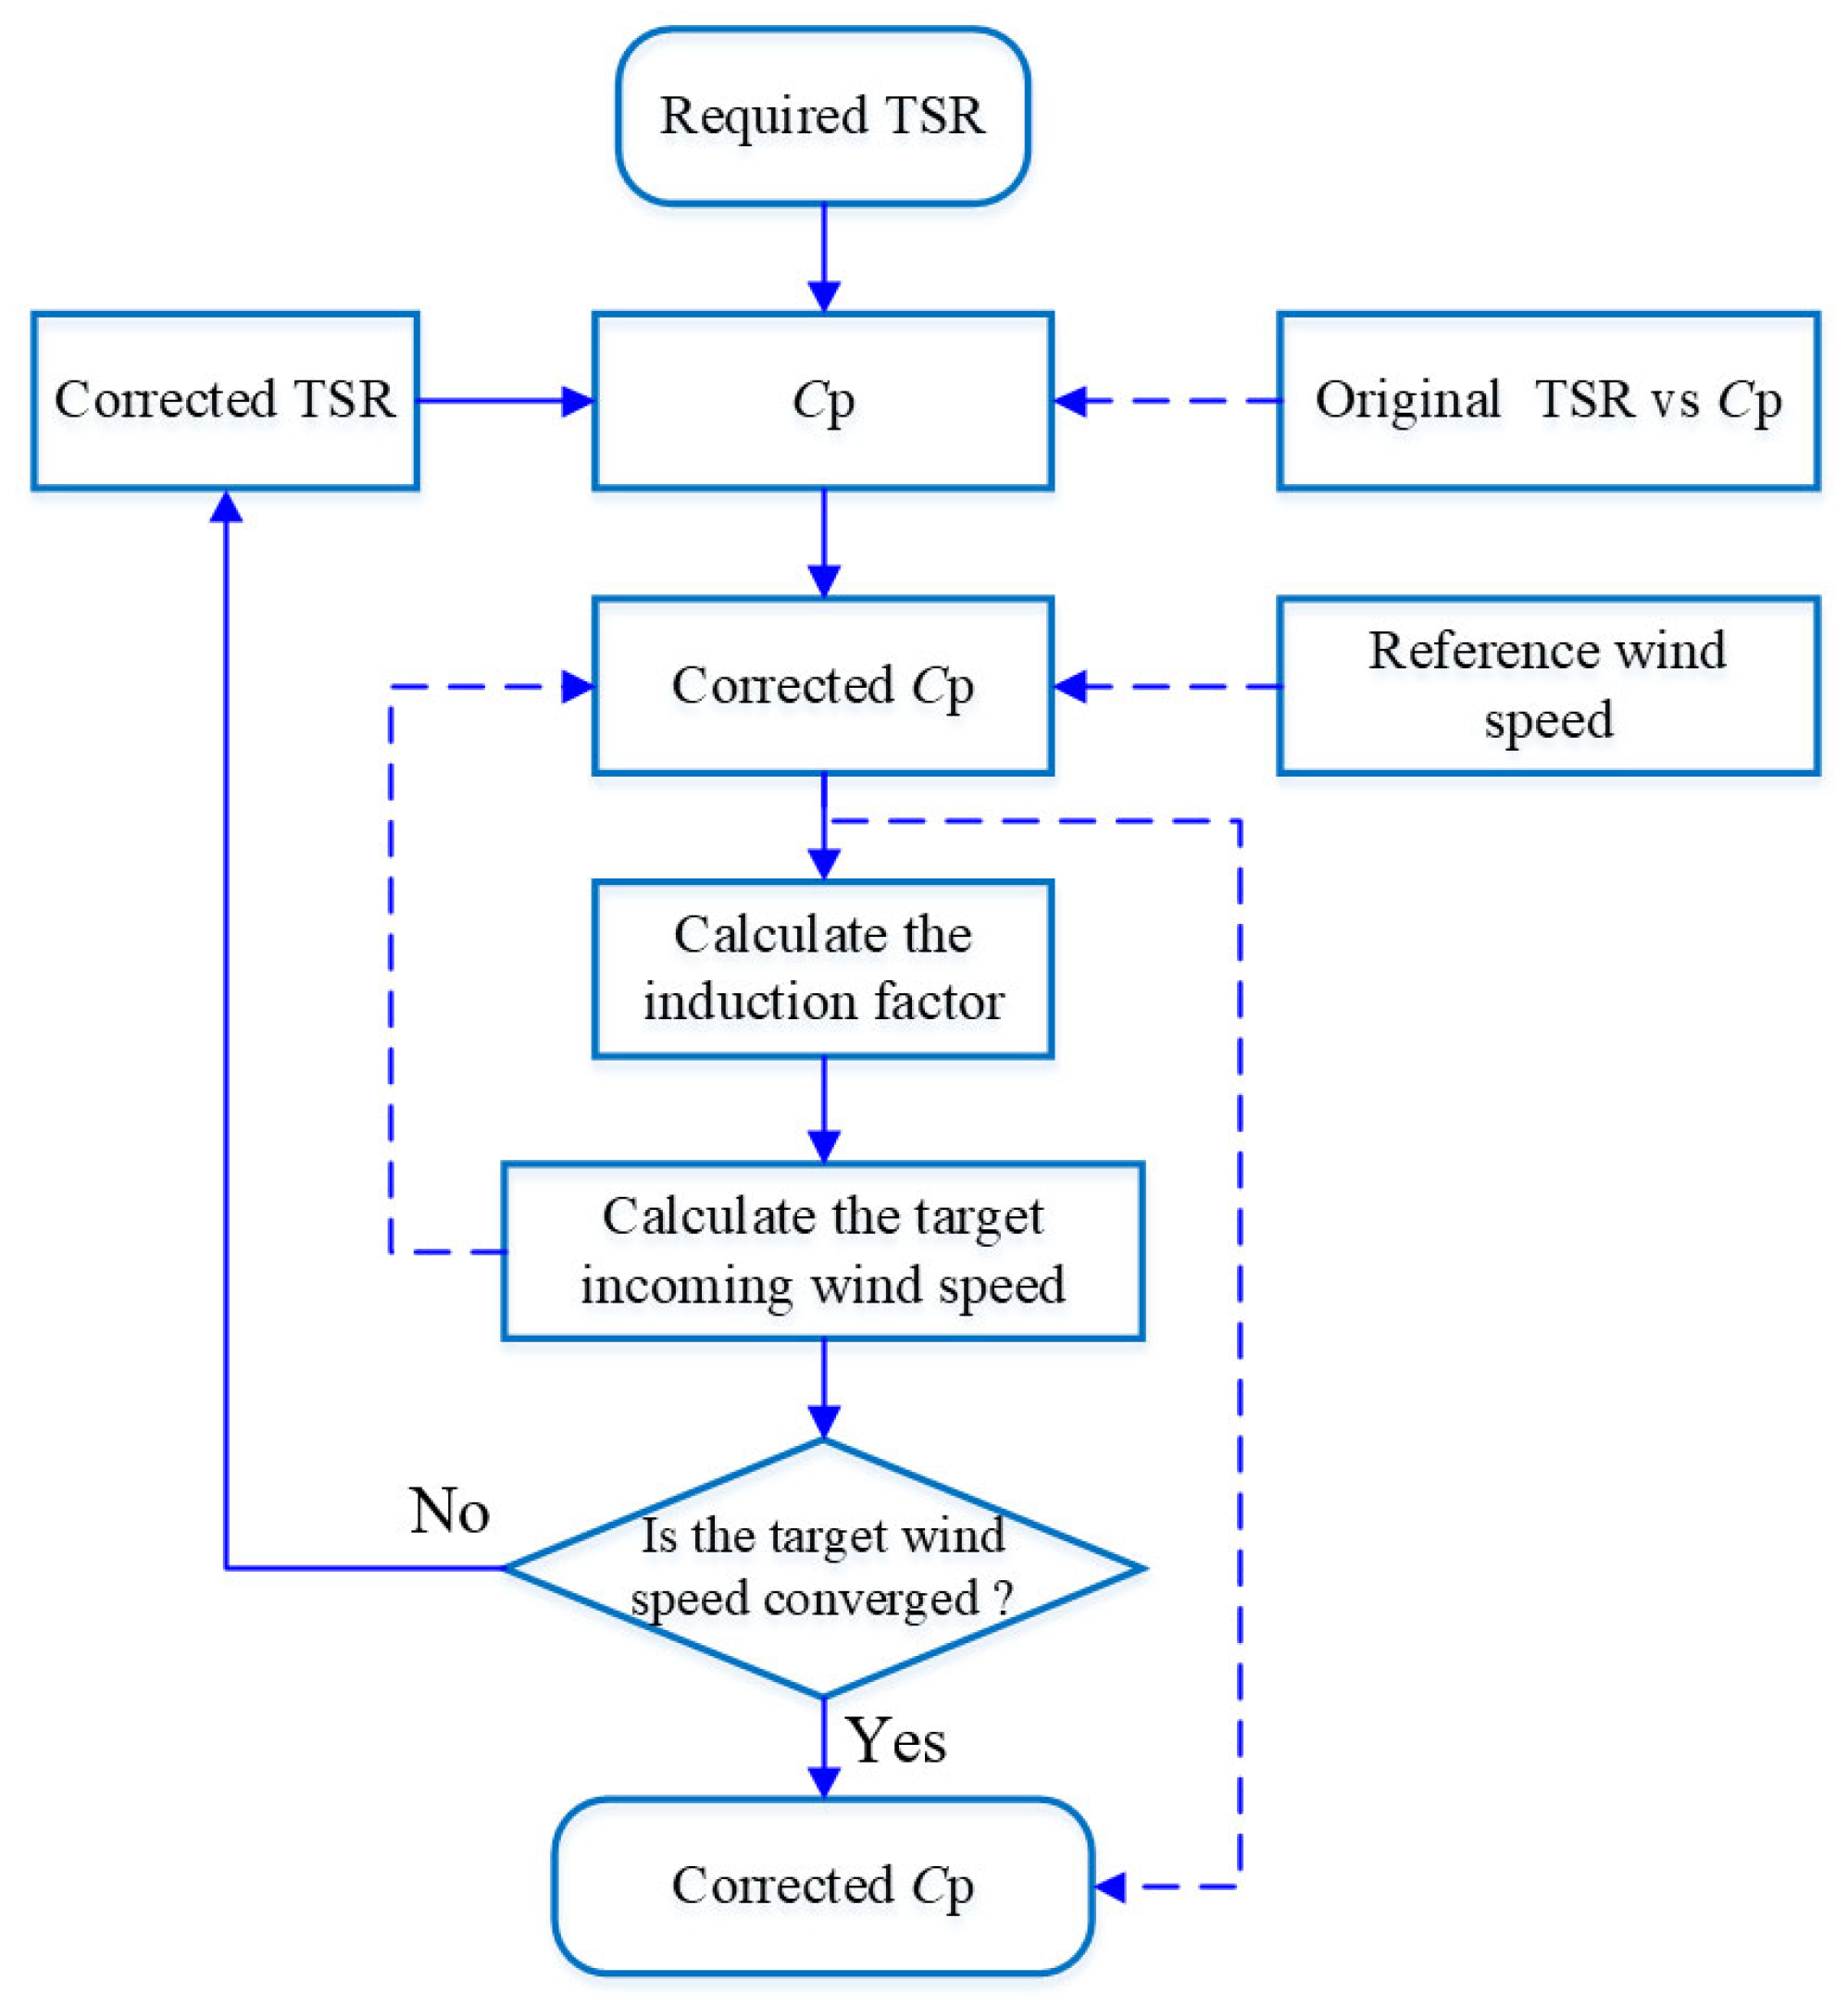
As in general cases power coefficients given by experiments may be affected by some factors such as the resistance of support rods and the disturbance of the shaft, we hope to correct the 2D computational results without the referred experimental values. In other words, the induction factor is instead calculated based on the original 2D computational results and then used to get the reduced incoming wind speed and corrected power coefficients. The specific correction process is shown in Figure 8, where the solid arrows indicate the operation flow and the dashed arrows indicate the data flow. Based on the original 2D computational data of the TSR versus Cp, the correction steps are as follows.

Figure 8.
Flow chart of the correction for 2D computational power coefficient based on 2D computational results.
- (a)
- Determine a required TSR and search the corresponding power coefficient, then calculate the induction factor and the target incoming wind speed.
- (b)
- Obtain the corrected TSR based on the reduced incoming wind speed and search for the power coefficient corresponding to the corrected TSR.
- (c)
- Correct the power coefficient based on the reduced incoming wind speed. Specifically, obtain the real power corresponding to the reduced incoming wind speed and then calculate the corrected power coefficient based on the real power and the original reference wind speed.
- (d)
- Based on the corrected power coefficient, calculate the induction factor and the target incoming wind speed again.
- (e)
- If the relative error of the inducement factors between two adjacent rounds does not exceed 0.05, the current corrected power coefficient will be the final corrected power coefficient. If the above relative error exceeds 0.05, repeat the steps of b~e.
Based on this, the corrected computational Cp vs TSR in the present work is shown in Figure 5. It can be seen that the corrected computational power coefficients are in better agreement with the experimental values and the maximum deviation is not more than 5.6% (the original maximum deviation is 49.1%).
In this section, the 2D computational results were corrected considering the flow divergence effect and the corrected results show a good agreement with the experimental results in terms of the power coefficients and the blade torque variation, which verifies the accuracy of the current 2D computational model. The correction method proposed also helps us deepen the understanding of the deviation between 2D computational models and 3D real models of VAWTs and provides a method for the correction of the 2D computational results.
4. Results and Discussion
Based on the computational model established in the present work, this section will explore the pitch angle effect on the power coefficient and blade normal force of the VAWT. As the low TSRs with high incoming wind speeds are the focus, the different TSRs will be achieved by keeping the rotor speed unchanged and gradually increasing the wind speed higher than the rated value.
4.1. Pitch Angle Effect on the Power Coefficient
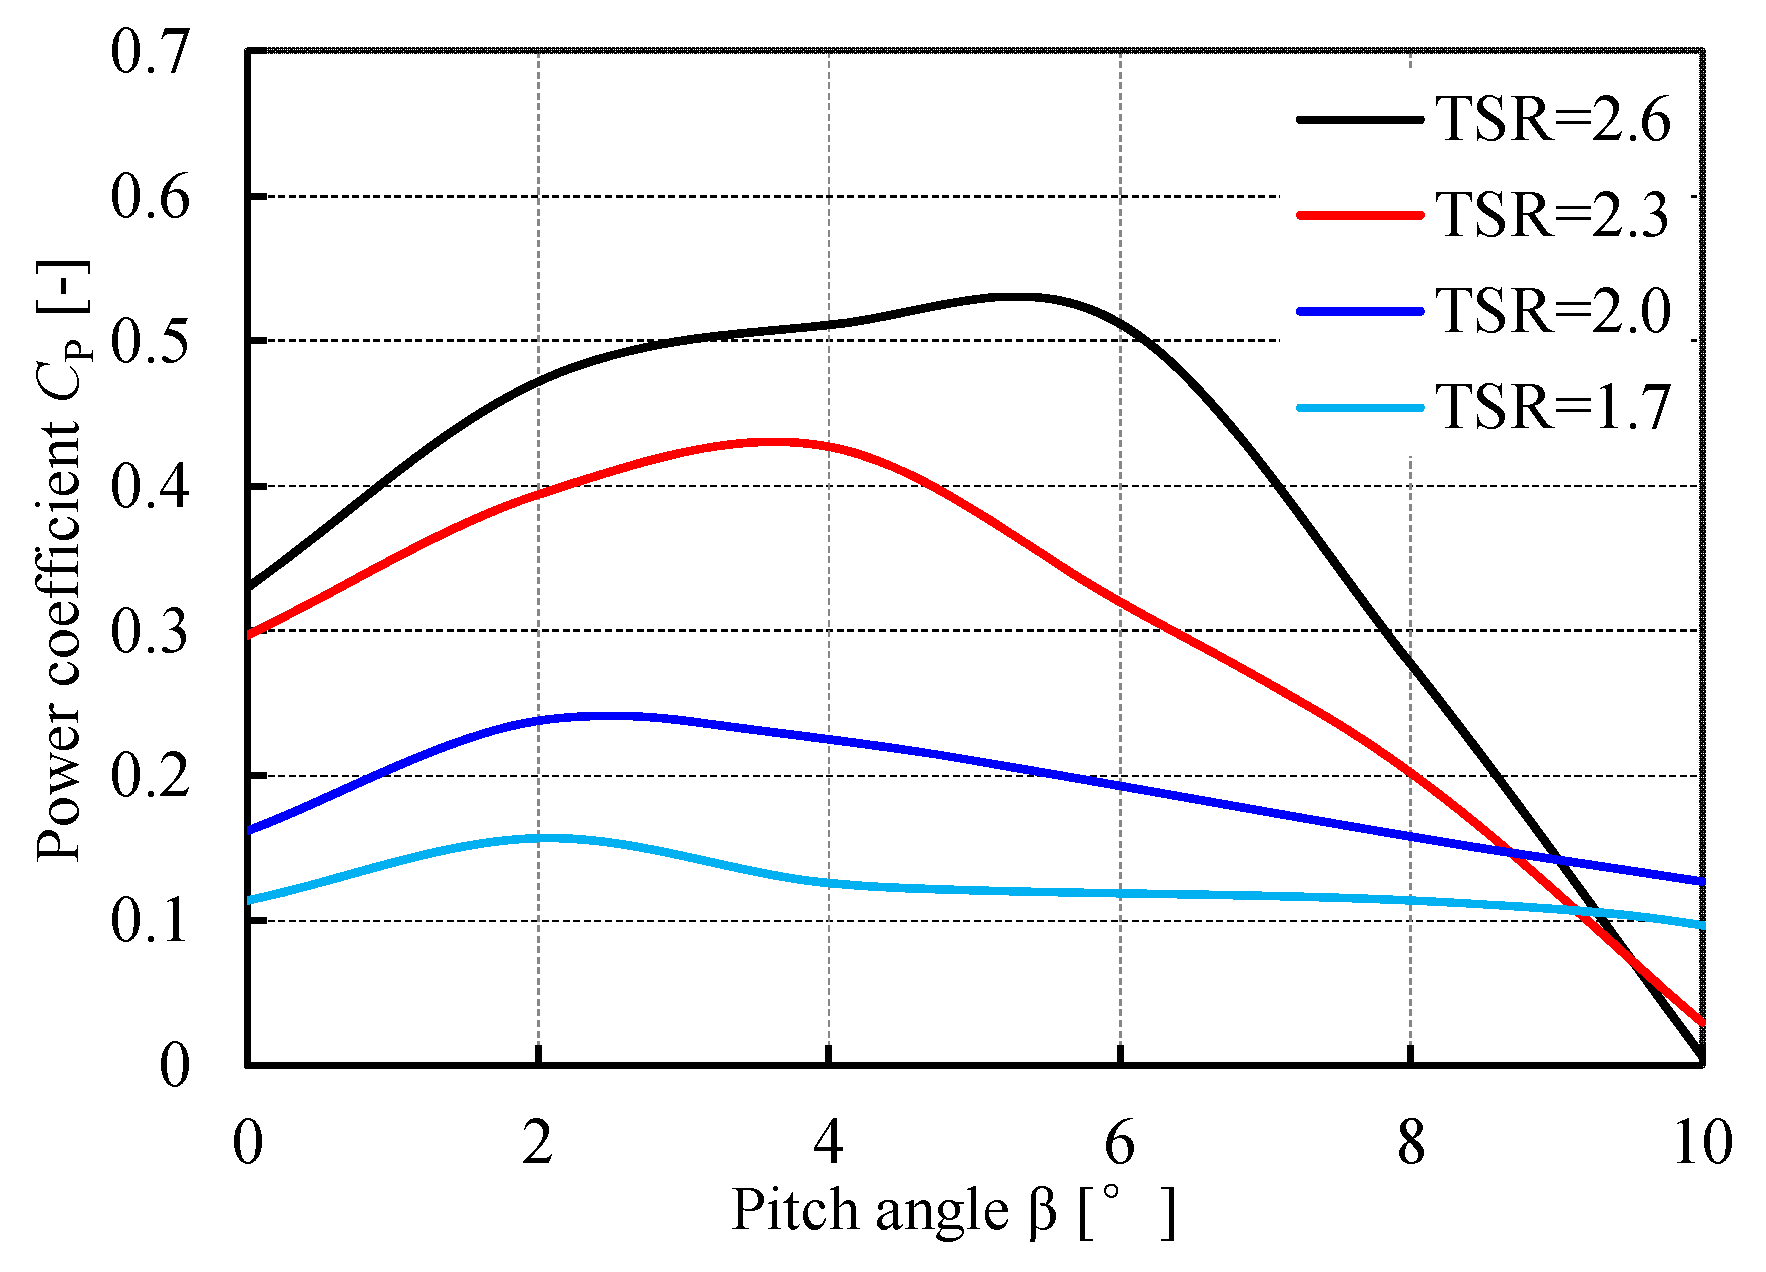
Figure 9 directly shows the power coefficients with different pitch angles at different TSRs. It can be seen that all the power coefficients for each TSR increase first and then decrease with the increase of the pitch angle. Moreover, the optimal power coefficient gradually decreases with the decrease of the TSR. It is worth noting that the pitch angle corresponding to the optimal power coefficient decreases with the reduction of the TSR. This indicates that it is necessary to vary the pitch during the TSR changes to make the wind turbine operate at the optimal power coefficient state for different TSRs.
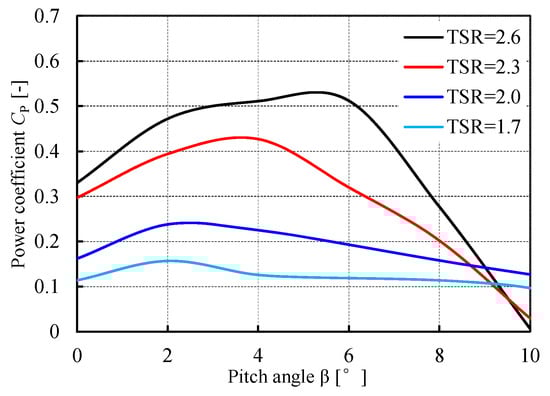
Figure 9.
Power coefficients with different pitch angles at different TSRs.
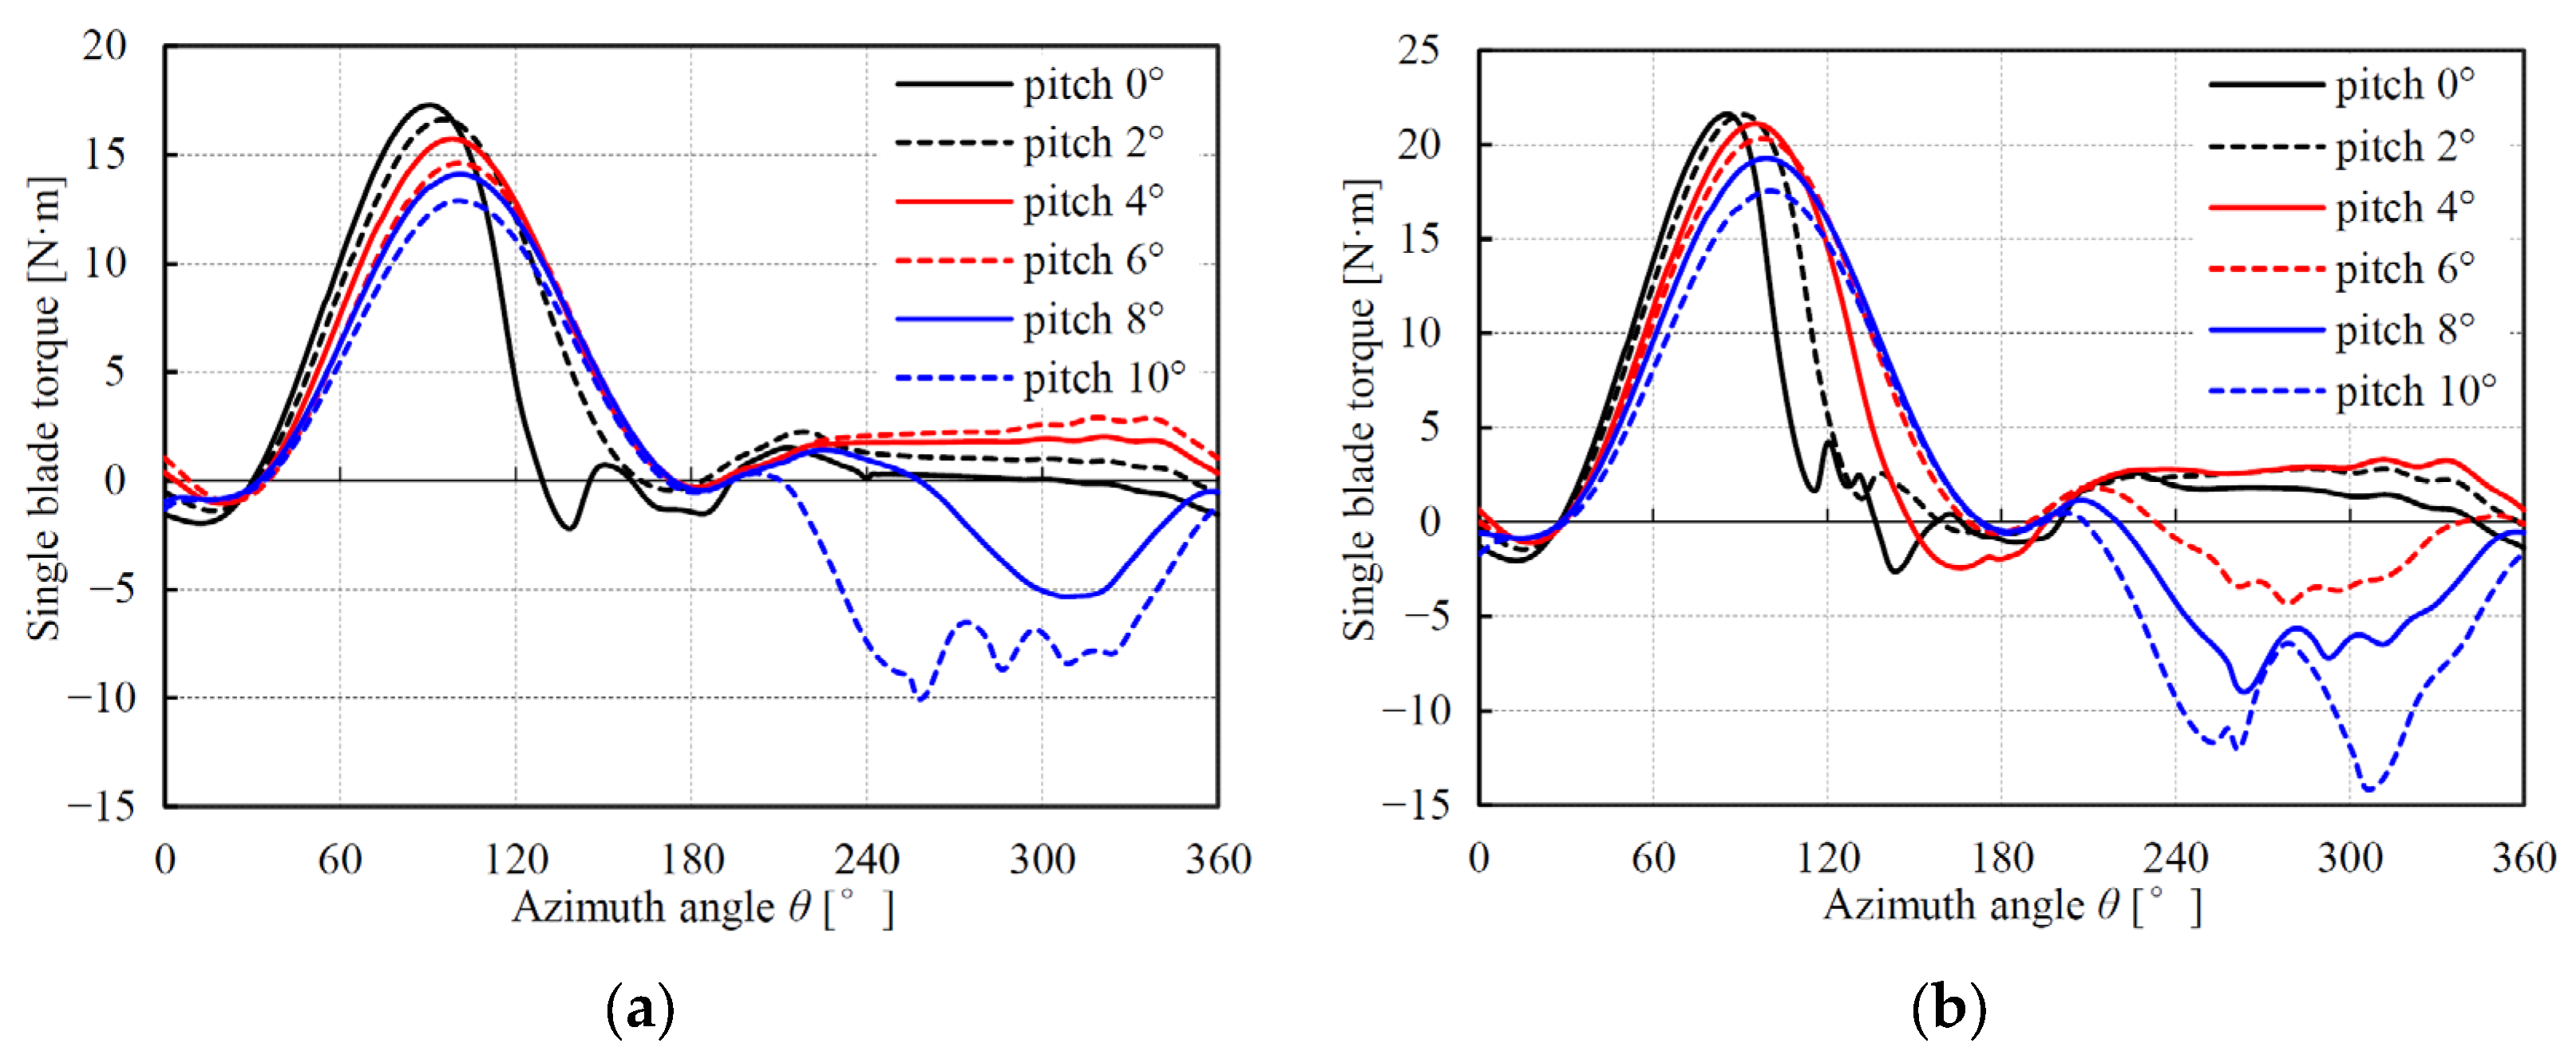
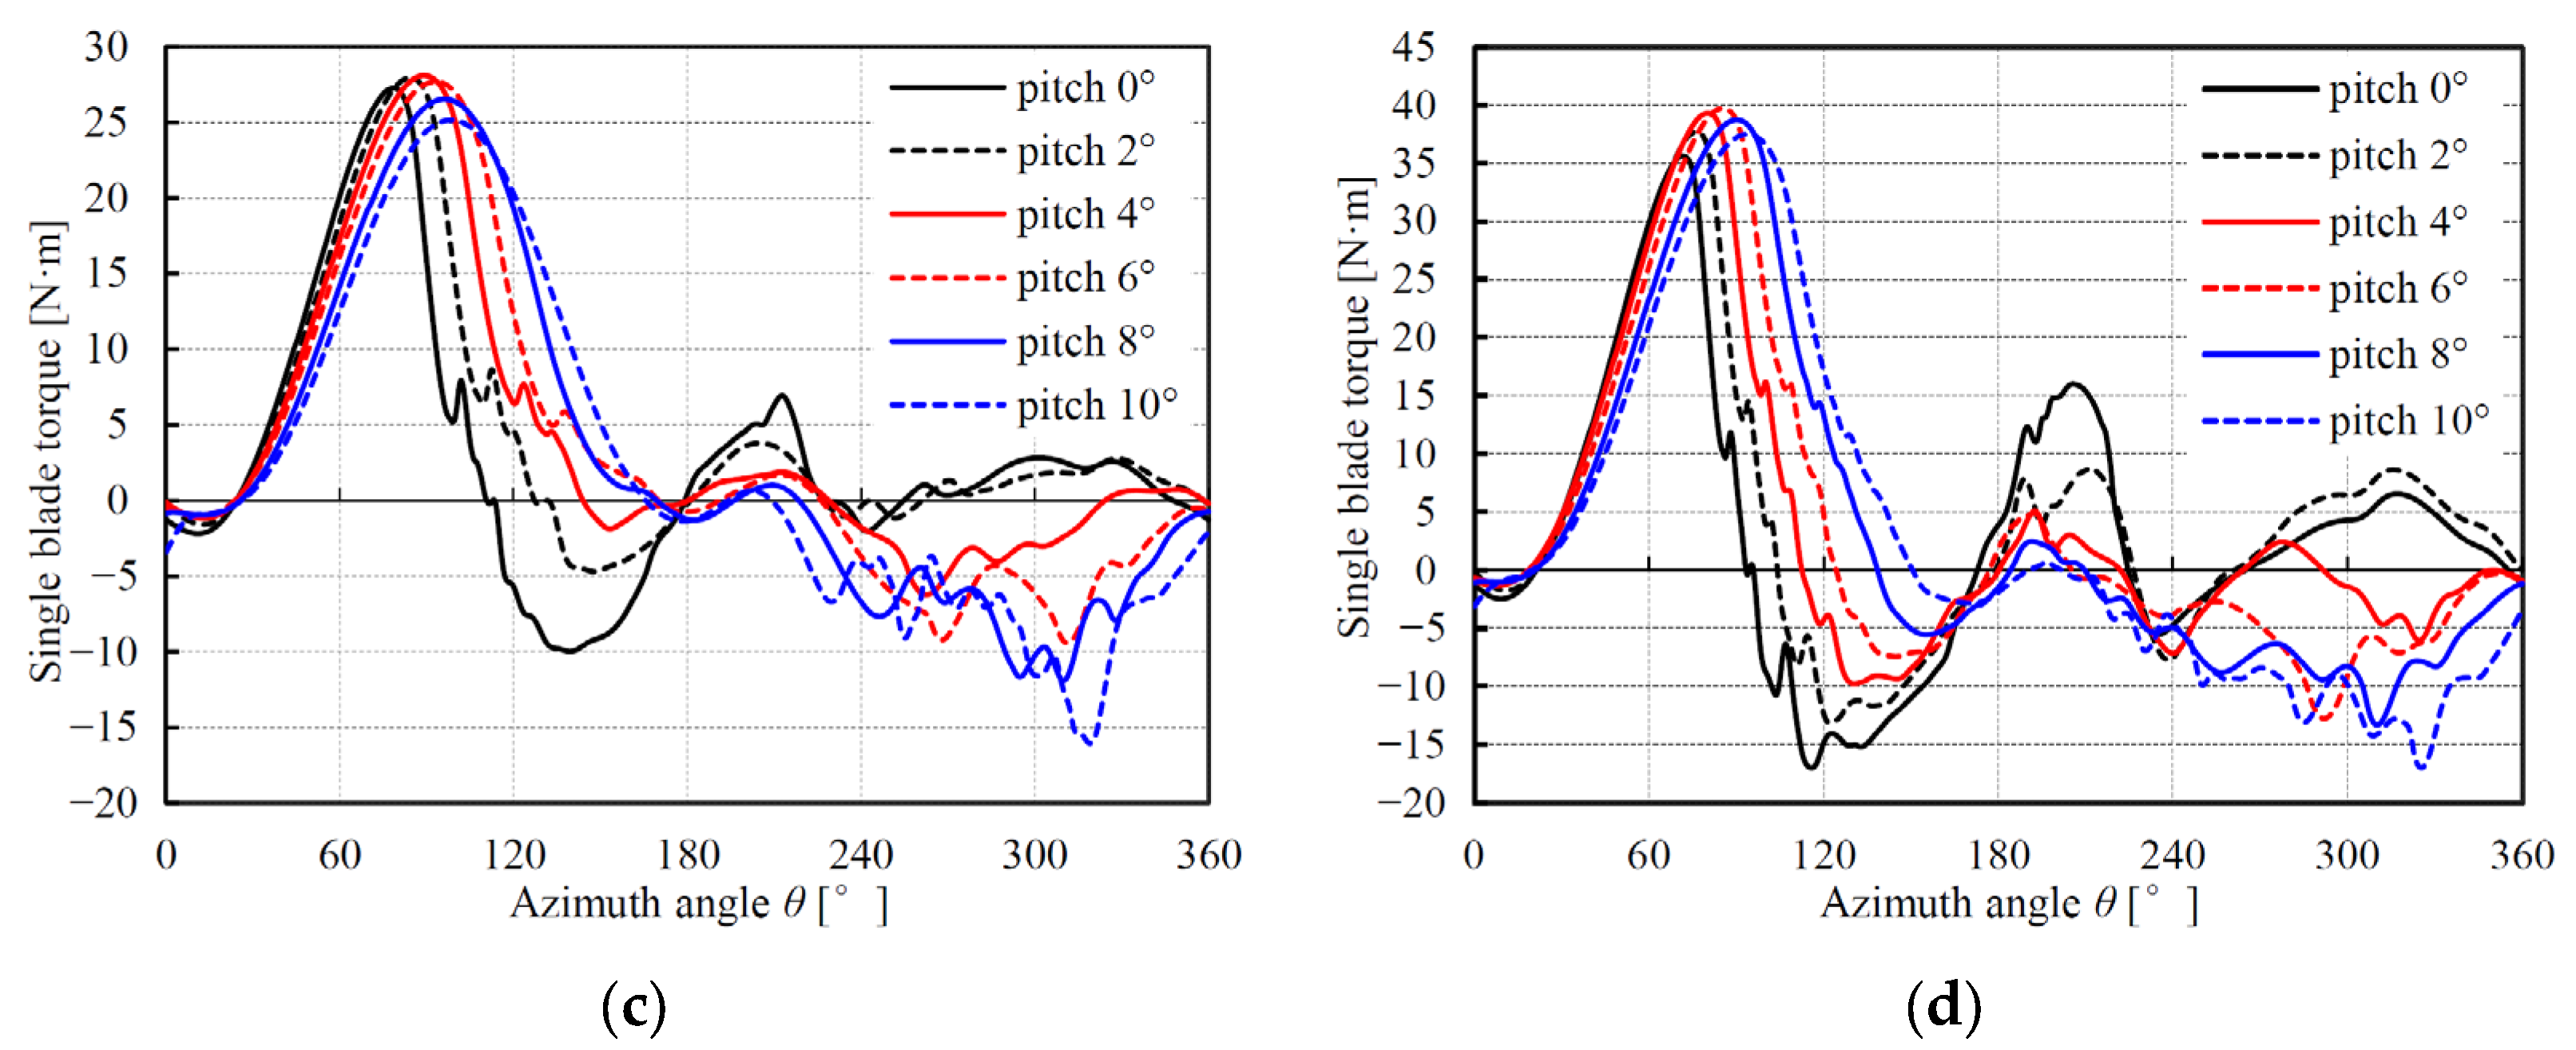
To explore the mechanism of the pitch effect on the power coefficient, Figure 10 shows the variations of the single blade torque with different pitch angles in one circle of blade rotation for different TSRs. It should be noted that when the torque has obvious local fluctuations or steep drops in the upwind zone, there is usually a flow separation on the blade’s inner side. If the torque has negative values for a large scope in the downwind zone, there is a high possibility of flow separation on the blade’s outer side.
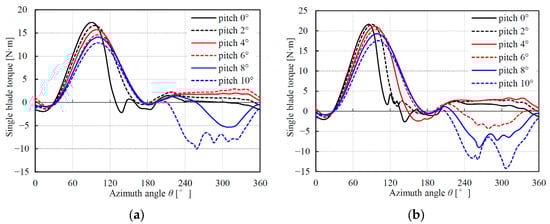
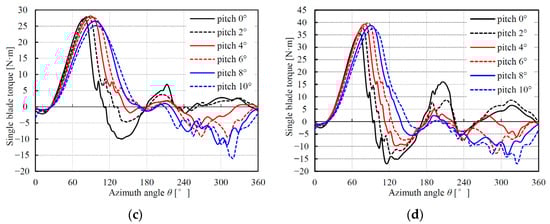
Figure 10.
Variations of the single blade torque with different pitch angles at different TSRs. (a) TSR = 2.6; (b) TSR = 2.3; (c) TSR = 2.0; (d) TSR = 1.7.
For a TSR of 2.6, it is evident that pitch angles of 4° and 6° do not exhibit significant flow separation characteristics in the upwind and downwind zones, so both result in high power coefficients. Generally, when airfoils are in the attached flow state, the larger the AoA, the better its aerodynamic performance as the lift-to-drag ratio is greater. Therefore, when the pitch angle increases from 4° to 6°, the AoA in the upwind zone decreases and reduces the aerodynamic performance, while the AoA in the downwind region increases and enhances the aerodynamic performance, thus making the overall power coefficient change slightly. However, if the pitch angle further increases or decreases, it will lead to excessive AoAs in the downwind or upwind zone, respectively. Excessive AoA usually causes flow separation and blade performance reduction. What is special in the present case, shown in Figure 10a, is that the reduction of the blade performance in the downwind is very sensitive to the pitch angle increase from 6° to 10°.
A decrease of the TSR to 2.3 will lead to an increase in the AoA variation range, so no pitch angle can keep the blade in the attached flow state in both the upwind and downwind zones. In theory, if we want to achieve the best aerodynamic efficiency, we should vary the pitch angle to ensure that the flow in one wind zone is in an attached flow state. Meanwhile, in the other wind zone, the AoAs should be as small as possible to weaken the flow separation. From Figure 10b, both the pitch angle of 4° and the pitch angle of 6° satisfy the principle, but the pitch angle of 4° provides the optimal power coefficient. This is because the flow separation in the downwind zone worsens the power coefficient more severely than that in the upwind zone. So, an appropriate pitch angle should first not cause flow separation in the downwind zone.
At the TSR of 2.0, the pitch angle of 2° that precisely maintains the attached flow in the downwind zone provides the optimal power coefficient. Based on this pattern, we can reveal the reason why the optimal pitch angle decreases with the decrease of the TSR. That is, with the decrease of the TSR, the AoA increases both in the upwind and downwind zones; to keep the flow attached to the blade in the downwind zone, the optimal pitch angle should decrease to reduce the AoAs in the downwind zone.
However, for the TSR of 1.7, the optimal pitch angle is also 2°, which does not comply with the above pattern as, in theory, this pitch angle will cause the flow separation in the downwind zone. As was expected, the flow separation has been reflected in the fluctuation of the blade torque in the downwind zone. However, the blade torque curve shows two special peaks in the downwind zone, which is the main reason for the higher power coefficient. It should be noted that the blade torques corresponding to pitch angles of 0° and 4° also have special peaks in the downwind zone, but as there are more severe flow separations in the upwind zone and smaller peaks in the downwind zone, respectively, neither of them achieve the best power coefficient.
Overall, for the TSRs higher than 1.7, the pitch angles that keep the flow attached in the downwind zone, and meanwhile make the AoAs as small as possible in the upwind zone, will perform the optimal power coefficient. This principle supports the phenomenon that the optimal pitch angle decreases with the decrease of the TSR. Moreover, the principle can also be used to optimize the pitch angle.
From the above results, it can be seen that when the TSR decreases with the incoming wind speed increase, it is necessary to vary the pitch with the TSR to improve the power coefficient. Meanwhile, there is a principle that can be used to guide the pitch angle to vary to the optimal value.
4.2. Pitch Angle Effect on the Blade Normal Force
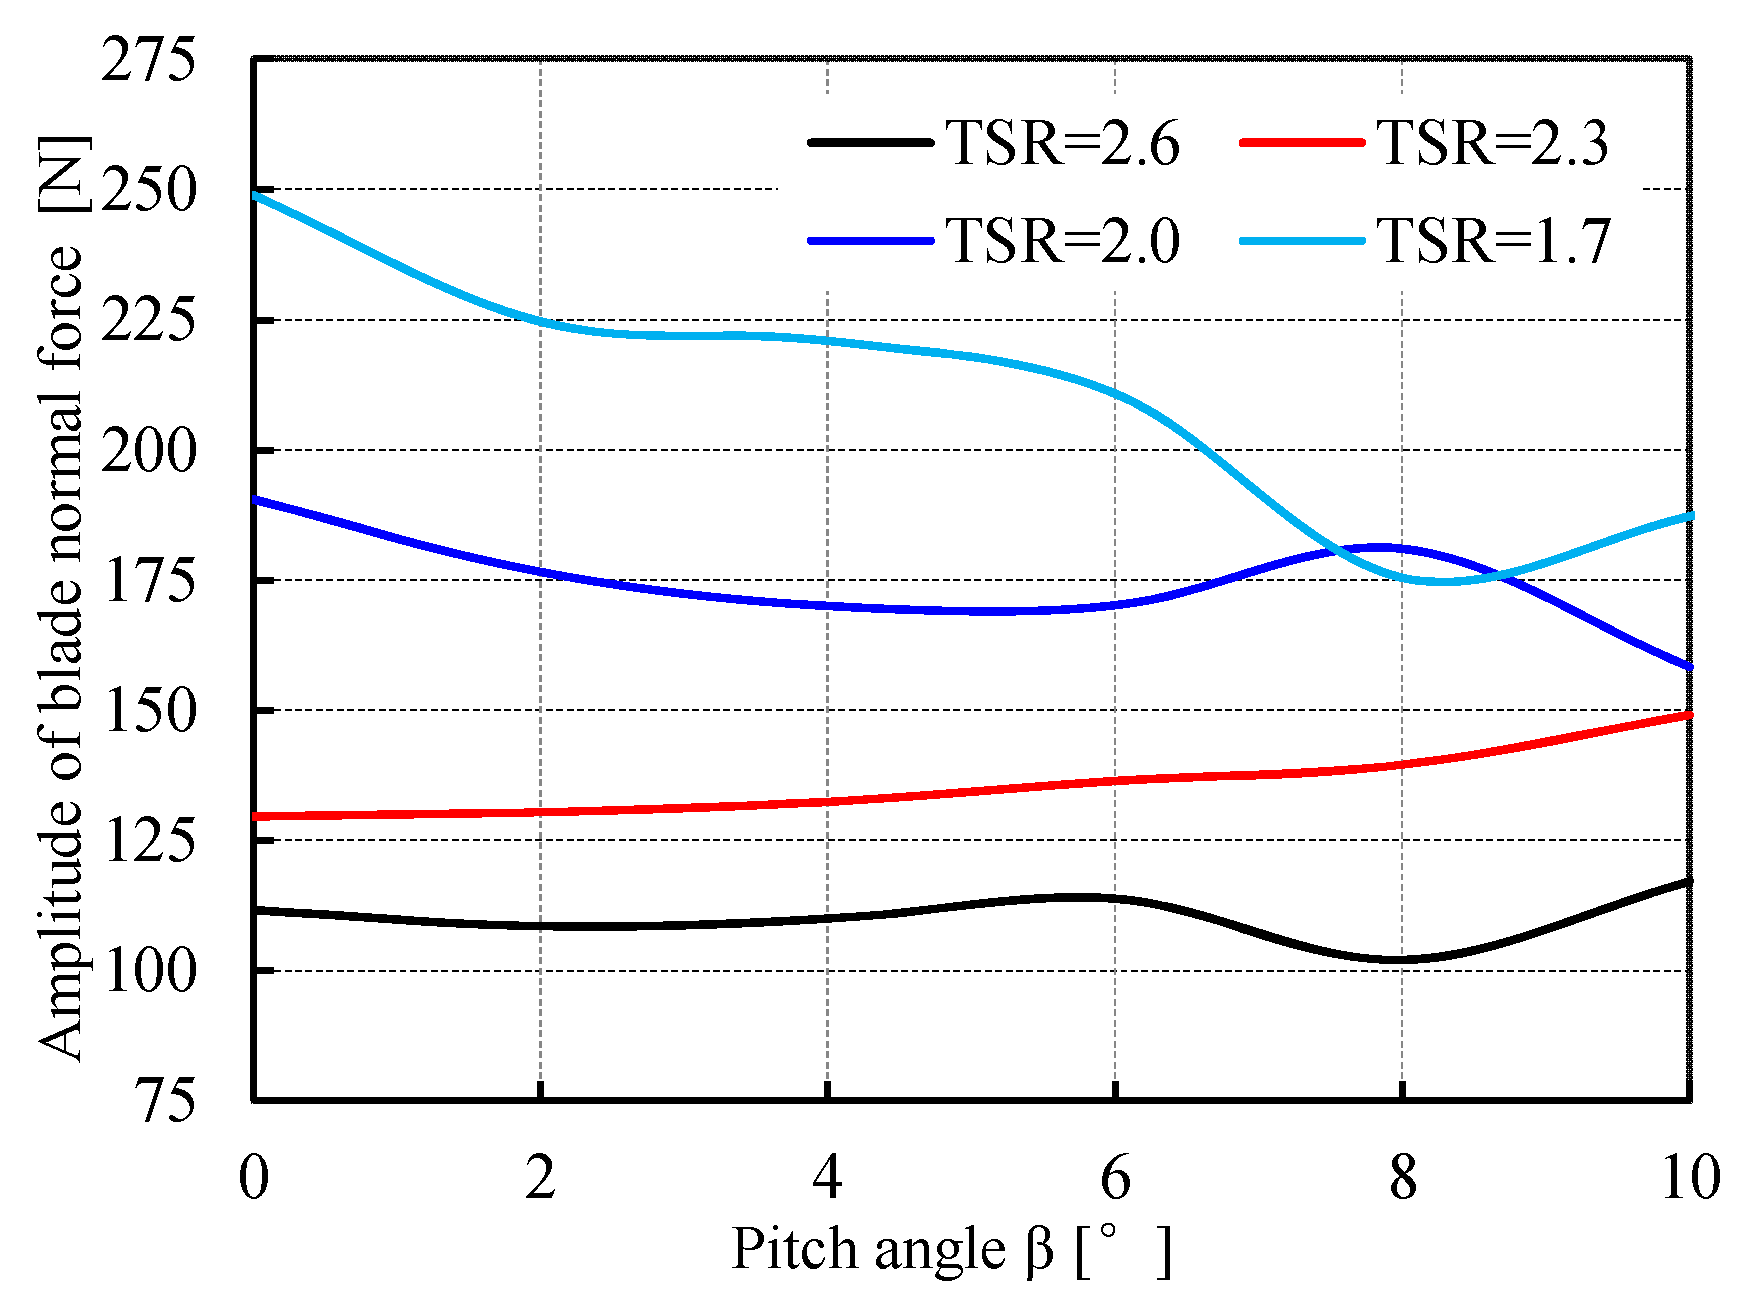
In this part, the pitch angle effect on the blade normal force will be studied to explore the feasibility of the TSR-based variable pitch in reducing the blade fatigue load. Firstly, by calculating the variations of the normal force corresponding to different pitch angles under different TSRs, the amplitudes of the normal force under different conditions were obtained, as shown in Figure 11. It can be seen that with the TSR decrease caused by the wind speed increase, most of the normal force amplitudes for different pitch angles increase. If the TSR of 2.6 is considered as the rated TSR and the pitch angle remains optimal in terms of the power coefficient, when the wind speed increases to the value corresponding to the TSR of 1.7, the normal force amplitude will increase by about 104.2%. Fortunately, the pitch angle effect on the normal force amplitude at the TSR of 1.7 is more significant than that of the other higher TSRs. Specifically, varying the pitch angle from the optimal value (2°) to 8° can reduce the normal force amplitude by 21.9%, resulting in a reduced amplitude, higher than the rated one by only 59.5%.
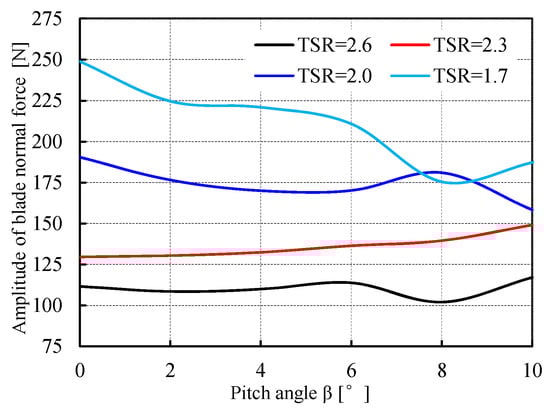
Figure 11.
Amplitudes of the blade normal force with different pitch angles at different TSRs.
It should be noted that the above variation of the pitch angle not only reduces the load, but also reduces the power coefficient. Specifically, the power coefficient is reduced from 0.157 to 0.114. It seems that it is not feasible to reduce the blade fatigue load by varying the pitch with the TSR as it will make VAWTs less competitive in wind energy utilization. Nevertheless, it is still useful under conditions where wind energy acquisition is not given priority, such as when structural safety is threatened by high wind speeds or during wind turbine shutdown in a high-wind-speed environment.
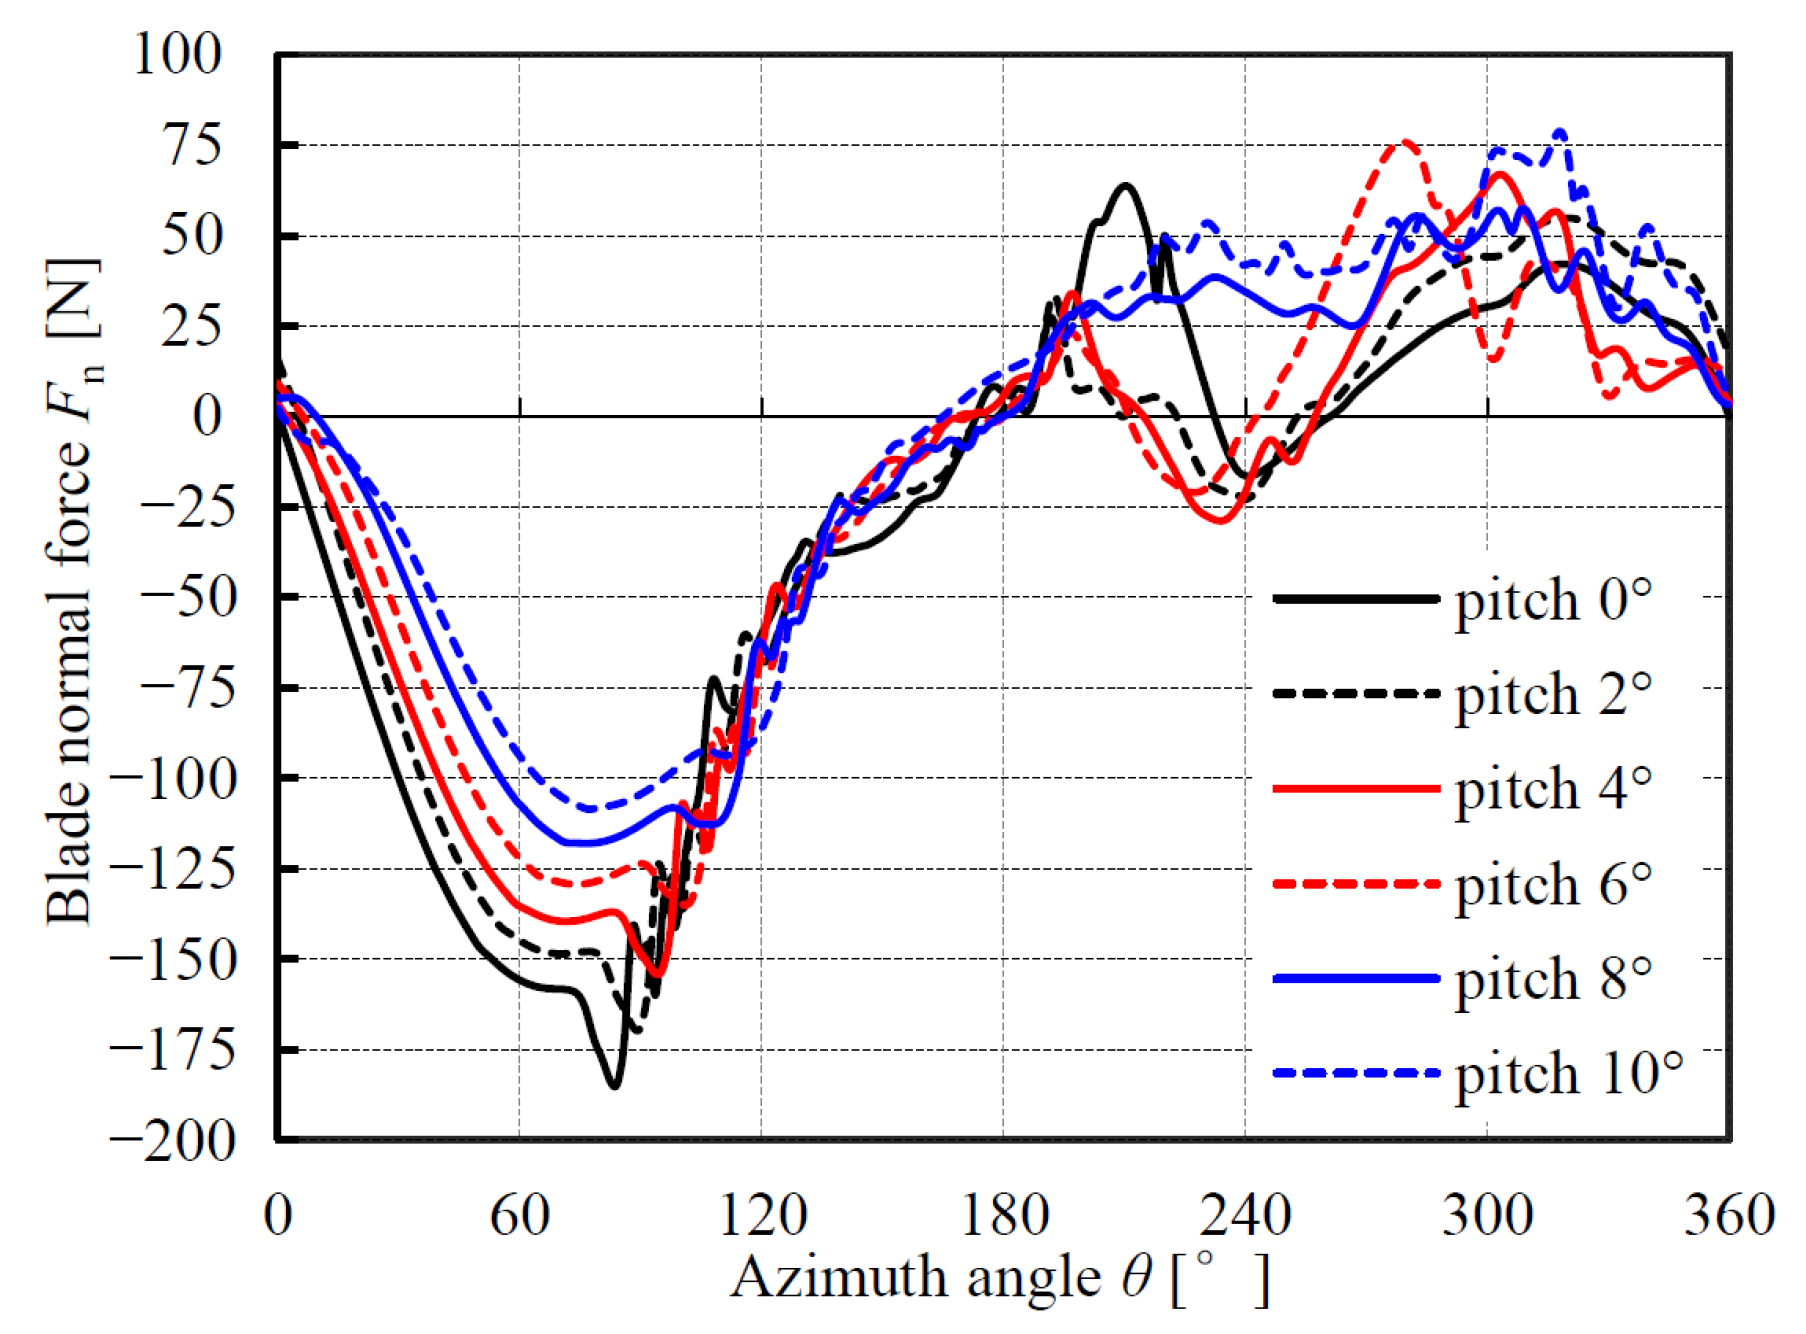
To explore the mechanism of the pitch angle effect on the blade’s normal force for a TSR of 1.7, the normal force variation during the blade rotation should be analyzed. Figure 12 shows the blade’s normal force variations with the azimuth angle for different pitch angles, where the positive values mean the normal force direction is radial outward and the negative values mean the direction is radial inward. In the upwind zone, with the pitch angle increases, the normal force shows a clear decreasing trend. It can also be observed that for some low pitch angles, the normal forces show sudden increases to their maximum values, which is a typical characteristic of dynamic stall. When the pitch angle increases to 8°, this typical characteristic is no longer obvious, which likely means that the dynamic stall was slowed down.
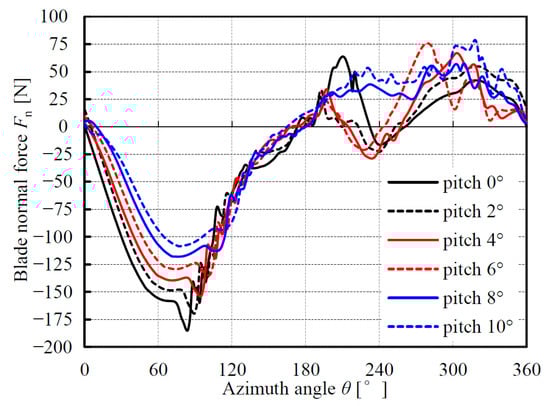
Figure 12.
Variations of the blade’s normal force with the azimuth angle for different pitch angles (TSR = 1.7).
In the downwind zone, the fluctuations of the blade’s normal force are complex and the variation trend with the pitch angle increases is vague. Generally, with the pitch angle increase, the AoAs in the downwind zone will increase and cause the normal force to increase throughout the entire zone. However, in terms of the maximum normal force, the pitch angle of 8° shows a smaller value than the pitch angles of 0°, 4° and 6°, which also helps the pitch angle of 8° perform best in the whole revolution cycle. Another noteworthy phenomenon is that for pitch angles less than or equal to 6°, all the normal forces show significant troughs around an azimuth angle of 240°.
To further explore the blade’s normal force variation with the pitch angle increase, Figure 13 shows the distributions of vorticity around the blade at different azimuths from different pitch angles.
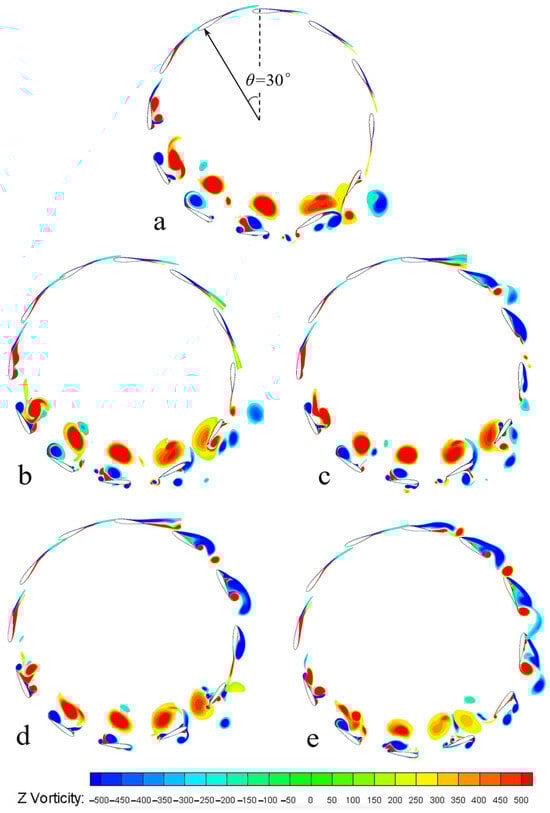
Figure 13.
Distributions of vorticity around the blades at different azimuths from different pitch angles (TSR = 1.7). (a) β = 0°; (b) β = 2°; (c) β = 4°; (d) β = 6°; (e) β = 8°.
From Figure 13a, the small pitch angle of 0° generally corresponds to great AoAs in the upwind zone, so the complex vortices generated from the flow separation are observed early at an azimuth angle of 90°. At this point, the blade torque is already in the decreasing stage and the blade’s normal force almost reaches its maximum value. At an azimuth angle of 120°, the separation vortices fall off and form a large anticlockwise shedding vortex. The vortex almost synchronously moves downstream with the blade and re-encounters with the blade near an azimuth angle of 210°. After an azimuth angle of 270°, the flow returns to the attached state due to the relatively small AoAs in the downwind zone.
With the pitch angle increase, the occurrence of the flow separation in the upwind zone is gradually delayed and the formation of the large anticlockwise shedding vortex is also delayed. In addition, the later the shedding vortex forms, the harder it is to catch up with the blade. For example, when the pitch angle is 8°, the shedding vortex does not form completely until an azimuth angle of 180° is reached and there is almost no encounter between the vortex and the blade. This is mainly because after the vortex sheds, its speed will gradually decrease due to drag from the surrounding fluid; only if the vortex forms earlier and benefits from the shorter path along the inner side of the wind turbine can it encounter the blade. The vortex–blade encounter mainly occurs before the azimuth angle of 270°.
After the azimuth angle of 270°, the flow separation on the outer side of the blade gradually appears and intensifies with the pitch angle increase, as the AoAs generally increase with the pitch angle increase. Note that the flow separation at this time is accompanied by alternating vortex shedding. Generally, the flow separation will lead to a decrease in blade torque and an increase in the blade’s normal force, both accompanied by local complex fluctuations. However, returning to Figure 12, the normal force does not continuously increase with the pitch angle increase. But for pitch angles less than or equal to 6° where the normal forces show significant troughs around an azimuth angle of 240°, the trend is followed. In addition, for pitch angles higher than 6° where the normal forces do not show significant troughs, the trend is also followed. Considering that the maximum normal force of a pitch angle of 8° is lower than that of a pitch angle of 4°, the normal force troughs tend to enhance the normal force after an azimuth angle of 270°.
From Figure 13, it can be seen that all pitch angles less than or equal to 6° show the vortex–blade encounter phenomenon in different degrees within an azimuth range of 210° to 240°. This may be the main factor that causes the blade’s normal force to enter a trough and then be strengthened.
For a pitch angle of 8°, the vortex shedding from the upwind zone is delayed with the phenomenon of an avoided vortex–blade encounter, resulting in almost the lowest maximum normal force in the downwind zone. Although a pitch angle of 10° also avoids the vortex–blade encounter, as the AoA is larger in the downwind zone, the maximum normal force in the downwind zone is higher than that of a pitch angle of 8° and the total normal force amplitude is also higher. Therefore, for low TSRs with vortex–blade encounters in the optimal aerodynamic state, varying the pitch angle to just avoid the vortex–blade encounter can achieve the lowest amplitude of the blade’s normal force.
As mentioned earlier, when the pitch angle is 0° and 2°, the blade torque significantly increases around an azimuth angle of 200°. This phenomenon may also be related to the vortex–blade encounter. Based on the airfoil circulation theory, when the AoA in the upwind zone gradually increases with the blade rotation, the circulation around the blade formed with the attached flow also increases. Although the higher circulation will provide a better aerodynamic performance for the blade, it is difficult for the flow on the suction surface to maintain the attached state as the adverse pressure gradient is high. When the flow separation occurs, the vortices with reversed circulations will be formed, resulting in a decrease in the overall circulation. Then, the reverse vortices will merge into a main reverse vortex and shed downstream. For the blade in the downwind zone, its AoA is reversed to that of the upwind zone and the resulting circulation is also reversed. When the shedding reverse vortex from the upstream encounters the blade in the downwind zone, the reverse circulations of the two will overlap, thereby improving the aerodynamic performance of the blade. For pitch angles of 0° and 2°, the shedding vortex mainly acts on the front section of the blade, resulting in a better effect of the circulations overlapping and a more significant improvement in the blade torque. When the pitch angle increases to 4° or more, the shedding vortex can only encounter the latter half of the blade or even miss with the blade, resulting in a relatively weak improvement in the blade torque.
For the blade torque of a pitch angle of 2°, in addition to the increment around an azimuth angle of 200°, there is another peak around an azimuth angle of 320°, where the flow is in an attached flow state, as shown in Figure 13b. As we know, when the TSR is 2.0, the blade with a pitch angle of 2° has been close to the flow separation state in the downwind zone. For the lower TSR of 1.7, the blade with the same pitch angle should theoretically be in a flow separation state in the downwind zone. At this point, the actual attached flow state may still be related to the vortex–blade encounter effect. Overall, although the vortex–blade encounter intensifies the blade fatigue loads, it also improves the aerodynamic efficiency of the VAWT, especially when the shedding vortex acts on the front section of the blade.
Based on a detailed analysis of the vorticity distribution and evolution around the blade, the above explained some special phenomena in the variations of the blade’s normal force and the blade torque. Furthermore, mechanisms of the pitch angle effect were explored.
5. Conclusions
Focusing on varying the pitch with the TSR to improve the power coefficient and reduce the blade fatigue load of VAWTs, this paper explored its feasibility by investigating the pitch angle effect on the power coefficient and the blade normal force of a VAWT. Based on this, some principles used to vary the pitch angle to get the optimal power coefficient and minimize the blade fatigue load were also provided. The main conclusions are summarized as follows:
- (a)
- The inability of the 2D computational model to reflect the flow spanwise divergence effect is the main cause for the inconsistency between its results and the 3D experimental results. Based on this, a correction method was proposed to correct the 2D computational results, which helps to verify the accuracy of the present 2D computational model and enhances the feasibility of 2D computational models to calculate VAWT aerodynamics.
- (b)
- The optimal pitch angle in terms of the power coefficient varies with the TSR decrease, indicating that varying the pitch with the TSR is necessary to make the wind turbine operate at the optimal power coefficient state for different TSRs. Meanwhile, the principle to guide the pitch variation is to avoid flow separation in the downwind zone and minimize the AoAs in the upwind zone.
- (c)
- For the studied lowest TSR, varying the pitch from the optimal one in terms of the power coefficient can significantly reduce the blade’s normal force amplitude with the power coefficient slightly reduced. As the vortex–blade encounter will enhance the blade’s normal force fluctuation, the principle to reduce the fatigue load is to avoid the vortex–blade encounter, while minimizing the AoAs in the downwind zone.
- (d)
- The mechanism in the pitch angle effect is not only related to the AoA and flow separation, but also related to the vortex–blade encounter phenomenon at the lowest TSR. Specifically, the encounter will increase the blade torque and enhance the blade normal force fluctuation and, with the pitch angle increase, gradually weaken and disappear.
Author Contributions
Conceptualization, W.H.; Software, A.A.; Validation, F.W.; Formal analysis, A.A.; Investigation, W.H.; Resources, G.W.; Data curation, A.A.; Writing—original draft, W.H.; Visualization, F.W.; Supervision, G.W. All authors have read and agreed to the published version of the manuscript.
Funding
This research was funded by [National Natural Science Foundation of China] grant number [12302364], [Natural Science Foundation of the Zhejiang Province] grant number [LQ23E060001] and [Natural Science Foundation of Shaoxing City] grant number [2022A13002].
Data Availability Statement
The data presented in this study are available on request from the corresponding author.
Acknowledgments
The authors gratefully acknowledge the technical support from senior engineer Xuyuan Gao of Zhejiang Shuaikang Electric Company Limited.
Conflicts of Interest
The authors declare no conflict of interest.
References
- Kumar, R.; Raahemifar, K.; Fung, A.S. A critical review of vertical axis wind turbines for urban applications. Renew. Sustain. Energy Rev. 2018, 89, 281–291. [Google Scholar]
- Möllerström, E.; Gipe, P.; Beurskens, J.; Ottermo, F. A historical review of vertical axis wind turbines rated 100 kW and above. Renew. Sustain. Energy Rev. 2019, 105, 1–13. [Google Scholar]
- Fiedler, A.J.; Tullis, S. Blade Offset and Pitch Effects on a High Solidity Vertical Axis Wind Turbine. Wind Eng. 2009, 33, 237–246. [Google Scholar]
- Miao, W.; Liu, Q.; Xu, Z.; Yue, M.; Li, C.; Zhang, W. A comprehensive analysis of blade tip for vertical axis wind turbine: Aerodynamics and the tip loss effect. Energy Convers. Manag. 2022, 253, 115140. [Google Scholar]
- Shu, Z.; Li, Q.; Chan, P. Investigation of offshore wind energy potential in Hong Kong based on Weibull distribution function. Appl. Energy 2015, 156, 362–373. [Google Scholar]
- Zhang, Q.; Musa, B.; Miao, W.; Liu, Q.; Li, C.; Yue, M.; Wang, P. Aerodynamic analysis of a novel pitch control strategy and parameter combination for vertical axis wind turbines. Renew. Energy 2023, 216, 119089. [Google Scholar]
- Melani, P.F.; Balduzzi, F.; Ferrara, G.; Bianchini, A. Development of a desmodromic variable pitch system for hydrokinetic turbines. Energy Convers. Manag. 2021, 250, 114890. [Google Scholar]
- Peng, Y. Aerodynamic Characteristics and Optimal Pitch Control of High-Solidity Straight-Bladed Vertical Axis wind Turbines. Ph.D. Thesis, Hong Kong Polytechnic University, Hong Kong, 2018. [Google Scholar]
- Abdalrahman, G.; Melek, W.; Lien, F.S. Pitch angle control for a small-scale Darrieus vertical axis wind turbine with straight blades (H-Type VAWT). Renew. Energy 2017, 114, 1353–1362. [Google Scholar]
- Paraschivoiu, I.; Trifu, O.; Saeed, F. H-Darrieus Wind Turbine with Blade Pitch Control. Int. J. Rotating Mach. 2009, 2009, 505343. [Google Scholar]
- Bundi, J.M.; Ban, X.; Wekesa, D.W.; Ding, S. Pitch control of small H-Type Darrius vertical axis wind turbines using advanced gain scheduling techniques. Renew. Energy 2020, 161, 756–765. [Google Scholar] [CrossRef]
- Bianchini, A.; Ferrara, G.; Ferrari, L. Pitch Optimization in Small-size Darrieus Wind Turbines. Energy Procedia 2015, 81, 122–132. [Google Scholar] [CrossRef]
- Li, Q.; Maeda, T.; Kamada, Y.; Murata, J.; Yamamoto, M.; Ogasawara, T.; Shimizu, K.; Kogaki, T. Study on power performance for straight-bladed vertical axis wind turbine by field and wind tunnel test. Renew. Energy 2016, 90, 291–300. [Google Scholar]
- Asr, M.T.; Nezhad, E.Z.; Mustapha, F.; Wiriadidjaja, S. Study on start-up characteristics of H-Darrieus vertical axis wind turbines comprising NACA 4-digit series blade airfoils. Energy 2016, 112, 528–537. [Google Scholar]
- Rezaeiha, A.; Kalkman, I.; Blocken, B. Effect of pitch angle on power performance and aerodynamics of a vertical axis wind turbine. Appl. Energy 2017, 197, 132–150. [Google Scholar]
- Nguyen, M.T.; Balduzzi, F.; Goude, A. Effect of pitch angle on power and hydrodynamics of a vertical axis turbine. Ocean. Eng. 2021, 238, 109335. [Google Scholar]
- Li, Q.; Maeda, T.; Kamada, Y.; Murata, J.; Kawabata, T.; Shimizu, K.; Ogasawara, T.; Nakai, A.; Kasuya, T. Wind tunnel and numerical study of a straight-bladed vertical axis wind turbine in three-dimensional analysis (Part I: For predicting aerodynamic loads and performance). Energy 2016, 106, 443–452. [Google Scholar]
- Balduzzi, F.; Bianchini, A.; Maleci, R.; Ferrara, G.; Ferrari, L. Critical issues in the CFD simulation of Darrieus wind turbines. Renew. Energy 2016, 85, 419–435. [Google Scholar]
- Balduzzi, F.; Bianchini, A.; Ferrara, G.; Ferrari, L. Dimensionless numbers for the assessment of mesh and timestep requirements in CFD simulations of Darrieus wind turbines. Energy 2016, 97, 246–261. [Google Scholar]
- Menter, F.R. Two-Equation Eddy-Viscosity Turbulence Models for Engineering Applications. AIAA J. 1994, 32, 1598–1605. [Google Scholar]
- ANSYS. ANSYS Fluent Theory Guide Release 17.0; ANSYS Inc.: Canonsburg, PA, USA, 2015. [Google Scholar]
- Wilcox, D.C. Reassessment of the scale-determining equation for advanced turbulence models. AIAA J. 1988, 26, 1299–1310. [Google Scholar]
- Jones, W.P.; Launder, B.E. The calculation of low-Reynolds-number phenomena with a two-equation model of turbulence. Int. J. Heat Mass Transf. 1972, 16, 1119–1130. [Google Scholar] [CrossRef]
- Daroczy, L.; Janiga, G.; Petrasch, K.; Webner, M.; Thévenin, D. Comparative analysis of turbulence models for the aerodynamic simulation of H-Darrieus rotors. Energy 2015, 90, 680–690. [Google Scholar] [CrossRef]
- Rezaeiha, A.; Kalkman, I.; Blocken, B. CFD simulation of a vertical axis wind turbine operating at a moderate tip speed ratio: Guidelines for minimum domain size and azimuthal increment. Renew. Energy 2017, 107, 373–385. [Google Scholar] [CrossRef]
- Edwards, J.M.; Danao, L.A.; Howell, R.J. PIV measurements and CFD simulation of the performance and flow physics and of a small-scale vertical axis wind turbine. Wind Energy 2015, 1, 201–217. [Google Scholar] [CrossRef]
- Howell, R.; Qin, N.; Edwards, J.; Durrani, N. Wind tunnel and numerical study of a small vertical axis wind turbine. Renew. Energy 2010, 35, 412–422. [Google Scholar] [CrossRef]
- Li, C.; Zhu, S.; Xu, Y.; Xiao, Y. 2.5D large eddy simulation of vertical axis wind turbine in consideration of high angle of attack flow. Renew. Energy 2013, 51, 317–330. [Google Scholar] [CrossRef]
- Mclaren, K.W. A Numerical and Experimental Study of Unsteady Loading of High Solidity Vertical Axis Wind Turbines. Ph.D. Thesis, Mcmaster University, Hamilton, ON, Canada, 2011. [Google Scholar]
- Newman, B.G. Actuator-disc theory for vertical-axis wind turbines. J. Wind Eng. Ind. Aerodyn. 1983, 15, 347–355. [Google Scholar] [CrossRef]


Disclaimer/Publisher’s Note: The statements, opinions and data contained in all publications are solely those of the individual author(s) and contributor(s) and not of MDPI and/or the editor(s). MDPI and/or the editor(s) disclaim responsibility for any injury to people or property resulting from any ideas, methods, instructions or products referred to in the content. |
© 2023 by the authors. Licensee MDPI, Basel, Switzerland. This article is an open access article distributed under the terms and conditions of the Creative Commons Attribution (CC BY) license (https://creativecommons.org/licenses/by/4.0/).