Abstract
Since the 1980s, many electricity markets around the world have undergone restructuring aimed at improving efficiency. In 2002, the Chinese government also introduced a vertical unbundling reform to dismantle vertical monopolies and boost efficiency in the power sector. This study estimates the unified, operational, and environmental efficiency to comprehensively assess the impact of China’s vertical unbundling on the production performance of thermal power firms. A non-radial data envelopment analysis (DEA) approach is employed to measure these efficiencies. Subsequently, a difference-in-difference model is used to assess the reform’s effects. Empirical results show that the vertical unbundling improved the unified efficiency of firms. Further analysis indicates that the reform improved the operational efficiency of firms by increasing their capacity utilization and coal quality. Additionally, we find that the reform led to an increased utilization of source control technologies but resulted in a reduction in the use of end-of-pipe treatments. Due to the opposing effects on different pollution treatment stages, the reform did not have a significant impact on environmental efficiency.
1. Introduction
Since the 1980s, countries have undertaken market-oriented reforms aimed at improving the efficiency of the electricity sector. Zhang et al. [1] summarizes the forms of the electricity sector market-oriented reform in various countries as follows: (1) vertical unbundling, in which former monopoly utilities are vertically split into independent power generation, transmission, distribution, and retail suppliers; (2) privatization; and (3) the development of new regulatory frameworks and the establishment of independent regulators. The reform programs in various countries have typically combined these three forms. Among them, vertical unbundling stands out as the most widely adopted reform method by many countries, including the United States [2], the United Kingdom [3], Australia [4], and India [5].
Historically, China’s power sector has been under tighter control compared to many other countries. Before 1985, the entire electricity sector in China was under the control of the Ministry of Electricity Power (MEP), which assumed multiple roles as an investor, manager, and regulator [6]. During that period, the generation, transmission, and distribution sectors were vertically integrated and operated under the MEP’s authority. In 1986, China opened free access to the power generation industry, allowing private and foreign investors to invest in the sector, thus marking the beginning of power system reform. Local governments, domestic enterprises, and foreign investors have since been allowed to form independent power producers (IPPs). In 1997, the Chinese central government abolished the MEP and established a new public utility, the State Power Company (SPC). The SPC took over state-owned electricity assets previously managed by the MEP, including generation plants, transmission, and distribution grids [7], while the MEP’s administrative functions were transferred to the State Economic and Trade Commission (SETC). Although China’s power sector has undergone two rounds of reform before 2002, power generation firms remained predominantly state-owned and faced soft budget constraints. Moreover, the SPC controlled many generation assets and the entire transmission and distribution grids, forming a vertical monopoly. Independent power producers and SPC-affiliated generation firms faced unfair competition. Against this background, to dismantle the vertical monopoly and enhance the performance of the electricity sector, China’s State Council authorized the Scheme of the Reform for Power Industry in April 2002, initiating a vertical unbundling reform. According to this reform program, the SPC has restructured its assets, finances, and personnel according to two types of businesses: power generation and power grid. The SPC was eventually split into two major power grid corporations, five major power generation groups, and four auxiliary firms. Transmission corporations are not allowed to hold any generation assets, except for hydro pump storage capacity. After the reform, competition in the power generation market has been strengthened, while transmission remains a monopoly.
The impacts of electricity market-oriented reforms have raised significant concerns. Vertical unbundling, as a pivotal form of market-oriented reform, restructures market structure and introduces competition into the power generation market. Many economists and policymakers believe that the competitive pressures and profit-seeking behavior of firms within a market can influence the productive performance of the power generation firms [7]. Has vertical unbundling had a positive effect on the electricity sector? Some empirical studies from developed countries have found that vertical unbundling can improve the efficiency of the power generation industry [2,3,8,9]. In studies of China’s vertical unbundling reform, scholars have also discovered that the reform has yielded certain benefits to firms’ production performance, such as improved labor efficiency, material input efficiency, and productivity [6,10,11,12]. While existing studies explored the effect of vertical unbundling on the performance of thermal power firms, they have primarily focused on operational performance, neglecting environmental performance.
The thermal power industry exerts a significant impact on the environment, and the role of the power sector in environmental protection has long been emphasized (Combustion of fossil fuels causes several pollutants such as sulfur dioxide (SO2), soot, and nitrogen oxides (NOx) [13]. About half of the fossil fuel consumption, as well as associated pollution, come from fossil-fuel-fired power generation [12]. And the dominance of fossil-fuel-fired power makes the power generation sector one of the largest sources of CO2 emissions in China). Therefore, the environmental effect of market-oriented reforms in the power sector is an important and intriguing subject for research. However, to the best of our knowledge, only a few studies have explored the environmental effects of power sector reforms [3,14,15,16]. Furthermore, except for Wang et al. [16], existing studies have assessed the environmental effects of reforms indirectly. These studies have estimated the environmental effects of reforms through fuel efficiency or fuel switching. They have not directly evaluated the influence of reforms on pollution emissions, nor have they incorporated emissions into the efficiency assessment framework when studying the effects of reforms on efficiency. Market-oriented reforms may directly influence a firm’s pollution control behavior, rendering these indirect estimations inaccurate.
This study aims to account for environmental effects when assessing the impact of the electricity sector market-oriented reforms on firms’ production performance. We investigate the vertical unbundling reform in China. We evaluate the unified, operational, and environmental efficiency indexes of Chinese thermal power firms using a comprehensive dataset that includes inputs, power generation, and emissions. The definitions of the three efficiency indexes are shown in Table 1. Subsequently, a difference-in-differences (DID) model is employed to assess the impact of vertical unbundling reforms on the operational and environmental performance, as well as the overall (unified) production performance of thermal power firms based on the efficiency assessment results.

Table 1.
Description of the three efficiency indicators.
The marginal contribution of this study primarily lies in the following. First, this study discusses the impact of vertical unbundling on the unified, operational, and environmental efficiency of Chinese thermal power in a unified framework. While some existing studies explored the effect of vertical unbundling on efficiency, they often ignore thermal power firms’ non-desired outputs (pollution emission) when measuring efficiency. This unbalanced treatment of desired and undesired outputs may lead to biased estimates of the economic welfare impacts from the vertical unbundling. In this study, we measured the unified efficiency index (UEI) of thermal power firms that includes non-desired outputs. Studying the impact of vertical unbundling on the thermal power firm’s UEI provides a more comprehensive picture of the policy effects. Moreover, we decompose the UEI into two components: operational efficiency (OPI) and environmental efficiency (EPI). This process enables us to distinguish the effect of vertical unbundling on the operational performance of the unbundled firms from the effect on their environmental performance. This study further discusses the mechanisms through which vertical unbundling influences efficiencies.
Second, this study directly assesses the environmental effects of vertical unbundling. With the exception of Wang et al. [16], environmental impacts are generally not studied directly. Moreover, in comparison to Wang et al., our investigation extends to several aspects. (1) We explored the impact of vertical unbundling on firms’ environmental efficiency. Unlike emission intensity, environmental efficiency takes input constraints into account, providing a more accurate reflection of the gap between actual and potentially optimal emissions for firms. (2) We explored the impact of vertical unbundling on the different environmental control technologies. Our findings indicate that the reform led to an increased utilization of source control technologies, but it also resulted in a reduction in the use of end-of-pipe treatments. (3) Wang et al. [16] considered state-owned thermal power firms as treated firms, while we more accurately identified those firms affected by the reform. In fact, state-owned firms that were not State Power Company (SPC) subsidiaries were only indirectly affected by the vertical unbundling reform [7].
Third, we use a unique dataset containing financial, energy input, and emission data for thermal power generators. This dataset provides more information than previous datasets used in the literature on China’s vertical unbundling. This extensive dataset enables us to eliminate the effects of firm heterogeneities related to coal and electricity prices when estimating policy effects. Specifically, our dataset incorporates physical indicators such as coal consumption and generation, which serve as inputs and outputs in efficiency measures. This ensures our efficiency results remain unaffected by coal and electricity prices, enabling our study of policy effects to exclude the influence of China’s complex electricity pricing system and fluctuations in coal prices (In China’s Electricity Industry, the continued existence of regulated prices, not only for electricity but also for coal, the primary input, complicates productivity calculations [17]). Moreover, raw coal consumption and standard coal consumption in the dataset help us to control for the role of fuel quality.
The remaining sections of this paper are organized as follows. Section 2 reviews previous studies. Section 3 presents the research design, including efficiency measurement model, econometric model, and data source. Section 4 analyzes the results, baseline estimations, and robustness checks. Section 5 analyzes the mechanisms by which vertical unbundling improves operational efficiency and why the reform did not improve the emission performance of treated firms. Section 6 presents the conclusions.
2. Literature Review
The market has long been seen as conducive to allocative and technical efficiency increases [18,19]. Market competition may affect firms’ operational performance through constraining managerial behavior, rewarding efficiency gains or confronting less-efficient firms with the choice of cost reduction to the level of their lower-cost counterparts or exit [2]. According to agency theory, regulation may induce efficiency distortion due to asymmetric information, while competition makes firms residual claimants to cost-savings, thereby increasing incentives for efficiency-enhancing efforts [20]. Although the electricity sector reforms in many countries tend to be market-oriented, whether the introduction of market competition in the power generation market can ultimately improve the efficiency of power producers still needs verification.
Many studies have examined the impact of market-oriented reforms in electricity. Newbery and Pollitt [3] reported a social cost–benefit analysis of the restructuring and privatization of the British Electricity Generating Board and found that the reform improved the efficiency of generators. In a study of generation plant operating efficiency in the United States over the period of 1988–1997, Hiebert [21] found that regulatory restructuring activity was associated with improvements in plant operating performance. Convincing empirical evidence about vertical unbundling reform effects was reported by Fabrizio et al. [2]. They used the Olley–Pakes control function approach to measure productivity and used a DID model to assess the effects of electricity restructuring reform on the efficiency of American power generation plants, proving that market competition can improve efficiency by replacing regulated monopoly. Some empirical evidence from countries such as Japan, Australia, and India also support the idea that vertical unbundling can improve the efficiency of the power generation industry [4,5,9]. Following Fabrizio et al. [2], some studies used the productivity results estimated by the Olley–Pakes control function approach to investigate the impact of vertical unbundling in the Chinese power sector on the productivity of power generators. Using the plant-level national survey data collected in 1995 and 2004, Du et al. [11] found that the regulatory reforms increased the efficiency of labor and non-fuel material in fossil-fired generation plants. Moreover, Du et al. [10] observed significant total factor productivity (TFP) gains from the reform. Using panel data, Gao and Van Biesebroeck [7] found that vertical unbundling had positive effects on both labor and physical input efficiencies, but these effects only appear two years after the reform. Some studies employed stochastic frontier analysis (SFA) or DEA to measure the efficiency of thermal power firms and assess the effect of vertical unbundling on efficiency results. In line with this, Zhao and Ma [6] estimated the efficiency of 34 large power plants from 1997 to 2010 and found that the unbundling reform increased the efficiency of large thermal power plants in China. Later, Ma and Zhao [12], using a richer dataset, confirmed the significant contributions from the unbundling reform. These studies have primarily focused on operational performance of thermal power firms, neglecting their environmental performance.
The environmental performance of firms has become a common concern for policy makers, producers, and consumers [22]. The impact of market-oriented reforms on the environmental performance of firms is much more uncertain than its impact on their operational performance. Competitive pressures may compel firms to improve production technology level, reduce resource waste, or adopt emission reduction technologies to remain competitive [23,24], thus subsequently improving their environmental performance. However, competition may lead to a higher likelihood of firms engaging in immoral behavior [25]. Farber and Martin [26] argued that increased competition leads to less abatement efforts by firms, as firms in less competitive industries allocate more efforts to combat air and water pollution than firms in more competitive industries. In a highly competitive environment, without effective supervision, firms may reduce their costs by reducing pollution control activities [24,27], resulting in a decline in their environmental performance. It is necessary to verify the impact of market-oriented reforms on the environmental performance of thermal power firms through empirical research.
However, only a few studies explored the environmental effects of market-oriented reforms in the electricity sector. Earlier, Newbery and Pollitt [3] estimated the fuel savings resulting from privatization and restructuring in England and Wales as well as the benefits of reduced emissions due to fuel savings. Nepal and Jamasb [15] used per capita renewable installed capacity to assess the environmental effects of the electricity sector and wider economic reforms since 1990. Davis and Wolfram [28] found that deregulation and consolidation led to a 10 percent improvement in operating performance in the U.S. nuclear power industry. They noted that the increase in nuclear production resulting from deregulation has largely displaced coal- and natural-gas-fired generation, implying an annual decrease in CO2 emissions by 35 million tons. Chan et al. [14] studied the efficiency and environmental effects of electricity market restructuring based on panel data of U.S. coal-fired power plants from 1991 to 2005. They found that electricity market restructuring led to a 1.4 percent improvement in fuel efficiency and an 8 percent decrease in unit cost of heat input, resulting in up to a 7.5 percent emission reduction among these plants. The above studies that have assessed the impact of reforms on pollution emissions suffer from the shortcoming that these assessments are indirect, i.e., the environmental effects of reforms were obtained by estimating the effects of reforms on fuel efficiency or fuel switching. In a recent exception, Wang et al. [16] studied the effects of ownership mixing and vertical unbundling on SO2 emission intensity of electricity generation firms and found that ownership mix had a positive effect on SO2 emission intensity, while vertical unbundling had no significant effect on SO2 emission intensity.
In summary, current research on market-oriented reforms in the power sector primarily focuses on economic performance. However, the environmental impacts of these reforms are understudied and lack direct empirical results. The aim of this study is to account for the environmental impact when assessing the impact of electricity sector market-oriented reforms. To achieve this goal, we chose to consider pollution at the efficiency assessment stage. Pollution emissions need to be considered alongside inputs and generation in the production decisions of thermal power producers. Given that thermal power inevitably results in air pollutant emissions, the performance evaluation of thermal power producers without considering their pollutant emissions does not seem to provide unbiased performance scores for performance comparison and policy formulation [29]. And there is an increasing focus on green economy indicators that can measure sustainable development [30,31]. Therefore, when assessing the performance of thermal power firms, considering both their performance on inputs and economic outputs as well as on undesirable outputs (pollution emissions) is important (Despite some studies that measure the efficiency of power generators considering pollution emissions [29,32,33,34,35], none of these studies discuss the effect of market-oriented reforms on the environmental performance of power producers). In this study, we employ a non-radial DEA model to measure the unified, operational, and environmental efficiency of thermal power generators in China and assess the effects of vertical unbundling on these efficiency outcomes. Thus, our research provides a more comprehensive discussion of the impact of market-oriented reforms on the production performance of thermal power firms.
3. Model and Data
3.1. Efficiency Measurement Model
There are two mainstream efficiency evaluation approaches, namely, parametric SFA and non-parametric DEA. Using DEA can avoid the potential bias caused by assuming a form of production function. Moreover, DEA can analyze multiple inputs and multiple outputs, which facilitates the inclusion of pollution emissions, a non-desired output, in the analytical framework. Therefore, DEA has become a prevailing method for environmental efficiency measurement [36]. In this study, DEA is also used for measuring efficiency.
Traditional production functions typically involve only a single output and therefore cannot incorporate undesired outputs such as pollutant emissions. Chung et al. [37] used the directional distance function (DDF) to incorporate pollutant emissions into an efficiency measurement framework. Production processes that contain undesired outputs can be better modeled using DDFs. A DDF assumes that inputs (undesirable outputs) are contracted and desirable outputs are expanded at the same rate, it can be regarded as a radial efficiency measure. Radial efficiency measures have two important shortcomings: first, they ignore slack variables, which can lead to biased efficiency estimates when non-zero slacks exist [38]; second, they cannot provide information on the efficiency of a particular input or output [39,40]. Färe and Grosskopf [41] and Zhou et al. [42] proposed the non-radial DDF approach based on the conventional DDF, which incorporates slacks into efficiency measurement and can decompose the efficiency sources. Owing to these advantages, this study uses the non-radial DDF approach to measure the operational and environmental efficiencies of thermal power firms.
We use environmental production technology to describe the production process of a thermal power firm that contains undesired outputs. Assuming the existence of N production decision units (DMUs), each DMU uses capital (K), labor (L), and fuel (F) as inputs to jointly produce the desired output, i.e., electricity generation (E), and the undesired outputs, i.e., pollution emissions (P). The environmental production technology of thermal power generation can be expressed as follows:
where T is usually assumed to satisfy the standard axioms of production theory, such as finite amounts of input which can only produce finite amounts of output [42]. In addition, Färe et al. [43] and Zhou et al. [42] added a series of settings including the weak disposability of undesired outputs to refine the environmental production technology. According to their settings, the regulated environmental production technology with variable returns of scale for N thermal power firms can be expressed as follows:
where denote capital, labor, and fuel inputs of the n-th thermal power firm, respectively. and denote the electricity generation and pollution emissions of the n-th thermal power firm, respectively. is the intensity variable, and denotes the variable returns to scale.
According to Zhou et al. [42], a non-radial DDF with undesirable outputs for thermal power generation can be expressed as follows:
where denotes the normalized weight vector relevant to the numbers of inputs and outputs; is the direction vector; is the vector of scaling factor, representing the proportion of each input (output) that can be increased or decreased; and diag denotes the diagonal matrix.
The value of each DMUs’ under the environmental production technology specified by Equation (2) can be calculated by solving the following DEA-type model:
where the weight vector is set as and the direction vector is set as (In the absence of other a priori information, treating various inputs and outputs equally is more reasonable in the construction of the weight vector. This weight vector was used in Zhou et al. [42] and Zhang et al. [44]). This study measures labor input (L) by the number of employees, capital input (K) by the installed capacity, and fuel input (F) by raw coal consumption (A few thermal power firms use mainly natural gas and oil as fuel. They were excluded in the study sample). It is important to note that if raw coal consumption is used directly as an input, the efficiency values will be influenced by the quality of coal used for power generation due to the variations in the quality (in this case, calorific value) of the raw coal used in different power firms. As a result, using raw coal consumption as an input lead to the confounding of coal quality in the results of subsequent policy effect assessments. To eliminate the interference of coal quality on the assessment results, two robustness tests were conducted after baseline regressions.
The use of electricity generation (E) for measuring desired output in the efficiency measurement may avoid the interference of China’s complex electricity tariff system. Most studies measured the environmental efficiency of power plants, selecting one or more of CO2, SO2, soot, and NOx as undesired outputs [29,35,45]. Considering that SO2 statistics are more complete in our dataset and SO2 is a representative pollutant emitted from thermal power generation, we only consider SO2 emissions as an undesired output.
The values of and can be obtained by solving Model (4). denotes the distance of the firm from the production frontier which can measure the inefficiency value of the firm. If , the firm evaluated is located at the frontier of best practice in the g direction. denotes the optimal solution for Model (4). Once is solved, the potential inputs and output for the firm being evaluated can be easily obtained.
Zhou et al. [42] defined the input performance index and the undesired output performance index. The performance index of an input is defined as the ratio of actual input efficiency to potential input efficiency; the performance index of an undesired output is defined as the ratio of the potential intensity of this undesired output to the actual intensity of this undesired output. Based on Zhou et al. [42], Zhang et al. [44] further defined the unified efficiency index (UEI) that is the average of the performance index of each input and the performance index of each undesired output. Following Zhang et al. [44], the UEI of the n-th thermal power firm is defined as follows:
UEI simultaneously measures the firm’s input utilization, pollution reduction potential, and output expansion potential. The UEI values range from 0 to 1, with higher values indicating higher synthetical efficiency of the thermal power producers. If UEI = 1, the DMU being evaluated lies on the best practice production frontier in the g direction. UEI integrates operational and environmental performance. If the goal is only to measure the performance of the n-th thermal power producer in terms of inputs and desired outputs, the operational efficiency index (OPI) can be defined as follows:
Clearly, the OPI lies between zero and unity. OPI simultaneously measures the firm’s input utilization and output expansion potential. A higher OPI implies better operational efficiency. Following Zhou et al. [42], this study uses the ratio of potential pollutant emission intensity (emission intensity when achieving optimal production) to actual pollutant emission intensity to measure environmental performance. Thus, the environmental efficiency index (EPI) is defined as follows:
The EPI also lies between zero and unity. A higher EPI value indicates that the closer the producer is to the emission intensity at optimal production, the better the environmental performance. According to the definitions of UEI, OPI, and EPI, the following clearly exists: . This finding indicates that the unified efficiency index consists of both operational and environmental efficiency indexes.
3.2. Econometric Model
In 2002, vertical unbundling reform resulted in the divestiture and restructuring of power generation firms that were formerly part of SPCs, while independent power generation firms were not directly affected by this reform (At the end of 2002, the former Chinese State Planning Commission issued the “Approval of the State Planning Commission on the Plan for the Reorganization and Division of the Power Generation Assets of the State Power Corporation”. This document listed the allocation scheme of power plants under the former State Power Company. According to this document, we can distinguish exactly which power generating firms belonged to the State Power Corporation before the vertical unbundling reform). We consider this reform as a quasi-experiment and use the DID approach to assess its effects on the unified, operational, and environmental efficiency of thermal power firms. The DID model is set as follows:
where . i and t denote firm and year, respectively. treat is a dummy variable indicating whether a firm is treated. The former SPC-owned generation firms which were separated from the grid firms after the vertical unbundling reform are classified into the treated group, whereas the other generation firms are classified into the control group (Some studies use the nature of firm ownership for grouping, e.g., Zhao and Ma [6]. However, some state-owned generation firms were not part of the SPC before the reform and were not directly affected by the vertical unbundling reform. Therefore, grouping treatment and control groups by ownership may cause bias in the estimation of reform effects). If a firm is in the treatment group, treat takes the value of 1; otherwise, treat takes the value of 0. Post is a dummy variable indicating the post treatment period. Given that the reform started in April 2002, post is set to 0 during 1998–2001 and 1 during 2002–2005. The interaction term treat × post of the two dummy variables indicates when treat = post = 1. The coefficient reflects the effect of vertical unbundling implementation.
X is a vector of control variables. Following Gao and Van Biesebroeck [7] and Ma and Zhao [12], this study chooses firm age, installed capacity, total assets, employee compensation, ratio of assets to liabilities, province electricity consumption, and province secondary industry output as control variables. is the time fixed effect, controlling for year-specific shocks on firm performance common to all firms, such as macroeconomic shocks, fiscal policy, and so on. is an individual fixed effect, controlling for firm-specific time-constant unobserved heterogeneity affecting firm performance, such as location.
Since the efficiency scores obtained using DEA approaches tend to fall within a certain range, many studies have used estimation methods for censoring data, such as Tobit estimation, when regressing efficiency scores as the dependent variable. McDonald [46] argued that the efficiency scores are not generated by a censoring process but are fractional data. He proved that Tobit estimation is inappropriate when using DEA efficiency scores as the dependent variable, whereas ordinary least squares (OLS) estimation yields unbiased and consistent estimators in this situation. Therefore, this study also uses OLS estimation.
3.3. Data Source
This study has three main sources of data, namely, the China Industrial Enterprise Database, the China Enterprise Pollution Database, and the Compilation of China Electric Power Industry Statistics. The China Industrial Enterprise Database records detailed basic information and financial data of all state- and non-state-owned enterprises with annual sales of more than CNY 5 million, which is widely used by the academic community [47]. The China Enterprise Pollution Database contains firm-level data on energy inputs, pollution control investments, and pollution emissions. The Compilation of China Electric Power Industry Statistics contains detailed energy use data such as raw and standard coal consumptions and production data such as equipment full-load hours for thermal power firms. We matched these three databases to eventually form a unique and comprehensive dataset.
Although our dataset contains financial and pollution emissions data for industrial firms in China from 1998 to 2013, emissions data for thermal power firms after 2005 are seriously missing. Consequently, the study sample excludes thermal power firms after 2005. This limitation means that this study can only assess the short-term effects of the vertical unbundling reform. However, this process helps avoid a potential issue that could arise when assessing long-term effects, namely, the confounding of the effects of other policies in the assessment results. After excluding missing values, outliers, and other data issues, the study sample contains 864 thermal power firms and 3221 observations. This dataset includes 189 thermal power firms that were formerly part of the SPC, serving as the treatment group, and 675 other thermal power firms in the control group. Table 2 shows the statistics of the main variables.
Table 2.
Summary statistics.
3.4. Efficiency Measurement Results
The UEI, OPI, and EPI were measured under the global benchmark technology. The global benchmark technology creates a single reference frontier from the panel data of inputs and outputs for all DMUs, which makes the efficiency values comparable over the entire sample period. Appendix A Figure A1 presents the mean values of the UEI, OPI, and EPI of thermal power firms by year from 1998 to 2005. Apparently, the UEI tends to increase during the study period for both the treatment and control groups, indicating that the unified performance of Chinese thermal power firms has improved during this period. In comparison, the average UEI of the treatment group is higher than that of the control group. The gap between the treatment and control groups in UEI widened during 2002–2004 but narrowed again in 2005. In terms of operational performance, the average OPIs of both the treatment and control groups tended to increase during the study period, with the average OPI of the treatment group consistently higher than that of the control group. However, no significant upward or downward trend exists in the average EPIs of both the treatment and control groups over the study period. Although the control group had relatively worse operational performance, it had a higher EPI than the treatment group in terms of environmental performance. Moreover, the difference between the treatment and control groups in terms of environmental performance remained stable.
4. Empirical Results
4.1. Reform Effects
We estimate the effect of the reform on the unified efficiency of the treated firms using Equation (8) with UEI as the dependent variable. Columns (1) and (2) of Table 3 present the regression results with and without the inclusion of control variables, respectively. On average, the reform is associated with an improvement in UEI of 0.022 and 0.017 with and without the inclusion of control variables, respectively. The results show that the coefficient of treat × post is significantly positive regardless of the inclusion of control variables, indicating a positive effect of the vertical unbundling reform on the unified efficiency of the treated firms. To further explore the source of the positive reform effect, we conducted regressions with OPI and EPI as dependent variables, respectively, and columns (3)–(6) of Table 3 present the results. The results show that reform has a significant positive effect on OPI, whereas no significant effect exists on EPI. On average, the reform is associated with an improvement in OPI of 0.026 and 0.021 with and without the inclusion of control variables, respectively. Therefore, the positive effect of the reform on the unified efficiency primarily arises from the positive effect of the reform on the operational efficiency.
Table 3.
Baseline estimates.
4.2. Robustness Checks
This study conducted five robustness checks. First, parallel trend tests were performed. Second, the following two approaches were used to eliminate the effect of power coal quality: by adding power coal quality as a control variable in baseline regressions and by replacing raw coal consumption with standard coal consumption to re-measure the efficiency values and re-regress. Third, the treated and control firms were regrouped. Fourth, the environmental efficiency index was redefined. Fifth, placebo tests were conducted through random grouping.
4.2.1. Parallel Trend Tests
An important prerequisite for the proper use of the DID approach is to satisfy the parallel trend assumption, as changes in the differences between the treatment and control groups may be driven by pre-existing differences before the implementation of the reform. Referring to Ai et al. [48] and Moser and Voena [49], the following regressions were used to conduct a test of parallel trends in the pre-treatment periods.
In Equation (9), t refers to the year. If = 0 is not rejected, it implies that no difference exists between the treatment and control groups in the time trends of the dependent variable before the implementation of the reform. Table 4 presents the estimation results of Equation (9), which show that is statistically insignificant, implying no significant preexisting differences between the treatment and control groups in the time trends of UEI, OPI, and EPI. Therefore, the parallel trend assumption is not violated.
Table 4.
Parallel trend tests.
4.2.2. Controlling the Effect of Power Coal Quality
Owing to the differences in the quality of power coal used in different power plants, using the quantity of power coal consumed directly as an input in the efficiency assessment can lead to the effect of power coal quality being mixed in the subsequent results of the reform effect assessment. Therefore, without controlling for power coal quality, it is impossible to distinguish whether the improvement in the unified and operational efficiencies of the treated firms comes from improvements in the underlying production technology or from the improvement in the coal quality. In order to control for the effect of power coal quality, two methods are used in the following.
First, we added a variable reflecting power coal quality (coalquality) as a control variable. Coalquality is measured using raw coal consumption divided by standard coal consumption, and higher values imply poorer quality. Columns (1)–(3) of Table 5 show the regression results of adding coalquality to Equation (8). The results show that UEI and OPI remain significantly and positively affected by the reform after controlling for power coal quality, but the coefficients decrease slightly. On average, the reform is associated with an improvement in UEI and OPI of 0.015 and 0.018, respectively, after controlling for power coal quality. This finding suggests that considering power coal quality somewhat affects the estimation of the policy effect. However, even excluding the effect of power coal quality, the reform still improves the unified efficiency and operational efficiency of the treated firms. After controlling for coalquality, no significant policy effect persists for EPI, which is consistent with the results of the baseline regressions. In addition, coalquality has a significant negative effect on UEI, OPI, and EPI, which implies that the use of poor-quality coal by a power plant will reduce its unified, operational, and environmental efficiencies.
Table 5.
Robustness tests (controlling for coal quality).
Second, we re-measured UEI, OPI, and EPI by using standard coal consumption instead of power coal consumption as the fuel input, expressed as UEI(B), OPI(B), and EPI(B), respectively. This procedure allows us to control the effect of power coal quality directly at the stage of efficiency measurement. Moreover, the re-estimated efficiencies also avoid the bias caused by omitting other fuel inputs compared with adding coal quality as a control variable. Appendix A Figure A2 presents the mean values of the three efficiency estimates using standard coal consumption as fuel input by year. The changes in UEI(B), OPI(B), and EPI(B) closely resemble those in UEI, OPI, and EPI, with the exception that the difference in OPI between the treatment and control groups is larger than that observed in OPI(B).
The effect of the reform was re-estimated using UEI(B) as the dependent variable. Columns (4)–(6) of Table 5 report the results of the DID regressions using UEI(B), OPI(B), and EPI(B) as dependent variables. The coefficients of treat × post for UEI(B) and OPI(B) are significantly positive. On average, the reform is associated with an improvement in UE(B) and OPI(B) of 0.016 and 0.022, respectively. This result indicates that the reform significantly improves the unified and operational efficiencies of thermal power generators, which is consistent with the findings of the baseline regressions. The coefficient of treat × post for EPI(B) remains insignificant.
4.2.3. Regrouping Treatment and Control Firms
Du et al. [10] argued that China’s vertical unbundling reform primarily affects state-owned power firms and divides the treatment and control groups by the ownership of power firms. This study also attempts to divide the treatment and control groups by the ownership of power firms. The treat variable in model (8) is replaced with the type variable, where type takes the value of 1 if the power firm is state-owned; otherwise the value is 0.
However, after the regrouping, some state-owned power firms that were not part of the SPC may enter the treatment group. These state-owned power firms are not actually directly affected by the vertical unbundling reform, and thus treating them as treated firms may interfere with the identification of the treatment effect. As shown in columns (1) and (2) of Table 6, the coefficients of type × post become insignificant in the UEI and OPI regressions, indicating that no significant policy effects are identified after regrouping. This finding suggests that accurately classifying treatment and control groups is crucial for identifying the policy effects of the reform in China. The effects identified by our baseline regressions are indeed for power generators affiliated with the SPC, and the results are unlikely to be caused by other factors. Column (3) of Table 6 shows that after regrouping, the coefficient of type × post remains insignificant in the regression on EPI.
Table 6.
Robustness tests (regrouping firms and redefining environmental efficiency).
4.2.4. Redefining Environmental Efficiency
Given that the magnitude of EPI depends not only on the firm’s likelihood in terms of emissions curtailment () but also on the firm’s likelihood in terms of generation expansion (), this scenario makes it possible that environmental efficiency measured using EPI is affected by the firm’s performance on the operational side. In the baseline regressions, we found that the reform improves the operational efficiency of treated firms. To avoid the reform effect on operational efficiency from being confounded with the reform effect on environmental efficiency, the environmental efficiency index is redefined as . (). EE is the ratio of potential optimal pollution emissions (theoretical minimum pollution emissions) to actual pollution emissions. The closer EE is to 1, the better environmental performance is implied.
The new definition of environmental efficiency considers only the possibilities of firms in terms of emission reductions, which allows us to identify more precisely whether the reform has impacted the environmental performance of firms. Columns (4)–(5) of Table 6 present the regression results with EE as the dependent variable. The regression results show that the reform had no significant effect on the EE, which is similar to the regression results based on EPI.
4.2.5. Placebo Tests
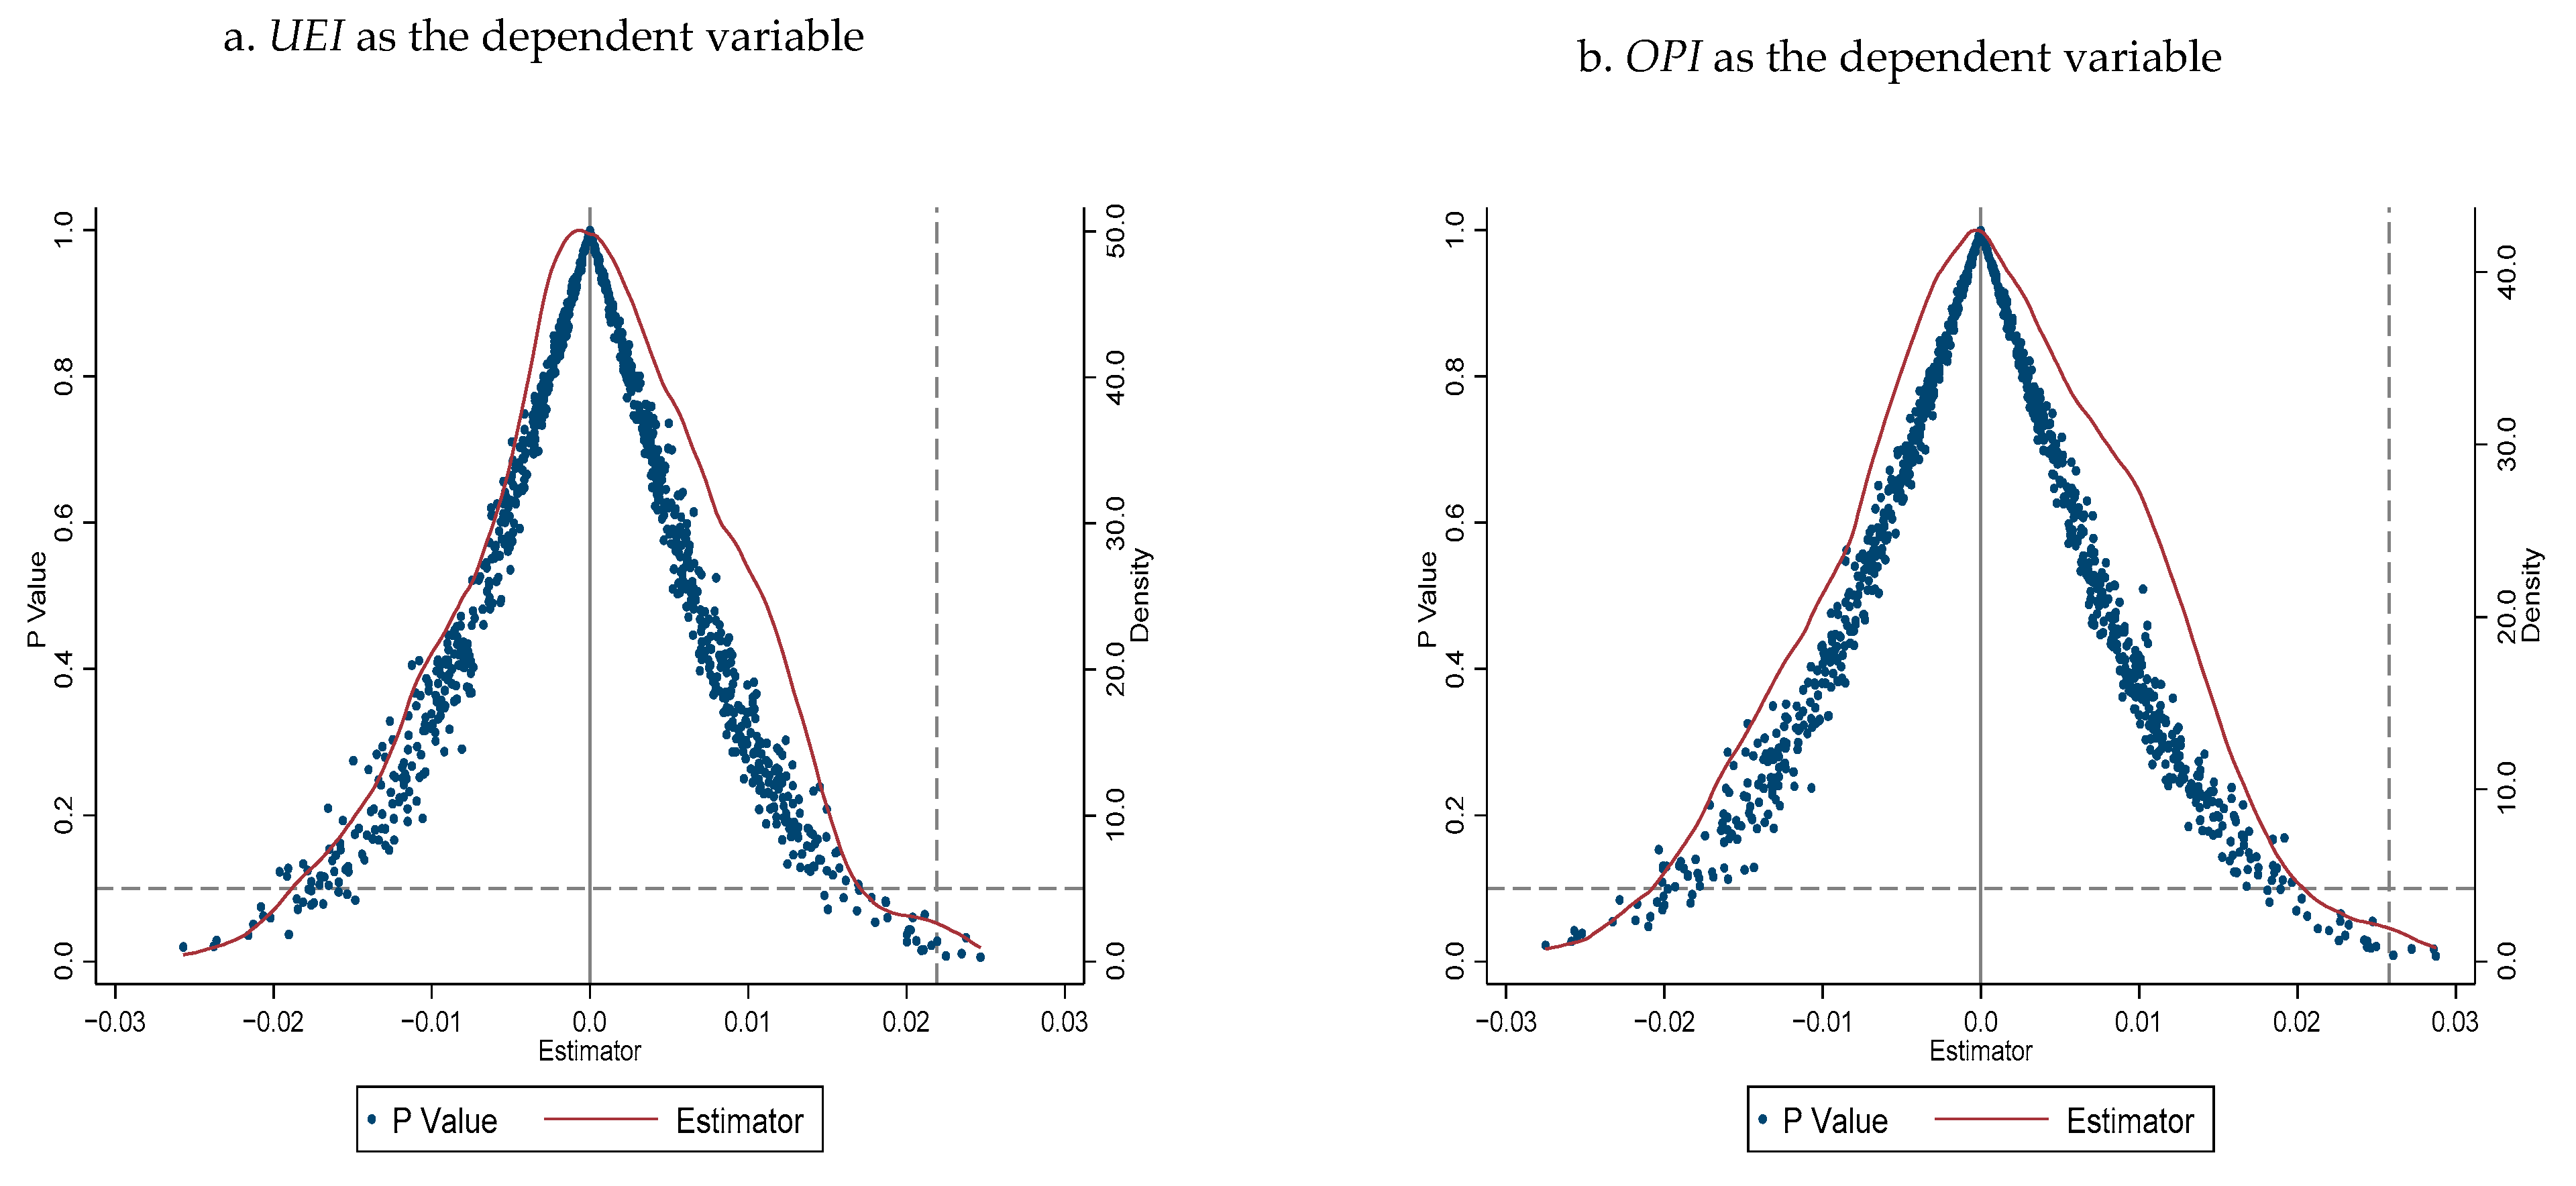
Placebo tests were conducted by randomly assigning the sample into the treatment and control groups. Specifically, 189 firms were randomly selected from from all 864 thermal power firms as the treatment group, and the remaining firms were grouped into the control group (The treatment groups generated by random grouping contain the same number of firms as the true treatment group). Given that the baseline regressions identify a significant effect of the reform on the UEI and OPI of the treated firms, placebo tests were conducted for the policy effects on UEI and OPI in this study. With random grouping, the estimated coefficient of treat × post should not be stably significantly different from 0. If a stably significant policy effect exists under random sampling, it indicates that the original estimation is biased. We performed 1000 random sample groupings and re-estimated the Equation (8). Appendix A Figure A3 shows the distribution of the estimated coefficients and p-values of treat × post. The results show that in the 1000 regressions on UEI, the mean of the coefficients of treat × post is close to 0, and 955 out of 1000 fail the 10% significance test; in the 1000 regressions on OPI, the mean of the coefficients of treat × post is also close to 0, and 959 out of 1000 fail the 10% significance test. The results indicate that stable and significant policy effects cannot be identified under random grouping. The results of placebo tests suggest that the effects of the vertical unbundling reform on the unified and operational efficiency are real, and they are unlikely to be caused by other unobserved factors.
5. Further Exploration
5.1. Mechanism for Vertical Unbundling to Enhance Operational Efficiency
Studies have shown that breaking up vertical monopolies and introducing competition can enhance the performance of thermal power generators [2,7]. While we demonstrated that the vertical unbundling reform improved the operational efficiency of Chinese thermal power generators, the mechanisms behind this improvement remain unclear. Two channels for enhancing operational efficiency, namely increased capacity utilization of thermal power generators and improved power coal quality, are examined using a mediating effect model.
5.1.1. Capacity Utilization
We examine whether the vertical unbundling reform improves OPI by increasing capacity utilization. Accordingly, the following mediating effect model is constructed:
where lnhour is the logarithm of full-load hours, which measures the capacity utilization of the generating firms. The control variables of Equations (10)–(12) are consistent with Equation (8). When , , and are significant and is not, is the mediator variable and a full mediation effect exists; when , , and are all significant and , it means that is the mediator variable but only a partial mediation effect occurs; when is significant and is not, it means that is not the mediator variable [50]. Table 7 presents the estimation results of the mediating effect model.
Table 7.
Results of mechanism analysis.
Column (1) of Table 7 presents the estimation results of Equation (10), which are fully consistent with the baseline estimation results. Column (2) reports the estimation results of Equation (11), which shows that the vertical unbundling reform significantly increases lnhour, indicating that the reform improves capacity utilization. It is possible that thermal power producers in the treatment group responded to intensified market competition by increasing generator utilization. The estimation results of Equation (12) are given in column (3). The results show that the coefficient of lnhour is significantly positive. Moreover, after controlling for lnhour, the coefficient of treat × post decreases in magnitude, and its significance level diminishes. These findings suggest that capacity utilization is a channel through which the reform affects operational efficiency.
5.1.2. Coal Quality
In Section 4.2.2, it was found that coalquality, as a control variable, has a significant effect on OPI. However, it remains uncertain whether the vertical unbundling reform directly improves power coal quality. To investigate whether the reform affects OPI by influencing power coal quality, we replace lnhour in Equations (10)–(12) with coalquality and perform a mediating effect analysis. Columns (4)–(6) of Table 7 present the regression results.
Column (5) of Table 7 shows that the reform has a significant negative effect on coalquality, indicating that the reform significantly improves the quality of power coal used by the treated firms. Under the pressure of market competition, firms are more concerned about production costs. The selection of higher quality fuels is an attractive option to reduce the cost of thermal power. Additionally, the treated firms hold a dominant position in the power generation market, giving them better access to high-quality coal from upstream sources. In the year when the vertical unbundling reform was initiated, the five major power generation groups that were unbundled from the SPC accounted for 33.8% of the country’s electricity generation [51]. Consequently, the treated firms both have the incentive and the ability to improve the quality of coal used after the reform. Columns (3) and (6) of Table 7 illustrate that the coefficient of the interaction term becomes smaller and less significant after adding coalquality to the control variables. This finding indicates that the reform leads to improved power coal quality and thus improved operational efficiency of the treated firms.
5.2. Environmental Effects of Vertical Unbundling
In Section 5.1, it was demonstrated that the vertical unbundling reform improves the operational efficiency of the treated firms and the quality of power coal they use. Theoretically, these improvements not only help enhance the performance of thermal power firms in electricity production but also yield co-benefits, such as energy conservation and emissions reduction. However, there was no positive effect of the reform on environmental efficiency. Additional research is required to determine why the reform did not improve the emission performance of the treated firms.
Pollution control technologies for businesses have two main types, namely, source control (or cleaner production) and end-of-pipe treatment [52,53]. In thermal power production, improving operational efficiency and fuel quality are both source control technologies. Improving operational efficiency and coal quality helps thermal power firms achieve cleaner production and reduce pollutants in the production process. Thus, the vertical unbundling reform enables the treated firms to enhance the source control of SO2. To confirm this assumption, we assessed the effect of the reform on the adoption of source control technologies by the treated firms using a DID model with logarithmic SO2 generation (lnSO2_pr), SO2 generation per unit of coal consumption (SO2c_pr), and SO2 generation per unit of electricity generation (SO2p_pr) as dependent variables. Here, SO2 generation was used instead of emissions because emissions are the result of the compound effect of source control and end-of-pipe treatment, but generation is only related to source control. The regression results presented in columns (1)–(3) of Table 8 show that the reform significantly reduces lnSO2_pr, SO2c_pr, and SO2p_pr. Thus, it is confirmed that the reform promotes the use of source control technologies by the treated firms.
Table 8.
Environmental effects of the vertical unbundling reform.
Given that the vertical unbundling reform helps reduce SO2 generated by the treated firms in the process of power generation, why do we not observe that the reform promotes the reduction in SO2 emissions by the treated firms? One possible reason is that the reform reduces the treated firms’ end-of-pipe treatment of SO2. To test this conjecture, we performed a DID estimation with SO2 removal rate (SO2_re = 1 – emission/generation) as the dependent variable, and column (4) of Table 8 presents the regression results (We did not use emissions/generation and emissions/coal consumption as dependent variables because generation and coal consumption may be influenced by source control technologies). The results show that this reform significantly reduces the SO2_re of the treated firms. In other words, it reduces the efforts of the treated firms in implementing end-of-pipe treatment measures. Therefore, it is found that this reform affects the choice of pollution control technologies by the treated firms, thereby compelling them to prefer source control technologies.
The reason may be as follows: source control, such as improvement in operational efficiency and fuel quality, not only reduces pollutant generation but also typically enhances the firm’s economic performance. This results in a win-win situation, characterized by increased revenue and reduced emissions. End-of-pipe treatment primarily reduces emissions by installing exhaust gas purification devices [54], which require additional investment in pollution treatment equipment and equipment operating costs. As a result, end-of-pipe treatment only brings about an increase in operating costs without improving revenues. With the implementation of the vertical unbundling reform, the treated firms face more intense competition, which motivates them to improve fuel quality and operational efficiency. The improved fuel quality and operational efficiency brought additional environmental benefits in the form of cleaner production processes and less pollutant generation. However, this reform has also led the treated firms to reduce their use of end-of-pipe treatment technologies to save costs, which may offset the environmental benefits of improving operational efficiency and fuel quality. According to Shleifer [25], competition tends to increase the incentives for firms to undercut costs to reduce prices. This approach can be implemented to prevent pollution in a sense that firms may pursue cost-reducing strategies by reducing pollution control activities. In the absence of effective environmental regulation, firms are likely to reduce the use of end-of-pipe treatment technologies to reduce costs.
The final environmental effects of the reform were assessed using logarithmic SO2 emissions (lnSO2_em) as the dependent variable. Column (5) of Table 8 shows that the coefficient of treat × post is negative but insignificant, implying that the reform did not significantly reduce SO2 emissions of the treated firms. Although this reform increased the use of source control technologies by the treated firms, it simultaneously reduced their utilization of end-of-pipe treatment technologies. This dual effect helps explain why the reform did not result in improved environmental efficiency for the treated firms.
We conducted a robustness check on this finding. Given that reduction in emissions is the compound result of firms’ adoption of source control and end-of-pipe treatment technologies, the environmental efficiency obtained by measuring emissions as non-desired output reflects firms’ efforts in both types of pollution control technologies. To strip the effect of end-of-pipe treatment, we re-measured four efficiency indicators expressed as UEI(pr), OPI(pr), EPI(pr), and EE(pr), using SO2 generation as an undesired output. The re-measured environmental efficiency reflects the efforts of firms in source control techniques but excludes the effect of firms’ use of end-of-pipe control techniques. Table 9 shows the results of the reform effect assessment based on the four re-measured efficiency indicators. The results indicate that the reform not only increases UEI(pr) and OPI(pr) but also has a positive effect on EPI(pr) and EE(pr). This finding again proves that the reforms increase the use of source control technologies by the treated firms.
Table 9.
Results of reform effect assessment based on the four re-measured efficiency indicators.
6. Conclusions
This study explores the effect of the vertical unbundling reform of China’s electricity sector. A non-radial DEA approach is adopted to include SO2 emissions as an undesired output in the efficiency measurement framework, measure the unified efficiency of thermal power firms, and decompose the unified efficiency into operational and environmental efficiencies. Subsequently, the effects of the reform on the unified, operational, and environmental efficiencies of the unbundled thermal power firms are identified using DID estimation.
Most previous studies of China’s vertical unbundling have found that the reform has yielded certain benefits to firms’ operational performance [6,10,11,12]. These studies overlook the environmental impact of the reform. Our findings on unified efficiency further demonstrate that the combined impact of China’s vertical unbundling reform on both the environment and operational performance remains positive.
The empirical results in this study demonstrate that vertical unbundling enhances the operational efficiency of the treated firms, consistent with previous findings. Furthermore, this study delves deeper into the mechanisms through which vertical unbundling influences operational efficiency. We found that the reform improves the capacity utilization and fuel quality of treated firms, which ultimately improves the operational efficiency of these firms.
This study does not observe a significant impact of vertical unbundling on the environmental efficiency of thermal power firms. This finding appears to support Wang et al.’s [16] conclusion that vertical unbundling does not have a significant effect on firms’ air pollution. However, we find that the vertical unbundling reform affected the choice of pollution treatment technologies by unbundled firms. Our analysis reveals that the reform increases the use of source control technologies by the treated firms but reduces their use of end-of-pipe technologies. In response to the intensely competitive market, after vertical unbundling, the treated firms improved their fuel quality and operational efficiency, which resulted in additional environmental benefits. However, the reform also led these thermal generators to reduce the use of end-of-pipe treatment technologies to save costs, which offset the environmental gains from improved operational efficiency and fuel quality.
Our findings confirm that the vertical unbundling reform in China has a positive effect on the performance of thermal power generators, even when their pollution emissions are considered. Therefore, promoting market-oriented reforms should continue in the power sector to improve its economic performance. However, competition may provide incentives for firms to reduce their investment in pollution control to save costs, which may have a negative effect on the environment. Therefore, a need arises to strengthen the regulation of pollution emissions from power firms during the marketization process. Appropriate environmental incentives/disincentives are necessary for a more market-oriented electricity sector. Some examples of such mechanisms include emissions markets, green certificates, and other environmental regulatory mechanisms.
Despite the valuable findings, this study has several limitations. Firstly, this study was unable to assess the long-term impact of the vertical unbundling reform due to the shortage of data. Future research should extend the study period to examine the long-term effects of vertical unbundling. Secondly, the whole plan of China’s vertically unbundling reform comprised two parts: reshaping the market structure by vertically unbundling the dominant integrated firm and putting in motion a plan towards wholesale price liberalization [7]. There is a need for studies that investigate the efficiency impacts of China’s tariff reforms on power producers and explore the relationship between tariff reforms and other reforms.
Author Contributions
Data curation, F.Y.; methodology, R.Y.; resources, P.Y.; writing—original draft, R.Y.; writing—review and editing, P.Y. and G.J. All authors have read and agreed to the published version of the manuscript.
Funding
This paper was supported by the Science Foundation of Ministry of Education of China [grant number:18XJA7900087], and the Fundamental Research Funds for the Central Universities [grant number: JBK230117].
Data Availability Statement
Data are available from the authors upon request.
Conflicts of Interest
The authors declare no conflict of interest.
Appendix A

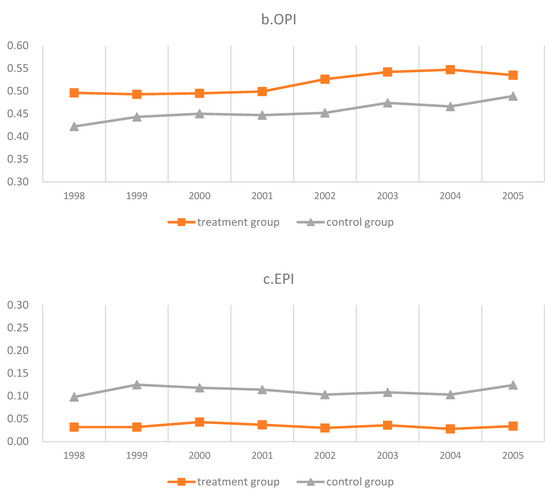
Figure A1.
Changes in UEI, OPI, and EPI of thermal power firms during the study period (mean values).
Figure A1.
Changes in UEI, OPI, and EPI of thermal power firms during the study period (mean values).
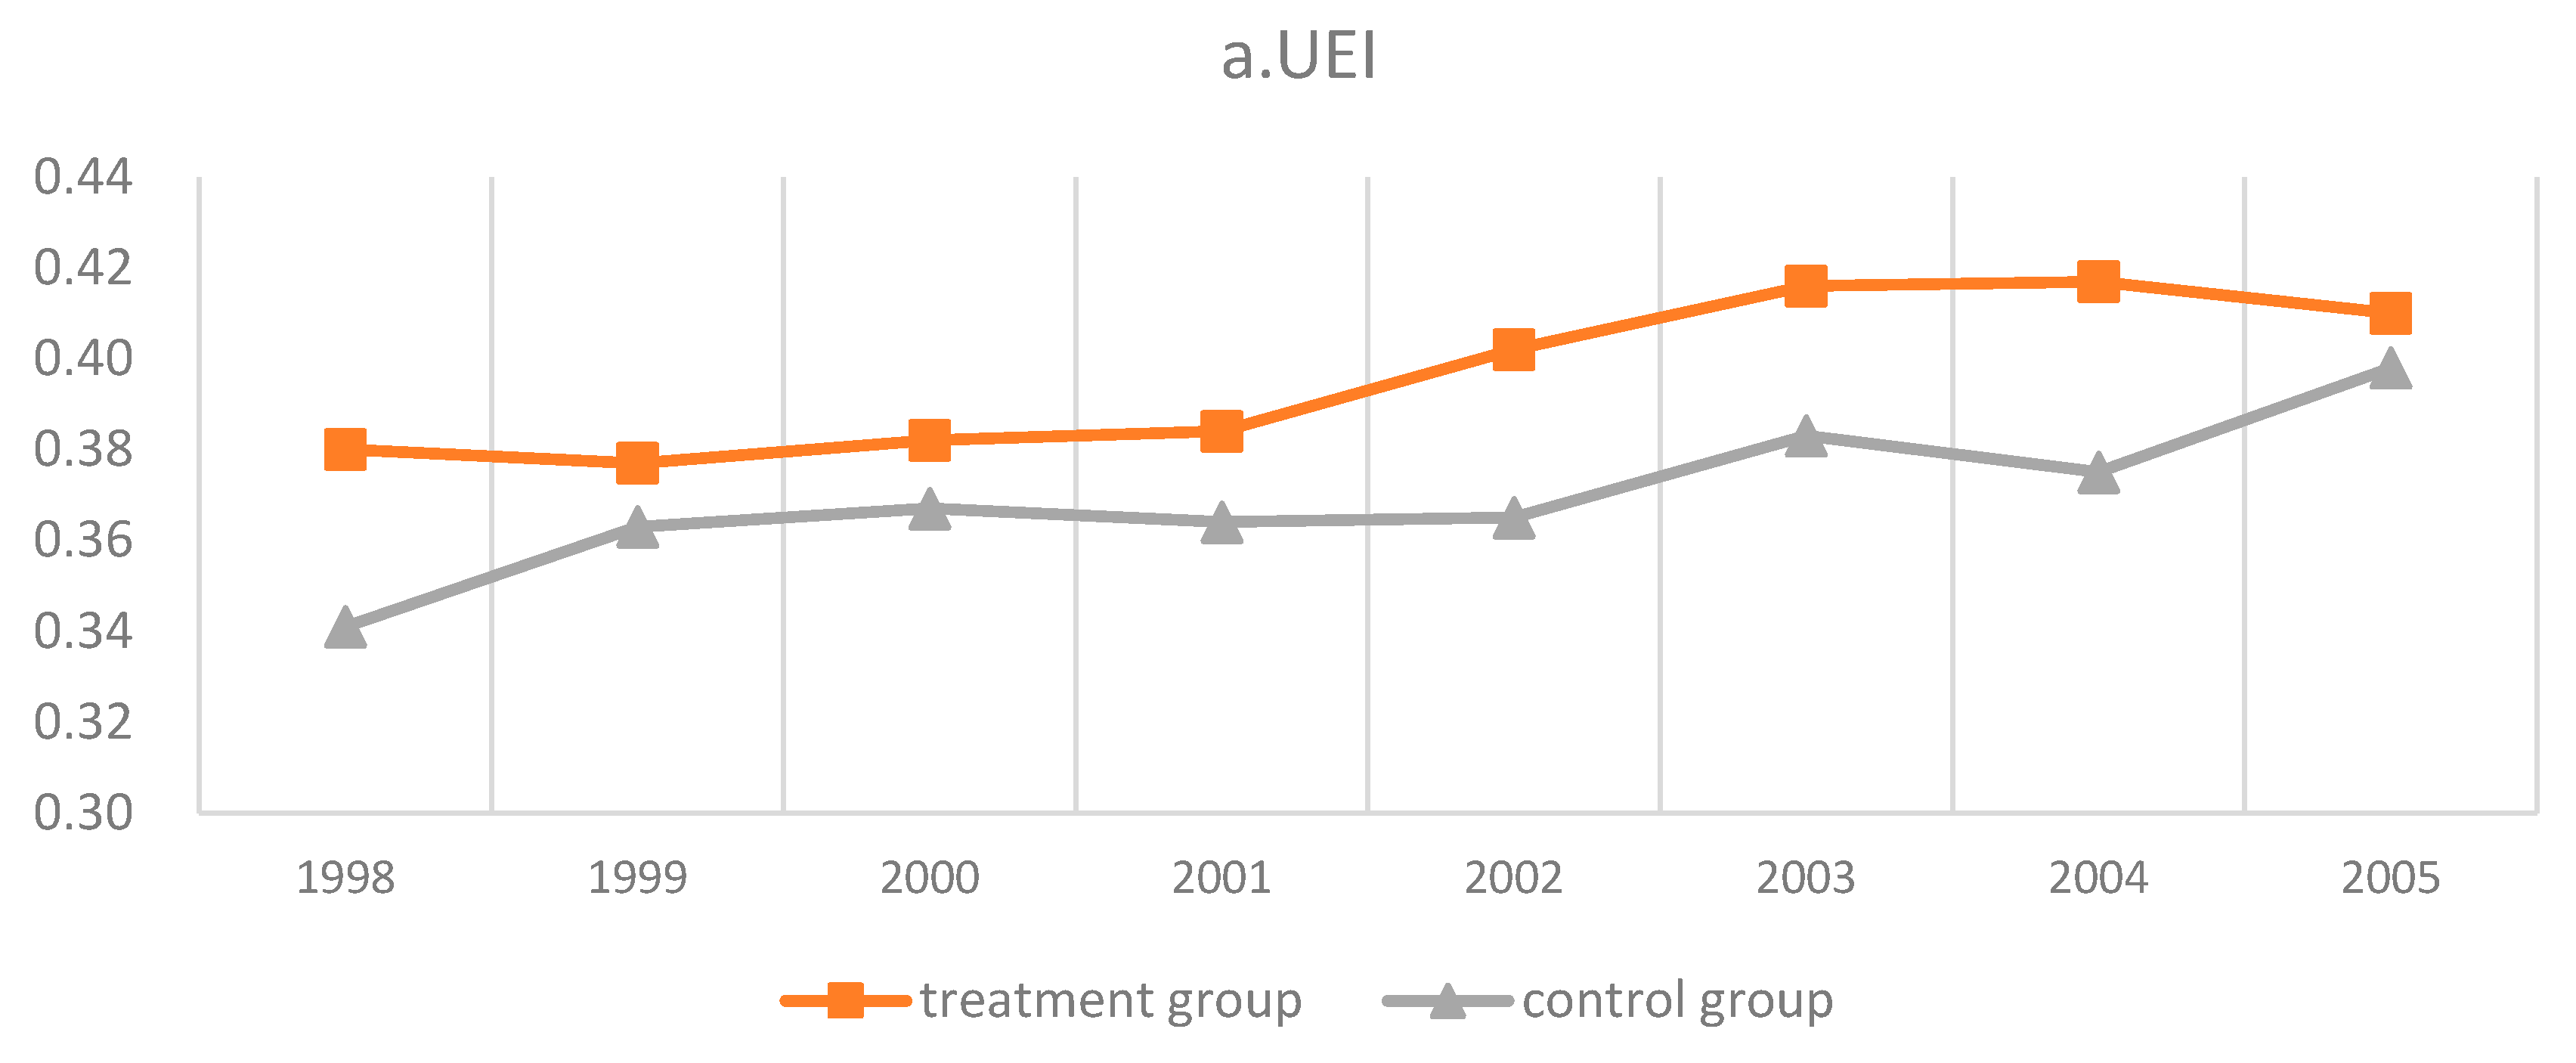
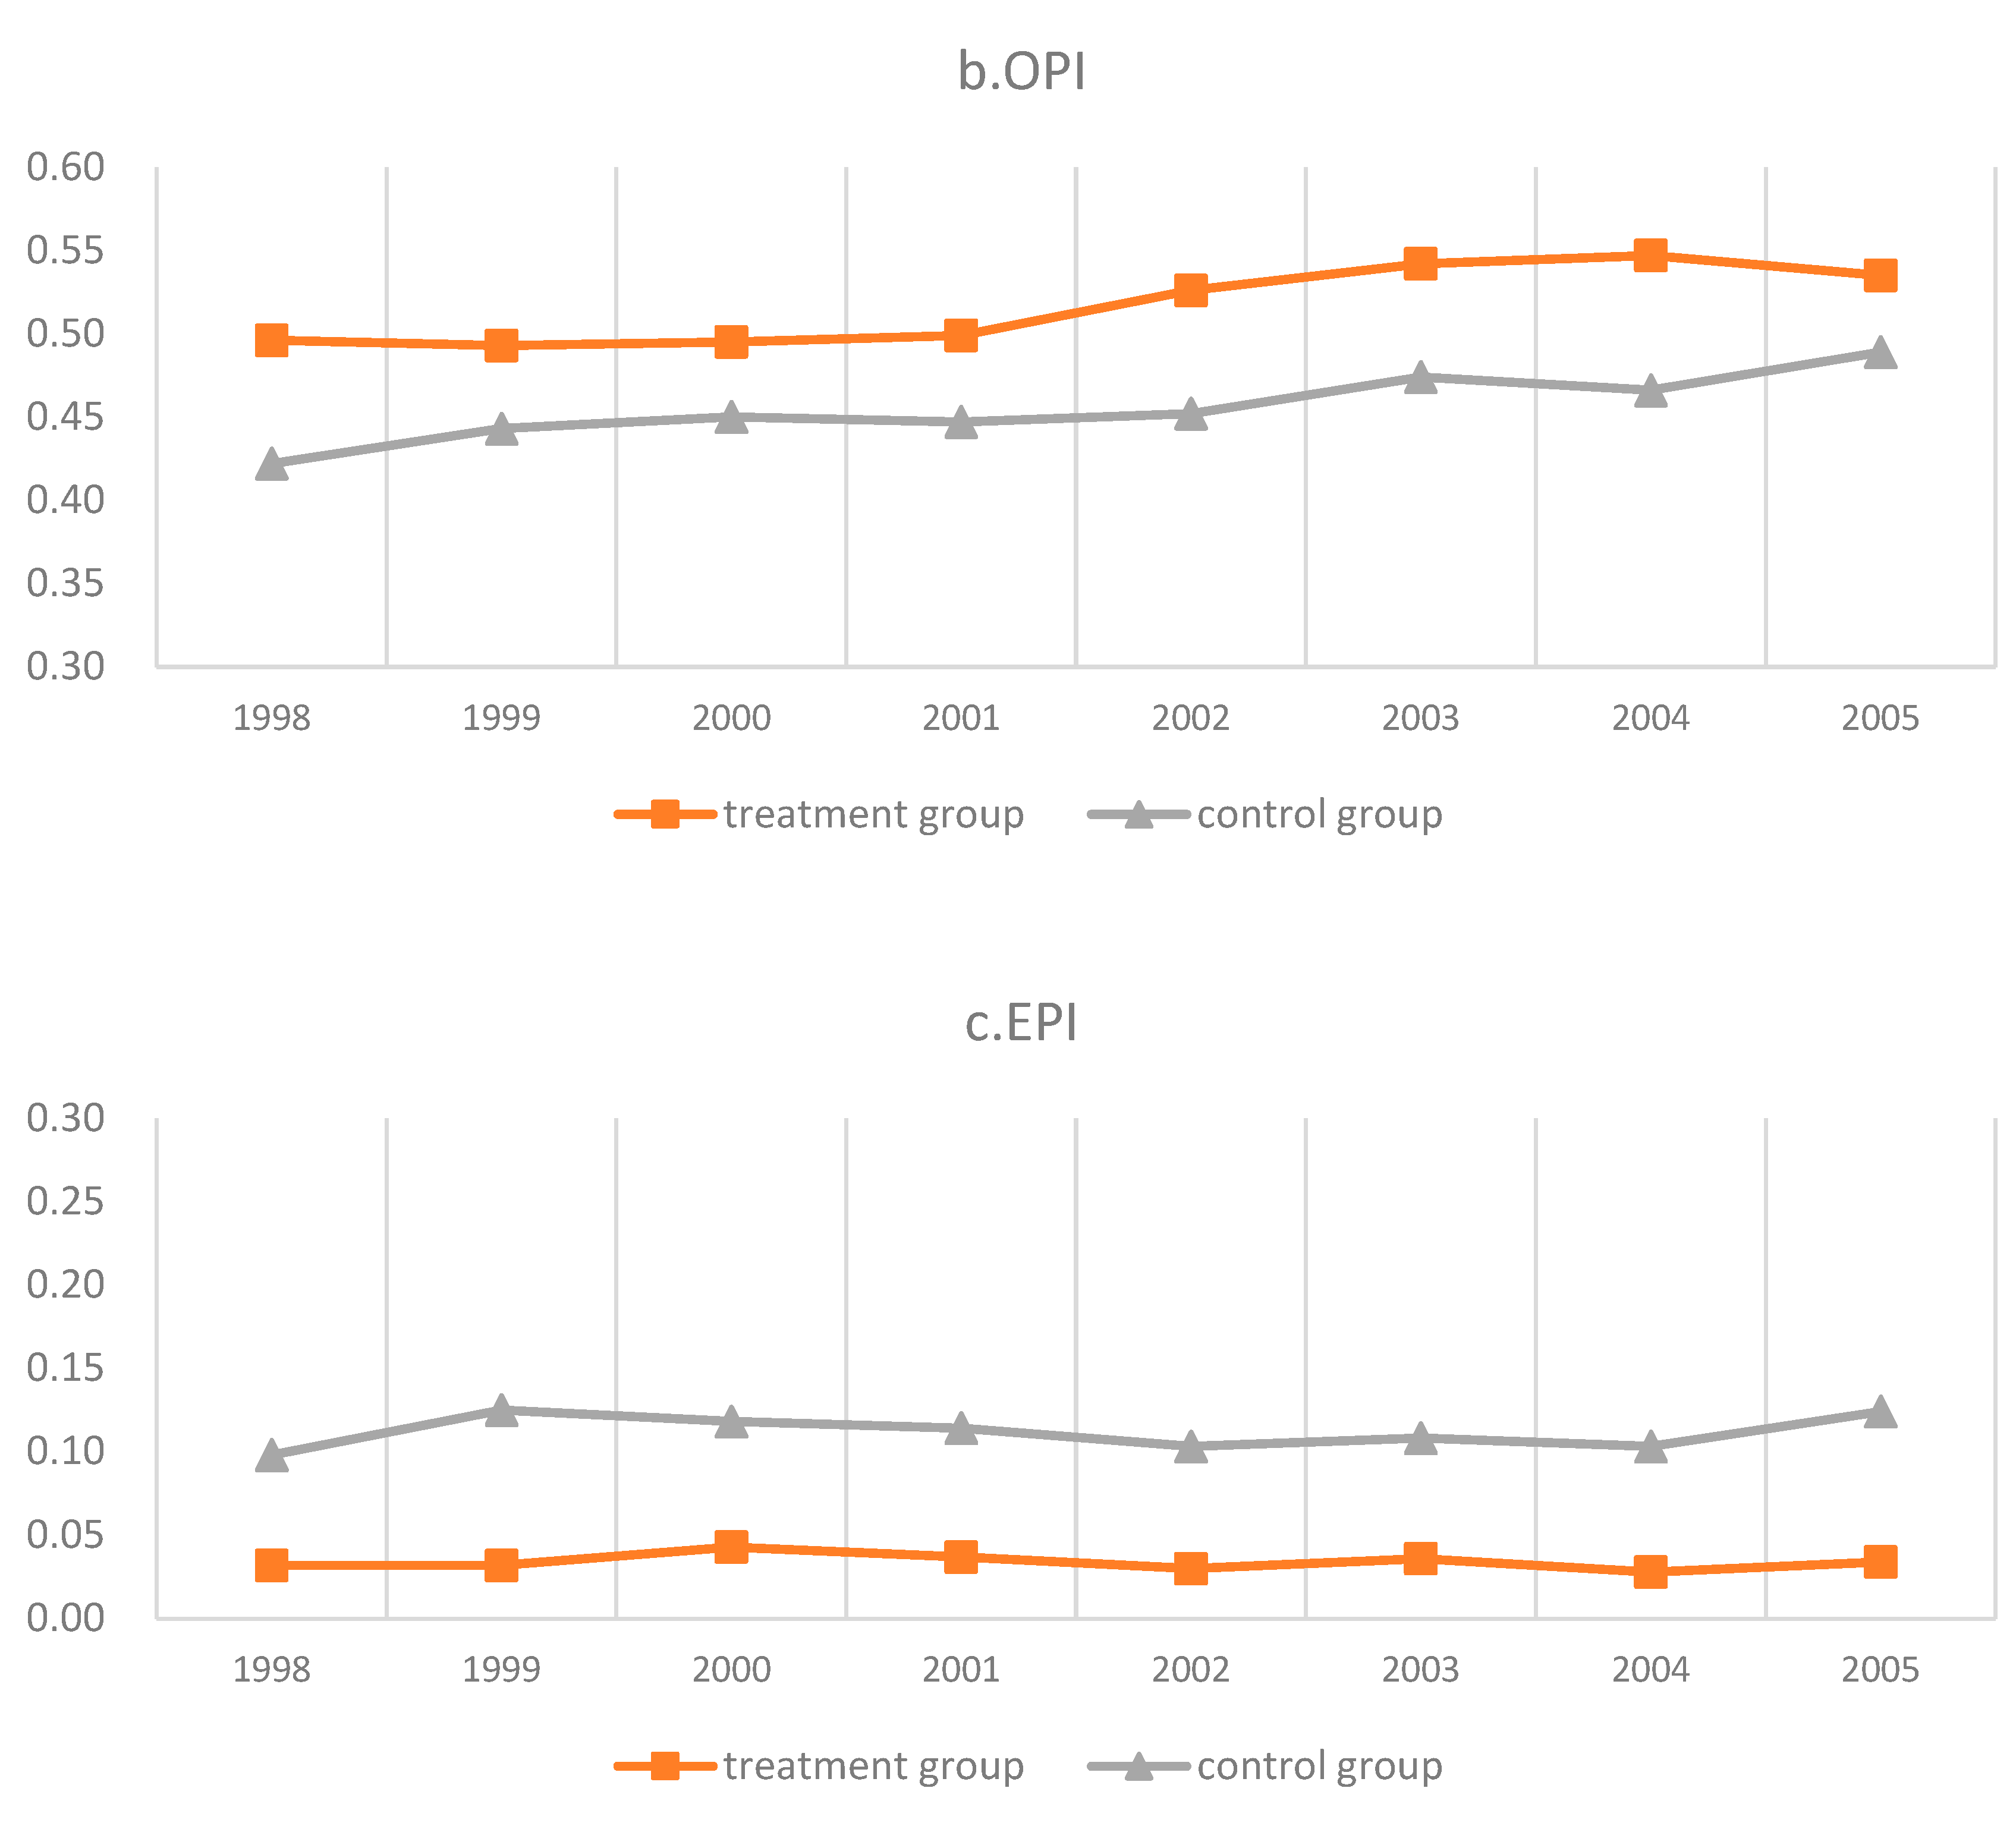
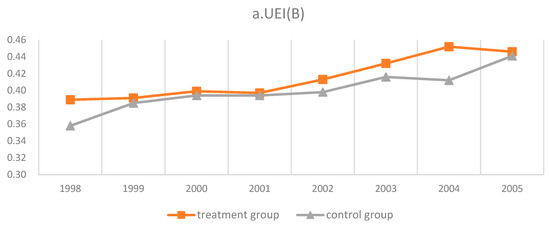
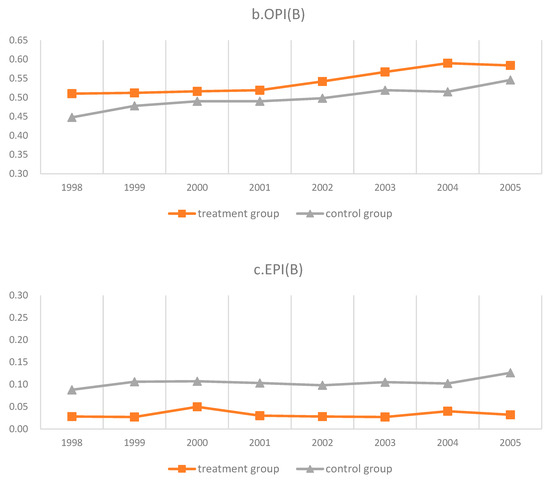
Figure A2.
Changes in UEI(B), OPI(B), and EPI(B) for thermal power firms during the study period (mean values).
Figure A2.
Changes in UEI(B), OPI(B), and EPI(B) for thermal power firms during the study period (mean values).
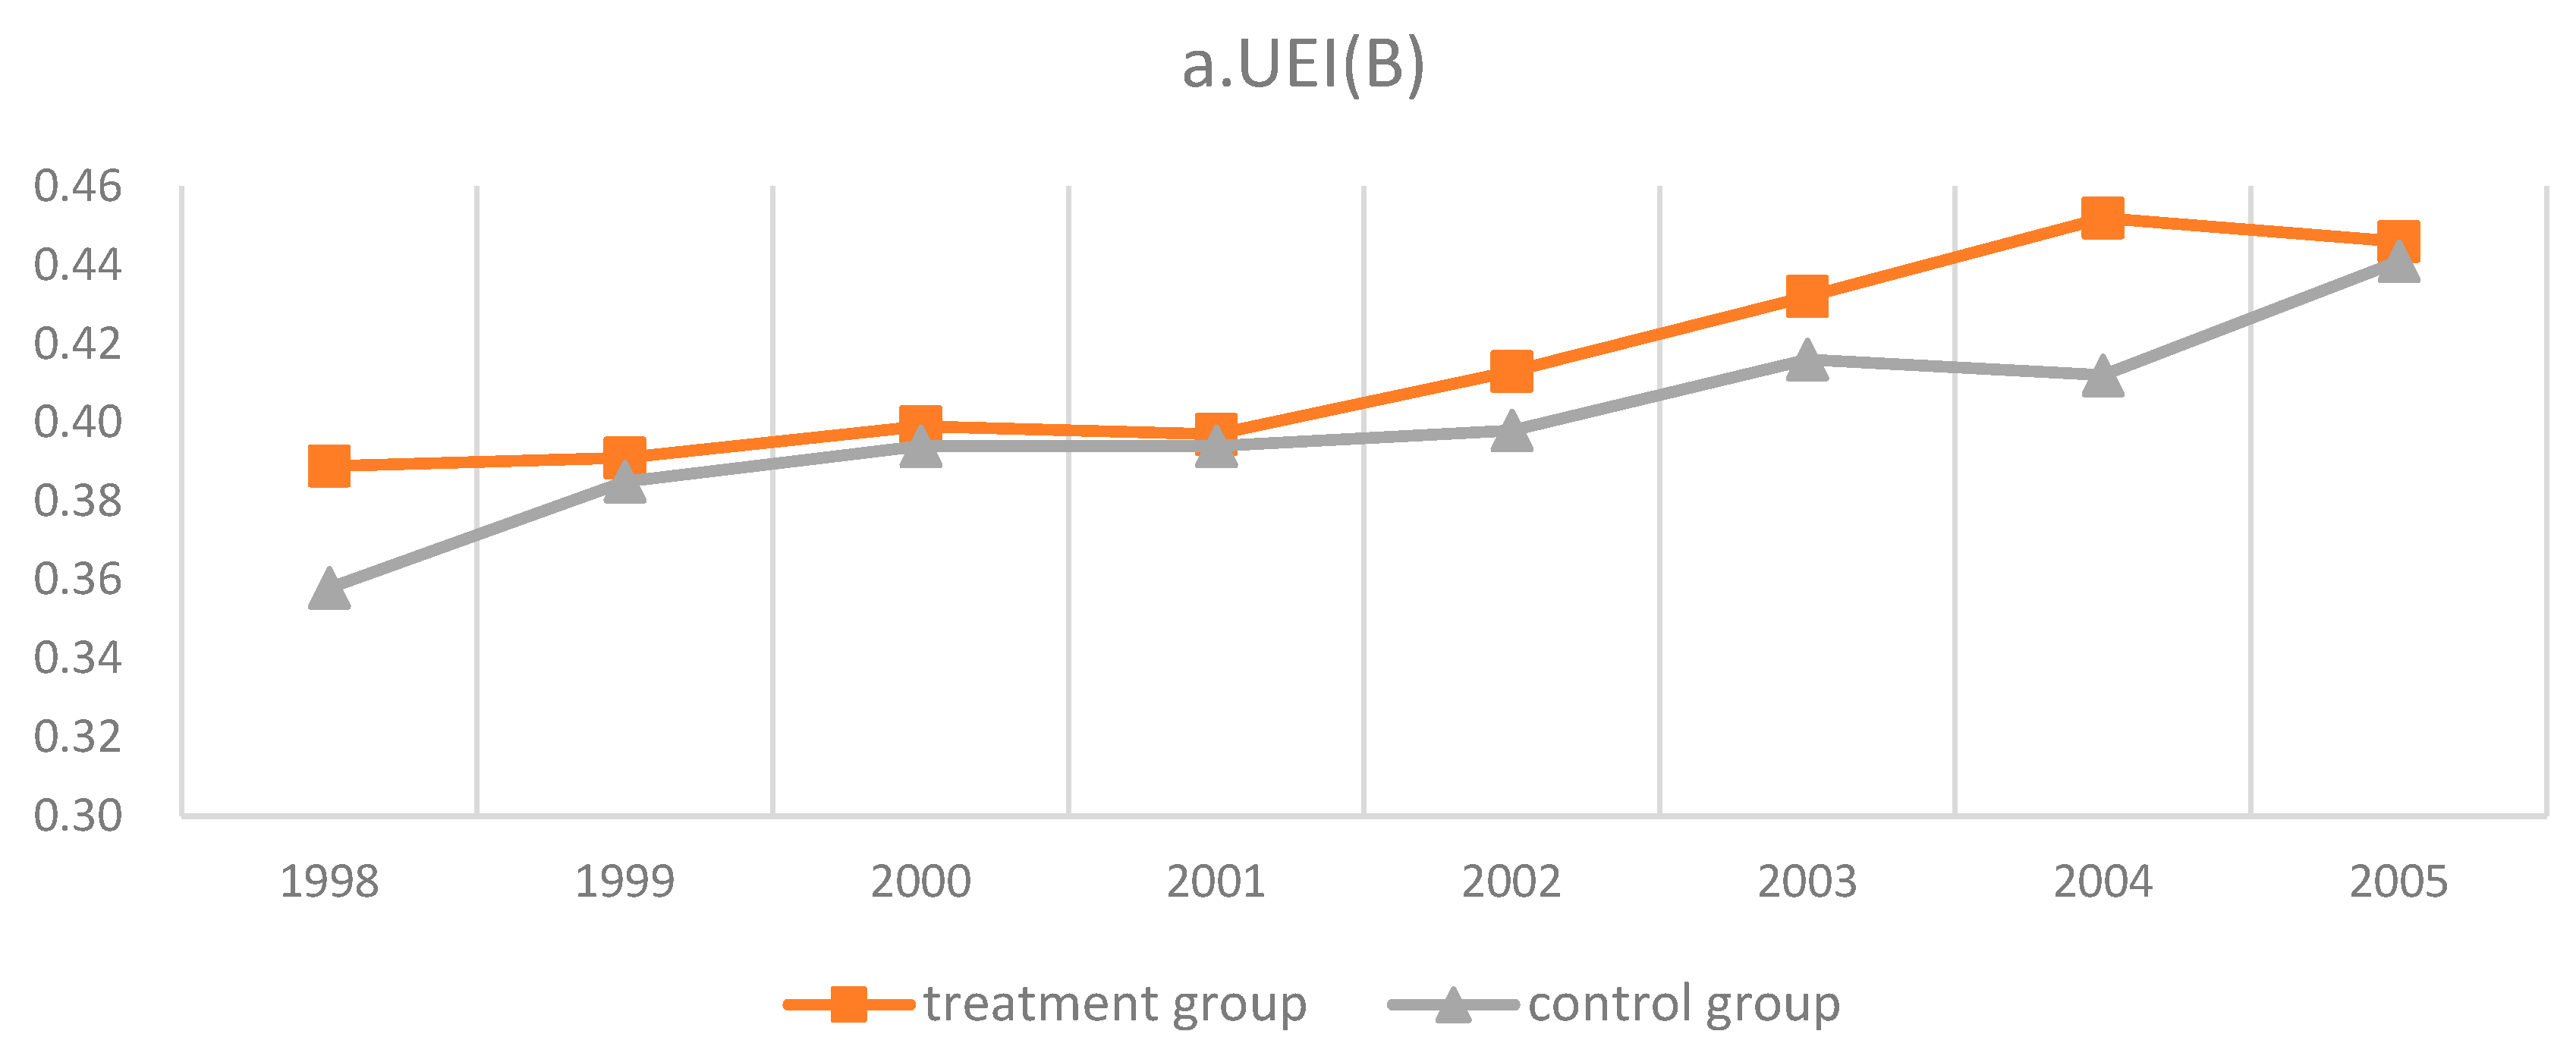
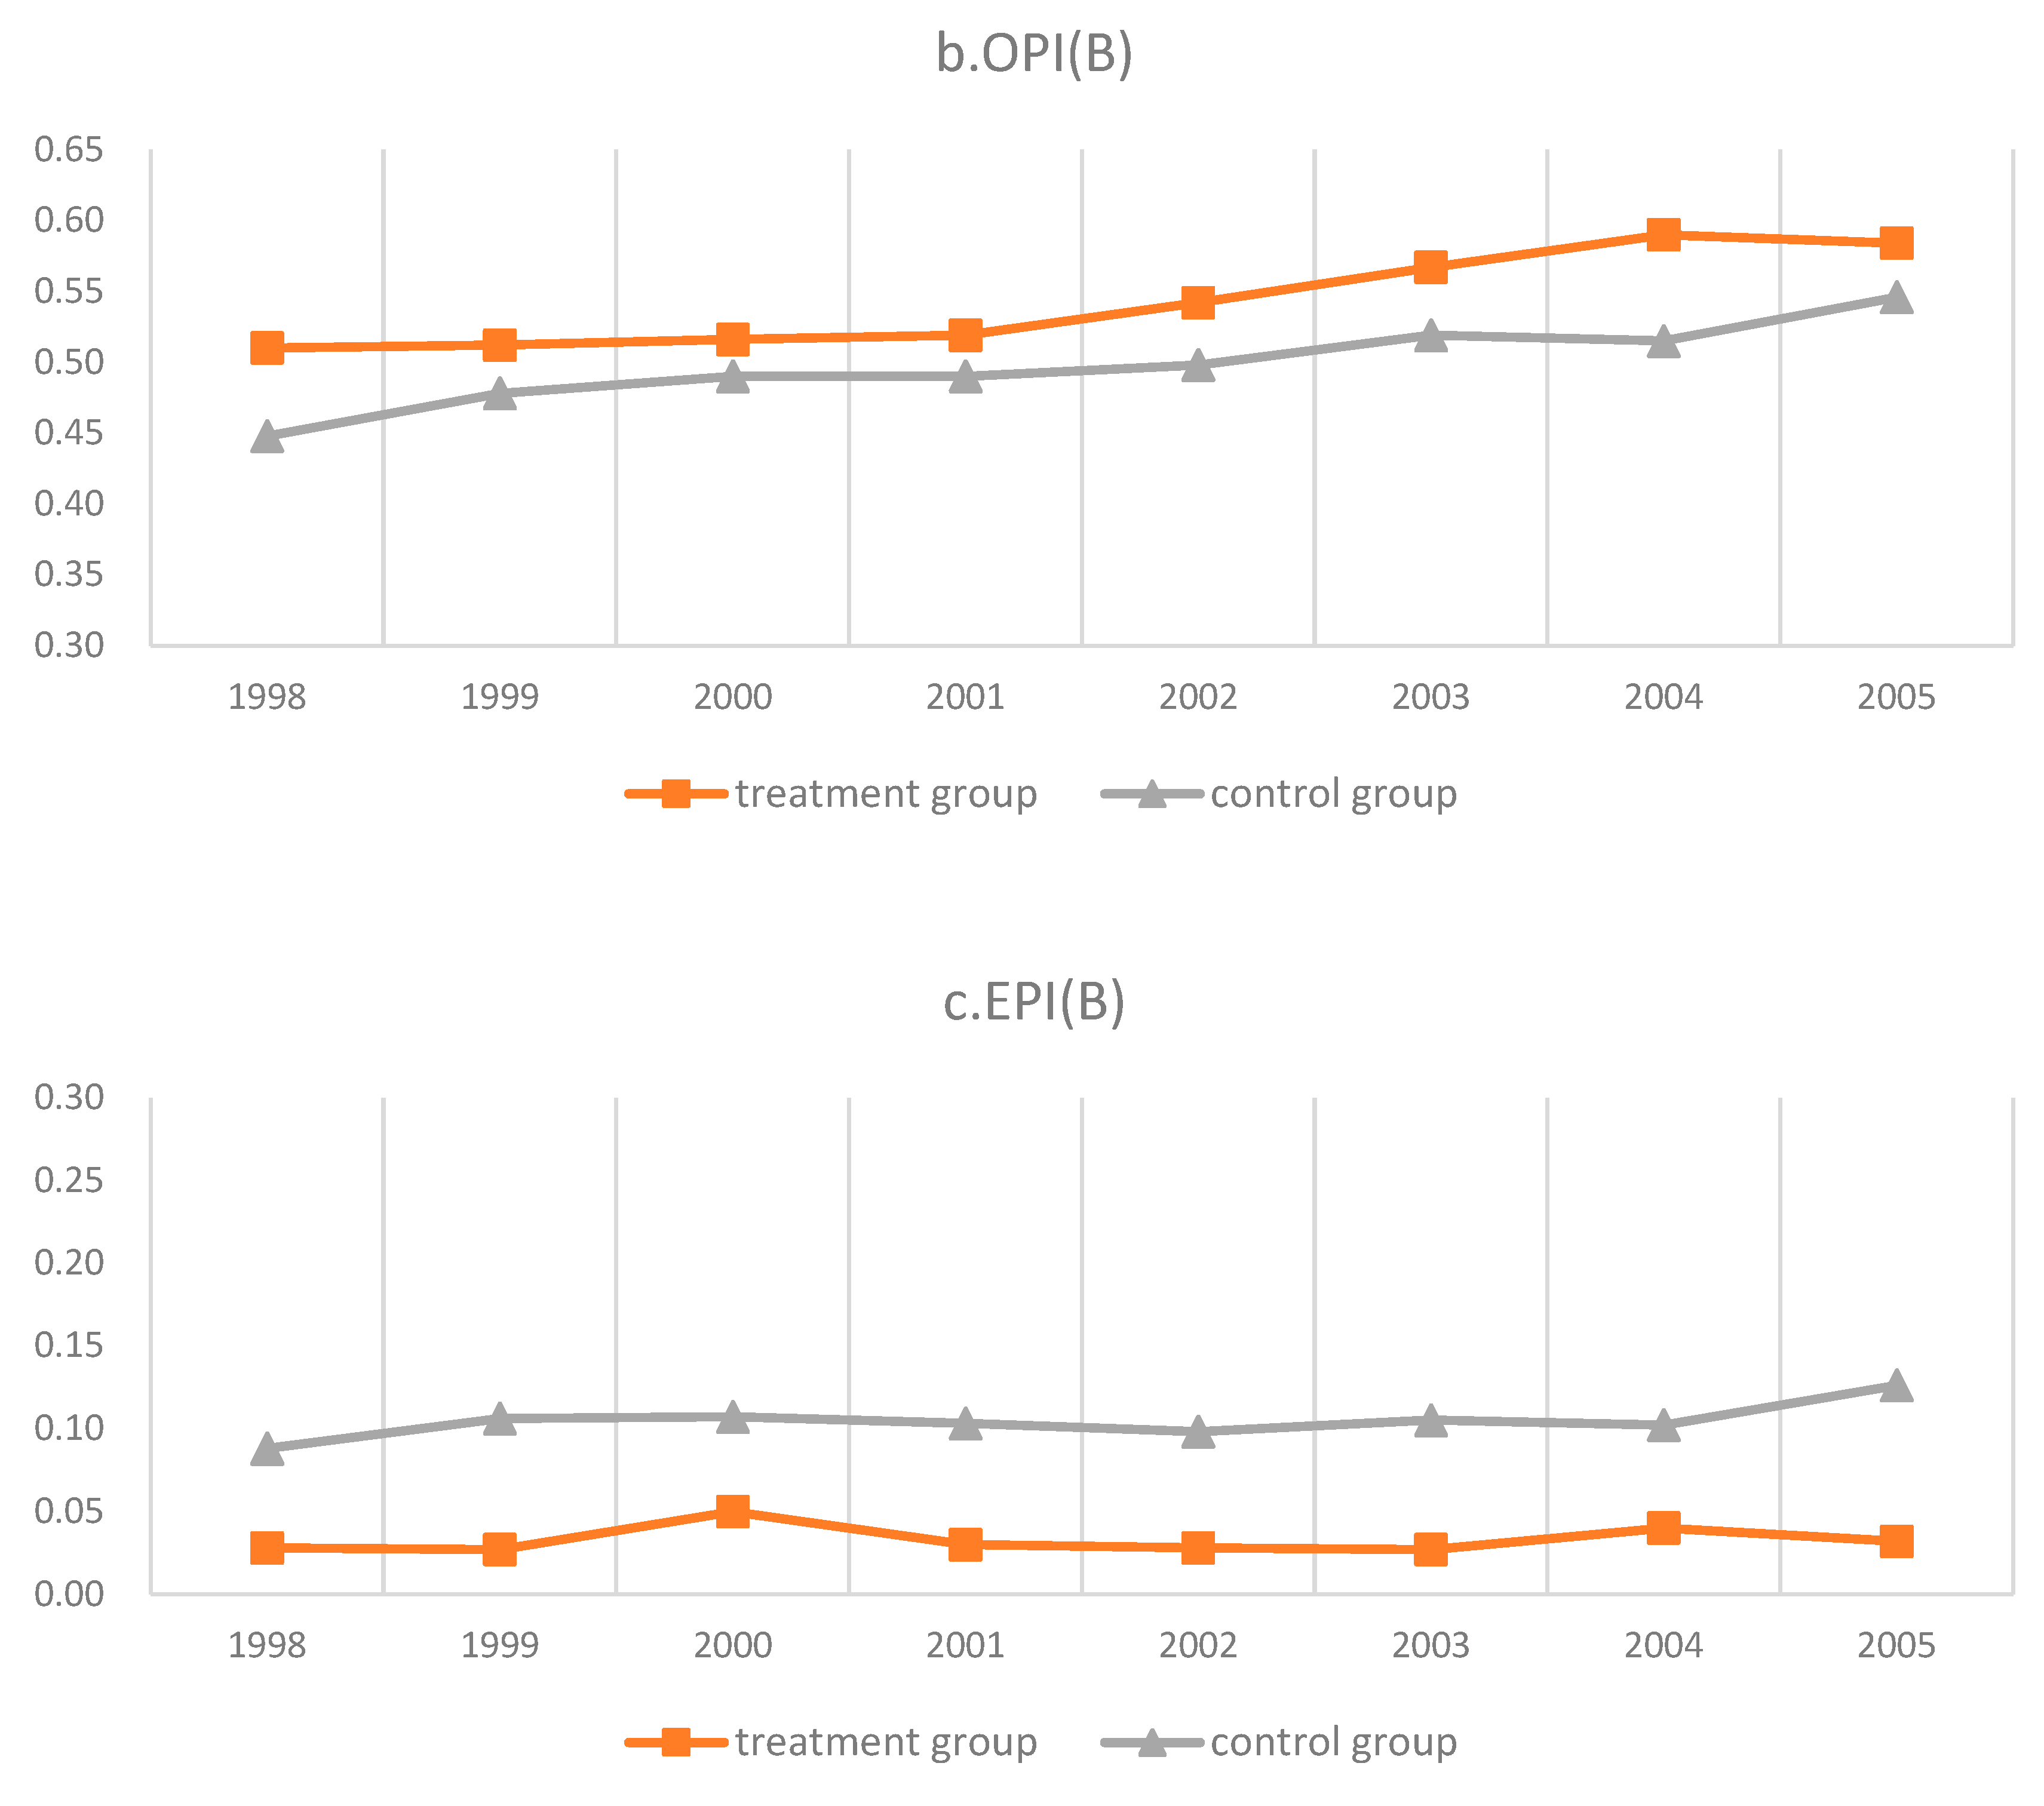

Figure A3.
Placebo test results. Note: The x-axis indicates the estimated coefficients of the interaction term for the randomized group experiment, the curve is the kernel density distribution of the estimated coefficients, and the dots are the corresponding p-values. The vertical dashed line is the true estimate of the baseline regression.
References
- Zhang, Y.; Parker, D.; Kirkpatrick, C. Electricity sector reform in developing countries: An econometric assessment of the effects of privatization, competition and regulation. J. Regul. Econ. 2008, 33, 159–178. [Google Scholar] [CrossRef]
- Fabrizio, K.R.; Rose, N.L.; Wolfram, C.D. Do Markets Reduce Costs? Assessing the Impact of Regulatory Restructuring on US Electric Generation Efficiency. Am. Econ. Rev. 2007, 97, 1250–1277. [Google Scholar] [CrossRef]
- Newbery, D.M.; Pollitt, M.G. The Restructuring and Privatisation of Britain’s Cegb—Was It Worth It? J. Ind. Econ. 1997, 45, 269–303. [Google Scholar] [CrossRef]
- Aghdam, R.F. Dynamics of productivity change in the Australian electricity industry: Assessing the impacts of electricity reform. Energy Policy 2011, 39, 3281–3295. [Google Scholar] [CrossRef]
- Malik, K.; Cropper, M.; Limonov, A.; Singh, A. The Impact of Electricity Sector Restructuring on Coal-fired Power Plants in India. Energy J. 2015, 36, 287–312. [Google Scholar] [CrossRef]
- Zhao, X.; Ma, C. Deregulation, vertical unbundling and the performance of China’s large coal-fired power plants. Energy Econ. 2013, 40, 474–483. [Google Scholar] [CrossRef]
- Gao, H.; Van Biesebroeck, J. Effects of Deregulation and Vertical Unbundling on the Performance of China’s Electricity Generation Sector. J. Ind. Econ. 2014, 62, 41–76. [Google Scholar] [CrossRef] [PubMed]
- Cicala, S. When Does Regulation Distort Costs? Lessons from Fuel Procurement in US Electricity Generation. Am. Econ. Rev. 2015, 105, 411–444. [Google Scholar] [CrossRef]
- Nakano, M.; Managi, S. Regulatory reforms and productivity: An empirical analysis of the Japanese electricity industry. Energy Policy 2008, 36, 201–209. [Google Scholar] [CrossRef]
- Du, L.; He, Y.; Yan, J. The effects of electricity reforms on productivity and efficiency of China’s fossil-fired power plants: An empirical analysis. Energy Econ. 2013, 40, 804–812. [Google Scholar] [CrossRef]
- Du, L.; Mao, J.; Shi, J. Assessing the impact of regulatory reforms on China’s electricity generation industry. Energy Policy 2009, 37, 712–720. [Google Scholar] [CrossRef]
- Ma, C.; Zhao, X. China’s electricity market restructuring and technology mandates: Plant-level evidence for changing operational efficiency. Energy Econ. 2015, 47, 227–237. [Google Scholar] [CrossRef]
- Zhou, Y.; Xing, X.; Fang, K.; Liang, D.; Xu, C. Environmental efficiency analysis of power industry in China based on an entropy SBM model. Energy Policy 2013, 57, 68–75. [Google Scholar] [CrossRef]
- Chan, H.R.; Fell, H.; Lange, I.; Li, S. Efficiency and environmental impacts of electricity restructuring on coal-fired power plants. J. Environ. Econ. Manag. 2017, 81, 1–18. [Google Scholar] [CrossRef]
- Nepal, R.; Jamasb, T. Reforming the power sector in transition: Do institutions matter? Energy Econ. 2012, 34, 1675–1682. [Google Scholar] [CrossRef]
- Wang, C.; Guo, Y.; Yang, Y.; Chen, S. The environmental benefits of electricity industry restructuring in China: Ownership mixing vs. vertical unbundling. Energy Econ. 2022, 115, 106380. [Google Scholar] [CrossRef]
- Wang, B. An imbalanced development of coal and electricity industries in China. Energy Policy 2007, 35, 4959–4968. [Google Scholar] [CrossRef]
- Hayek, F.A. The Use of Knowledge in Society. Am. Econ. Rev. 1945, 35, 519–530. [Google Scholar]
- Leibenstein, H. Allocative Efficiency vs. “X-Efficiency”. Am. Econ. Rev. 1966, 56, 392–415. [Google Scholar]
- Laffont, J.; Tirole, J. A Theory of Incentives in Procurement and Regulation; MIT Press: Cambridge, MA, USA, 1993. [Google Scholar]
- Hiebert, L.D. The Determinants of the Cost Efficiency of Electric Generating Plants: A Stochastic Frontier Approach. Seoul Econ. J. 2002, 68, 935. [Google Scholar]
- Murty, M.N.; Kumar, S.; Paul, M. Environmental regulation, productive efficiency and cost of pollution abatement: A case study of the sugar industry in India. J. Environ. Manag. 2006, 79, 1–9. [Google Scholar] [CrossRef] [PubMed]
- Plummer, L.A.; Acs, Z.J. Localized competition in the knowledge spillover theory of entrepreneurship. J. Bus. Ventur. 2014, 29, 121–136. [Google Scholar] [CrossRef]
- Simon, D.H.; Prince, J.T. The effect of competition on toxic pollution releases. J. Environ. Econ. Manag. 2016, 79, 40–54. [Google Scholar] [CrossRef]
- Shleifer, A. Does competition destroy ethical behavior? Am. Econ. Rev. 2004, 94, 414–418. [Google Scholar] [CrossRef]
- Farber, S.C.; Martin, R.E. Market Structure and Pollution Control Under Imperfect Surveillance. J. Ind. Econ. 1986, 35, 147–160. [Google Scholar] [CrossRef]
- Polemis, M.L.; Stengos, T. Does competition prevent industrial pollution? Evidence from a panel threshold model. Bus. Strateg. Environ. 2019, 28, 98–110. [Google Scholar] [CrossRef]
- Davis, L.W.; Wolfram, C. Deregulation, consolidation, and efficiency: Evidence from US nuclear power. Am. Econ. J. Appl. Econ. 2012, 4, 194–225. [Google Scholar] [CrossRef]
- Bi, G.; Song, W.; Zhou, P.; Liang, L. Does environmental regulation affect energy efficiency in China’s thermal power generation? Empirical evidence from a slacks-based DEA model. Energy Policy 2014, 66, 537–546. [Google Scholar] [CrossRef]
- Dzwigol, H.; Kwilinski, A.; Lyulyov, O.; Pimonenko, T. The Role of Environmental Regulations, Renewable Energy, and Energy Efficiency in Finding the Path to Green Economic Growth. Energies 2023, 16, 3090. [Google Scholar] [CrossRef]
- Jamil, M.H.; Ullah, K.; Saleem, N.; Abbas, F.; Khalid, H.A. Did the restructuring of the electricity generation sector increase social welfare in Pakistan? Renew. Sustain. Energy Rev. 2022, 157, 112017. [Google Scholar] [CrossRef]
- Yang, H.; Pollitt, M. Incorporating both undesirable outputs and uncontrollable variables into DEA: The performance of Chinese coal-fired power plants. Eur. J. Oper. Res. 2009, 197, 1095–1105. [Google Scholar] [CrossRef]
- Du, L.; Hanley, A.; Zhang, N. Environmental technical efficiency, technology gap and shadow price of coal-fuelled power plants in China: A parametric meta-frontier analysis. Resour. Energy Econ. 2016, 43, 14–32. [Google Scholar] [CrossRef]
- Sun, C.; Liu, X.; Li, A. Measuring unified efficiency of Chinese fossil fuel power plants: Intermediate approach combined with group heterogeneity and window analysis. Energy Policy 2018, 123, 8–18. [Google Scholar] [CrossRef]
- Zhang, N.; Jiang, X. The effect of environmental policy on Chinese firm’s green productivity and shadow price: A metafrontier input distance function approach. Technol. Forecast. Soc. 2019, 144, 129–136. [Google Scholar] [CrossRef]
- Vlontzos, G.; Niavis, S.; Manos, B. A DEA approach for estimating the agricultural energy and environmental efficiency of EU countries. Renew. Sustain. Energy Rev. 2014, 40, 91–96. [Google Scholar] [CrossRef]
- Chung, Y.H.; Färe, R.; Grosskopf, S. Productivity and Undesirable Outputs: A Directional Distance Function Approach. J. Environ. Manag. 1997, 51, 229–240. [Google Scholar] [CrossRef]
- Fukuyama, H.; Weber, W.L. A directional slacks-based measure of technical inefficiency. Socio-Econ. Plan. Sci. 2009, 43, 274–287. [Google Scholar] [CrossRef]
- Zhang, J.; Zeng, W.; Shi, H. Regional environmental efficiency in China: Analysis based on a regional slack-based measure with environmental undesirable outputs. Ecol. Indic. 2016, 71, 218–228. [Google Scholar] [CrossRef]
- Chen, J.; Song, M.; Xu, L. Evaluation of environmental efficiency in China using data envelopment analysis. Ecol. Indic. 2015, 52, 577–583. [Google Scholar] [CrossRef]
- Färe, R.; Grosskopf, S. Directional distance functions and slacks-based measures of efficiency. Eur. J. Oper. Res. 2010, 200, 320–322. [Google Scholar] [CrossRef]
- Zhou, P.; Ang, B.W.; Wang, H. Energy and CO2 emission performance in electricity generation: A non-radial directional distance function approach. Eur. J. Oper. Res. 2012, 221, 625–635. [Google Scholar] [CrossRef]
- Färe, R.; Grosskopf, S.; Pasurka, C.A. Environmental production functions and environmental directional distance functions. Energy 2007, 32, 1055–1066. [Google Scholar] [CrossRef]
- Zhang, N.; Kong, F.; Choi, Y.; Zhou, P. The effect of size-control policy on unified energy and carbon efficiency for Chinese fossil fuel power plants. Energy Policy 2014, 70, 193–200. [Google Scholar] [CrossRef]
- Martín-Gamboa, M.; Iribarren, D.; Dufour, J. Environmental impact efficiency of natural gas combined cycle power plants: A combined life cycle assessment and dynamic data envelopment analysis approach. Sci. Total Environ. 2018, 615, 29–37. [Google Scholar] [CrossRef]
- McDonald, J. Using least squares and tobit in second stage DEA efficiency analyses. Eur. J. Oper. Res. 2009, 197, 792–798. [Google Scholar] [CrossRef]
- Du, W.; Wang, F.; Li, M. Effects of environmental regulation on capacity utilization: Evidence from energy enterprises in China. Ecol. Indic. 2020, 113, 106217. [Google Scholar] [CrossRef]
- Ai, H.; Hu, Y.; Li, K. Impacts of environmental regulation on firm productivity: Evidence from China’s Top 1000 Energy-Consuming Enterprises Program. Appl. Econ. 2020, 53, 830–844. [Google Scholar] [CrossRef]
- Moser, P.; Voena, A. Compulsory licensing: Evidence from the trading with the enemy act. Am. Econ. Rev. 2012, 102, 396–427. [Google Scholar] [CrossRef]
- Baron, R.M.; Kenny, D.A. The moderator–mediator variable distinction in social psychological research: Conceptual, strategic, and statistical considerations. J. Pers. Soc. Psychol. 1986, 51, 1173. [Google Scholar] [CrossRef]
- Wang, Q.; Chen, X. China’s electricity market-oriented reform: From an absolute to a relative monopoly. Energy Policy 2012, 51, 143–148. [Google Scholar] [CrossRef]
- Del Río González, P. Analysing the factors influencing clean technology adoption: A study of the Spanish pulp and paper industry. Bus. Strateg. Environ. 2005, 14, 20–37. [Google Scholar] [CrossRef]
- Xing, Z.; Wang, J.; Feng, K.; Hubacek, K. Decline of net SO2 emission intensity in China’s thermal power generation: Decomposition and attribution analysis. Sci. Total Environ. 2020, 719, 137367. [Google Scholar] [CrossRef] [PubMed]
- Mantovani, A.; Tarola, O.; Vergari, C. End-of-pipe or cleaner production? How to go green in presence of income inequality and pro-environmental behavior. J. Clean. Prod. 2017, 160, 71–82. [Google Scholar] [CrossRef]
Disclaimer/Publisher’s Note: The statements, opinions and data contained in all publications are solely those of the individual author(s) and contributor(s) and not of MDPI and/or the editor(s). MDPI and/or the editor(s) disclaim responsibility for any injury to people or property resulting from any ideas, methods, instructions or products referred to in the content. |
© 2023 by the authors. Licensee MDPI, Basel, Switzerland. This article is an open access article distributed under the terms and conditions of the Creative Commons Attribution (CC BY) license (https://creativecommons.org/licenses/by/4.0/).