Abstract
Yunnan is rich in renewable energy resources. An understanding of its energy structure and developmental trajectories would assist in enabling the design of suitable decarbonizing pathways and how to fit into the national 30–60 agenda. Drawing from endogenous growth theory and time series analysis, our study employs comparative functions and scenario assessments to predict the changes in the key economic indicators, such as GDP, industrial structure shifts, population, and urbanization rates, during the low-carbon transition. We further show energy structure patterns and intensity trends using regression-modeling and data-fitting methods. Based on our analyses, we project that by 2035, Yunnan’s GDP will grow to CNY 5.4761 trillion, with secondary and tertiary industries contributing 88.8%. The population is estimated to grow to 52.08 million with an urbanization rate of 70%. Moreover, fossil fuel energy consumption is forecasted to diminish to 38.7%, and energy consumption intensity is projected to be reduced to 0.38 tons of standard coal per CNY 10,000. If these metrics follow the inherent endogenous growth trend, Yunnan’s emissions are forecasted to peak at around 220 million tons of CO2 by 2030. These findings not only provide a data foundation for Yunnan’s low-carbon development goals but also illuminate pathways for regions rich in renewable resources to transition towards sustainable growth, emphasizing the harmony between advancement and environmental stewardship.
1. Introduction
Restructuring energy systems for low-carbon transition has become a key agenda item for all economies to mitigate climate change [1,2]. It is not merely a matter of technological progression but an inevitable pathway to mitigating the catastrophic impacts of climate change on all societies, necessitating comprehensive integration across sectors and governance levels [3,4]. Beyond the broad strategic outlines, the crux of climate policy integration becomes evident in its tangible enactment, particularly at the subnational level [5,6]. This is where broad strategies confront the complexities of regional specificities, economic contexts, and localized socio-ecological conditions [7,8]. The success of all commitments on climate change often hinges on the subnational entities—cities, provinces, and regions—which are crucial in transforming broad climate objectives into tangible and sustainable actions [9,10].
As the largest carbon dioxide emitter, globally, China stands out among major economies for its ambitious commitment to shift towards low-carbon energy sources [11,12]. In September 2021, China announced to the UN General Assembly its aim to peak its carbon emissions before 2030 and achieve carbon neutrality before 2060 [12]. To achieve these goals, China is undergoing significant energy transitions [12,13]. Subnational governments, notably provincial administrations, are crucial for the implementation of energy transition and emission reduction strategies in China [13]. The central government’s strategy of allocating differentiated emission targets to provinces, as illustrated in the 13th Five-Year Plan, underscores the importance of regional capacities and specificities [13,14]. Each province is tasked with formulating and implementing tailored strategies to achieve these goals, factoring in regional strengths and challenges. Given the varied energy transition strategies across the provinces—from the emphasis on wind and solar in the northwest to hydropower in the southwest—the role of provincial governments in China’s sustainable energy paradigm is undeniable [13,14]. China adopts a command-and-control approach to allocate policy goals of emissions reduction and energy structural change and enable each province to achieve the goals allocated [13,14].
Situated in China’s southwest, Yunnan is characterized by its abundant coal resources and scant oil and gas reserves [15]. Within China’s framework of quota allocation for emissions to provincial governments, Yunnan serves as a crucial case study in understanding provincial-level contributions to national decarbonization objectives. Its unique geography and resource allocation demand specialized energy tactics that align with broader national directives [11,16]. As China shifts to a sustainable energy framework, examining Yunnan’s strategic choices is vital to achieve understanding of the depth and breadth of the country’s ambitious energy transformation.
Until 2013, coal consumption in Yunnan constituted over 50% of the province’s total energy consumption, but this proportion has hovered around 40% in the past decade [17]. Notably, Yunnan has prominent renewable energy reserves: its hydropower resources and photovoltaic (PV) installed capacity exceed more than 100 million kilowatts [17]. By the close of 2020, Yunnan’s installed hydropower capacity had surpassed 75 million kilowatts, with hydropower accounting for 70% of the province’s total power generation capacity. Furthermore, renewable energy contributed to over 80% of total power generation, consistently supplying green power to Yunnan and neighboring provinces, such as Guangdong [18,19]. Given the growing concerns in China generally about air pollution and carbon emissions from fossil fuel consumption, Yunnan faces the challenge of decarbonizing its energy structure: how can Yunnan adjust its energy structure to foster sustainable development matters for the province, the surrounding regions and China.
The primary source of Yunnan’s carbon emissions comes from fossil fuel energy consumption, with economic, social, and technological factors influencing energy demand. From our preliminary research [11], we identified GDP and industrial structure as the main economic determinants with population and urbanization rates as the primary social factors and energy consumption composition and intensity as the chief technological drivers. Using data from the China Energy Statistical Yearbook, Yunnan Statistical Yearbook, and the National Bureau of Statistics for the period between 2000 and 2019 [20], we assessed the evolution of the these factors and projected their status up to 2035 using the endogenous growth theory. Additionally, employing a carbon emission model developed by our team based on the production function theory, we integrated the forecasted values of each parameter. This allowed us to estimate Yunnan’s future carbon emissions under a business-as-usual trajectory, thereby providing foundational data for subsequent analyses and projections. This comprehensive analysis of Yunnan’s energy and carbon dynamics bridges the gap between traditional metrics and emerging trends. Drawing on historical data, we link Yunnan’s energy consumption and carbon emissions to parameters like GDP and urbanization, offering a more informed prediction for future trajectories.
2. Materials and Methods
2.1. Time Series Analysis
According to the preliminary studies undertaken by the research group, in this paper, we applied time series analysis to evaluate and predict Yunnan’s economic, social and technological indicators. Time series analysis is a branch of statistics analyzing data that changes over time, including statistical analysis, statistical modelling and inference, and optimal prediction, control and filtering of random sequences [21]. A time series is formed when a series of random variables are indexed by time. Time series data have the characteristic of dynamic and random changes and have some correlation with time. By applying an appropriate model and satisfying specific precision requirements, the characterization of the time series can be performed [22]. The seven models used in this paper are as follows. In the equation, t represents time, t0 represents the initial time; y represents the random variables, y0 is the initial value.
Linear model:
a, b are constants, c represents the rate of change
Exponential model:
Hyperbolic decay model:
n is the decline exponent, ; is the initial decline rate.
Harmonic decay model:
The harmonic decay model is the case of n = 1 in the hyperbolic decay model
Logistic function model:
Gompertz function model:
It indicates a state in which the growth rate first slows, then accelerates, and eventually slows down.
Polynomial model:
a, B1, B2 and B3 are constant coefficients.
2.2. Carbon Emission Measurement Model
According to the preliminary research results, in this study, we adopt the production function to measure the carbon emissions in Yunnan, and the mathematical expression is:
In terms of carbon emissions, there is more than just a simple linear relationship between them and the drivers. For instance, some regions show an inverted U-shaped relationship between carbon emissions and GDP, while others show a linear or N-shaped pattern. Therefore, in order to represent the complex coupling more precisely between carbon emissions and the drivers, carbon emissions and the drivers are considered as product output and factors of production separately. Wu et al. (2019) [23] describe them using a total factor production function as follows:
In this equation, Q represents the carbon emissions; X represents the drivers; a, b…m are the index of the functional relationship between carbon emissions and each driver; C0 is the constant term; ε is the error term. According to endogenous growth theory, assume that the driver , a generic model for carbon emissions on the basis of production function theory can be obtained as:
In this equation, n represents the driver index, normally a natural number no greater than 6; C0 is the integrated revised constant of the model; C1, C2, …, Ct are the revised constants of the driving parameters; a, b…m, etc., are the undetermined parameters which can be obtained by multiple linear regression; lnε is the error term, and can be ignored. In fact, when the integrated revised constant of the model C0 equals 1 and the index of each driver is 1 regardless of its revised constant, if Q is considered to have a linear relationship with each driver (that is, a, b, c = 1), the above equation can be transformed into IPAT model or ImPAT model, depending on the different drivers considered. On the other hand, if an undetermined mathematical relationship exists between Q and each driver, the above equation can be transformed into the STIRPAT model. In other words, the classical IPAT, ImPAT and STIRPAT models of carbon emissions can be derived from the generic model, proving the generic model’s practicability. By simultaneously taking logarithms from both sides of the generic model and organizing them, we can obtain the equation as follows:
Since social-economic development and fossil-fuel exploitation are the main drivers leading to the increase in carbon emissions, in the model, GDP and industrial structure (IM) are used to represent the indicators of economic development drivers; population (P) and urbanization rate (UR) represent the indicators of social drivers, and energy structure (ES) and energy intensity (EI) are used to represent the indicator of energy drivers. In particular, carbon emissions per capita (Qp) and GDP per capita (A) are used to describe the results in order to make them more comparable. It is generally considered that the relationship between carbon emissions and factors such as industrial structure, energy structure and energy intensity is mostly linear, which means the corresponding driver index is 1. However, in others, this relationship can manifest in more complex patterns like inverted U shapes, N shapes, or M shapes. These varied patterns highlight the multifaceted impacts of economic development on emissions, with some regions initially increasing emissions with growth and then decreasing as they reach higher income levels (inverted U shape), or going through multiple cycles of increase and decrease (N or M shapes). Such variations emphasize the importance of allowing our model to account for different driver indices ranging from 1 to 4, ensuring its applicability across diverse economic contexts. Meanwhile, carbon emissions per capita show either a positive or negative correlation with the urbanization rate. Thus, the driving index of the urbanization rate is assumed to be equal to 1 or 2. Accordingly, the model equation is obtained as:
3. Results
3.1. Gross Regional Product and Industrial Structure
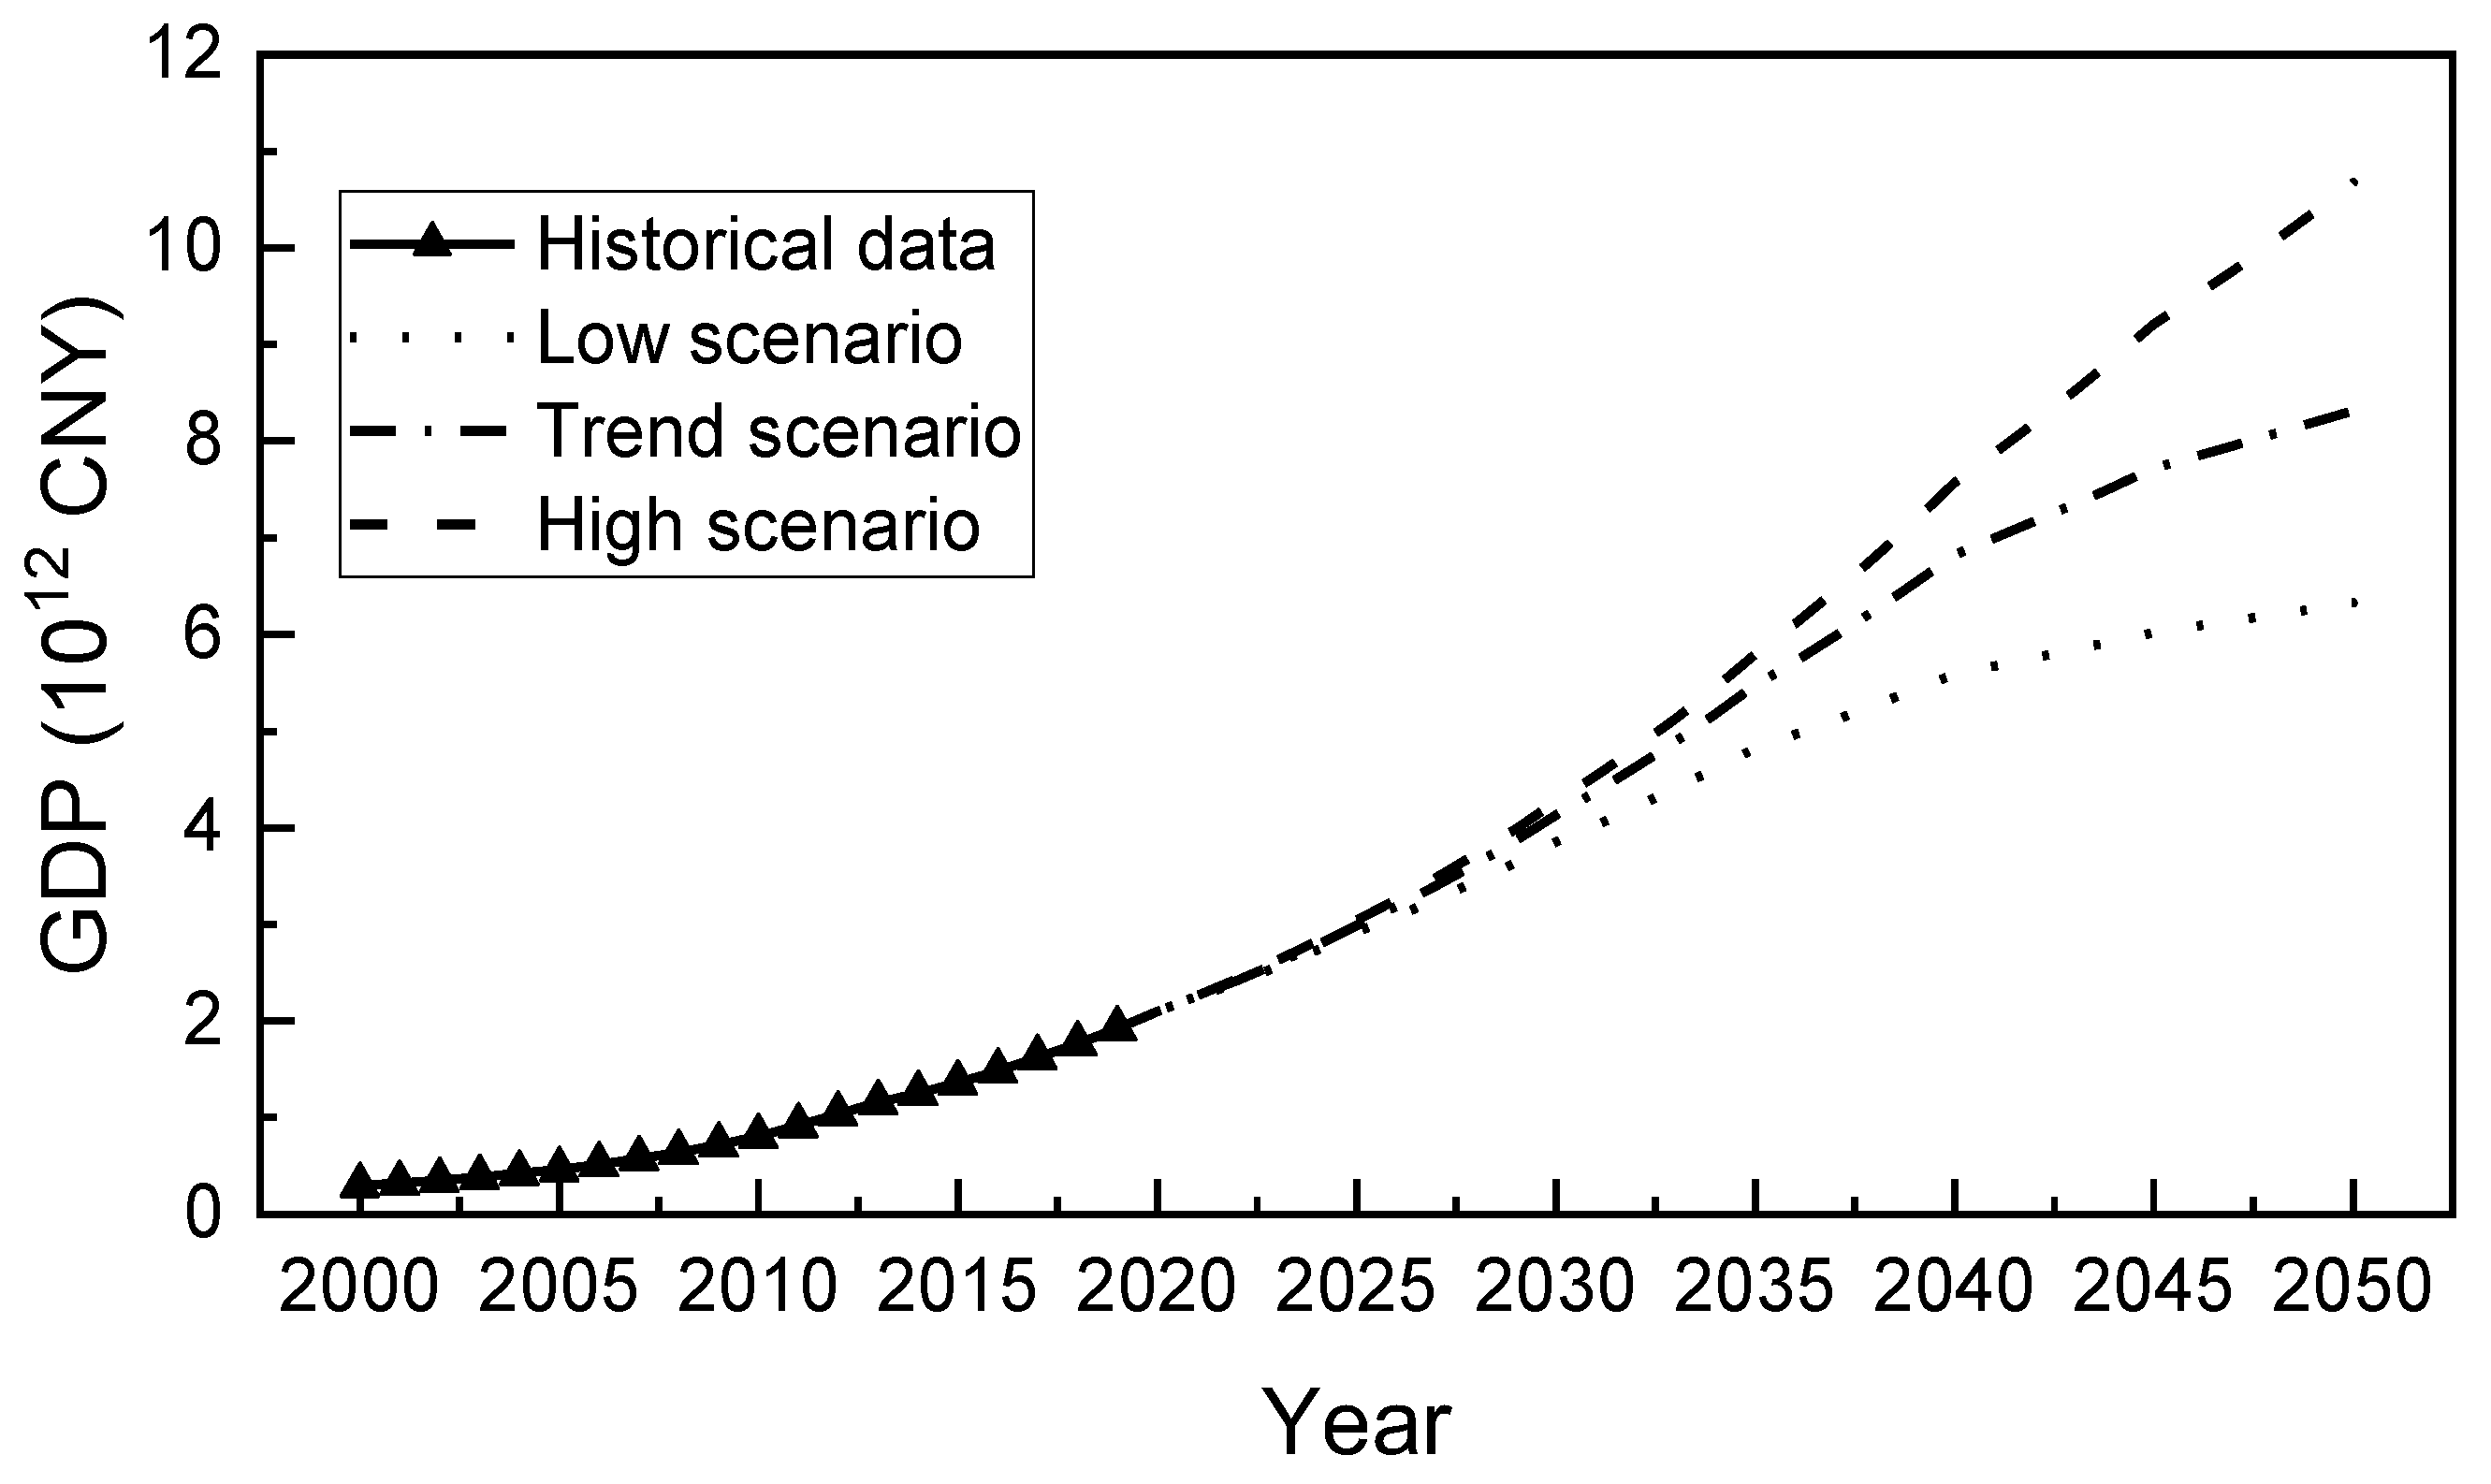
Since its reform and opening-up, Yunnan has undergone rapid economic growth. Nonetheless, Yunnan’s total economic volume and GDP per capita remain below the national average. In 2019, Yunnan’s GDP stood at CNY 1.9189 trillion, representing just 2.3% of the total national GDP, falling short of the 13th Five-Year Plan’s target. The economic trajectory of 2020 was clouded by the COVID-19 pandemic, and no specific growth targets were set. However, Yunnan reported a GDP of CNY 1.1 trillion in the first half of the year, suggesting a promising upswing for the latter half. Consequently, we project a regional GDP of 2.1 trillion for Yunnan by the close of the 13th Five-Year Plan. During the “12th Five-Year Plan” and “13th Five-Year Plan” periods, Yunnan’s average annual GDP growth rates were 11.2 and 9.1%, respectively. As economic development turns into a new normal, the economic growth rate of Yunnan Province is gradually slowing down; therefore, it is reasonable to set the GDP growth rate between 6 and 8% for 2020~2030. Using 2015 as our reference year, we employed compound average growth rate analysis in stages to predict the GDP development in Yunnan using three scenarios with a 5-year cycle (Figure 1). The projection shows that by 2035, Yunnan’s GDP will be CNY 4.8207 trillion, CNY 5.4761 trillion and CNY 5.7927 trillion for low, trend, and high scenario conditions, respectively (Figure 1).

Figure 1.
Forecast of GDP growth trend in Yunnan Province.
Against the backdrop of advancing the “Belt and Road” construction, Yunnan capitalizes on its strategic geographic placement. It has been transformed from a remote border to a frontier of opening up to the outside world. Serving as a corridor to South and Southeast Asia, Yunnan is becoming increasingly interconnected and cooperative with its neighboring nations. Within the Yangtze River Economic Belt, Yunnan not only acts as a crucial ecological barrier in the upper reaches but also a proving ground for unique industrial pursuits and a comprehensive pilot for modern urbanization. In essence, while Yunnan possesses immense economic potential, it is simultaneously shaped by factors like geographic constraints, cultural nuances, and historical foundations. Consequently, this study posits that the trend scenario resonates more closely with Yunnan’s prospective development trajectory.
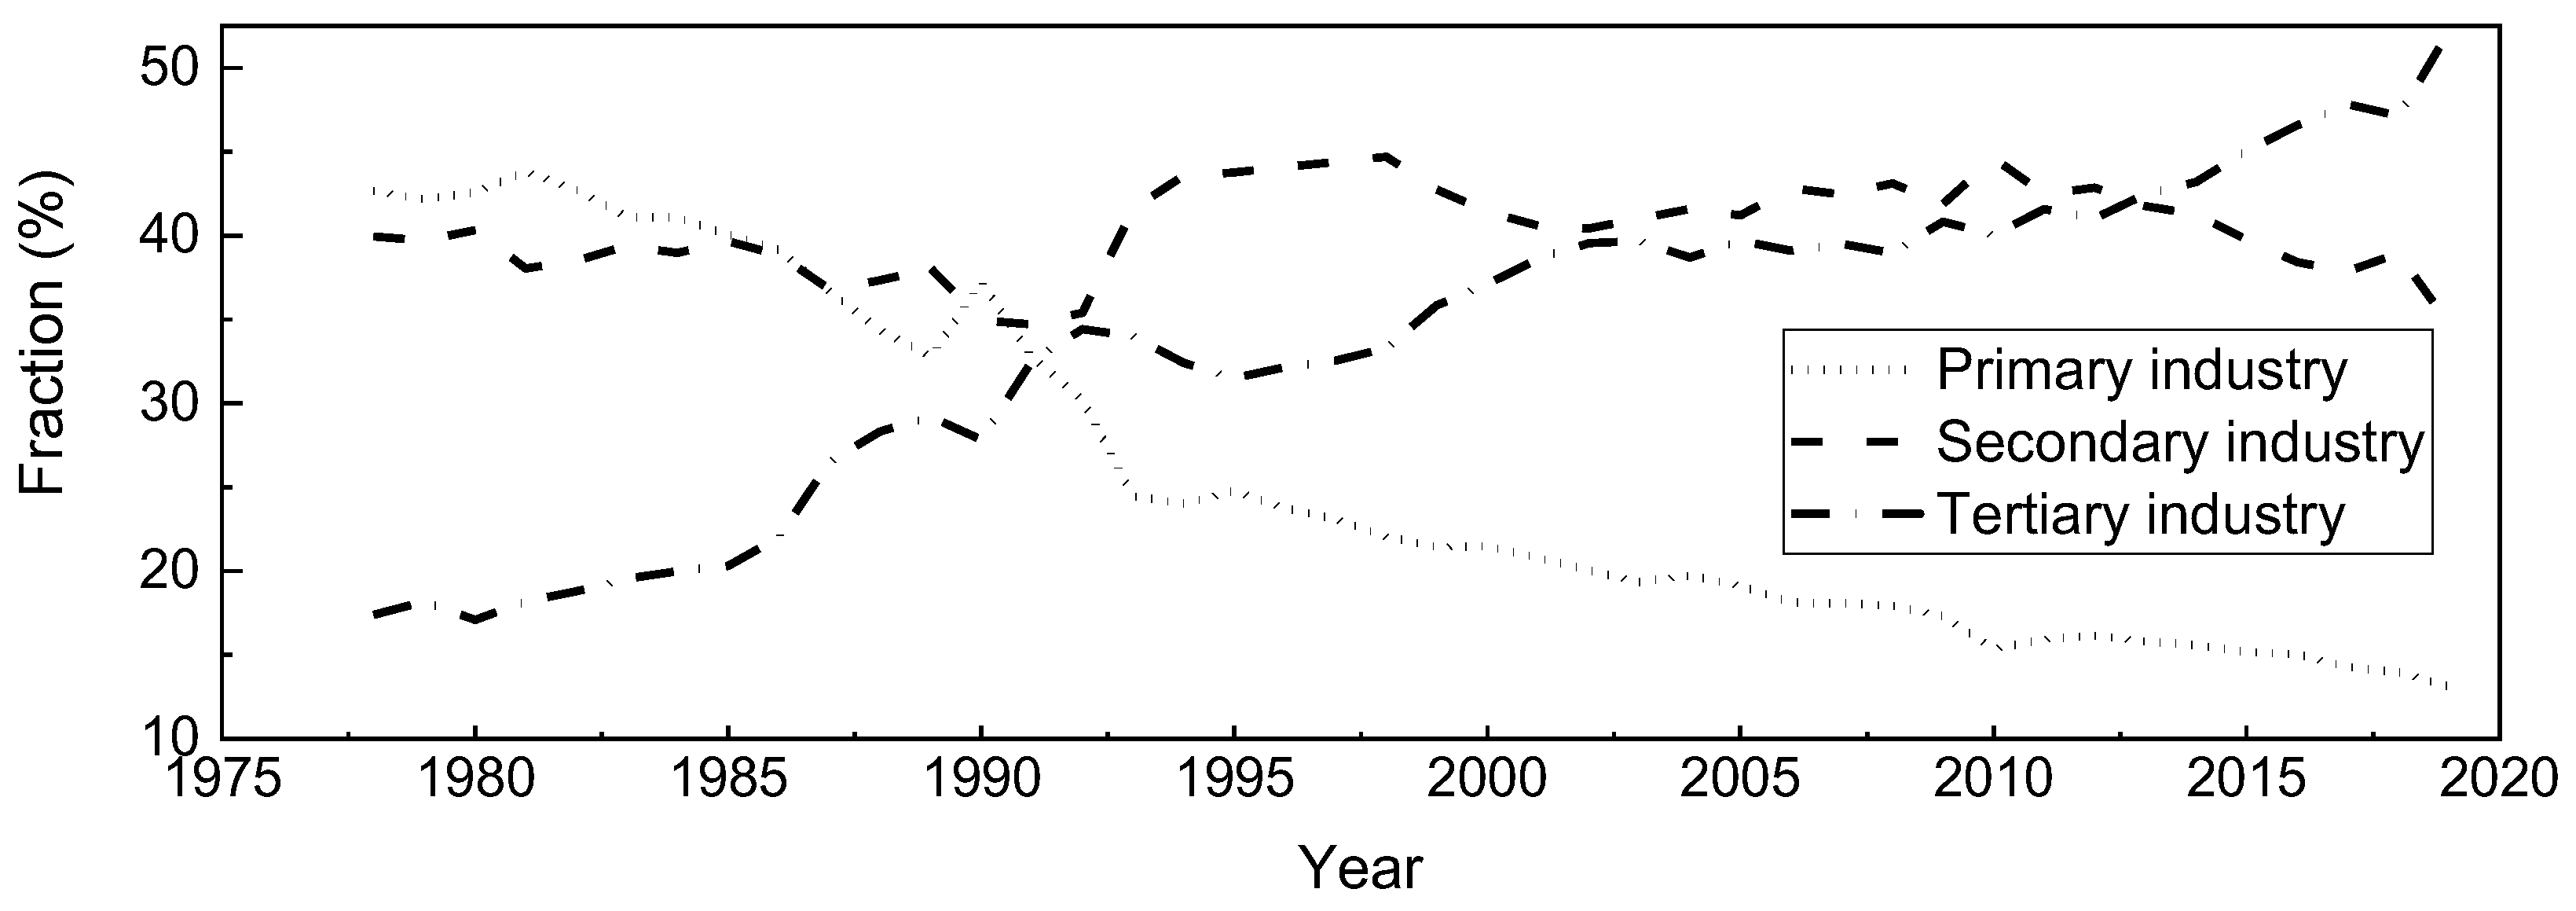
The term “industrial structure” denotes the linkage and proportional dynamics between or within economic sectors [24]. This paper mainly focuses on the relationships among the primary, secondary, and tertiary sectors. Given the pivotal role of the secondary and tertiary sectors in energy consumption, we use the proportion of the sum of the secondary and tertiary industries “value-added” in GDP to represent the industrial structure (Figure 2).
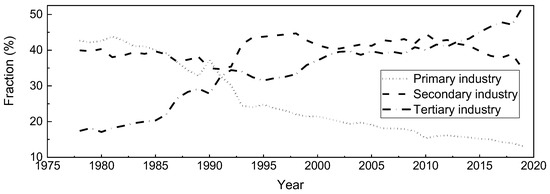
Figure 2.
Changes in the industrial structure and industrial output.
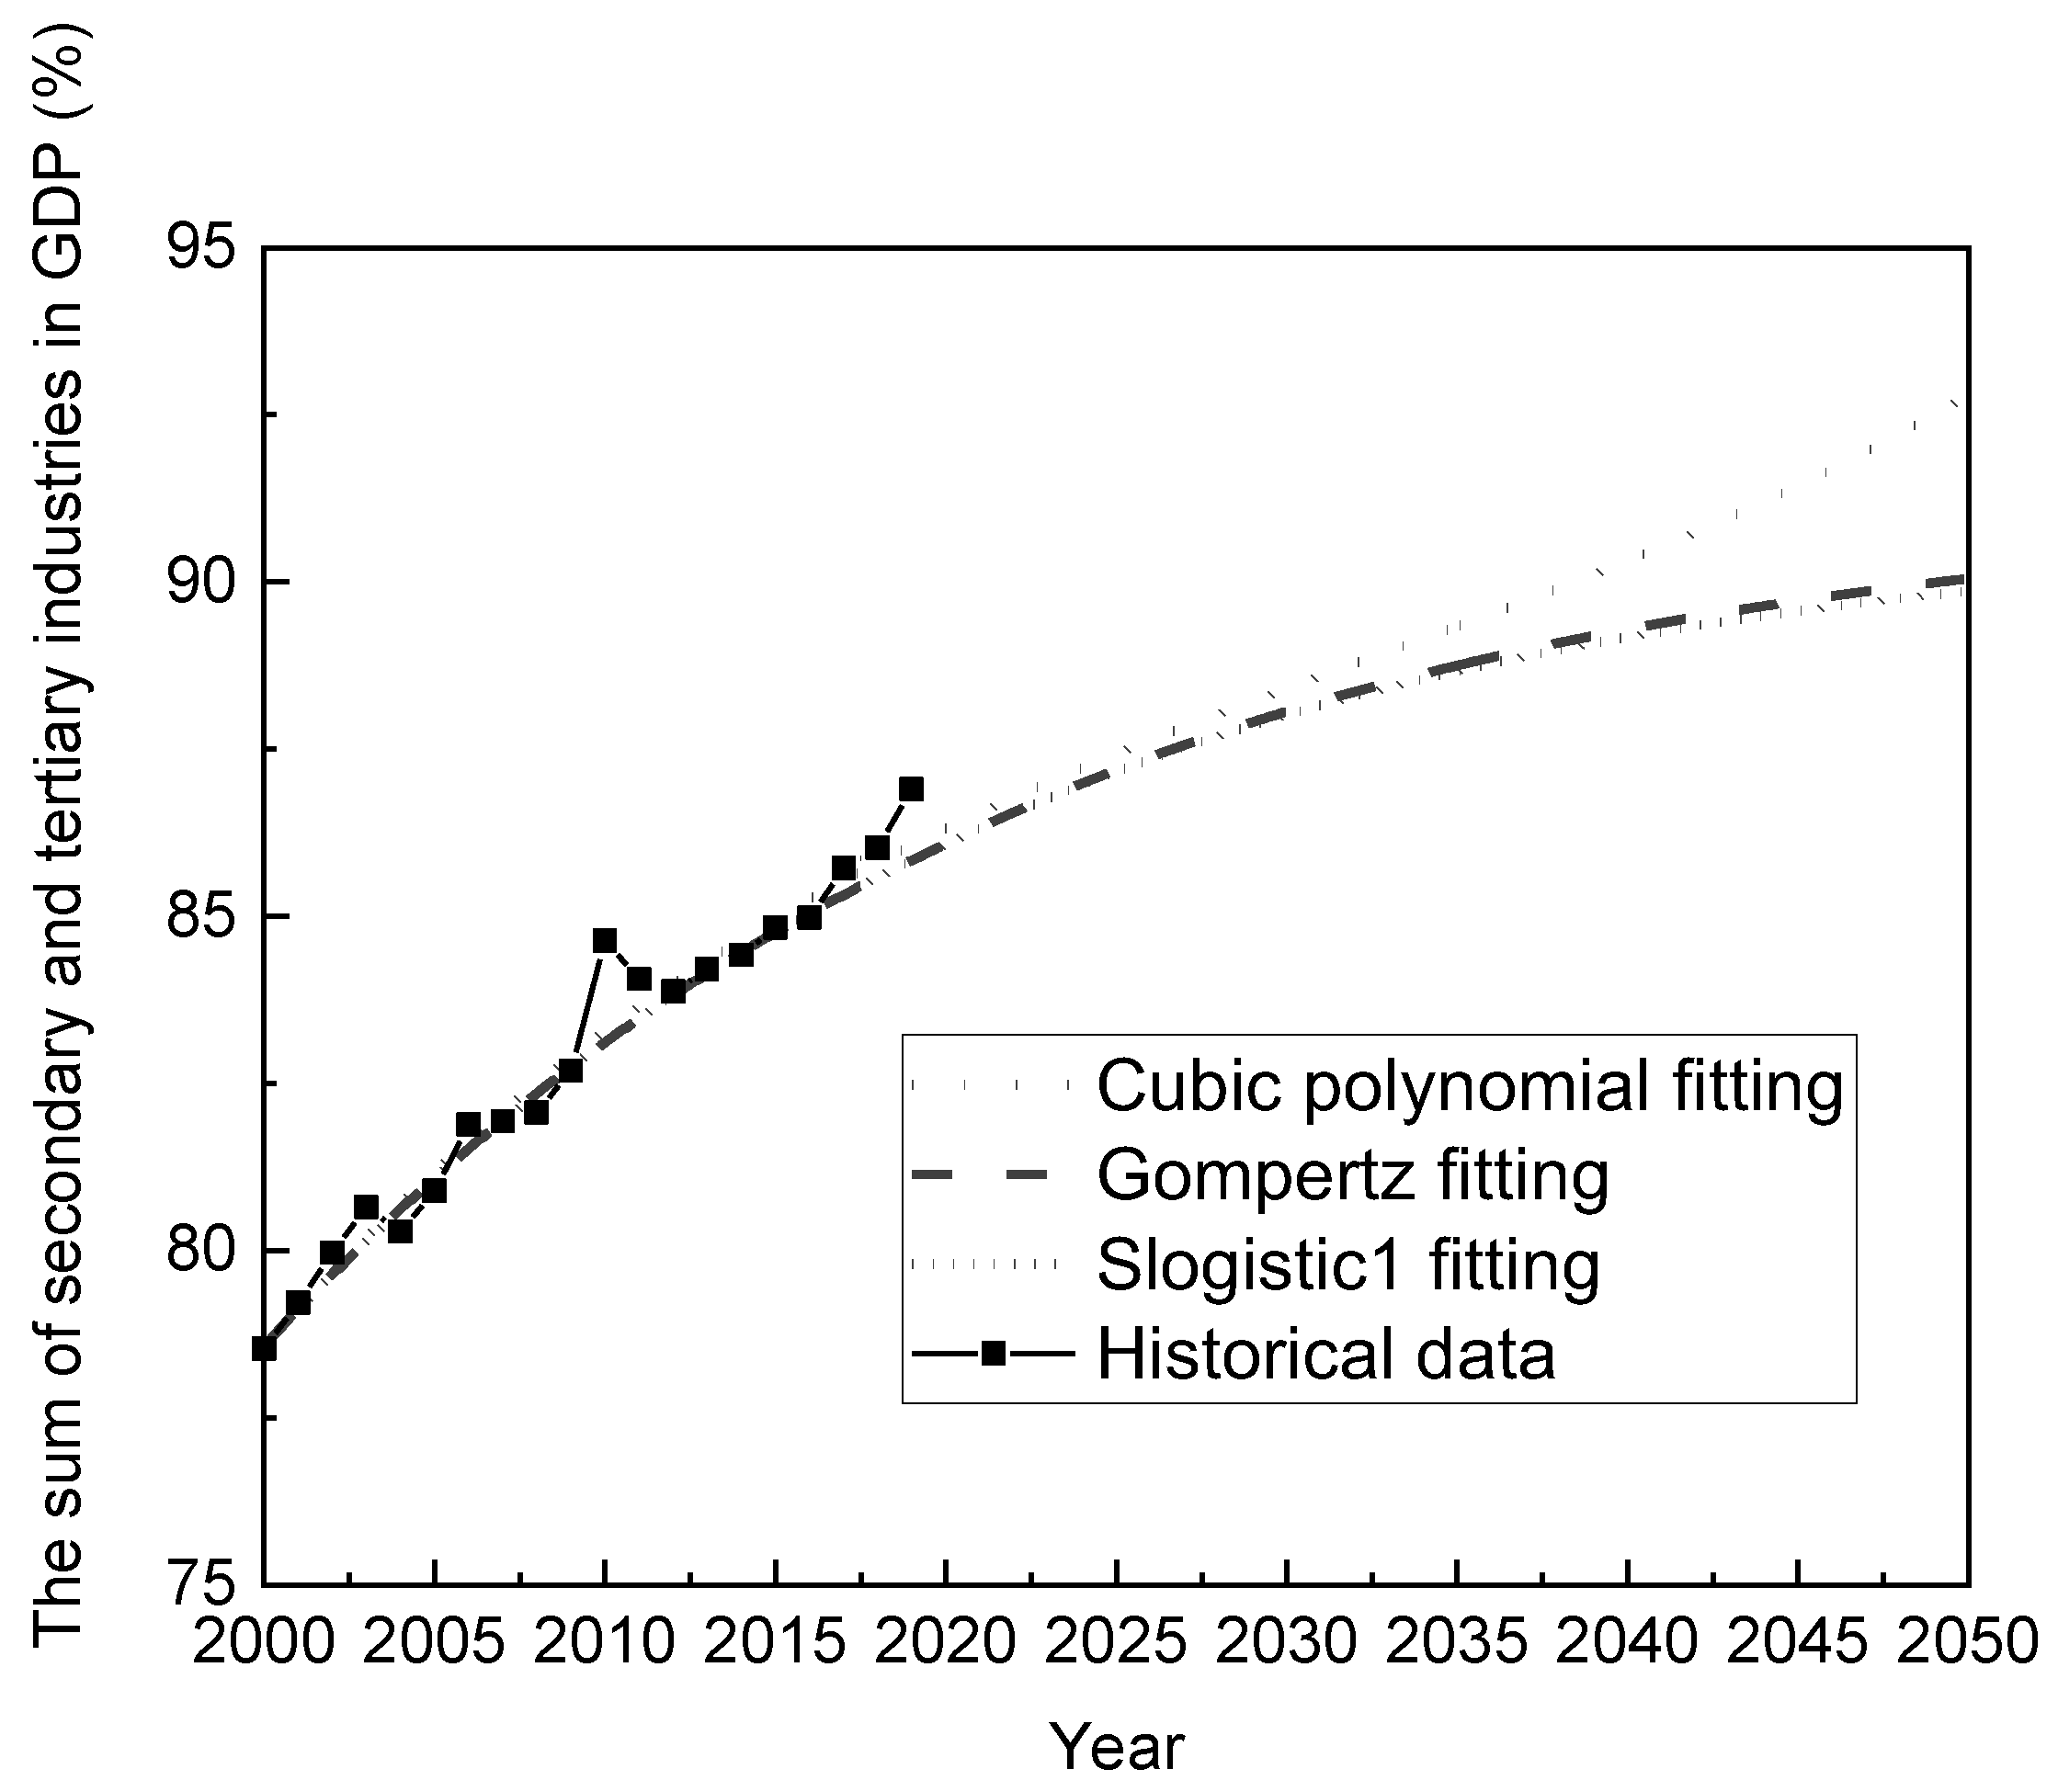
As the urbanization in Yunnan continues, the GDP contribution from primary industry is expected to recede. Concurrently, the combined contributions of the secondary and tertiary industries to GDP will inch closer to encompassing the entirety of the GDP, suggesting an “S”-shaped growth trajectory. In our analysis, we applied the SLogistic1 and Gompertz fittings to Yunnan’s industrial structure, referencing the outcomes from cubic polynomial fittings (see Figure 3).

Figure 3.
Evolutionary trend of industrial structure in Yunnan Province.
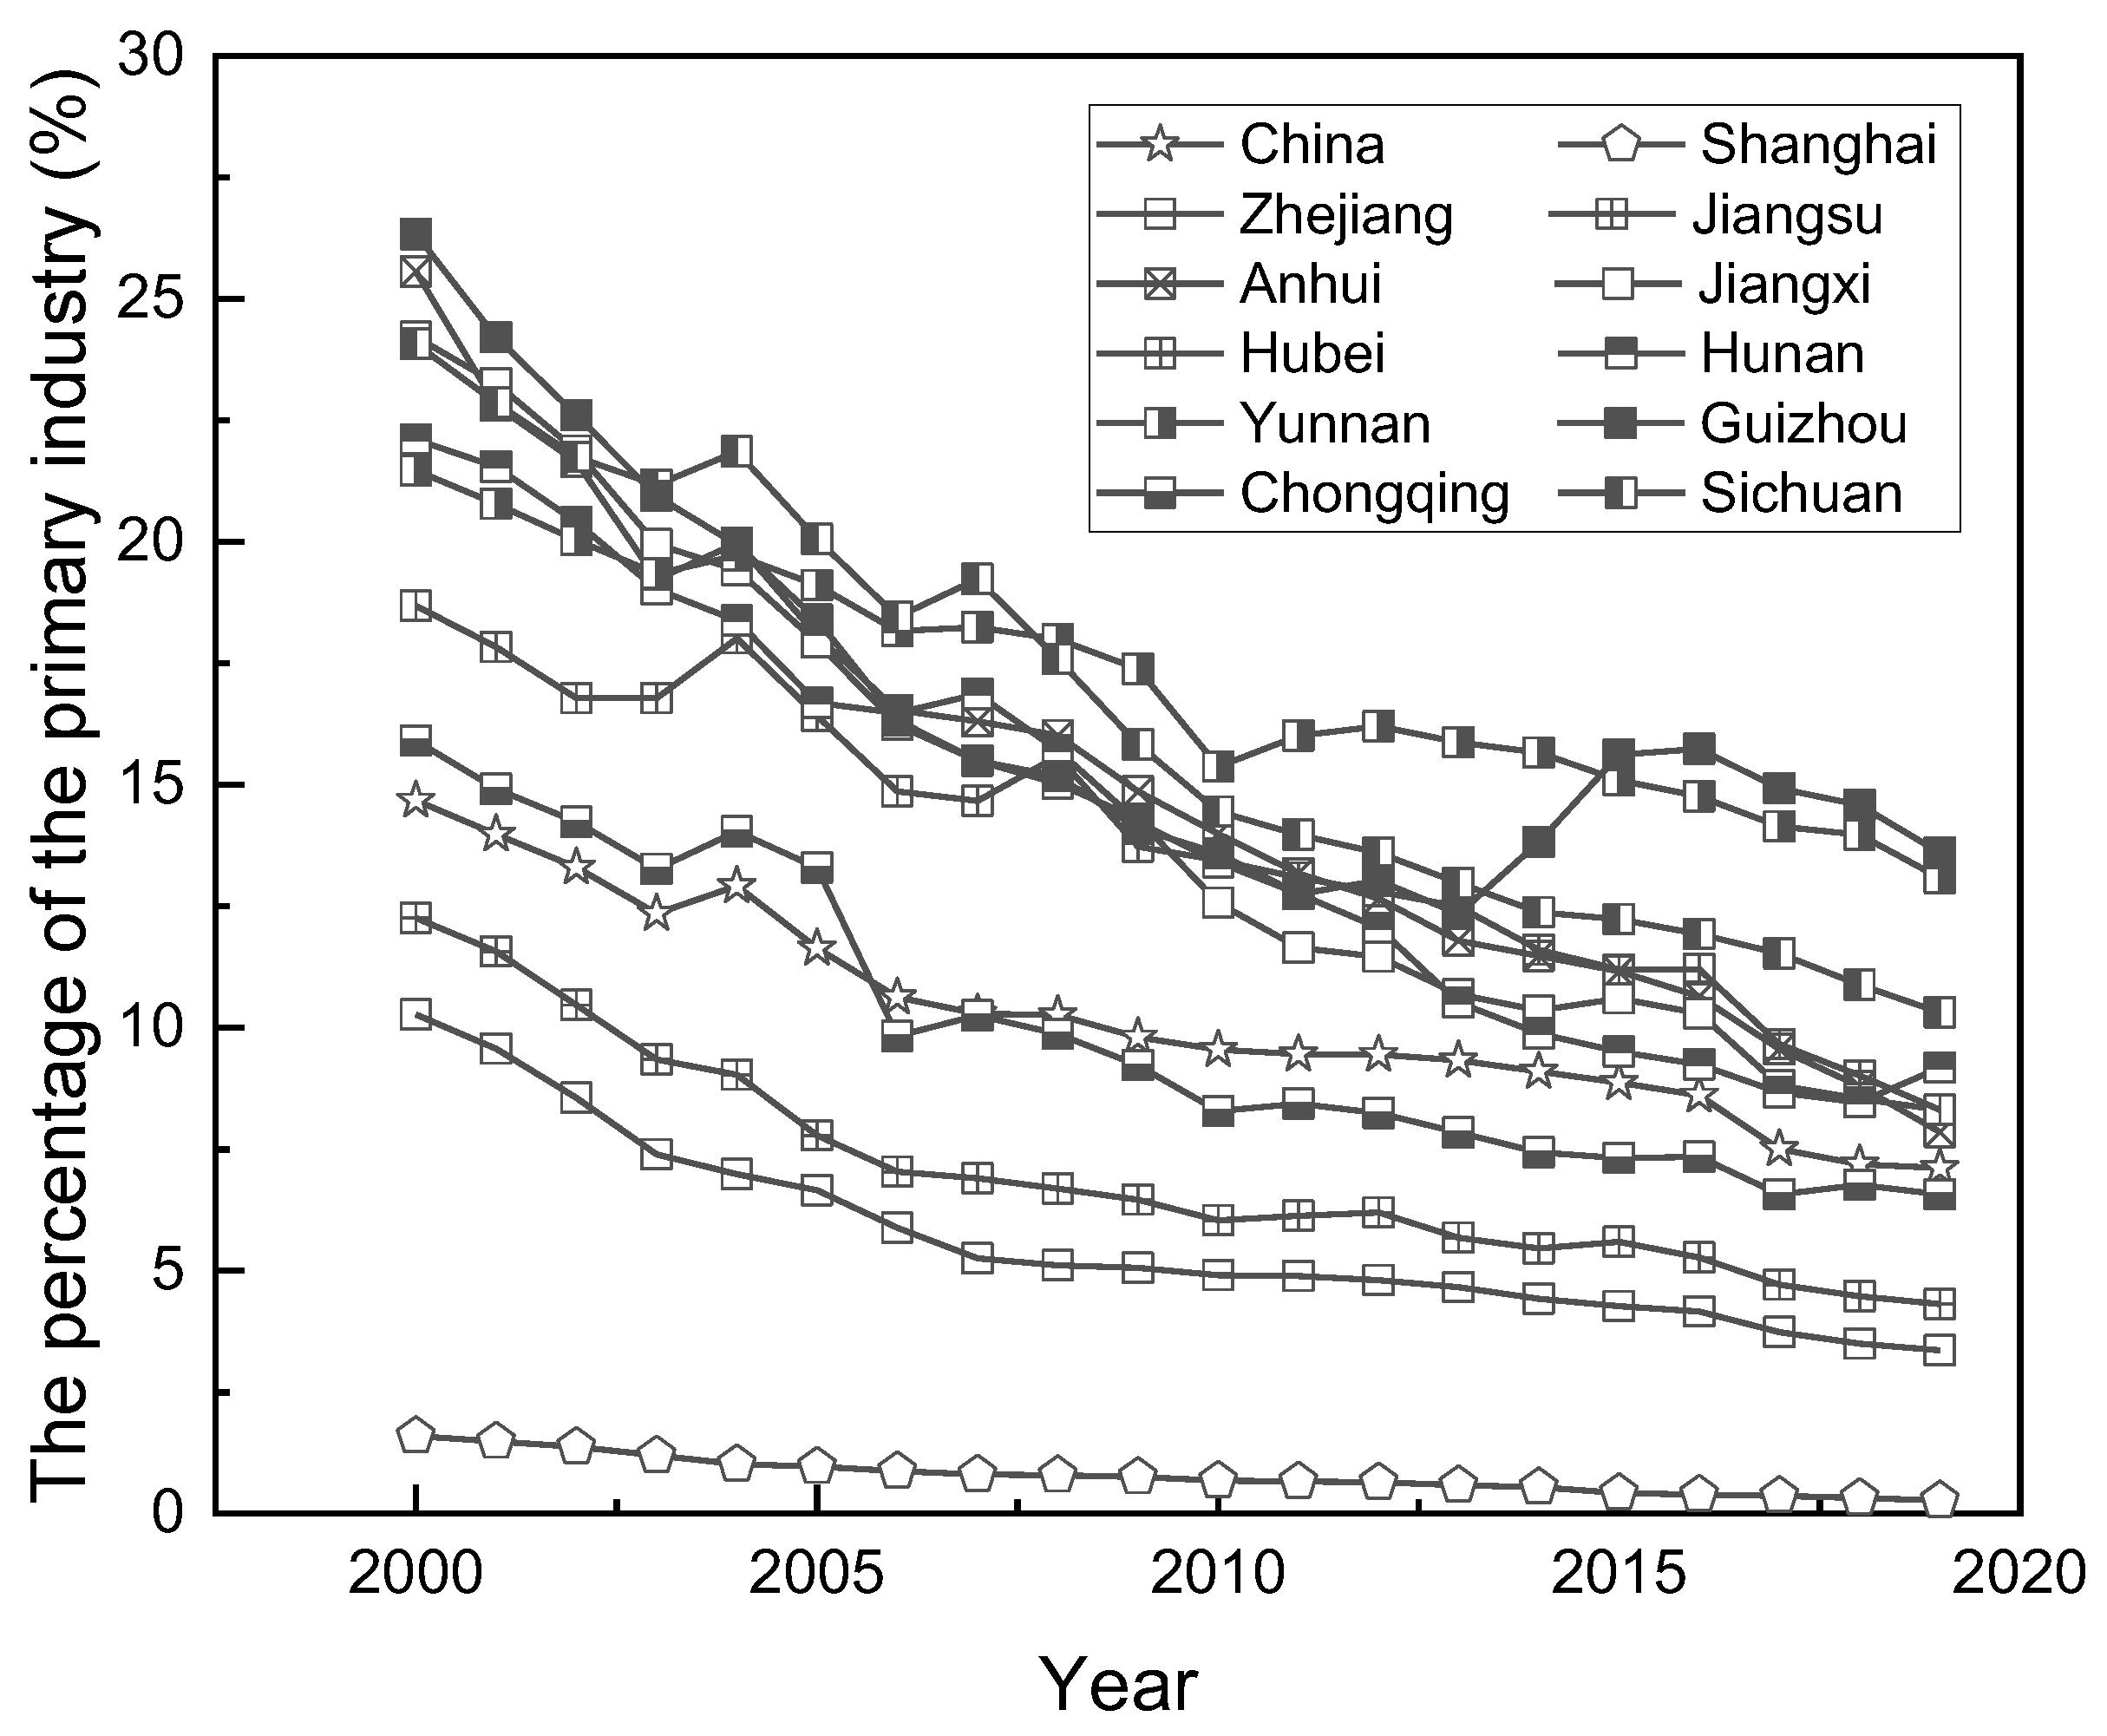
Although tertiary industry now plays a pivotal role in Yunnan’s economic makeup, its representation remains below the national mean. In comparison, well-established economic hubs like Beijing and Shanghai, or globally developed nations, register a scant primary industry contribution, often less than 1%. Meanwhile, provinces within the Yangtze River Economic Belt see their primary sectors contributing between 5 and 15% (Figure 4). Yunnan’s primary industry ranks second in the country in terms of GDP from primary industry. Given that Yunnan has abundant natural resources and is a critical area for agriculture, forestry, animal husbandry and fishery products, the proportion of primary industry cannot reach the same level as the provinces downstream of the Yangtze River. Therefore, in this paper, we consider that SLogistic1 and Gompertz function predictions are more reasonable, which means that the value-added in secondary and tertiary industries will reach 88.8% in 2035 and 90% in 2050.

Figure 4.
The percentage of the primary industry in each province of the Yangtze River Economic Belt.
3.2. Gross Regional Product and Industrial Structure
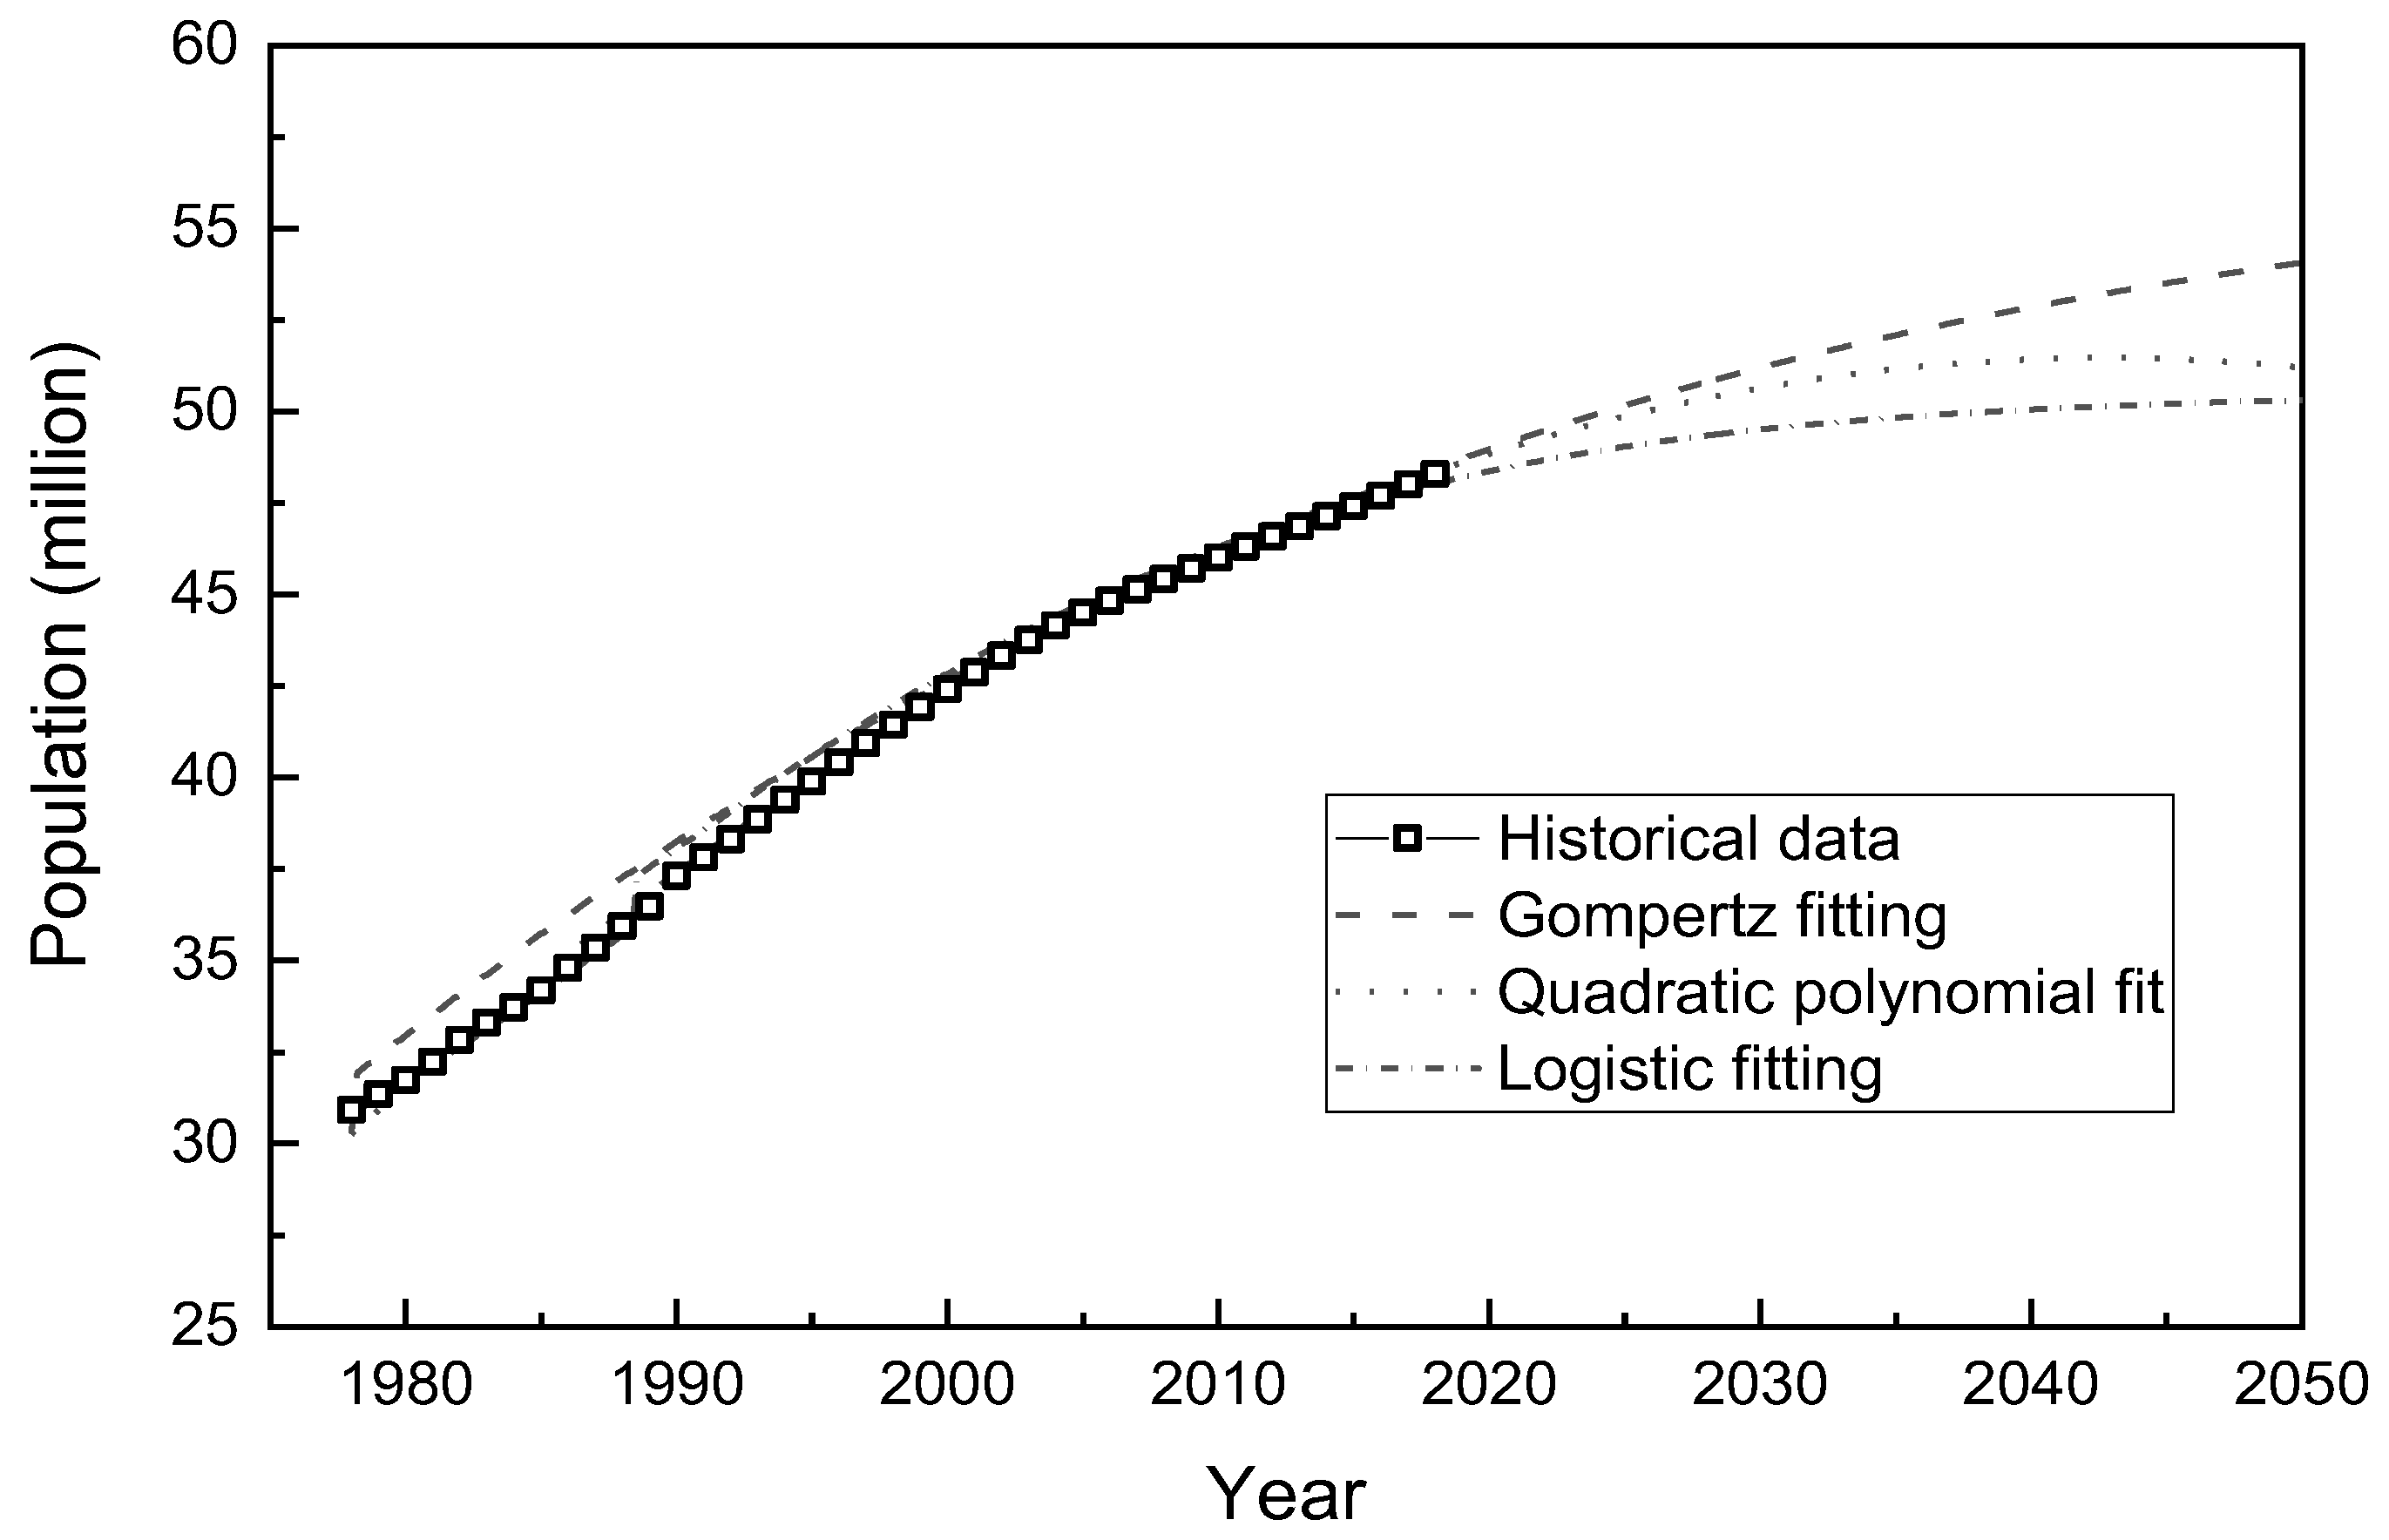
Previous studies have made projections regarding the population trend in Yunnan Province. In 2005, Zhaohe Lv predicted that the population peak of Yunnan would be between 52 million and 56.5 million, occurring in 2038–2045 [25]. An analysis of Yunnan’s population growth rate shows that prior to 2005, the growth rate was consistently higher than 8.0‰; after 2005, the growth rate slowed down and remained around 6 8.0‰. Various mathematical approaches to predicting population size include logistic growth models, regression analysis prediction method, and GM(1,1) gray model method [26]. We choose the logistic function model and Gompertz function model in this paper to predict the future development of population size in Yunnan Province (Figure 5). Since the curve is similar to the shape of the quadratic polynomial, we used the quadratic polynomial fit as a reference.

Figure 5.
Trend of population size in Yunnan.
Under the prediction of the logistic function model, Gompertz model and quadratic polynomial model, the population size of Yunnan will expand to 49.83 million, 52.08 million and 51.16 million, respectively, in 2035. To further calculate the natural population growth rate from 2021 to 2030, the growth rate from the logistic model is only 1.63‰ to 2.94‰, which is too different from the current natural growth rate, the rate calculated by quadratic polynomial simulation is 2.66‰ to 4.38‰, and the value of Gompertz function simulation is 3.81‰ to 4.98‰. Observing the trend of the curve, apart from the quadratic polynomial model that peaks in 2043, both other models do not reach the peak. Currently, the population aging in Yunnan is not severe and continues to enjoy a population bonus at present and for a period of time in the future. It also has the phenomenon of labor migration outflow. Meanwhile, Yunnan’s development potential, talent introduction policy, and favorable ecological environment are attractive to talented people. As a result, Yunnan’s population growth rate will be stable to moderate, with little possibility of a population spike or plunge. In summary, we believe that the Gompertz function model has a more accurate prediction of population size in 2035 but cannot precisely reflect the longer-term population growth trend.
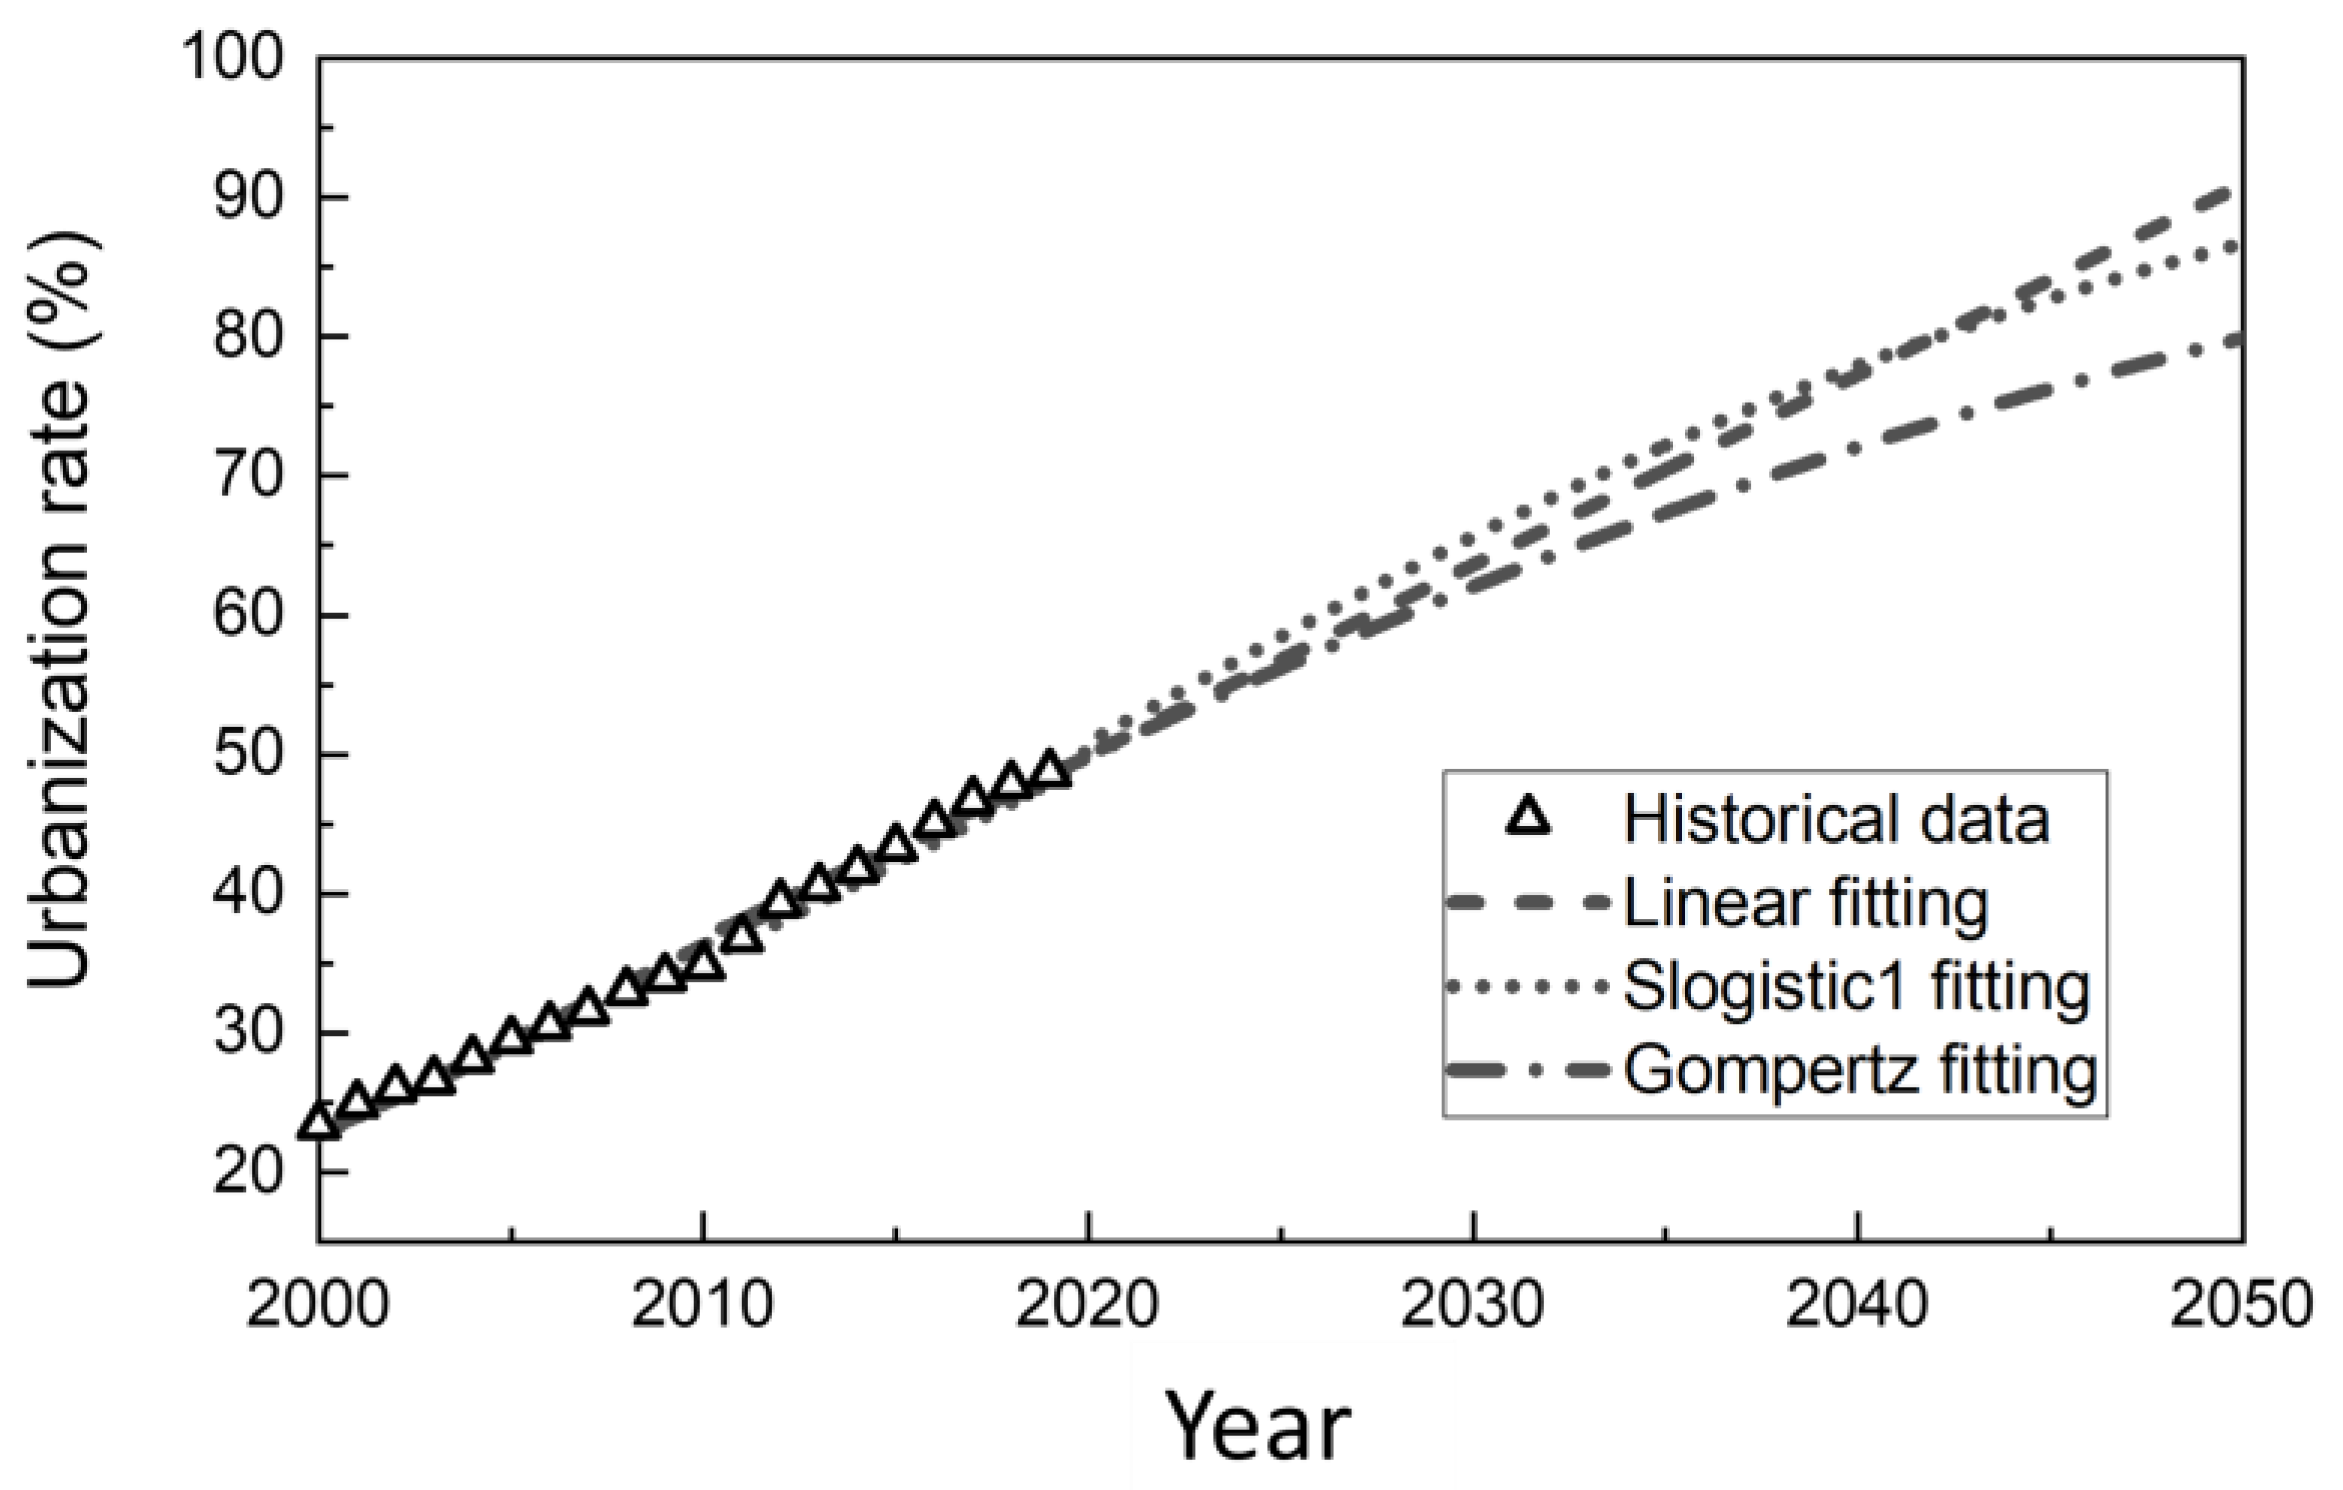
The urbanization rate is an indicator of the pace of urbanization [27]. This paper focused on the urban population ratio to the total (Figure 6). At present, the urbanization process in Yunnan is steadily increasing and is growing linearly, but the overall level of urbanization remains low and is mainly dominated by large cities such as Kunming. Moreover, the overall urbanization rate of the Yangtze River Economic Belt is expected to hit 60% by 2020, while Yunnan has not yet reached this level. Since the development pattern of urbanization follows the “S” type of growth curve, we then applied the widely used SLogistic1 function model and Gompertz function model to predict the future trend of urbanization level in Yunnan.
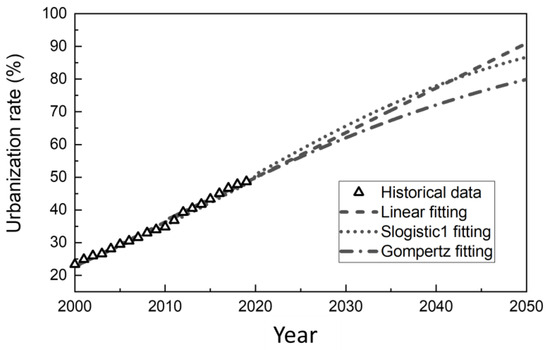
Figure 6.
Trend of urbanization rate in Yunnan.
Currently, Yunnan is following the strategic urbanization pattern of “One district, one belt, five communities, seven corridors” to accelerate the transformation of the migrated agricultural population into urban residents for the promotion of urbanization. According to the “Outline of Urban System Planning in Yunnan Province (2011–2030)”, the urbanization rate is expected to reach 48–50% in 2020 and 60–65% in 2030. In addition, this paper’s simulation results obtained from the three mathematical models for 2030 are all within the planning scope. Above all, combining the calculated results from the model with the provincial development conditions, we predicted that the urbanization rate of Yunnan would be about 70% in 2035.
3.3. Energy Structure and Energy Intensity
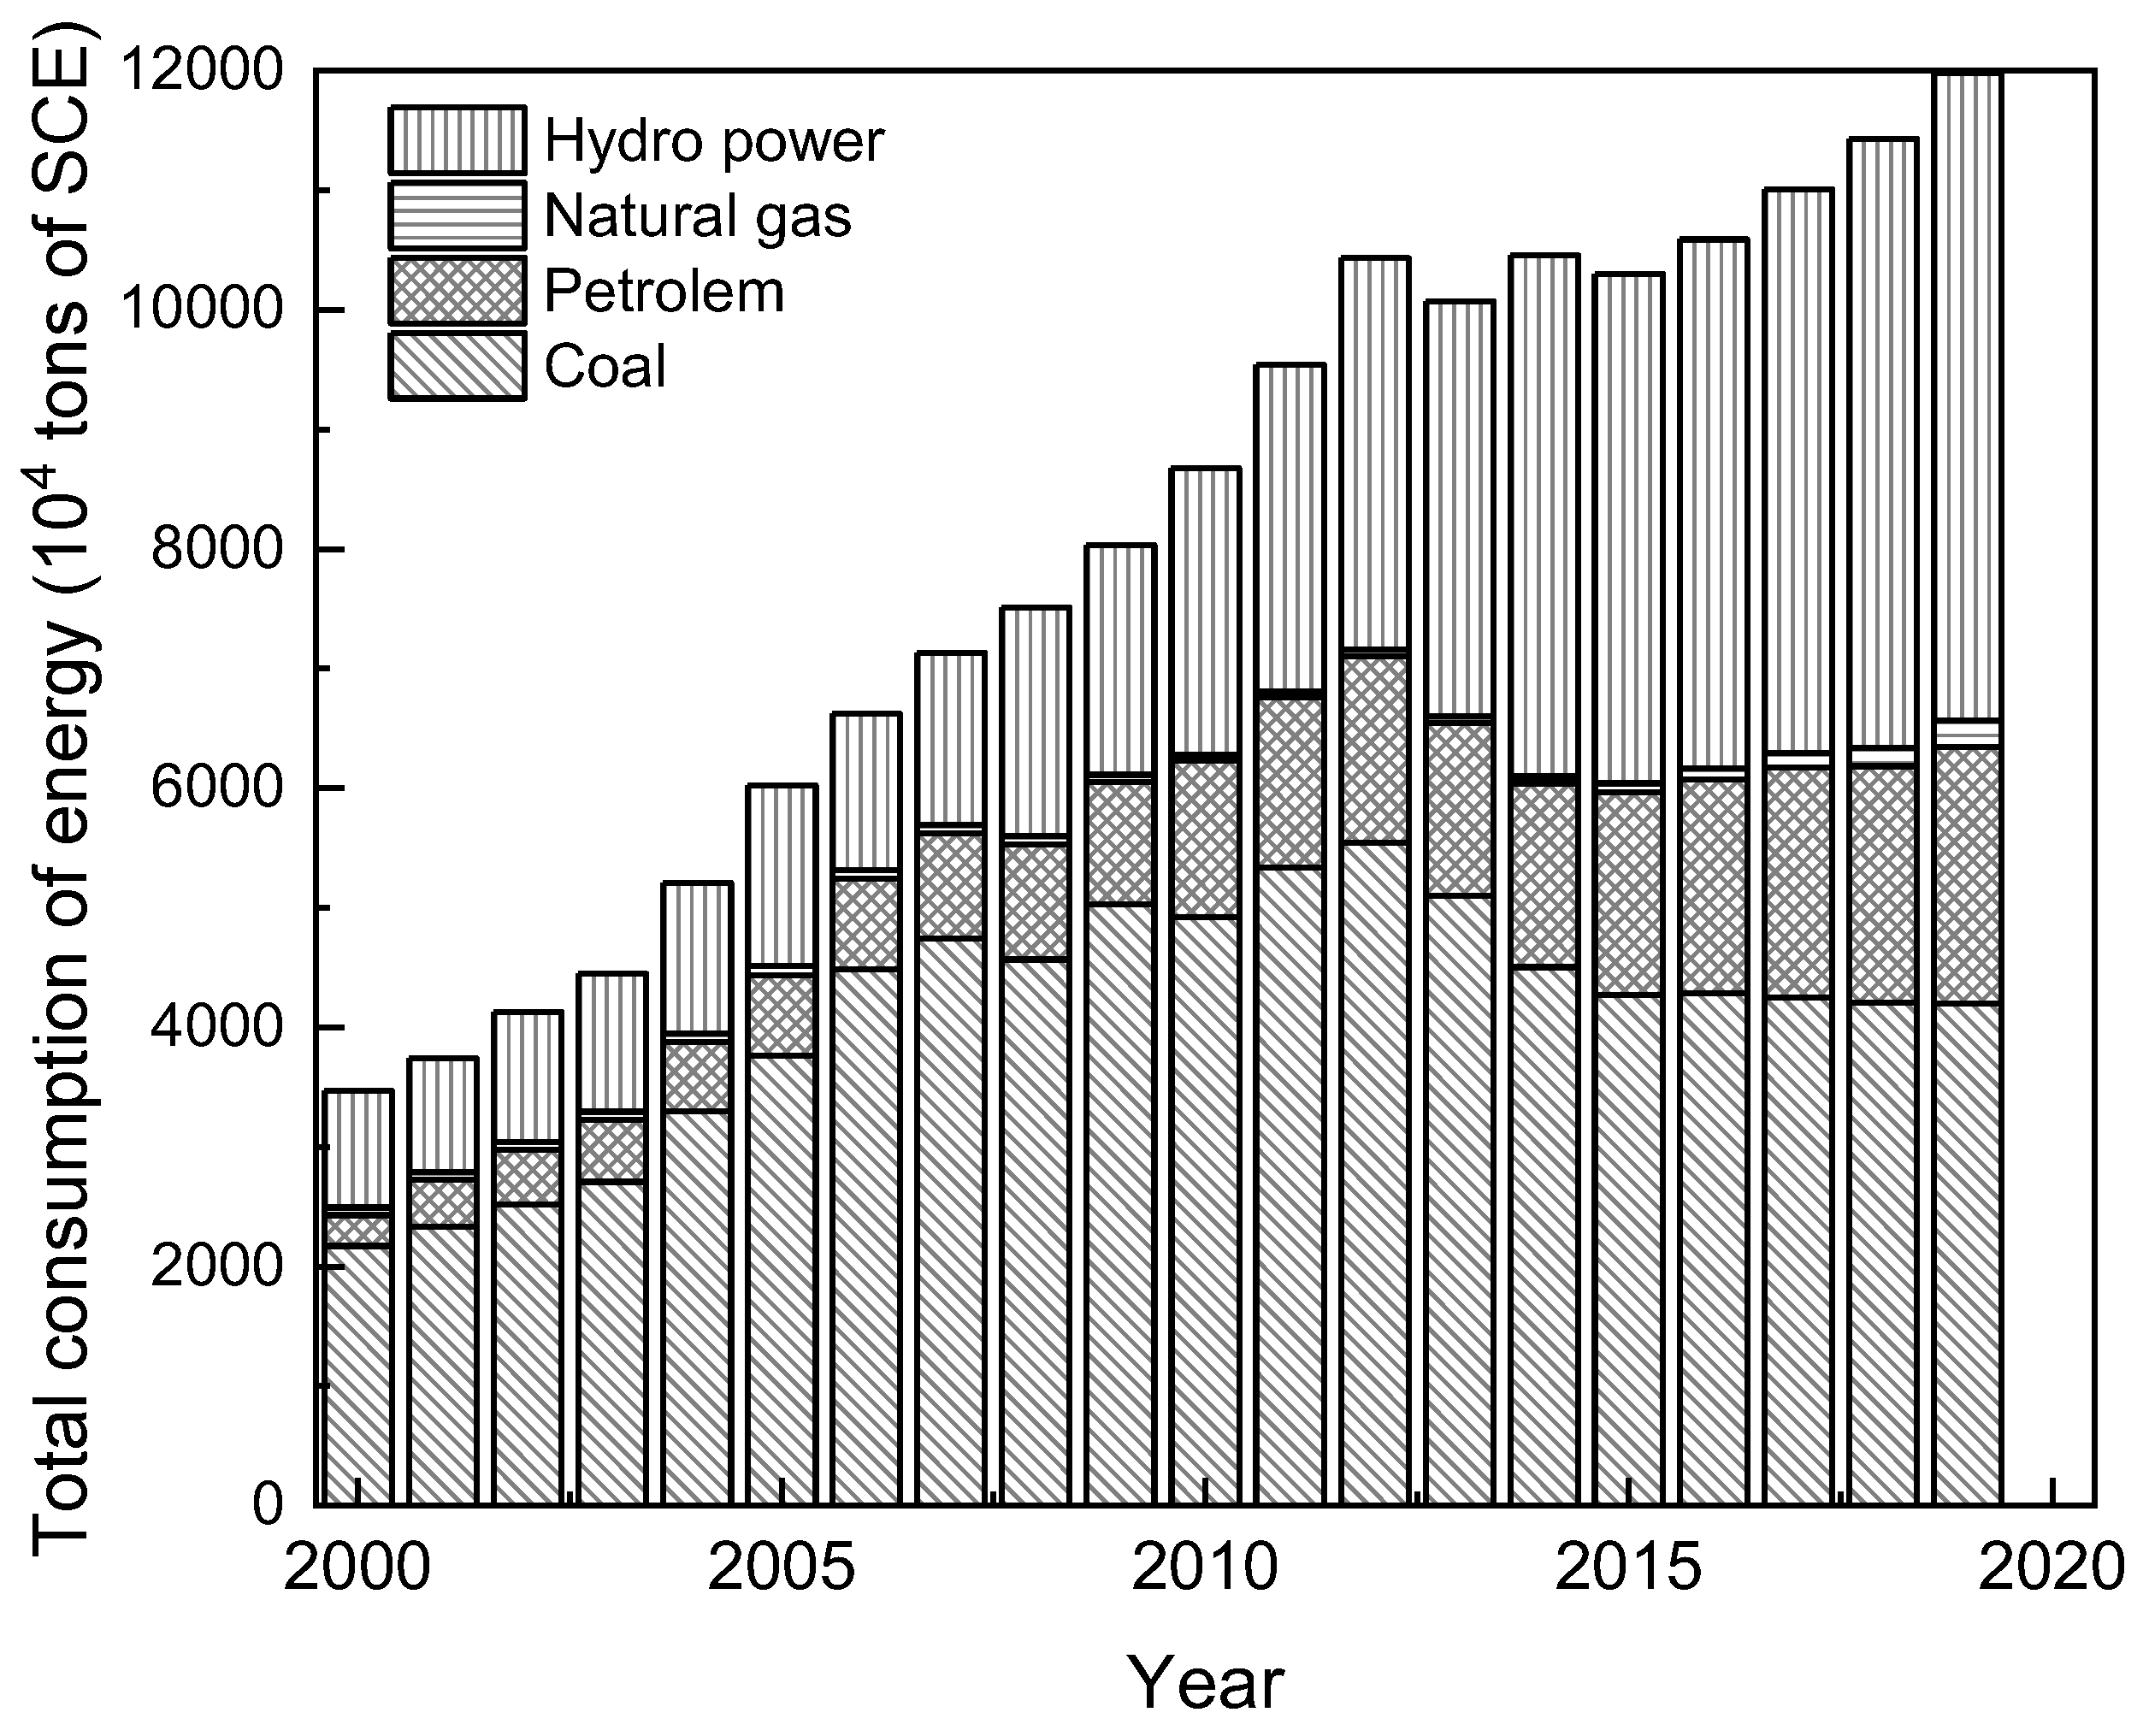
From 2000 to 2011, total energy consumption in Yunnan proliferated at an annual rate of 8–10%, and the growing trend was nearly linear (Figure 7). With a series of strict environmental and energy policies introduced during the 12th Five-Year Plan, the fossil fuel energy consumption in Yunnan has significantly reduced while primary electricity and other energy consumption has increased. As a result, total energy consumption growth has slowed with a growth rate between 3 and 4% from 2016 to 2017. In addition, coal consumption in Yunnan used to reach 68% of the total energy consumption [28]. However, since then, the proportion of coal consumption has been decreasing year by year, with oil consumption slowly increasing. Primary electricity, especially hydropower, has constantly expanded its proportion, providing the cleaner energy structure.
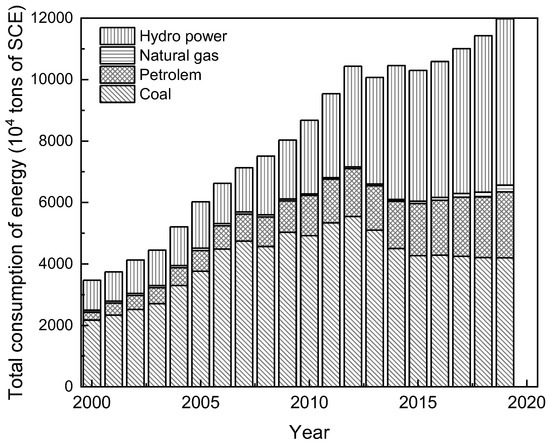
Figure 7.
Energy consumption in Yunnan Province.
By taking the proportion of fossil fuel energy (coal, oil, natural gas) in primary energy consumption as the energy structure, we performed a linear fitting of historical data to predict the energy structure of Yunnan by 2035 (Figure 8). The prediction results show that fossil fuel energy consumption will account for 38.7% in 2035. Data also show that in 2017 the proportion of fossil fuel energy consumption in Yunnan was already lower than the 13th Five-Year Plan target of 56.3%. In fact, the five southwestern provinces account for more than 70% of the nation’s hydro energy resources; in particular, the theoretical reserves of hydro energy resources in Yunnan are 914.421 billion kWh (annual electricity), second only to the hydro energy resources in Tibet and Sichuan. Moreover, Yunnan has a technically installable capacity of 109,139,100 kilowatts, with an annual power generation capacity of 491,881 million kWh (annual electricity), and the technical development capacity is just behind Sichuan. Therefore, Yunnan can theoretically take the lead in the country to implement the primary energy replacement from “coal-based” to “hydropower-based”; hence, the linear fitting is basically consistent with the future development trend of energy structure in Yunnan.
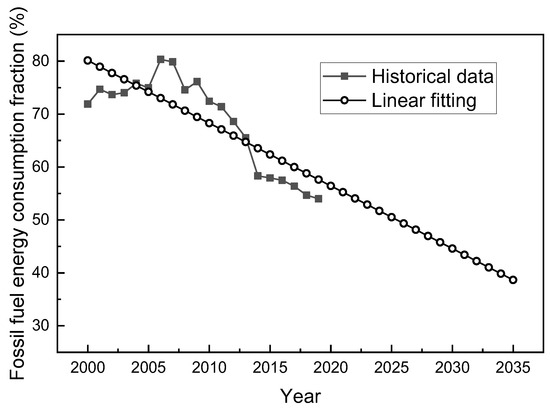
Figure 8.
The evolution of energy consumption structure trends in Yunnan.
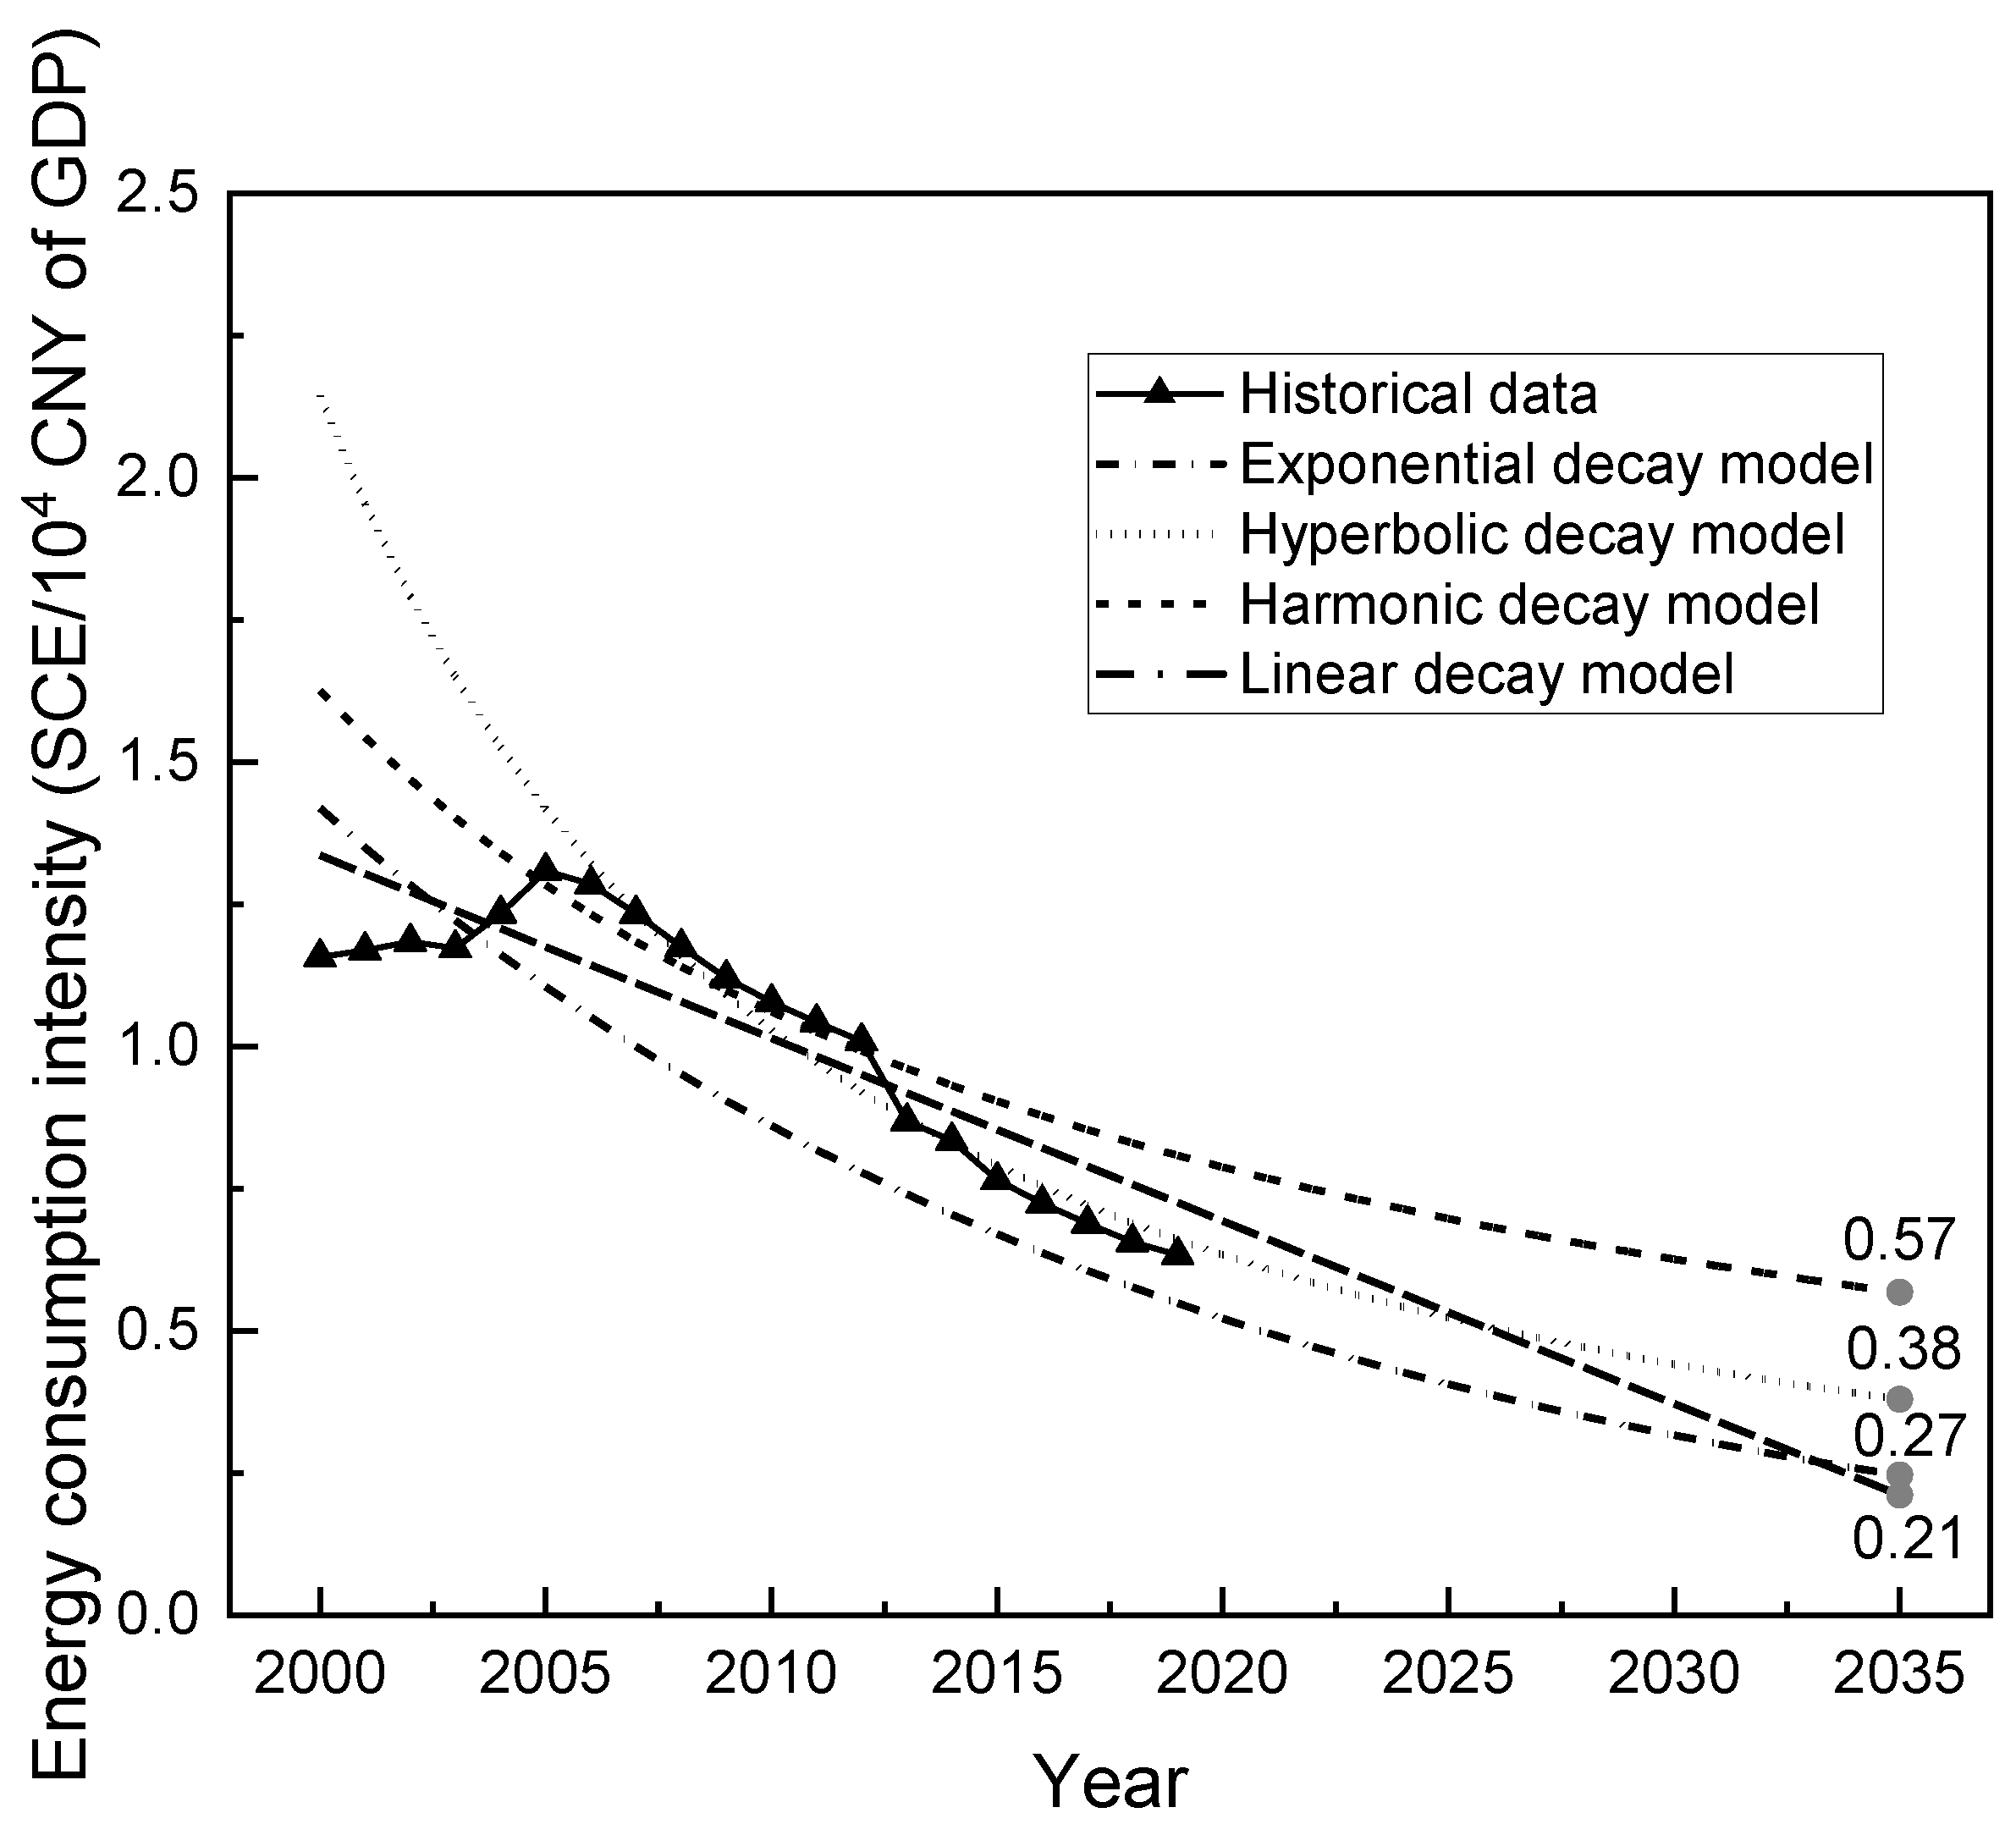
Energy intensity, also known as the energy consumption per unit of GDP, is a comprehensive indicator to measure the economic effects of energy use during national economy development [2]. In 2017, the energy consumption intensity of Yunnan was 0.68 tons of standard coal per CNY 10,000 of GDP, which is an improvement in energy-use efficiency compared to 1.16 tons of standard coal per CNY 10,000 of GDP in 2000. Following the adjustment of industrial structure and energy structure, the energy consumption intensity of Yunnan will gradually decline in the future, and the energy-use efficiency will be further improved (Figure 9). Therefore, we selected four regressive models to forecast their future development trends: the linear decay model, exponential decay model, hyperbolic decay model, and harmonic decay model.
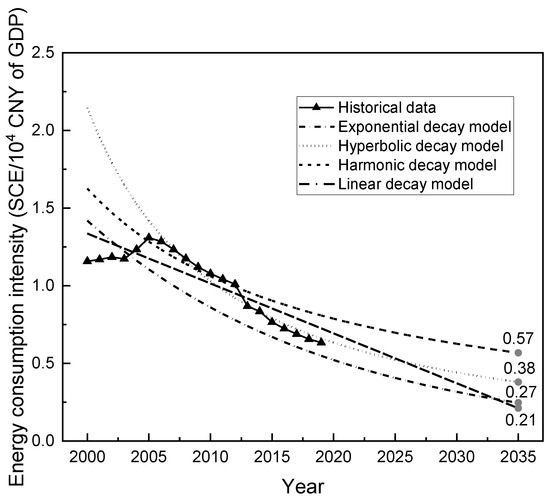
Figure 9.
The evolution of energy consumption intensity in Yunnan.
The decay rate of the linear decay model for energy consumption is excessively fast, and the decay rate of the harmonic decay model is the slowest, with a prediction of 0.57 tons of standard coal per CNY 10,000 of GDP. The predicted results of the exponential decay model and hyperbolic decay model are 0.25 and 0.38 tons of standard coal/CNY 10,000 of GDP, respectively. With the high-quality development of the coal industry, the utilization efficiency of coal in Yunnan will be improved; the increase in renewable energy use such as solar and wind energy and the exploitation of shale gas can provide a complementary role to hydropower. In summary, the future energy consumption structure of Yunnan Province will be cleaner and more efficient, with improved energy-use efficiency. We believe that the hyperbolic decay model is more consistent with the future development trend.
3.4. Carbon Emission Measurement and Structural Trend Analysis in Yunnan Province
Assuming that carbon emissions per capita in Yunnan Province show a primary or secondary relationship with GDP per capita and urbanization rate and have a linear relationship with all other drivers, then three carbon emission calculation models can be obtained based on the integrated carbon emission model.
Model 1: Assuming that the carbon emission per capita Qp in Yunnan has a linear relationship with GDP per capita (A) and urbanization rate (UR), that is, n1 = n2 = 1 in the previous equation, then the carbon emission model can be expressed as:
Model 2: Assuming that the carbon emissions per capita Qp in Yunnan show a quadratic relationship with GDP per capita (A), and have a linear relationship with other drivers, that is n1 = 2, n2 = 1 in the previous equitation, then the carbon emission model can be expressed as:
Model 3: Assuming that the carbon emissions per capita Qp in Yunnan present a quadratic relationship with GDP per capita (A) and urbanization rate (UR), and have a linear relationship with other drivers, then the carbon emission model can be expressed as:
Different energy sources have slightly different CO2 emission coefficients. Coal has the highest carbon emission coefficient of 2.64, followed by petroleum at 2.08, and natural gas is relatively small with a value of 1.63. By substituting the historical values of each driver and the historical value of carbon emissions generated by energy consumption in Yunnan into the regional carbon emission model, the main node year data are shown in Table 1. The fitting was performed using the least squares method, and the results are shown in Table 2, to obtain the parameter values of the carbon emission projection model.

Table 1.
Estimation of economic and social development in Yunnan.
Table 2.
Estimation of carbon emissions in Yunnan.
We then substitute the predicted values of each driver to calculate the future carbon emissions per capita in Yunnan under each model; by combining the predicted values of population, the total carbon emissions of each year in the future can be obtained.
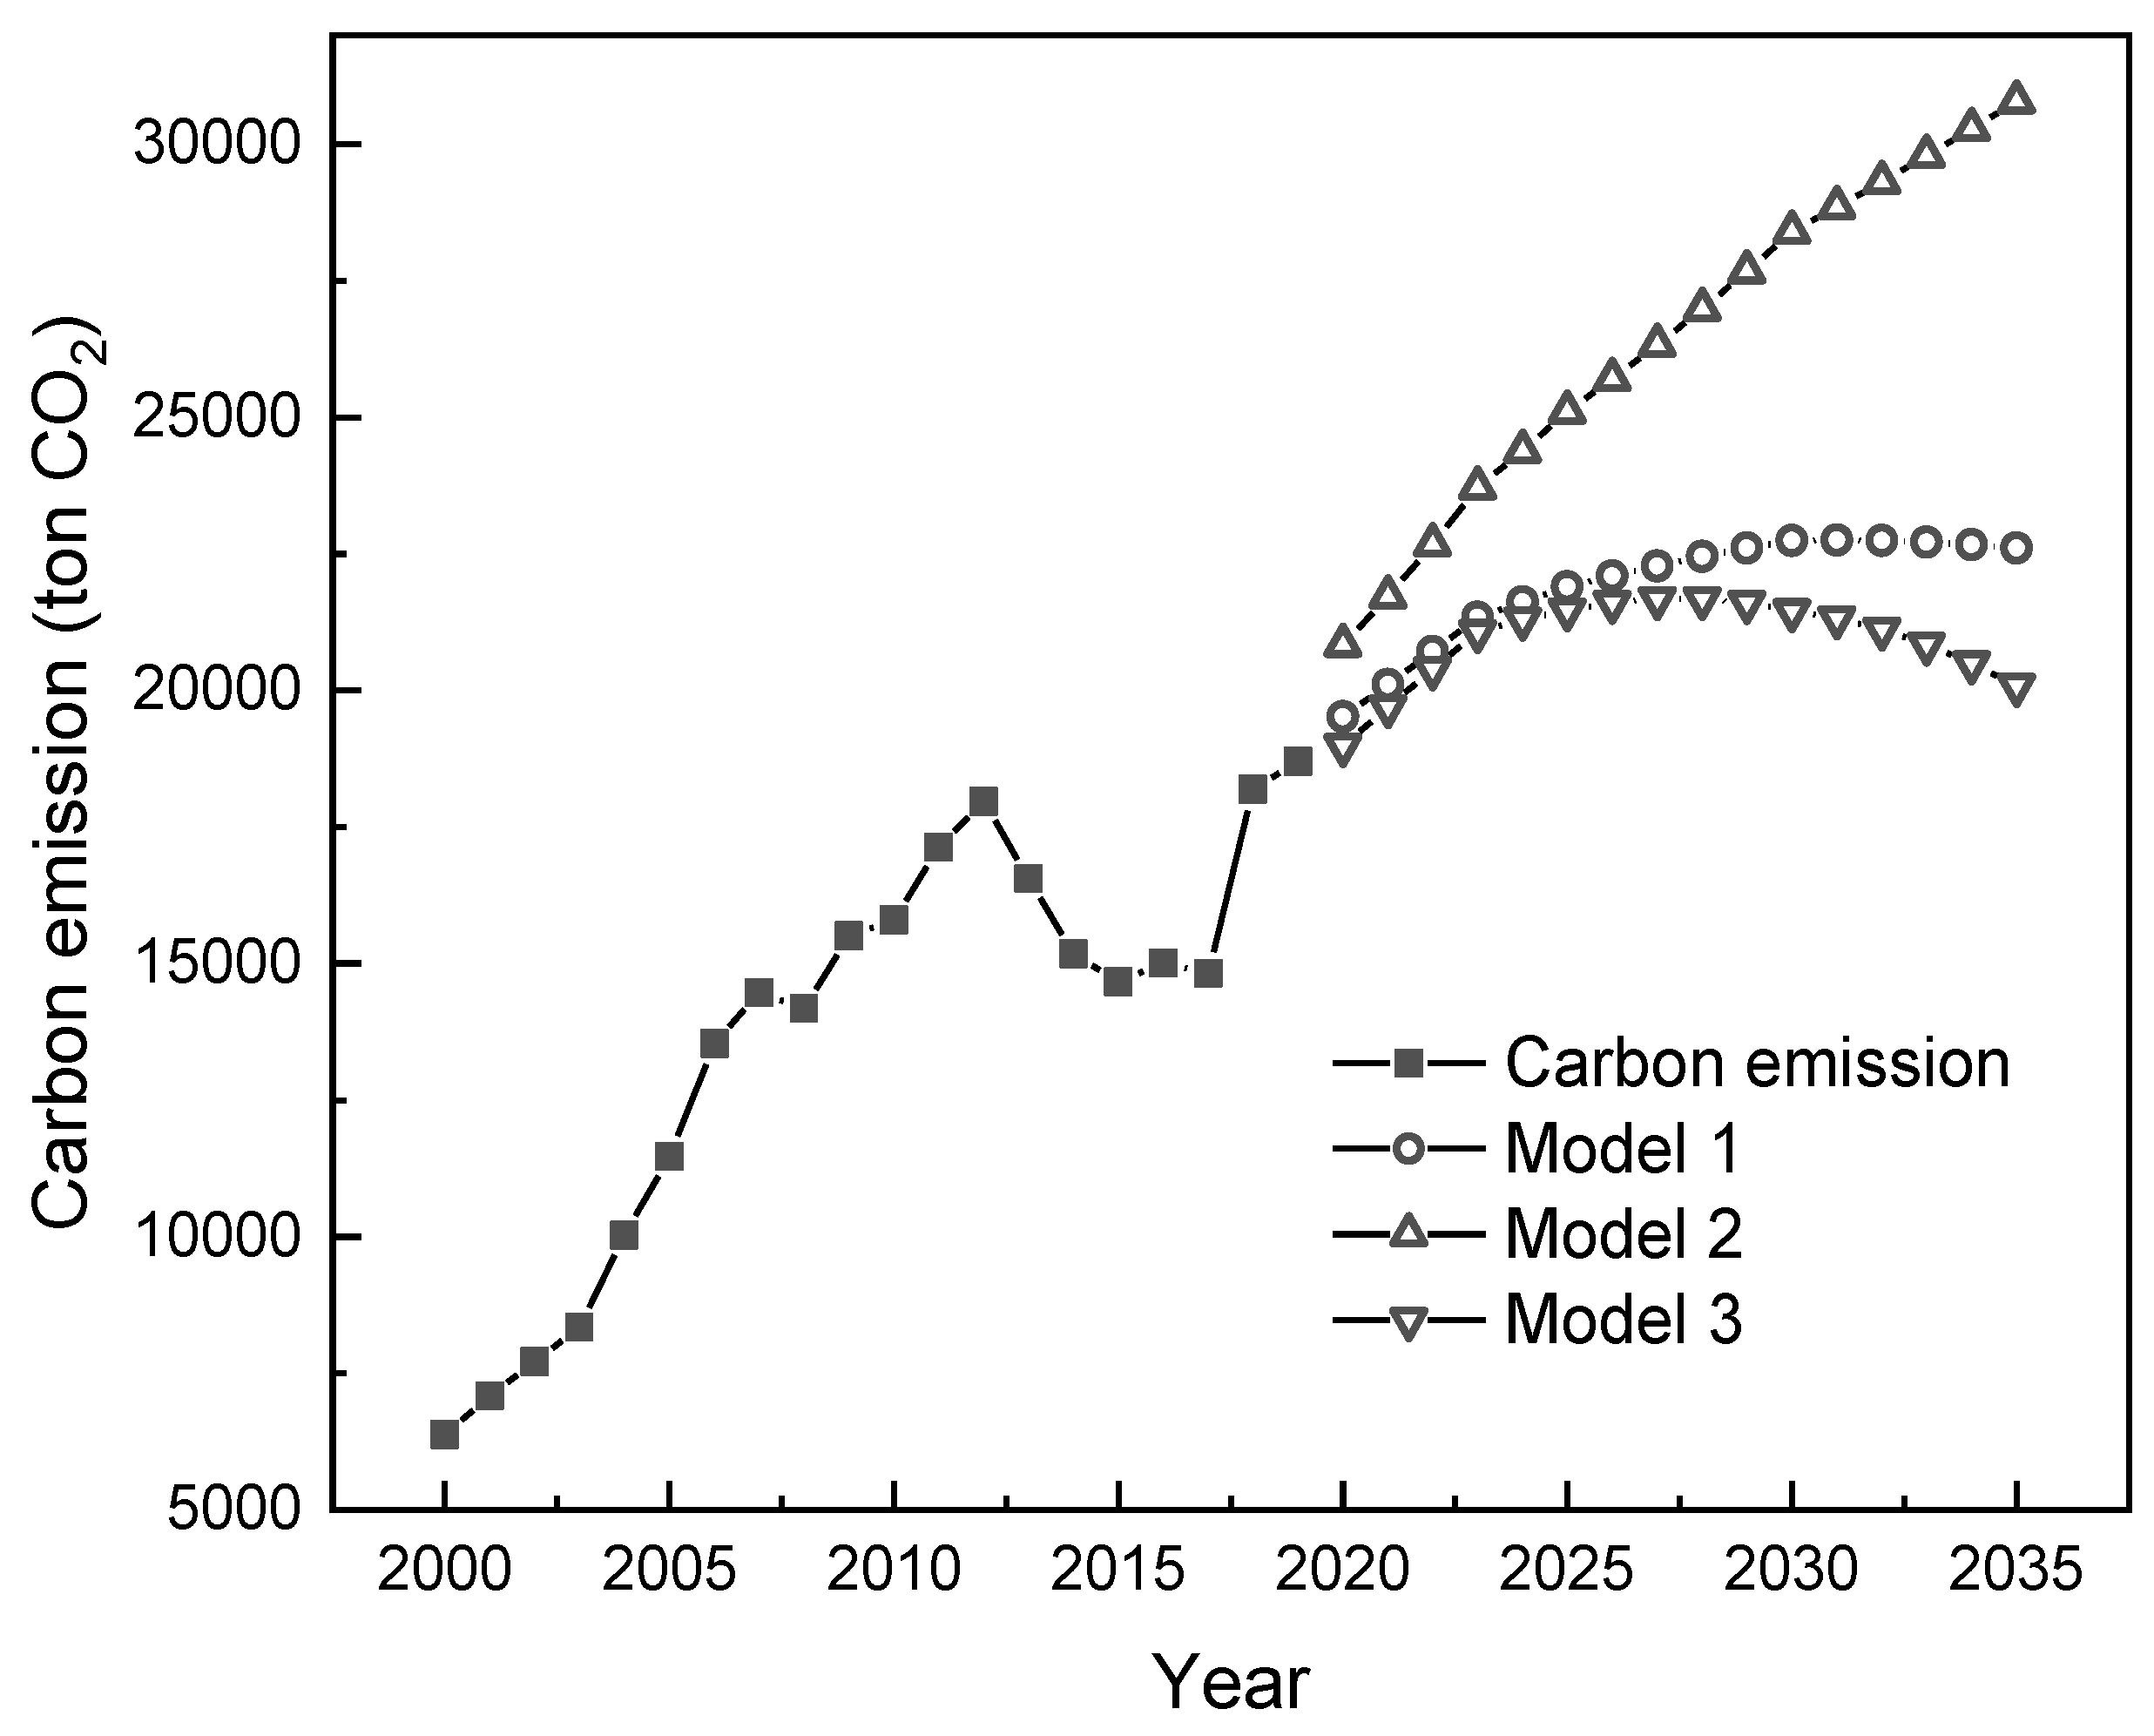
As shown in Figure 10, the projections of both model 1 and model 3 indicate that the total carbon emissions in Yunnan will start to decline after a certain period of increase, generally following the law of environmental Kuznets change (EKC curve). In model 1, the projection results show that the total carbon emissions in Yunnan will peak in 2031 at 228 million tons. On the other hand, the prediction of model 2 shows that the total carbon emissions in Yunnan Province present a rapid growth trend and will not reach their peak by 2035; and the projection of model 3 shows that the total carbon emissions will peak in 2028 at 217 million tons. As mentioned in the National Determined Contributions (NDC) document in China, the national carbon emissions will peak in 2030 and aim to reach the peak beforehand. Furthermore, Yunnan has remarkable renewable resources such as hydropower. Its energy structure and energy-use efficiency are superior to the national average, so it has accomplished the carbon intensity target of the 13th Five-Year Plan two years ahead of schedule. Under the premise of intensified renewable energy, reaching the peak as scheduled or even ahead of schedule is achievable; therefore, the forecast results of model 2 are considered inconsistent with the actual local situation. In addition, the coal industry is currently the primary source of carbon emissions in Yunnan, accounting for more than 70% in recent years, according to the Three-Year Action Plan for High-Quality Development of Coal Industry in Yunnan Province (2019–2021). However, after 2025, coal mining will decrease with the reduction in coal consumption demand from thermal power and the replacement of coal with green hydrogen in the chemical industry. Therefore, in this study, we considered the projection of model 3 more consistent with the actual situation of Yunnan, which means that the total carbon emissions in Yunnan will peak at 217 million tons in 2028, and the carbon emissions per capita will be 4.16 tons/year.
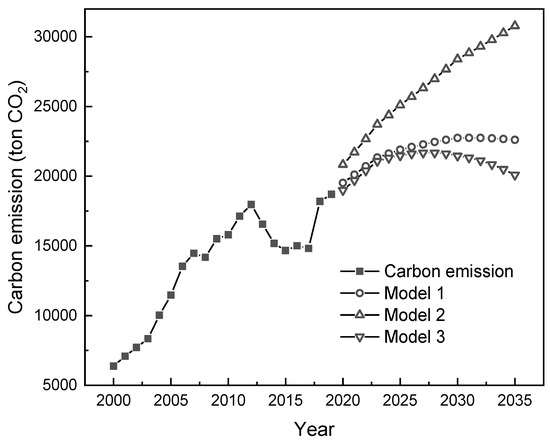
Figure 10.
Estimation of carbon emissions in Yunnan.
4. Discussion
Drawing upon the principles of the endogenous growth theory, our study crafts a forward-looking view of Yunnan’s socio-economic landscape until 2035. The results above provide a novel and comprehensive insight into Yunnan’s energy and carbon emission dynamics. By using multiple regression models, such as linear decay, exponential decay, hyperbolic decay, and harmonic decay, we construct a granular and nuanced understanding of Yunnan’s energy trajectories. Furthermore, our study weaves together various parameters, not just limited to GDP or urbanization rates but also includes energy intensity, structure, and specific sources. This interwoven approach offers a more holistic view and ensures that predictions align closely with broader policy directives such as the NDC document, thus enhancing the predictive accuracy.
Employing the phased compound growth rate analysis, we anticipate that Yunnan’s GDP will ascend to an impressive CNY 547.61 billion by that time. Further delving into the province’s developmental trajectory, an s-shaped growth curve predicts transformational shifts: a dominantly urbanized population of 51.16 million and secondary and tertiary sectors contributing 90% of the GDP. In sync with a shifting economic dynamic, our projections also spotlight an environmental transition. By 2035, Yunnan’s reliance on fossil fuels is set to dip to 38.7%, aligning with an energy consumption intensity of 0.38 million tons of standard coal per CNY 10,000 of GDP.
Building upon the foundation set by the Cobb–Douglas production function theory, our study offers a tailored regional carbon emission blueprint for Yunnan. Notably, the data-rich patterns we deciphered from our model have drawn parallels with the environmental Kuznets curve, a testament to the province’s evolving relationship between economic growth and environmental degradation. As per our rigorous projections, Yunnan stands on the cusp of an environmental milestone, with its carbon emissions forecasted to climax at 220 million tons around the watershed year 2030. This trend underscores the dual challenges and opportunities that lie ahead for the province: the need for calibrated strategies to mitigate the impending peak and the potential to serve as a reference point for other regions grappling with similar environmental and developmental trajectories. The lessons and insights drawn from Yunnan’s carbon dynamics could offer broader implications for both policy formulation and academic discourse on sustainable growth in rapidly developing regions.
However, the reliance on historical data as a foundational bedrock, while robust, can also be a limitation. Time series analysis requires consistent and comprehensive data collection over extended periods. Gaps or inconsistencies in data might hinder accurate predictions. Moreover, the application of multiple models necessitates rigorous validation to ascertain the best-fit model for specific datasets. The carbon emission measurement model, while holistic in capturing the intricacies of various economic drivers, relies heavily on assumptions, which might vary across regions and over time. The inclusion of multiple variables and drivers, although comprehensive, could lead to overfitting and might complicate interpretation. Last but not least, the dynamic nature of the energy sector, punctuated by policy shifts, technological innovations, and unforeseen global events, can quickly alter predicted trajectories based on past patterns. Furthermore, the inherent assumptions driving these predictions, especially the relationships posited between parameters like GDP, carbon emissions, and urbanization rates, introduce potential variances. If these relationships evolve differently from what is currently anticipated, the model’s projections might require adjustment.
5. Conclusions and Implications
5.1. Conclusions
Despite Yunnan’s commendable harnessing of clean energy—accounting for 85.4% of its total capacity—a notable consideration is Yunnan’s pronounced dependency on hydropower as its primary energy source, emphasized throughout the study. While harnessing the province’s hydro potential is commendable, it also introduces vulnerability. Factors affecting hydropower’s availability or efficiency could have disproportionate impacts on Yunnan’s energy landscape, underscoring the need for diversification in energy sources and strategies. Additionally, a benchmark that comfortably surpasses the national average, the shadow of coal looms large, contributing over 70% of its carbon emissions.
The path forward for Yunnan is clear: amplify its renewable and hydrogen energy sectors, capitalize on its unique assets like abandoned mines and salt caves for innovative energy storage solutions. Strategies like synthesizing methane from carbon dioxide reactions and leveraging the potential of the Sino-Myanmar oil and gas pipeline promise dual benefits: a reduced coal dependency and an elevated energy infrastructure, ensuring seamless energy transfer not just within Yunnan but interprovincially.
5.2. Implications
In essence, the journey of Yunnan underscores the importance of data-driven planning, strategic utilization of resources, and the necessity to combine local strengths with global best practices. For regions embarking on similar pathways, we provide seven implications below that may help to navigate the complex landscape of energy transition and sustainable development.
- Endogenous Growth Theory Application: By modeling regional growth through endogenous mechanisms, regions can anticipate key economic and social development indicators. This can provide a roadmap to visualize and strategize the integration of renewables into the economy.
- Resource Endowment Assessment: Recognizing the proportion of clean energy in the total energy mix can serve as a benchmark. For Yunnan, the high proportion of clean energy generation was a unique strength. Regions could conduct a comprehensive resource endowment assessment to identify their renewable energy potential and build on it.
- Challenges of Transitioning: Despite having a robust clean energy portfolio, regions can still grapple with high fossil fuel consumption, as seen with Yunnan’s coal consumption. Regions must be prepared to address legacy energy infrastructures and consumption patterns that might hinder transition.
- Strategic Utilization of Existing Resources: Instead of viewing abandoned infrastructures as liabilities, regions can creatively repurpose them. Yunnan’s strategy to use abandoned mine sites and salt caves for energy storage demonstrates the potential of adaptive reuse in the transition. To support the influx of renewables and accommodate shifting energy dynamics, regions should prioritize the upgradation of existing energy infrastructures. This includes modernizing power transmission lines and constructing interprovincial channels for efficient energy distribution.
- Collaborative Energy Projects: Inter-regional projects, like the Sino-Myanmar oil and gas pipeline for Yunnan, can be leveraged to diversify energy sources and reduce dependency on environmentally detrimental fuels. Collaborations can enhance energy security while promoting sustainable consumption.
- Guidance for Stakeholders: By offering a transparent and data-backed energy and carbon model, regions can inspire trust among stakeholders. Clear roadmaps and forecasts can assist in rallying public and private sector stakeholders around shared sustainable development goals.
Author Contributions
Conceptualization, M.P., L.T., H.L., H.X. and J.X.; formal analysis, M.P., L.T. and J.W.; funding acquisition, J.X., W.Z. and J.H.; investigation, M.P. and H.L.; methodology, M.P., L.T., H.L., J.W. and T.M.; project administration, J.X., W.Z. and J.H.; resources, T.M.; supervision, J.X., W.Z. and J.H.; validation, L.T. and H.L.; writing—original draft, H.X.; writing—review and editing, H.X. All authors have read and agreed to the published version of the manuscript.
Funding
This research was funded by National Key Research and Development (R & D) Program of China (Grant No. 2022YFC3902605); and China Postdoctoral Innovative Talents Program (Grant No. BX201907170).
Data Availability Statement
Some or all data, models, or code that support the findings of this study are available from the corresponding author upon reasonable request.
Conflicts of Interest
The authors declare no conflict of interest.
References
- González, D.M.L.; Rendon, J.G. Opportunities and challenges of mainstreaming distributed energy resources towards the transition to more efficient and resilient energy markets. Renew. Sustain. Energy Rev. 2022, 157, 112018. [Google Scholar] [CrossRef]
- Tian, J.; Yu, L.; Xue, R.; Zhuang, S.; Shan, Y. Global low-carbon energy transition in the post-COVID-19 era. Appl. Energy 2022, 307, 118205. [Google Scholar] [CrossRef] [PubMed]
- Sovacool, B.K.; Martiskainen, M.; Hook, A.; Baker, L. Decarbonization and its discontents: A critical energy justice perspective on four low-carbon transitions. Clim. Chang. 2019, 155, 581–619. [Google Scholar] [CrossRef]
- Newell, P.J.; Geels, F.W.; Sovacool, B.K. Navigating tensions between rapid and just low-carbon transitions. Environ. Res. Lett. 2022, 17, 041006. [Google Scholar] [CrossRef]
- Wakiyama, T.; Zusman, E. The impact of electricity market reform and subnational climate policy on carbon dioxide emissions across the United States: A path analysis. Renew. Sustain. Energy Rev. 2021, 149, 111337. [Google Scholar] [CrossRef]
- Rodríguez-García, C.; García-Pintos, A.; Caballero, G.; Vázquez, X.H. The role of knowledge maps in sub-national climate change policymaking and governance. Clim. Policy 2022, 22, 273–284. [Google Scholar] [CrossRef]
- Cid, A.; Lerner, A.M. Local governments as key agents in climate change adaptation: Challenges and opportunities for institutional capacity-building in Mexico. Clim. Policy 2023, 23, 649–661. [Google Scholar] [CrossRef]
- Garcia Hernandez, A.L.; Bolwig, S. Understanding climate policy integration in the global South through the multiple streams framework. Clim. Dev. 2021, 13, 68–80. [Google Scholar] [CrossRef]
- De Macedo, L.S.V.; Jacobi, P.R. Subnational politics of the urban age: Evidence from Brazil on integrating global climate goals in the municipal agenda. Palgrave Commun. 2019, 5, 18. [Google Scholar] [CrossRef]
- Casiano Flores, C. Toward a contextualized research agenda: Governance challenges of the wastewater treatment policy in Mexico and the role of subnational governments. Wiley Interdiscip. Rev. Water 2023, 10, e1617. [Google Scholar] [CrossRef]
- Peng, M.; Xu, H.; Qu, C.; Xu, J.; Chen, L.; Duan, L.; Hao, J. Understanding China’s largest sustainability experiment: Atmospheric and climate governance in the Yangtze river economic belt as a lens. J. Clean. Prod. 2021, 290, 125760. [Google Scholar] [CrossRef]
- Xu, H.; Tang, A.; Pittock, J. The dark side of ambition: Side-effects of China’s climate policy. Environ. Res. Lett. 2021, 16, 111001. [Google Scholar] [CrossRef]
- Zhou, T.; Xu, H.; Gosens, J.; Jotzo, F. China’s Net-Zero Plans: Policy Brief on Near-Term Policy Challenges & Australia-China Links in Decarbonization; Australian National University: Canberra, Australia, 2022. [Google Scholar]
- Bu, C.; Cui, X.; Li, R.; Li, J.; Zhang, Y.; Wang, C.; Cai, W. Achieving net-zero emissions in China’s passenger transport sector through regionally tailored mitigation strategies. Appl. Energy 2021, 284, 116265. [Google Scholar] [CrossRef]
- Zheng, J.; Feng, G.; Ren, Z.; Qi, N.; Coffman, D.M.; Zhou, Y.; Wang, S. China’s energy consumption and economic activity at the regional level. Energy 2022, 259, 124948. [Google Scholar] [CrossRef]
- Mi, Z.; Sun, X. Provinces with transitions in industrial structure and energy mix performed best in climate change mitigation in China. Commun. Earth Environ. 2021, 2, 182. [Google Scholar] [CrossRef]
- Ou’yang, T. The South of Colorful Clouds Series (35) Hydro Energy Resources and Hydropower Development in Yunnan. Yunnan Electr. Power 2005, 8, 1. [Google Scholar]
- Wang, T.; Tian, F.; Deng, Z.; Hu, H. Pore structure and fractal characteristics of Wufeng–Longmaxi formation shale in northern Yunnan–Guizhou, China. Front. Earth Sci. 2023, 10, 998958. [Google Scholar] [CrossRef]
- Wan, F.; Xue, M.; Luo, H. Progress of Solar Energy Resources and Solar Energy Utilization in Yunnan Province. Gas Heat 2009, 29, 19–22. [Google Scholar]
- Yunnan Bureau of Statistics (n.d.). Yunnan Energy Production Report 2000–2020. Available online: http://stats.yn.gov.cn/tjsj/jjxx/202102/t20210201_1044039.html (accessed on 21 September 2023).
- Jiang, Z. Dictionary of Natural Science Subjects; China Economic Press: Beijing, China, 1991; pp. 19–20. [Google Scholar]
- Tang, Y. Research and Application of Time Series Analysis; Northeast Agricultural University: Harbin, China, 2007. [Google Scholar]
- Wu, J.; Xu, J. Carbon Emission Model and Application Based on Production Function Theory. J. Jiangsu Univ. 2019, 40, 5. [Google Scholar]
- Peng, K. Social Science Dictionary; China International Radio Press: Beijing, China, 1989; p. 635. [Google Scholar]
- Lv, Z. Yunnan’s Future Population Development Forecast and Economic Impact. J. Yunnan Univ. Natl. 2005, 2, 31–36. [Google Scholar]
- Yang, L.; Yang, G.; Wan, S. Application of Mathematical Models in Population Forecasting—Taking Jiangsu as an Example. Resour. Environ. Yangtze Basin 2006, 3, 287–291. [Google Scholar]
- Xi, J. Encyclopedic Dictionary of Scientific Development Outlook; Shanghai Lexicographical Publishing House: Shanghai, China, 2007; p. 513. Available online: http://www.ewen.co/sjcb/view.aspx?id=0202010000967792 (accessed on 21 September 2023).
- Editorial Committee of China Electric Power Encyclopedia. China Electric Power Encyclopedia—Comprehensive Volume; China Electric Power Press: Beijing, China, 2001; p. 316. [Google Scholar]

Disclaimer/Publisher’s Note: The statements, opinions and data contained in all publications are solely those of the individual author(s) and contributor(s) and not of MDPI and/or the editor(s). MDPI and/or the editor(s) disclaim responsibility for any injury to people or property resulting from any ideas, methods, instructions or products referred to in the content. |
© 2023 by the authors. Licensee MDPI, Basel, Switzerland. This article is an open access article distributed under the terms and conditions of the Creative Commons Attribution (CC BY) license (https://creativecommons.org/licenses/by/4.0/).