Abstract
Sports centers are significant energy consumers. This article outlines the engineering design for a comprehensive energy performance upgrade of the indoor sports hall in Arkalochori, Greece, and presents the projected results. The indoor sports hall constitutes a major sport facility on the mainland of Crete, hosting a broad cluster of sport municipal activities and the official basketball games of the local team in the 2nd national category. Having been constructed in the mid-1990s, the facility exhibits very low thermal performance, with considerably high U-factors for all constructive elements (from 4 to 5 W/m2∙K), still use of diesel oil for indoor space heating and domestic heat water production, and ineffective old lamps and luminaries covering the lighting needs of the facility. The energy performance upgrade of the indoor sports hall was studied, and the following passive and active measures were considered: Opaque-surfaces’ thermal insulation and openings’ replacement, stone wool panels, installation of heat pumps for indoor space conditioning, removal of diesel oil for any end use, production of domestic hot water from a novel solar-combi system, upgrade of lighting equipment, installation of solar tubes on the main sports hall roof for natural lighting as well as of a photovoltaic system for covering the remaining electricity consumption. With the proposed interventions, the studied building becomes a zero-energy facility. The payback period of the investment was calculated at 26 years on the basis of the avoided energy cost. This work was funded by the “NESOI” Horizon 2020 project and received the public award “Islands Gamechanger” competition of the NESOI project and the Clean Energy for EU Islands initiative.
1. Introduction
1.1. Background
Energy consumption patterns of sports centers, particularly in rural settings, remain a subject of intense scrutiny and innovation in the broader sustainability discourse. In the quest to transition these significant energy consumers into sustainable entities, the challenge is not just to harness modern energy-saving technologies but to integrate them holistically within the facility’s unique operational demands. In Part A [1] of this two-series exploration, the focus was on the energy performance upgrade process for the swimming pool center within the municipal sports center in Arkalochori, Greece. It detailed an extensive approach, transforming the swimming facility, which had not seen energy efficiency improvements since its initial construction in 2002, into a near-zero-energy building. Part B focuses on the energy retrofit challenges and estimated achievements of another major part of the sports complex, the indoor sports hall.
The engineering design study for the energy upgrade of the sports complex was financially supported by the “New Energy Solutions Optimized for Islands” (NESOI) project, under the auspices of the Horizon 2020 Programme. Its potential benefits not only underscored the significant energy savings but also emphasized the pivotal role such projects play in fostering community engagement and socio-economic benefits, as highlighted by its recognition in the “Islands Gamechanger” competition. By weaving together technical insights, local context, and broader sustainability goals, this paper aims to present a comprehensive view of the retrofit process, potentially serving as a blueprint for similar facilities in rural settings.
In the ongoing journey towards energy transition, Rational Use of Energy (RUE) stands as a foundational principle, emphasizing the importance of maximizing energy efficiency and adopting sustainable energy practices across diverse sectors, including residential, commercial, industrial, and transportation. This overarching commitment to energy efficiency and conservation is entrenched in European Union (EU) policies, such as Directives 2018/844 [2] and 2012/27/EU [3], which obligate Member States to establish definitive targets and strategies in favor of RUE. For instance, Greek legislation [4] mandates new public structures to aspire towards nearly zero-energy standards. In 2021, buildings and their construction accounted for 30% of the annual global energy consumption, and despite a slowdown since 2010, this consumption is projected to surge to 50% by 2050 [5,6]. Within the EU, the majority of household energy expenditure is on indoor heating, followed by domestic hot water and lighting. As global fuel costs rise and the push to curtail CO2 emissions intensifies, the appeal for energy-efficient solutions grows. Although green building initiatives lead to operational cost reductions of 10–30%, their initial construction expenses remain a concern [7].
The drive towards more energy-efficient methodologies, influenced by escalating fuel costs and the urgency to curtail CO2 and other harmful emissions, underscores the importance of adapting to our evolving ecological landscape. While buildings in general grapple with variables such as economic dynamics, available resources, and climatic conditions [6,8,9,10,11], sports centers introduce added layers of complexity. Not only are they influenced by these typical factors, but the type and intensity of their usage—which can fluctuate seasonally—further complicates their energy dynamics. It is within this intricate framework that athletic centers emerge as particularly unique subjects, navigating both the common challenges faced by most buildings and their distinctive obstacles and opportunities in the realm of energy optimization enhancements. Part B of our study builds on these considerations, focusing specifically on the sustainable retrofit of the indoor sports hall in Arkalochori.
1.2. Literature Review
Sports centers represent approximately 4% of non-residential buildings in the EU [12]. They also come with their diverse operational needs, which present distinct challenges in terms of energy consumption and efficiency. Tackling these challenges through sustainable retrofits goes beyond mere technological solutions—it necessitates a deep comprehension of the various elements influencing these energy demands. This section commences by offering a categorization, shaped from the authors’ viewpoint, of energy demands in sports centers. By discerning patterns and suggesting a framework influenced by previous studies, we lay the groundwork for subsequent discussions on past research. Our objective is to delve into the multifaceted nature of energy-saving retrofits in sports centers, from the role of regional climatic factors to the calculated study results. In doing so, we aim to present readers with a comprehensive understanding, both broad and detailed, of the energy retrofit landscape within sports centers.
Typically, sports centers are energy-intensive, especially if they have amenities such as heated pools, saunas, and extensive lighting requirements. Although there has been work to compile and unify several building codes and benchmark indicators for energy-efficiency buildings [13], there are several ongoing attempts in Israel [14] and Pakistan [15]. Additionally, there has not been much focus on sports centers, probably because of the non-standardised desired indoor climatic conditions and the complexity of the operational parameters associated with each specific technology. This lack of information may also be attributed to the fragmented definitions [16], even for simple concepts such as Zero Emission Building (ZEB), which can be evidenced by differences across European studies [17], but also in individual countries such as Croatia [18] and Korea [19].
Azaza et al. [20] delved into the intricate energy consumption patterns of large sports facilities with a case study at Rocklunda Arena in Sweden. Distinct key performance indicators (KPIs) were formulated to decipher the energy consumption intricacies of sports facilities. These KPIs encompassed energy flow mapping, load factors for heat and electricity, operational hour indicators, and area indicators.
Table 1 showcases the energy requirements and their respective shares, compiled from various sources (IEA [5], US Building Energy Data Book [21], European Building Stock Observatory [22]). It can be seen that more than half of the energy consumption is related to heating and cooling (of spaces and water). Notably, over 50% of energy consumption is attributed to heating and cooling, both for spaces and water.

Table 1.
Energy needs for a sports center building and typical range of corresponding share.
The energy consumption of sports centers ranges from under 100 to 350 kWh/m2/year (refer to Table 2) in the UK (CIBSE Energy Benchmark (TM46: 2008) [23] and ECON 78 (2001) [24]), depending on the location and the facilities. Based on audited data from 17 sports facilities, Trianti-Tsourna et al. [25] reported the average annual energy consumption metrics in Greece as follows: 73.2 kW h/m2 for total energy, 322.3 kW h/m2 for heating, and 37.14 kW h/m2 for electricity (accounting for energy systems such as heat pumps, ventilation units, and electrical motors in operation during sports activities).

Table 2.
Energy use in sports centers pools (CIBSE Energy Benchmark (TM46: 2008) [23] and ECON 78 (2001) [24]).
In Sweden, sports halls the annual energy consumption ranges between 145 and 174 kWh/m2 [26]. Also, an analysis of the Swedish GRIPEN database from 2015 [27] revealed a correlation between the construction period of sports halls and their average energy performance. Sports halls built before 1979 had an average energy consumption of 191 kWh/m2. This figure decreased to 148 kWh/m2 for buildings constructed between 1980 and 2009. Impressively, for buildings erected after 2010, the energy consumption was further reduced to 104 kWh/m2, highlighting the benefits of technological advancements over time.
Griffiths [28] in 1997 undertook a detailed analysis of the UK’s sports and recreation sector. His study of two leisure complexes, one with double the occupancy rate of the other, revealed that, despite the disparity in user numbers, both had similar energy consumptions of approximately 10 kWh per user. Yet, their energy costs per user differed significantly, hinting at the potential for considerable energy savings and underscoring the influence of varying energy sources and pricing at the time.
Katsaprakakis et al. [29] studied the energy performance upgrading of the Pancretan Stadium in Crete, Greece. The proposed optimal blend of both passive and active measures yielded an impressive annual energy saving of 83% and included: Replacement of openings, a photovoltaic system, an open loop geothermal system, lighting upgrade, a solar-biomass combi system, and a building energy management system (BEMS). The use of these technologies elevated the stadium’s energy classification, upgrading it from D to A+ as per the Greek EPBD directive. Specific interventions, such as the combined replacement of selected openings and the geothermal system, resulted in 48% electricity savings for indoor space conditioning. The lighting system interventions saved 52% on electricity. The study reveals vast energy-saving potential in large sports facilities and emphasizes the need for tailored solutions based on local conditions and infrastructure.
A study in 2020 focused on Crete, Greece, and highlighted that the building stock often features subpar insulation and poor-quality openings, which have historically led to increased energy consumption. The research offers the following promising perspective: implementation of tailored passive and active energy-saving measures can lead to significant energy savings. Additionally, it was estimated that the Mediterranean’s abundant solar and wind resources further emphasize the potential for transitioning to zero-energy buildings. Such findings suggest that regions with architectural challenges similar to the Mediterranean can harness substantial energy-saving benefits, making sustainability both an environmentally and economically viable goal.
In the context of contemporary building design and energy conservation, passive technologies have long been acknowledged for their efficiency. Tracing their origins to ancient cave dwellings, these technologies have evolved over millennia and are now integral to modern energy-efficient building applications [9].
Thermal insulation is a cornerstone of energy-efficient building design. Over the decades, its paramount importance has been highlighted by evolving standards, with the minimum performance requirement regarding insulation thickness in northern Europe being doubled in the 2010s compared to the 1970s [30]. Proper insulation, encompassing walls, roofs, and floors, acts as a barrier to heat transfer, thereby contributing to better indoor thermal comfort conditions and energy conservation [31].
Katsaprakakis et al. [31] also reported on the thermal mass optimization of buildings, an often-overlooked yet pivotal passive technique. By utilizing materials that can absorb, store, and release heat over time, such as concrete or brick, buildings can naturally regulate temperature fluctuations [30]. The innovative use of phase-change materials further enhances this process, offering a dynamic approach to managing thermal loads.
Sun shading techniques, whether through external artificial shading devices, plants, or architectural design, can significantly reduce solar gains and, consequently, cooling loads, especially in regions with intense sunlight [31]. For instance, a study conducted for a sports hall in Słomniki concluded that sunlight access was reduced by up to 30% through shading interventions [32].
The quality and design of building openings, or fenestration, play a crucial role in energy conservation [31]. Advancements in materials, such as aerogel and vacuum glazing, offer superior insulation properties [28]. Additionally, the strategic placement and design of windows can balance maximum natural light with minimal heat gain or loss.
Considering the maximum heat losses through ceilings as well as the direct exposure of rooftops to sunlight, roofing interventions can dramatically reduce a building’s energy consumption, thus presenting unique challenges and opportunities. Nature-based solutions, such as green roofs, offer both insulation and sunlight absorption, while photovoltaic systems harness solar energy and radiant-transmitting barriers deflect the excessive heat [28,31,33].
In addition, designing spaces that promote natural airflow can significantly compensate for the need for mechanical ventilation. Through the circulation of fresh air, natural ventilation can not only reduce energy consumption but also contribute to the displacement of harmful pollutants, thus promoting healthy indoor air environments [34].
Finally, the optimized building orientation can strategically capitalize on seasonal sun positions and lead to substantial energy savings by effectively reducing heat absorption, further diminishing the need for artificial cooling in the summer, and allowing more sun irradiance heat to enter the home, thus reducing heating requirements. However, this is a method that is primarily useful in the initial planning and construction phases. The important parameter of the climate can be modelled by computational tools and methods [35].
Active measures in building design and energy conservation encompass a range of technologies and systems aimed at optimizing energy use, often harnessing renewable sources or maximizing the efficiency of existing resources [9]. These measures, supported by extensive research, offer promising avenues for sustainable energy management in various settings.
Heating, ventilation, and air conditioning (HVAC) systems play a pivotal role in the energy efficiency of buildings. Among these, radiant heating and cooling (RHC) systems are emerging as a preferred choice. Their growing popularity is attributed to their ability to provide consistent thermal comfort levels while consuming less energy. This is achieved through their design, which allows for high-temperature cooling and low-temperature heating [9]. Nevertheless, RHC systems are not standalone; they often integrate with auxiliary systems such as heat pumps and boilers [36]. These auxiliary components, particularly heat pumps and boilers, have been in development for over a century. Their enduring relevance in modern HVAC systems is a testament to their efficiency and the continual advancements made over the years [37].
Heat pumps, both as auxiliary components and primary systems, offer a versatile solution for heating and cooling needs. For instance, a study that compared a water solar-assisted heat pump (W-SAHP) with conventional gas-boiler plants in Italy found that W-SAHPs could achieve energy savings ranging from 35 to 50% [38]. However, it is worth noting that the efficiency of these systems tends to decrease with the site’s degree days. Further research by Chow et al. into solar-assisted heat pump systems for indoor swimming pool water heating revealed that such systems could achieve a coefficient of performance (COP) of 4.5. Impressively, this translates to an energy-saving fraction of 79% compared to traditional energy systems [39].
Another innovative approach to heating and cooling is the use of variable refrigerant volume (VRV) heat pumps [30,32]. VRV systems are designed to modulate the amount of refrigerant sent to individual evaporators, allowing for precise temperature control in different zones or rooms. This adaptability ensures that each area receives the exact amount of cooling or heating required, optimizing energy consumption. The inherent flexibility of VRV systems makes them especially suitable for buildings with varying occupancy patterns or diverse thermal demands. By adjusting the refrigerant volume based on real-time requirements, VRV systems can achieve significant energy savings, reduce wear and tear on components, and enhance overall system longevity. Their modular design also allows for scalability, making them a viable choice for both small and large installations.
Water heating is a significant energy consumer in buildings, often accounting for a large portion of total energy use. Efficient water heating not only reduces energy consumption but also contributes to a building’s overall sustainability and reduces operational costs.
Solar thermal technology has emerged as a frontrunner in sustainable water heating solutions. Unlike photovoltaic systems that generate electricity, solar thermal systems harness solar radiation directly to produce hot water [40]. Its growing significance is evident from 2019 data, which showed that the global market for solar heating and cooling reached a remarkable 479 GWh [41]. Among the various solar thermal technologies, evacuated solar thermal collectors stand out, offering superior payback periods and efficiency [42].
Geothermal systems offer another innovative approach to water heating. Research into the integration of geothermal systems for water heating at low temperatures has shown promising results. Passive solar systems integrated with geothermal components can achieve reductions in heating loads by over 90% when compared to traditional methods [30]. Furthermore, geothermal heat exchangers (GHE) and geothermal heat pumps (GHP) have been recognized as potent supplementary systems for water heating, providing consistent and efficient thermal energy [43].
Another noteworthy development in the realm of water heating is the advent of solar combi systems. These systems, essentially hybrid thermal power plants, combine solar collectors, biomass heaters, and thermal storage tanks. They excel at meeting thermal energy needs for hot water production at low temperatures, ensuring optimal energy utilization and reduced reliance on non-renewable energy sources [44].
In the modern era of building design and management, the integration of intelligent systems is paramount. Smart thermostats and BEMS stand at the forefront of this technological evolution. These systems not only streamline energy consumption but also potentially optimize it based on real-time data and predictive analytics. Their ability to adapt to changing environmental conditions and occupant preferences ensures both comfort and energy efficiency [31]. The implementation of these systems has consistently shown that they can lead to significant energy savings, making them both technically and economically viable solutions.
Lighting, often a major energy consumer in buildings, has seen transformative advancements with the introduction of LED technology. LED lights, known for their longevity and efficiency, can drastically reduce energy consumption compared to traditional lighting solutions. Several studies [30,45,46] have demonstrated the ability of those systems to provide consistent and high-quality illumination while consuming a fraction of the power, making them an essential component in modern energy-efficient buildings.
Furthermore, the global shift towards sustainable energy solutions has elevated the importance of renewable energy sources, particularly solar and wind turbines. These technologies harness natural resources to generate electricity, reducing dependency on fossil fuels and decreasing carbon footprints. Integrating these renewable sources into a building’s energy system not only diversifies its energy portfolio but also enhances overall energy efficiency. The potential of solar and wind energy, both in terms of capacity and cost-effectiveness, has been well documented, emphasizing their crucial role in the future of building energy management [47,48].
A pivotal element of this research underscores the prevalence of energy measures being integrated as part of extensive retrofitting projects rather than new installations. Balaras et al. [49] investigated the retrofitting of the Hellenic Building stock. Ma et al. [50] proposed a systematic approach to selecting retrofit options and discussed associated activities such as energy auditing, economic analysis, risk assessment, etc. Luddeni et al. [51] proposed an analytical methodology for government and local authorities that aimed to assess the magnitude of achievable energy savings and their respective costs. Ascione et al. [52] proposed and extended SLABE (“Simulation-based Large-scale uncertainty/sensitivity Analysis of Building Energy performance”) to obtain optimal retrofits based on the building location, intended use, and construction type through the use of Latin hypercube sampling and uncertainty analysis. Gabrielli et al. [53] proposed a process for identifying optimal retrofits with the criteria of energy consumption, focusing on good reliability and economic viability. The economic effect of retrofits has also been extensively reported by Gabrielli et al. [54] and Tuominen et al. [55]. When considering expansive retrofit projects, Swan et al. have proposed methods for the modelling of end-use energy consumption [56]. Additionally, Pittarello et al. have demonstrated an artificial neural network (ANN) approach for optimizing zero-energy building projects in the design stage [57].
1.3. Research Aim
This article constitutes the second part of the overall work implemented within the framework of the project “Sustainable Actions for Viable Energy” (SAVE), funded by the European Commission’s Horizon 2020 project “New Energy Solutions Optimized for Islands” (NESOI) [58]. In the first part, the work accomplished and the calculated results for the energy performance upgrade of the municipal sports center in Arkalochori, Crete, Greece, were presented. In this second and final part, similarly, the implemented work and the anticipated results from the energy performance upgrade of the indoor sports hall in the same town are analyzed. As with the first part of this work, the target for the indoor sports hall under study is its upgrade to a zero-energy facility. The most technically feasible and economically competitive passive and active measures were examined and proposed for the specific facility after detailed computational simulation, siting, and sizing. The article aims to constitute an essential holistic reference (approach, mathematical formulation, data and assumptions, application details, and results) for the study and the design of similar energy performance upgrade projects for indoor sports halls.
The whole SAVE project was implemented by the Minoan Energy Community [59]. Apart from the energy performance upgrade of the municipal sports facilities, the SAVE project was integrated with the design at the application level of the first smart grid in Crete, including decentralized production and storage and certain demand-side management strategies. The SAVE project was awarded with the public award of the Islands Gamechanger competition [60], organized by the European Commission’s Secretariat of the “Clean Energy for EU Islands” initiative and the NESOI Consortium.
2. The Sports Facility
The indoor sports hall under study is located in Arkalochori, Crete. Arkalochori is a small town with a population of 5000, located at the center of the mainland of the Regional Unit of Heraklion. It is situated approximately 25 km from the northern and southern coastlines of the island and has an elevation ranging between 350 m and 400 m.
The indoor sports hall (Figure 1a) was constructed in the mid-nineties. It belongs to the local municipality and hosts several sports activities, either by the local sports club or the municipal sports department, as well as the official basketball games of the local team. The sports complex facility comprises two distinct sections (Figure 1b), the main sports hall, with an area of 1196 m2 and 7 m height, and the auxiliary building, which hosts the changing rooms, a canteen, offices, a gym room, medical service, etc., with a covered area of 269 m2 and 3.2 m height. More details on the building’s structural elements and geometry are given in Section 5.2.1.
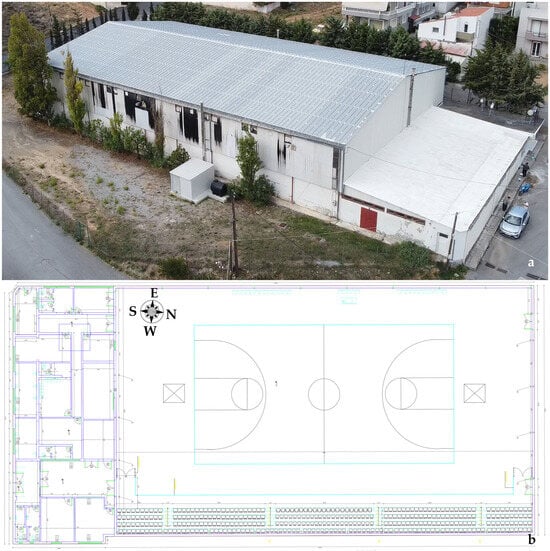
Figure 1.
General aerial view (a) and top view drawing (b) of the indoor sports hall in Arkalochori.
3. Methodology
The methodology applied unfolds into the following steps:
- collaboration with the municipal authority and the establishment of an open communication line with the staff responsible for the operation and maintenance of the facility;
- onsite inspection of the sports facility and collection of data regarding the existing conditions, including the architectural and construction elements, the systems’ properties and operation schedules, and the energy demand;
- initial computational simulation of the existing condition and calculation of annual indoor space heating and cooling load;
- calculation of the primary energy consumption to fully cover all energy end uses, including the existing active systems for indoor space conditioning, domestic hot water, and lighting;
- selection, siting, and sizing of the most technically feasible and cost-effective passive interventions, aiming primarily at the minimisation of the cooling and heating energy demand;
- second computational simulation of the sports facility’s operation in the suggested situation including the proposed passive measures and computation of the indoor space heating/cooling loads in annual operation;
- selection and sizing of the most technically feasible and cost-effective active measures for indoor space conditioning, domestic hot water production, and lighting;
- calculation of the primary energy consumption for full coverage of all energy demand with the proposed active systems;
- sizing and siting of a photovoltaic system, for the annual covering of the remaining electricity consumption;
- calculation of the annual energy savings for the retrofit scenario, the project’s total budget, and other typical key performance indicators (KPIs).
All the aforementioned calculations, both for passive and active systems, were executed through computational simulations using hourly time series over the course of a year. The mathematical background and calculation process are detailed in Section 5. A graphical representation of the methodology followed is provided in Figure 2.
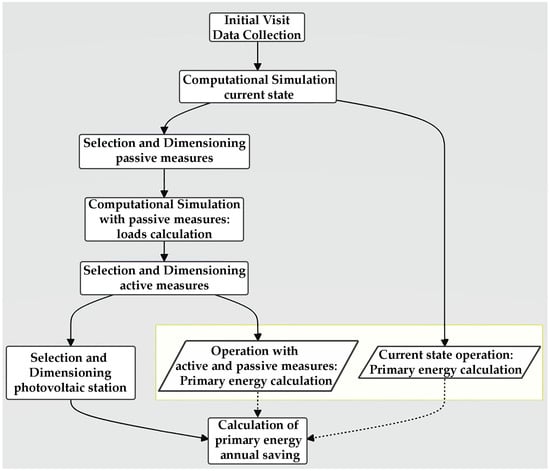
Figure 2.
The methodology logical flow chart.
Finally, regarding the data used in this study:
- the climatic data were sourced from the European Centre for Medium-Range Weather Forecasts (see Section 4);
- properties of the proposed new equipment and materials were retrieved from the manufacturers’ manuals and datasheets;
- thermophysical and optical properties of the building’s construction elements are either calculated or sourced from existing literature.
4. Climate Conditions—Meteorological Data
The local climate in Arkalochori is characterized by a rather mild winter, with ambient temperatures usually ranging between 5 °C and 15 °C, and a cool summer, with ambient temperatures rarely exceeding 30 °C. In this work, meteorological data were retrieved from the available climate data in the European Centre for Medium-Range Weather Forecasts (ECMWF) for the period 2010–2020 [61] for a specific geographical point only 13.5 km to the north of the town. All climatic data were used in terms of annual time series with hourly average values. Indicatively, in Figure 3, Figure 4 and Figure 5, the ambient temperature, relative humidity, and wind speed at 2 m above ground are presented, respectively, for the two consecutive years 2019 and 2020.
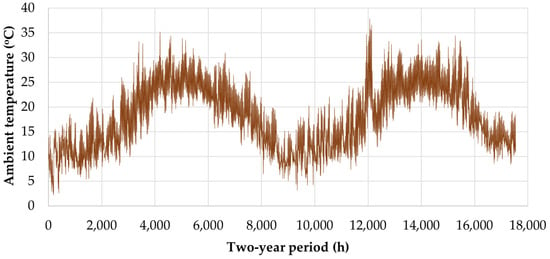
Figure 3.
Hourly ambient temperature in the 2-year period from 2019 to 2020 in Arkalochori.
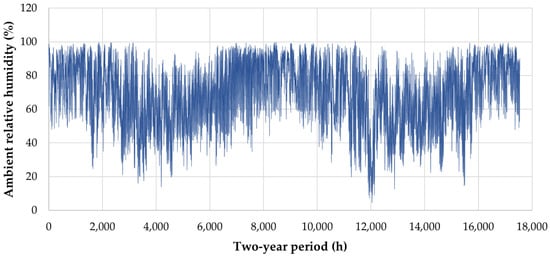
Figure 4.
Hourly ambient relative humidity in the 2-year period from 2019 to 2020 in Arkalochori.
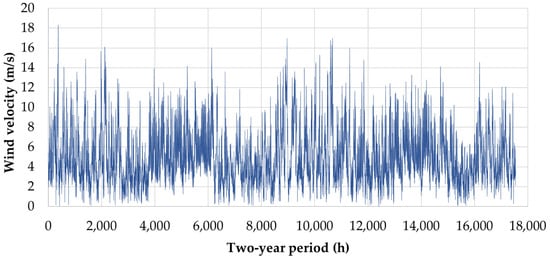
Figure 5.
Hourly Wind speed fluctuation in the 2-year period from 2019 to 2020 at 2 m above ground in Arkalochori.
These figures reveal a certain annual periodicity; e.g., the annual average ambient temperature for 2019 and 2020 was 18.0 °C and 18.1 °C, respectively, while the annual average wind speed for 2019 and 2020 was 4.9 m/s and 5.1 m/s, respectively.
In Figure 6, the annual wind rose graph for the year 2020 is presented, showing a predominant northwest wind direction. This pattern is influenced by the consistent regional northwest summer winds, known as “meltemia”, which contribute to a cooler summer climate.
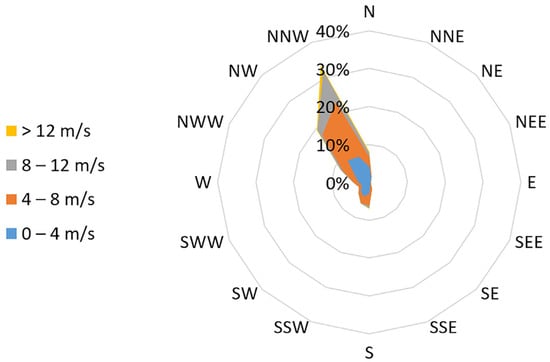
Figure 6.
Wind rose graph at 2 m above ground in Arkalochori for the year 2020.
Finally, Figure 7 illustrates both the hourly average incident solar irradiance and the daily cumulative solar irradiance on the horizontal plane for the year 2020. The annual cumulative incident solar radiation on the horizontal plane is calculated at 1675 kWh/m2, indicating a remarkable solar potential in the studied area.
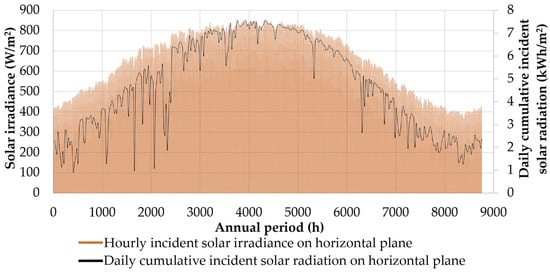
Figure 7.
Hourly average incident solar irradiance and daily cumulative solar radiation on the horizontal plane for the year 2020 in Arkalochori.
Based on the presented meteorological data, it is concluded that the climate conditions in the geographical area under study are relatively mild, with winter temperatures never dipping below 0 °C and summer temperatures rarely higher than 32 °C. The area also experiences consistent northwestern winds, even in summer, which maintain both ambient temperature and relative humidity within the bounds of thermal comfort. These characteristics align with the typical features of a “Mediterranean Climate”. Furthermore, the area boasts high levels of incident solar radiation, thereby creating highly favorable conditions for both power generation via photovoltaic panels and heat production via solar thermal collectors, as well as for the integration of passive measures to optimize the buildings’ thermal performance and natural lighting.
The time-series of climatic parameters presented above are then used in this study for the calculation of the indoor space conditioning load, the electricity yield from the photovoltaic panels, and the heat production from the solar thermal collectors.
5. The Energy Performance Upgrade of the Indoor Sports Hall
5.1. Current State
Currently, the main sports hall lacks an active indoor cooling system. It is equipped with two central oil burners, each having a nominal thermal capacity of 291 kW, coupled with a hydraulic network and 22 hydronic terminal units for heating. This system was installed in 2021 to accommodate the heating needs of the main sports hall, which served as a temporary shelter for homeless residents following a 6.1 Richter earthquake in September 2021. The existing central heating system, which consists of an oil boiler, a hydraulic network, and radiators, serves only the auxiliary building and remains unused due to the high cost of diesel oil. For hot water production in the changing rooms, an electric boiler is employed. A single autonomous heat pump (split unit) is installed in the facility’s main administrative office. The lighting equipment, both indoors and outdoors, consists of outdated, inefficient luminaires fitted with fluorescent lamps and halogen floodlights.
The only energy source currently in use at the indoor sports hall is electricity, allocated for hot water production, indoor lighting, and the existing heat pump. Diesel oil consumption was limited to the winter of 2021–2022 when the facility housed homeless residents from the above-mentioned earthquake. According to the municipal authority’s electricity bills, the actual annual electricity consumption for the facility in 2019 was 19,804 kWh. However, the anticipated energy consumption—assuming the facility operates year-round with full indoor space conditioning via the existing infrastructure—would be considerably higher, as will be detailed in the subsequent section.
5.2. Energy Consumption in the Existing Situation
The energy consumption of the indoor sports hall in its current state is categorized into the following discrete end uses:
- Indoor space conditioning;
- domestic hot water production;
- indoor and outdoor space lighting.
For these specified end uses, the annual electricity and diesel oil consumption in the municipal indoor sports hall, based on the assumption of year-round operation and complete energy coverage, is discussed in subsequent sections. It should be noted that, at the time of composing this article, no measurements regarding the variables presented in the following sections have been conducted. All reported results were obtained through computational simulations corresponding to each passive or active system.
5.2.1. Indoor Space Conditioning
The thermal performance of the indoor sports hall was computationally simulated over an annual period with hourly average time steps. The overall sports facility was divided into two thermal zones: the main sports hall and the auxiliary building.
The main sports hall has been constructed with a metallic-bearing structure. Its vertical surfaces have been constructed with bricks for the first 3 m of height and semi-transparent polycarbonate panels for the remaining 4 m, as illustrated in Figure 1a. The main sports hall’s roof is covered with synthetic polyurethane panels, which are significantly deteriorated due to inadequate sealing, age-related wear, and rainwater infiltration. The auxiliary building is constructed with concrete and bricks, with no insulation. All existing openings in the overall facility have metallic frames and single glazing.
To compute the heating and cooling loads, the American Society of Heating, Refrigerating and Air-Conditioning Engineers (ASHRAE) transfer function method (TFM) [62,63] was applied through a relevant simulation developed with the TRSNSYS 17.0 software.
The thermal transmittance U-factors for all the opaque surfaces were calculated by using the essential Equation (1) from 3 W/m2∙K for the vertical brick walls to 5 W/m2∙K for the semi-transparent polycarbonate panels:
where dj and kj stand for the thickness and thermal conductivity of the structural material j of the opaque construction element, respectively.
The convective heat transfer coefficients from the inner space hi and towards the outer space ho (or vice versa in the cooling period) were set equal to [64]:
- hi = 10 W/m2∙K and ho = 25 W/m2∙K for air flow over horizontal surfaces and for an average wind speed of 5 m/s;
- hi = 7.7 W/m2∙K and ho = 25 W/m2∙K for air flow next to vertical surfaces and for an average wind speed of 5 m/s.
The U-factors for the openings were set equal to 7 W/m2∙K and the solar heat gain at 0.77, according to the TRNSYS 17.0 library. The high solar radiation penetration from the semi-transparent panels increases considerably the solar gains in the main sports hall and creates an unpleasant environment with too high indoor temperatures during the summer months. On the other hand, the high U-factor of the same structural elements leads to increased heat losses during winter and the configuration of an unpleasant, cold indoor environment during winter.
The ventilation rate due to air permeability through the openings was calculated by Equation (2) [65], introduced by ASHRAE (ACH: air changes per hour):
where uw is the average wind speed, Tin and Tamb are the indoor space and the ambient temperature (Figure 3, Section 4), while the parameters K1, K2, and K3 are set equal to 0.100, 0.023, and 0.070, respectively, for the existing, inadequate sealing condition of the openings.
Indoor air temperature and relative humidity for thermal comfort conditions were set at 22 °C/50% in winter and 26 °C/50% in summer [66,67]. The sports facility operates daily from 14:00–23:00, plus roughly 15 basketball games per year for the local team during weekends.
The annual heating and cooling load for the existing indoor sports facility was calculated to be 79,144.6 kWh and 101,981.9 kWh, respectively. Considering the total conditioned area of 1426.7 m2, the specific annual heat consumption was calculated at 55.5 kWh/m2 for heating and 71.5 kWh/m2 for cooling.
Assuming that the existing oil burners will fully meet the annual heating needs for both the main sports hall and the auxiliary building and that hypothetical heat pumps with energy efficiency ratios (EER) between 1.5 and 3.2 will be used for cooling, the projected annual consumption of diesel oil and electricity is summarized in Table 3. The electricity consumption for indoor space cooling is calculated from the following fundamental equation:

Table 3.
Energy consumption breakdown for indoor space conditioning in the existing operation.
The efficiency of the newly installed oil burners was set at 83.5%, while the older unit was rated at 75% efficiency. The efficiency of the hot water hydraulic network was set at 80%, and the hydronic terminal units were assumed to operate at an efficiency of 91.8%. Finally, the calorific value of diesel was set at 10.25 kWh/L [67]. In compliance with the Greek Directive on Building’s Energy Performance [67], the primary energy electricity conversion factor is 2.9; therefore, the primary energy of electricity consumption is simply calculated by multiplying the final electricity consumption with the factor 2.9. Likewise, the primary energy equivalent of consumed diesel oil is obtained by multiplying its initial chemical energy by a factor of 1.1.
5.2.2. Domestic Hot Water Production
Domestic hot water consumption in the indoor sports hall exists in the changing rooms. The arisen annual heat demand for the production of the required domestic hot water amount is simply calculated with the following essential equation:
where:
- is the mass flow rate of the consumed hot water;
- cp = 4.187 kJ/kg∙K the water specific heat capacity;
- Thw = 45 °C the hot water required temperature;
- Tsw the water temperature from the municipal water supply network. given by the Technical Directive 20701-1/2017 [68] (from 12.8 °C in February to 26.6 °C in August).
The hourly calculation of the consumed hot water was calculated, based on the information provided by the management of the indoor sports hall. It was assumed that between 17:00 and 23:00, there would be 12 to 16 showers per hour, with each user consuming 40 L of hot water. Based on these assumptions, an annual time series was developed to represent the fluctuating demand for domestic hot water in the indoor sports hall. This data is graphically presented in Figure 8.
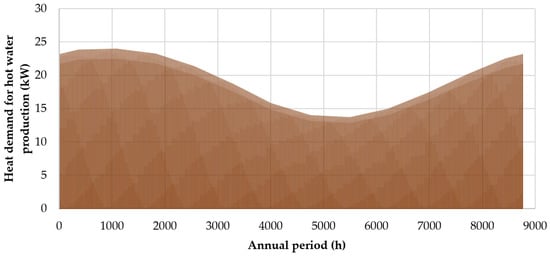
Figure 8.
Hourly heat demand for the domestic hot water needs throughout a year of operation of the indoor sports hall.
Τhe annual hot water demand in the indoor sports hall is calculated to be equal to 41,327.3 kWhth, obtained by summing the hourly values from the annual time series in Figure 8.
To estimate the consumption of energy resources to meet this hot water demand, it is assumed that:
- During the winter period, which spans from 16 October to 14 April, the existing oil burner in the auxiliary building will be used both for indoor space heating and domestic hot water production.
- During the summer period, namely from 15 April to 15 October, the existing electrical boilers will be employed for hot water production.
Based on these heat demands, Table 4 presents the consumption of electricity, diesel oil, and primary energy. The efficiencies and calorific values of the diesel oil, as specified in the previous section, were used for the existing oil burner and the distribution network.

Table 4.
Energy consumption analysis for domestic hot water production in the existing operation.
5.2.3. Lighting
Lighting represents an important final energy use in the indoor sports hall under study. The lighting needs are broken down as follows:
- Indoor lighting in the main sports hall is provided by 32 mercury floodlights and 4 halogen floodlights, with a nominal electrical power of 250 W and 400 W, respectively.
- Indoor lighting in the auxiliary building utilizes fluorescent lamps fitted in 28 outdated plastic luminaires without reflective surfaces.
- Outdoor perimeter lighting for the entire facility is supplied by 4 mercury floodlights, each with a nominal electrical power of 250 W.
The annual electricity consumption for lighting can be calculated by considering the installed electrical power of the existing fixtures and the daily operational hours for each distinct area within the facility. The results are presented in Table 5. The specified nominal power ratings are based on the labels of the installed bulbs and floodlights.

Table 5.
Electricity consumption for lighting in the current operation state.
5.2.4. Other Electricity Consumptions
In addition to the primary energy uses of indoor space conditioning, domestic hot water production, and lighting, the indoor sports hall also consumes electricity for the following equipment:
- Three circulators for the heating hydraulic network: two with a nominal electrical input of 150 W each for the main sports hall, and one with a nominal electrical input of 100 W for the auxiliary building.
- Twenty-two (22) fans for the hydronic terminal units in the main sports hall, each with a nominal electrical input of 183 W.
Based on the annual heating load time series for Thermal Zone 1 (main sports hall) and Thermal Zone 2 (auxiliary building), the total annual operating hours for the heating systems, and consequently for the associated circulators, are calculated to be 2696 and 1456 h, respectively.
The total annual electricity consumption for these additional devices is calculated as follows:
- 808.8 kWh for the main sports hall heating network circulators
- 145.6 kWh for the auxiliary building heating network circulators
- 10,854.1 kWh for the hydronic units.
The aggregate annual electricity consumption for these auxiliary systems amounts to 11,808.5 kWh, which corresponds to 34,244.6 kWh of primary energy.
5.2.5. Synopsis Regarding the Energy Consumption in Existing Conditions
A comprehensive summary of the annual energy consumption, broken down by energy carriers—namely diesel oil and electricity—is provided in Table 6. This table also presents the corresponding primary energy consumption for each distinct category of final energy use.

Table 6.
Annual energy consumption assuming full operation of the municipal sports center throughout a year under the current state.
As illustrated in Table 6, the primary driver of energy consumption in the municipal indoor sports hall is associated with heating loads, accounting for 78.5% of the total primary energy use. Electrical energy consumption for lighting also comprises a significant portion, contributing 12.8% to the total. When the overall annual primary energy consumption is normalized by the conditioned indoor area, the specific annual primary energy consumption is calculated to be 277.1 kWh/m2.
5.3. Proposed Energy Saving Measures
Τhe energy performance upgrade of the indoor sports hall under study was approached with a wide cluster of the most mature, effective, and economically competitive passive and active measures. Specifically, starting with the passive measures:
- Replacement of all existing semi-transparent polycarbonate panels from the vertical walls of the main sports hall with stone wool panels of 8 cm thickness, with a total net surface of 579.4 m2 and U-factor of 0.38 W/m2∙K.
- Installation of external insulation on all vertical opaque surfaces made of reinforced concrete or bricks using 7 cm thick stone wool sheets. The new U-factors are calculated to be 0.40 W/m2∙K for the structural parts of the opaque surfaces and 0.34 W/m2∙K for the brick walls. The total opaque area to be insulated is 471.7 m2.
- Replacement of all synthetic polyurethane panels on the main sports hall’s roof, which measures 1230 m2, with 8 cm thick stone wool panels. The new U-factor is calculated to be 0.39 W/m2∙K.
- Installation of external insulation on the auxiliary building’s roof of 304 m2 total area, using 7 cm thick stone wool sheets. The new U-factor is calculated to be 0.40 W/m2∙K.
- Replacement of all existing openings in the facility, with new ones featuring low-e technology, synthetic frames, and double glazing. The new U-factors will be 0.95 W/m2∙K for the windows and 1.2 W/m2∙K for the doors. A total of 46 windows and 5 doors will be installed, covering total areas of 44.6 m2 and 16.6 m2, respectively.
- Installation of 54 solar tubes on the main sports hall’s roof, arranged in a 6 × 9 layout, to maximize natural daylight.
Additionally, the following active systems are proposed:
- Installation of an air-to-water heat pump with a nominal capacity of 150 kWth for heating and 149 kWth for cooling for the main sports hall. This heat pump will utilize the existing hydraulic network and the 22 hydronic terminal units with a nominal capacity of 6.5 kWth each for both heating and cooling. The oil burners will be removed.
- Installation of a second air-to-water heat pump with nominal capacities of 11.2 kWth for heating and 10.0 kWth for cooling for the auxiliary building, along with a new hydraulic network and new hydronic terminal units. A total of 12 new hydronic units will be installed, with capacities ranging from 1.6 kWth to 2.7 kWth.
- Installation of a solar-combi system featuring 24 solar collectors, each with an absorber surface of 2.4 m2, and two heat storage tanks with capacities of 2000 L each. The system is supported by a third air-to-water heat pump with a nominal heating capacity of 23 kWth. The layout of this system is depicted in Figure 9. The solar collectors will be installed on the ground, on the south side of the facility, with an inclination of 30° relative to the horizontal plane and a southern orientation to maximize the annual captured solar radiation.
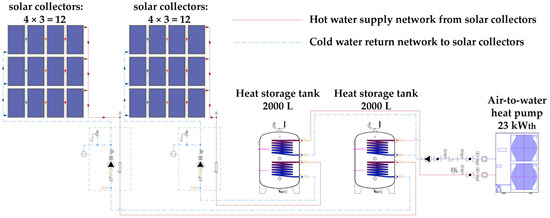 Figure 9. Layout of the proposed system for the production of domestic hot water.
 - Replacement of all existing lamps and luminaires for both indoor and outdoor lighting with new fixtures featuring reflective surfaces and LED technology. A total of 4 outdoor luminaires and 47 indoor luminaires in the auxiliary building will be replaced, while 40 new LED floodlights will be installed in the main sports hall. The total installed lighting power will be reduced from 18.4 kW to 8.4 kW, a decrease of 54.4%.
- Lastly, a photovoltaic plant will be installed on the roof of the main sports hall to offset the remaining electricity consumption. The use of diesel oil will be completely eliminated with the removal of the existing diesel oil burners.
- Finally, a photovoltaic plant will be installed on the main sports hall’s roof to compensate for the remaining electricity consumption. The use of diesel oil will be totally eliminated with the removal of the diesel oil burners.
It is worth clarifying that small wind turbines could also be considered for electricity generation at the facility, given the abundant wind resources at the site. However, this option was not pursued due to the challenges of public acceptance when installing small wind turbines in urban environments. Additionally, given the plentiful biomass resources in the area, primarily from olive tree pruning, biomass is another attractive option for indoor heating and domestic hot water production. This option was also dismissed because it cannot support indoor cooling and would require significant human resources and working hours for biofuel supply and regular maintenance of the biomass burner.
5.4. Energy Consumption with the Proposed Energy-Upgrading Interventions
In this section, the anticipated energy savings and production outcomes are presented and categorized according to each specific final energy use. These projections are based on the passive and active energy upgrade measures that have been proposed.
5.4.1. Indoor Space Conditioning
Firstly, the indoor space heating and cooling load is calculated under the assumption that all proposed passive measures have been applied to the building’s overall envelope. The calculation procedure remains consistent with the one outlined in Section 5.2.1. As a result of the proposed passive measures, the newly achieved U-factors for the building’s discrete envelope components are listed in Table 7. All of these U-factors are substantially lower than the maximum acceptable limits set by the Greek Directive of Building’s Energy Performance [67]: 0.5 W/m2∙K for opaque surfaces (walls and roofs) and 2 W/m2∙K for openings.

Table 7.
U-factors of the building’s envelope discrete structural elements for the situation with the proposed passive measures.
Equation (2) is employed again to calculate the natural ventilation from the newly proposed openings, albeit this time with improved values for parameters K1, K2, and K3, which are set at 0.100, 0.011, and 0.034, respectively. These values assume effective air sealing of the new openings. The computational simulation of the building’s overall thermal performance is again conducted using TRNSYS 17.0 software.
The hourly total heating and cooling load for both thermal zones (encompassing the entire building) over a year of operation is depicted in Figure 10. The first part of Figure 10 (Figure 10a) represents the load under the current operating conditions, while the second part (Figure 10b) illustrates the load after the proposed integration of passive measures.
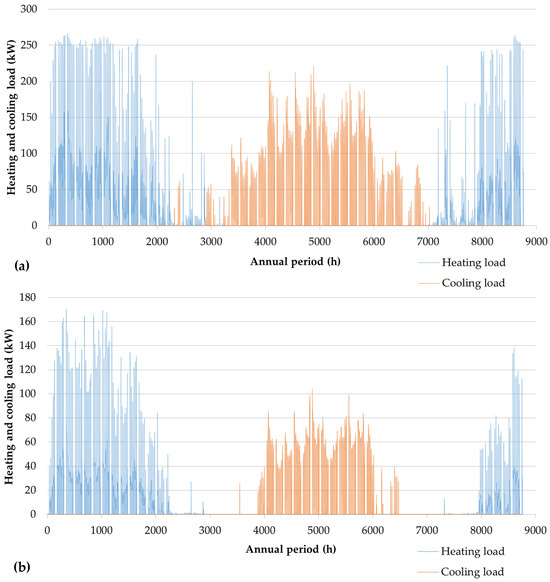
Figure 10.
Hourly space heating and cooling load for the indoor sports hall overall building facility throughout a year of operation, (a) before and (b) after the implementation of the proposed passive measures.
The annual heating and cooling load for the entire building facility is presented in Table 8, both before and after the proposed passive measures are hypothetically implemented. The consequent reduction in the annual heating and cooling load is also detailed. As evidenced by Table 8, an approximate annual reduction in heating and cooling load by 60% is anticipated, a result that aligns logically with the current facility’s notably inefficient thermal performance.

Table 8.
Reduction in indoor space conditioning load of the overall sports facility due to the application of the proposed passive measures.
The heating and cooling load of the indoor sports facility, under the proposed operational state, is anticipated to be managed by two air-to-water heat pumps, as described in Section 5.3. The first heat pump, of a larger nominal capacity (150 kWth for heating and 149 kWth for cooling), is intended for the main sports hall. The second, smaller heat pump (with a nominal capacity of 11.2 kWth for heating and 10.0 kWth for cooling) is planned for the auxiliary building. The purpose of the second, smaller pump is to ensure autonomous climate control for the auxiliary building during periods when the main sports hall may be unoccupied. At the same time, through hydraulic automation and electronic control, the larger heat pump is designed to accommodate the climate control needs of the entire facility, should the total heating or cooling load not surpass its nominal capacity.
The existing hydraulic network, along with the 22 hydronic terminal units, is planned to be utilized for the main sports hall. For the auxiliary building, the installation of a new hydraulic network is proposed, featuring polypropylene (PPR) pipelines and 12 new hydronic terminal units.
New coefficient of performance (COP) and energy efficiency ratio (EER) curves as functions of ambient air temperature have been introduced for both proposed heat pumps and are depicted in Figure 11.
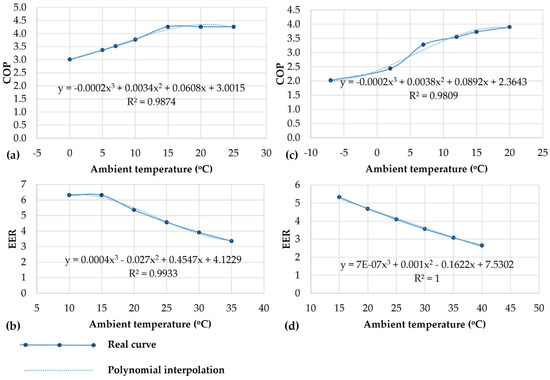
Figure 11.
COP and EER curves versus ambient temperature of the large size (a,b) and the small size (c,d) heat pump introduced for the indoor space conditioning of the sports facility.
The electricity consumption from these heat pumps is calculated from Equation (5) (Qh the heating load) for heating and from Equation (3) for cooling.
The anticipated savings in energy resources for the indoor space conditioning of the sports facility are analyzed in Table 9. It is projected that diesel oil consumption will be eliminated, and an exceptional annual saving of 77.4% in consumed primary energy is expected for the overall indoor space conditioning of the sports facility.

Table 9.
Energy resources saving results for indoor space conditioning in the sports facility after the application of the proposed passive and active measures.
5.4.2. Domestic Hot Water Production
A solar-combi system is proposed for domestic hot water production in the indoor sports hall. The overall layout of this proposed system is presented in Figure 9, Section 5.3. In practice, the system comprises two identical parts. Each part consists of 12 solar collectors, arranged in three parallel groups, with four collectors connected in series in each group. Each part also includes a heat storage tank with a capacity of 2000 L. An air-to-water heat pump with a nominal heating capacity of 23 kWth is integrated as a backup unit for both storage tanks. The aforementioned sizing arises from the dimensioning procedure briefly described below.
The operation algorithm of the proposed system is simple, and it is analysed in the following steps (see also Figure 9):
- if Tsol > Tst, the circulator of the solar collectors’ primary closed loop turns on, and heat transfer takes place from the solar collectors to the heat storage tanks;
- if Tsol ≤ Tst, then the heat produced by the solar collectors cannot be transferred to the heat storage tanks, and the circulator of the solar collectors’ primary loop remains off;
- if Tst < Thw, then the back-up unit (the heat pump) is turned on;
- where:
- Tsol: the supplied water temperature from the solar collectors;
- Tst: the stored water temperature in the heat storage tanks;
- Thw: the required hot water temperature.
Another significant consideration concerning the efficiency of the proposed solar-combi system is the inclination angle of the solar collectors. Iterative calculations were conducted to determine the total incident solar radiation on an inclined, south-facing surface for various inclinations relative to the horizontal plane. These calculations were based on the geographical coordinates of the installation site and adhered to the fundamental principles of solar geometry and radiation [62]. These results are presented in Table 10.

Table 10.
Calculation of the total incident annual cumulative solar radiation on a flat surface versus its inclination at the geographical location of the municipal sports center.
According to Table 10, the maximum annual received cumulative solar radiation is achieved at a 30° inclination. However, for this specific case, the primary focus is to maximize the cumulative solar radiation during the winter months (from 15 October to 15 March). Given this criterion, the optimum inclination is found at 50° inclination. To strike a balanced approach, aimed at maximizing winter operation without significantly affecting the overall annual heat production, a final inclination of 40° was adopted. Figure 12 presents the annual fluctuation of incident solar irradiance on a flat surface inclined at 40° at the geographical site of the indoor sports hall.
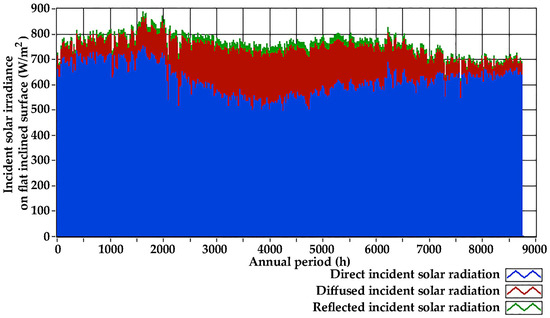
Figure 12.
Annual fluctuation of the incident solar irradiance on a flat area with 40° inclination at the geographical site of the indoor sports hall.
The sizing of the proposed solar-combi system was achieved through the computational simulation of the system’s annual operation, following the aforementioned simple operation algorithm.
The methodology for sizing the proposed solar-combi system, previously detailed in Part A of this series, is revisited herein for the sake of comprehensiveness.
The computational simulation of the proposed solar-combi is based on the following data:
- the 1-year period hourly time-series of the total incident solar irradiance on the 40° inclined surface (Figure 12);
- the 1-year period hourly time-series of the heat demand for domestic hot water production (Figure 8, Section 5.2.2);
- the water-specific heat capacity (4.187 kJ/kg∙K);
- the minimum set point of the domestic hot water temperature Thw, set equal to:
- -
- from the 1st of January to the 30th of April: 40 °C
- -
- from the 1st of May to the 30th of June: 35 °C
- -
- from the 1st of July to the 15th of September: 30 °C
- -
- from the 16th of September to the 15th of November: 35 °C
- -
- from the 16th of November to the 31st of December: 40 °C;
- typical geometrical and thermo-physical features of a collective plate, flat solar collector’s model [44];
- typical geometrical and thermo-physical features of a heat storage tank with a 2000 L storage capacity (2.4 m height, 1.3 m diameter, 10 mm insulation thickness, and a total U-factor of 0.22 W/m2∙K).
The computational simulation of the system’s annual operation was iteratively conducted for various numbers of solar collectors and heat storage tanks. The minimization of the heat production specific cost from the solar-combi system serves as the optimization criterion and is calculated as follows:
where:
- ΝSC: the solar collectors’ total number in the system;
- CSC: the procurement cost of one solar collector, adopted to be equal to EUR 450;
- ΝSΤ: the quantity of heat storage tanks in the system, with storage capacity of 2000 L;
- CSΤ: the procurement cost of one 2000 L heat storage tank, adopted to be equal to EUR 6000;
- ESC: the annual heat demand coverage for domestic hot water production from the solar-combi system;
- ΤLP: the solar-combi system’s life span, adopted as equal to 15 years.
Additionally, an annual coverage of at least 45% of the final heat demand by the solar collectors was adopted as a sizing requirement.
It should be mentioned that the above-presented specific cost is just indicative, as it does not include other components of the solar-combi system set-up cost, such as the required hydraulic network or control devices, or any other component of the annual operation cost (such as heat pump maintenance or the cleaning of the solar collectors). However, a more precise calculation is not considered necessary in this work because it is used only as a comparative evaluation criterion between the explored dimensioning scenarios.
The mathematical background for calculating the thermal power production from the solar collectors and the heat storage in the tanks is detailed in [44,69].
Following the iterative execution of the aforementioned sizing process, the results are summarized in Table 11. The annual heat demand for domestic hot water production is 41,327.3 kWh.

Table 11.
Results from the iterative dimensioning process of the solar-combi system.
Based on the results in Table 11, the minimum heat production specific cost with annual heat demand percentage coverage from the solar collectors of at least 45% is achieved by 24 collectors and two heat storage tanks of 2000 L each.
Figure 13 presents the annual fluctuation of the heat demand coverage from the solar collectors and the heat pump.
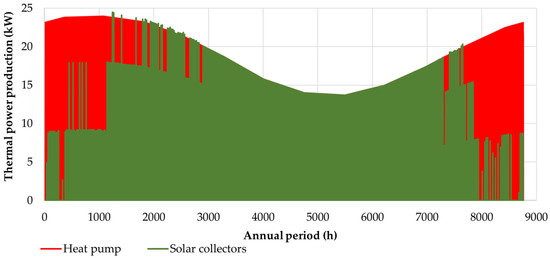
Figure 13.
Annual heat demand coverage for domestic hot water production from the solar collectors and the heat pump in the indoor sports hall.
The annual fluctuation of the supplied hot water temperature from the solar collectors’ primary loop to the heat storage tanks is also presented in Figure 14.
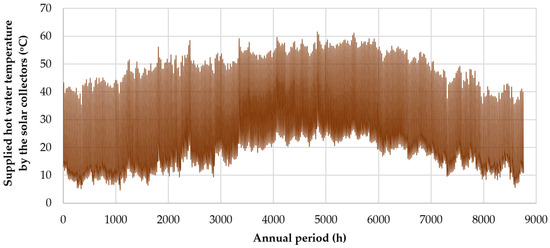
Figure 14.
Annual fluctuation of the supplied hot water temperature from the solar collectors’ primary loop to the heat storage tanks.
The proposed solar-combi system achieves energy savings for the production of domestic hot water in the indoor sports hall on two levels:
- the 47.6% contribution from solar collectors toward the annual heat demand;
- The complete elimination of diesel oil consumption, which is replaced by electricity.
The electricity consumption from the heat pump for domestic hot water production is calculated using Equation (3). The COP curve versus the ambient temperature presented in Figure 11c is employed. The ambient temperature curve presented in Figure 3 is used, while the heat demand Qh for hot water production has been supplied in Figure 8. The energy resource-saving results for domestic hot water production in the indoor sports hall are summarized in Table 12.

Table 12.
Energy resources saving summary for domestic hot water production in indoor sports hall.
5.4.3. Lighting
The interventions for the improvement of the lighting operation in the indoor sports hall contain both passive and active measures:
- The passive measures entail the installation of 54 solar tubes on the main sports hall’s roof, arranged in nine parallel rows along the hall’s longitudinal axis, each row containing six tubes, as illustrated in Figure 15. This figure also presents photometric results at 1 m above ground level, demonstrating natural light penetration solely through the proposed solar tubes, captured on a typical summer day at 12:00 a.m. Comparable results for a typical sunny winter day at 12:00 a.m. are shown in Figure 16. According to the Greek Directive on Building’s Energy Performance, the minimum required illuminance at 1 m height is set at 300 lux. As observed in Figure 15 and Figure 16, the proposed number and arrangement of solar tubes fulfill the lighting requirements for both sunny winter and summer days.
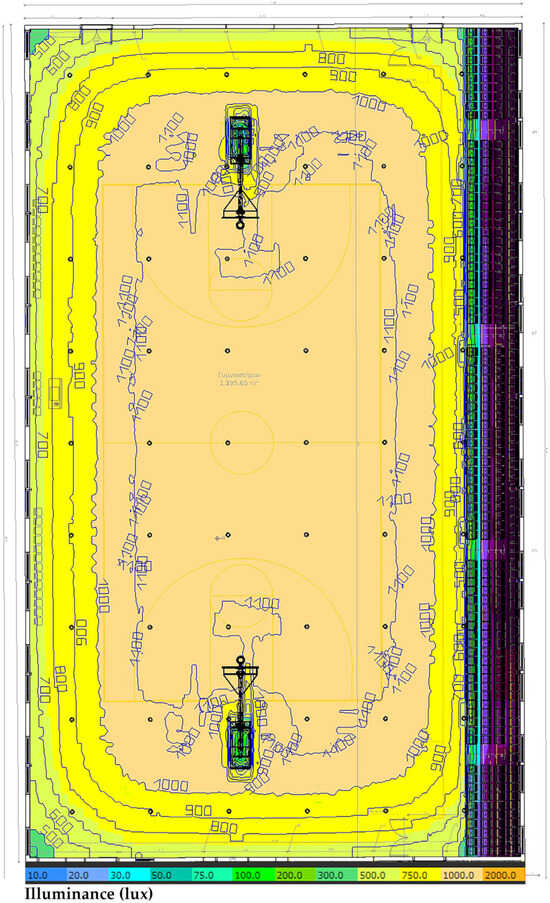 Figure 15. Solar tubes arrangement and photometric results from natural lighting in the main sports hall in typical sunny summer day at 12:00 a.m.
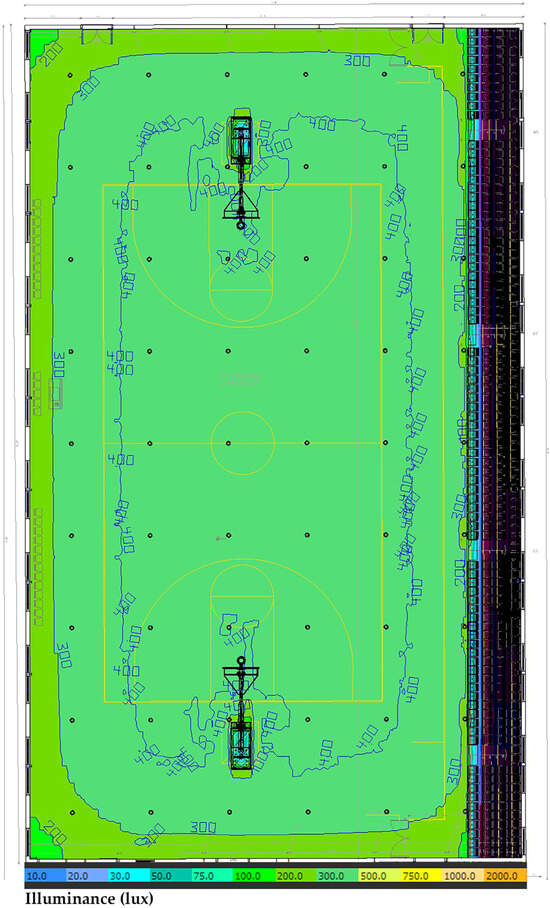 Figure 16. Solar tubes arrangement and photometric results from natural lighting in the main sports hall in typical sunny winter day at 12:00 a.m.
- With these solar tubes, it is anticipated that natural lighting will fully cover the lighting needs of the main sports hall during the day for most days of the year. This intervention is also expected to fully offset the reduction in natural lighting due to the substitution of the existing semi-transparent and energy-inefficient polycarbonate panels with opaque stone wool panels.
- Regarding active measures, practically all existing mercury and halogen floodlights in the main sports hall and outdoor areas, as well as outdated fluorescent lamps and luminaires, will be completely replaced with LED floodlights and lamps equipped with reflective surfaces. Specifically, the 32 existing mercury and 4 halogen floodlights in the main sports hall will be replaced by 40 LED floodlights, arranged in eight rows of five units each, with a nominal electrical power input of 147 W and a nominal luminous flux of 22,000 lumens. Photometric results in the main sports hall with this proposed lighting equipment are provided in Figure 17. As demonstrated in this figure, the illuminance requirements are fully met with this proposed floodlight arrangement. All photometric calculations for this section were performed using DIALux evo 11 [70].
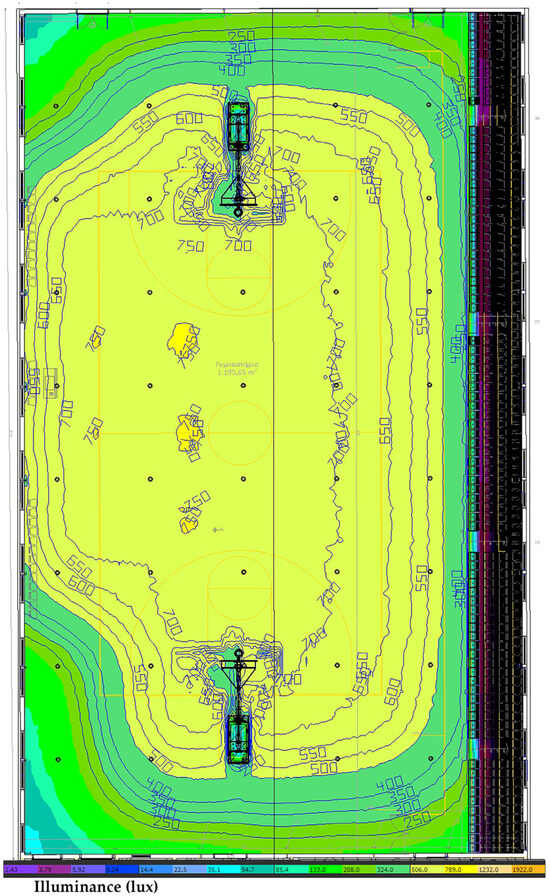 Figure 17. LED floodlights arrangement and photometric results from artificial lighting in the main sports hall.
Additionally, a total of 47 fluorescent luminaires and lamps in the discrete rooms of the auxiliary building will be replaced with LED lamps and luminaires featuring reflective surfaces.
The reduction in electrical power consumption for lighting in the indoor sports hall, along with the annual electricity savings, are presented in Table 13.

Table 13.
Summary of the achieved electrical power drop and respective electricity saving for lighting purposes in the municipal indoor sports hall.
In total, the expected annual primary energy saving is calculated at 29,412.7 kWh.
5.4.4. Remaining Electricity Consumption—Summary of New Consumptions
In addition to the detailed consumption metrics for indoor space conditioning, domestic hot water, and lighting, electricity will also be consumed in the facility for operating the circulators in the hydraulic networks and the fans in the hydronic units. The calculation of these additional consumptions, including essential parameters such as annual operating hours and nominal electrical power inputs, is summarized in Table 14.

Table 14.
Remaining electricity consumption analysis.
The total electricity consumption from the above-presented equipment is calculated at 7853.4 kWh, which corresponds to 22,774.9 kWh of primary energy.
The total electricity consumption for all final energy uses in the proposed operation state is summarized in Table 15.

Table 15.
Summary of the total electricity consumption in the proposed operation state of the indoor sports hall.
5.4.5. Photovoltaic Station
To compensate for the added annual electricity consumption (such as from the substitution of oil burners with heat pumps), a photovoltaic plant is proposed for installation on the roof of the main sports hall. The photovoltaic panels will be aligned with a 5-degree inclination relative to the horizontal plane and will have a western orientation. This design choice aims to:
- avoid the need for additional structures and weight on the building’s roof, which would be required for alternative installation inclinations and orientations;
- prevent potential shading of the solar tubes by the photovoltaic panels, as the panels are situated among these tubes;
- mitigate any impact on the building’s overall form and aesthetic quality.
With these installation parameters, the annual fluctuation of the total incident solar irradiance on the photovoltaic panels is depicted in Figure 18.
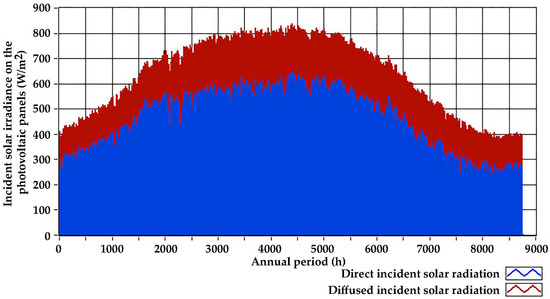
Figure 18.
Annual fluctuation of the incident solar irradiance on the photovoltaic panels for 4° inclination and western orientation.
The required installed photovoltaic power to fully offset the remaining annual electricity consumption in the facility is calculated to be 31.8 kW. This calculation is based on the available solar potential in the specific geographical region, along with the installation characteristics, and follows fundamental procedures for determining the electricity yield from a photovoltaic system [71]. This total power requirement can be met with the installation of 108 panels, each having a nominal power of 300 W. Two 20 kW inverters will facilitate the interconnection with the local electrical grid. The layout of the photovoltaic plant, situated on the roof of the main sports hall, is depicted in Figure 19, along with the grid of solar tubes.
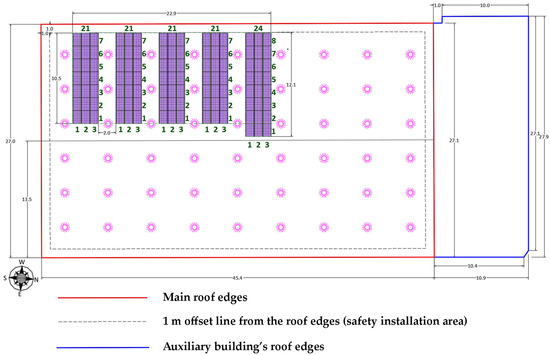
Figure 19.
Panels and solar tubes siting on the main sports hall’s roof.
The 31.8 kW photovoltaic plant is expected to produce 40,195 kWh of electricity annually, equating to 116,565.5 kWh of primary energy. This leads to a final total capacity factor of 14.4%. The electricity generated by the photovoltaic plant exceeds the expected remaining annual electricity consumption by 758 kWh, effectively upgrading the indoor sports hall into a zero-energy facility.
5.5. Synopsis of Energy Savings and Key Performance Indicators
The anticipated primary energy savings are summarized in Table 16. The remaining negative primary energy consumption simply indicates an annual electricity production surplus from the photovoltaic plant, relative to the facility’s annual electricity consumption. Consequently, the total annual primary energy saving amounts to 100.6%, effectively upgrading the indoor sports hall to a zero-energy facility.

Table 16.
Primary energy saving achieved with the suggested energy upgrading of the indoor sports hall.
In Table 17, the annual diesel oil and electricity savings are presented. Diesel oil consumption is entirely eliminated. Despite transitioning all final energy use to electricity, a 9.3% annual reduction in electricity consumption is also anticipated.

Table 17.
Annual savings per energy carrier in the municipal sports center.
In Table 18, the project’s total set-up cost is presented in a comprehensive approach, analyzed for each different proposed category of energy performance upgrade measure.

Table 18.
Investment breakdown per intervention of the proposed energy upgrading project.
The annual economic benefit of the proposed energy upgrade is determined based on the estimated annual savings for each energy carrier and their respective procurement costs. This cost–benefit analysis is presented in Table 19.

Table 19.
Estimated annual economic benefit produced by the suggested energy performance upgrade.
For the results presented in Table 19, it is assumed that the sports facility currently operates on a full annual basis and all final energy needs are fully met. This provides a common basis for comparing the existing operational state with the proposed state, which will be established after the implementation of all suggested passive and active measures. It should also be clarified that none of the proposed measures have been implemented yet. Furthermore, it should be noted that due to the electricity consumption compensation achieved through the operation of the photovoltaic station, the electricity operation cost is reduced by approximately 85%. A remaining 15% cost cannot be eliminated as it is attributable to other factors such as grid usage fees and taxes. In summary, considering all these assumptions and variables, the annual cost of procuring energy sources is reduced by 96.1%.
Finally, with the above-calculated results, the following typical KPIs can be calculated:
- Payback period and economic indices:
- It is calculated to be equal to 26.4 years, by dividing the project’s total budget (EUR 953,000) by the annually achieved economic benefit (EUR 36,051). The payback period is calculated to be relatively high. Yet, it should be stated that such high payback periods are rather usual in similar energy performance upgrade projects of buildings and other facilities, especially when passive measures are included among the proposed interventions. On the other hand, it should also be underlined that the proposed interventions do not have only an energy-saving contribution. They contribute to the renovation of a facility, prolonging its lifetime period and ensuring its structural stability. Additionally, both in general and in this specific case, they create a more comfortable and pleasant indoor environment, with excellent thermal comfort and lighting conditions, which enable the use of the facility regardless of the season and the climate conditions. Based on these remarks, the payback period in such projects should not be considered a critical decision parameter with regard to the implementation of the project or not.
- Lastly, it should also be underlined that with the proposed interventions, the hosted activities and sports and the number of the facility’s users will be sensibly increased, bringing additional income for the municipality and, practically, reducing the payback period. The annual maintenance cost will also be reduced. Although all these parameters are not known to the authors, to proceed to a more structural cost–benefit analysis, we may assume:
- current annual maintenance cost EUR 10,000;
- annual maintenance cost after the implementation of the proposed interventions: gradually varied from EUR 0 to 10,000;
- number of users in the current operation state: 150;
- number of users in the new operation state: 250;
- monthly fee per user: EUR 30;
- number of months per annum: 10;
- discount rate: 3%.
- Based on these assumptions, the annual monetary flows for the ensuing 20 years are calculated and presented in Table 20. From this data, the following key financial metrics are calculated:
 Table 20. Annual monetary flows in the current and the proposed operation state of the indoor sports hall.
- payback period: 12.9 years;
- discounted payback period: 16.6 years;
- net present value: EUR 138,690.
- It should be noted that the assumptions are only approximate and are introduced solely to facilitate a more structured cost–benefit analysis and to enable the calculation of more accurate economic indicators.
- Annual primary energy saving:
- As indicated in Table 16, the anticipated annual primary energy savings amount to 397,585 kWh, representing 100.6% compared to the existing annual primary energy consumption.
- Annual Renewable Energy Sources (RES) penetration:
- The total contribution of the suggested RES technologies to the annual energy demand coverage originates from:
- -
- the production of 40,195 kWh of electricity from the photovoltaic system, which corresponds to 116,565.5 kWh of primary energy;
- -
- the heat production of 19,692.7 kWh from the solar collectors, which corresponds to 35,804.9 kWh of primary solar radiation, assuming a typical average efficiency of 55% for the solar collectors.
- In conclusion, the total primary energy contribution from RES is calculated to be 152,370.4 kWh. The facility’s remaining electricity consumption amounts to 39,437.1 kWh, equivalent to 114,367.6 kWh of primary energy. By dividing these two primary energy amounts, the RES annual penetration in the facility is calculated at 133.2% relative to the remaining electricity consumption (before its compensation from the photovoltaic plant).
- CO2 emissions saving:
- The annual CO2 emissions saving is due to the elimination of diesel oil consumption, electricity saving, and demand compensation with the photovoltaic plant. According to the Greek Directive on Buildings’ Energy Performance [67], the following factors are introduced as specific CO2 emissions:
- -
- 0.989 kg CO2/kWh of electricity;
- -
- 0.264 kg CO2/kWh of primary energy corresponding to diesel oil consumption.
- Given the aforementioned factors, the annual CO2 emissions savings are calculated as shown in Table 21.
 Table 21. Calculation of the annual CO2 emissions savings.
6. Discussion
The construction of the indoor sports hall under study was completed in 1995. Since then, it has been the sole indoor sports facility in the broader area of the Municipality of Minoa Pediadas, hosting a variety of municipal indoor sports activities with hundreds of participating students and athletes. Additionally, it serves as the venue for the official basketball games of the local sports club in the 2nd national category. Thus, the facility holds significant importance for the local community.
The necessity for the energy performance upgrade of this sports hall is revealed by several facts:
- the reliance on diesel oil boilers for heating both the main sports hall and the auxiliary building;
- the lack of any kind of active cooling system for the main sports hall;
- the availability of only one air-to-air heat pump for the cooling of only one specific room (the administrative office) in the auxiliary building;
- the notably high U-factor values of all construction elements, which contribute to a particularly cold indoor environment in the main sports hall during winter;
- the high solar gain factor of the semi-transparent polycarbonate panels in the main sports hall, which, in combination with their large surfaces, significantly increases indoor temperatures in the summer;
- the absence of any kind of active system for generating electricity or heat from renewables;
- the use of electrical resistances and diesel oil for domestic hot water production;
- the use of ineffective lighting equipment.
Despite these facts, the required process for the implementation of essential energy upgrades has not yet been initiated by the Municipality of Minoa Pediadas, an action that logically should commence with the execution of the final application studies.
This opportunity arose from the first call for funding studies on energy transition projects, issued in 2020 by the Consortium of the European Commission’s Horizon 2020 project titled “New Energy Solutions Optimized for Islands” (NESOI). The applicant for the proposal, “Sustainable Actions for Viable Energy” (SAVE), was the Minoan Energy Community, currently the largest energy community in Greece. Among the 120 submitted proposals, SAVE was one of the 30 approved. In addition to the work presented in this current article, the SAVE project also included an energy performance upgrade study for the municipal sports center in the town of Arkalochori. This facility comprises an outdoor swimming pool center, an 8 × 8 outdoor football court, as well as tennis and basketball courts. This portion of the project is discussed in a preceding article, designated as Part A and bearing the same title as the present work. The SAVE project was integrated with the application study for Crete’s first smart grid, featuring decentralized storage, photovoltaic electricity production, and demand-side management (DSM) strategies.
The results of the SAVE project may serve as a benchmark for similar initiatives globally. Firstly, emphasis is placed on the importance of energy conservation and rational use of energy, particularly in the areas of indoor space conditioning and domestic hot water production, where annual energy savings of more than 77% are achieved in the specific study. Secondly, the SAVE project constitutes a success story of successful collaboration between local municipalities and community-based organizations, such as energy communities, for addressing significant challenges and improving essential municipal facilities. Furthermore, it provides a framework for the implementation of energy transition projects funded by the European Commission, involving active participation from local communities and authorities. Finally, it demonstrates that energy transition projects can be implemented, leading to the maximum possible social and economic benefits for the citizens, only through the active involvement of the local stakeholders in their design and implementation phases.
In terms of the technical and economic outcomes from the proposed energy performance upgrade measures, attention should first be drawn to the notably high energy-saving percentages in indoor space conditioning and hot water production. These percentages are shaped by both the current inefficient operational state and the efficacy of the recommended passive and active interventions. High U-factors characterizing all structural elements of the building’s envelope provide opportunities for significant reductions in indoor space heating and cooling loads. In fact, a reduction in the overall indoor space conditioning load on the order of 60% was estimated by calculations.
Moreover, the utilization of diesel oil for purposes such as indoor space heating and hot water production presents considerable opportunities for energy savings. The abundant solar radiation in the region provides an advantageous context for satisfying hot water demand through solar thermal collectors. Lastly, the integration of high-efficiency air-to-water heat pumps, coupled with an optimally designed heating and cooling distribution system, results in a significant reduction in electricity consumption for indoor space conditioning. After taking into account all these favorable conditions and proposed interventions, the total primary energy savings achieved for indoor space conditioning and hot water production is estimated to exceed 77%.
Regarding lighting, a notable innovation, particularly in the context of existing practices and standards in the specified geographical area, is the incorporation of solar tubes for natural illumination. Through rigorous photometric calculations, it was demonstrated that the natural light channeled through these solar tubes suffices to meet indoor sports illuminance standards for the majority of the year, including the winter months. Furthermore, the substitution of all outdated and inefficient luminaires and lamps with state-of-the-art LED lamps and floodlights contributes to an equally significant annual primary energy savings of 58%.
Finally, having achieved a total primary energy savings for all final energy uses in the sports facility above 70%, the remaining electricity consumption is fully compensated on an annual basis with the production of the proposed photovoltaic plant. As a result, the indoor sports hall is expected to become a zero-energy facility.
It is imperative to clarify that this study was carried out under the assumption that the indoor sports hall operates at full capacity throughout the year in its current state, thereby fulfilling all required final energy needs, including indoor space conditioning, domestic hot water production, and lighting. This assumption was essential to establishing a common baseline for robust comparisons between the existing and proposed operational states.
The process delineated above is universally applicable to similar building and facility cases worldwide. The methodology introduced in Section 2 serves as a general blueprint for energy performance upgrade projects. The proposed passive and active systems boast a broad application spectrum and can be deemed typical for facilities with substantial heating and cooling loads. Nevertheless, optimization concerning system sizing and material selection remains crucial for each unique case. For such optimization, the calculation methodologies and mathematical framework set forth in this article should be employed. Collectively, both the current Part B and its preceding Part A offer a comprehensive methodology, supplemented by the requisite mathematical foundation, for executing optimized energy performance upgrade studies.
The SAVE project was awarded by the European Commission with the public award of the “Islands Gamechanger” competition, organized by the NESOI Consortium and the Secretariat of the “Clean Energy for EU Islands” initiative.
So far, none of the interventions proposed within the framework of the energy performance upgrade project for the indoor sports facility have been implemented. All results presented are derived from computational simulations. Nonetheless, it is anticipated that the project will soon be implemented, pending the acquisition of the requisite funding from the local municipality. Upon completion, an interesting follow-up article would involve the presentation and analysis of the realized energy savings.
7. Conclusions
The work accomplished for the energy performance upgrade of the indoor sports hall in the small town of Arkalochori, Crete, Greece, was presented in this article. This work constitutes a part of the energy transition studies accomplished for the project entitled “Sustainable Actions for Viable Energy” (SAVE), which was funded by the European Commission’s Horizon 2020 project “New Energy Solutions Optimized for Islands” (NESOI).
All the most technically feasible and economically competitive energy upgrade measures were proposed in this work. The current ineffective and energy-consuming operation of the sports facility, together with the effectiveness, proper design, and selection of the proposed passive and active measures, led to considerably higher anticipated energy-saving percentages. Specifically, all synthetic constructive materials for vertical surfaces and walls are proposed to be replaced with 8 cm thick stone wool panels. External insulation of 7 cm thick stone wool sheets is proposed for all reinforced concrete and brick walls on both vertical and horizontal surfaces. New low-e openings with a synthetic frame and double glazing are proposed. All new U-factors are considerably lower than the upper limit introduced in the Greek Directive on Buildings’ Energy Performance, leading to a roughly 60% drop in the annual indoor space conditioning load. With the introduction of two air-to-water heat high-efficiency pumps and the appropriate design of the hydraulic heating and cooling system, diesel oil use is eliminated, and the primary energy savings for indoor space heating exceed 77% with regard to the current operation state. A solar-combi system, supported by a heat storage tank and a heat pump as a back-up unit, is proposed for the production of domestic hot water, leading to 77% primary energy savings for this particular final energy need compared to the current state. A solar tube arrangement ensures natural lighting in the main sports hall during the day and for the whole year, while the replacement of all the existing ineffective luminaires and lamps with new LED technology is estimated to lead to a primary energy annual saving of 58% for the lighting coverage needs of the facility. The remaining electricity consumption is fully compensated for by the proposed photovoltaic plant, so the indoor sports hall is upgraded to a zero-energy facility.
The SAVE project was effortlessly initiated by a community-based scheme, the Minoan Energy Community, which configured an integrated proposal for the beginning of the energy transition in the local municipal facilities. The Minoan Energy Community adequately traced the real needs of the community and formulated an effective cluster of discrete works, with high added value, energy-saving results, and social benefits for the local community. For all these reasons, the SAVE project as a whole constitutes a pilot, lighthouse global example, indicating excellent collaboration between local authorities and community-based, private initiatives.
Author Contributions
Conceptualization, D.A.K.; methodology, D.A.K. and E.G.; software, D.A.K. and G.Z.; validation, D.A.K. and A.K.; formal analysis, D.A.K. and A.K.; investigation, D.A.K., N.P., E.G., E.D. and Y.Y.; resources, G.K.; data curation, G.M.S.; writing—original draft preparation, D.A.K. and N.P.; writing—review and editing, D.A.K. and N.P.; visualization, D.A.K. and N.P.; supervision, D.A.K.; project administration, D.A.K. and E.D.; funding acquisition, D.A.K. All authors have read and agreed to the published version of the manuscript.
Funding
This research was funded by the European Commission’s Horizon 2020 project entitled “New Energy Solutions Optimized for Islands” (NESOI), under the grant number EL-056-2021-006–[SAVE] and the sub-project entitled “Sustainable Actions for Viable Energy” (SAVE).
Data Availability Statement
Data sharing not applicable. No new data were created or analyzed in this study.
Acknowledgments
The authors and the working team of this project are grateful to the NESOI Consortium for the approval of the SAVE proposal and for their overall contribution and support for the implementation of the project.
Conflicts of Interest
The authors declare no conflict of interest.
Glossary
| Abbreviations (Alphabetically) | |
| ANN | Artificial neural network |
| ASHRAE | American Society of Heating, Refrigerating and Air-Conditioning Engineers |
| BEMS | Building energy management system |
| COP | Coefficient of performance |
| DSM | Demand-side management |
| EER | Energy efficiency ratio |
| EU | European Union |
| GHE | Geothermal heat exchangers |
| GHP | Geothermal heat pumps |
| HVAC | Heating, ventilation, and air conditioning |
| KPIs | Key performance indicators |
| NESOI | New Energy Solutions Optimized for Islands |
| PPR | Polypropylene |
| RES | Renewable energy sources |
| RHC | Radiant heating and cooling |
| RUE | Rational use of energy |
| SAVE | Sustainable Actions for Viable Energy |
| TFM | Transfer function method |
| VRV | Variable refrigerant volume |
| W-SAHP | Water solar-assisted heat pump |
| ZEB | Zero emission building |
| Nomenclature (In Order of Appearance) | |
| Tamb | the ambient temperature |
| U | the thermal heat transfer factor (the so-called U-factor) (in W/m2∙K) |
| hc | the heat convection factor for ambient air horizontal flow with average velocity of 5 m/s (10 W/m2∙Κ) |
| hrw | the heat radiation factor |
| cp | the water specific heat capacity (4.187 kJ/kg∙K) |
| Tsw | the water temperature in the water supply network |
| hfg | the specific latent heat of water (2441.7 kJ/kg at 25 °C) |
| dj | the thickness of the structural material j of the opaque constructive element |
| kj | the thermal conductivity factor of the structural material j of the opaque constructive element |
| hi | the heat transfer factor from the inner space and towards the outer space ho (or conversely in summer) |
| ho | the heat transfer factor towards the outer space (or conversely in summer) |
| ACH | air changes per hour |
| Tin | the indoor space temperature |
| the domestic hot water consumed mass flow rate | |
| Thw | the hot water required temperature |
| Pel | the electrical power consumption in the heat pump |
| Qh | the indoor space heating load |
| hw | the thermal convection factor of still water, equal to 50 W/(m2∙K) |
| Qc | the indoor space cooling load |
| Tsol | the supplied water temperature from the solar collectors |
| Tst | the stored water temperature in the heat storage tanks |
| Thw | the required hot water temperature |
| ΝSC | the solar collectors’ total number in the system |
| CSC | the procurement price of one solar collector, adopted equal to EUR 450 |
| ΝSΤ | the heat storage tanks’ number in the system, with storage capacity of 2000 L |
| CSΤ | the procurement price of one 2000 L heat storage tank, adopted equal to EUR 6000 |
| ESC | the annual heat demand coverage for domestic hot water production from the solar-combi system |
| ΤLP | the solar-combi system’s life period, adopted equal to 15 years |
| cth | the heat production specific cost from the solar-combi system |
References
- Katsaprakakis, D.A.; Papadakis, N.; Giannopoulou, E.; Yiannakoudakis, Y.; Zidianakis, G.; Kalogerakis, M.; Katzagiannakis, G.; Dakanali, E.; Stavrakakis, G.M.; Kartalidis, A. Rational Use of Energy in Sports Centres to Achieve Net Zero: The SAVE Project (Part A). Energies 2023, 16, 4040. [Google Scholar] [CrossRef]
- Directive (EU) 2018/844 of the European Parliament and of the Council of 30 May 2018 Amending Directive 2010/31/EU on the Energy Performance of Buildings and Directive 2012/27/EU on Energy Efficiency. Volume 156. 2018. Available online: https://Eur-Lex.Europa.Eu/Legal-Content/EN/TXT/?Uri=uriserv%3AOJ.L_.2018.156.01.0075.01.ENG (accessed on 14 February 2023).
- Directive 2012/27/EU of the European Parliament and of the Council of 25 October 2012 on Energy Efficiency, Amending Directives 2009/125/EC and 2010/30/EU and Repealing Directives 2004/8/EC and 2006/32/EC (Text with EEA Relevance)Text with EEA Relevance. 2012. Volume EUR-Lex-02012L0027-20230504-EN. Available online: https://eur-lex.europa.eu/LexUriServ/LexUriServ.do?uri=OJ:L:2012:315:0001:0056:en:PDF (accessed on 14 February 2023).
- Law 4122/2013. Official Governmental Gazette 42A’/19-2-2013. Energy Performance of Buildings—Harmonization with the Directive 2010/31/EU of the European Parliament and the Council and Other Clauses. Available online: https://www.kodiko.gr/nomothesia/document/70937/nomos-4122-2013 (accessed on 18 February 2023).
- International Energy Agency (IEA). Buildings—Analysis. Available online: https://www.iea.org/reports/buildings (accessed on 18 February 2023).
- Vakiloroaya, V.; Samali, B.; Fakhar, A.; Pishghadam, K. A Review of Different Strategies for HVAC Energy Saving. Energy Convers. Manag. 2014, 77, 738–754. [Google Scholar] [CrossRef]
- Weerasinghe, A.S.; Ramachandra, T. Economic Sustainability of Green Buildings: A Comparative Analysis of Green vs Non-Green. Built Environ. Proj. Asset Manag. 2018, 8, 528–543. [Google Scholar] [CrossRef]
- Baek, S.G. Plan for the Sustainability of Public Buildings through the Energy Efficiency Certification System: Case Study of Public Sports Facilities, Korea. Buildings 2021, 11, 589. [Google Scholar] [CrossRef]
- Li, X.; Shen, C.; Yu, C.W.F. Building Energy Efficiency: Passive Technology or Active Technology? Indoor Built Environ. 2017, 26, 729–732. [Google Scholar] [CrossRef]
- Balaras, C.A.; Grossman, G.; Henning, H.-M.; Infante Ferreira, C.A.; Podesser, E.; Wang, L.; Wiemken, E. Solar Air Conditioning in Europe—An Overview. Renew. Sustain. Energy Rev. 2007, 11, 299–314. [Google Scholar] [CrossRef]
- Pérez-Lombard, L.; Ortiz, J.; Pout, C. A Review on Buildings Energy Consumption Information. Energy Build. 2008, 40, 394–398. [Google Scholar] [CrossRef]
- D’Agostino, D.; Cuniberti, B.; Bertoldi, P. Energy Consumption and Efficiency Technology Measures in European Non-Residential Buildings. Energy Build. 2017, 153, 72–86. [Google Scholar] [CrossRef]
- Clark, D. What Colour Is Your Building? Measuring and Reducing the Energy and Carbon Footprint of Buildings; RIBA Publishing: London, UK, 2019; ISBN 978-0-429-34773-3. [Google Scholar]
- Yezioro, A.; Capeluto, I.G. Energy Rating of Buildings to Promote Energy-Conscious Design in Israel. Buildings 2021, 11, 59. [Google Scholar] [CrossRef]
- Khan, M.A.; Wang, C.C.; Lee, C.L. A Framework for Developing Green Building Rating Tools Based on Pakistan’s Local Context. Buildings 2021, 11, 202. [Google Scholar] [CrossRef]
- Zero Energy Building Certification System. Available online: https://zeb.energy.or.kr/BC/BC00/BC00_01_001.do (accessed on 21 February 2023).
- Teni, M.; Čulo, K.; Krstić, H. Renovation of Public Buildings towards NZEB: A Case Study of a Nursing Home. Buildings 2019, 9, 153. [Google Scholar] [CrossRef]
- Garcia, J.F.; Kranzl, L. Ambition Levels of Nearly Zero Energy Buildings (NZEB) Definitions: An Approach for Cross-Country Comparison. Buildings 2018, 8, 143. [Google Scholar] [CrossRef]
- Topriska, E.; Kolokotroni, M.; Melandri, D.; McGuiness, S.; Ceclan, A.; Christoforidis, G.C.; Fazio, V.; Hadjipanayi, M.; Hendrick, P.; Kacarska, M. The Social, Educational, and Market Scenario for NZEB in Europe. Buildings 2018, 8, 51. [Google Scholar] [CrossRef]
- Azaza, M.; Eskilsson, A.; Wallin, F. Energy Flow Mapping and Key Performance Indicators for Energy Efficiency Support: A Case Study a Sports Facility. Energy Procedia 2019, 158, 4350–4356. [Google Scholar] [CrossRef]
- Mayernik, J. Buildings Energy Data Book; US Department of Energy: Washington, DC, USA, 2015.
- EU Building Stock Observatory—Data Europa EU. Available online: https://data.europa.eu/data/datasets/building-stock-observatory?locale=en (accessed on 10 August 2023).
- TM46: Energy Benchmarks|CIBSE. Available online: https://www.cibse.org/knowledge-research/knowledge-portal/tm46-energy-benchmarks (accessed on 19 February 2023).
- ECG 78 Energy Use in Sports and Recreation Buildings, Building Research Energy Conservation Support Unit—Publication Index|NBS. Available online: https://www.thenbs.com/PublicationIndex/documents/details?Pub=BRECSU&DocID=285163 (accessed on 19 February 2023).
- Trianti-Stourna, E.; Spyropoulou, K.; Theofylaktos, C.; Droutsa, K.; Balaras, C.A.; Santamouris, M.; Asimakopoulos, D.N.; Lazaropoulou, G.; Papanikolaou, N. Energy Conservation Strategies for Sports Centers: Part A. Sports Halls. Energy Build. 1998, 27, 109–122. [Google Scholar] [CrossRef]
- Hjortling, C.; Björk, F.; Berg, M.; Klintberg, T.A. Energy Mapping of Existing Building Stock in Sweden—Analysis of Data from Energy Performance Certificates. Energy Build. 2017, 153, 341–355. [Google Scholar] [CrossRef]
- Stengård, L.; Berling-Agståhl, L. Energistatistik för Flerbostadshus 2008. Energy Statistics for Multi-Dwelling Buildings in 2008; Swedish Energy Authority: Örebro, Sweden, 2009.
- Griffiths, A.J.; Bowen, P.J.; Brinkworth, B.J.; Morgan, I.R.; Howarth, A. Energy Consumption in Leisure Centres—A Comparative Study. Energy Environ. 1997, 8, 207–225. [Google Scholar] [CrossRef]
- Katsaprakakis, D.A.; Dakanali, I.; Zidianakis, G.; Yiannakoudakis, Y.; Psarras, N.; Kanouras, S. Potential on Energy Performance Upgrade of National Stadiums: A Case Study for the Pancretan Stadium, Crete, Greece. Appl. Sci. 2019, 9, 1544. [Google Scholar] [CrossRef]
- Sadineni, S.B.; Madala, S.; Boehm, R.F. Passive Building Energy Savings: A Review of Building Envelope Components. Renew. Sustain. Energy Rev. 2011, 15, 3617–3631. [Google Scholar] [CrossRef]
- Katsaprakakis, D.A.; Zidianakis, G.; Yiannakoudakis, Y.; Manioudakis, E.; Dakanali, I.; Kanouras, S. Working on Buildings’ Energy Performance Upgrade in Mediterranean Climate. Energies 2020, 13, 2159. [Google Scholar] [CrossRef]
- Dudzińska, A. Efficiency of Solar Shading Devices to Improve Thermal Comfort in a Sports Hall. Energies 2021, 14, 3535. [Google Scholar] [CrossRef]
- Efthymiou, E.N.; Yfanti, S.; Kyriakarakos, G.; Zervas, P.L.; Langouranis, P.; Terzis, K.; Stavrakakis, G.M. A Practical Methodology for Building a Municipality-Led Renewable Energy Community: A Photovoltaics-Based Case Study for the Municipality of Hersonissos in Crete, Greece. Sustainability 2022, 14, 12935. [Google Scholar] [CrossRef]
- Stavrakakis, G.M.; Tomazinakis, N.M.; Markatos, N.C. Modified ‘closure’ constants of the Standard k-ε turbulence model for the prediction of wind-induced natural ventilation. Build. Serv. Eng. Res. Technol. 2012, 33, 241–261. [Google Scholar] [CrossRef]
- Stavrakakis, G.M.; Katsaprakakis, D.A.; Damasiotis, M. Basic Principles, Most Common Computational Tools, and Capabilities for Building Energy and Urban Microclimate Simulations. Energies 2021, 14, 6707. [Google Scholar] [CrossRef]
- Rhee, K.-N.; Kim, K.W. A 50 Year Review of Basic and Applied Research in Radiant Heating and Cooling Systems for the Built Environment. Build. Environ. 2015, 91, 166–190. [Google Scholar] [CrossRef]
- Chua, K.J.; Chou, S.K.; Yang, W.M. Advances in Heat Pump Systems: A Review. Appl. Energy 2010, 87, 3611–3624. [Google Scholar] [CrossRef]
- Tagliafico, L.A.; Scarpa, F.; Tagliafico, G.; Valsuani, F. An Approach to Energy Saving Assessment of Solar Assisted Heat Pumps for Swimming Pool Water Heating. Energy Build. 2012, 55, 833–840. [Google Scholar] [CrossRef]
- Chow, T.T.; Bai, Y.; Fong, K.F.; Lin, Z. Analysis of a Solar Assisted Heat Pump System for Indoor Swimming Pool Water and Space Heating. Appl. Energy 2012, 100, 309–317. [Google Scholar] [CrossRef]
- Omeiza, L.A.; Abid, M.; Dhanasekaran, A.; Subramanian, Y.; Raj, V.; Kozak, K.; Mamudu, U.; Azad, A.K. Application of solar thermal collectors for energy consumption in public buildings—An updated technical review. J. Eng. Res. 2023. [Google Scholar] [CrossRef]
- Weiss, W.; Spörk-Dür, M. Global Market Development and Trends in 2019 Detailed Market Data 2018; IEA: Gleisdorf, Austria, 2020.
- Olfian, H.; Ajarostaghi, S.S.M.; Ebrahimnataj, M. Development on evacuated tube solar collectors: A review of the last decade results of using nanofluids. Sol. Energy 2020, 211, 265–282. [Google Scholar] [CrossRef]
- Katsaprakakis, D.A. Comparison of Swimming Pools Alternative Passive and Active Heating Systems Based on Renewable Energy Sources in Southern Europe. Energy 2015, 81, 738–753. [Google Scholar] [CrossRef]
- Katsaprakakis, D.A. Computational Simulation and Dimensioning of Solar-Combi Systems for Large-Size Sports Facilities: A Case Study for the Pancretan Stadium, Crete, Greece. Energies 2020, 13, 2285. [Google Scholar] [CrossRef]
- Orejón-Sánchez, R.D.; Hermoso-Orzáez, M.J.; Gago-Calderón, A. LED Lighting Installations in Professional Stadiums: Energy Efficiency, Visual Comfort, and Requirements of 4K TV Broadcast. Sustainability 2020, 12, 7684. [Google Scholar] [CrossRef]
- Fantozzi, F.; Leccese, F.; Salvadori, G.; Rocca, M.; Garofalo, M. LED Lighting for Indoor Sports Facilities: Can Its Use Be Considered as Sustainable Solution from a Techno-Economic Standpoint? Sustainability 2016, 8, 618. [Google Scholar] [CrossRef]
- Fei, J.; Su, Z.; Yao, Y.; Fei, C.; Shamel, A. Investigation and 3E (Economic, Environmental and Energy) Analysis of a Combined Heat and Power System Based on Renewable Energies for Supply Energy of Sport Facilities. IET Renew. Power Gener. 2023. [Google Scholar] [CrossRef]
- Artuso, P.; Santiangeli, A. Energy Solutions for Sports Facilities. Int. J. Hydrogen Energy 2008, 33, 3182–3187. [Google Scholar] [CrossRef]
- Balaras, C.A.; Gaglia, A.G.; Georgopoulou, E.; Mirasgedis, S.; Sarafidis, Y.; Lalas, D.P. European Residential Buildings and Empirical Assessment of the Hellenic Building Stock, Energy Consumption, Emissions and Potential Energy Savings. Build. Environ. 2007, 42, 1298–1314. [Google Scholar] [CrossRef]
- Ma, Z.; Cooper, P.; Daly, D.; Ledo, L. Existing Building Retrofits: Methodology and State-of-the-Art. Energy Build. 2012, 55, 889–902. [Google Scholar] [CrossRef]
- Luddeni, G.; Krarti, M.; Pernigotto, G.; Gasparella, A. An Analysis Methodology for Large-Scale Deep Energy Retrofits of Existing Building Stocks: Case Study of the Italian Office Building. Sustain. Cities Soc. 2018, 41, 296–311. [Google Scholar] [CrossRef]
- Ascione, F.; Bianco, N.; Stasio, C.D.; Mauro, G.M.; Vanoli, G.P. Addressing Large-Scale Energy Retrofit of a Building Stock via Representative Building Samples: Public and Private Perspectives. Sustainability 2017, 9, 940. [Google Scholar] [CrossRef]
- Gabrielli, L.; Ruggeri, A.G. Optimal Design in Energy Retrofit Interventions on Building Stocks: A Decision Support System. In Appraisal and Valuation: Contemporary Issues and New Frontiers; Morano, P., Oppio, A., Rosato, P., Sdino, L., Tajani, F., Eds.; Green Energy and Technology; Springer International Publishing: Cham, Switzerland, 2021; pp. 231–248. ISBN 978-3-030-49579-4. [Google Scholar]
- Tuominen, P.; Forsström, J.; Honkatukia, J. Economic Effects of Energy Efficiency Improvements in the Finnish Building Stock. Energy Policy 2013, 52, 181–189. [Google Scholar] [CrossRef]
- Gabrielli, L.; Ruggeri, A.G.; Scarpa, M. Automatic Energy Demand Assessment in Low-Carbon Investments: A Neural Network Approach for Building Portfolios. J. Eur. Real Estate Res. 2020, 13, 357–385. [Google Scholar] [CrossRef]
- Swan, L.G.; Ugursal, V.I. Modeling of End-Use Energy Consumption in the Residential Sector: A Review of Modeling Techniques. Renew. Sustain. Energy Rev. 2009, 13, 1819–1835. [Google Scholar] [CrossRef]
- Pittarello, M.; Scarpa, M.; Ruggeri, A.G.; Gabrielli, L.; Schibuola, L. Artificial Neural Networks to Optimize Zero Energy Building (ZEB) Projects from the Early Design Stages. Appl. Sci. 2021, 11, 5377. [Google Scholar] [CrossRef]
- New Energy Solutions Optimized for Islands (NESOI) The “Sustainable Actions for Viable Energy” (SAVE) Project. Available online: https://www.nesoi.eu/content/save-greece (accessed on 14 February 2023).
- Minoan Energy Community The SAVE Project of NESOI. Available online: https://minoanenergy.com/en/%cf%84%ce%bf-%ce%ad%cf%81%ce%b3%ce%bf-save-%cf%84%ce%bf%cf%85-nesoi/ (accessed on 14 February 2023).
- European Commission Clean Energy for EU Islands. Island Gamechanger Award. Available online: https://clean-energy-islands.ec.europa.eu/assistance/island-gamechanger-award (accessed on 14 February 2023).
- European Centre for Medium-Range Weather Forecasts (ECMWF) ERA5 from the Copernicus Climate Change Service (C3S) Climate Date Store. ERA5 Hourly Data on Single Levels from 1959 to Present. Available online: https://cds.climate.copernicus.eu/#!/search?text=ERA5&type=dataset (accessed on 14 February 2023).
- Kreider, J.; Rabl, A.; Curtiss, P. Heating and Cooling of Buildings, 3rd ed.; CRC Press: Boca Raton, FL, USA, 2017. [Google Scholar]
- Spitler, J.D. Load Calculation Applications Method, 2nd ed.; ASHRAE Editions: Atlanta, GA, USA, 2014. [Google Scholar]
- Kteniadakis, M. Heat Transfer Applications, 2nd ed.; Ziti Editions: Athens, Greece, 2021. [Google Scholar]
- 2009 ASHRAE Handbook—Fundamentals (SI Edition); American Society of Heating, Refrigerating and Air-Conditioning Engineers, Inc.: Atlanta, GA, USA, 2009.
- Stavrakakis, G.M.; Stamou, A.I.; Markatos, N.C. Evaluation of Thermal Comfort in Indoor Environments Using Computational Fluid Dynamics (CFD). In Indoor Work and Living Environments: Health, Safety and Performance; Harris, R.G., Moore, D.P., Eds.; Nova Science Publishers Inc.: Hauppauge, NY, USA, 2009; Volume 2009, pp. 97–166. [Google Scholar]
- Official Hellenic Governmental Gazette. Directive on Buildings’ Energy Performance—(Greek) 2367Β’/12-7-2017; Official Hellenic Governmental Gazette: Athens, Greece, 2017.
- Technical Chamber of Greece Technical. Directive 20701-1/2017: Analytical National Specifications for the Buildings’ Energy Performance Evaluation and the Issuance of the Energy Performance Certificate; Technical Chamber of Greece: Athens, Greece, 2017. [Google Scholar]
- Katsaprakakis, D.A.; Zidianakis, G. Optimized Dimensioning and Operation Automation for a Solar-Combi System for Indoor Space Heating. A Case Study for a School Building in Crete. Energies 2019, 12, 177. [Google Scholar] [CrossRef]
- DIALux Evo—Online Photometric Tool. Available online: https://www.dialux.com/en-GB/ (accessed on 14 February 2023).
- Fragkiadakis, I. Photovoltaic Systems, 4th ed.; Ziti Editions: Athens, Greece, 2019. [Google Scholar]
Disclaimer/Publisher’s Note: The statements, opinions and data contained in all publications are solely those of the individual author(s) and contributor(s) and not of MDPI and/or the editor(s). MDPI and/or the editor(s) disclaim responsibility for any injury to people or property resulting from any ideas, methods, instructions or products referred to in the content. |
© 2023 by the authors. Licensee MDPI, Basel, Switzerland. This article is an open access article distributed under the terms and conditions of the Creative Commons Attribution (CC BY) license (https://creativecommons.org/licenses/by/4.0/).