1. Introduction
The large-scale deployment of renewable energies plays a significant role in the deep transformation of the European Union towards decarbonization [
1]. This deployment is led by photovoltaics (PV), accounting for 41.4 GW of new installed capacity in 2022, reflecting a 47% increase from the previous year [
2]. Within the installed capacity, 25 GW belongs to distributed systems, reflecting the increase in rooftop installations in residential dwellings and small commercial and industrial buildings. This means a change in user behavior from consumers to prosumers who can manage their own consumption and generation. However, there are also disadvantages associated with the proliferation of PV systems [
3], particularly when they are connected to the grid. The dependence of PV generation on weather and environmental conditions leads to unstable and unpredictable power output [
4]. In addition, surplus energy that is not consumed locally is often injected into the grid. All of these have a negative impact on grid stability and power quality, causing problems in grid balancing and regulation.
The challenges related to increasing PV generation can be mitigated by introducing battery energy storage systems (BESSs). Integrating batteries into PV generation systems results in a lower impact on the power system than injecting surplus energy into the grid [
5]. BESSs are very effective for this purpose because they provide load shifting. Thus, PV power output can be smoothed, and peak shaving as well as valley filling can also be achieved. On the consumer side, batteries also provide significant benefits. Optimizing consumption by scheduling loads has been the subject of numerous studies aimed at reducing electricity bills [
6,
7]. Some consumers even choose to adapt consumption, often with effects on comfort and welfare. Batteries are an asset in this context, as they offer flexibility, so that users can use stored energy during periods of high prices and reduce their bills without changing their consumption.
In the literature focused on the PV sector, conventional storage technologies such as lithium-ion or lead-acid batteries can be found, as can alternative technologies such as hydrogen batteries [
8,
9,
10] or reused batteries from electric vehicles [
11,
12,
13]. However, conventional batteries are the most widely used [
14]. Specifically, from a technical and economic point of view, lithium-ion batteries excel in terms of higher efficiency, greater power and energy density, longer life cycle, and lower cost [
15,
16].
PV costs have been drastically reduced in recent years and at the same time subsidies have increased, making this type of installation profitable in most scenarios. However, although the price of batteries has also been reduced due to the rapid development of electric vehicles [
17], multiple studies show that further price reductions are still needed to be economically profitable to include them in PV systems [
18,
19]. This is the case even considering the sharp increase in electricity prices in recent years [
20]. The profitability of batteries depends not only on equipment and electricity prices, but also on the strategy adopted in the charging and discharging process. The strategy usually adopted consists of prioritizing the self-consumption of PV production and using surplus energy to charge the battery. Under this strategy, surplus energy is only injected into the grid when the battery is full. Regarding the discharge process, when PV generation is not enough to satisfy demand, priority is given to the use of stored energy and only grid energy is used when the battery is discharged. In some situations, this strategy may not be the most profitable. Especially when the price of electricity is not fixed and varies depending on the time of use. For the design of the optimal strategy, some authors apply complex optimization techniques [
21,
22,
23,
24,
25], but others have achieved good results using rule-based strategies [
26,
27,
28,
29,
30]. Some of these authors also discuss the use of BESS to store energy from the grid. This opens the possibility of charging the battery when the electricity price is lower and consuming stored energy when it is higher. This is also an interesting demand response strategy since it is generally possible to modulate consumption, increasing it during periods of lower demand and reducing it during periods of higher demand. Nengroo et al. [
30] discriminate between peak and off-peak hours and implemented a strategy that seeks to minimize the amount of energy consumed from the grid during peak hours. The research conducted by Ouédraogo [
26] compares five energy management strategies that differ in battery operation. One strategy is seasonal, with two modes of operation for the summer or winter months, using the battery in winter mainly as a security reserve. However, Yu [
25] proposes a second use for the batteries in the winter months, in order to smooth power demand when consumption peaks occur. In turn, the strategy presented by Li et al. [
24] achieves positive results by injecting all the surplus energy into the grid and charging the battery using only energy from the grid. The battery is charged only when the price of electricity is lower and stored for use in periods with higher prices.
The profitability of more complex operational strategies is highly dependent on electricity prices and the tariff structure. For this reason, it is essential to carry out the studies considering updated pricing models. In Spain, electricity prices have risen sharply in recent years. In addition, the entry into force of the new electricity tariffs has brought major changes that have had a significant impact on the profitability of PV systems and storage systems [
20]. This study considers different pricing scenarios based on the current state of the Spanish electricity market and Spanish regulation.
Additionally, most economic analyses assume that the battery has a fixed lifetime after a specific time of use [
21,
22,
23,
25,
29]. However, battery degradation is not constant over time, but varies according to the operating strategy applied. Increased battery cycling accelerates the rate of degradation, thus anticipating the need for battery replacement. Degradation is therefore a parameter that influences operating and maintenance costs and must be considered.
This study presents and analyzes three battery operation strategies: the most frequently adopted strategy and two alternative strategies. All the strategies are simulated in a PV-BESS system to conduct the analysis, and the economic benefits of each strategy are compared with the PV-Only system. Two objectives are sought: to optimize the operation of batteries in order to increase the economic benefits they provide; and to quantify the impact of electricity prices on the profitability of this technology, identifying the most appropriate strategies for each price scenario. Thus, the main novelty of this research lies in the operational strategies developed, which consider electricity prices, and the aging and degradation of the batteries due to cycling and use. But this study is also novel because it is carried out in the industrial sector and under the Spanish electricity market framework, considering current electricity prices and tariffs.
2. Materials and Methods
This article aims to identify the most beneficial battery strategy for optimizing profits in industries that already have an existing battery in place. Three different strategies for battery operation in PV self-consumption systems are analyzed. The analysis involves simulating all the strategies in a PV-BESS system, comparing the economic benefits of each strategy with the PV-Only system. In addition, the strategies are evaluated under different electricity price configurations and the impact of each strategy on the health of the battery is assessed. This aspect is of great relevance. A change in storage conditions can affect the rate of battery degradation and result in a premature need for replacement. A complex simulation model is used for this technical and economic analysis.
The analysis of energy flows is based on a tool presented in previous studies [
20] that has already been validated for the evaluation of the operation of PV systems with batteries. An adaptation of this tool has been implemented to include the possibility to simulate the PV system under different battery operating strategies. In addition, the model was improved by adding battery cycling aging simulation.
Regarding battery modeling, battery degradation was refined including an aging model based on [
31]. More details are provided in subsequent sections.
To determine the hourly energy exchanges between the user, the PV system, the storage system and the grid and, at the same time, to economically value these exchanges, load data are essential. It is therefore crucial to feed the energy and economic analysis tool with the actual load profile of the user to ensure the accuracy of the results. The model is also fed with economic data related to electricity tariffs and prices and financing parameters. Once the model is built, the simulation runs until the end of the battery life. This process is used to determine the savings in comparison to the situation where only photovoltaics are used.
The reader can refer to the symbol table at the end of the document to identify different variables and parameters used.
2.1. Electricity Tariffs
Due to the strong influence of energy prices on the battery operation strategies analyzed in this study, different pricing scenarios have been considered attending to the current state of the energy market in Spain and Spanish regulation.
In addition, in June 2021, important regulatory changes on electricity tariffs and consumption schedules and periods were implemented. Specifically, the most significant changes that may affect the industrial sector, the main subject of this study, include the disappearance of the 3.0A tariff. This tariff is now the 3.0TD tariff and the number of energy and power periods has been increased from three to six. The 3.1A tariff also disappeared and was integrated into the 6.1TD and 6.2TD tariffs. These tariffs, corresponding to medium and high voltages, are characterized by six periods of energy and power. For large consumers, the 6.3TD and 6.4TD tariffs remain unchanged. All these tariffs include differentiated prices during periods for both energy and power and vary depending on the time of day, day of the week, and even the month. These changes are aimed to encourage a reduction in consumption during periods with greater network saturation (peak hours) and shifting the load to periods of lower demand (off-peak hours).
In Spain, industrial consumers have different options for their electricity pricing models. They can choose between multi-period pricing and market index pricing.
Multi-period pricing. Users with these tariffs pay a price agreed with the provider company for electricity. Therefore, for these users, the price is always the same for each tariff period. This type of tariff entails less risk for users because it is not affected by market fluctuations, but it can increase the price of the electricity bill.
Market index pricing: Electricity tariffs with indexed prices offer electricity at market cost, which means that the price of electricity changes every hour and every day. The price can be split into two parts: one of them is regulated by the government while the other varies according to the final price of electricity in the pool market. In addition, the electricity provider company charges the user a management fee since it offers the electricity supply at the purchase price. The indexed tariff, therefore, is exposed to market variations but is interesting for users with more concentrated consumption during periods with lower prices.
The real prices of each of these two pricing models will be used for the analysis of the different strategies.
2.2. Battery Aging Model
Battery aging or degradation can be decomposed into two types: calendar aging and cycle aging. Calendar aging is the result of battery self-discharge and depends on parameters such as temperature, humidity, state of charge (SOC), and mechanical stresses. Ultimately, this aging is due to non-operational factors. In contrast, cycle aging is related to the charge and discharge cycles of the battery. This means that cycle aging depends on parameters such as cycle depth, average state of charge (SOC), over charge, and over discharge, etc. Battery degradation is quantified with state of health (SOH), expressed as the ratio between current battery capacity and battery capacity at the beginning of life.
To simulate battery degradation, the model developed by Xu et al. [
31], which is based on the use of the rainflow-counting algorithm [
32], has been implemented. This algorithm, very effective in predicting material fatigue, has also been adapted by several authors to predict battery aging [
33,
34].
Following the procedure described in [
31], the algorithm has been embedded into the model to account for full cycles and half cycles of discharge. For the sake of simplicity and taking into account that the amount of energy charged and discharged from a battery in a regular evaluation is practically identical, only the full cycles and half cycles of the discharge stages are counted and included in the model. Thus, a half discharge cycle is considered to cause the same aging as a full cycle of the same depth.
Cycle counting is performed by analyzing the battery SOC profile. First, the local maxima and minima of the profile are identified. These are the points where there is a change in trend due to a transition from charging to discharging or vice versa. The points () are then analyzed in sets of four from the beginning of the profile in accordance with the following procedure:
- (i)
The variation of SOC between consecutive points is determined, so that three charge/discharge segments or intervals are evaluated.
- (ii)
A full cycle is identified when the condition of Equation (1) is met and the SOC variation of the central interval is less than the SOC variation of the two adjacent intervals. The SOC variation of this interval corresponds to the depth () of the identified cycle.
- (iii)
If the above condition is met and a cycle is identified, the process is repeated from the beginning by eliminating the points involved in the central interval and adding two new points to the set. Otherwise, the process is also repeated from the beginning, but the first point of the set is eliminated and the next in the series is included.
The above steps are repeated in a loop until no more complete cycles are detected. In addition, the half cycles are identified from the residual points of the load profile. They can be either charge or discharge half cycles. However, as mentioned above, only half cycles of discharge are counted.
Once the discharge cycles and half cycles are accounted for, the life loss for each cycle is determined by the following stress function [
31]:
Thus, the cycle aging (
) of the set of identified cycles is calculated as the sum of the life loss for each cycle.
Since calendar aging (
) is calculated as a fraction of the expected battery shelf life, which is estimated to be 10 years, the total aging (
) is the sum of calendar aging and cycling aging.
In the model developed to simulate the behavior of the battery, this loss of life or aging is included as a reduction in the maximum capacity of the battery and in the efficiency of the charge and discharge process. Additionally, the battery is considered to have reached the end of life (EOL) when the calculated life loss is greater than one. Efficiencies and battery capacity will be updated using a linear relationship with life loss and values at the beginning and end of life.
2.3. Battery Operational Strategies
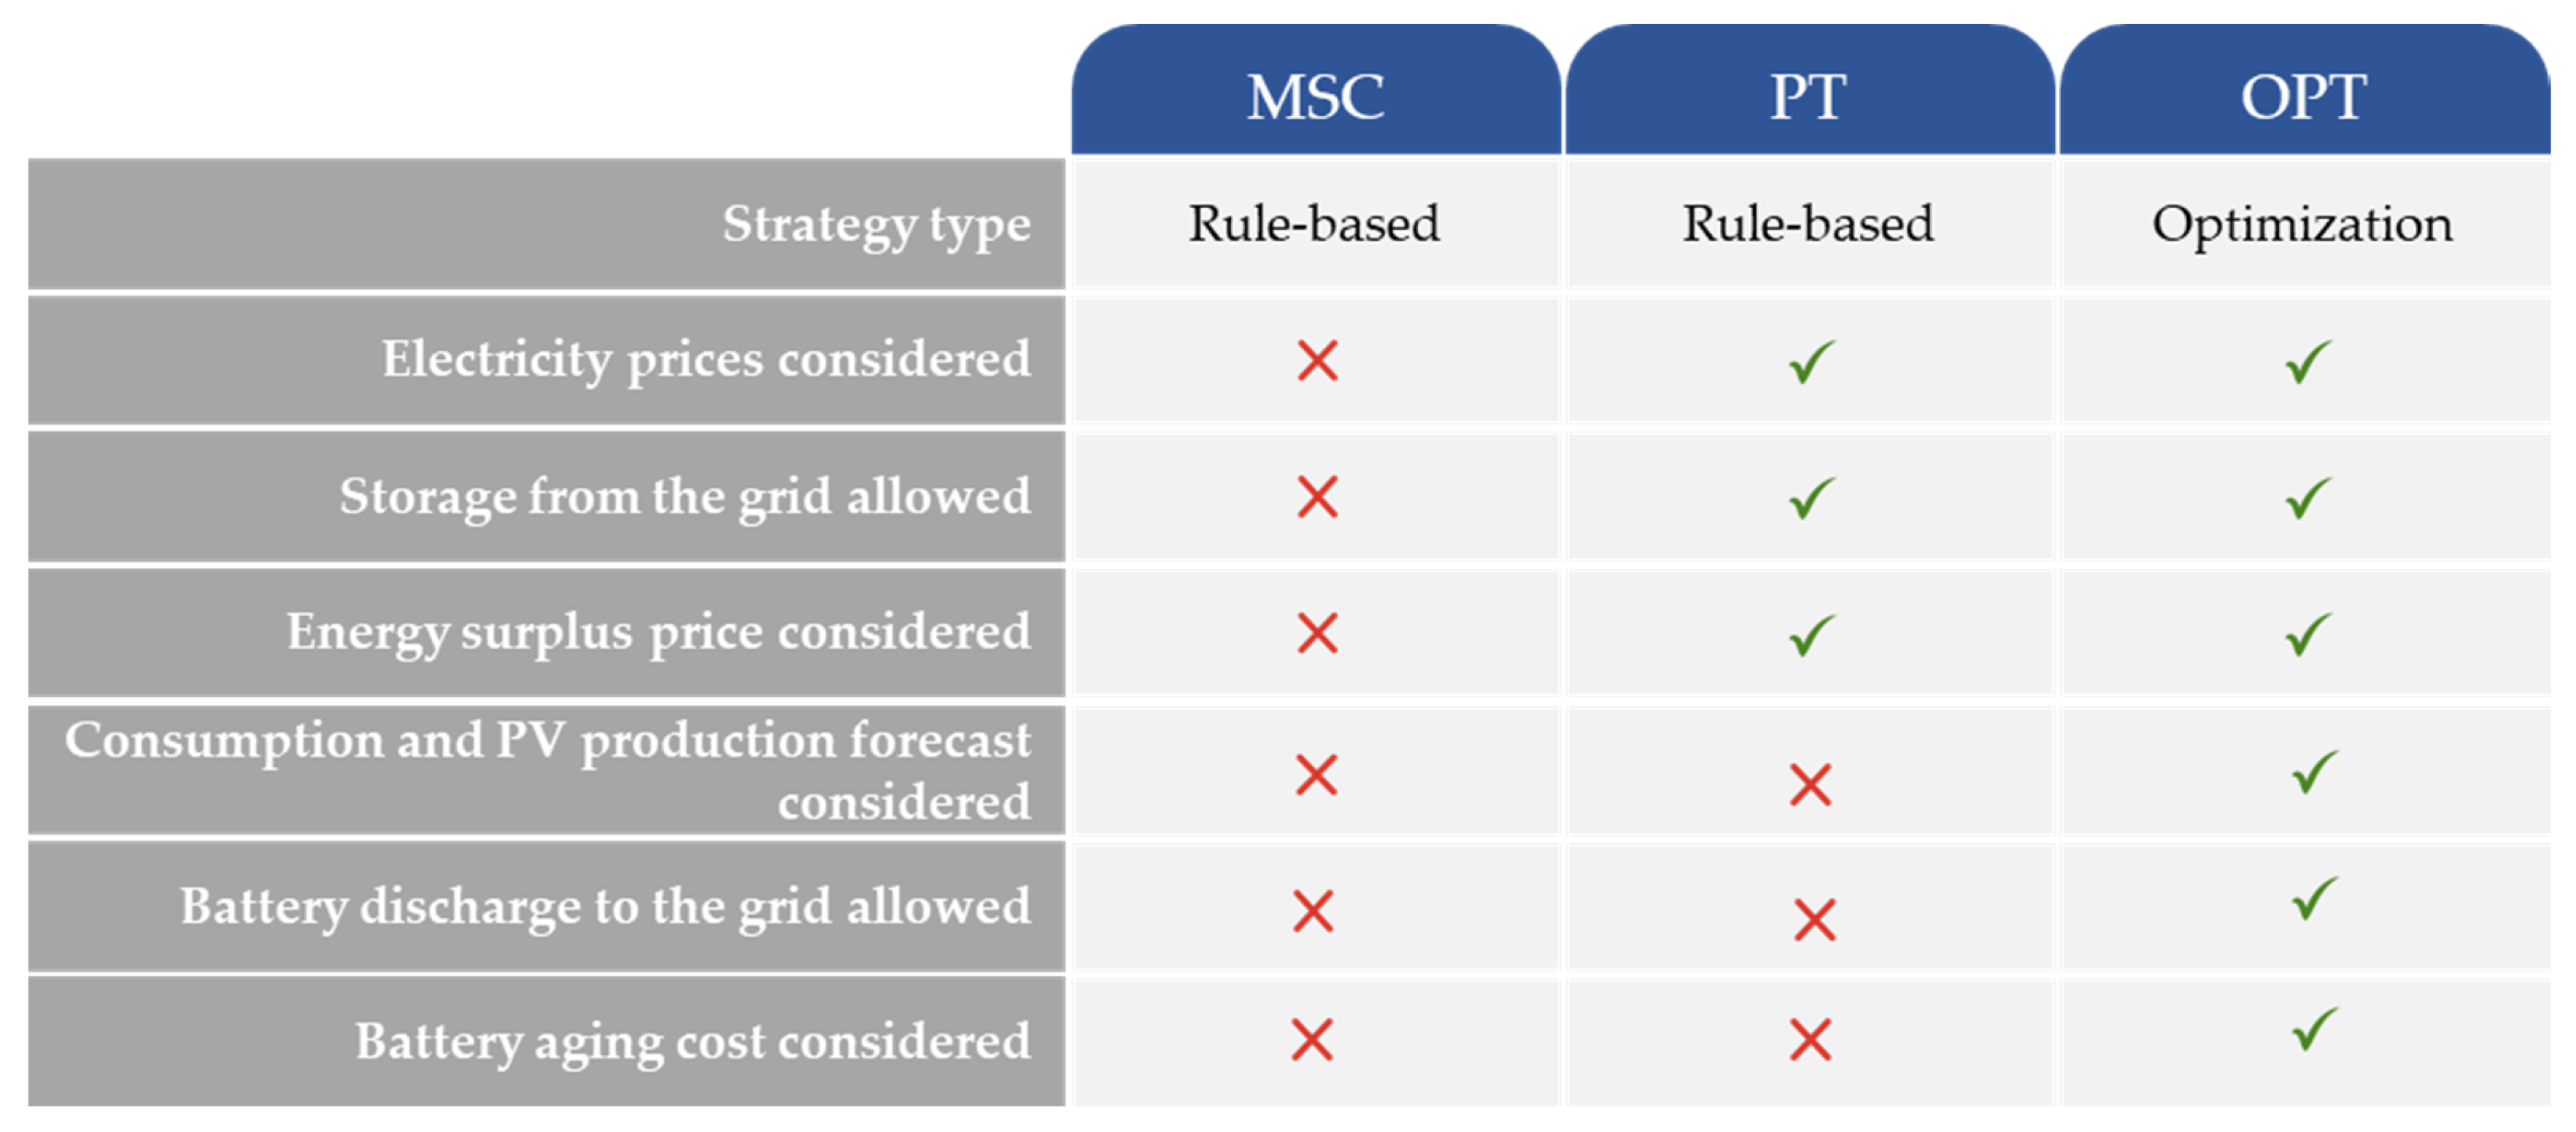
This study tests and compares three battery operating strategies: the most widely used strategy and two alternative strategies, one of them is based on the use of rules and the other one requires an optimization process. In addition, the strategies feature different characteristics depending on whether they take into account the price of electricity, allow the storage of energy from the grid, or allow the injection of stored energy into the grid.
Figure 1 summarizes the characteristics of each strategy.
2.3.1. Strategy 1: MSC (Maximum Self-Consumption Strategy)
This is the most conventional and widely used strategy in self-consumption PV systems with batteries nowadays. This strategy stands out for prioritizing the energy generated to cover the load demand and charge the battery. The basis of this rule-based strategy is as follows: when PV generation exceeds demand, surplus energy is stored in the battery as far as possible, and the excess energy is fed into the grid. Conversely, when generation is not enough to satisfy demand, the energy stored in the battery is used first and the share of consumption not satisfied by PV and the battery is covered by grid electricity. This strategy is therefore independent of external variables such as the price of electricity and focuses exclusively on increasing self-consumption. For this reason, it is known as MSC (maximum self-consumption).
2.3.2. Strategy 2: PT (Price Threshold Strategy)
One of the alternative strategies developed in this research consists of including the price of grid electricity among the decision variables considered in energy management. This rule-based strategy also introduces the possibility of storing energy from the grid in the battery, so that the use of the battery is not exclusive to the energy generated by the PV system. The basic principles of this strategy are: when the price of grid electricity is higher than a given threshold (), the base strategy is followed and electricity consumption from battery power is prioritized when generation is not enough to cover consumption. However, when the price of electricity falls below the charge threshold (), the procedure to follow is to charge the battery with both surplus PV energy and energy from the grid. Similarly, when generation is lower than demand, instead of using energy from the battery, it is reserved for periods with a higher electricity price and the demand is fully covered by energy from the grid. If the above conditions are not met and the price of electricity remains between the two charge/discharge thresholds, the use of the battery is minimized so that it is only used to store surplus PV energy and not to meet consumption.
This strategy involves two decision variables with a great impact on battery operation, the charge price, and discharge price thresholds. Estimating the optimal value for these variables requires an analysis process adapted to each scenario, since it depends to a large extent on the user’s consumption profile and electricity prices. To address this challenge, the model was programmed to test a set of options and find the optimal configuration to reduce energy costs for the user. For users with multi-period prices, the price assigned to one period was used for the price thresholds, while for market index pricing, a range of prices between maximum and minimum values observed was used.
2.3.3. Strategy 3: OPT (Optimization-Based Strategy)
A more complex strategy was also developed as part of this research. This strategy requires an optimization process to reduce energy costs and program battery operation. Compared to the previous strategies, this strategy is also characterized by the fact that it allows the battery energy to be injected into the grid. This gives the battery a second use in addition to storing PV energy for later consumption. The battery can also be used both to store energy from the grid in periods when the price of electricity is lower and to inject energy into the grid in exchange for financial compensation.
The goal of the optimization strategy, in contrast to rule-based strategies, is to schedule battery operation for future time periods. Two approaches are considered:
First, an optimization is performed considering future load and PV generation as known in order to obtain an approximation for the best result achievable. The optimization is run in windows of 36 h, from 12 a.m. of one day to 23 p.m. of the next day, the reason for this being that energy prices are known for this time period. This approach will be referred to as OPT.
The second approach uses forecasts for both load and PV generation: these forecasts are constructed using type curves considering the month and type of day (working and non-working day) for load and month and type of day (overcast, sun and clouds, and sunny) for PV generation. In this case, optimizations are performed each hour and the span of the optimization window varies to consider price availability. This approach will be referred to as OPT-MPC.
- ○
These type curves are computed as averages of the observed values with the considerations commented.
- ○
The criteria used to determine the previously mentioned weather class is the mean ratio of diffuse to global radiation during central solar hours and the following thresholds:
- ▪
[0–0.25): sunny. Code 1.
- ▪
[0.25–0.75): sun and clouds. Code 2.
- ▪
[0.75–1]: overcast. Code 3.
The different forecast values can be consulted in
Appendix B.
The optimization problem seeks to minimize the energy cost controlling battery flows hourly and is formulated as follows:
The variable used in the optimization is the energy charged(+)/discharged(−) from the battery: this value is corrected in the calculations with the respective charge/discharge efficiencies. The constraints refer to the energy limits due to the maximum capacity value, which is updated with aging, minimum capacity value, and power limits.
The objective function reflects the energy costs: when grid (
) energy flow is negative, it means that energy is imported and is paid at price
, and when it is positive, energy is exported and is paid at price (
. The grid energy flow is calculated as:
The last term considers a degradation cost weighted by the parameter alpha. Different values are considered for this parameter, ranging from 0 to 1.
Expressions used in these strategies use sign convention shown in
Figure 2 for energy flows.
2.4. Economic Evaluation and Strategy Comparison
In this article, three different operational strategies are compared in order to determine which is the most advantageous in economic terms. The baseline used for this comparison is the case of the load with the PV installation only, without the battery system.
In order to evaluate this economic advantage, present time savings with regard to the baseline are considered. Implementation costs are not considered in savings calculations as they are affected by multiple factors: installation environment, the particularities of commercial PV and BESS systems implemented and communication networks available. Thus, savings obtained serve as an indicator of how much it is possible to expend in these extra systems in order to improve the results.
The residual value of the battery system was not taken into account for savings calculations as there exists great variability from case to case and it is difficult to estimate in general; also, Apricum’s cost model [
35] assumes the residual value of behind the meter applications to be zero. In addition, in this article, it is considered that, when the batteries reach their end of life, they all have the same residual capacity.
2.5. Hardware Requirements for Strategies 2 and 3
Control algorithms considered in this article would require a micro-controller with a Modbus or similar protocols and ethernet communications. The former in order to communicate with the inverter and BMS to acquire PV generation and load consumption at a given time and the latter to obtain external information such as energy prices.
There is a plethora of options in the market, some examples are:
- -
Texas Instruments (TI) Tiva TM4C129x Series:
- ▪
Offer Ethernet MAC with MII (Media Independent Interface) and RMII (Reduced Media Independent Interface) interfaces, as well as CAN and UART modules.
- -
STMicroelectronics STM32F4 and STM32F7 Series:
- ▪
Come with Ethernet MAC, multiple CAN interfaces, and UART modules.
- -
NXP Kinetis K6x and K7x Series:
- ▪
Feature Ethernet MAC, FlexCAN (CAN FD) interfaces, and UART modules.
- -
Microchip PIC32MZ Series:
- ▪
Offer Ethernet MAC with RGMII (Reduced Gigabit Media Independent Interface) and MII interfaces, as well as CAN and UART modules.
- -
Infineon XMC4xxx Series:
- ▪
Come with EtherCAT (Ethernet for Control Automation Technology) and CAN interfaces.
- -
Renesas RX600 Series:
- ▪
Offer Ethernet MAC, multiple CAN interfaces, and UART modules, providing flexible communication options for industrial applications.
- -
Silicon Labs EFM32GG11 Series:
- ▪
Feature Ethernet MAC, multiple CAN interfaces, and UART modules.
The cost of the microcontrollers may range from EUR 100 to 300. When factoring in expenses for a protective case, wiring, and additional materials (estimated at around EUR 100), as well as installation and programming costs (estimated at around EUR 500, considering 5 days of work—3 for implementation and 2 for testing—and a rate of EUR 13 per hour), the total implementation cost is estimated to fall within the range of EUR 700–900.
4. Results
The objective of this section is to compare the savings generated by each strategy implemented in the PV-BESS system in comparison to the PV-only system. The aim is to determine the most beneficial strategy for increasing profits when a battery is already in place. Therefore, the analysis will not take into account the investment in the BESS and will conclude when the battery’s lifespan ends.
4.1. Visualizing Strategies’ Behaviors
Prior to the analysis of the results, in order to visualize how strategies operate differently,
Figure 6 shows the distinctive behaviors of the battery under each strategy during the same 3-day period.
From the previous figure, several observations can be made:
Under the MSC strategy, it can be observed that, during daylight hours, excess energy is stored in the battery, and only the energy that cannot be stored is injected into the grid. During the first hours of the night, the battery is discharged to meet consumption.
Under the PT strategy, a distinct pattern emerges, particularly evident during the first evening from hour 2610 onwards. During this period, the battery’s discharge time is reduced from four hours to just two. This adjustment stems from the strategy’s decision to utilize grid electricity during the more cost-effective hours in order to meet consumption demands. A few hours later during the night, the battery is recharged over a two-hour span, capitalizing on the lower energy prices. As a consequence, the battery becomes incapable of storing surplus PV energy throughout the subsequent day. Moving to the second night, starting at hour 2635, the PT strategy discharges the gradually battery throughout the entire night, selectively during the higher-priced hours. During the last day, both the MSC strategy and the PT strategy exhibit similar behaviors.
The OPT strategy adopts a distinct approach. On the first day, it charges the battery with solar surplus energy but only up to 60%. The remaining surplus energy is injected into the grid, and the battery is fully discharged in the evening when electricity prices are at their peak. Over the subsequent two days, the battery follows a similar pattern, charging during off-peak hours and discharging when electricity costs are high. Notably, this strategy is the only one that deliberately abstains from fully utilizing surplus energy to charge the battery, as there is an opportunity cost associated with not selling it back to the grid.
4.2. Results for Each Strategy: Total Energy Savings and Years of Operation
The final goal of the simulation is to determine which strategy produces the largest economic savings when implemented in the same PV-BESS self-consumption facility. Each strategy produces a different battery degradation, which is why the comparison between the strategies will not be made over a specific time period, but rather until the end of the battery life. Each strategy’s results are presented in the ensuing subsections.
4.2.1. Results for MSC Strategy
Table 5 shows the results for the MSC strategy, which is the most commonly used option in self-consumption PV systems with batteries.
From the previous table, it is worth noting that, when utilizing the MSC strategy under the multi-period tariff, savings are not achieved, and the results are negative. In other words, the maintenance cost of the battery exceeds the savings it can provide.
As expected, the battery lifespan is the same in both cases. This is because this strategy does not alter its behavior based on electricity prices, resulting in identical battery actions in both scenarios during the whole battery lifespan.
4.2.2. Results for PT Strategy
For the PT strategy, different sub-strategies were simulated. Each of these sub-strategies allows the battery to charge and discharge at different electricity prices. To better illustrate the results of each sub-strategies, the two following heat maps were created, where each cell displays the total savings and the battery lifespan. The first heat map shows the results under market index pricing and the second under multi-period pricing.
As observed in
Figure 7, for market index pricing the best outcome for this strategy occurs if the battery is allowed to charge when the energy price is below 0.111 EUR/kWh and discharge when it is above 0.165 EUR/kWh.
As seen in
Figure 8, for multi-period pricing, the best outcome for this strategy occurs when the battery is allowed to charge when energy price is below 0.172 EUR/kWh and discharge when it is above 0.194 EUR/kWh.
Table 6 shows the best results obtained for the PT strategy, both for market index and multi-period pricing.
4.2.3. Results for OPT Strategy
As previously explained, this strategy employs an optimization process to minimize energy costs and schedule battery operation. In addition, this strategy also uses new decision variables such as battery aging cost, formulated as battery investment multiplied by battery life lost, and the prediction of load and PV production.
Regarding the battery aging cost, a weight is applied to this term to explore the trade-off between battery duration and savings obtained. Values between 0 and 1 are explored. The results are shown in
Figure 9 and
Figure 10. After this analysis, the weight that yields the best result is selected.
Table 7 shows the best results obtained for the OPT strategy, both for market index and multi-period pricing.
4.3. Comparison of the Results and Insights
Table 8 compares the outcomes of each strategy across different electricity tariffs. For strategies 2 and 3, the outcomes shown are the ones generated for the best sub-strategies analyzed.
The MSC strategy achieves savings of EUR 1464.9 when compared to the PV-only system under market index pricing. However, in the case of multi-period pricing, savings turn out to be negative (at EUR −54.3). This indicates that the maintenance costs of the batteries alone exceed the economic benefit they can offer. Since the MSC strategy does not alter its behavior based on electricity prices, the battery actions have to be the same across the market index and multi-period pricing, resulting in identical operational durations (5.3 years). The disparity in savings arises due to lower battery discharge prices in the context of multi-period pricing.
The PT strategy performs better than the MSC strategy under both market index pricing and multi-period pricing. For market index pricing, the most attractive option for battery charging is when prices are below 0.111 EUR/kWh. This is because this is the lowest price point that includes the PV surplus, which is priced at 0.11 EUR/kWh. Consequently, the battery charges using the surplus energy as well as electricity from the grid when it is below this price. As for discharge, the greatest savings occur when allowing discharge at any price above 0.165 EUR/kWh. For multi-period pricing, since 0.172 EUR/kWh is even lower than the P6 price (refer to
Table 1), this implies that the battery is only being charged using surplus energy. Regarding discharge, it only occurs when electricity price is above 0.194 EUR/kWh, which corresponds to periods from P1 to P5 (refer to
Table 1).
The OPT strategy presents the best result, as expected. As previously explained, this strategy executes an automation algorithm and relies on the day-ahead hourly electricity price given by the market operator; it also relies on predictions of electricity demand and PV generation. If these two predictions are not accurate, the savings provided may be diminished. In this case study, historical data were used instead of prediction data; therefore, these results can be understood as a maximum limit to the improvement that this strategy can offer.
4.4. Influence of Prediction Errors in the OPT Strategy
In order to analyze how prediction errors can impact the OPT strategy, the OPT-MPC approach was developed. As explained in
Section 2.3.3, this approach employs a simple method to forecast both PV generation and energy consumption. Due to imperfect predictions, the MSC approach logically leads to the less optimal operation of the strategy.
Figure 11 illustrates the battery operation of the MPC approach in comparison to the OPT strategy.
Figure 11 shows how the pattern followed by the SOC is very similar in both graphs. However, there are some differences that can be attributed to prediction errors. These slight differences will lead to a minor decrease in the provided savings.
The savings achieved by the OPT-MPC strategy under market index pricing amount to EUR 2086.5 within 5.4 years of operation. This shows that, even when using the simplest prediction models, the OPT strategy can yield higher savings than the MSC and PT strategies.
4.5. Aging Behavior
Figure 12 shows which part of the degradation of batteries during its life is due to calendar aging and cycle aging for each of the strategies.
In both market index pricing and multi-period pricing, the MSC strategy exhibits a higher level of cycling aging. This outcome stems from the fact that this strategy discharges the battery whenever there is consumption exceeding PV generation, without considering the possibility that utilizing grid electricity might be more advantageous when its price is low.
Under multi-period pricing, both the OPT strategy and the PT strategy display a more pronounced deviation from the MSC strategy. The reason for this is that the lower price volatility of multi-period pricing makes the PT and OPT strategies more selective in their usage of the battery.
5. Conclusions
This article analyzes the use of external decision variables in battery operational strategies, such as energy prices, PV forecasting, load prediction, and battery aging cost. After conducting a thorough analysis of the behavior and outcomes of the different strategies used, the following findings can be drawn:
Incorporating electricity prices as a decision variable in energy storage operation strategies to purchase energy from the grid when prices are below a certain value and consuming it when grid electricity prices are above a certain value can improve battery profitability. The PT strategy increases the savings provided by the battery by 19% under market index pricing and makes savings turn positive under multi-period pricing when compared with the MSC strategy (which is the most commonly used strategy nowadays in self-consumption systems).
Using an optimization strategy (OPT strategy) which adds consumption and PV generation prediction as decision variables, the savings provided by the battery increases by up to 37% under market index pricing and by up to 24% under multi-period pricing when compared to the PT strategy.
Aggressively employing high-depth discharge cycles in certain strategies may yield maximum short-term earnings. However, this approach can potentially compromise the long-term operational lifespan of the battery (battery years of operation) due to cycle aging. Therefore, a judicious balance between aggressive and conservative operational approaches is essential to optimize overall benefits. The selection of an accurate aging model is crucial to properly evaluate this balance (Reviewer 3).
When analyzing how errors in predictions can impact the OPT strategy, a basic method to forecast both PV generation and energy consumption was used. Still, the OPT strategy turned out to be better than the PT strategy and the MSC strategy.
It is worth noting that simulations have shown that the MSC strategy can even be counterproductive. Under multi-period pricing, the MSC strategy did not generate enough savings to cover the maintenance costs of the batteries.
This article’s primary contribution lies in its comprehensive analysis and comparison of various battery strategies. This is accomplished through the utilization of a sophisticated aging model that assesses cycle aging—a dimension often overlooked in techno-economic analyses. Moreover, the study is uniquely contextualized within the Spanish electric pricing framework and draws from authentic industrial consumer data, setting it apart from existing research in the field.
However, it is important to acknowledge certain limitations. Firstly, this study exclusively focuses on lithium-ion batteries. Additionally, the simulations do not account for uncertainties related to state-of-charge and state-of-health estimations, and more intricate models of power electronics systems and system integrations were not included in the analysis. Finally, more complex prediction models could be used to enhance the MPC strategy.
Expanding this framework to encompass a broader range of battery technologies could yield valuable insights. Conducting real-world experiments to quantify the impact of these estimations on economic indicators would further enhance the robustness of this research. Furthermore, an advanced model of the systems, which incorporates detailed representations of power electronics, could be employed to account for performance variations under diverse load conditions.
The findings of this article reveal that the implementation of the proposed strategies can considerably increase the savings offered by energy storage batteries. This is a step towards the moment when batteries become profitable in photovoltaic self-consumption systems, as the significant investment required today for battery installation still makes batteries unattractive most of the time. Furthermore, with the growing share of renewable energy sources in the power grid, it is expected that electricity prices will become more volatile. This will make this type of price-driven strategies even more attractive.


