Abstract
Forests are a potentially carbon-negative energy source and function as carbon sinks. However, both of these functions have become threatened significantly by spruce bark beetle infestation in Czechia. This paper assesses how this ecological issue may affect the future energy mix, and in the process, affect carbon emission reduction targets and the available share of renewable energy sources (RESs). We assess several forest development scenarios with three policy incentives: subsidising wood pellet production, striving for climate neutrality, and adhering to ecological constraints. We build a spatially enriched energy system model, TIMES-CZ, based on Eurostat’s NUTS3 regions. We find that the spruce bark beetle infestation may not exert a lasting influence on overall decarbonisation pathways, the energy mix, or system-wide costs in any forest scenario. The RESs share is affected only until 2030, and the effect is minimal, at <1.5 percentage points. Nevertheless, Czechia’s RES contribution is far below the 45% 2030 EU target. Subsidising wood pellet production is a costly transition that does not contribute to meeting the target. Limiting forest biomass availability and adhering to ecological constraints increase the overall system costs and worsen the chances of meeting decarbonisation targets.
1. Introduction
One way to combat climate change is to promote renewable energy sources (RESs). Most countries worldwide support RES investment and have set targets to increase their share in total energy consumption. The European Parliament agreed—on 17 September 2023—to boost the deployment of renewable energy in line with the European Green Deal and REPowerEU plans. This update of the Renewable Energy Directive (RED) increases the share of renewables in EU final energy consumption to 42.5% by 2030, whilst the EU Member States should strive to achieve 45%.
Following this legislation, in September 2023, the Czech government prepared the actualisation of its National Energy and Climate Plan, which relies heavily on combining renewable and nuclear energy sources. To date, biomass has been the most crucial source of clean energy in Czechia, as has been the case in most central European countries. Due to the limited capacity of biomass, other renewable energy sources—wind and, in particular, solar energy—will become more important sources of clean energy in the future energy mix. However, biomass has the potential to be a flexible source, unlike many other RESs, because it can be burnt in conventional power plants. One drawback, though, is that forests can be some distance from power plants, and transporting biomass can be costly [1], limiting its economic potential.
Moreover, the central European region has recently experienced a spruce bark beetle infestation [2], which has cast doubt on the medium and long-term accessibility of forest biomass for energy production. This paper analyses the role of forest biomass in the decarbonisation of the Czech energy system, considering the EU requirements, ecological constraints, and economic limitations, by using a spatially enriched energy system model.
The need to practice reliable and science-based energy system modelling (ESM) has been growing as a direct response to policymakers’ calls for strategies and plans to reach a carbon-neutral future. Although many such models have been built and applied for decades, they still face multiple modelling challenges to providing realistic and effective energy transition plans. Energy system optimisation models search to identify cost-minimal pathways, assuming perfect behaviour from a central planner’s perspective and neglecting decision making under uncertainties or biased perceptions and behaviour. This modelling feature often leads to inaccurate assumptions regarding the requirements of a successful energy transition. As a result, ESM underestimates the required capacities for power generation, storage, and transmission compared with real-world energy systems, which is a phenomenon known as the “economic granularity gap” [3]. Furthermore, a review by Fodstad et al. [4] identifies four main challenges in ESM: the handling of several energy carriers within the system analysed, how uncertainty is dealt with, the integration of energy transition dynamics and energy behaviour, and the integration of different scales regarding time and space; the latter aspect has also been most frequently identified as the main modelling challenge in previous reviews.
The first contribution of our paper is to enrich the literature that deals with spatial resolution in cost-optimisation ESM. In principle, the spatial granularity of the model can be improved by linking ESM to a Geographic Information System (GIS) or by increasing the resolution of the model with respect to space. While the former involves an assessment of meteorological conditions, and the deployment and expansion of energy infrastructure or land availability, the latter modifies model granularity to realistically map the potential and availability of RESs or to analyse optimal power-plant siting (see more in ref. [5]). Because transporting biomass to a power/heat plant can entail considerable costs, GIS linkage or finer spatial granularity allows the model to consider distances directly in energy system cost optimisation.
There are several examples of studies that have implemented regional aggregation of electricity and climate data: see, for instance, refs. [6,7,8,9,10,11,12]. Maimó-Far et al. [13] analyse the effects of spatial granularity on an optimal renewable (wind and solar) energy portfolio in Spain. However, literature on spatially enriched ESM is relatively recent and sparse [5]. Resch et al. [14] and Ramirez Camargo and Stoeglehner [15] discuss the integration of spatial resolution and ESM but mainly focus on GIS applications, while other studies have aimed to investigate how spatial data aggregation improves the precision of results (e.g., [16]). A very recent review by Martínez-Gordón et al. [5] identifies several ESM applications based on a finer spatial resolution in biomass energy; however, the majority of the applications aim to analyse optimal locations of biomass power plants based on proximity to biomass sources, including transportation costs. Three other studies have aimed to calculate the potential and availability of certain types of biomass; however, these studies have focused only on limited biomass sources, such as residual biomass [17], biomass from agricultural land [18], or biomass planted on marginal lands [19].
We enrich the TIMES [20,21,22] energy system optimisation model by splitting three components of the otherwise country-wide ESM—forest biomass availability, power and heat, and industry production and energy services consumption—into 14 relatively small sub-systems (≈3000–11,000 km) defined by EUROSTAT’s NUTS3 regions. This allows us to vary the transportation costs of biomass by distance from the sources to the generation units (grouped into 14 sub-systems) and, hence, to evaluate the economic costs of biomass more precisely. The level of granularity in the TIMES-CZ model is beneficial in a number of ways. Because forest biomass is not evenly distributed throughout the country, a regionalised model more accurately reflects the costs associated with transporting forest biomass. For example, forest biomass is abundant in southwestern Czechia. As the cost of transporting biomass increases with distance, a regionalised TIMES-CZ model can make more informed decisions on where to establish new biomass-burning or co-burning facilities. Increasing spatial granularity also brings our TIMES-CZ model closer to the real-world energy system. To the best of our knowledge, no comprehensive regionalisation of any optimisation ESM has been conducted prior to this study.
The second contribution of this paper is its evaluation of the potential impact of the spruce bark beetle infestation on the Czech energy system until 2050. Before the infestation, spruce trees made up roughly half of Czech forests [23]. Prolonged periods of drought and increased temperatures, together with bark beetles, have been quickly destroying spruce trees since 2012. The paths through which the spruce bark beetle infestation may evolve up to 2070 have recently been conceptualised by the Institute for Forest Ecosystem Research (IFER), which built four possible scenarios on the availability of forest biomass given the spread of spruce beetles and the Land Use, Land Use Change, and Forestry (LULUCF) [24]. Based on these scenarios, we quantify the potential availability of forest biomass for energy purposes. Because forest biomass is unequally distributed across regions and the spruce beetle infestation is not uniform [25], our regionalisation of forest and energy system modelling was performed using the same spatial granularity.
Applying our spatially enriched TIMES-CZ model, we analyse impacts on the energy mix, decarbonisation efforts, and final allocation of forest biomass resources up to 2050. Specifically, we incorporate forest biomass projections, based on Cienciala and Melichar [24], into our regionalised TIMES-CZ model. The previous version of the TIMES-CZ model [26] had limited ability to distinguish energy production and demand technologies by location. The model employed in this paper offers a spatial resolution that more effectively accounts for potential transportation costs. It identifies a more realistic allocation of final energy resources and the decisions on where to install new heat and power plants.
Third, our paper contributes to the current literature by examining the role of forest biomass in achieving greenhouse gas emission (GHG) reduction targets in Czechia, considering that forests have become heavily infested with spruce bark beetles in the last ten years. We analyse energy system pathways, GHG emissions, and RES targets for four main ‘ecological’ scenarios on forest development in Czechia: RED anticipates that the spruce beetle infestation will subside, GREEN assumes the infestation will end soon, and 6% more timber can be harvested. In BLACK, the infestation will continue to spread in Western regions, and in BLACK-REP, it will resurge every ten years. We then change policy measures and GHG emissions targets in the following three RED scenarios: RED-P50 assumes a 50% production cost subsidy on wood pellets, RED-HH requires the exclusive use of biomass in households, starting from 2035 in accordance with ecological requirements, in order to maximise biomass remaining in forests, and RED-0 is the only scenario in which GHG emissions are set to be reduced to near-zero, reaching a maximum emission balance of 2.2 Mt by 2050. Our main research question is whether the availability of forest biomass affected by the bark beetle infestation and biomass costs could pose challenges for Czechia to contribute sufficiently to the EU’s 2030 RES target and to achieve climate neutrality by 2050.
2. The Regionalised TIMES-CZ Model and Biomass Availability
TIMES is an energy system optimisation model that operates from a bottom–up perspective. It seeks the most cost-effective path to fulfil energy service demands under given constraints. The TIMES is developed and maintained as part of the Energy Technology System Analyses Program (ETSAP) by the International Energy Agency (IEA) [27]. Originally, the TIMES-CZ model was based on the Czech region of the pan-European TIMES PanEu model, which was developed by the Institute of Energy Economics and Rational Energy Use at the University of Stuttgart [28]. Since the introduction of the initial version, the TIMES-CZ model has undergone enhancements, including the incorporation of individual facilities operating within the scope of the EU Emission Trading System (EU ETS) [20,21] and the inclusion of a comprehensive transportation module [26].
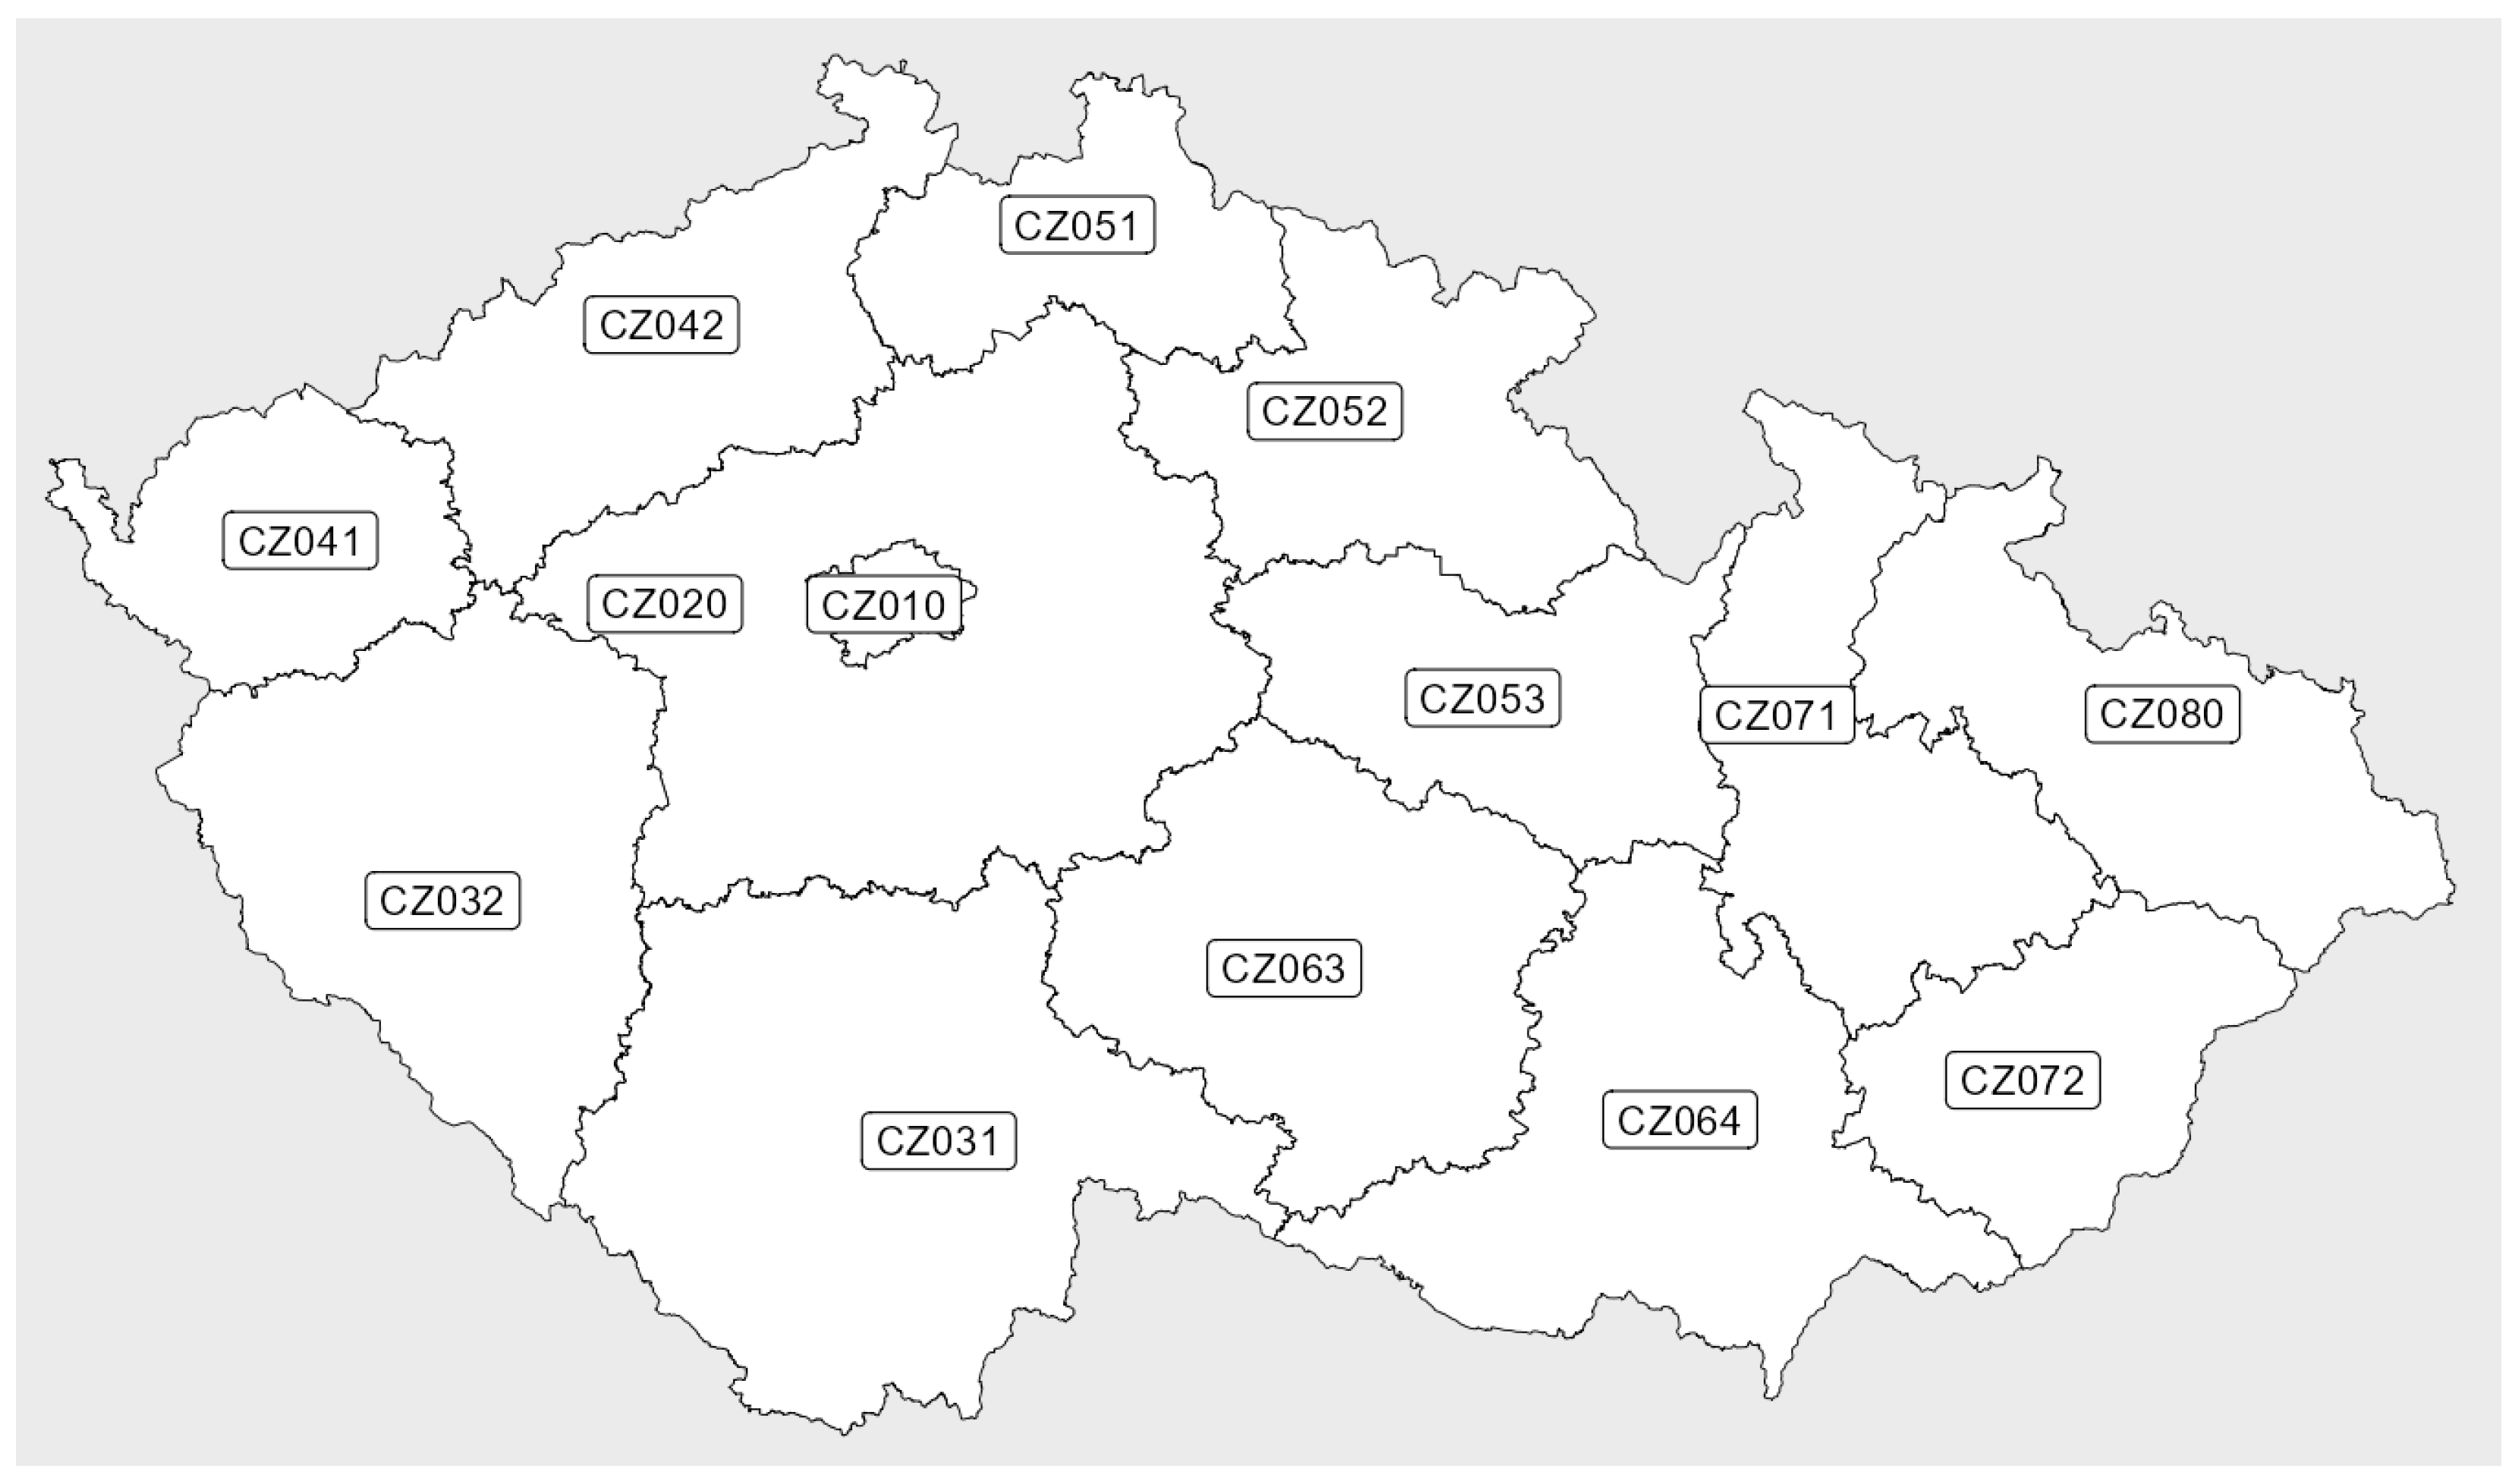
In this paper, we update and extend the TIMES-CZ model considerably in several ways. We update the base year of the model to 2019. Although data for 2020 were available, we chose 2019 to avoid bias caused by the COVID-19 pandemic restrictions in 2020. We split three components of the otherwise country-wide ESM—forest biomass availability, power and heat, and industry production and energy services consumption—into 14 relatively small sub-systems (≈3000–11,000 km) defined by EUROSTAT’s NUTS3 regions. We use individual data on facilities participating in the EU ETS scheme, annual reports on electricity and heat grids [29,30], regional energy balances [31], and sample surveys on energy consumption in households [32] to divide data on power, heat, and industry production and energy services consumption into 14 NUTS3 regions. Figure 1 represents regionalised Czechia. Only transport and non-energy-intensive industry production remain aggregated at the level of Czechia as a single region due to a lack of regionalised data in this area.
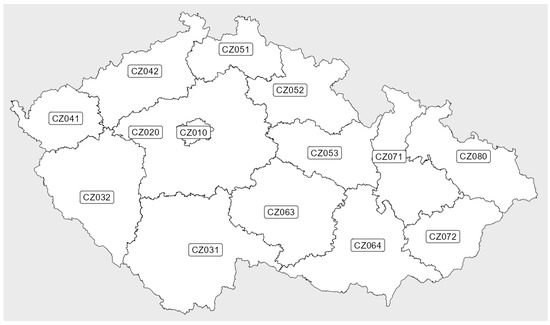
Figure 1.
Czech NUTS 3 regions: the building blocks of our regionalised TIMES-CZ model.
We categorise forest biomass based on both the harvesting method and its form of energy utilisation. Additionally, we incorporate the forest biomass development scenarios projected by Cienciala and Melichar [24] to estimate biomass availability for energy purposes. Further elaboration on this biomass extension is provided in subsequent sections.
Spruce bark beetles have become a major problem for Czech forests since 2012 [23]. These beetles destroy massive areas of forests, as spruce is one of the most widespread species of trees [33]. With climate warming, bark beetles multiply even faster [25], and the pace of felling trees and removing them from the forests has failed to keep pace. The infestation threatens the availability of biomass for various purposes, including energy. Our paper focuses exclusively on forest biomass and does not consider biomass from agricultural and marginal lands, unlike Knápek et al. [18]. Therefore, when we mention biomass in the text, we imply solely forest biomass.
IFER analysed possible pathways for managing and adapting Czech forests to respond to the challenge [24]. They designed four possible scenarios envisioning forest development and the amount of timber harvested, taking into account probable changes in forest management and the impact of spruce bark beetle infestation. Considering these scenarios, we calculated the percentage of biomass available for energy purposes, factoring in the past patterns of all potential uses of forest biomass (e.g., energy, timber, production of furniture, pulp, and paper). These scenarios include all types of biomass, both softwoods and hardwoods, which are referred to as conifers and broadleaf, respectively. Biomass is classified into three narrower categories based on its most likely use: firewood, forest chips, and white chips. This classification indicates the quality of the wood itself but not necessarily its final state. For example, white chips are raw materials and can be transformed into wood pellets, but they may be used for other purposes—retaining their original state.
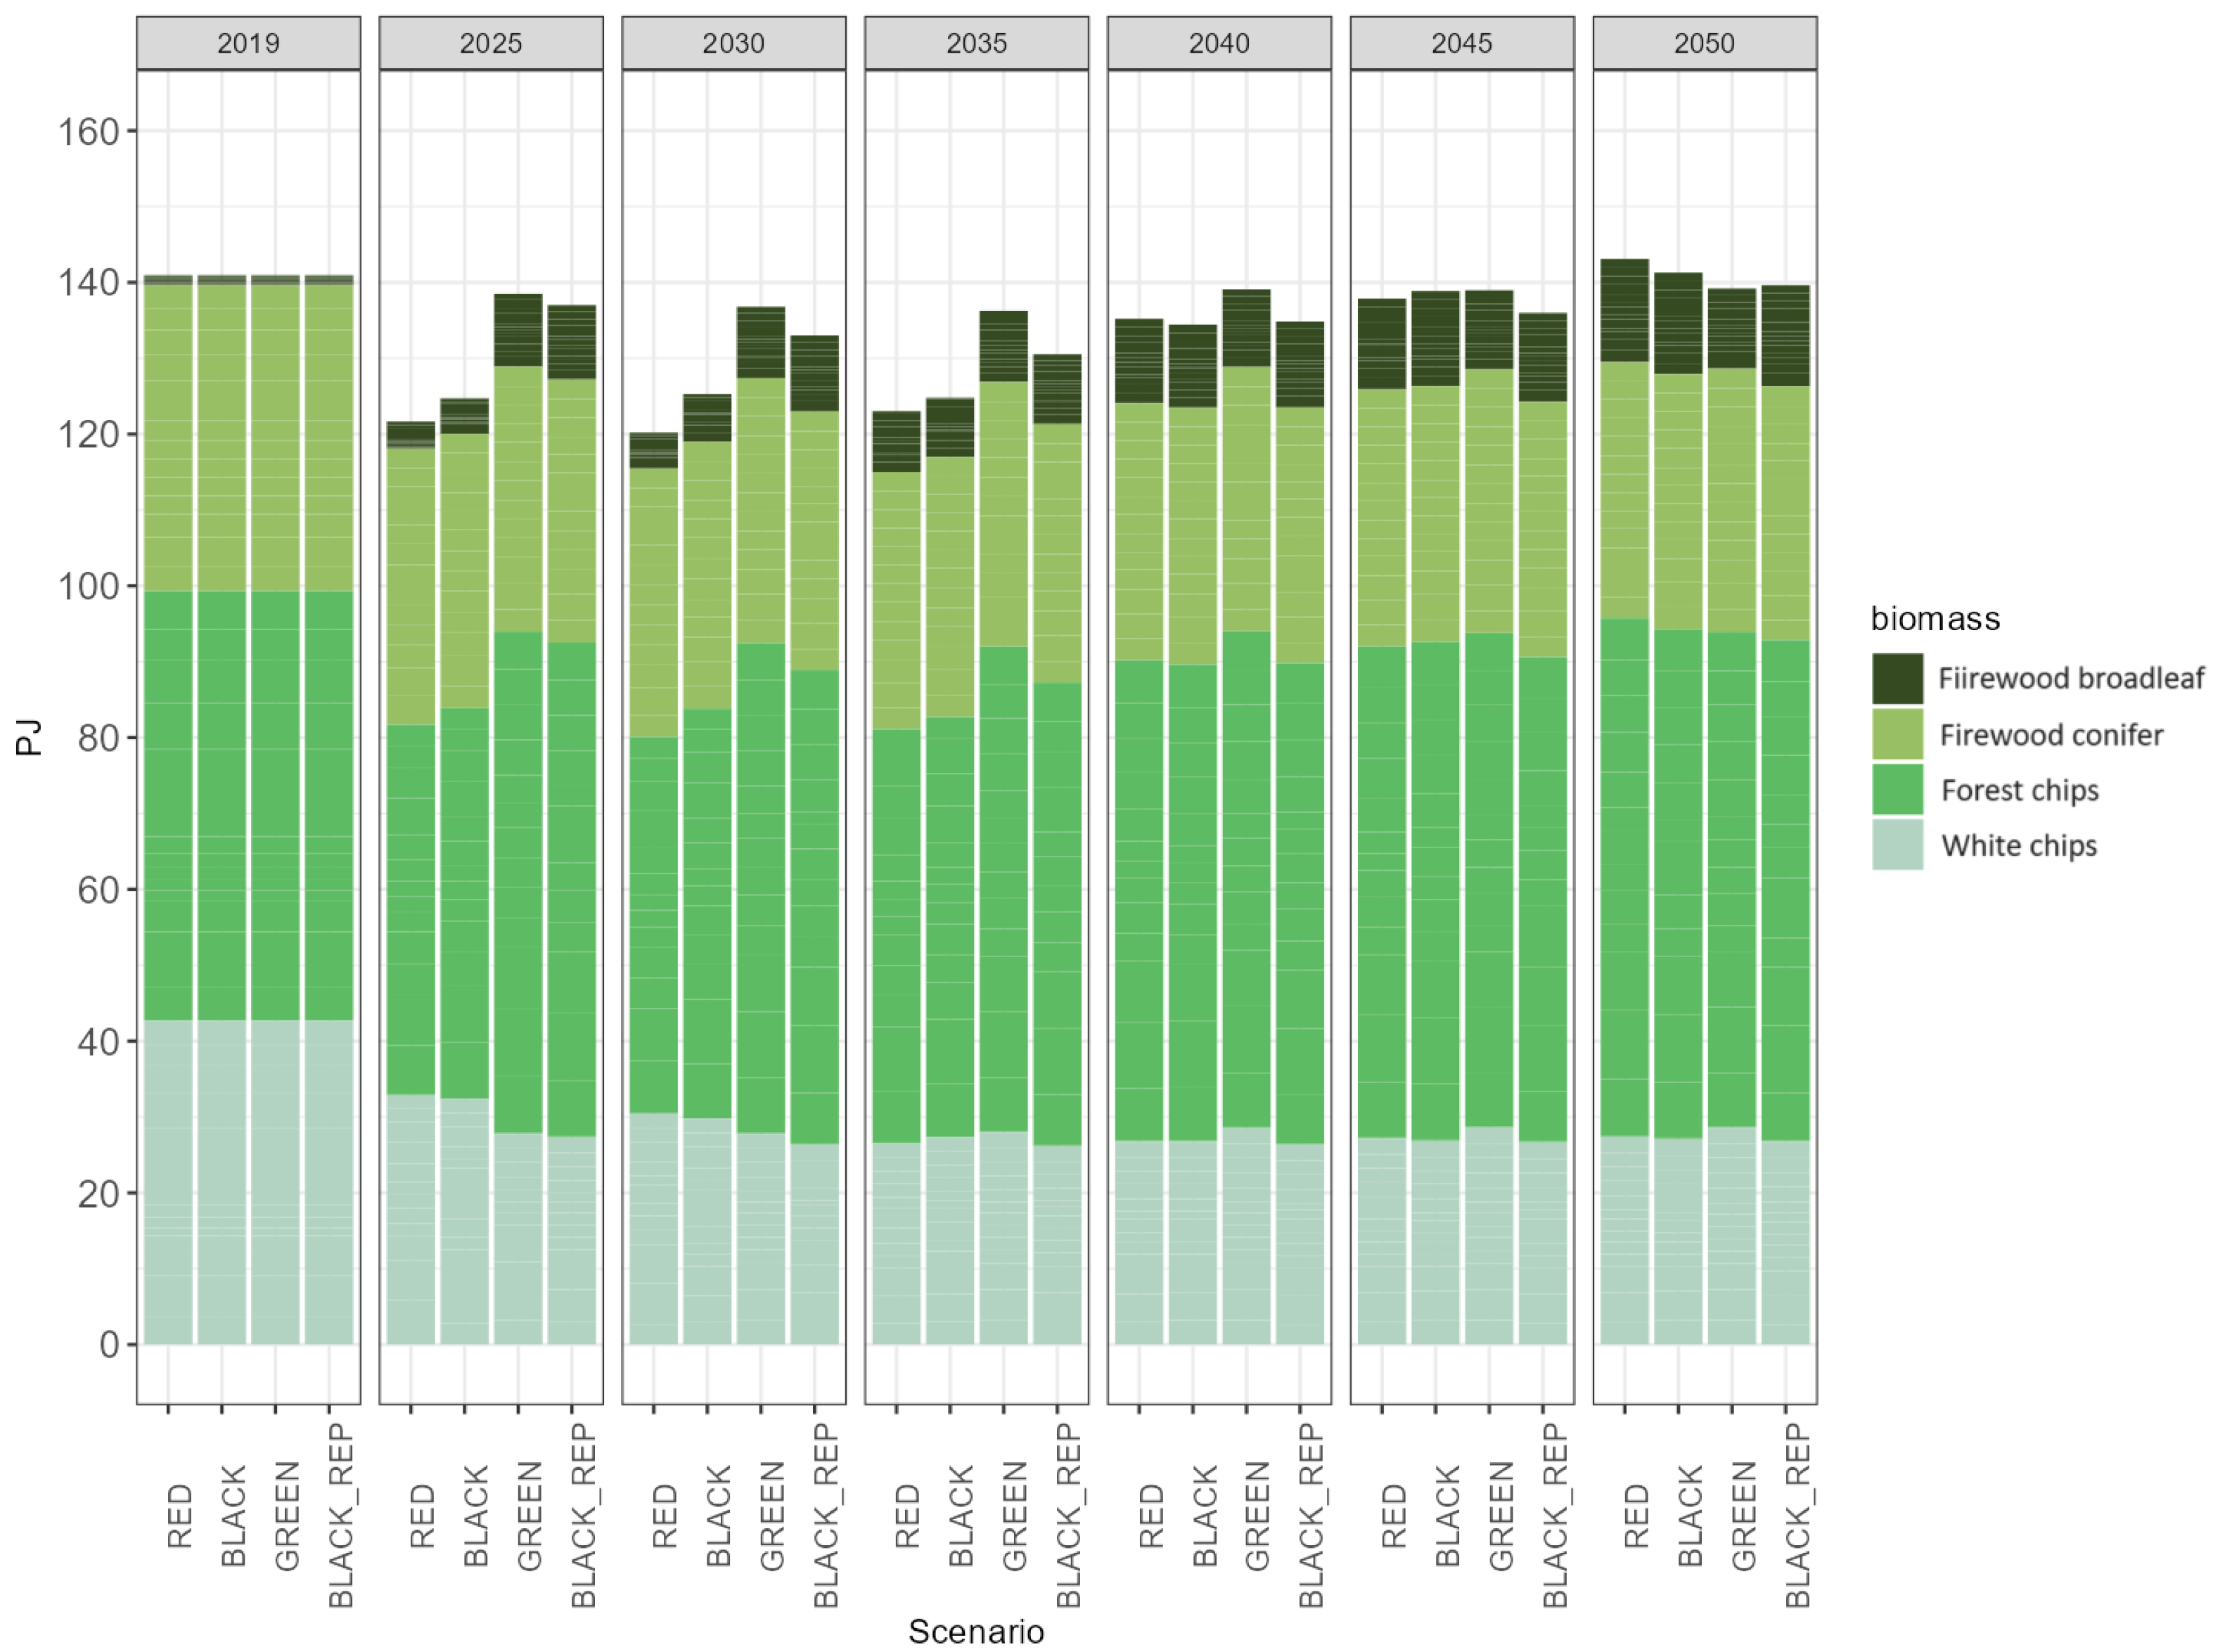
In the following, we define all four scenarios. The RED scenario, which we use as the baseline, anticipates that the spruce beetle infestation will subside. The GREEN scenario predicts that the infestation will end sooner than in RED and enable a 6% greater timber harvest than in the other scenarios. The BLACK scenario conjectures that the infestation will spread into more western regions given the riskiness level involved, and finally, the BLACK-REP scenario envisions that the infestation will repeat every decade. Figure 2 depicts the maximum possible amount of biomass harvest for energy purposes by categories under these four scenarios.
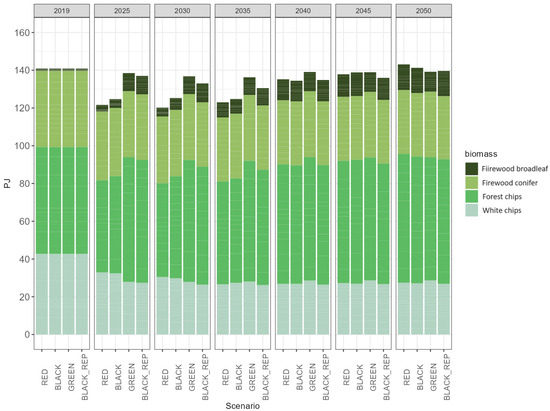
Figure 2.
Biomass availability for energy purposes 2019–2050, broken down into four products based on their most likely use. Source: Authors’ computations based on Cienciala and Melichar [24].
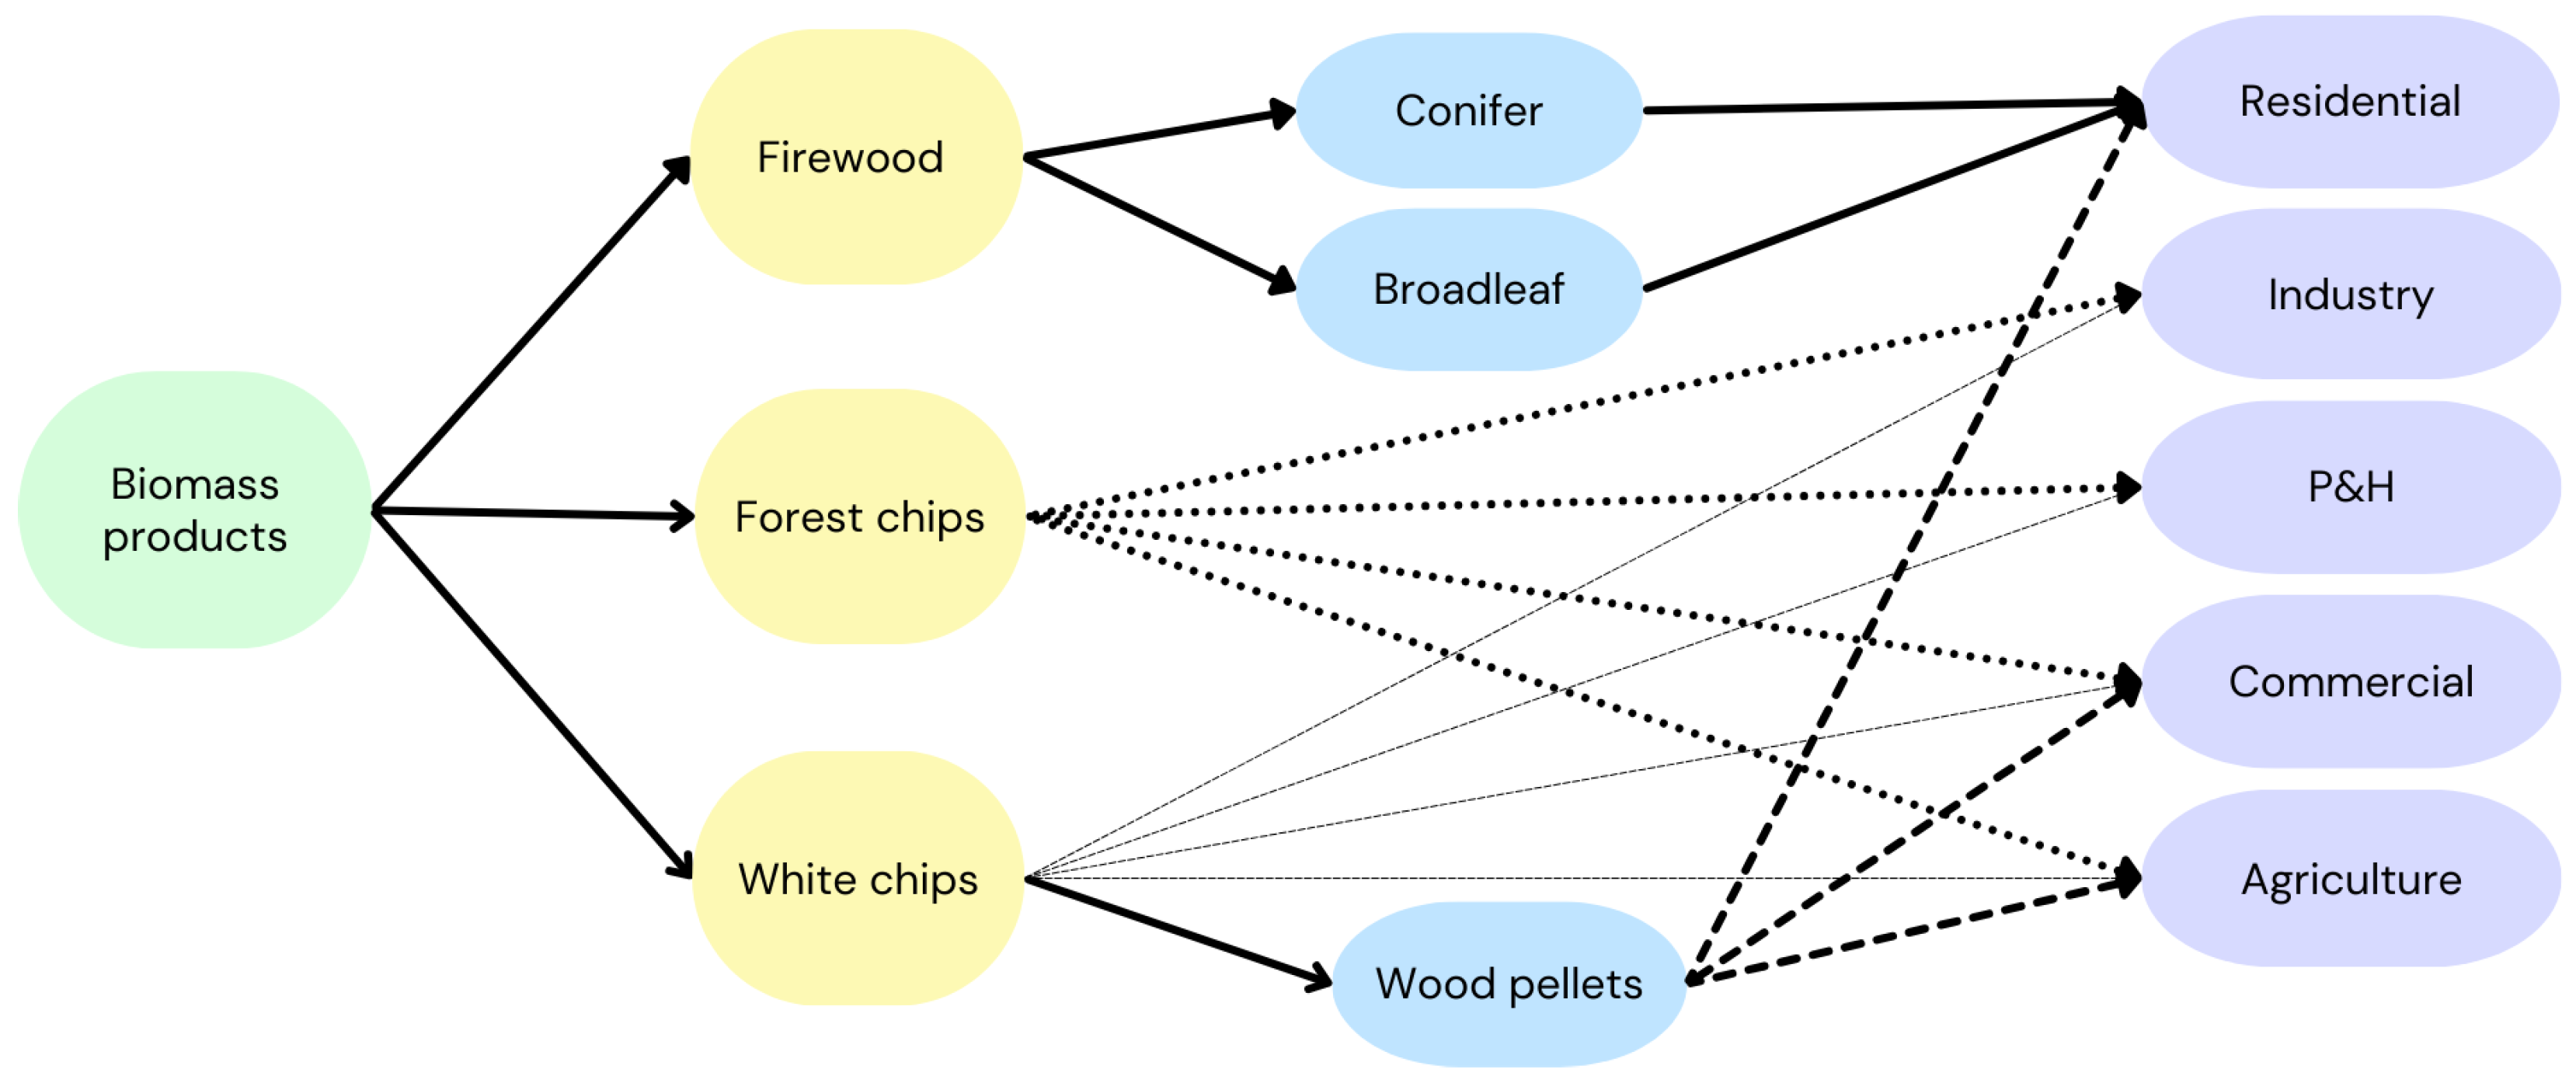
Figure 2 shows four biomass products. For firewood, the authors consider the distinctions between broadleaf and conifer relevant, while such a distinction is not crucial for forest chips and white chips. In the model, firewood and white chips are primarily used in the residential sector, because most white chips are transformed into wood pellets. In contrast, forest chips are favoured for power, heat production and industrial sectors. Figure 2 depicts the maximum possible supply of each type. To avoid the unnecessary conversion of biomass into more expensive products, such as wood pellets, the model directs unprocessed white chips to power, heat, and industry. From Figure 2, it is clear that the largest differences between forest biomass development scenarios occur in 2025–2035. Nevertheless, the magnitude may not be large enough to create significant differences in the final allocation of resources. The figure also demonstrates the lasting nature of the infestation, especially up to the year 2035. This infestation significantly diminishes biomass availability by more than 14% in both the RED and BLACK scenarios. The biomass flows in the TIMES-CZ model are shown in Figure 3. To produce biomass products, we assume a stepwise cost function with decreasing returns to scale in Table 1.
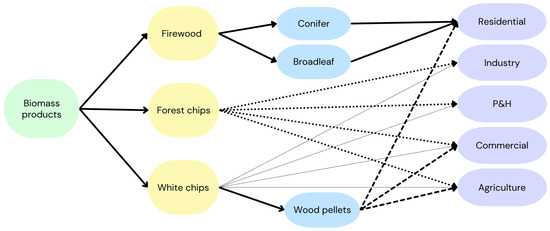
Figure 3.
Biomass flows in the TIMES-CZ model from biomass products to the power and heat (P&H) sector and final energy consumption sectors.

Table 1.
Costs of biomass production, stepwise cost function, in €/GJ (2015 prices).
Our regionalised TIMES-CZ model considers distance-specific and time-variant transportation costs. Our assumptions on moisture, gross calorific value, weight, and truck volume capacity to calculate average transportation costs for different biomass products are described in Table 2.

Table 2.
Assumptions used to calculate transportation costs of biomass per trip.
Wood pellets and briquettes made from white chips are available from online shops for fixed transportation costs of around €55. Given our assumptions listed in Table 2, the transportation of wood pellets costs about 0.8 €/GJ regardless of the distance.
Calculating the transportation cost of firewood is more complex. Firewood is typically sold in one-cubic-meter pallets, where depending on whether the wood is stacked or not, weight and embodied energy will differ [39]. Coniferous firewood is lighter and has less embodied energy than broadleaf firewood per cubic meter. Furthermore, the maximum transportation volume by service providers is limited. We rely on average figures and assume nine cubic meters of capacity (if stacked) to calculate the total embodied energy transported per trip. According to ref. [39], one cubic meter of wood pallet contains roughly 475 kg of broadleaf wood with a gross calorific value of 14.6 MJ/kg and 340 kg of coniferous wood with a gross calorific value of 15.6 MJ/kg with a moisture content of 15%. The embodied energy carried per trip is then a product of volume, weight and gross calorific value (and 1000 to obtain GJ).
To calculate the total biomass transportation cost per trip, we first derive a 14 × 14 distance matrix between the centres of Czech regions to allow for trade between them. Because transportation companies typically charge for both the outbound and inbound transportation of biomass, we double the distance between regions i and j (). Based on a review of the offers by transportation companies, we obtain the average transportation cost per kilometre () that is increasing over time t due to pricing fuel within the EU ETS2 (column 3, Table 3) and kg CO2/km (we assume large transport trucks consume roughly 0.4 L of diesel per kilometre [40] and each litre of diesel produces 2.7 kg of CO2 [41], giving [kg CO2/km]). Dividing the total transportation cost between two regions i and j by the embodied energy of transported biomass product b, we obtain transportation costs , which are expressed in €/GJ between regions i and j by biomass products b:

Table 3.
EUA carbon price trajectory.
In the model, we also assume the transport of biomass from the regions to the aggregate region of Czechia. We calculate the distance from each region to the Czechia region as an average of all distances, excluding Prague and Brno, where the availability of biomass is not significant. For the rest of the calculations, Equation (1) applies.
3. Scenarios
This paper primarily examines how different trajectories of forest biomass development will influence the overall energy composition of the Czech economy and Czechia’s efforts to attain climate neutrality. We do not present a business-as-usual scenario, as seen in Rečka et al. [26]. Our scenarios share common assumptions about prices, the potential of photovoltaic (PV) and wind energy, and the potential of electricity and hydrogen imports, along with energy service demand projections. The variable availability of biomass depicted in Figure 2 is the only difference among our first four scenarios (RED, BLACK, GREEN, BLACK-REP).
We also evaluate three policies using the RED scenario as a baseline. RED-0 requires an exogenous reduction in GHG emissions, resulting in a maximum of 2.2 megaton emissions balance in 2050. The purpose of the policy evaluation is to see whether increased pressure to reduce emissions would encourage renewable production. The RED-HH assumes that starting from 2035, biomass available from forests can only be used by households, meaning that forest chips are no longer available for power, heat, and industrial sectors. This scenario aligns with ecological requirements, maximising the biomass that remains in the forest. The goal of this scenario is to see how the ‘ecological’ requirements—limiting the availability of biomass—would affect the overall energy mix and annualised system costs. Finally, RED-P50 considers a 50% production cost subsidy on wood pellets for households from 2025 onwards. Here, the objective is to investigate whether these subsidies facilitate the full utilisation of biomass resources. All the scenarios are briefly described in Table 4.

Table 4.
Description of scenarios.
The prices of fossil fuels and emission allowances (EUAs) follow the trajectory of the WAM scenario according to the recent HCT trajectory [42]. The price of EUA2 for buildings and transport starts at €47 in 2030 and then converges linearly to the current EUA1 price of 2050 (see Table 3). We assume energy-saving potentials in buildings according to the progressive scenario of the Czech Strategy of Building Renovation [43]. The development of new nuclear power plants is not constrained; however, our assumption is that 1450 MW of new capacity will be installed around 2035. This assumption aligns with the expectations of the Czech Ministry of Industry and the Ministry of Environment. The optimisation problem within the model determines any potential installations beyond this 1450 MW threshold. The profile of possible electricity imports is described according to the Czech Transmission System Operator (ČEPS) and assumes no bottlenecks. The maximum installed capacity of wind farms and solar PV is limited to 7 GW and 30.1 GW in 2050, respectively. Hydrogen imports are assumed to rise to 36.7 TWh in 2050. Carbon capture, use, and storage (CCUS) is limited to 18 Mt of captured CO2 emissions.
4. Results
4.1. Greenhouse Gas Emissions
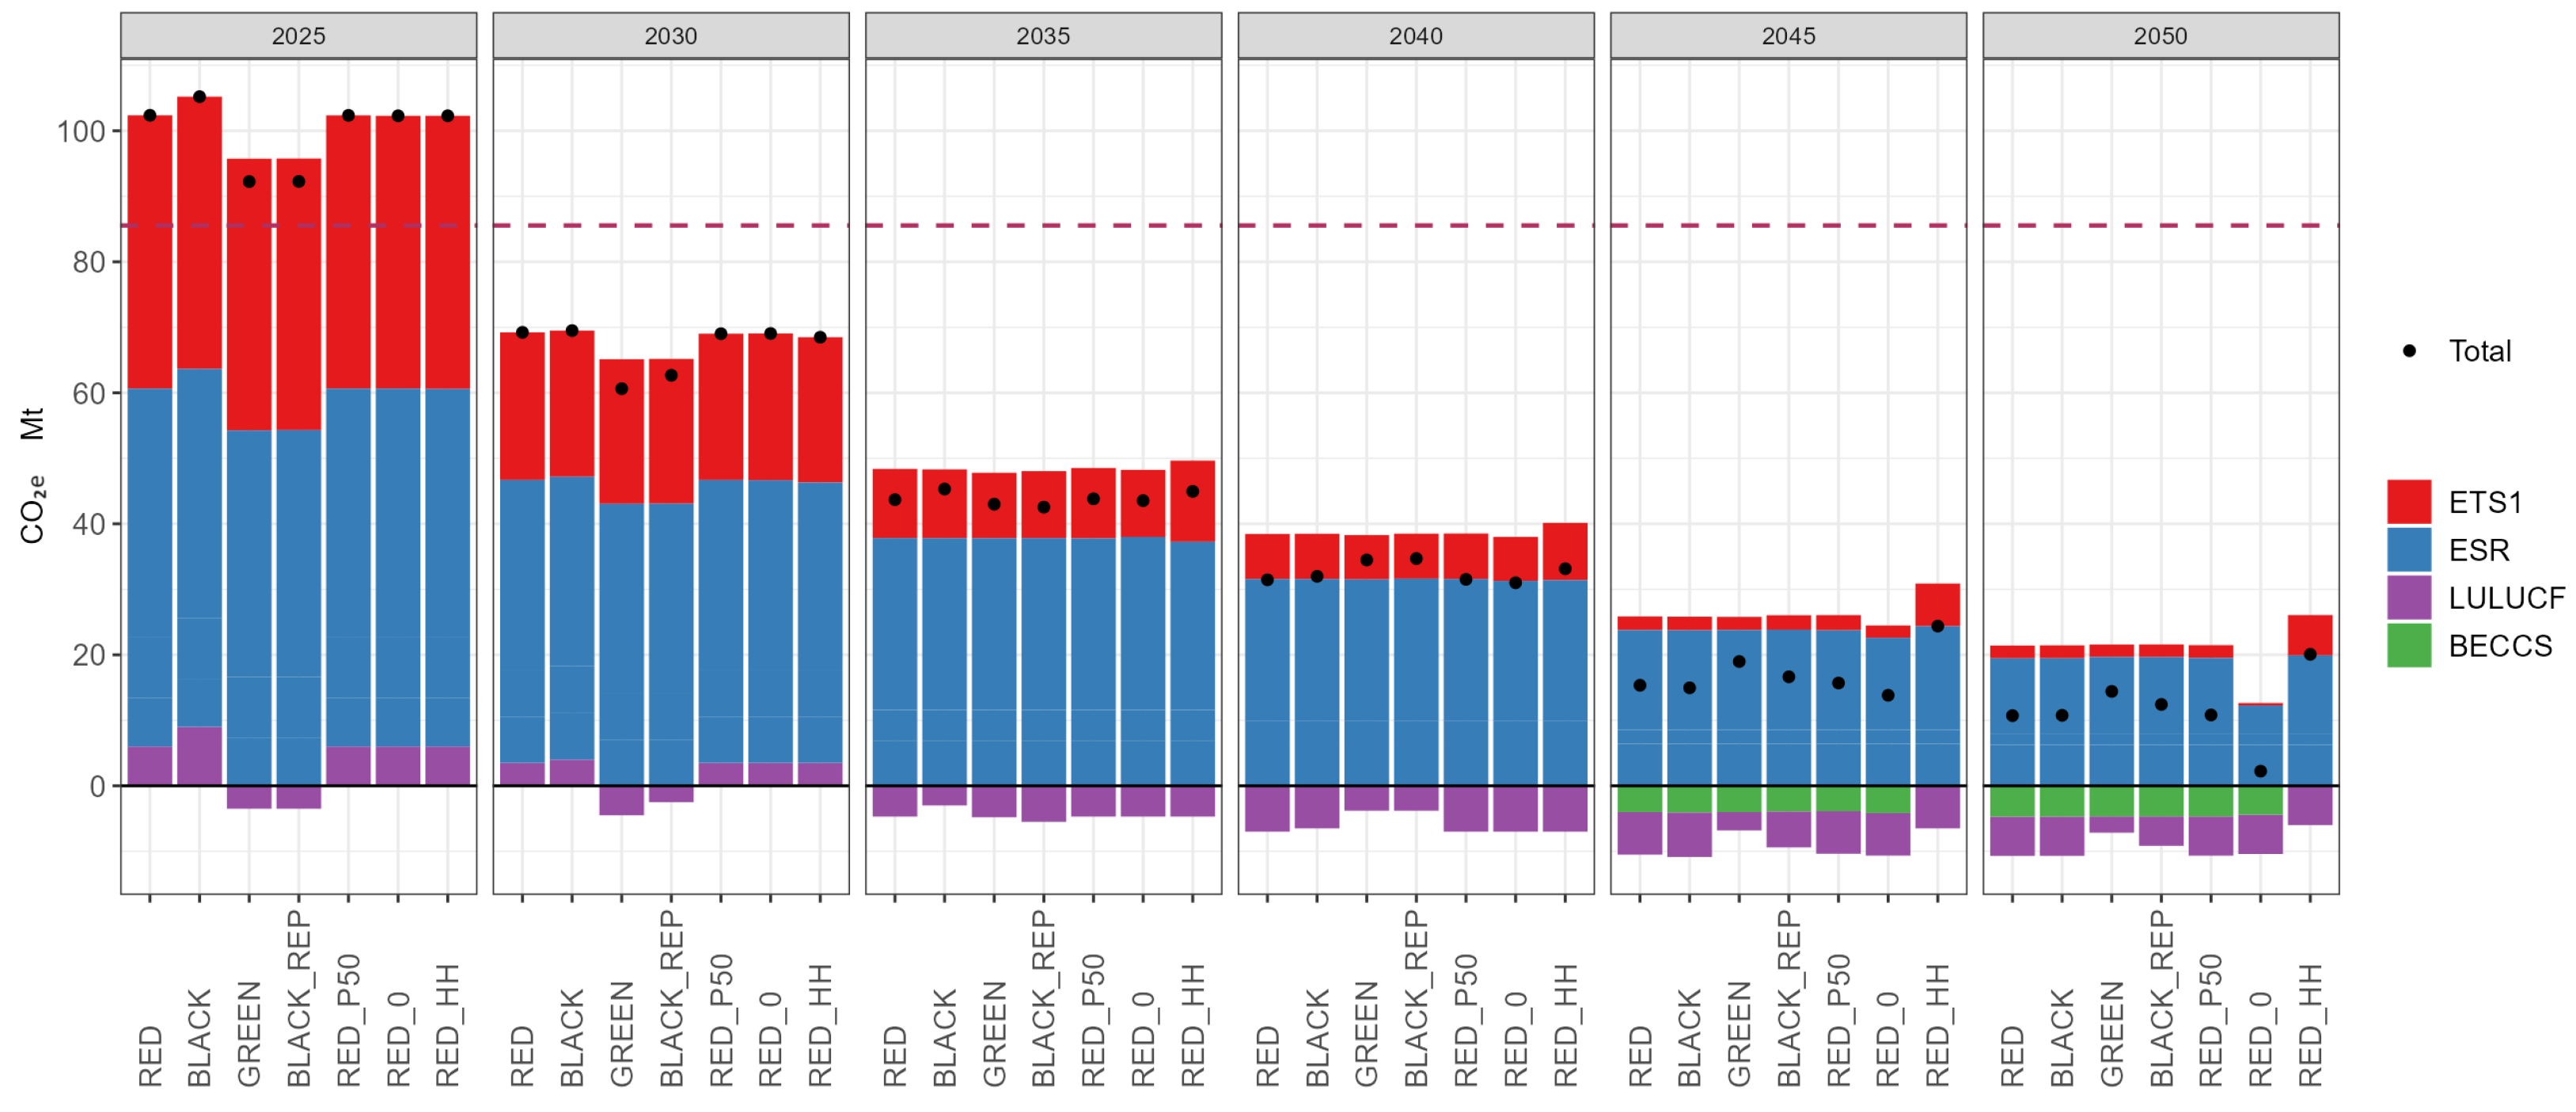
Figure 4 illustrates greenhouse gas (GHG) emissions across all scenarios, which are categorised by their primary sources of emissions. Meanwhile, the total GHG emissions decline in all scenarios, reaching 10–20 Mt of CO2e in 2050. The exception is RED-0, which reaches the pre-defined (exogenous) cap of 2.2 Mt of CO2e in 2050. We note that the near zero-carbon level in RED-0 is achieved without any further increase in bioenergy with carbon capture and storage (BECCS).
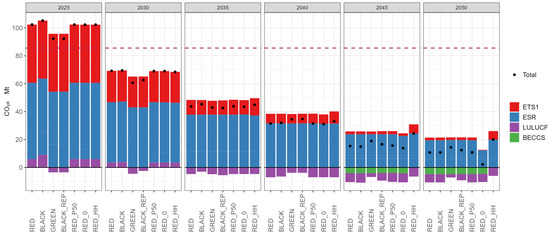
Figure 4.
Total greenhouse gas emissions, Czechia, 2025–2050. Notes: ETS1 represents the current scope of EU ETS. LULUCF accounts for emissions or carbon savings associated with Land Use, Land Use Change, and Forestry. ESR covers the remaining sectors and small industrial installations. BECCS refers to biomass combustion installations equipped with carbon capture and storage (CCS), resulting in a negative emissions balance. The red dashed line indicates the EU target to reduce greenhouse gas emissions by 55% in 2030 compared to 1990 levels.
It is evident that even with a European Union Allowance (EUA) price of €386 (expressed in 2015 euros), climate neutrality by 2050 remains unattainable. The red dashed line signifies the EU’s binding target of a 55% reduction in greenhouse gas emissions for member countries by 2030 compared to 1990 levels, which is a goal that Czechia is realistically poised to achieve across all scenarios.
In the RED-0 scenario, GHG emissions align with the 2.2 Mt CO2e cap in 2050, with this cap being the sole driver of emissions reduction compared to other RED scenarios. Notably, the RED-HH scenario exhibits relatively higher GHG emissions. In this scenario, only the residential sector utilises biomass as an energy source starting from 2035, prompting other sectors to replace biomass with alternative energy sources, primarily natural gas. In this particular situation, BECCS, which could have reduced GHG emissions by 4–4.5 megatons in 2045 and 2050, as seen in other scenarios, is unavailable.
The emissions associated with facilities included in the current EU Emission Trading System (ETS1) substantially contribute to reducing GHG emissions. Additionally, sectors covered by the extended system Effort Sharing Regulation (ESR), which includes areas like agriculture, small industrial facilities, transportation, and buildings, also demonstrate noteworthy reductions in GHG emissions [44]. Meanwhile, emissions linked to Land Use, Land Use Change, and Forestry (LULUCF) are the primary factors driving variability in GHG emissions across forest biomass development scenarios RED, BLACK, GREEN, and BLACK-REP. This underscores the crucial role of forests in sequestering carbon emissions, which appears to be more influential than fluctuations in forest biomass availability for energy use. Therefore, based on Figure 4, it can be concluded that the spruce bark beetle infestation does not impact decarbonisation pathways in the long term. In the BLACK-REP and GREEN scenarios, LULUCF GHG emissions are negative in 2025 and 2030, while other scenarios incur GHG emissions from forests. Lastly, it appears that using subsidies to promote wood pellet use by households in the RED-P50 scenario does not contribute to achieving GHG emission reduction goals compared to the RED scenario.
4.2. Primary Energy Sources
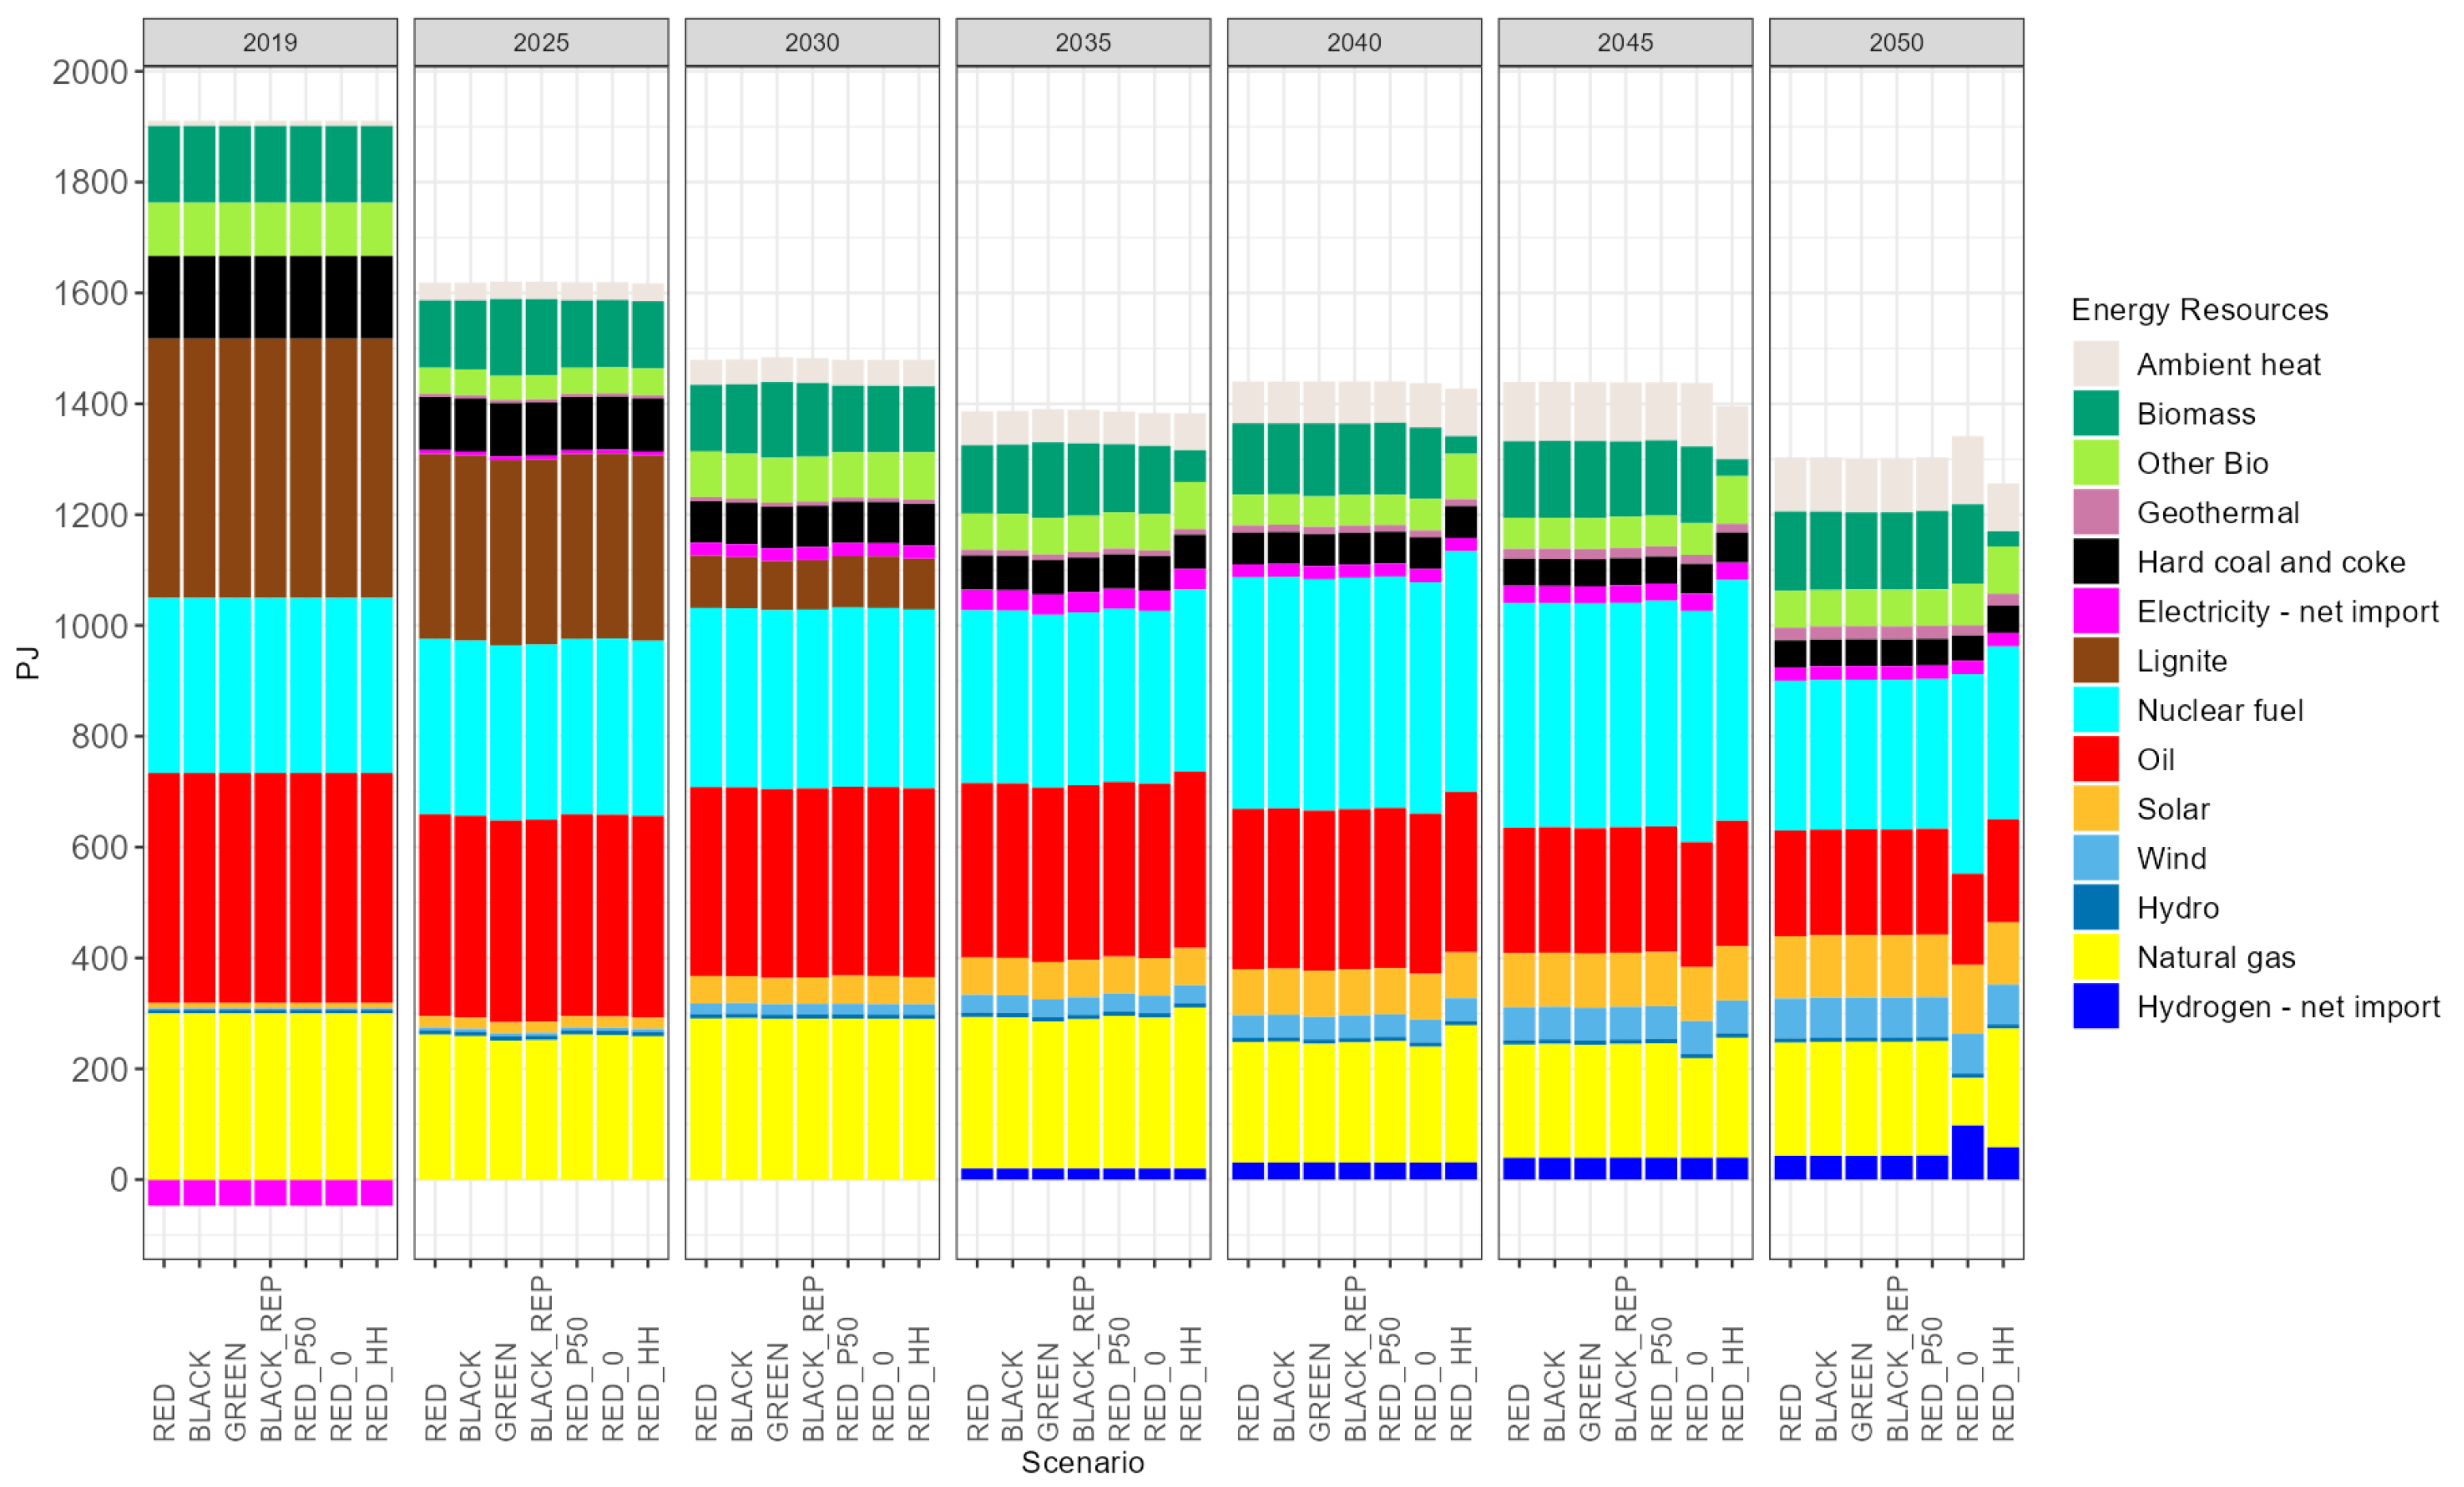
Figure 5 shows primary energy sources (PES) consumption spanning 2019 to 2050. An estimation of all modelled scenarios delivers approximately a 30% decrease in the consumption of PES. From 2040, there is a significant decrease in gas consumption, which is primarily replaced by hydrogen, whereas brown coal will be almost phased out by 2035. Limiting biomass to household consumption RED-HH and pursuing ecological constraints primarily involves substitution by natural gas and nuclear energy, with a GHG cap of a net 2.2 Mt in 2050. Conversely, in the RED-0 scenario, the primary replacements for natural gas and oil include hydrogen, nuclear, and ambient heat technologies. Solar and wind energy are maximally utilised in all scenarios. The degree of availability of biomass significantly influences its usage in all scenarios, with only a temporary deviation occurring in 2040, where biomass demand lags behind its increased availability.
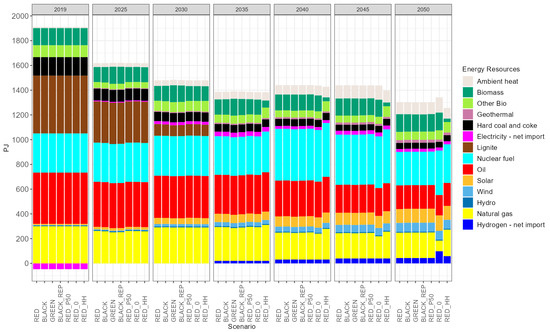
Figure 5.
Primary energy sources, Czechia, 2019–2050.
4.3. Final Energy Consumption
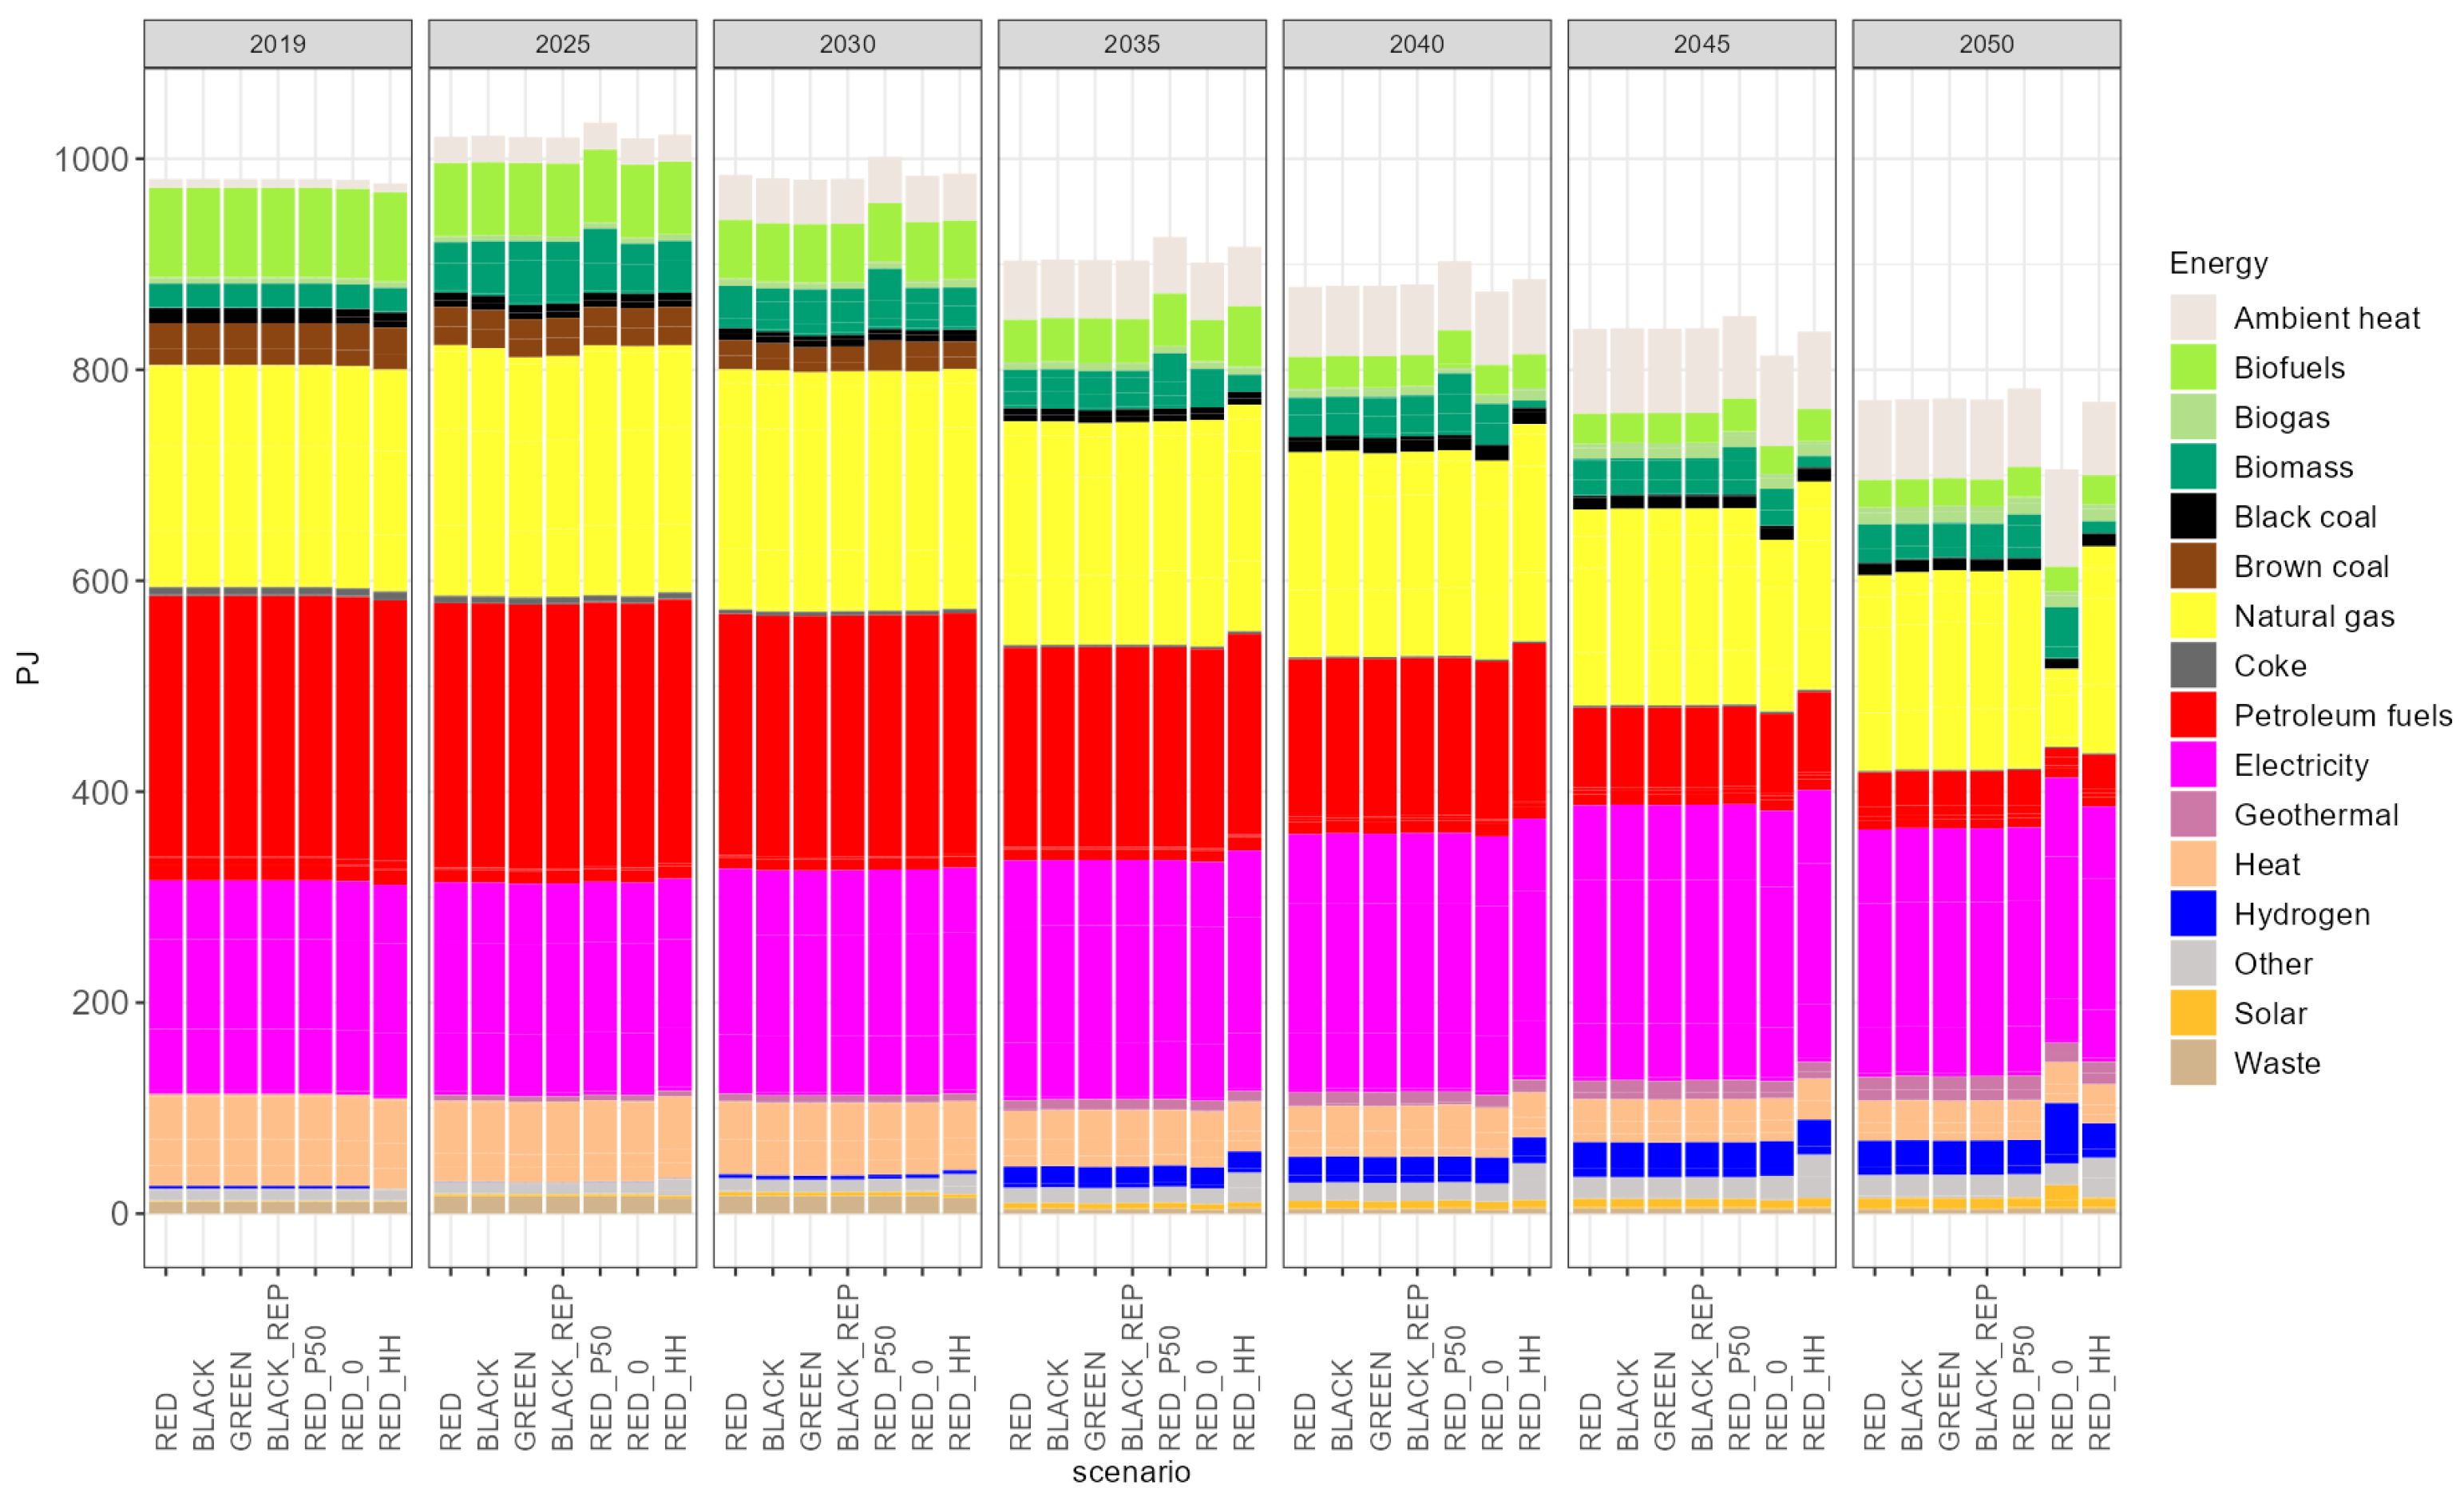
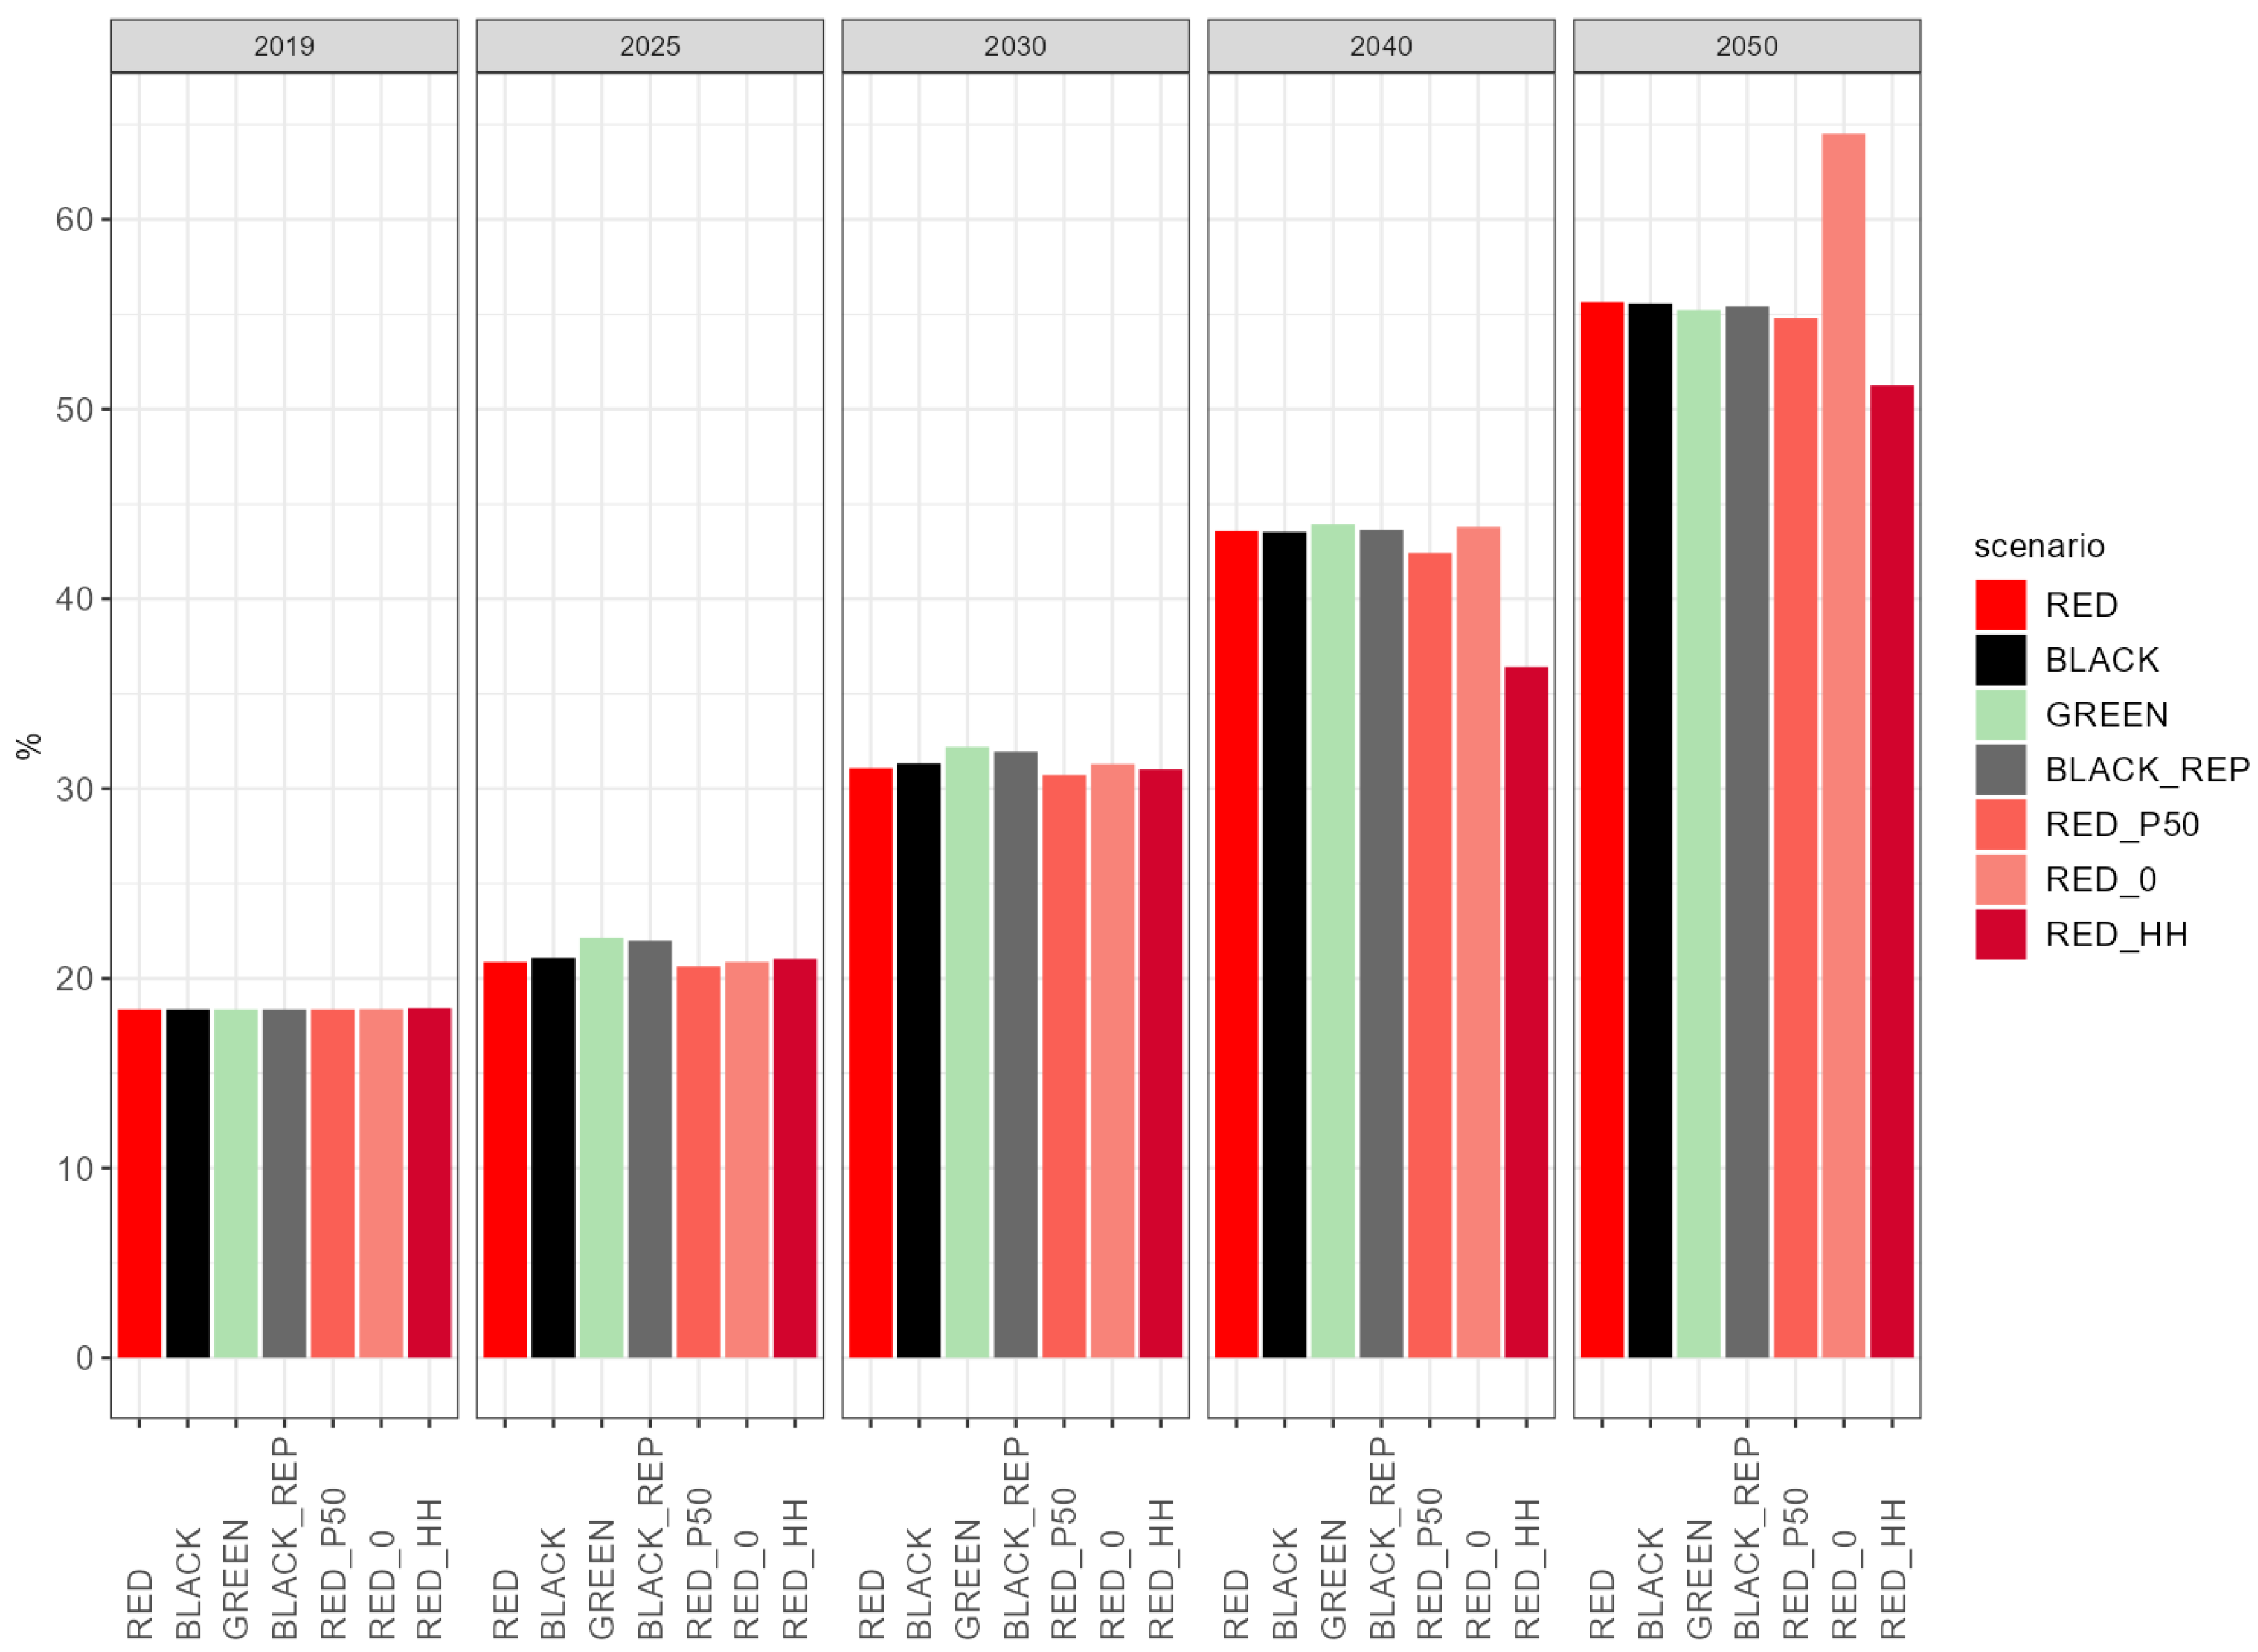
Final energy consumption according to the model results is illustrated in Figure 6. As a result of improvements in energy efficiency, there is a substantial reduction in total final energy consumption across the entire timeframe, and this trend is consistent across almost all scenarios. The sole exception is the RED-0 scenario, which notably exhibits lower final energy consumption than the other scenarios, starting from 2040. In this scenario, there is a decreased reliance on natural gas and an increased utilisation of hydrogen. The overarching trend across all scenarios involves a shift away from more environmentally hazardous technologies, such as petroleum-based fuels and coal, in favour of cleaner alternatives. Figure 7 also highlights an overall increase in renewable energy shares across all scenarios. In the RED-HH scenario, where biomass is allocated solely to residential use, there is a reduction in biomass consumption in the final energy sector compared to the other scenarios. In general, it seems that the spruce bark beetle infestation has no discernible impact on the overall energy mix when we examine the forest biomass development scenarios, including RED, BLACK, GREEN, and BLACK-REP.
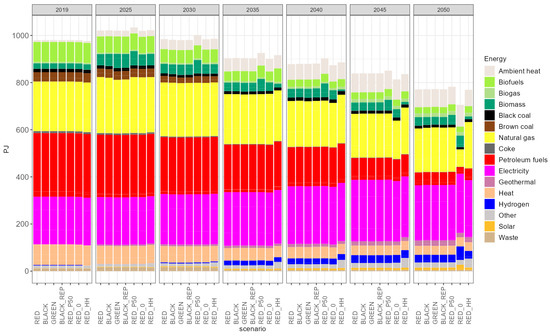
Figure 6.
Final energy consumption, Czechia, 2019–2050.
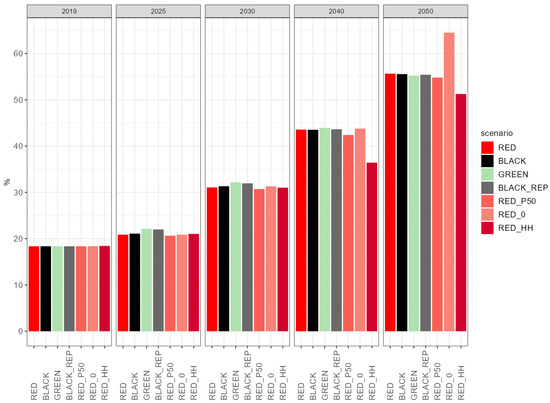
Figure 7.
Share of renewable energy sources in gross final energy consumption, Czechia, 2019–2050.
4.4. Share of Renewable Energy Sources
As depicted in Figure 7, the proportion of renewables within the overall energy mix exhibits a consistent upward trajectory. By 2050, the model’s average projection anticipates a 55% share of renewables. The RED-0 renewables reach almost 65% in 2050. However, achieving the EU’s recommended target of 45% renewables by 2030 appears unlikely across all scenarios. In Figure 7, it is noteworthy that subsidies aimed to encourage household use of wood pellets (RED-HH) do not contribute significantly to achieving renewable energy objectives. This intriguing observation prompts further investigation, and we will seek to clarify this in the next subsection.
While the proportion of renewable energy sources is strictly increasing throughout the period, the proportion of forest biomass within the overall renewable energy mix follows a contrasting pattern. To illustrate, in 2019, the average share of biomass in total renewable energy is approximately 12%, but it diminishes to an average of 7% by 2050. Within the range of forest development scenarios, the more optimistic GREEN and BLACK-REP scenarios stand out, with the share of renewable energy in gross final energy consumption increasing by about one percentage point between 2025 and 2030 compared to the other scenarios. Clearly, the spruce bark beetle infestation will exert only a transient, relatively limited influence on renewable energy goals.
4.5. Biomass
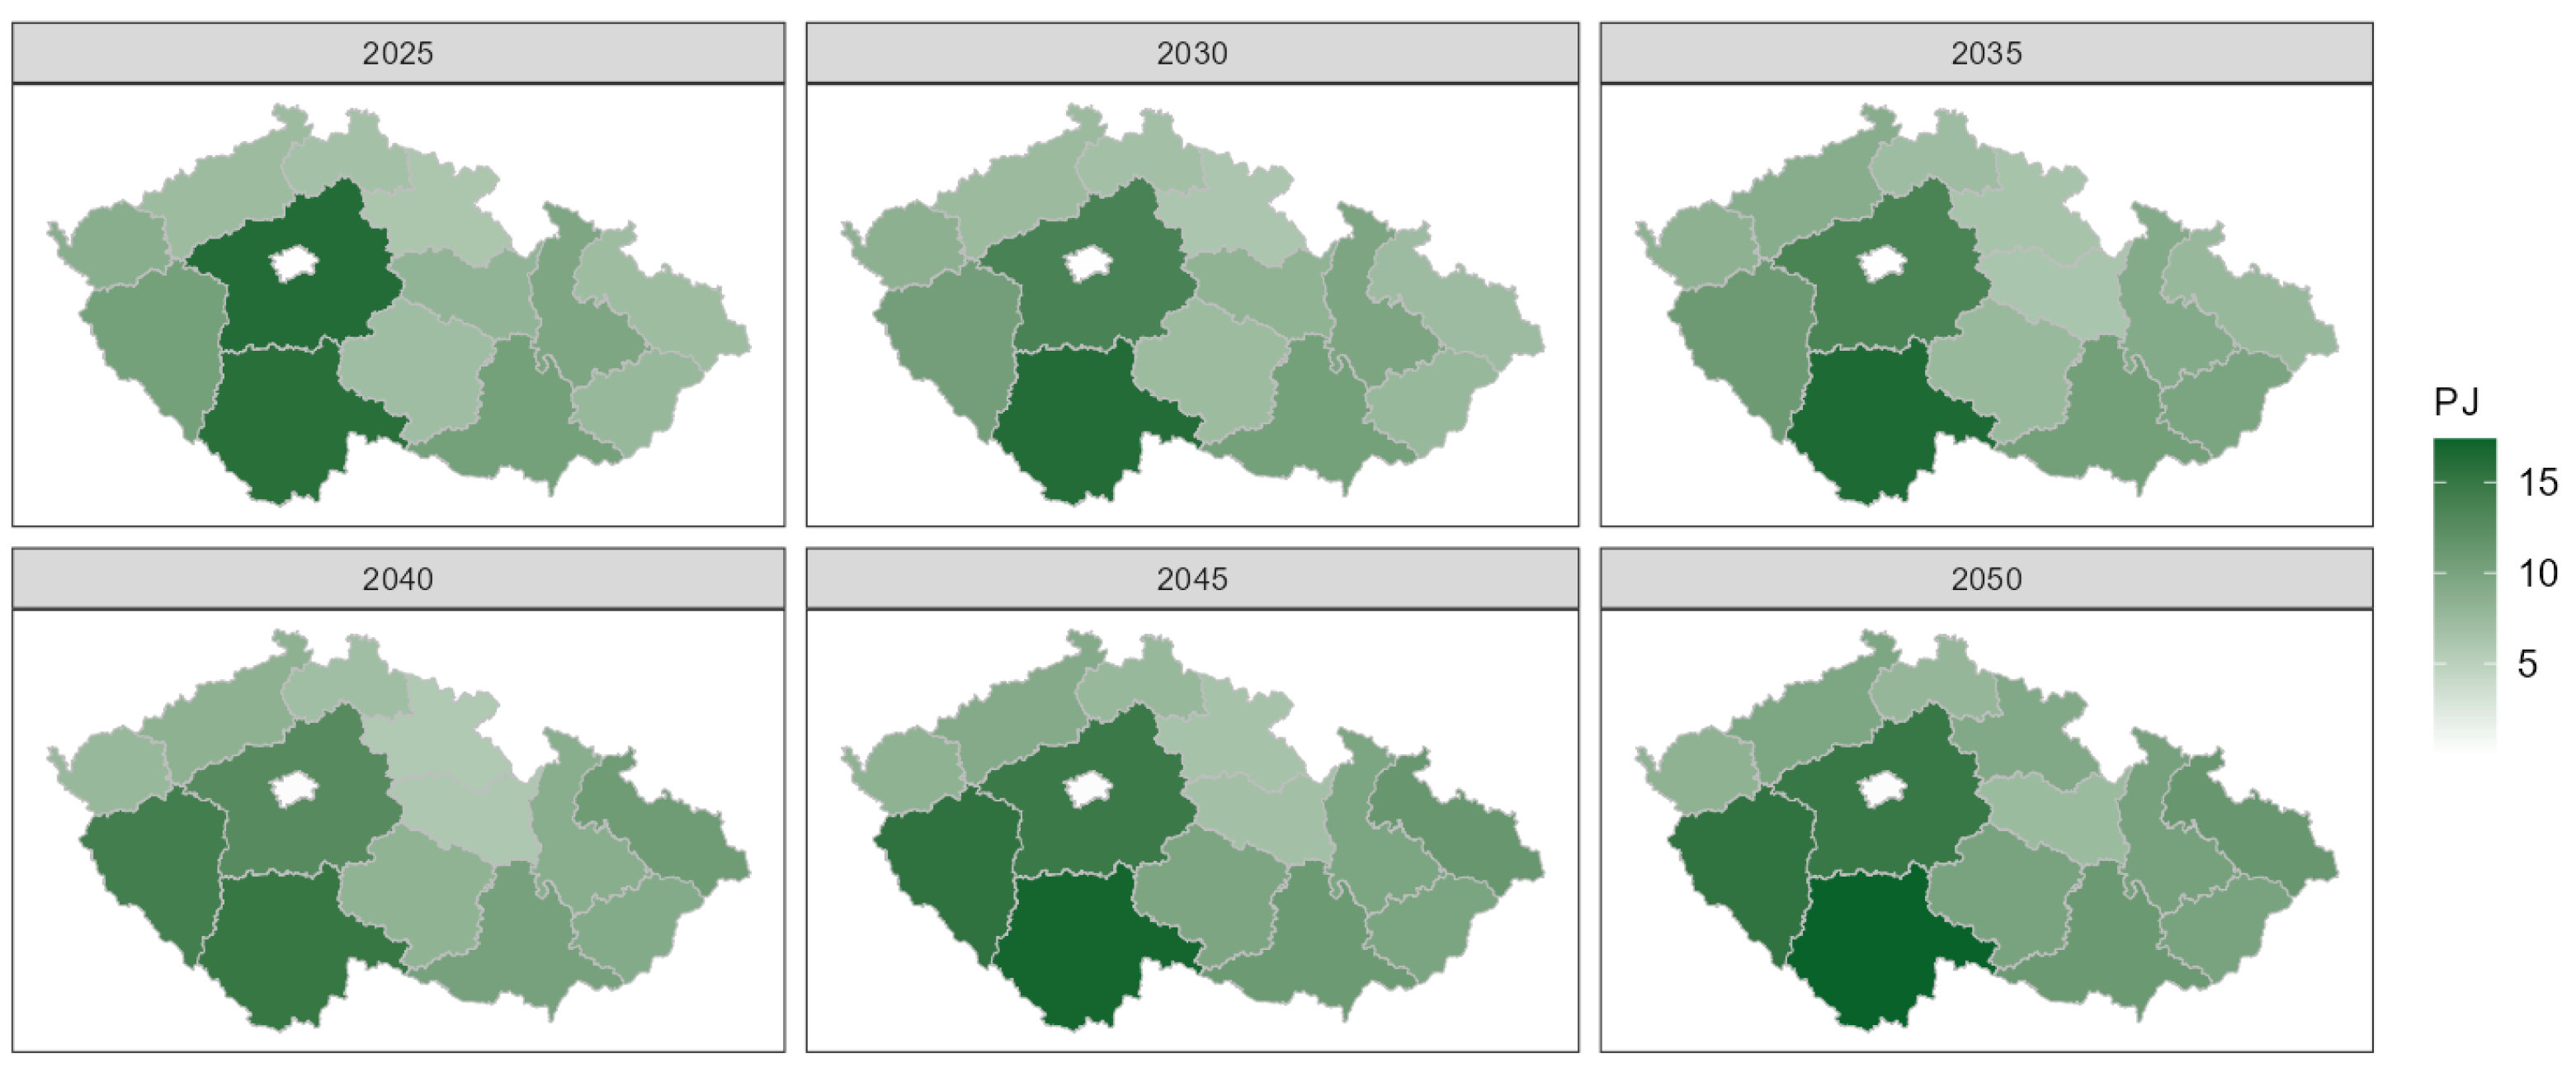
Focusing on forest biomass, first, we repeat the claim that the regionalised TIMES-CZ model increases the spatial resolution of the Czech energy system. In Figure 8, forest biomass supply for energy purposes is more abundant in southwest Czechia. Due to the increasing transportation costs with distance, regionalised TIMES-CZ allows more realistic choices for locating new biomass-burning or co-burning plants. As the southwestern regions of Czechia have the highest availability of forest biomass, it would be advantageous to locate new biomass CHP plants in these regions.
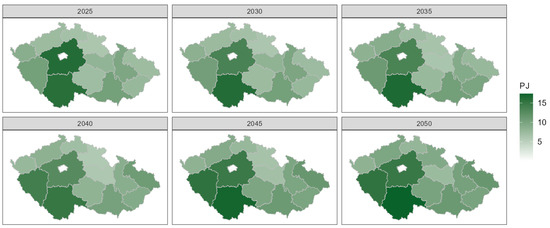
Figure 8.
Forest biomass supply in RED scenario, by region, 2025–2050.
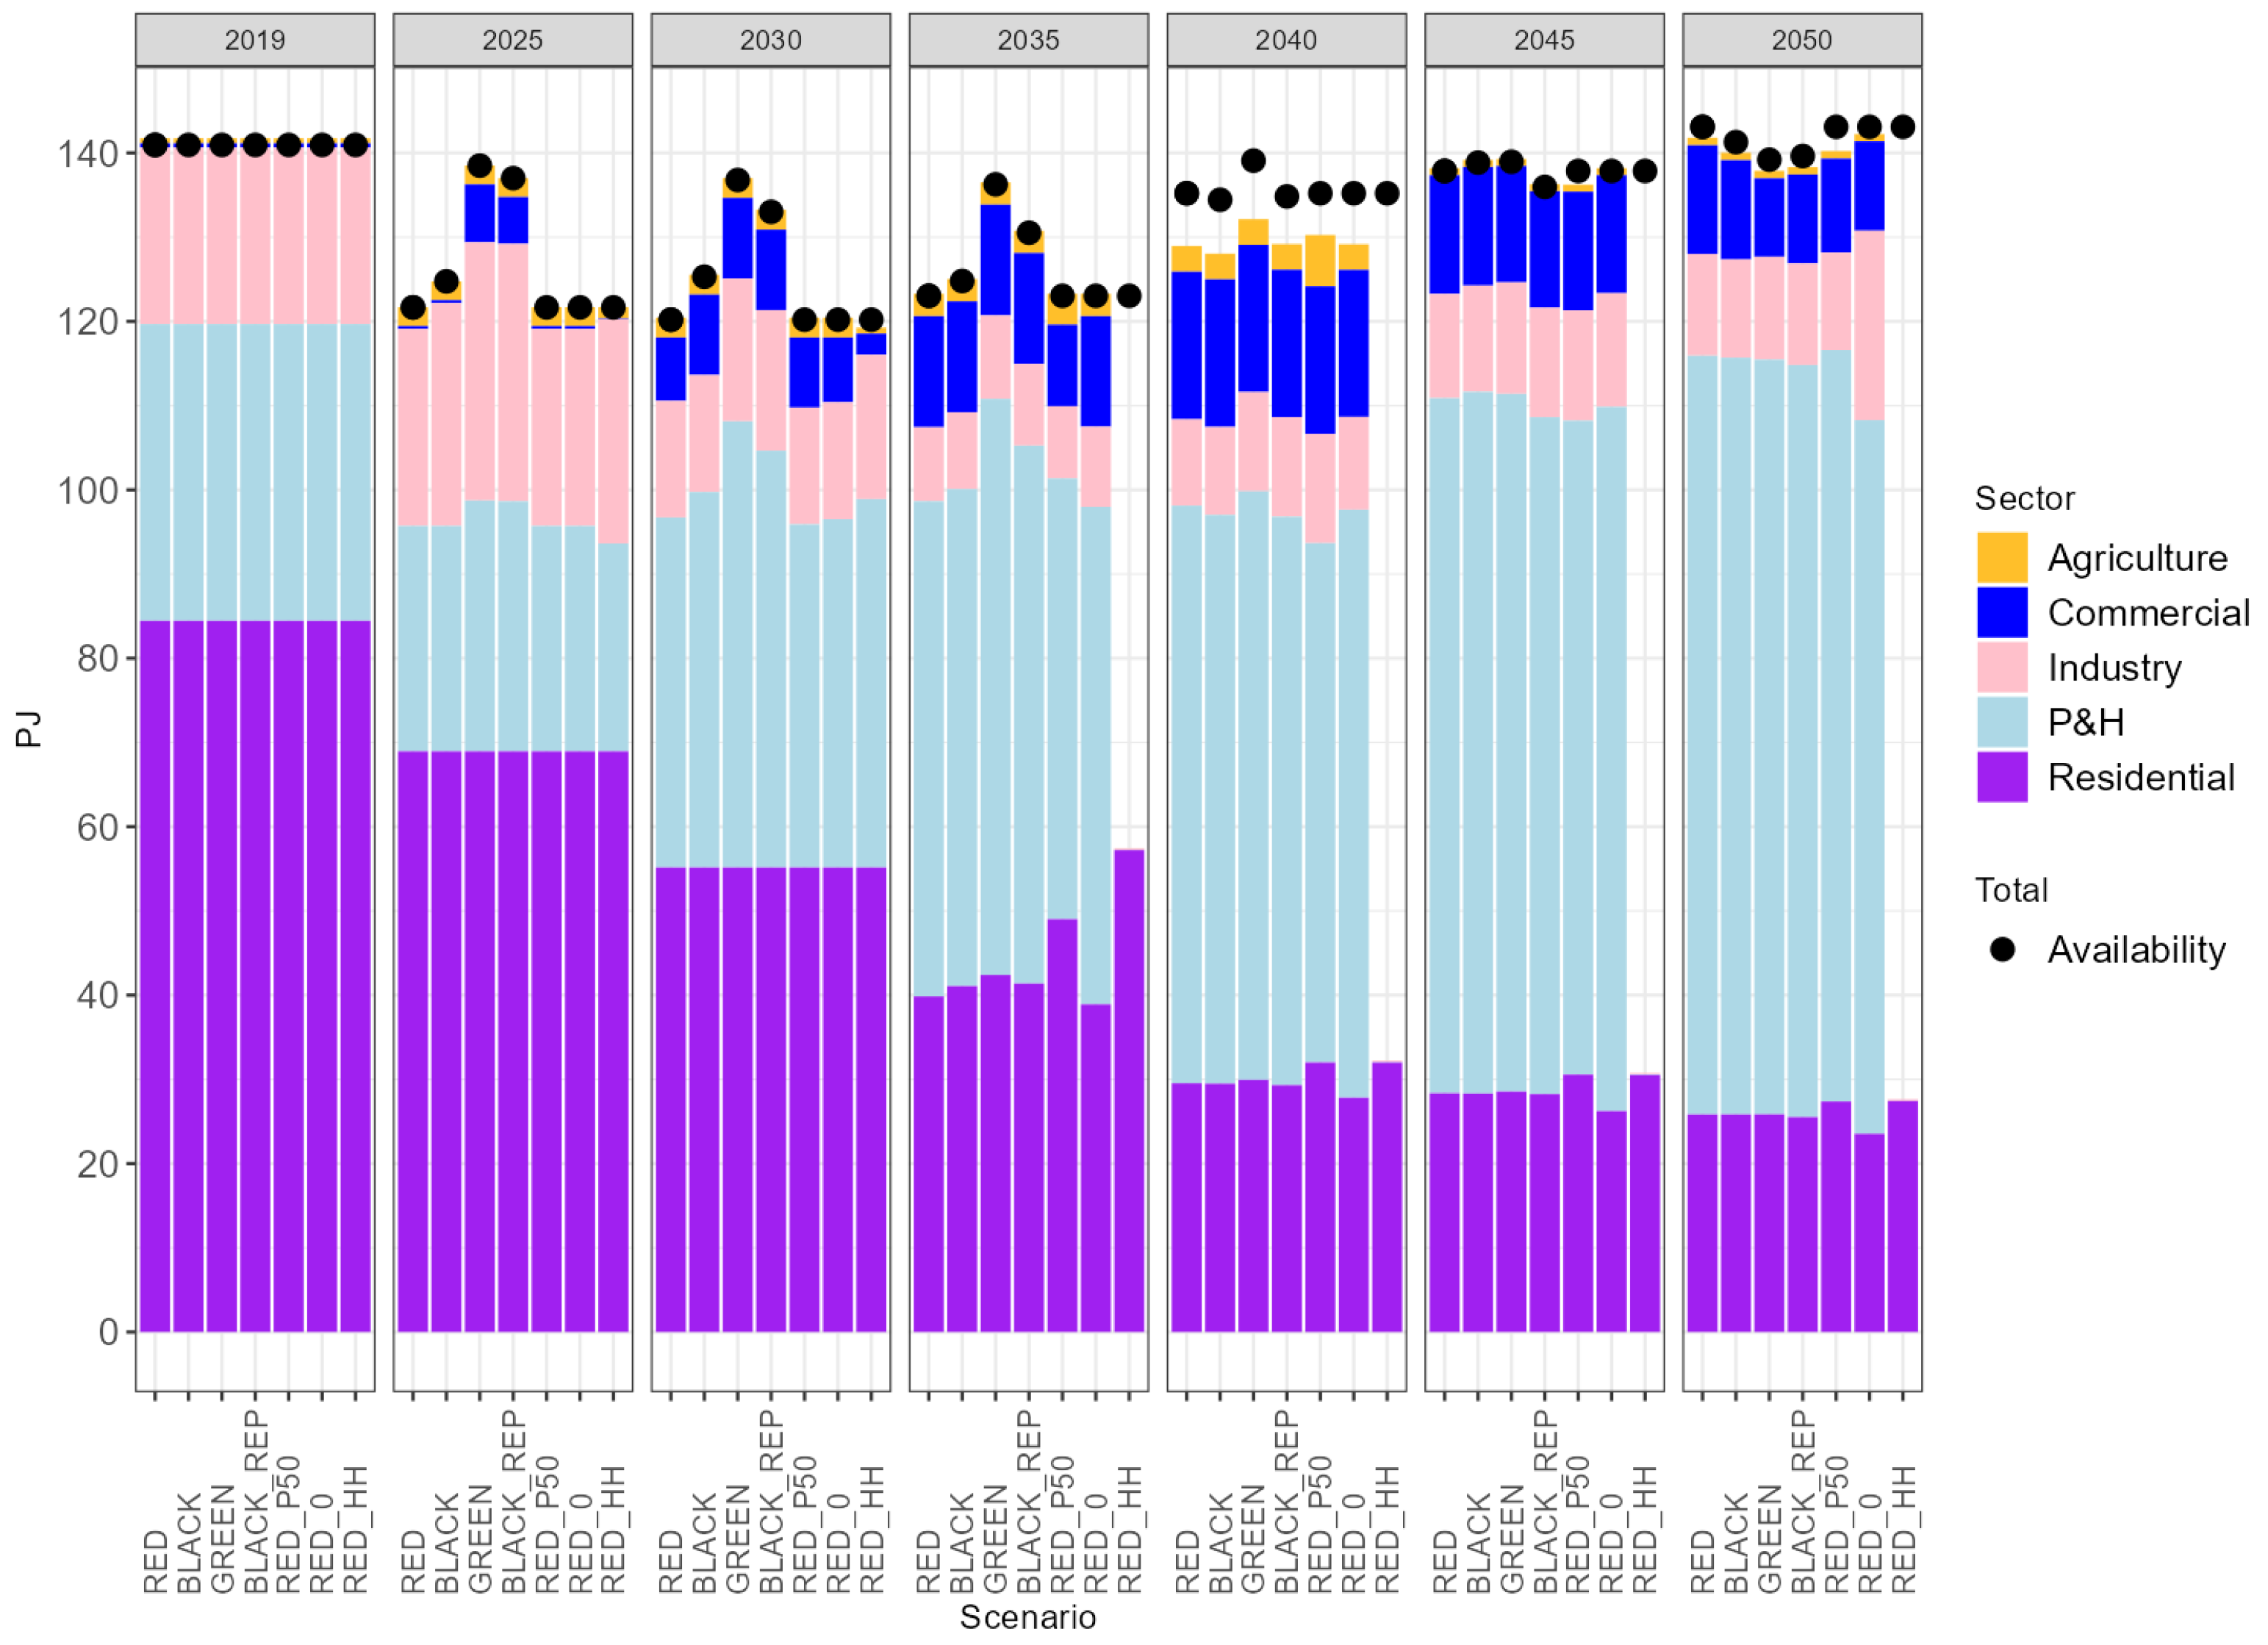
Figure 9 shows the final consumption of forest biomass by sectors, contrasting it with the availability of biomass according to Figure 2. The utilisation of biomass as an energy source does not fully align with the available biomass resources by 2040. This discrepancy arises because timber harvesting experiences a slowdown between 2025 and 2035. With the reduced availability of biomass, the model adapts by incorporating new technologies that are less reliant on biomass. Even though timber harvesting experiences a significant resurgence in 2040, the replacement of previously installed technologies is not instantaneous. Consequently, biomass consumption does not catch up as quickly as timber harvesting recovers in 2040.
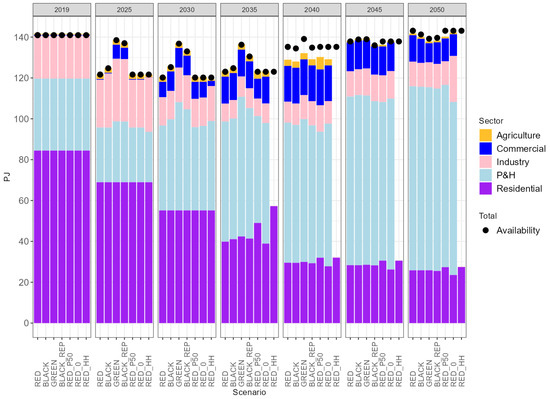
Figure 9.
Forest biomass consumption by sectors (bars) and its availability (black dots), 2019–2050. Note: P&H stands for power and heat sector.
Another explanation for this mismatch is that some steps on the cost curve of the broadleaf firewood and white chips are more expensive than natural gas. Subsidies of biomass production may be one avenue that would help to unlock the full potential of biomass, as illustrated in the RED-P50 scenario in 2040. Nonetheless, in other years, biomass resources are already fully utilised, necessitating a thorough cost–benefit analysis before subsidies are implemented. In fact, in the years 2045 and 2050, the subsidy policy seems counterproductive: the full potential of biomass is no longer being exploited compared to the RED scenario. This occurrence can be attributed to the rise in household wood pellet consumption, displacing other sectors and compelling them to consider alternative technologies utilising different fuels.
Figure 9 also reveals other crucial trends. In all scenarios, the residential consumption of biomass steadily declines over the period under review. The opposite is true for the power and heat sector. Hence, large sources can absorb available biomass even at the expense of households; nevertheless, from a system-wide perspective, this may appear to be more efficient. A more detailed overview of the residential sector follows in Figure 10 and Figure 11.
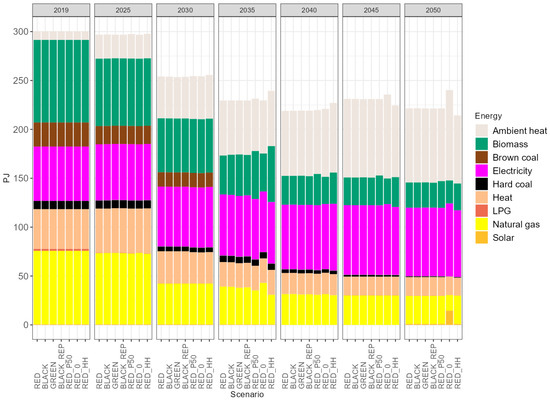
Figure 10.
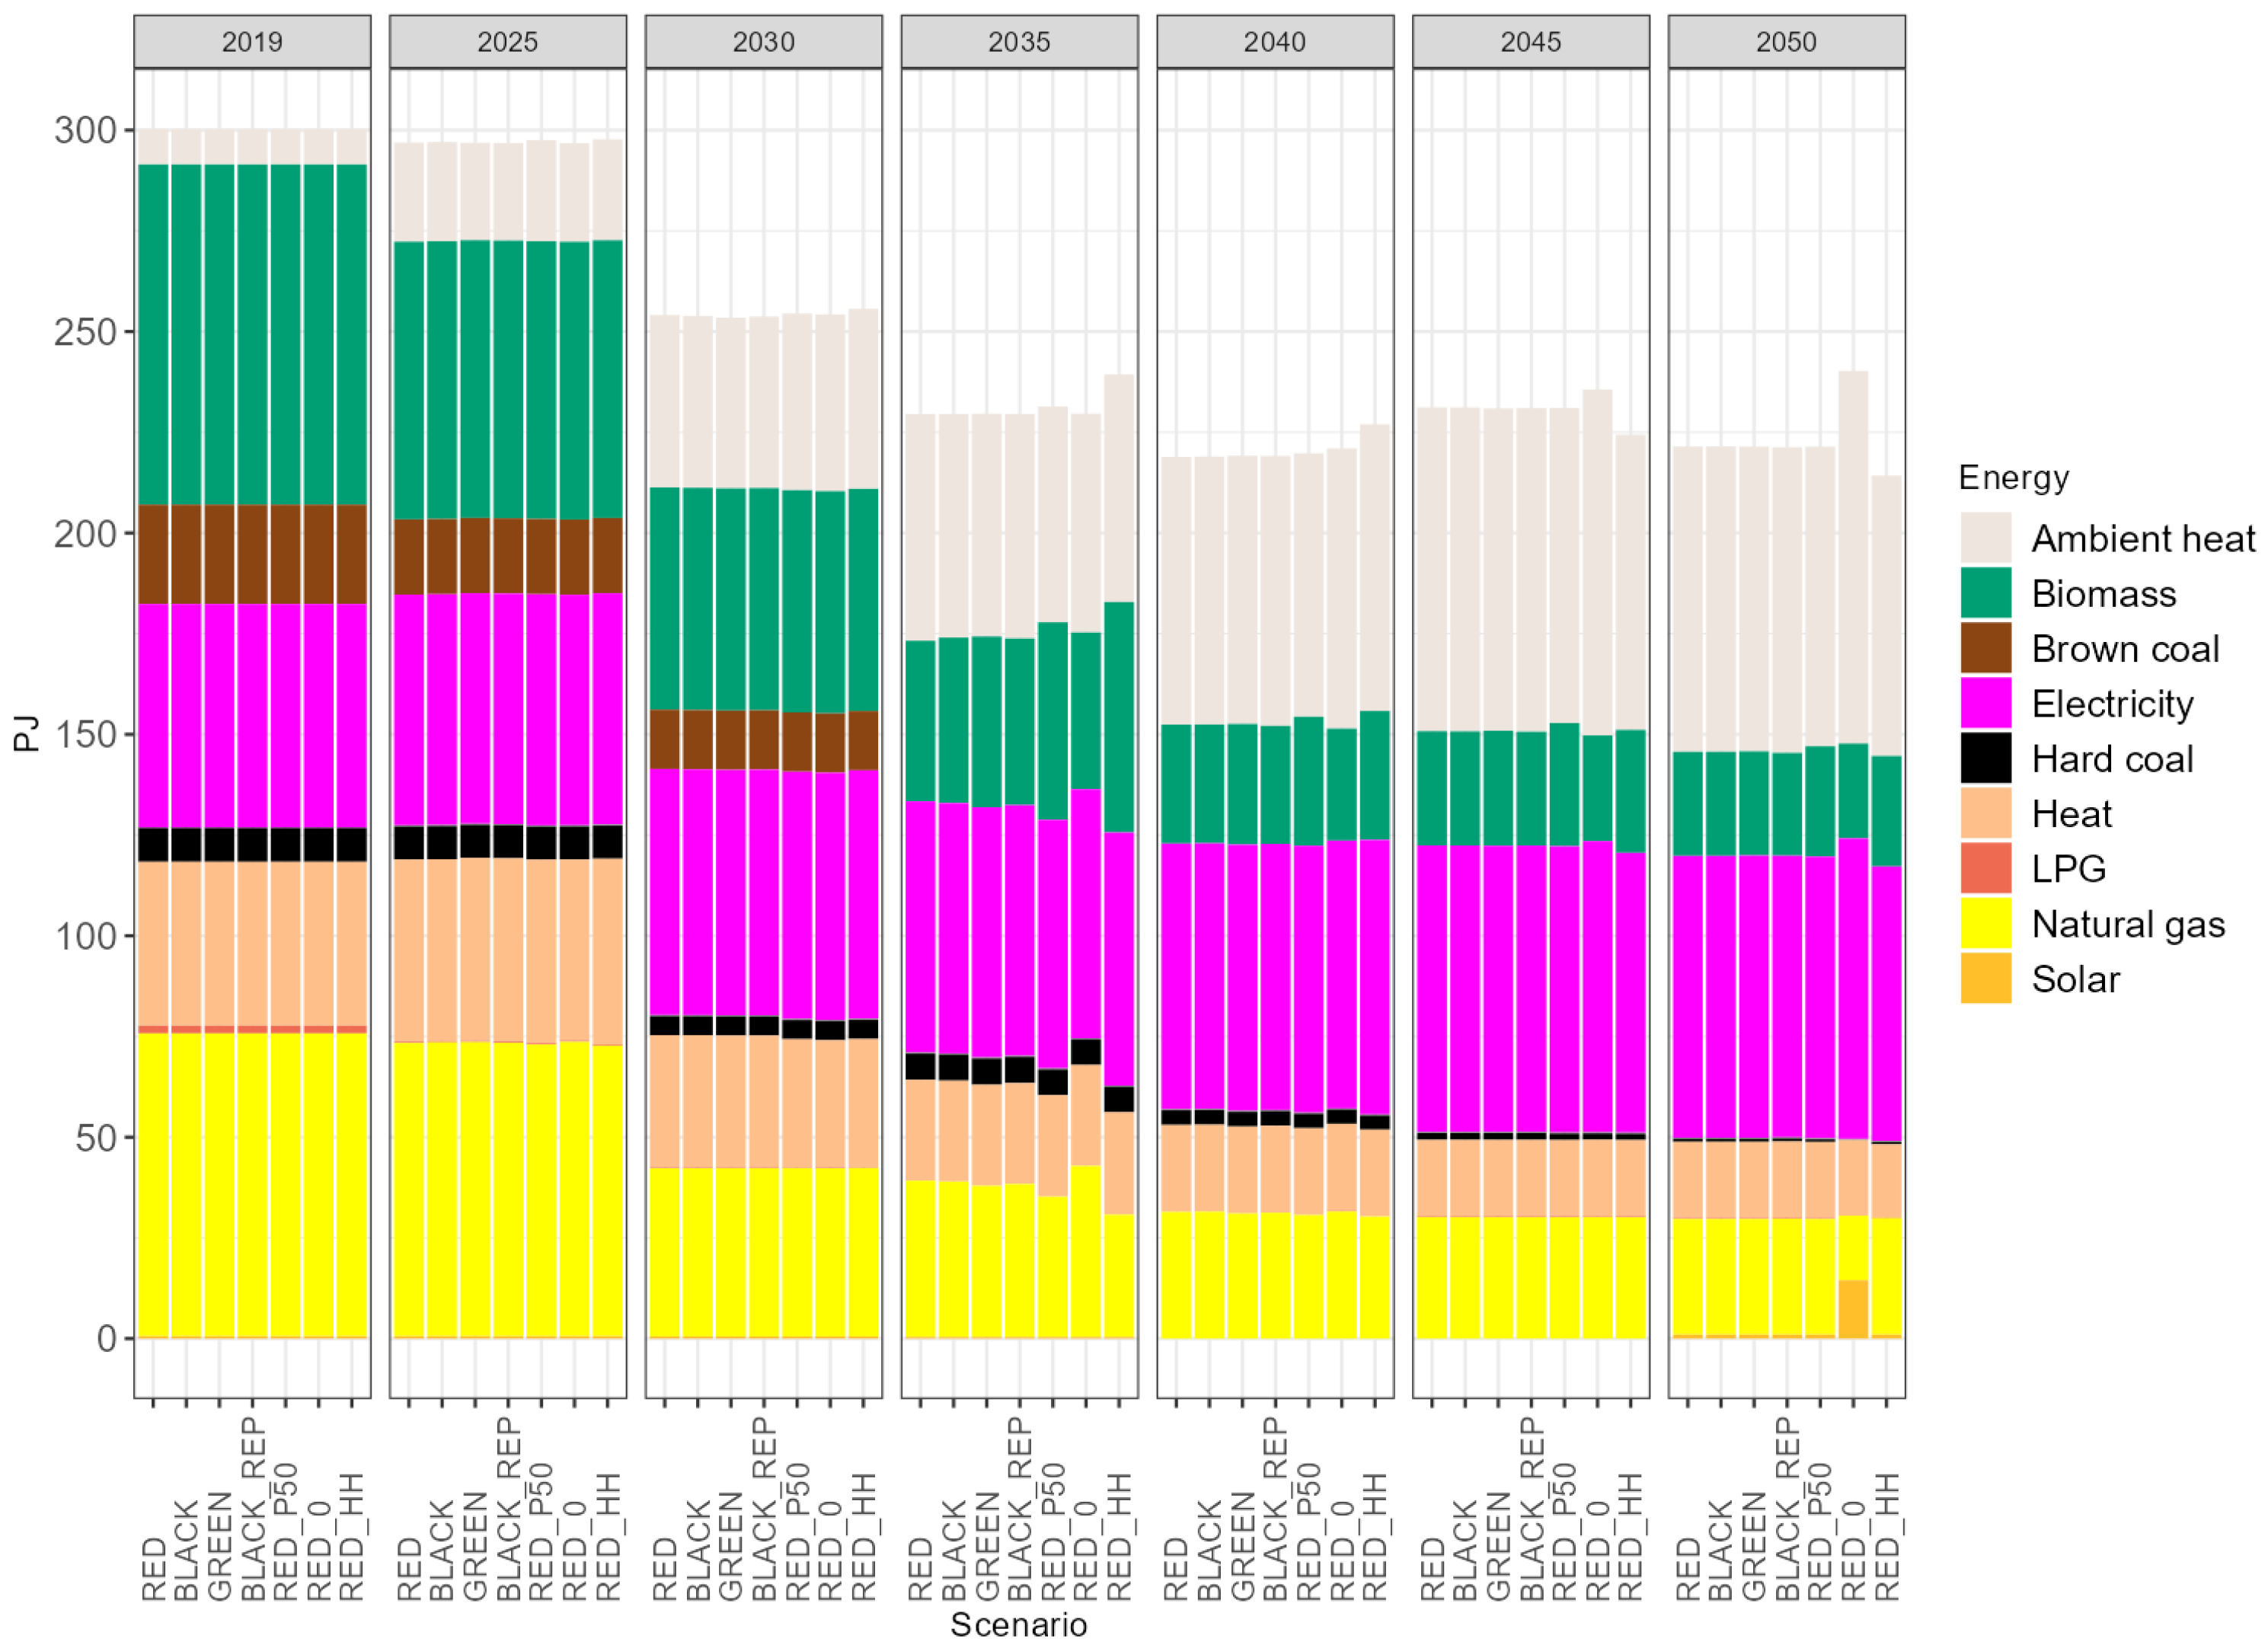
Final energy consumption in the residential sector, by energy sources, Czechia, 2019–2050.
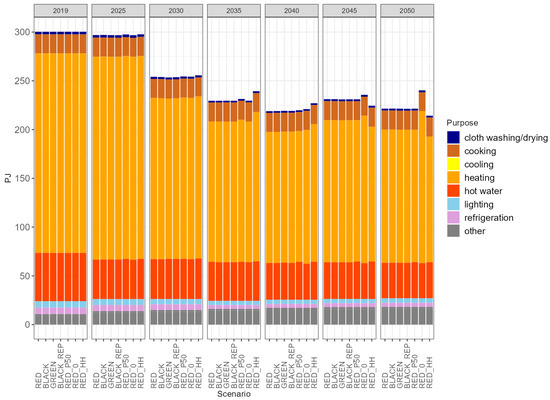
Figure 11.
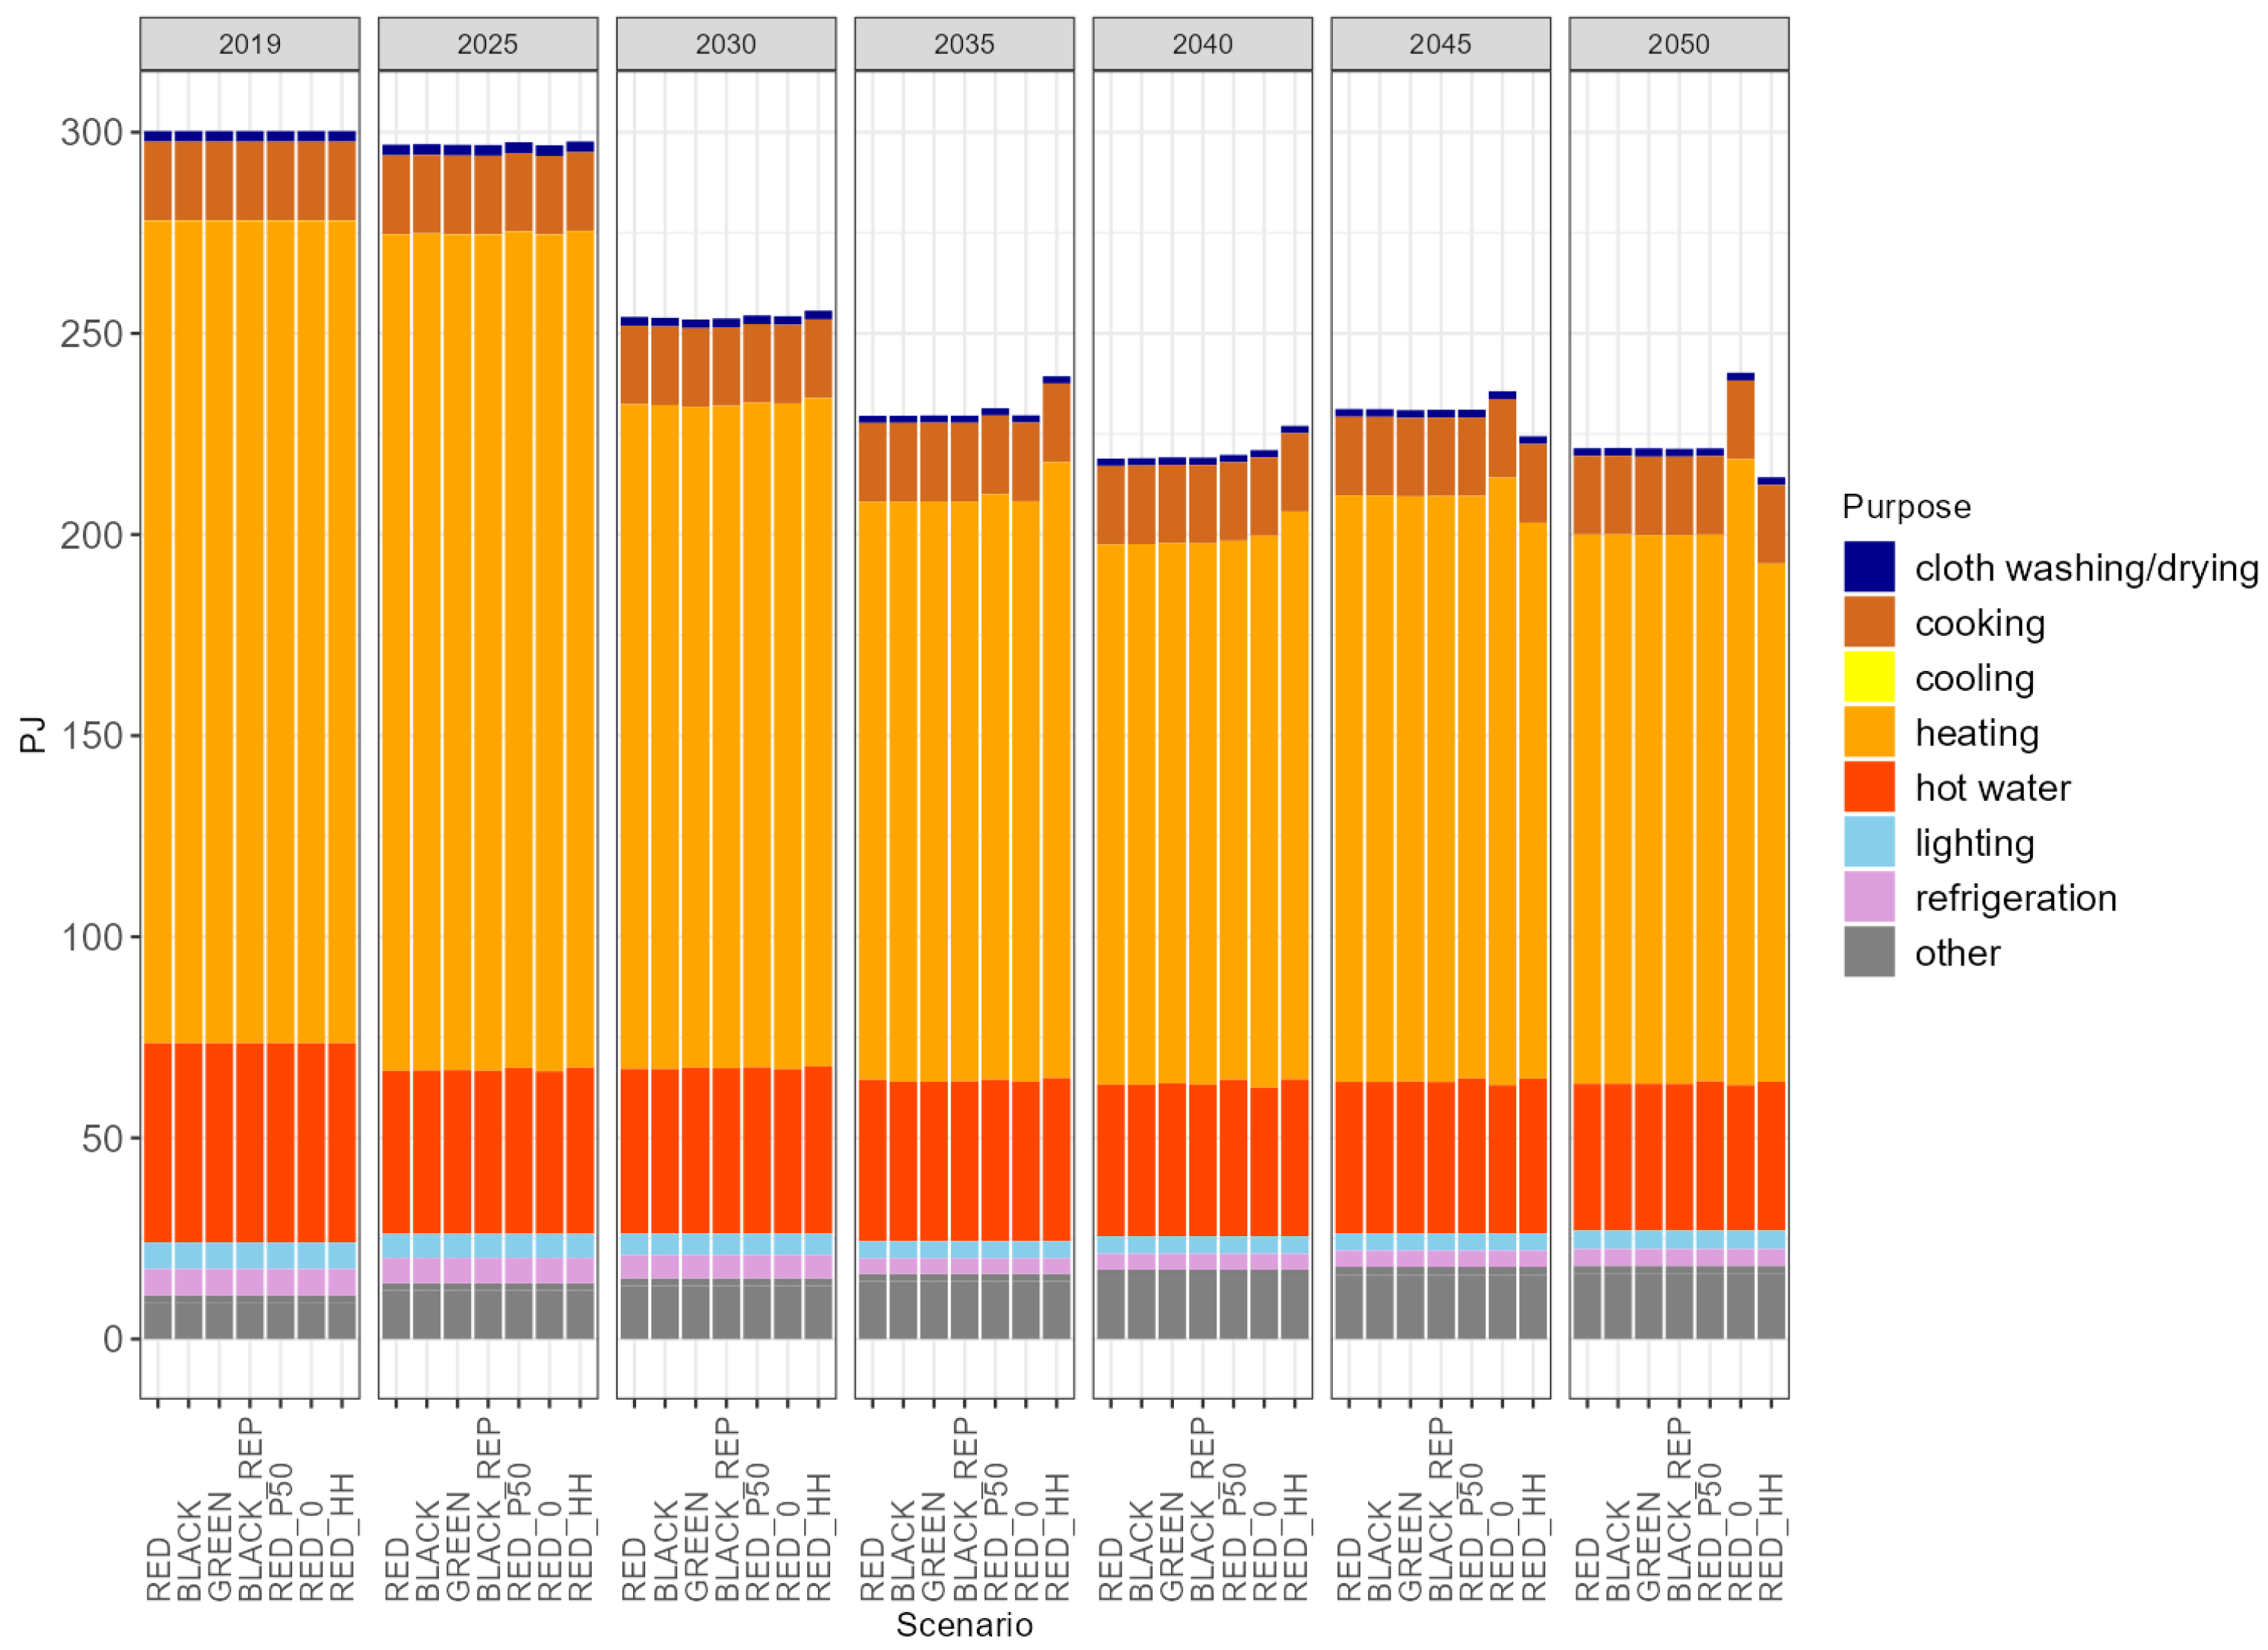
Final energy consumption in the residential sector by purpose in Czechia 2019–2050.
4.6. Residential Sector
The residential sector consumed more than 62% of all biomass energy in Czechia in 2019. As this is substantial, we present detailed results of energy consumption in the residential sector.
In all scenarios, residential sector energy consumption generally shows a downward trend over time. Starting from 2035, district heating and biomass are predominantly replaced by ambient heat and electricity used by heat pumps. Interestingly, in scenario RED-0, which involves an exogenous reduction of GHG emissions to a net of 2.2 Mt in 2050, biomass does not appear to be the preferred choice in the residential sector. Instead, ambient heat and solar energy gain prominence. This shift is influenced by the fact that the power and heat sector and industry absorb most of the available biomass.
This observation is further supported by the RED-HH scenario, where the residential sector does not face competition for biomass consumption from other sectors. As a result, its biomass consumption exceeds that of the other scenarios. However, in this scenario, the residential sector is not able to fully utilise the available potential of biomass energy.
Figure 11 offers a detailed breakdown of energy use within the residential sector, which is categorised by its intended purposes. The ‘other’ category includes small electric appliances like televisions. Notably, the most substantial portion of household energy consumption is attributed to heating. The decline in energy demand by households is a result of advancements in appliance efficiency and enhanced building insulation.
4.7. Annualised Costs
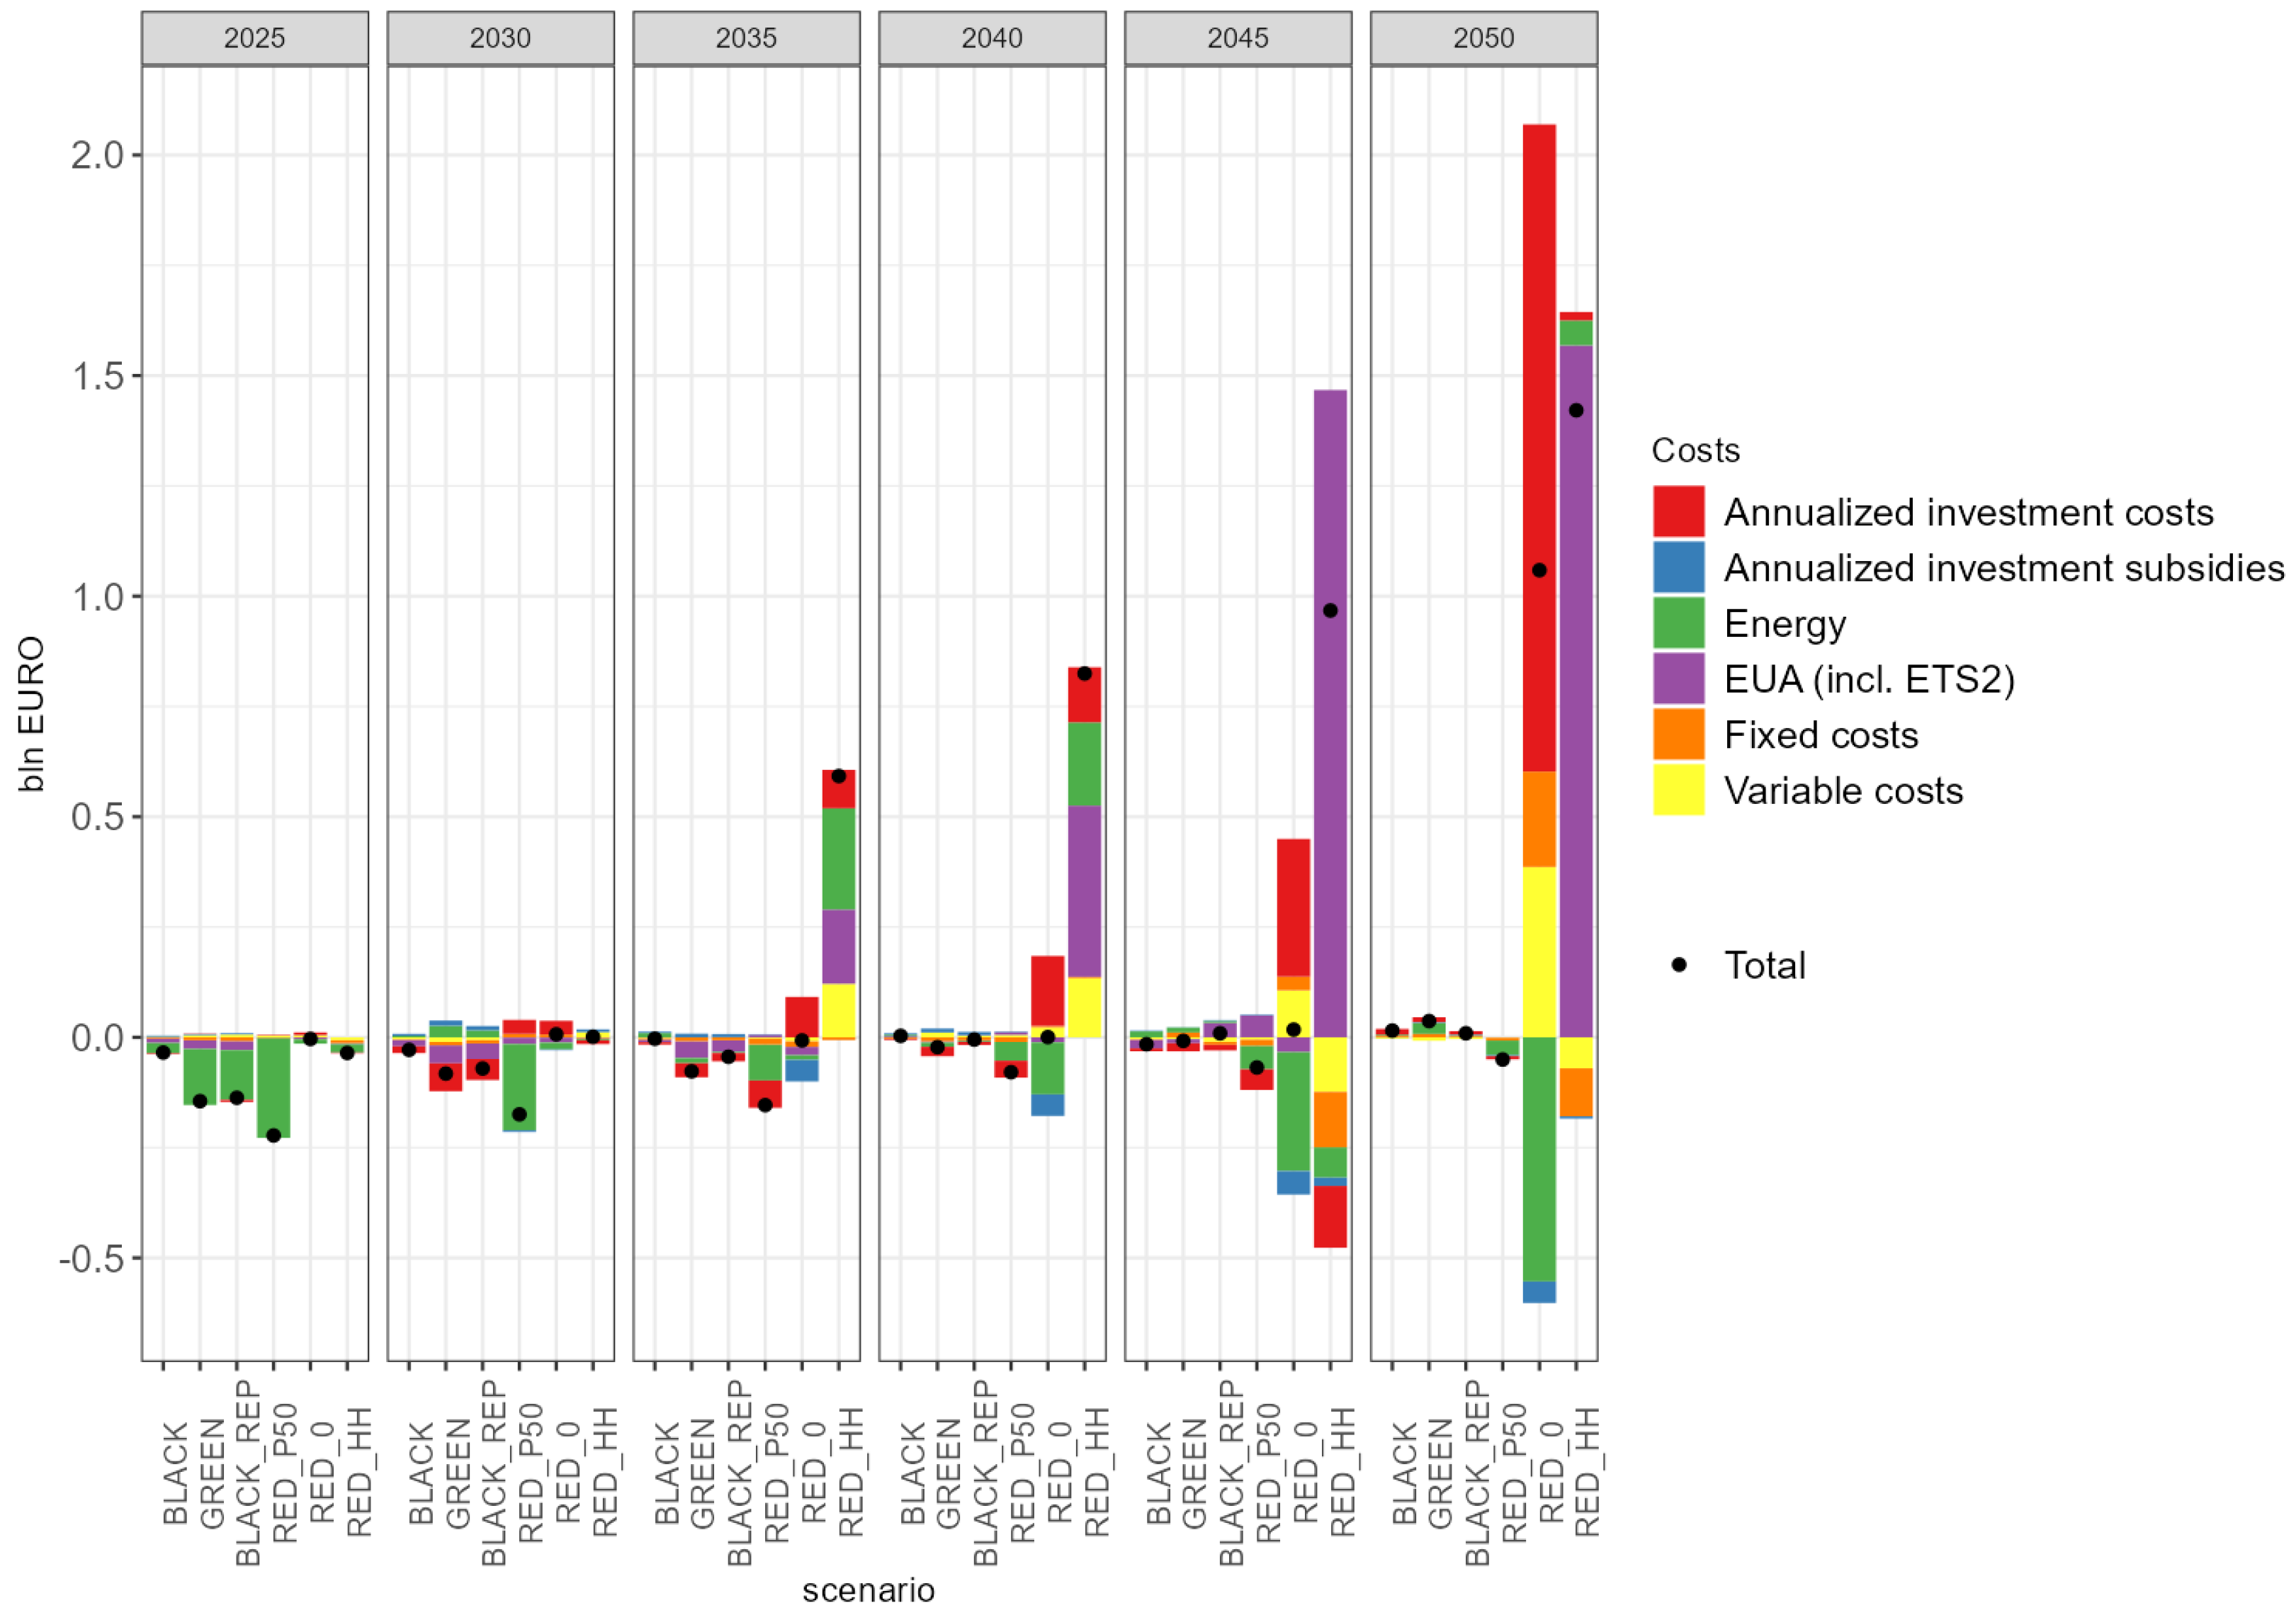
Figure 12 shows the difference in total annualised system-wide costs compared to a reference scenario, which is RED. The annualised total system-wide costs include the sum of investments, expenditures for energy and EUAs, and fixed and variable costs of technologies) and are shown from an energy system perspective, i.e., after deducting subsidies for clean technologies or wood pellet production. The subsidy for wood pellet production is included in the price of wood pellets, i.e., in the energy category. The bars show the costs per category, and the black dots show the totals. When the bars or black dots appear below (above) the zero line, the costs are lower (higher) than in the RED scenario. For example, the total annualised costs in RED-P50 are around €175 million lower each year in 2028–2032 than in RED; cumulatively, these costs are €875 million lower over the same five years.
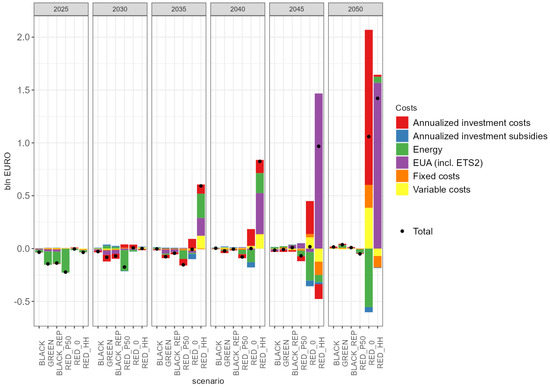
Figure 12.
Difference in total annualised energy system–wide costs compared to the RED scenario. Note: Negative bars signify that the particular cost component is lower than its counterpart in the RED scenario.
It is noteworthy that none of the four forest development scenarios differs significantly from the others, indicating that the impact of the spruce bark beetle infestation on energy system costs is very limited.
However, regarding the three policy scenarios, we observe notable spikes in annualised total costs, particularly in the case of the RED-HH and RED-0 scenarios. The RED-HH scenario is the only one in which annual costs significantly exceed the costs of all four forest scenarios, starting from 2035. This occurs because adhering to ecological constraints forces the system to rely on costlier and more carbon-intensive fuels, substantially increasing the system costs. Because the availability of forest biomass is constrained in the RED-HH scenario, higher carbon emissions result in higher payments on EUAs. The scenario is the most expensive, costing €16 billion more than RED.
For the RED-0 scenario, total annualised costs significantly surpass the costs in RED baseline only in 2050, because the scenario requires reducing greenhouse gas emissions to a net 2.2 million tons by 2050. This requirement triggers investments in costly abatement technologies like nuclear power and energy-saving measures, resulting in €3.3 billion higher overall annual costs up to 2050.
RED-P50 seems to be the least costly scenario, which is mainly due to the expenditures on energy use, which are €3.1 billion (cumulatively, until 2050) smaller than in all four scenarios on forest development. Lower energy bills are partly due to subsidies for wood pellets, which cost €4.54 billion cumulatively until 2050. Annually, these subsidies amount to €227 million during 2023–2027. Then, as a result of increased energy efficiency in residential buildings and resulting lower energy consumption, wood pellet subsidies fall to €143 million around 2040 and €80 million around 2050. This subsidy is implicitly reflected in reduced energy bills. This scenario is, however, not the least costly from a social planner’s perspective when all subsidies are factored in the annualised total costs. Including subsidies in the annualised costs, the total costs are €0.9 billion higher than the costs in the baseline scenario, whereas GREEN and then BLACK-REP are the cheapest ones, with €1.4, and €1.0 billion lower annualised total costs than in the baseline.
5. Conclusions
Forest biomass is the main source of renewable energy in Czechia. This precious resource is currently facing challenges from spruce bark beetles. In this paper, we explore the impact of possible forest biomass development pathways on the Czech energy system, taking the current spruce bark beetle infestation into account. In particular, we evaluate the impact on greenhouse gas reduction efforts, renewable objectives and the final allocation of resources. We use a spatially enriched energy system optimisation model, TIMES-CZ, enhancing its spatial resolution by regionalising biomass availability, power and heat generation, and energy service demands, following Eurostat’s NUTS3 levels. Our regionalised model accounts for the fact that forests are unevenly distributed across the country and that transporting biomass over long distances is not economical. Our updated model informs more realistic choices for locating new biomass-burning or co-burning plants. More broadly, regionalisation incorporates various constraints, specific details, and heterogeneities across regions, improving the accuracy of our results. This type of incorporation of spatial granularity in optimisation ESM is notably lacking in the literature, particularly when considering the relatively small and compact nature of the TIMES-CZ regions. This contribution to the existing literature is quite evident.
This paper underscores several key findings. Firstly, it highlights that even at an EUA price of €386, Czechia is unlikely to achieve climate neutrality by 2050 across all scenarios. Furthermore, attaining climate neutrality by 2050 necessitates investments in costlier technologies. Regarding pathways for reducing greenhouse gas emissions, neither the impact of the spruce bark beetle infestation nor special subsidies aimed at promoting wood pellet consumption by households seem to influence the outcomes significantly. Instead, the primary drivers concerning biomass are the adoption of BECCS technologies, which could lead to a reduction of 4–4.5 megatons in emissions during the period of 2045–2050, along with sustainable activities related to land use, land use change, and forestry.
Regarding ecological constraints, it becomes evident that at times, there is a need to prioritise specific objectives over others. Limiting the use of biomass to households and conserving the remaining biomass in forests does not align with the goal of reducing greenhouse gas emissions. This misalignment has a significant impact particularly by constraining the potential of BECCS.
The disparities among biomass development scenarios are substantial until 2035. However, these distinctions do not seem to have a long-lasting impact on the overall energy mix. Nonetheless, the more optimistic scenarios permit an additional 1 percentage point increase in the share of renewable energy sources (RESs) in total final energy consumption compared to other forest biomass development scenarios in 2025–2030. Consequently, the spruce bark beetle infestation does exert a negative influence on medium-term renewable energy objectives.
Irrespective of the spruce bark beetle infestation, our results suggest that the energy system will make full use of biomass potential with the exception of a temporary deviation in 2040 when biomass demand will likely lag behind increasing availability. In this context, one could suggest the implementation of subsidies to encourage household adoption of biomass. However, this policy does not appear to yield positive changes in key variables of interest, including greenhouse gas emission reduction, the achievement of renewable energy targets, or cost savings. In addition, such subsidies seem to distort the allocation of this precious resource by crowding it out from sectors that could use it more efficiently.
Author Contributions
Conceptualisation, L.R. and M.Š.; methodology, L.R. and D.T.L.; software, L.R. and D.T.L.; validation, L.R., D.T.L. and M.Š.; formal analysis, L.R., D.T.L. and M.Š.; investigation, L.R. and D.T.L.; resources, L.R. and M.Š.; data curation, L.R., M.Š. and D.T.L.; writing—original draft preparation, D.T.L.; writing—review and editing, L.R., M.Š. and D.T.L.; visualisation, L.R. and D.T.L.; supervision, L.R. and M.Š.; project administration, L.R. and M.Š.; funding acquisition, L.R. and M.Š. All authors have read and agreed to the published version of the manuscript.
Funding
This research was funded by the Technology Agency of the Czech Republic, grant number TL02000440: “Modelling of Sustainable Forestry Scenarios Contributing To Climate Change Adaptation—Examining the Impacts on Energy Sector and GHG Emissions in the Czech Republic and Public Acceptability of These Scenarios by Czech Population”.
Data Availability Statement
Not applicable.
Conflicts of Interest
The authors declare no conflict of interest. The funders had no role in the design of the study; in the collection, analyses, or interpretation of data; in the writing of the manuscript; or in the decision to publish the results.
Abbreviations
The following abbreviations are used in this manuscript:
| BECCS | Bioenergy with Carbon Capture and Storage |
| CCUS | Carbon Capture, Use, and Storage |
| ETSAP | Energy Technology System Analyses Program |
| ESM | Energy System Modelling |
| ESR | Effort Sharing Regulation |
| EUA | European Union Allowance (EUA) |
| EU ETS | EU Emission Trading System |
| GIS | Geographic Information Systems |
| HCT | Harmonised Common Trajectories |
| IEA | International Energy Agency |
| IFER | Institute for Forest Ecosystem Research |
| LULUCF | Land Use, Land Use Change and Forestry |
| NUTS | Nomenclature of Territorial Units for Statistics |
| PES | Primary Energy Sources |
| RESs | Renewable Energy Sources |
| TIMES | The Integrated MARKAL-EFOM System |
| WAM | With Additional Measures |
| WEM | With Existing Measures |
References
- Stolarski, M.J.; Stachowicz, P.; Sieniawski, W.; Krzyżaniak, M.; Olba-Zięty, E. Quality and delivery costs of wood chips by railway vs. Road transport. Energies 2021, 14, 6877. [Google Scholar] [CrossRef]
- Hlásny, T.; König, L.; Krokene, P.; Lindner, M.; Montagné-Huck, C.; Müller, J.; Qin, H.; Raffa, K.F.; Schelhaas, M.J.; Svoboda, M.; et al. Bark beetle outbreaks in Europe: State of knowledge and ways forward for management. Curr. For. Rep. 2021, 7, 138–165. [Google Scholar] [CrossRef]
- Sarfarazi, S.; Sasanpour, S.; Cao, K.K. Improving energy system design with optimization models by quantifying the economic granularity gap: The case of prosumer self-consumption in Germany. Energy Rep. 2023, 9, 1859–1874. [Google Scholar] [CrossRef]
- Fodstad, M.; del Granado, P.C.; Hellemo, L.; Knudsen, B.R.; Pisciella, P.; Silvast, A.; Bordin, C.; Schmidt, S.; Straus, J. Next frontiers in energy system modelling: A review on challenges and the state of the art. Renew. Sustain. Energy Rev. 2022, 160, 112246. [Google Scholar] [CrossRef]
- Martínez-Gordón, R.; Morales-España, G.; Sijm, J.; Faaij, A. A review of the role of spatial resolution in energy systems modelling: Lessons learned and applicability to the North Sea region. Renew. Sustain. Energy Rev. 2021, 141, 110857. [Google Scholar] [CrossRef]
- Carpio, L.G. Efficient spatial allocation of solar photovoltaic electric energy generation in different regions of Brazil: A portfolio approach. Energy Sources Part B Econ. Plan. Policy 2021, 16, 542–557. [Google Scholar] [CrossRef]
- Castillo, C.P.; e Silva, F.B.; Lavalle, C. An assessment of the regional potential for solar power generation in EU-28. Energy Policy 2016, 88, 86–99. [Google Scholar] [CrossRef]
- Holttinen, H.; Meibom, P.; Orths, A.; Lange, B.; O’Malley, M.; Tande, J.O.; Estanqueiro, A.; Gomez, E.; Söder, L.; Strbac, G.; et al. Impacts of large amounts of wind power on design and operation of power systems, results of IEA collaboration. Wind Energy 2011, 14, 179–192. [Google Scholar] [CrossRef]
- Monforti, F.; Huld, T.; Bódis, K.; Vitali, L.; D’isidoro, M.; Lacal-Arántegui, R. Assessing complementarity of wind and solar resources for energy production in Italy. A Monte Carlo approach. Renew. Energy 2014, 63, 576–586. [Google Scholar] [CrossRef]
- Pfenninger, S.; Staffell, I. Long-term patterns of European PV output using 30 years of validated hourly reanalysis and satellite data. Energy 2016, 114, 1251–1265. [Google Scholar] [CrossRef]
- Roques, F.; Hiroux, C.; Saguan, M. Optimal wind power deployment in Europe—A portfolio approach. Energy Policy 2010, 38, 3245–3256. [Google Scholar] [CrossRef]
- Yang, Q.; Huang, T.; Wang, S.; Li, J.; Dai, S.; Wright, S.; Wang, Y.; Peng, H. A GIS-based high spatial resolution assessment of large-scale PV generation potential in China. Appl. Energy 2019, 247, 254–269. [Google Scholar] [CrossRef]
- Maimó-Far, A.; Homar, V.; Tantet, A.; Drobinski, P. The effect of spatial granularity on optimal renewable energy portfolios in an integrated climate-energy assessment model. Sustain. Energy Technol. Assess. 2022, 54, 102827. [Google Scholar] [CrossRef]
- Resch, B.; Sagl, G.; Törnros, T.; Bachmaier, A.; Eggers, J.B.; Herkel, S.; Narmsara, S.; Gündra, H. GIS-based planning and modeling for renewable energy: Challenges and future research avenues. ISPRS Int. J. Geo-Inf. 2014, 3, 662–692. [Google Scholar] [CrossRef]
- Ramirez Camargo, L.; Stoeglehner, G. Spatiotemporal modelling for integrated spatial and energy planning. Energy Sustain. Soc. 2018, 8, 32. [Google Scholar] [CrossRef]
- Hörsch, J.; Brown, T. The role of spatial scale in joint optimisations of generation and transmission for European highly renewable scenarios. In Proceedings of the 2017 14th International Conference on the European Energy Market (EEM), Dresden, Germany, 6–9 June 2017; pp. 1–7. [Google Scholar]
- Lozano-García, D.F.; Santibañez-Aguilar, J.E.; Lozano, F.J.; Flores-Tlacuahuac, A. GIS-based modeling of residual biomass availability for energy and production in Mexico. Renew. Sustain. Energy Rev. 2020, 120, 109610. [Google Scholar] [CrossRef]
- Knápek, J.; Králík, T.; Vávrová, K.; Weger, J. Dynamic biomass potential from agricultural land. Renew. Sustain. Energy Rev. 2020, 134, 110319. [Google Scholar] [CrossRef]
- Zhang, B.; Hastings, A.; Clifton-Brown, J.C.; Jiang, D.; Faaij, A.P. Modeled spatial assessment of biomass productivity and technical potential of Miscanthus× giganteus, Panicum virgatum L., and Jatropha on marginal land in China. GCB Bioenergy 2020, 12, 328–345. [Google Scholar] [CrossRef]
- Rečka, L.; Ščasnỳ, M. Impacts of carbon pricing, brown coal availability and gas cost on Czech energy system up to 2050. Energy 2016, 108, 19–33. [Google Scholar] [CrossRef]
- Rečka, L.; Ščasnỳ, M. Brown coal and nuclear energy deployment: Effects on fuel-mix, carbon targets, and external costs in the Czech Republic up to 2050. Fuel 2018, 216, 494–502. [Google Scholar] [CrossRef]
- Rečka, L.; Ščasnỳ, M. Impacts of reclassified brown coal reserves on the energy system and deep decarbonisation target in the Czech Republic. Energies 2017, 10, 1947. [Google Scholar] [CrossRef]
- Lorenc, F. Škodliví činitelé v Lesích Česka 2021/2022; Výzkumný ústav Lesního Hospodářství a Myslivosti, v. v. i. Lesní Ochranná Služba, Ministerstvo Zemědělství: Praha, Czech Republic, 2022. [Google Scholar]
- Cienciala, E.; Melichar, J. Forest carbon stock budget development following extreme drought-induced dieback of coniferous stands in Central Europe—A CBM-CFS3 model application. Carbon Balance Manag. 2023, preprint. [Google Scholar]
- Hlásny, T.; Zimová, S.; Merganičová, K.; Štěpánek, P.; Modlinger, R.; Turčáni, M. Devastating outbreak of bark beetles in the Czech Republic: Drivers, impacts, and management implications. For. Ecol. Manag. 2021, 490, 119075. [Google Scholar] [CrossRef]
- Rečka, L.; Máca, V.; Ščasnỳ, M. Green Deal and Carbon Neutrality Assessment of Czechia. Energies 2023, 16, 2152. [Google Scholar] [CrossRef]
- IEA-ETSAP. TIMES. Available online: https://iea-etsap.org/index.php/etsap-tools/model-generators/times (accessed on 19 June 2023).
- Capros, P.; Paroussos, L.; Fragkos, P.; Tsani, S.; Boitier, B.; Wagner, F.; Busch, S.; Resch, G.; Blesl, M.; Bollen, J. Description of models and scenarios used to assess European decarbonisation pathways. Energy Strategy Rev. 2014, 2, 220–230. [Google Scholar] [CrossRef]
- ERU. Roční Zpráva o Provozu Elektrizační Soustavy ČR. 2019. Available online: https://www.eru.cz/rocni-zprava-o-provozu-elektrizacni-soustavy-cr-pro-rok-2019 (accessed on 9 May 2022).
- ERU. Roční Zpráva o Provozu Teplárenských Soustav ČR. 2019. Available online: https://www.eru.cz/rocni-zprava-o-provozu-teplarenskych-soustav-cr-za-rok-2019 (accessed on 9 May 2022).
- Ministry of Industry and Trade. Regional Energy Balance of the Czech Republic. 2021. Available online: https://www.mpo.cz/cz/energetika/statistika/energeticke-bilance/krajske-energeticke-bilance--260319 (accessed on 4 September 2023).
- CZSO. Spotřeba Paliv a Energií v Domácnostech, 2017. Czech Satitistical Office—ENERGO 2015 Data. Available online: https://www.czso.cz/csu/czso/spotreba-paliv-a-energii-v-domacnostech (accessed on 9 June 2020).
- Janová, J.; Hampel, D.; Kadlec, J.; Vrška, T. Motivations behind the forest managers’ decision making about mixed forests in the Czech Republic. For. Policy Econ. 2022, 144, 102841. [Google Scholar] [CrossRef]
- Ministry of Industry and Trade. Energy Balance of the Czech Republic 2019. 2021. Available online: https://www.mpo.cz/cz/energetika/statistika/energeticke-bilance/souhrnna-energeticka-bilance-statu-v-metodice-eurostatu-za-leta-2010_2020--265192/ (accessed on 19 June 2023).
- CZSO. Indexy cen v Lesnictví. 2019. Czech Satitistical Office. Available online: https://www.czso.cz/csu/czso/indexy-cen-v-lesnictvi-surove-drivi-4-ctvrtleti-2019 (accessed on 8 August 2023).
- Vytečka, L. Logistika Výrobního Procesu Zaměřeno na Skladování Nákladu a Přepravu Dřevní Štěpky. Dřevošrot a.s. Available online: https://docplayer.cz/3301723-Logistika-vyrobniho-procesu-zamereno-na-skladovani-nakladku-a-prepravu-drevni-stepky-drevosrot-a-s.html (accessed on 17 July 2023).
- Lyčka, Z. Náklady na Vytápění Dřevními Peletami. 2010. Available online: https://oze.tzb-info.cz/biomasa/6263-naklady-na-vytapeni-drevnimi-peletami (accessed on 16 June 2022).
- Avydon. Topení Peletami: Jaká je Cena a Spotřeba pelet na Topnou Sezónu? Available online: https://www.avydon.cz/topeni-pelety-spotreba (accessed on 8 August 2023).
- TZBINFO. Přehled Energetických Plodin, Jejich Vlastnosti a Přepočty Jednotek. Available online: https://www.tzb-info.cz/tabulky-a-vypocty/98-prehled-energetickych-plodin-jejich-vlastnosti-a-prepocty-jednotek (accessed on 16 June 2022).
- Wang, J.; Rakha, H.A. Fuel consumption model for heavy duty diesel trucks: Model development and testing. Transp. Res. Part D Transp. Environ. 2017, 55, 127–141. [Google Scholar] [CrossRef]
- Natural Resources Canada. Learn the Facts: Emissions from Your Vehicle. 2014. Available online: https://natural-resources.canada.ca/sites/www.nrcan.gc.ca/files/oee/pdf/transportation/fuel-efficient-technologies/autosmart_factsheet_9_e.pdf (accessed on 17 July 2023).
- European Comission Directorate-General Climate Action. Recommended Parameters for Reporting on GHG Projections in 2023; Report; European Comission Directorate-General Climate Action: Brussels, Belgium, 2023. [Google Scholar]
- Ministry of Industry and Trade. Dlouhodobá Strategie Renovací na Podporu Renovace Vnitrostátního Fondu Obytných a Jiných než Obytných Budov, Veřejných i Soukromých. 2020. Available online: https://www.mpo.cz/cz/energetika/energeticka-ucinnost/strategicke-dokumenty/dlouhodoba-strategie-renovaci-budov--255200/ (accessed on 5 September 2023).
- European Comission. Questions and Answers—The Effort Sharing Regulation and Land, Forestry and Agriculture Regulation. Available online: https://ec.europa.eu/commission/presscorner/detail/en/qanda_21_3543 (accessed on 8 August 2023).
Disclaimer/Publisher’s Note: The statements, opinions and data contained in all publications are solely those of the individual author(s) and contributor(s) and not of MDPI and/or the editor(s). MDPI and/or the editor(s) disclaim responsibility for any injury to people or property resulting from any ideas, methods, instructions or products referred to in the content. |
© 2023 by the authors. Licensee MDPI, Basel, Switzerland. This article is an open access article distributed under the terms and conditions of the Creative Commons Attribution (CC BY) license (https://creativecommons.org/licenses/by/4.0/).

