
Policy Design for Diffusing Hydrogen Economy and Its Impact on the Japanese Economy for Carbon Neutrality by 2050: Analysis Using the E3ME-FTT Model

Abstract
:1. Introduction
1.1. Background
1.2. Hydrogen Roadmap towards 2050
- Phase 1: Fast expansion of hydrogen uses.Extensive diffusion of stationary fuel cells and fuel cell electric vehicles (FCEV). Playing a leading role in the global market for hydrogen and fuel cells.
- Phase 2: introducing hydrogen power generation/establishing a large-scale hydrogen supply system (in the late 2020s).
- Phase 3: establishing a CO2-free hydrogen supply system using renewable energy sources or CCS (in 2040).
1.3. Proposed Hydrogen-Related Policies
1.4. Modelling the Promotion of the Hydrogen Economy in Japan
1.5. Aim of This Study
2. Methodology
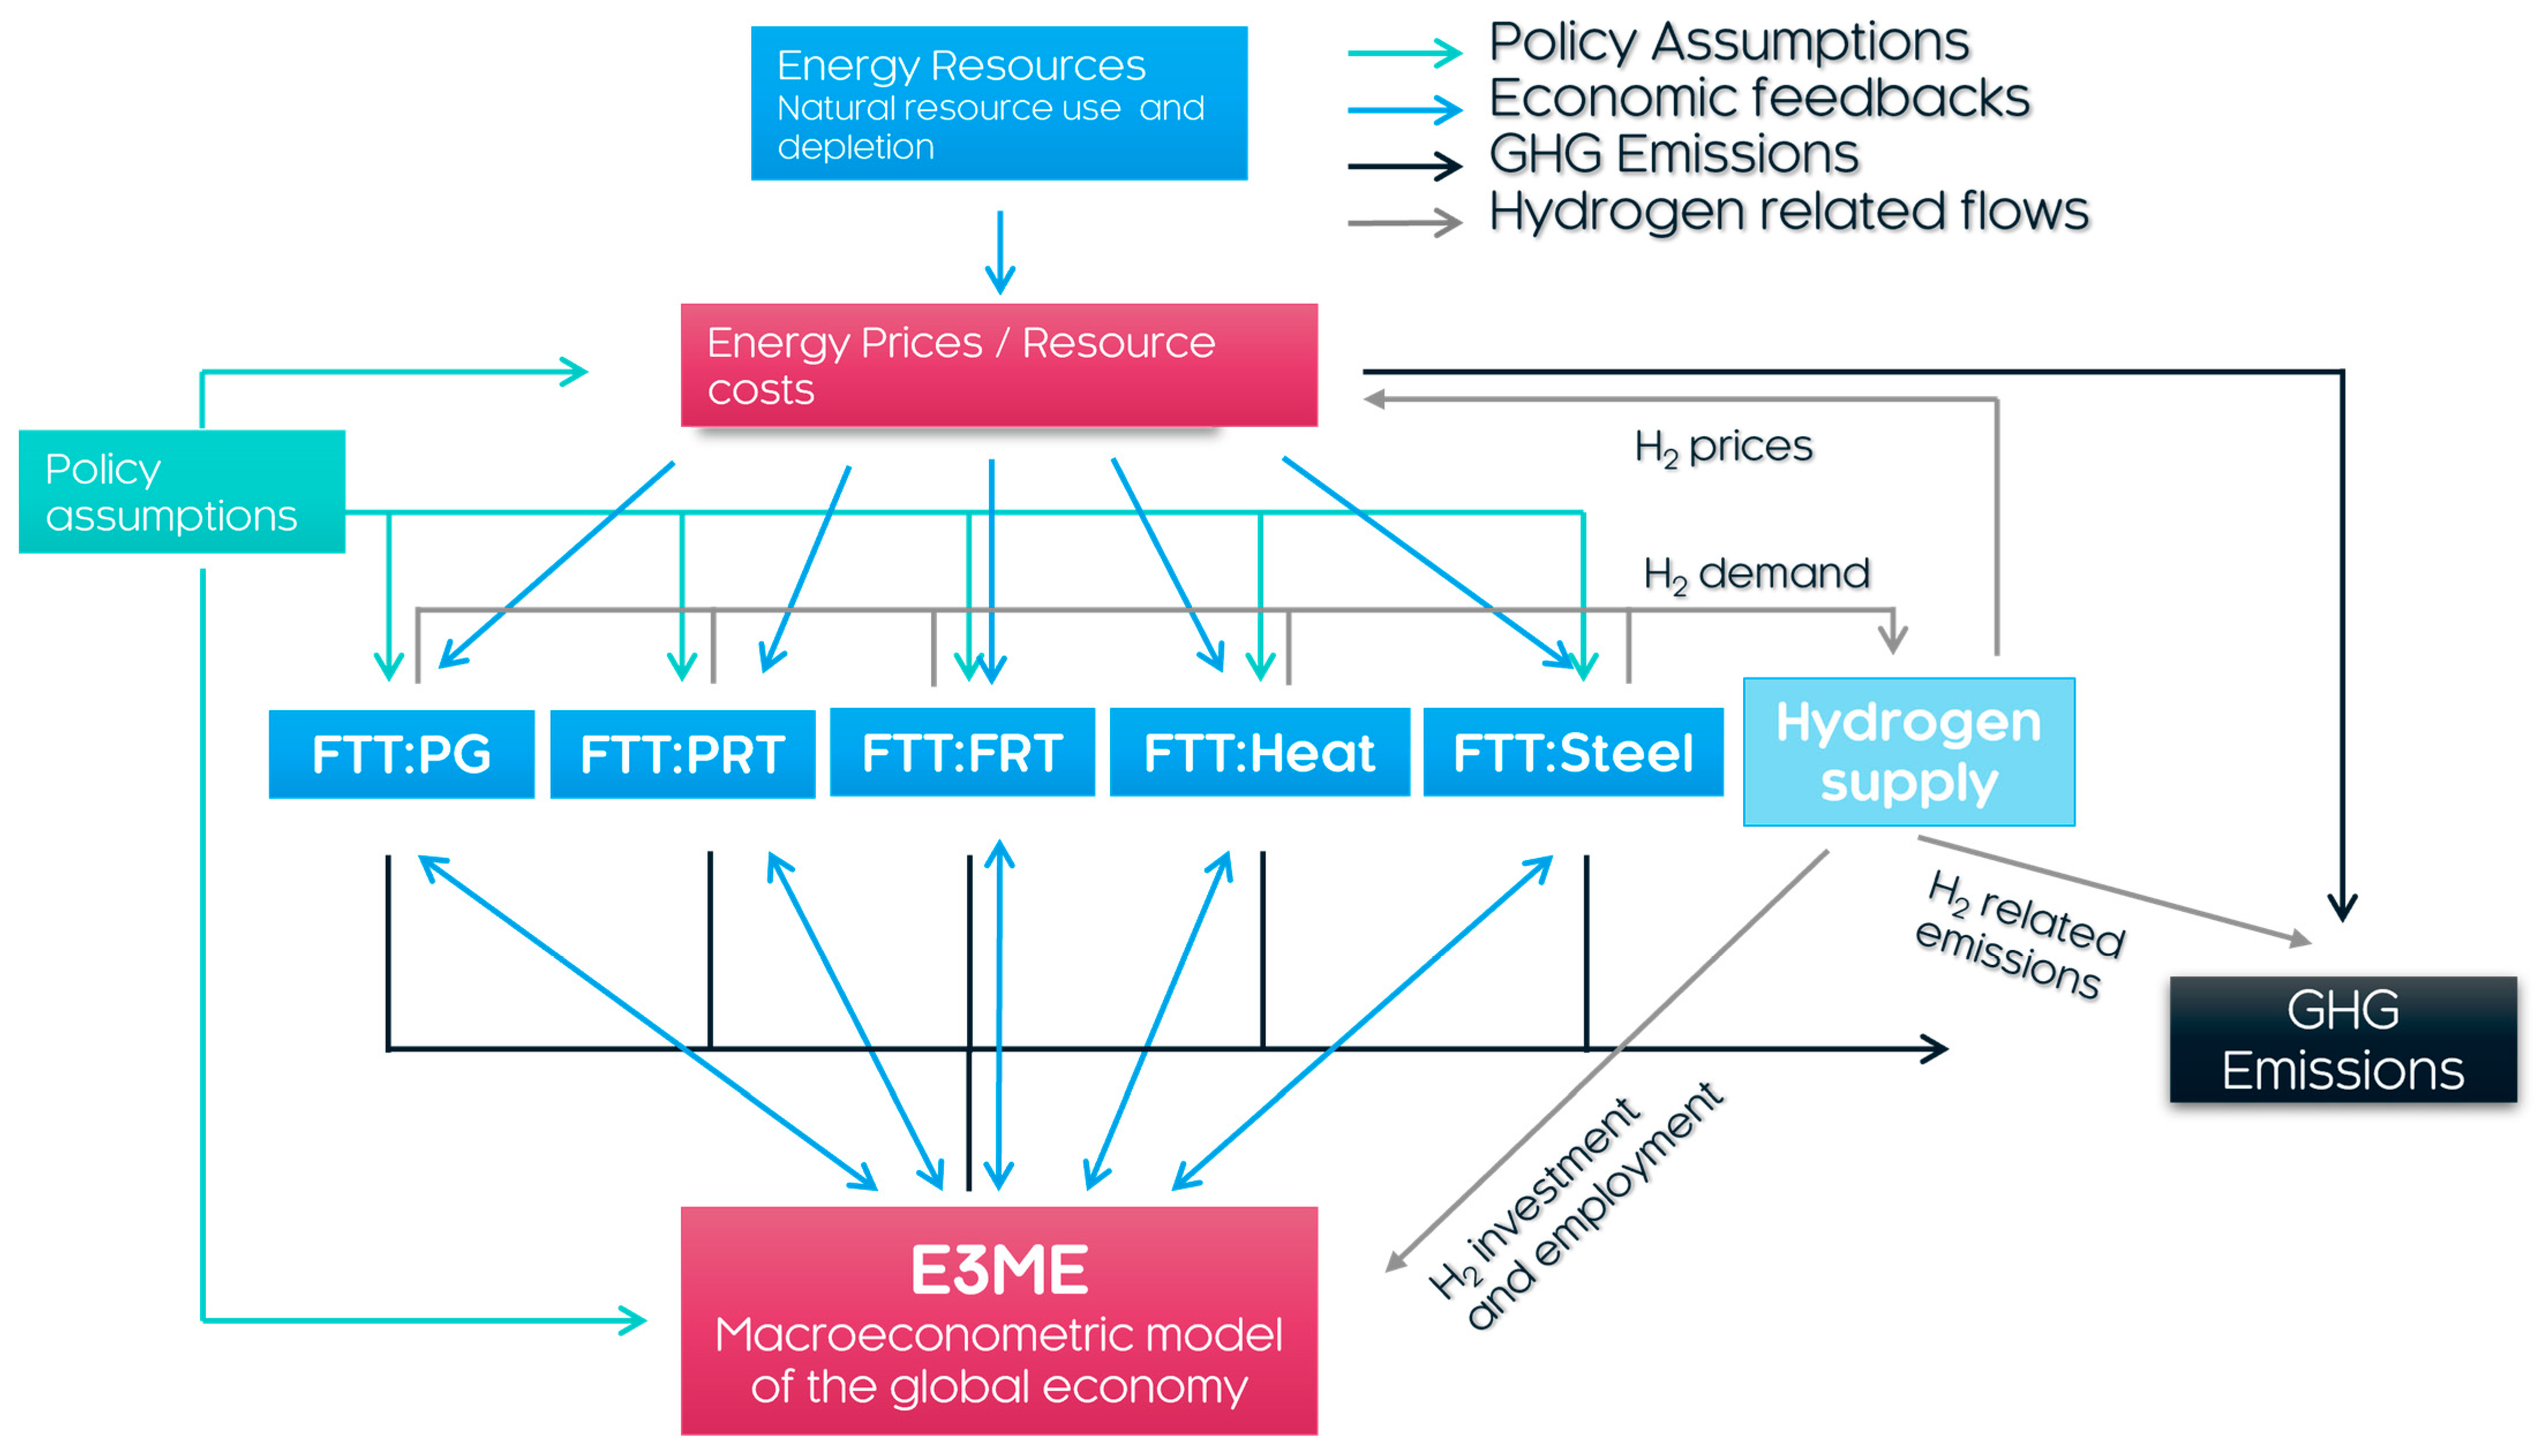
2.1. Outline of E3ME-FTT
2.2. Reference Scenario
2.3. Hydrogen-Based Net-Zero Scenario
- Policy revenues: carbon tax is in relation to taxable emissions.
- Policy costs: public energy efficiency investment, low-carbon technology subsidies, and stranded power plant assets costs.
- Net revenues are equal to the total policy revenues minus the total policy costs.
2.4. Hydrogen Supply Assumptions
3. Results and Discussion
3.1. Technology Deployment
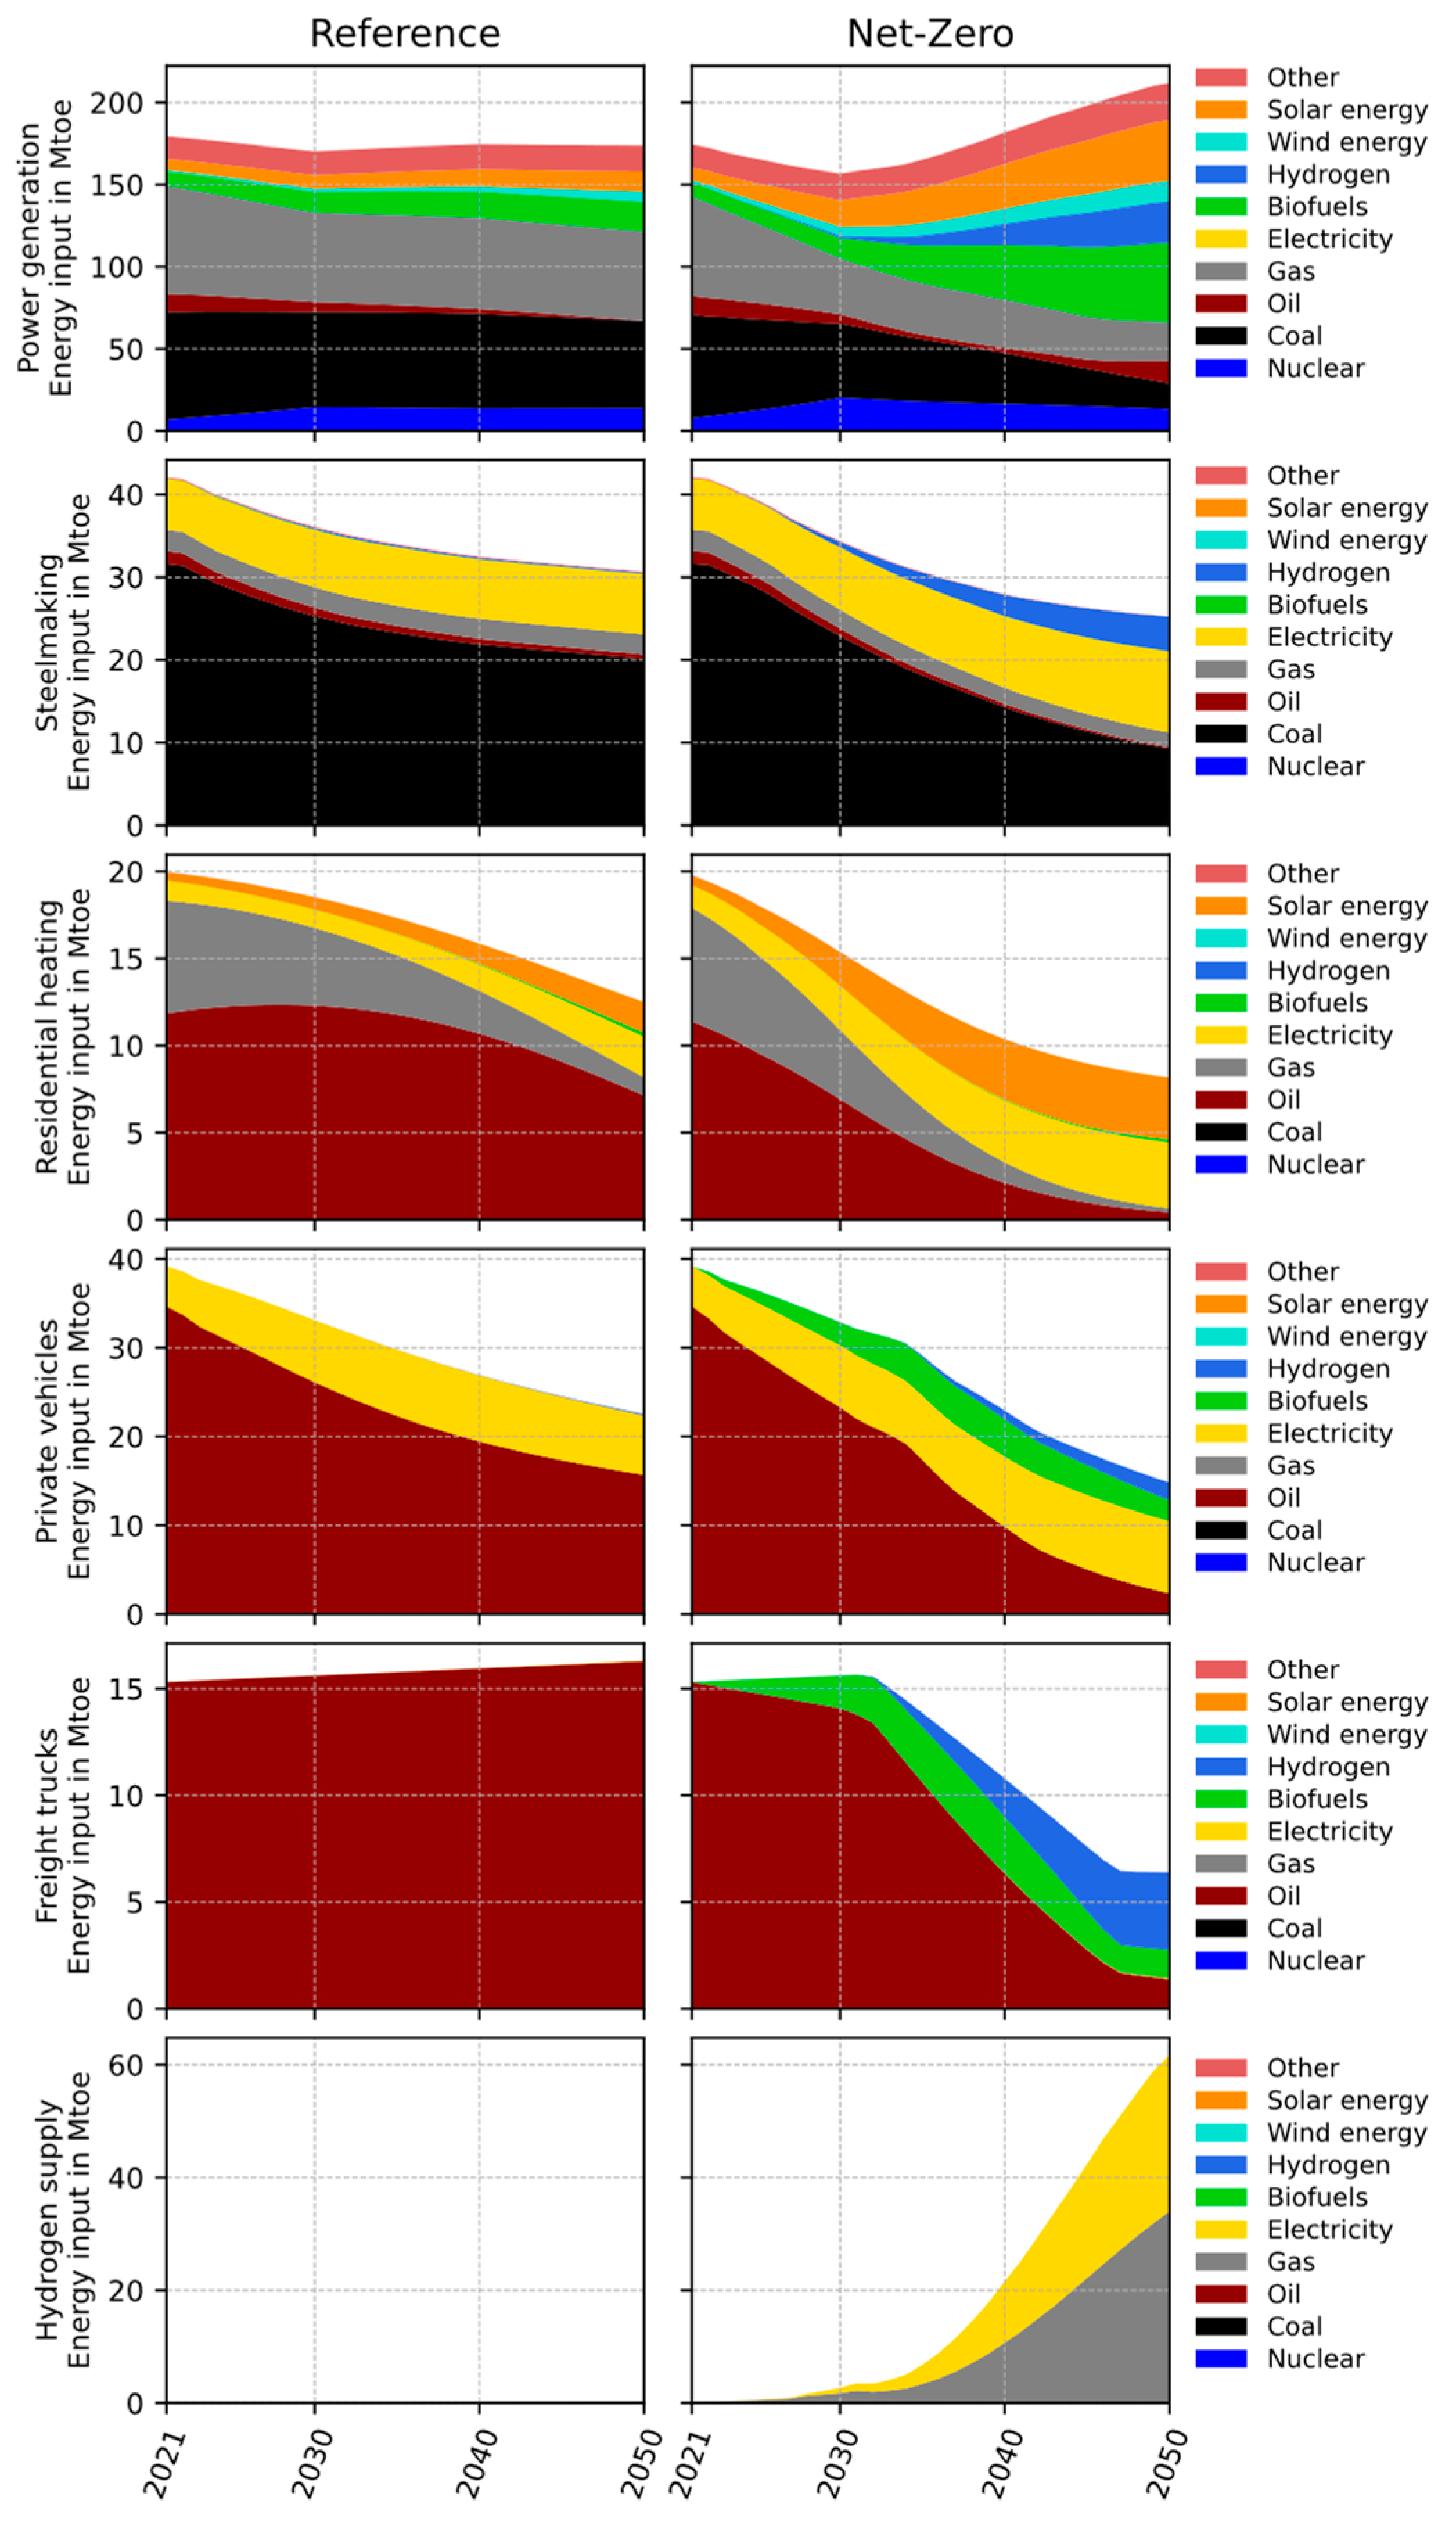
3.2. Energy Demand
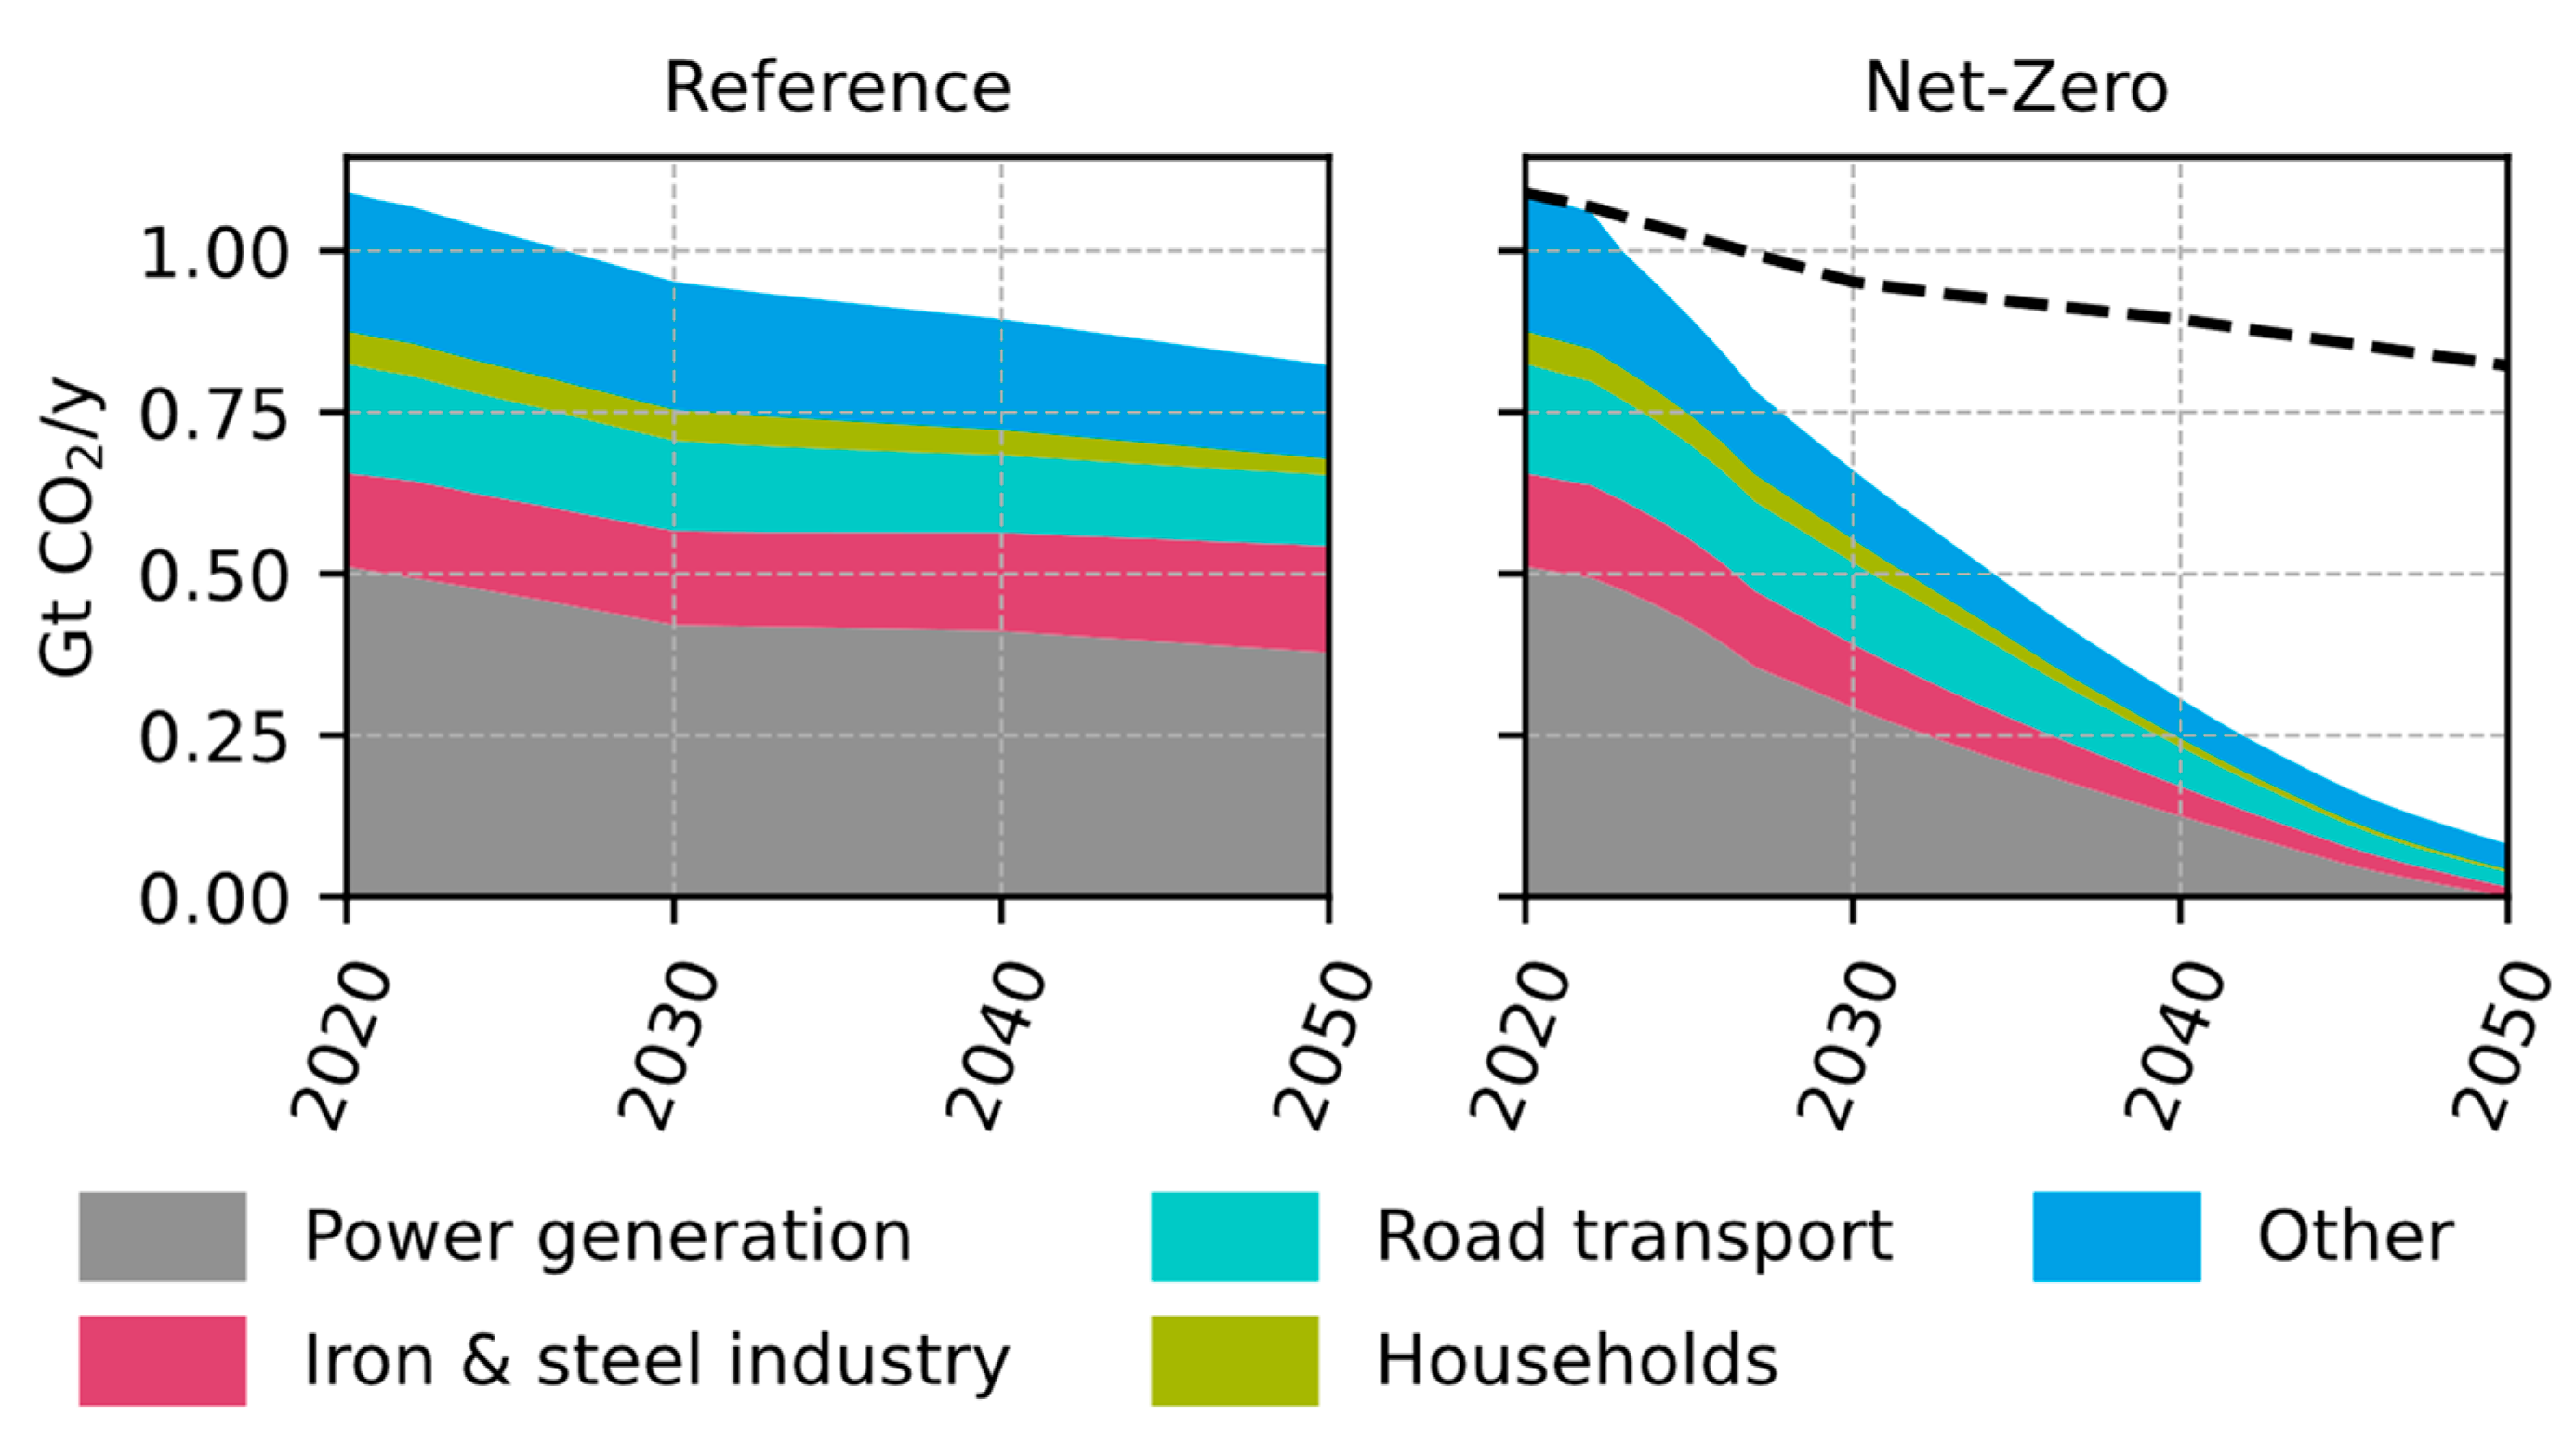
3.3. Emissions
3.4. Gross Domestic Product and Employment
4. Conclusions and Challenges
Author Contributions
Funding
Data Availability Statement
Conflicts of Interest
Abbreviations
| FITs | feed-in tariffs. |
| METI | the Japanese Ministry of Economy, Trade and Industry. |
| R&D | research and development. |
| CCS | carbon capture and storage. |
| NEDO | New Energy and Industrial Technology Development Organization. |
| FCEV | fuel cell electric vehicle. Also called FCV. |
| CCUS | carbon capture, usage, and storage. |
| EV | electric vehicles. |
| PHEVs | plug-in hybrid electric vehicles. |
| REI | Renewable Energy Institute. |
| GENeSYS-MOD | the multi-sectoral open-source Global Energy System Model. |
| GRAPE | a global and long-term intertemporal optimization energy model. |
| FTT:PG | FTT model for power generation. |
| FTT:PRT | FTT model for private road transport. |
| FTT:FRT | FTT model for freight road transport. |
| FTT:Heat | FTT model for residential heat. |
| FTT:Steel | FTT model for iron and steel industry. |
| E3ME model | Energy-Economy-Environment Macro-econometric model. |
| FTT model | Future Technology Transformations model. |
| GHG | greenhouse gas. |
| GDP | gross domestic product. |
| GPMP | the Government Power Mix Plan. |
| VAT | value-added tax. |
| BECCS | bioenergy with carbon capture and storage. |
| LDV | light-duty vehicle. |
| HDV | heavy-duty vehicle. |
| H2-DR-EAF | hydrogen direct reduction and electric arc furnaces. |
| IEA | International Energy Agency. |
| ASEAN | the Association of Southeast Asian Nations. |
| PV | photovoltaics. |
| BF-BOF | the blast furnace-basic oxygen furnace. |
| SR-BOF | the smelting reduction-basic oxygen furnace. |
| DR-EAF | direct reduced iron electric arc furnace. |
| H2 | hydrogen. |
| CNG | compressed natural gas. |
| LPG | liquefied petroleum gas. |
| BEV | battery electric vehicle. |
| PHEV | plug-in hybrid electric vehicle |
| ICEV | internal combustion engine vehicle. |
Appendix A. Fiscal Implications of the Policy Scenario

References
- METI 2050 Carbon Neutral Growth Strategy. Available online: https://www.meti.go.jp/press/2021/06/20210618005/20210618005-3.pdf (accessed on 5 October 2022).
- Enerdata Japan Sets Feed-In Tariff Levels for Renewable Projects in 2022–2023. Available online: https://www.enerdata.net/publications/daily-energy-news/japan-sets-feed-tariff-levels-renewable-projects-2022-2023.html#:~:text=The%20Japanese%20Ministry%20of%20Economy,April%202022%2DMarch%202023).&text=In%20addition%2C%20FiTs%20for%20offshore,US%2431c%2FkWh) (accessed on 15 July 2023).
- METI. Hydrogen Basic Strategy. Available online: https://www.enecho.meti.go.jp/category/savingandnew/advancedsystems/hydrogensociety/data/hydrogenbasicstrategy.pdf (accessed on 5 October 2022).
- Agency for Natural Resources and Energy the Situation of Energy Cost. Available online: https://www.enecho.meti.go.jp/about/whitepaper/2015html/1-3-1.html (accessed on 10 January 2023).
- METI. Recent Trends in Hydrogen Policy. Available online: https://www.meti.go.jp/shingikai/energy_environment/suiso_nenryo/pdf/026_01_00.pdf (accessed on 22 January 2023).
- METI. Environment Innovation Strategy. Available online: https://unit.aist.go.jp/gzr/zero_emission_bay/en/images/kankyousenryaku2020_english.pdf (accessed on 14 May 2023).
- IEA. Japan 2021 Energy Policy Review; IEA: Paris, France, 2021. [Google Scholar]
- Iida, S.; Sakata, K. Hydrogen Technologies and Developments in Japan. Clean Energy 2019, 3, 105–113. [Google Scholar] [CrossRef]
- Renewable Energy Institute. Re-Examining Japan’s Hydrogen Strategy: Moving Beyond the “Hydrogen Society” Fantasy; Renewable Energy Institute: Tokyo, Japan, 2022. [Google Scholar]
- METI. Basic Hydrogen Strategy (Revised); METI: Tokyo, Japan, 2023. [Google Scholar]
- METI. Recent Trends in Energy and the Progress of Policies toward Energy Transition and Decarbonization. Available online: https://www.enecho.meti.go.jp/en/committee/council/basic_policy_subcommittee/pdf/data190701.pdf (accessed on 2 October 2022).
- Renewable Energy Institute. Revised Basic Hydrogen Strategy Offers No Clear Path to Carbon Neutrality; Renewable Energy Institute: London, UK, 2023. [Google Scholar]
- Nakano, J. Japan’s Hydrogen Industrial Strategy. Available online: https://www.csis.org/analysis/japans-hydrogen-industrial-strategy (accessed on 6 October 2022).
- METI. Tokyo “Beyond-Zero” Week 2021 Held. Available online: https://www.meti.go.jp/english/press/2021/1013_003.html (accessed on 27 May 2023).
- Japan Targets 1000 Hydrogen Stations by End of Decade. Available online: https://asia.nikkei.com/Economy/Japan-targets-1-000-hydrogen-stations-by-end-of-decade (accessed on 28 May 2023).
- METI. Japan’s Roadmap to “Beyond-Zero” Carbon. Available online: https://www.meti.go.jp/english/policy/energy_environment/global_warming/roadmap/innovation/thep.html (accessed on 4 October 2022).
- Burandt, T. Analyzing the Necessity of Hydrogen Imports for Net-Zero Emission Scenarios in Japan. Appl. Energy 2021, 298, 117265. [Google Scholar] [CrossRef]
- Ishimoto, Y.; Kurosawa, A.; Sasakura, M.; Sakata, K. Significance of CO2-Free Hydrogen Globally and for Japan Using a Long-Term Global Energy System Analysis. Int. J. Hydrogen Energy 2017, 42, 13357–13367. [Google Scholar] [CrossRef]
- Ozawa, A.; Kudoh, Y.; Murata, A.; Honda, T.; Saita, I.; Takagi, H. Hydrogen in Low-Carbon Energy Systems in Japan by 2050: The Uncertainties of Technology Development and Implementation. Int. J. Hydrogen Energy 2018, 43, 18083–18094. [Google Scholar] [CrossRef]
- Sugiyama, M.; Fujimori, S.; Wada, K.; Endo, S.; Fujii, Y.; Komiyama, R.; Kato, E.; Kurosawa, A.; Matsuo, Y.; Oshiro, K.; et al. Japan’s Long-Term Climate Mitigation Policy: Multi-Model Assessment and Sectoral Challenges. Energy 2019, 167, 1120–1131. [Google Scholar] [CrossRef]
- Mercure, J.-F.; Knobloch, F.; Pollitt, H.; Paroussos, L.; Scrieciu, S.S.; Lewney, R. Modelling Innovation and the Macroeconomics of Low-Carbon Transitions: Theory, Perspectives and Practical Use. Clim. Policy 2019, 19, 1019–1037. [Google Scholar] [CrossRef]
- Pollitt, H.; Mercure, J.-F. The Role of Money and the Financial Sector in Energy-Economy Models Used for Assessing Climate and Energy Policy. Clim. Policy 2018, 18, 184–197. [Google Scholar] [CrossRef]
- Cambridge Econometrics. E3ME Model Manual; Cambridge Econometrics: Cambridge, UK; Available online: www.e3me.com (accessed on 21 October 2022).
- Nakicenovic, N. The Automobile Road to Technological Change: Diffusion of the Automobile as a Process of Technological Substitution. Technol. Forecast. Soc. Chang. 1986, 29, 309–340. [Google Scholar] [CrossRef]
- Mercure, J.F. FTT: Power A Global Model of the Power Sector with Induced Technological Change and Natural Resource Depletion. Energy Policy 2012, 48, 799–811. [Google Scholar] [CrossRef]
- Mercure, J.-F. An Age Structured Demographic Theory of Technological Change. J. Evol. Econ. 2015, 25, 787–820. [Google Scholar] [CrossRef]
- Grubb, M.; Drummond, P.; Mercure, J.-F.; Hepburn, C. The New Economics of Innovation and Transition: Evaluating Opportunities and Risks. Available online: https://eeist.co.uk/eeist-reports/the-new-economics-of-innovation-and-transition-evaluating-opportunities-and-risks/ (accessed on 26 February 2022).
- Barbrook-Johnson, P.; Sharpe, S.; Pasqualino, R.; De Moura, F.S.; Nijsse, F.; Vercoulen, P.; Clark, A.; Peñasco, C.; Anadon, L.D.; Mercure, J.-F.; et al. New Economic Models of Energy Innovation and Transition: Addressing New Questions and Providing Better Answers. Available online: https://eeist.co.uk/eeist-reports/new-economic-models-of-energy-innovation-and-transition/ (accessed on 2 June 2023).
- CE Delft Jobs from Investment in Green Hydrogen. Available online: https://cedelft.eu/wp-content/uploads/sites/2/2021/04/CE_Delft_200427_Jobs_from_investment_in_green_hydrogen_Def.pdf (accessed on 1 April 2023).
- Capros, P.; De Vita, A.; Kannavou, M.; Fotiou, T.; Siskos, P.; Tsiropoulos, I.; Katoufa, N.; Mitsios, I.; Evangelopoulou, S.; Asimakopoulou, G.; et al. EU Reference Scenario 2020: Energy, Transport and GHG Emissions—Trends to 2050; European Commission: Brussels, Belgium, 2021. [Google Scholar]
- IEEJ. IEEJ Outlook 2021. Available online: https://eneken.ieej.or.jp/whatsnew_op/201016teireiken.html (accessed on 22 October 2022).
- Kato, S.; Lee, S.; He, Y.; Yoshioka, T.; Morotomi, T.; Chewpreecha, U. Study on Economic and Industrial Impact by 2050 Carbon Neutral in Japan, Assuming GHG Reduction Target and Power Supply Composition in 2030. Anal. Using E3ME Macro Econom. Mode Res. Proj. Renew. Energy Econ. Kyoto Univ. 2022, 43, 1–28. [Google Scholar]
- METI. Strategic Energy Plan. Available online: https://www.enecho.meti.go.jp/category/others/basic_plan/pdf/strategic_energy_plan.pdf (accessed on 18 February 2023).
- International Energy Agency Hydrogen Projects Database. Available online: https://www.iea.org/data-and-statistics/data-product/hydrogen-projects-database#license (accessed on 27 January 2023).
- International Energy Agency Global Hydrogen Review 2021. Available online: https://www.iea.org/reports/global-hydrogen-review-2021 (accessed on 11 April 2023).
- Ortiz Cebolla, R.; Dolci, F.; Weidner Ronnefeld, E. Assessment of Hydrogen Delivery Options. 2022. Available online: https://publications.jrc.ec.europa.eu/repository/handle/JRC130442 (accessed on 23 September 2023).
- Lam, A.; Mercure, J.F. Which Policy Mixes Are Best for Decarbonising Passenger Cars? Simulating Interactions among Taxes, Subsidies and Regulations for the United Kingdom, the United States, Japan, China, and India. Energy Res. Soc. Sci. 2021, 75, 101951. [Google Scholar] [CrossRef]
- Mercure, J.-F.; Salas, P.; Vercoulen, P.; Semieniuk, G.; Lam, A.; Pollitt, H.; Holden, P.B.; Vakilifard, N.; Chewpreecha, U.; Edwards, N.R.; et al. Reframing Incentives for Climate Policy Action. Nat. Energy 2021, 6, 1133–1143. [Google Scholar] [CrossRef]
- Odenweller, A.; Ueckerdt, F.; Nemet, G.F.; Jensterle, M.; Luderer, G. Probabilistic Feasibility Space of Scaling up Green Hydrogen Supply. Nat. Energy 2022, 7, 854–865. [Google Scholar] [CrossRef]


| 2018 | 2030 | 2040 | 2050 | |
|---|---|---|---|---|
| GDP (USD billion, 2015 prices) | 4485 | 4850 | 5242 | 5611 |
| Final energy consumption (Mtoe) | 283 | 263 | 244 | 224 |
| Power generation (TWh) | 1050 | 1079 | 1093 | 1082 |
| Coal-fired | 339 | 291 | 289 | 262 |
| Oil-fired | 52 | 21 | 2.0 | - |
| LNG-fired | 378 | 329 | 330 | 288 |
| Nuclear | 65 | 157 | 141 | 141 |
| Hydroelectric | 81 | 91 | 94 | 94 |
| Geothermal | 2.5 | 6.0 | 9.7 | 13 |
| Solar | 63 | 87 | 106 | 123 |
| Wind | 7.5 | 18 | 32 | 64 |
| Biomass Waste | 44 | 60 | 70 | 78 |
| CO2 emissions (million tons) | 1081 | 940 | 852 | 738 |
| Policy/Setting | Sectors | Description |
|---|---|---|
| Carbon tax (from 2021 onward) | All sectors | Carbon tax gradually increasing from USD 50/tCO2 in 2023 to reach USD 410/tCO2 in 2040 (2010 prices), and constant thereafter. |
| Government power mix plan | Power | Government power mix plan of 2030 and 2050. |
| Kick-start for BECCS and hydrogen | Power | A program to support BECCS and hydrogen plants by setting up a small-size demonstration plant in the first few years. |
| Hydrogen or ammonia blending in coal and gas power plants | Power | From 2025 a mix of fossil fuels and ammonia or hydrogen is used in fossil-fueled power plants. The blending percentage grows to 25% by 2050. |
| Ban on petrol and diesel engines by regulation | Road transport | Ban sales from 2035 onward. |
| Biofuel mandate | Freight and air transport | Increase the share of biofuels in the fuel mix. |
| ZEV subsidies for LDV | Passenger road transport | Subsidies given to EVs and FCEVs in the first few years. Battery EV: USD 8000, 10,000, 12,000/veh for economy, medium, and luxury vehicles, respectively. Plug-in hybrid EV: USD 4000, 5000, 6000/veh for economy, medium, and luxury vehicles, respectively. Fuel cell EV: USD 24,000/veh for all classes. |
| ZEV subsidies for HDV | Freight road transport | Subsidies given to EVs and FCEVs in the first few years. USD 30,000/veh on small trucks and USD 60,000/veh on large freight trucks. |
| FCEV mandates for HDV | Freight road transport | Mandate to kick-start FCEV HDV in the system. 10% of all truck sales are mandated to be FCEV by 2030 and 20% by 2035. |
| Energy efficiency investment | Buildings and industry | Similar level of investment under the IEA Sustainable Development Scenario. |
| Coal, gas, and oil boiler regulations | Buildings | Gradual ban of fossil fuel boilers by 2050. |
| Steel sector | Steel | Regulation of blast furnaces to gradually reduce to zero by 2050. |
| Kick-start for H2-DR-EAF | Steel | A program to support H2-DR-EAF plants by setting up a small-size demonstration plant in the first few years |
| Support for low-carbon steelmaking | Steel | Subsidies on low-carbon steelmaking (hydrogen-based and steel recycling); 50% on the upfront investment costs of hydrogen-based steelmaking, 40% of hydrogen energy, and 25% of electricity costs. |
| Hydrogen use in other industries | Industry | Substitution towards hydrogen for process heating. In line with the METI’s strategy. |
| Processed emissions | Industry | Assume processed emission intensity reduced by 4% pa in the Net-Zero scenario. |
| Exogenous representation of hydrogen supply | Hydrogen supply | Based on targets set by METI, an exogenous pathway of hydrogen technologies is implemented. |
Disclaimer/Publisher’s Note: The statements, opinions and data contained in all publications are solely those of the individual author(s) and contributor(s) and not of MDPI and/or the editor(s). MDPI and/or the editor(s) disclaim responsibility for any injury to people or property resulting from any ideas, methods, instructions or products referred to in the content. |
© 2023 by the authors. Licensee MDPI, Basel, Switzerland. This article is an open access article distributed under the terms and conditions of the Creative Commons Attribution (CC BY) license (https://creativecommons.org/licenses/by/4.0/).
Share and Cite
Han, X.; Vercoulen, P.; Lee, S.; Lam, A.; Kato, S.; Morotomi, T. Policy Design for Diffusing Hydrogen Economy and Its Impact on the Japanese Economy for Carbon Neutrality by 2050: Analysis Using the E3ME-FTT Model. Energies 2023, 16, 7392. https://doi.org/10.3390/en16217392
Han X, Vercoulen P, Lee S, Lam A, Kato S, Morotomi T. Policy Design for Diffusing Hydrogen Economy and Its Impact on the Japanese Economy for Carbon Neutrality by 2050: Analysis Using the E3ME-FTT Model. Energies. 2023; 16(21):7392. https://doi.org/10.3390/en16217392
Chicago/Turabian StyleHan, Xu, Pim Vercoulen, Soocheol Lee, Aileen Lam, Shinya Kato, and Toru Morotomi. 2023. "Policy Design for Diffusing Hydrogen Economy and Its Impact on the Japanese Economy for Carbon Neutrality by 2050: Analysis Using the E3ME-FTT Model" Energies 16, no. 21: 7392. https://doi.org/10.3390/en16217392