Abstract
In this study, a performance assessment and analysis of a 1 MW three-phase photovoltaic (PV) power station connected to the electrical grid of a factory in Morocco are presented. The main objective of this research is to assess the performance of the PV power station and analyze its efficiency, energy generation, and operational characteristics. To accomplish this, a combination of field measurements, data analysis, and simulation techniques are used. The study begins by providing an extensive overview of the PV power station, including a thorough description of its main elements such as solar panels, inverters, transformers, and grid interconnection infrastructure. Furthermore, field measurements are conducted to collect data on solar irradiance, ambient temperature, and PV system power, as well as electrical parameters such as voltage, current, and power factor. The findings of this study provide valuable insights into the performance and economic viability of the PV power station. These insights can serve as guidance for renewable energy stakeholders, investors, and policymakers, facilitating the development of sustainable solar energy projects and contributing to renewable energy targets.
1. Introduction
In 2009, Morocco adopted an energy strategy primarily centered on the utilization of renewable energy sources, enhancing energy efficiency, and bolstering regional integration. This comprehensive approach, implemented through specific programs and supported by pertinent legislative and institutional reforms, has proven its effectiveness and relevance. It has enabled Morocco to transition from a nation heavily reliant on foreign fossil fuels to becoming an energy producer from renewable sources.
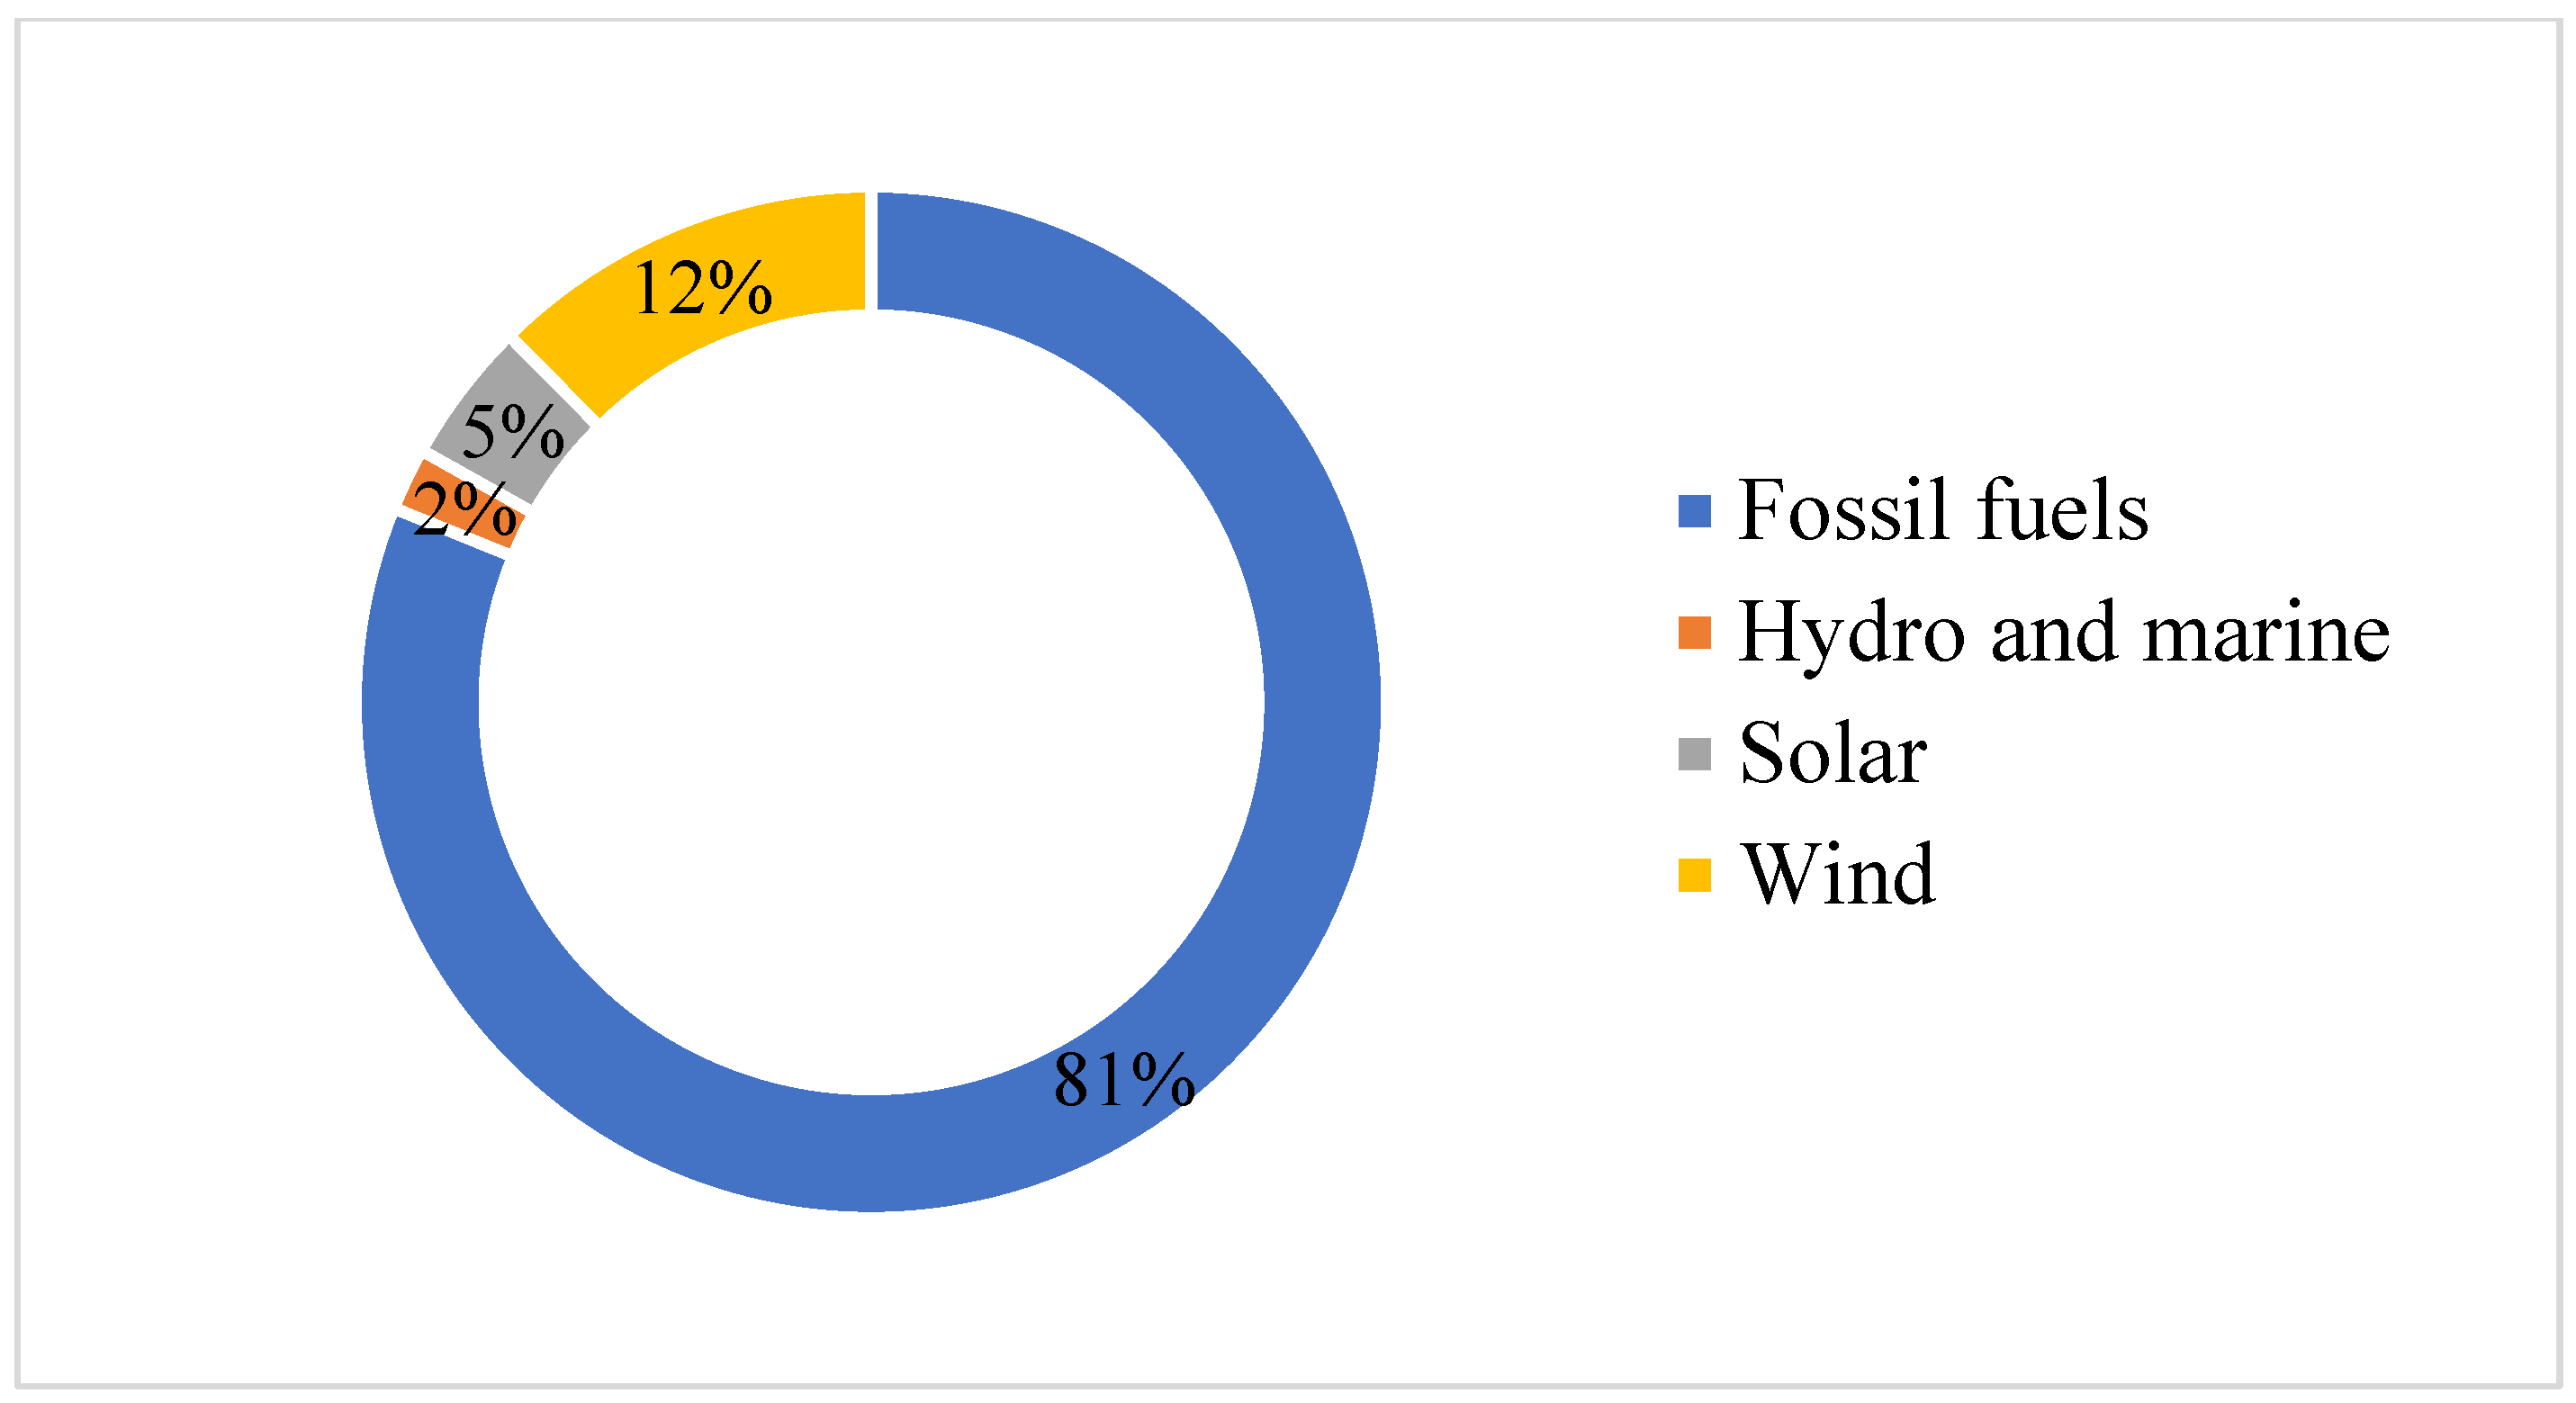
Figure 1 provides a visual representation of the energy production composition in Morocco for the year 2021. Historically, a significant portion of Morocco’s electricity was generated from fossil fuels such as oil, gas, and coal, amounting to approximately 41,343 GWh in 2021, with 19% now originating from renewable sources. Solar energy, especially photovoltaic (PV) solar energy, plays a central role in Morocco’s renewable energy initiatives and is poised to emerge as a leader in the renewable energy sector. Consequently, Morocco has outlined a clear strategy to achieve a 42% share of electricity production from renewable sources.
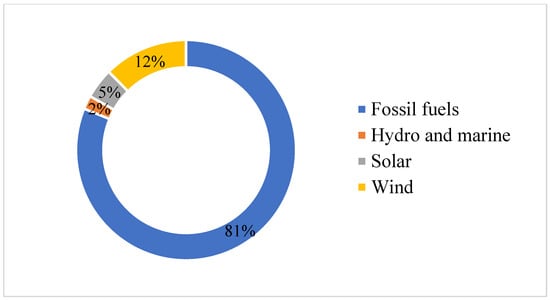
Figure 1.
Morocco’s electricity generation in 2021 [1].
In pursuit of this objective, Morocco is actively deploying numerous PV installations, as illustrated in Figure 2, showing the evolution of installed solar power capacities from 2015 to 2021, with a percentage increase reaching up to 80%. These installations are notably concentrated in five key locations: Ouarzazate, Ain Bni Mathar, Foum Al Oued, Boujdour, and Sebkhat Tah. Furthermore, Morocco has set its sights on achieving a planned 52% electricity production from renewable sources by 2030. This strategic approach will reduce energy dependency, promote environmental conservation through the limitation of greenhouse gas emissions, and contribute to the global effort to combat climate change, aligning with commitments made in 2015.
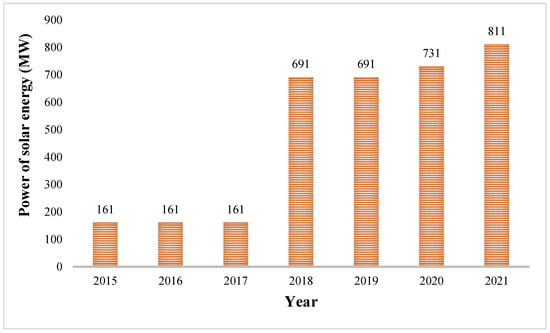
Figure 2.
Evolution of installed power of solar energy in 2021 (MW) [2].
Morocco’s considerable solar energy potential, with approximately 300 sunny days per year and an average annual global solar radiation of 2600 kWh/m2/year, are pivotal factors in meeting investor expectations regarding system performance and economic returns. It is evident that photovoltaic solar energy will emerge as a major future source of electricity production in Morocco, given its favorable climatic conditions and solar potential.
The performance of a grid-connected photovoltaic system relies on a balanced combination of technological factors such as solar cell technology, inverters, and system configuration, as well as meteorological parameters, including global solar irradiance, ambient temperature, and losses in the soil. For instance, research efforts, have scrutinized the performance of photovoltaic systems by comparing various photovoltaic technologies based on simulated energy production [3]. Furthermore, studies have examined the experimental behavior of two commonly used photovoltaic module technologies, namely, monocrystalline silicon (m-Si) and polycrystalline silicon (p-Si) [4].
A study closely monitored the performance of four rooftop grid-connected photovoltaic systems in Abu Dhabi, United Arab Emirates (UAE), over the course of one year. Their findings provide valuable insights into the comparative performance of different photovoltaic technologies. They concluded that monocrystalline silicon cells consistently outperformed polycrystalline silicon cells in terms of monthly average final yield, highlighting the advantages of monocrystalline silicon in this specific context [5]. This underscores the importance of making informed choices regarding photovoltaic technology to optimize the performance of photovoltaic systems, depending on geographical and environmental conditions.
Several research studies have thoroughly examined the performance parameters of photovoltaic power plants installed in different geographical regions and under various climatic conditions [6]. Respected researchers have also made significant advancements in the field of modeling for solar thermal, photovoltaic, and solar radiation [7,8,9,10].
It is imperative to determine optimal system configurations to maximize the performance of photovoltaic systems [11]. Additionally, it is worth noting that the performance of these systems tends to degrade gradually over time, underscoring the importance of continuous performance monitoring and the implementation of strategies to enhance energy yields. Finally, monitoring and evaluating the performance of existing photovoltaic systems remain crucial for assessing the potential for photovoltaic energy production in a given region.
It is also relevant to mention that the evaluation of photovoltaic system performance typically relies on standard test conditions (STCs), which do not comprehensively reflect the real-world operation of modules. Degradation, aging, environmental factors, design, and installation configurations all significantly impact the long-term performance of solar panels. In this regard, numerous studies conducted worldwide have examined the performance of photovoltaic solar systems [12,13]. These analyses are critically important for monitoring the performance of installed systems and serve as the foundation for continuous technological improvement.
This research focuses on a 1 MW three-phase photovoltaic power station installed at a factory in Morocco. The goal is to assess its performance and efficiency, analyze its operational characteristics, and evaluate its energy generation capabilities. This comprehensive study involves field measurements, data analysis, and simulations to provide insights into the system’s reliability, effectiveness, and economic viability.
Field measurements will collect data on solar irradiance, ambient temperature, electrical parameters, and the PV system’s output. These data will be used to evaluate key performance metrics like energy yield, capacity factor, and overall efficiency. Data analysis will identify performance deviations and investigate contributing factors, such as module degradation, shading effects, and electrical losses, to optimize the system’s performance. Computer simulations using advanced PV modeling software will validate the measured data and explore various operational scenarios to enhance configuration and operation.
Our study is part of the broader context of the global transition to renewable energies. Morocco, with its abundance of untapped solar resources, plays a crucial role in this transition. Our goal is to explore how a photovoltaic plant operates in a specific environment, but it goes beyond a mere local analysis. The lessons learned from this study can be applied elsewhere in the world, thus contributing to the global effort to reduce carbon emissions. Drawing from this global renewable energy context that frames our study, and considering that Morocco has unique characteristics in terms of solar resources, climate, and energy policy, our study highlights the challenges the country faces and the solutions it has implemented to develop its photovoltaic sector. This makes it a revealing case study for other countries, especially those sharing geographical or environmental similarities. Furthermore, our work makes a significant contribution to the existing literature on solar energy. It introduces new performance models tailored to specific conditions, which can help researchers and practitioners better understand how to maximize the efficiency of photovoltaic plants in similar environments. Additionally, our analysis of real-world data from the field adds a crucial practical dimension to existing academic research, contributing to the global transition toward cleaner and more sustainable energy. And it is essential to note that our research has significant implications in terms of environmental and economic impact. By promoting the use of solar energy in Morocco, we contribute to reducing greenhouse gas emissions and moving toward energy independence, which can serve as a model for other regions of the world facing similar challenges.
2. Description of the Photovoltaic Power Plant
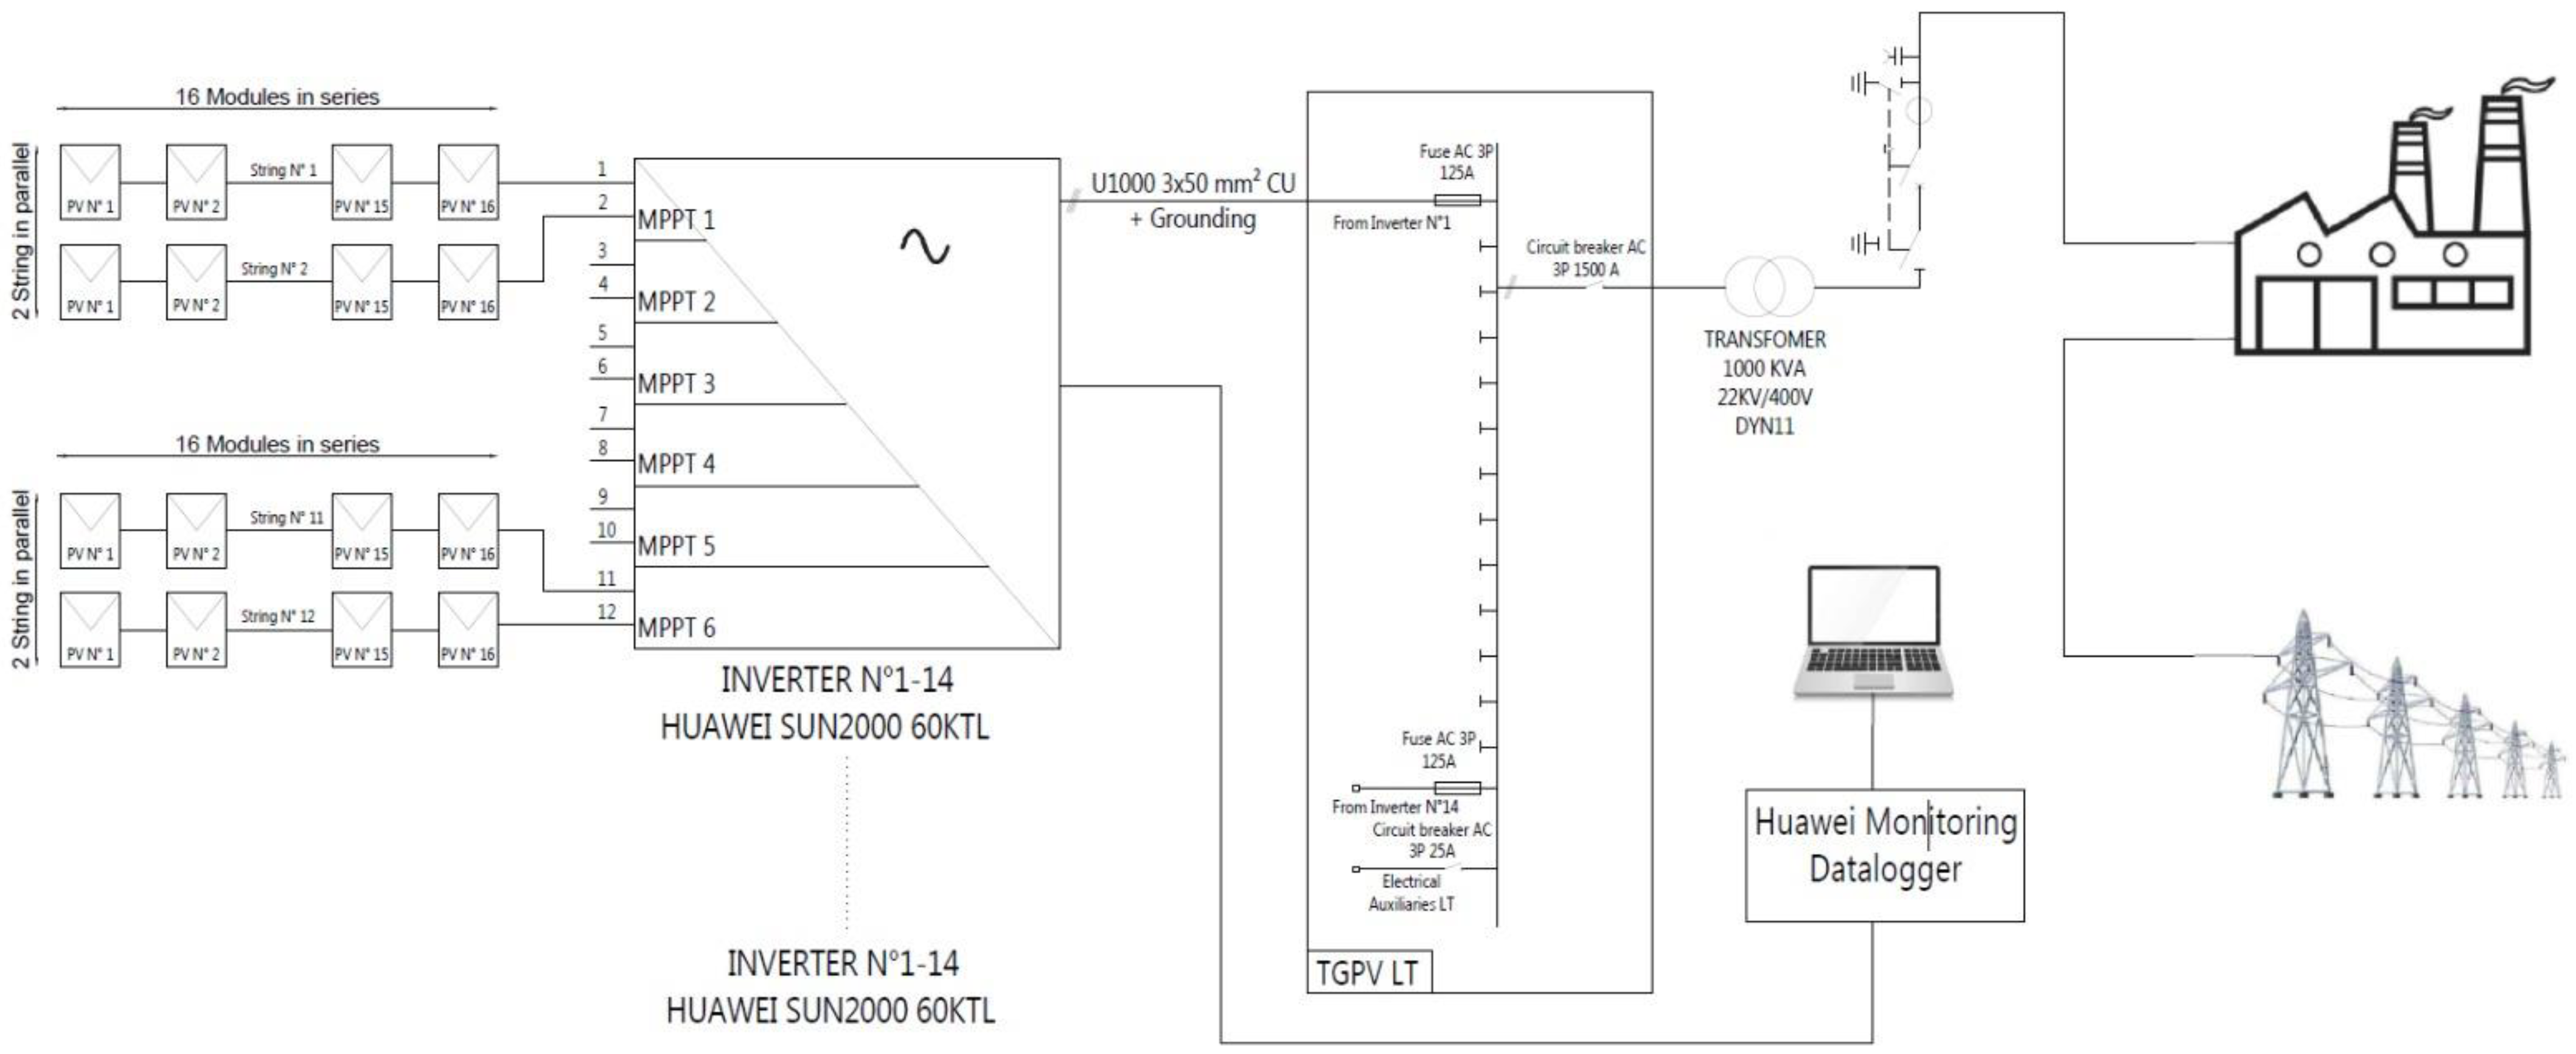
The grid-connected photovoltaic power plant comprises 2568 monocrystalline solar modules, each with a power rating of 390 W. The total installed capacity of the plant is 1001 kWp, covering an area of 5136 m2 and inclined at a 20° angle toward the south. The PV modules are arranged in two parallel strings, with 16 modules connected in series in each string. These strings are then connected to a Huawei inverter (Sun2000 60KTL).
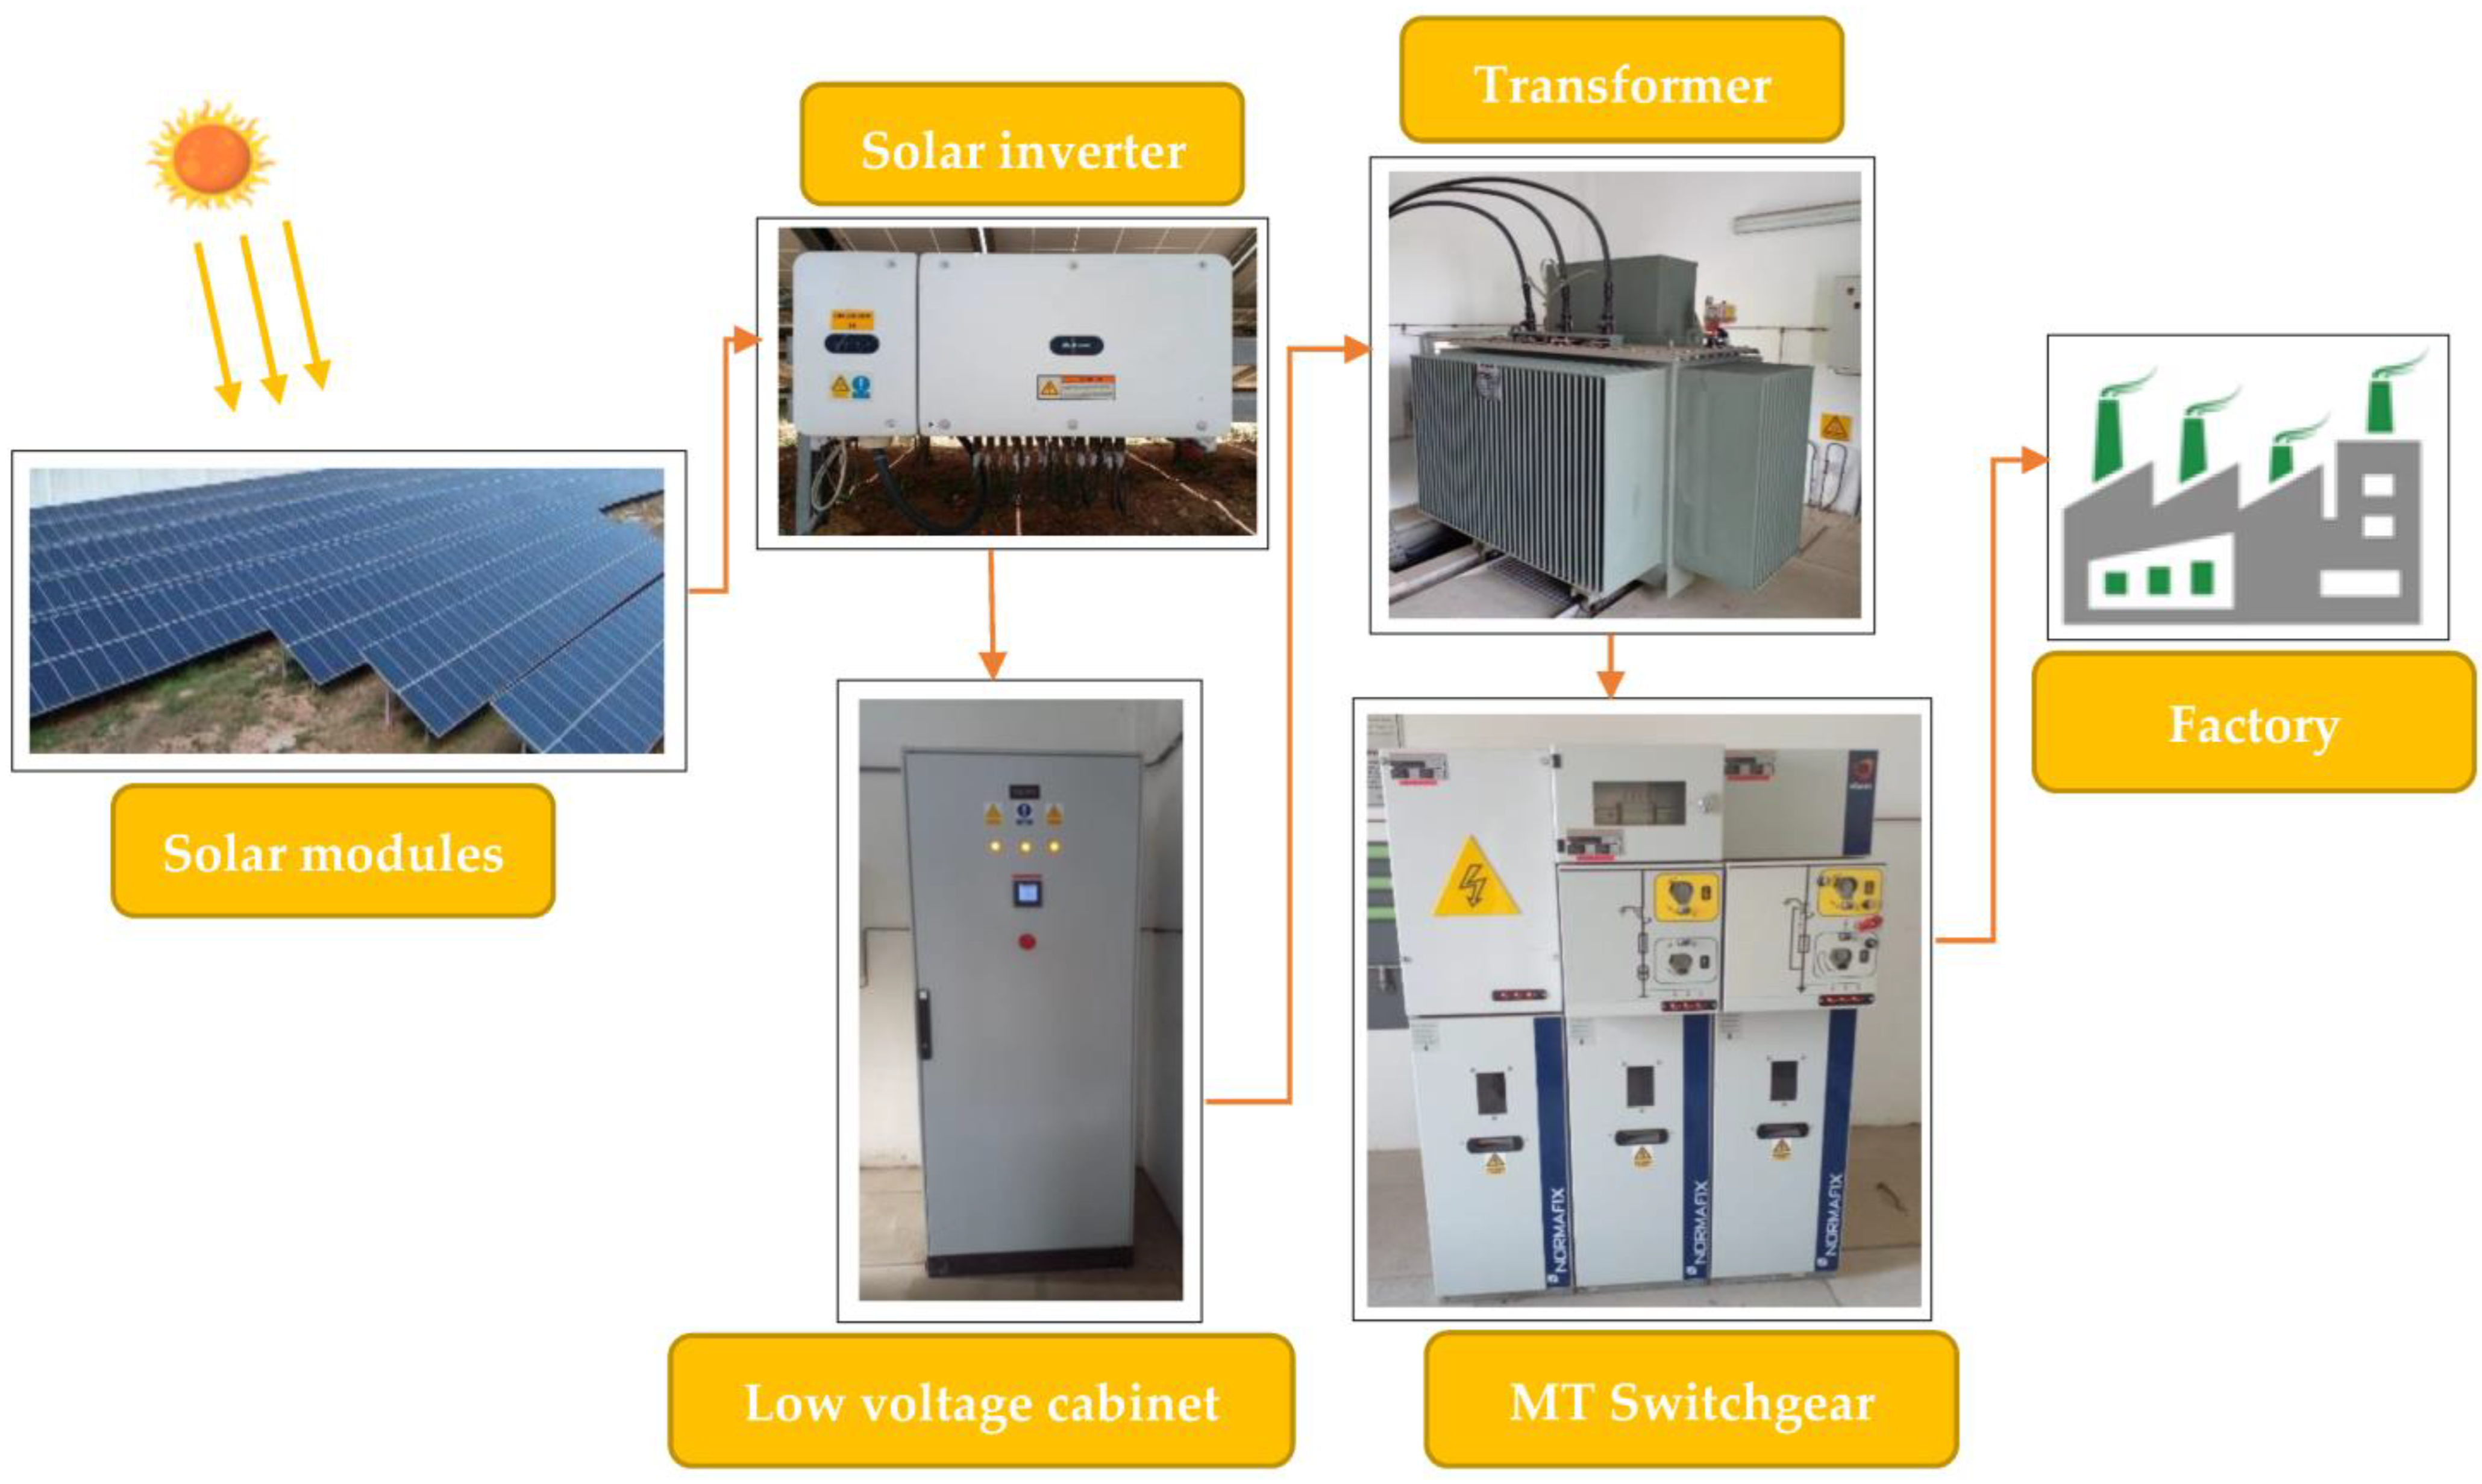
In this photovoltaic power plant, 14 inverters were used to supply the general low-voltage cabinet of the solar power plant, after a 1000 KVA transformer (22 KV/400 V) was connected with a solar power plant cell and the output of the cell to the plant power supply. Figure 3 illustrates a schematic diagram of our 1 MW solar power plant, highlighting the key electrical equipment of our solar installation.

Figure 3.
Schematic diagram of the 1 MW solar power plant.
It is important to note that this photovoltaic solar power plant is designed for self-consumption purposes. According to Moroccan law, self-consumption is permitted as long as it does not disrupt the local electricity supply plans. Therefore, the solar power plant will be connected to a supervision system that prevents the injection of excess energy into the National Office of Electricity’s electrical network.
Figure 4 displays an actual photograph of our 1001 kWc photovoltaic solar power plant in Morocco. We found that this plant consists of 2568 monocrystalline photovoltaic panels.
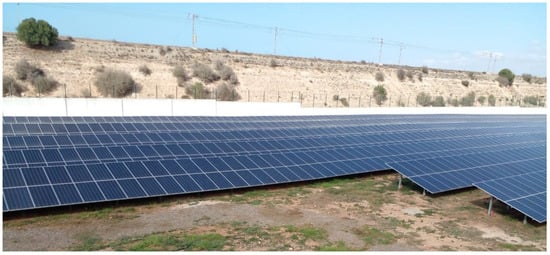
Figure 4.
Overview of the 1001 kWp photovoltaic solar power plant in Morocco.
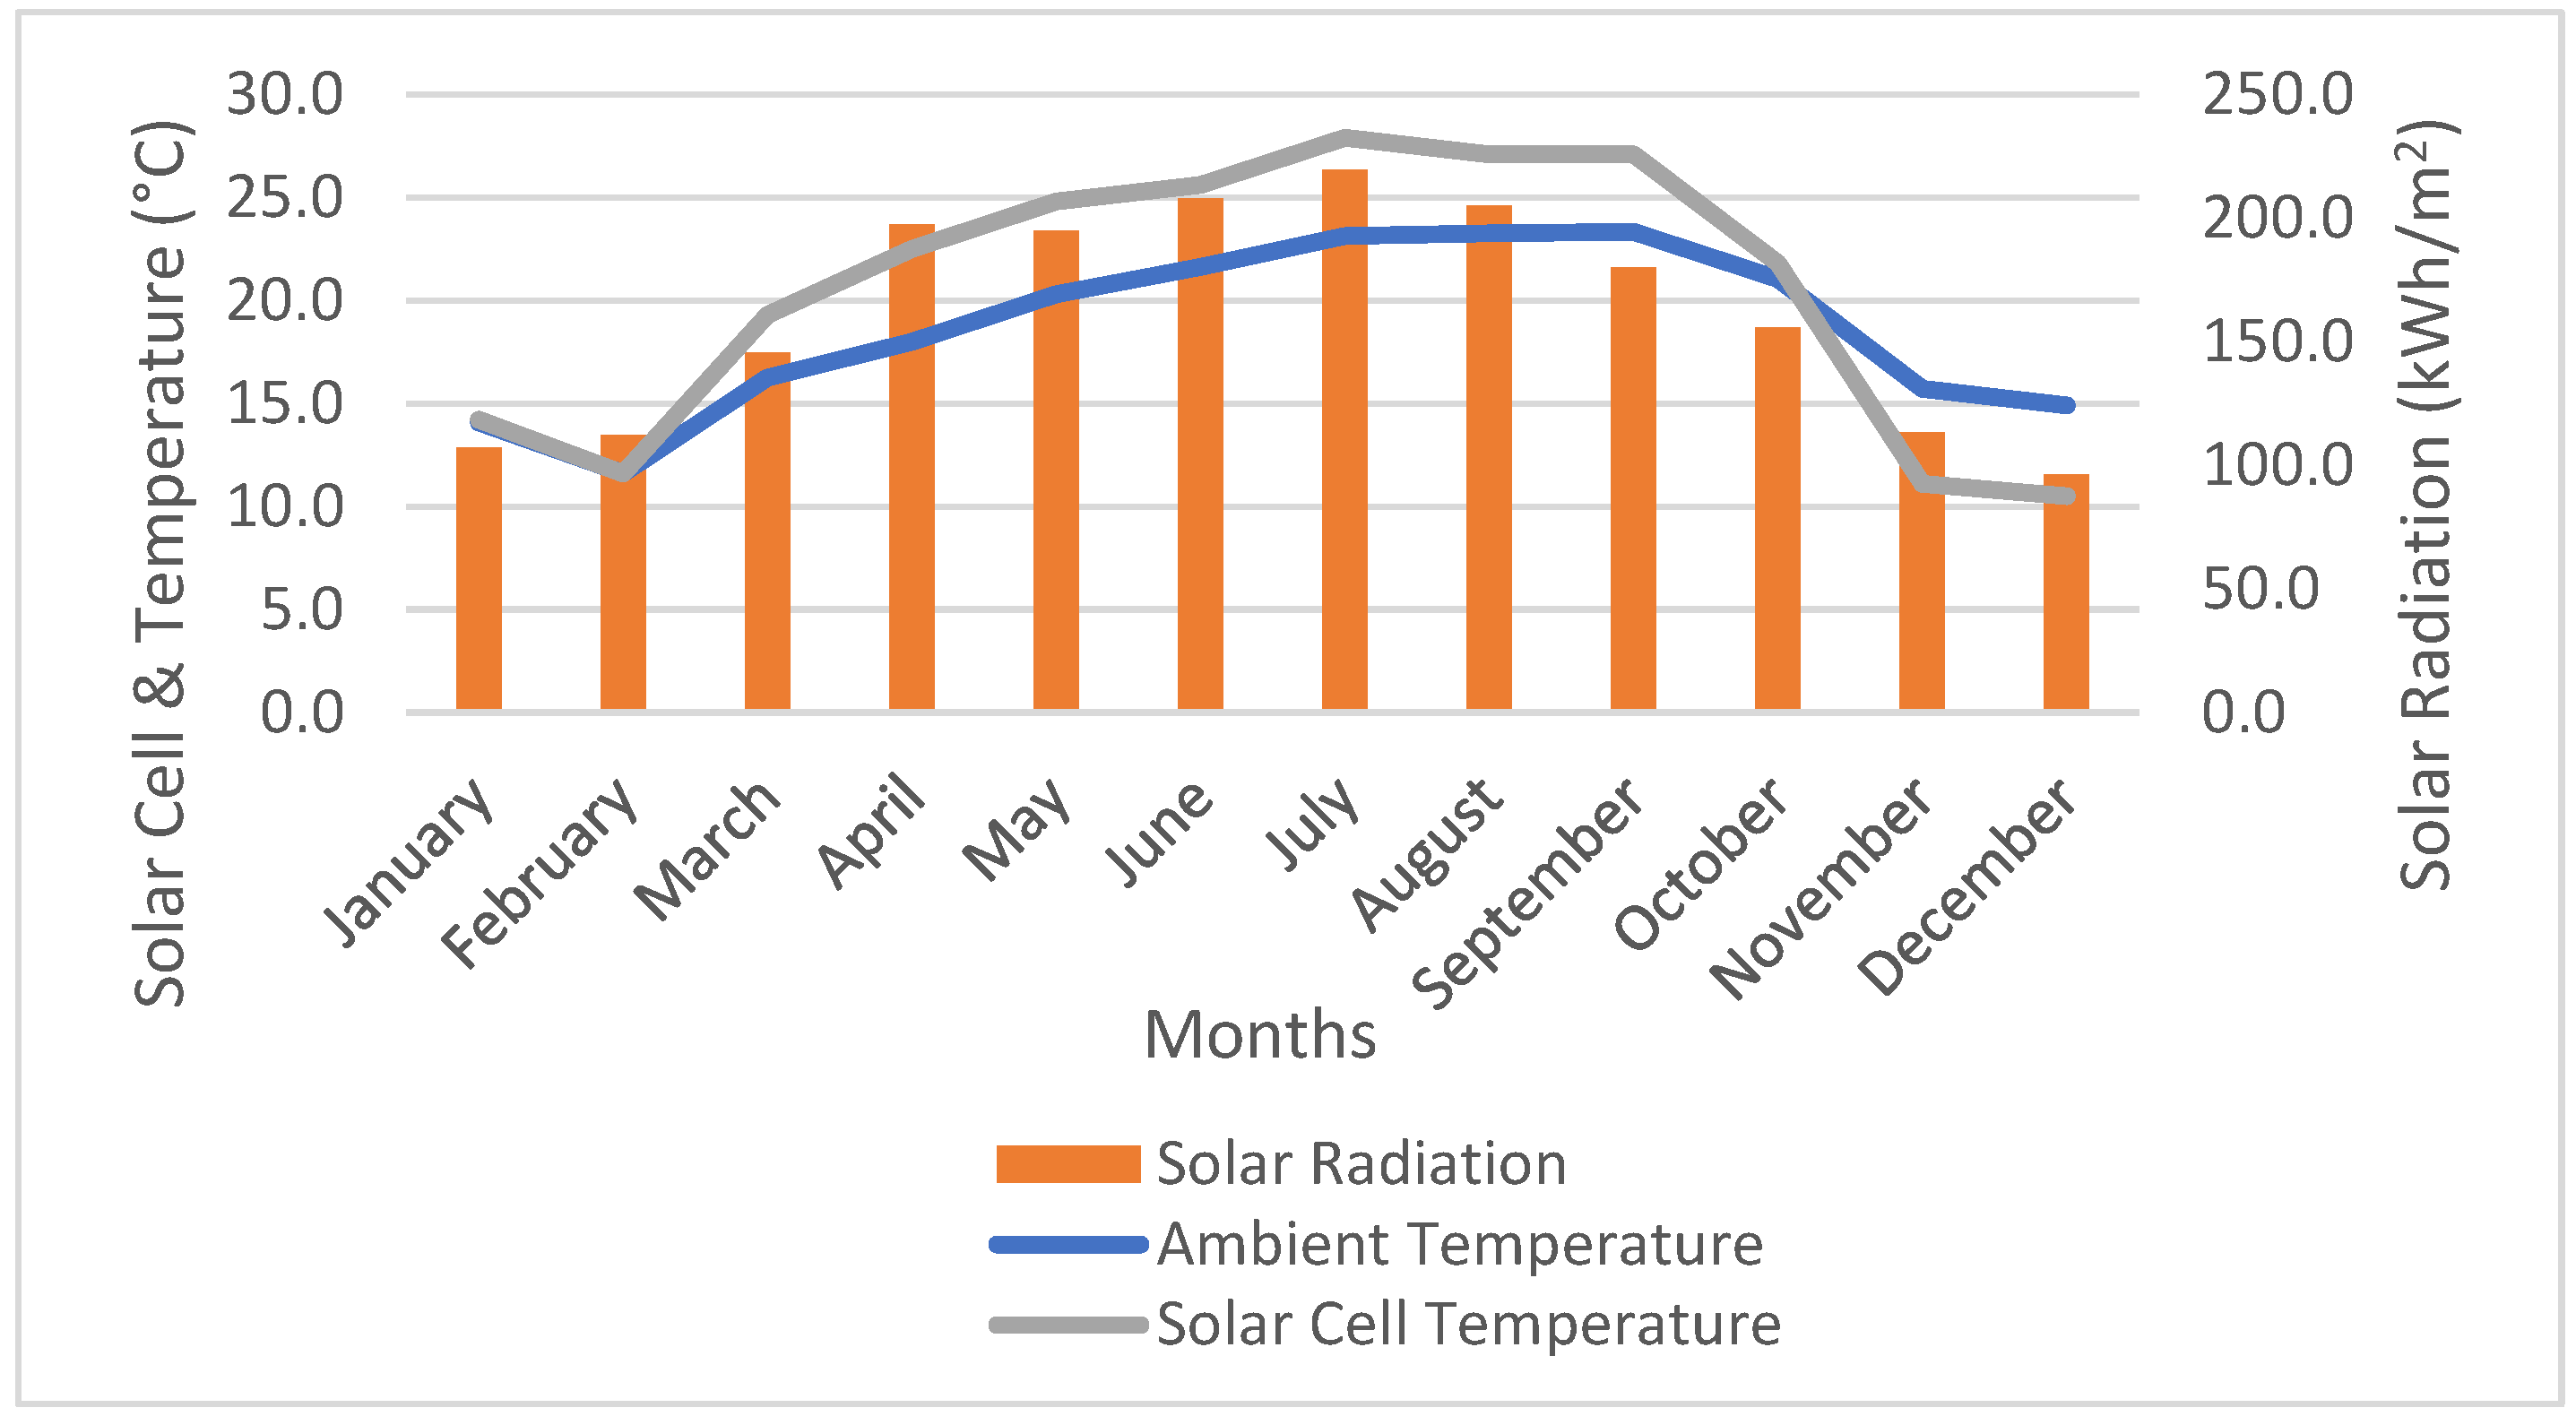
July and May stand out as the months with the highest energy production compared with June and April This significant difference can be attributed to the fact that the month of May, in particular, exhibits irradiance levels comparable to those of July, owing to the combination of high irradiance and cooler temperatures compared with the preceding months. The overall average temperature remains at 18.6 °C, while the average monthly ambient temperature varies from 14.91 °C in December to 28.05 °C in September. As for the temperature of the solar cells, it ranges from 10.5 °C in December to 27.9 °C in July, as illustrated in Figure 5.
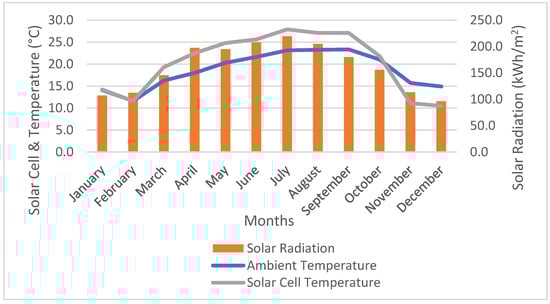
Figure 5.
Monthly mean radiation, average temperature of ambient air, and solar cell measured during 2022.
The total monthly energy production of the photovoltaic system during the monitoring period varies from 77,573 kWh in December to 176,941 kWh in May. The months of November, December, January, and February record relatively low levels of energy production. This decline can be attributed to a reduction in the number of sunlight hours due to an increase in cloudy days during this time of year, as well as high temperatures in August, as demonstrated in Figure 5. Additionally, losses related to the accumulation of dirt, resulting from dust deposition during the summer season and the absence of preventive maintenance, may have also contributed to this decrease. Finally, it is possible that climate changes and drought played a role in 2022.
3. Details of the Power Plant
3.1. Solar Panel Specification
The JAM72S01-390/PR solar panel is a specific model, as illustrated in Table 1 and Table 2, that possesses the following specifications:

Table 1.
Technical specification of the monocrystalline solar module cell [14].
Table 2.
The electrical parameters of a solar module measured under standardized conditions (solar irradiance of 1000 W/m2, cell temperature of 25 °C, and air mass of 1.5), and the operating conditions of a solar module refer to the environment in which the solar module is used and the parameters that affect its performance [14].
- Power output: The solar panel has a power rating of 390 watts (W), indicating the amount of electricity it can generate under standard test conditions.
- Maximum voltage: The panel is designed to operate at a maximum voltage of 1000 volts (V), which determines the upper limit of electrical potential it can handle.
- Efficiency: The efficiency of the JAM72S01-390/PR solar panel refers to its ability to convert sunlight into electricity. The exact efficiency rating for this specific model is not provided in the information provided.
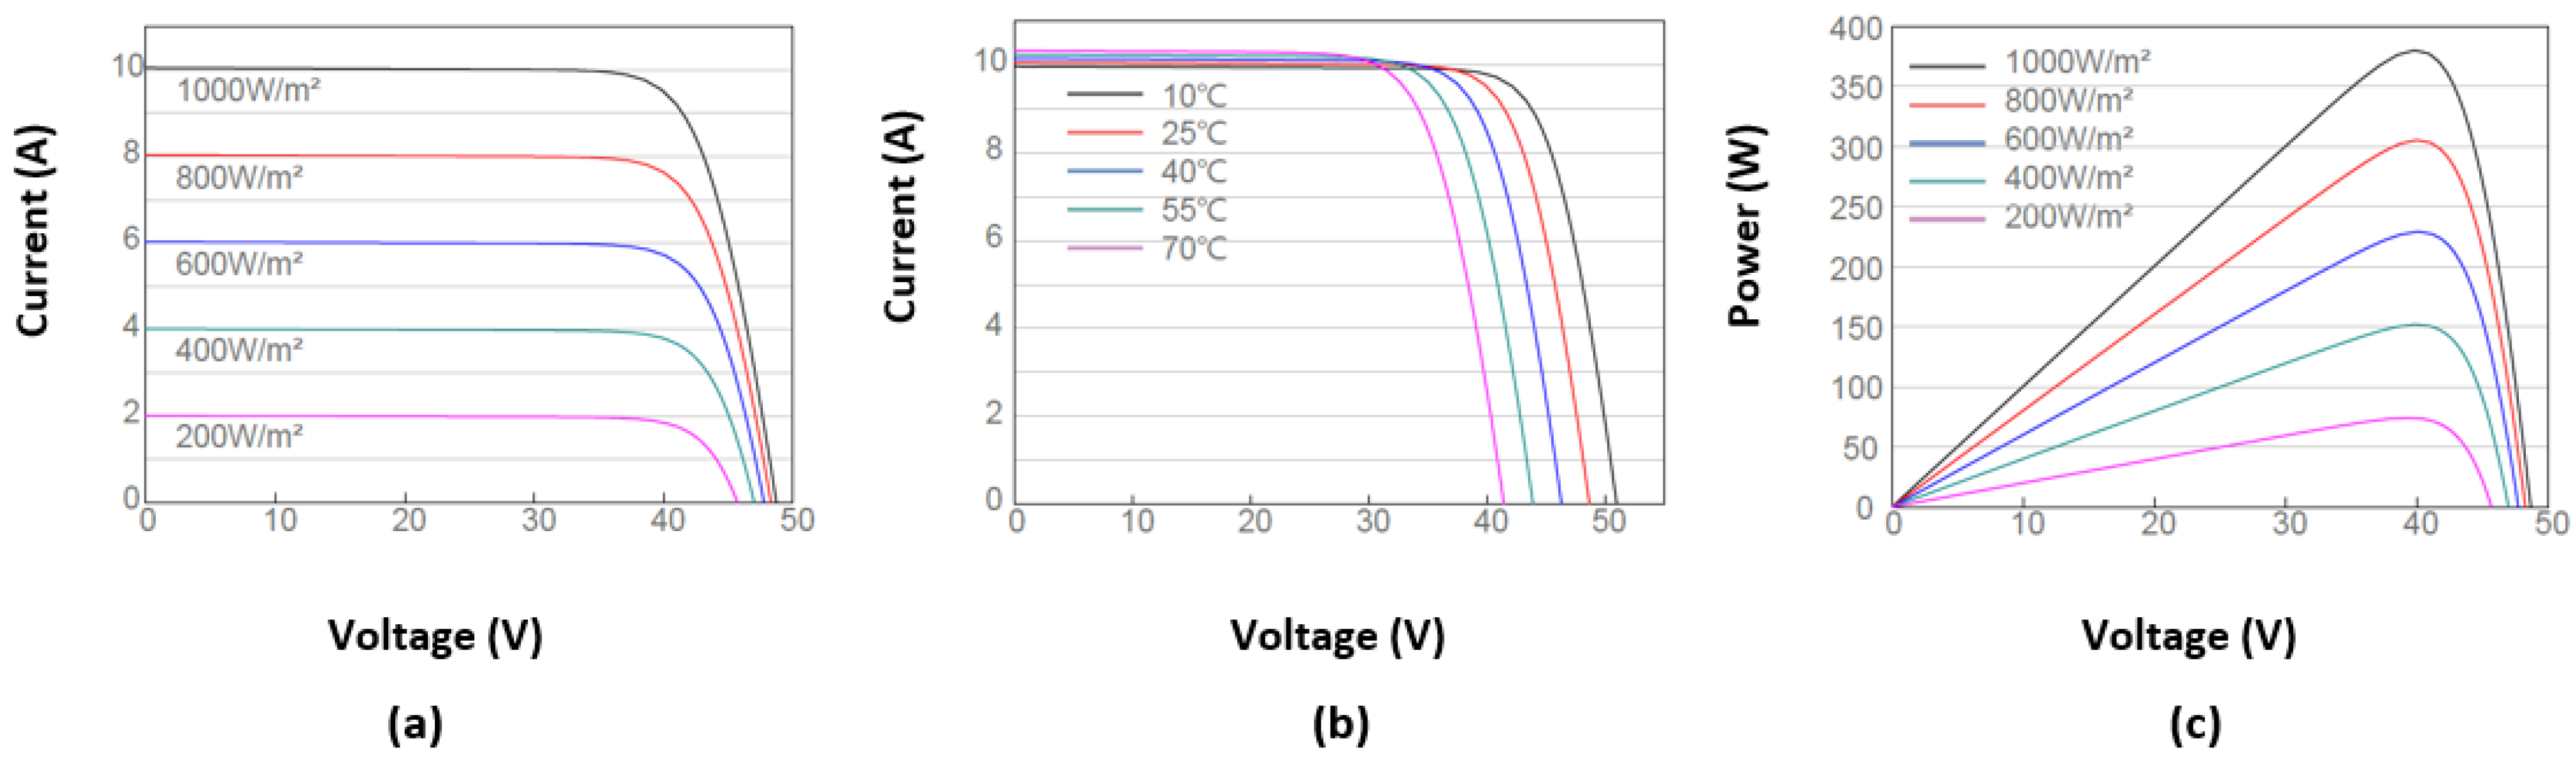
The energy input required for electron–hole separation is provided by light energy. Therefore, it is expected that an increase in illumination will automatically lead to an increase in the number of separated electron–hole pairs. The current generated is thus proportional to the level of sunlight. However, the voltage across the junction varies only slightly as it depends on the potential difference at the N-P junction of the material itself. The open-circuit voltage will only decrease slightly with increasing light intensity.
Figure 6a,c illustrate the effect of varying irradiance levels (200, 300, 400, 500, 600, 700, 800, 900, and 1000) W/m2 at a constant temperature (T = 25 °C) on the current–voltage characteristics and power–voltage characteristics, respectively. The output current and power of the PV system are proportional to the irradiance, while the open-circuit voltage changes slightly with varying irradiance levels.
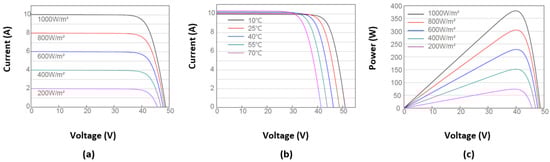
Figure 6.
(a) Effect of the irradiation on (current–voltage) PV characteristic of the PV module, (b) Effect of the temperature on (current–voltage) PV characteristic of the PV module. (c) Effect of the irradiation on (power–voltage) PV characteristic of the PV module [14].
Temperature is a crucial parameter in the operation of solar cells, as the electrical properties of a semiconductor are highly sensitive to temperature. It has a significant impact on the efficiency of a photovoltaic cell in general. The short-circuit current varies minimally with temperature, while the open-circuit voltage is much more affected (around −0.4%/K). Therefore, temperature has a significant influence on the efficiency of a photovoltaic cell, resulting in a power loss of approximately 9 to 15% for a temperature increase of 30 °C.
Figure 6b presents the simulation results for different temperature values (10 °C, 25 °C, 40 °C, 55 °C and 70 °C) at constant irradiation (G = 1000 W/m2) on the current–voltage characteristic. The current exhibits a gradual decrease with increasing temperature. Additionally, the graph also shows a decrease in the maximum voltage across the module.
3.2. Solar Inverter Specification
The SUN2000-60KTL-M0 is a specific model of a string inverter manufactured by Huawei. Here are some common specifications for the SUN2000-60KTL-M0:
- Power rating: The inverter has a power rating of 60 kilowatts (kW), which indicates the maximum AC power output it can deliver to the grid.
- Maximum DC voltage: The maximum DC voltage that the SUN2000-60KTL-M0 can handle is typically around 1100 volts (V).
- Efficiency: The inverter’s efficiency is a measure of its ability to convert DC power to AC power. The SUN2000-60KTL-M0 is known for its high efficiency, typically exceeding 98% under specific operating conditions.
- Input voltage range: The inverter has a wide input voltage range that allows it to accommodate different configurations of solar panels and string layouts.
- Monitoring and communication: The SUN2000-60KTL-M0 comes equipped with advanced monitoring and communication capabilities.
- Protection features: The inverter incorporates multiple protection features to ensure safe and reliable operation.
3.3. General Low-Voltage Cabinet of the Solar Power Plant
As per the scheduled installation plan, the general low-voltage cabinet of the solar power plant will be positioned within the transformer room of the solar power plant. At this phase, the incoming cables from the power plant will be linked to the fuse terminals, located upstream of the busbar, leading toward the main circuit breaker of the general low-voltage cabinet of the solar power plant, and then routed to the transformer inputs.
3.4. Transformer Specification
The specification “Energy Transfo 1000 kVA 22 kV/400 V DYN11” refers to a specific type of electrical transformer. Here are the key specifications:
- Power rating: The transformer has a power rating of 1000 kilovolt-amperes (kVA)
- Voltage transformation: The transformer is designed to transform voltage from a high voltage level of 22 kilovolts (kV) to a low voltage level of 400 volts (V).
- Phase configuration: The transformer follows a DYN11 phase configuration. DYN11 refers to Delta (Δ) primary winding and Y-connected (star) secondary winding, with an 11 o’clock phase shift. This configuration is commonly used in distribution transformers.
3.5. Technical Specification of Cells
The provided cells are designed for indoor installations and equipped with air insulation and SF6 breaking technology.
These cells are compliant with the specifications outlined in the following standards: IEC, NFC, and HN.
The composition of the cells includes:
- DC-type protection cell.
- TT-type counting cell.
- CIS-type transformer protection cell.
The electrical characteristics of the cells are shown in Table 3.
Table 3.
Electrical characteristics of the cells [15].
3.6. Data Monitoring Specification
The SmartLogger1000 is a specific model of a data logger and monitoring device commonly used in solar PV systems.
- Data acquisition: The SmartLogger1000 is designed to collect data from various components of a solar PV system, including inverters, string combiners, environmental sensors, and meters. It can gather information such as power generation, energy consumption, voltage, current, and environmental conditions.
- Communication interfaces: The data logger supports multiple communication interfaces for data transmission and integration. This may include Ethernet, RS485, and Modbus.
- Data storage and logging: The SmartLogger1000 is equipped with built-in storage capabilities to store collected data.
- Remote monitoring and control: The device enables remote monitoring and control of the solar PV system.
- Compatibility: The SmartLogger1000 is typically compatible with a range of solar PV system components.
- Data visualization and reporting: The data logger may offer data visualization tools and reporting features, enabling users to generate customized reports and analyze system performance trends over time.
Figure 7 illustrates the NetEco1000S solution is an energy management system designed for monitoring and managing energy consumption in data centers. It helps optimize energy efficiency, reduce costs, and improve overall operational performance. The solution provides real-time monitoring, analysis, and reporting of energy usage, allowing data center operators to make informed decisions and implement energy-saving measures.
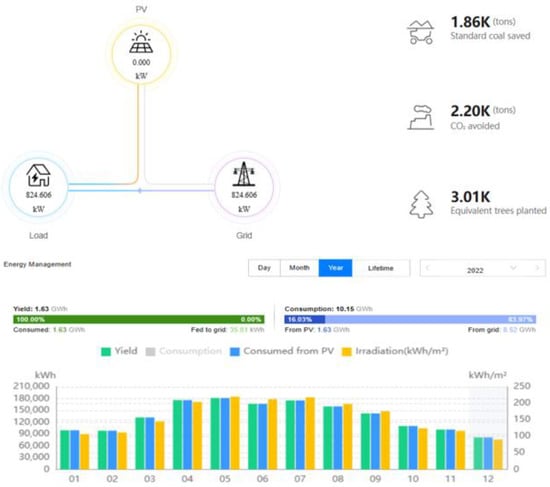
Figure 7.
The performance data of the solar station is monitored using the Huawei SmartLogger1000 app and the Fusion Solar portal NetEco1000S.
4. Parameters for Performance Analysis of the Photovoltaic Power Plant
When conducting a performance analysis of a photovoltaic (PV) power plant, several key parameters and metrics should be taken into consideration. The IEC 61724, known as “Photovoltaic System Performance Monitoring” and released by the International Electrotechnical Commission (IEC) [16], provides comprehensive guidelines for monitoring the performance of photovoltaic systems. These parameters include the reference yield (Yr), the yield of the PV array (Ya), the final yield of the PV system (Yf), the performance ratio (PR), the system losses (Ls), and the miscellaneous losses (Lc). Using these parameters, one can assess the overall performance of the system concerning energy production, solar resources, and the overall impact of photovoltaic system losses.
Figure 8 depicts a schematic block circuit diagram of the photovoltaic system, while Table 4 provides the technical data of the PV module.
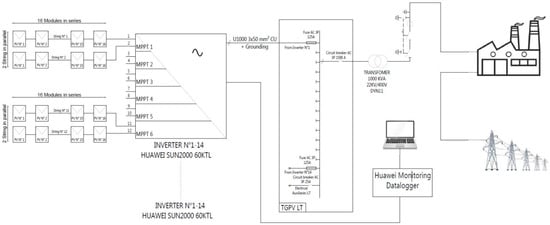
Figure 8.
Diagram of the photovoltaic solar power plant.
Table 4.
Plant specifications.
4.1. Energy Output:
The energy output is characterized as the amount of alternating current (AC) produced by the system within a specific time frame. The system’s generated energy can be calculated using the equations provided below, covering intervals from hourly to annual [17,18].
The energy produced at a specific moment is denoted as , while , , , and represent the energy generated on an hourly, daily, monthly, and yearly basis, respectively. Additionally, N and P represent the number of days in a month and a year.
4.2. Yield of the PV Array: Ya
The yield of the PV array is defined as the ratio between the total energy generated (kWh) by the PV arrays for a defined period (day, month, or year) and the nominal power (kWp) of the arrays under standard conditions (STCs: irradiation: 1000 W/m2, 25 °C ambient temperature, and reference spectrum AM 1.5-G) [19,20].
4.3. Final Yield of the PV System: Yf
The final yield corresponds to the total energy produced by the PV system, (kWh) compared to the nominal installed power (kWp). This quantity represents the number of hours the PV array should operate at its rated power [21,22,23,24].
4.4. The Reference Yield: Yr
The reference yield is the ratio between the total quantity of solar radiation (kWh/m2) arriving at the surface of the PV solar panels and the quantity of reference radiation (1 kW/m2). This parameter represents the number of hours during which the illumination is equal to that of reference, where Yr defines the solar resource for the PV system [25].
4.5. Performance Ratio: PR
The performance ratio (PR) indicates the overall effect of losses on the energy production of the rows of a PV system. PR values indicate how close a PV system is to ideal performance under actual operating conditions. (PR) is defined by the ratio between the final yield and the reference yield and is given as [26,27]:
4.6. Total Losses across the Entire System: LT
We compute the aggregate losses within the entire PV system. The cumulative collection losses, denoted as , encompass losses associated with various aspects of the solar PV system, including PV array inefficiencies arising from solar PV conversion, wiring, thermal issues, module quality, shading, mismatch, dirt, regulation, MPPT, and other environmental factors. In numerical terms, signifies the variance between the final yield and the reference yield. This relationship is mathematically expressed in the equation [21]:
4.7. System Losses by Conversion: Ls
The losses of the LS system are due to the losses by conversion of the inverters (DC–AC), and they are defined by the difference between the yield of the PV array (Ya) and the final yield (Yf) [20].
4.8. Array Capture Losses: Lc
Miscellaneous losses Lc are defined by the difference between the reference yield and the yield of the PV array. They represent losses due to panel temperature, wiring, partial shading, spectral losses, soiling, errors in finding the maximum power point, conversions (DC–AC), etc. [28].
4.9. Capacity Factor: CF
Finally, the load factor (CF) is defined as the ratio of the actual annual energy production to the amount of energy generated by the solar photovoltaic power plant if it operated at maximum rated power () for 24 h per day for a year [29].
4.10. PV Array Efficiency:
The efficiency of the photovoltaic field is the ratio of the total energy generated by the PV arrays () to the product of the amount of irradiation on the plane of the panels and the global surface of the photovoltaic field [30,31,32].
4.11. Efficiency of the PV System:
The efficiency of the PV system is the ratio of the total energy generated by the PV system () to the product of the amount of irradiation on the plane of the panels and the overall surface of the photovoltaic field [33].
4.12. Efficiency of the Photovoltaic Inverter:
Inverter efficiency is the ratio of the total energy generated by the PV system to the total energy generated by the PV arrays [27,34,35].
4.13. Thermographic Analysis of Photovoltaic Panels
Thermographic assessment requires the use of infrared thermal cameras to examine the temperature distribution across a solar panel. Analyzing the temperature distribution on a solar cell can provide an accurate description of the panel’s condition. Since the temperature coefficient of the power peak for solar modules is negative, it becomes crucial to monitor the temperature distribution to assess the energy performance of the panels. Although visual inspection may be used at times, there are defects that can only be detected using thermal cameras, such as:
- Delamination due to external damage;
- Defective individual cells, and hotspots;
- Ingress of dirt or moisture;
- Damaged sub-chains;
- Cracked cells;
- Glass cracks;
- Short circuits;
- Loose contacts.
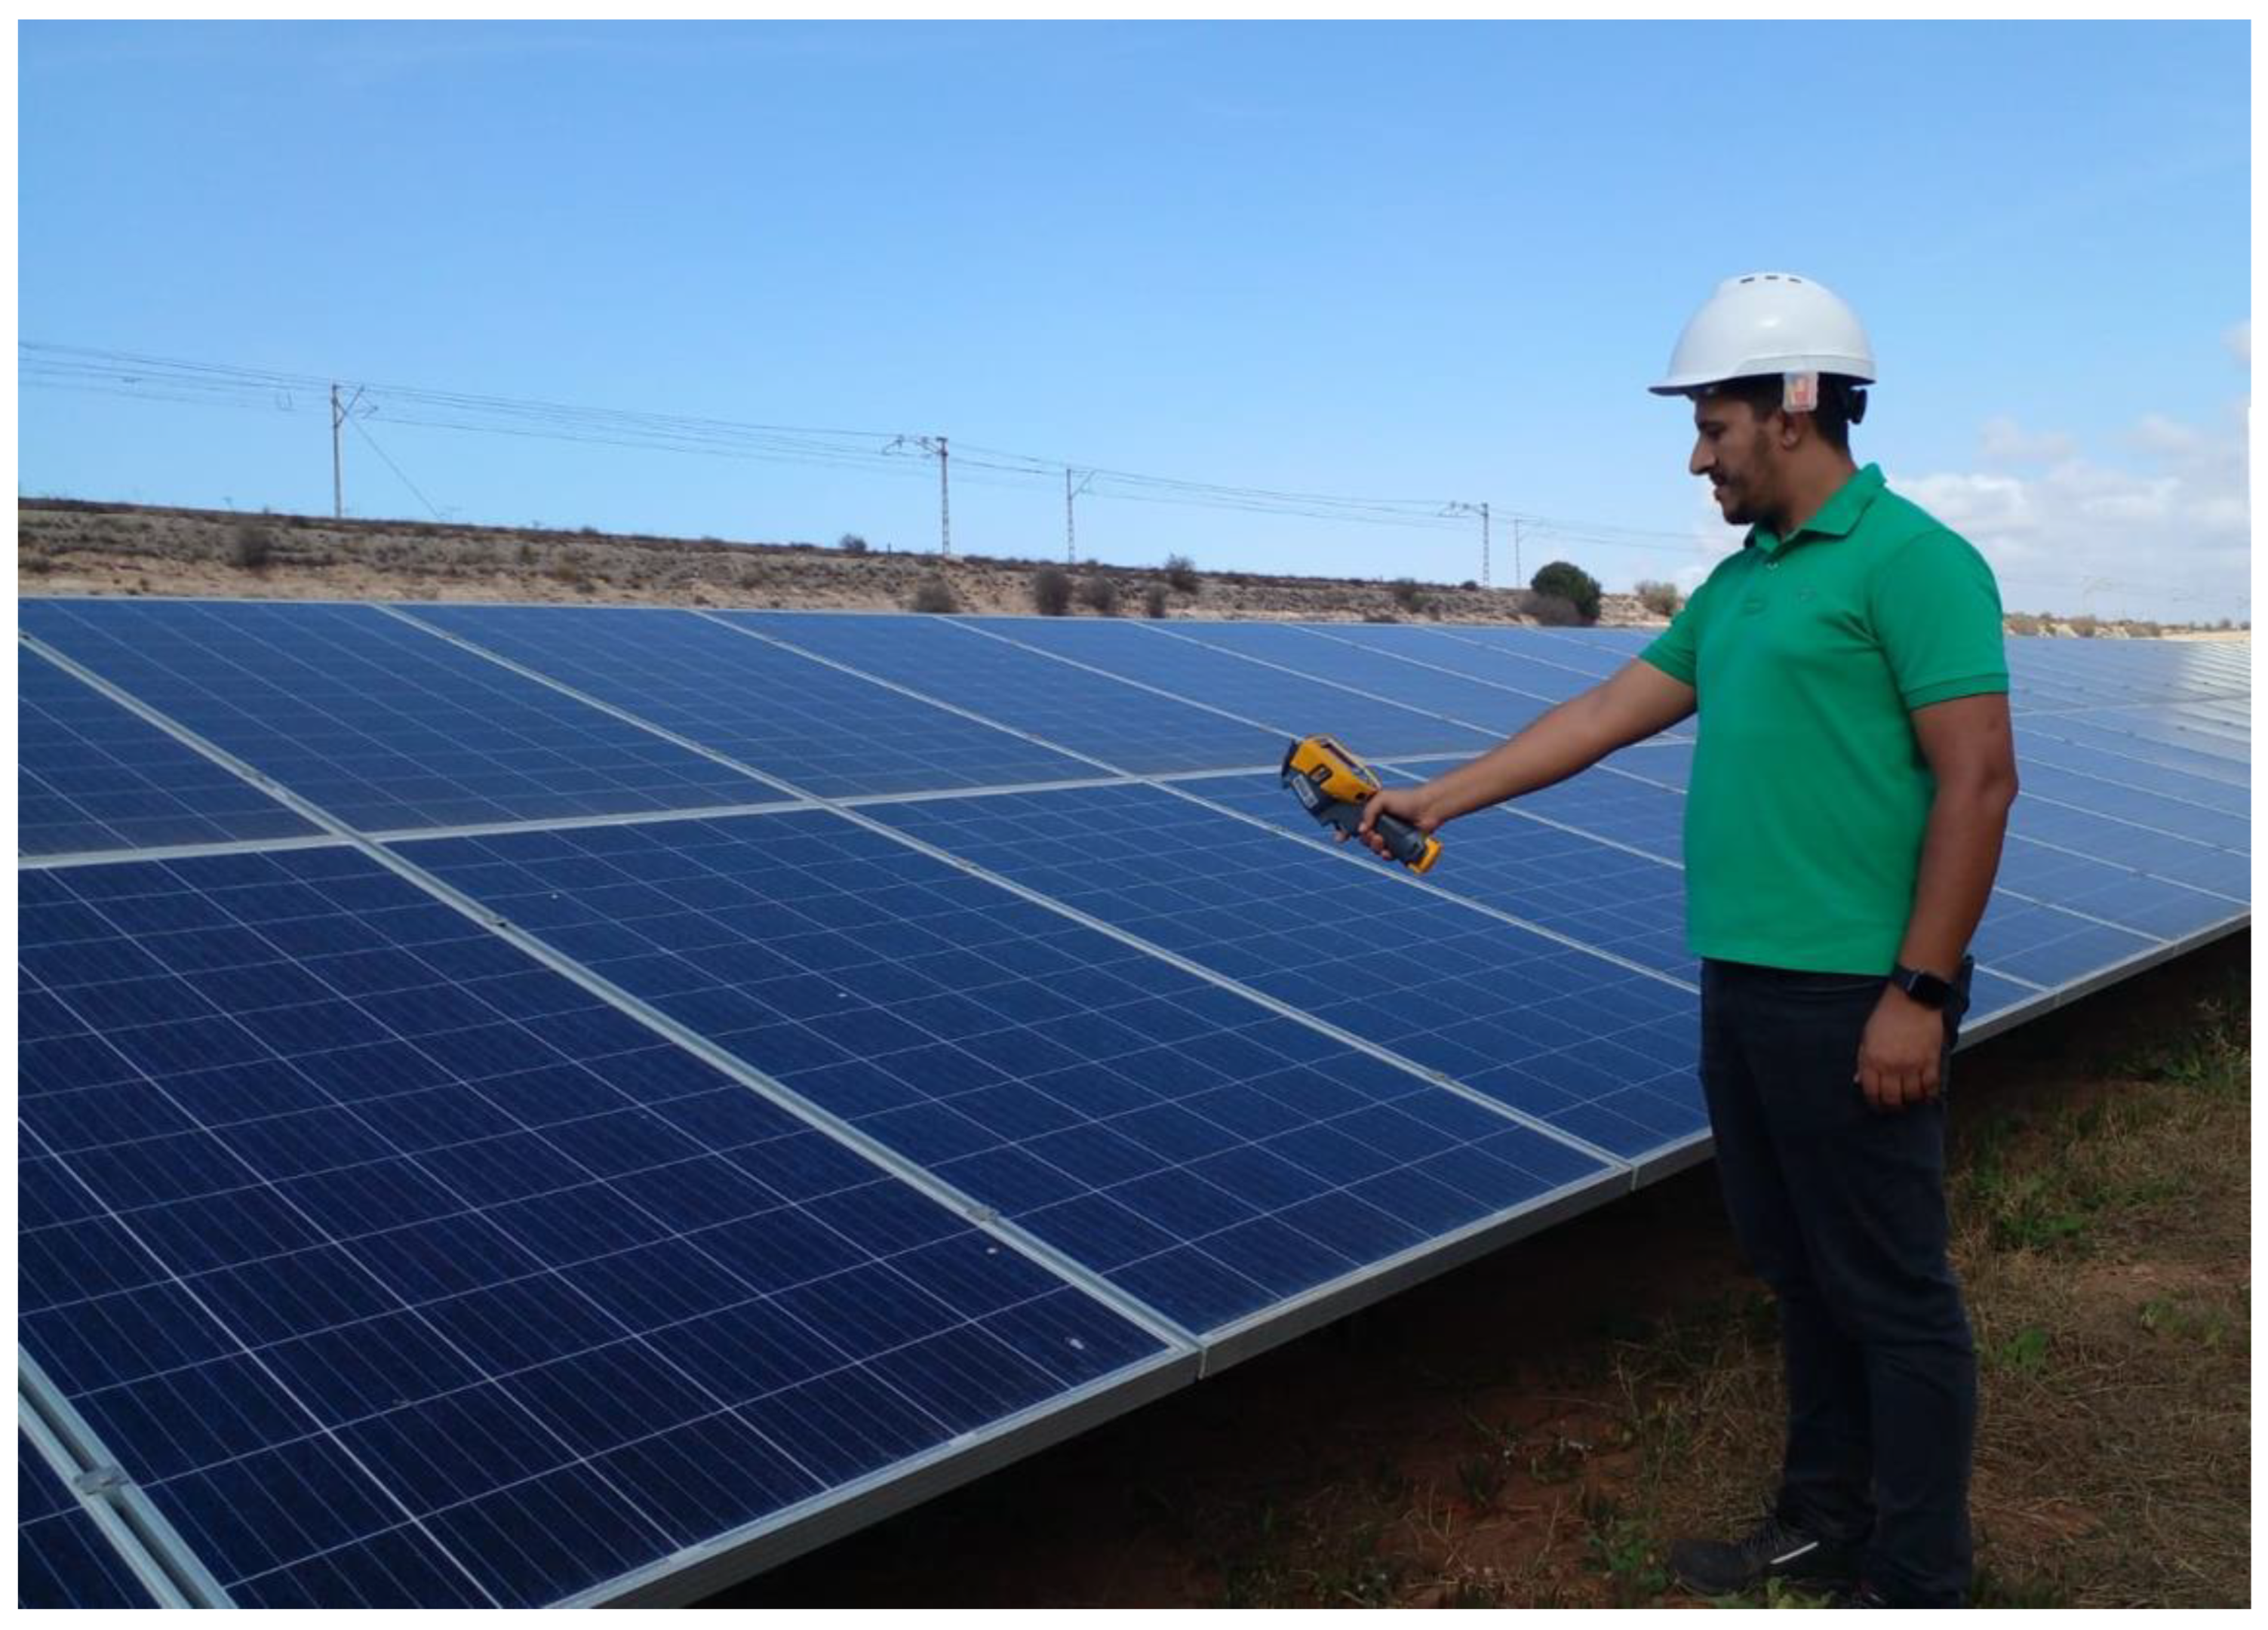
To conduct a thermographic analysis for our solar station, we used a FLUKE thermal camera (Figure 9 and Figure 10). This thermal camera operates within a temperature range of −10 °C to 250 °C. The thermal images captured were subsequently analyzed using SmartView R&D software version 1.1.550.0.
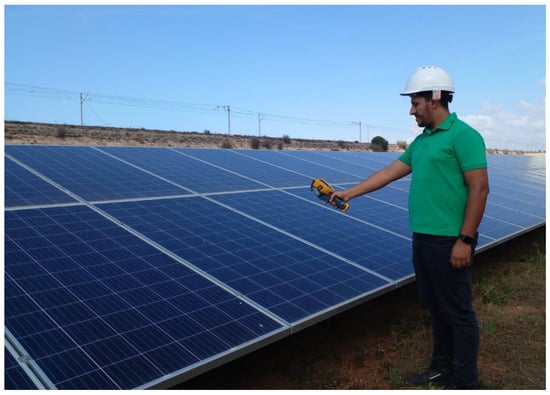
Figure 9.
Gathering thermal images (15 September 2023).

Figure 10.
FLUKE infrared thermal imaging camera [36].
The thermal camera’s settings were configured as outlined in Table 5.
Table 5.
FLUKE thermal camera parameter settings [36].
4.14. Economic Analysis of the Solar Power Plant
The solar power plant was established with a total investment of DHS 5 million. For economic analysis, we utilized two metrics: a simple payback period and the levelized cost of electricity (LCOE) to assess its economic performance over the years. The LCOE is used to compare electricity generation technologies, regardless of differences in project size, location, system specifications, and even lifespan.
The levelized cost of electricity (LCOE) represents the net present average cost of electricity production for a generator over its entire lifespan. This measure is used to guide investment decisions and to make consistent comparisons among various electricity production methods. LCOE basically refers to the minimum price of selling energy to break even. The levelized cost of energy is given as [37]:
4.15. Greenhouse Gas Savings
Photovoltaic solar systems have the advantage of not emitting greenhouse gases throughout their lifespan.
For the period from 2021 to 2022 in Morocco, the average emission factor for the electrical grid associated with photovoltaic solar systems was 0.657 metric tons of carbon dioxide per megawatt-hour (tCO2/MWh). This grid emission factor typically quantifies the amount of carbon dioxide that could be avoided by generating electricity from photovoltaic solar systems.
Using this grid emission factor, carbon savings were calculated using the following formula:
Tonnage of CO2 emissions (tCO2) = 0.657 × Energy generated
5. Results and Discussion
The analysis of the 1001 kWp grid-connected PV system was conducted using data collected over a period of 12 months, spanning from January 2022 to December 2022. The photovoltaic system under study is located in the industrial zone of El Jadida, Morocco, at a latitude of 33.2146° north and a longitude of 8.4886° west. The altitude relative to sea level is 21 m.
The data required for this analysis were retrieved from the PV station monitoring system, encompassing information on PV power, inverter output power, and irradiance.
Using these data, various performance indicators were calculated, including average daily energy, yields, performance ratio, capacity factor, and losses. The analysis results comprise average daily DC and AC energy, performance ratio, and capacity factor, as well as module, system, and inverter performance. These results are presented in Table 6.
Table 6.
The monthly calculation results for energy output, ambient temperature, irradiance, module efficiency, system efficiency, inverter efficiency, performance ratio, and capacity factor.
5.1. Energy Production
The energy production of a photovoltaic system is closely tied to the level of solar radiation it receives. Photovoltaic systems directly convert sunlight into electricity using solar cells.
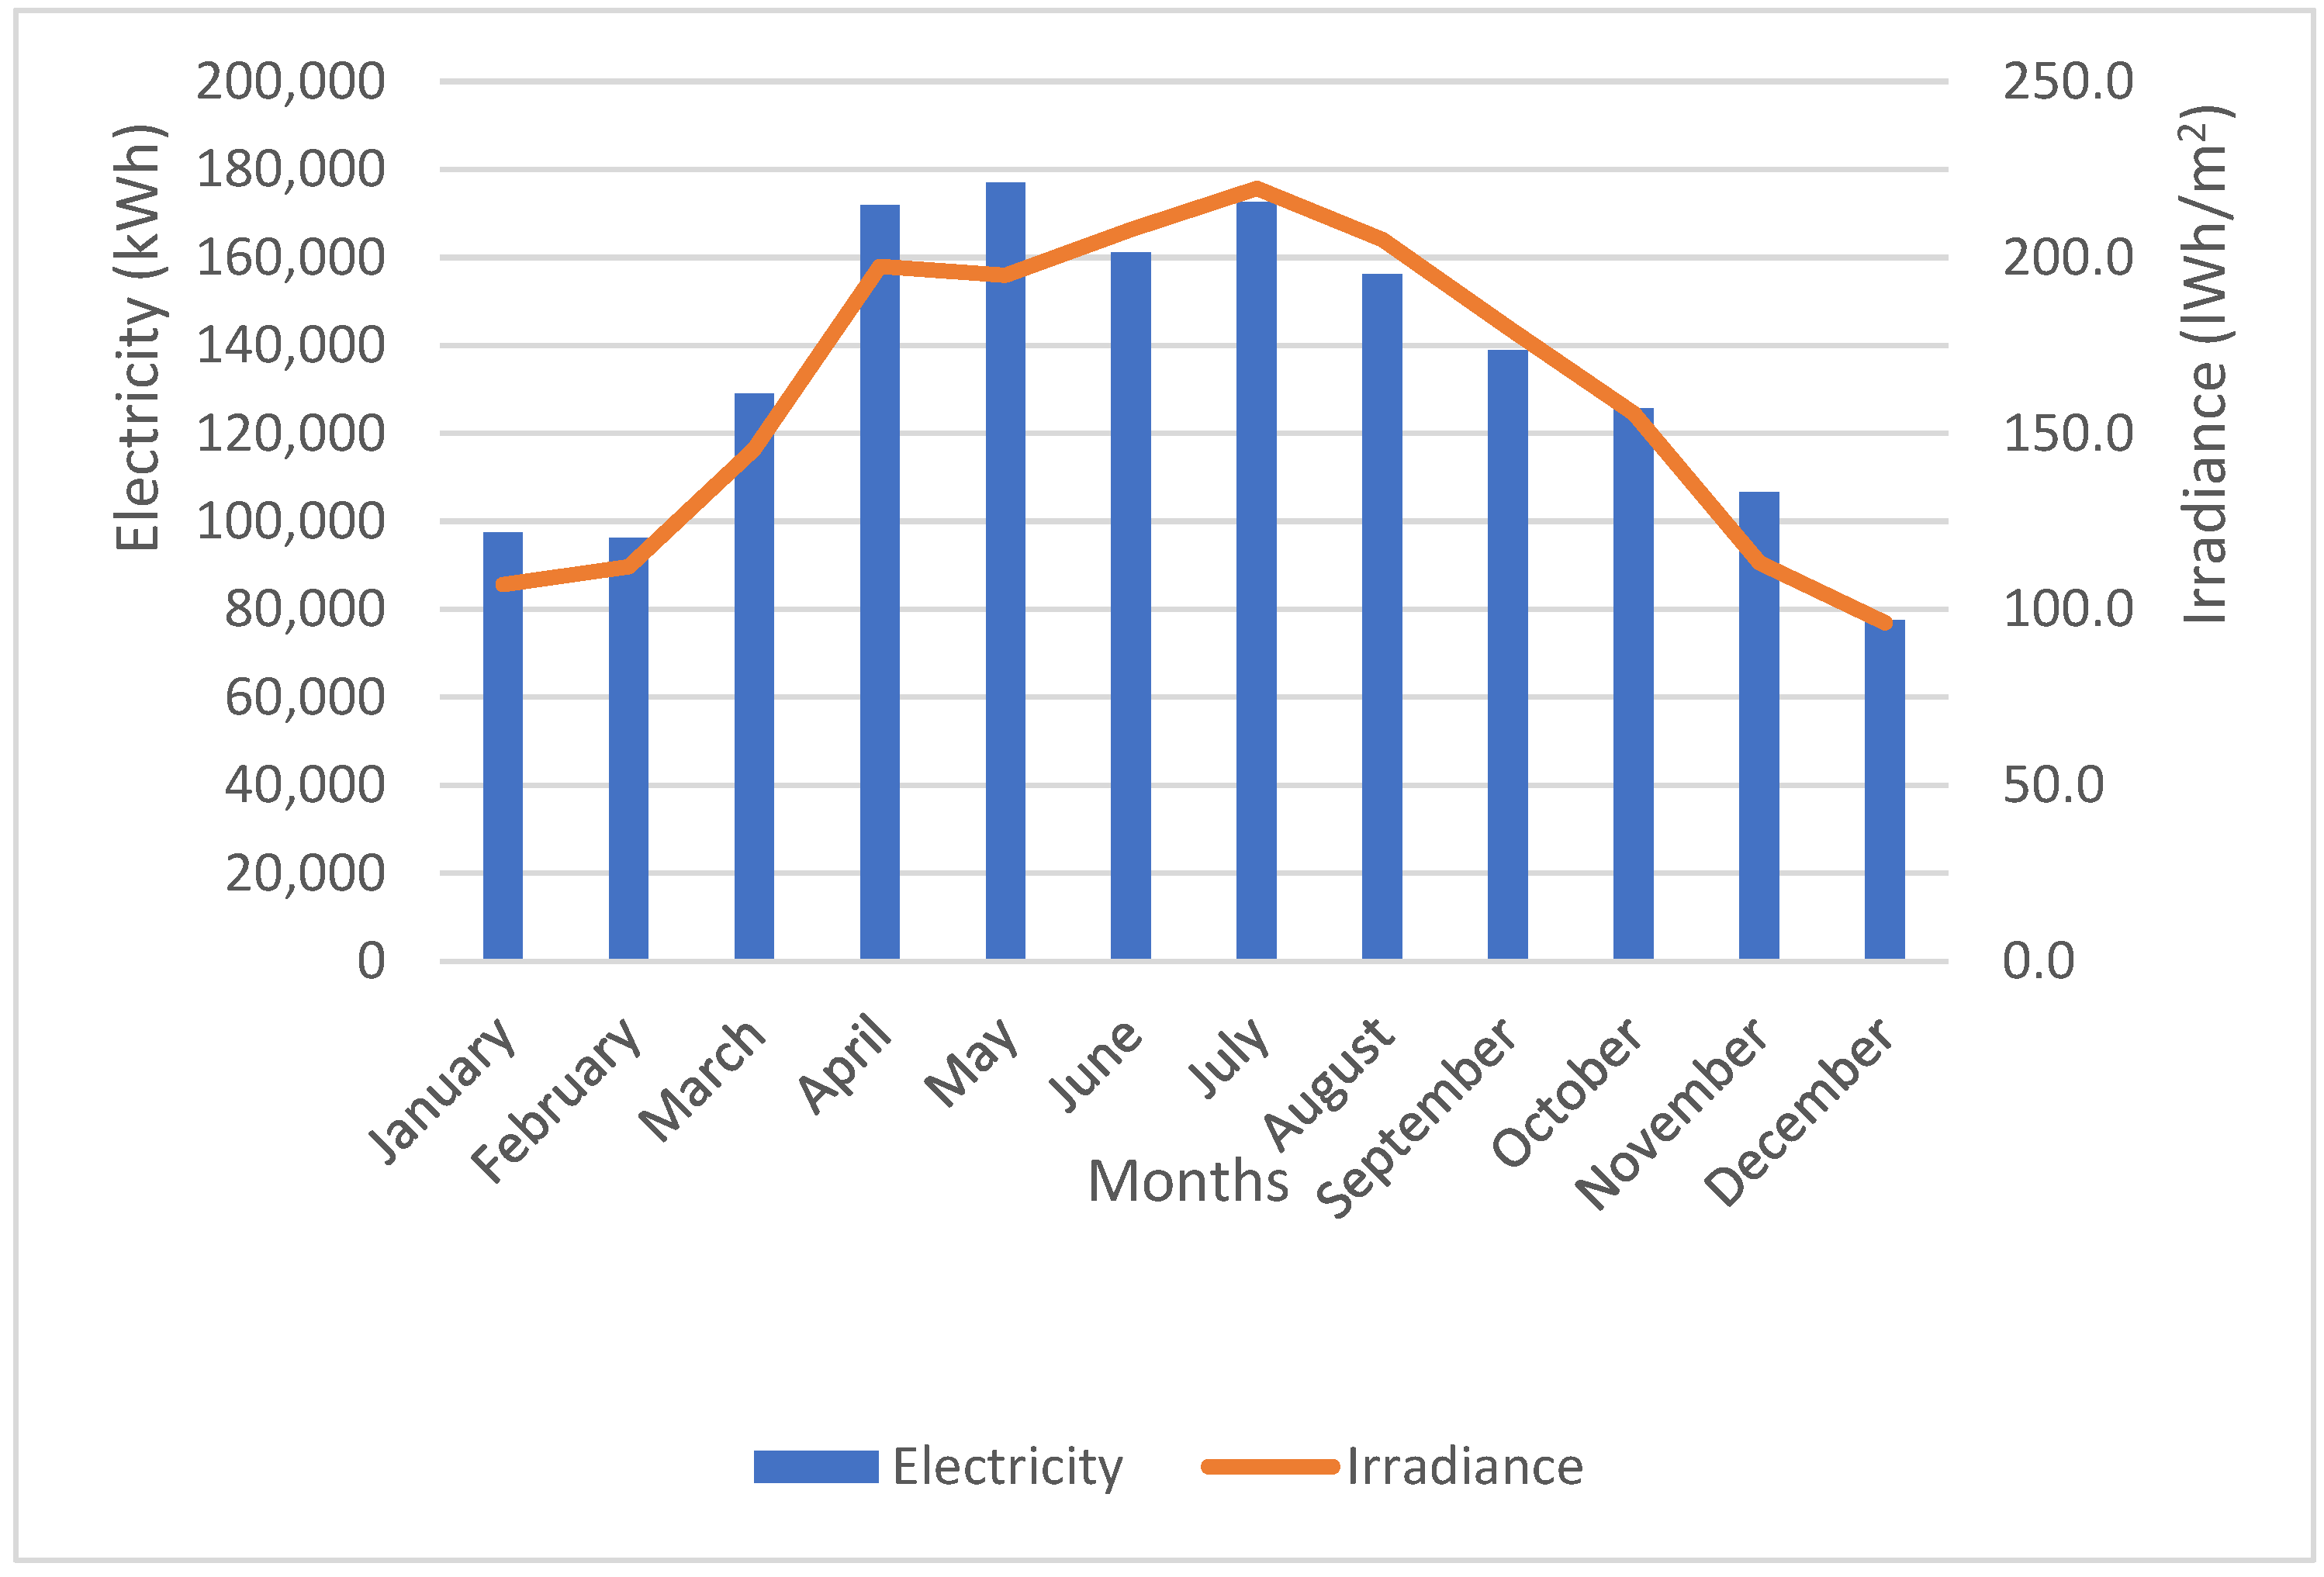
Based on the data provided and as illustrated in Figure 11, we can observe that the intensity of solar radiation is notably stronger between the months of April and September, with an average radiation of 2008.8 kWh/m2 per month. During this period, the system’s energy production reaches an average of 162,901 kWh per month.
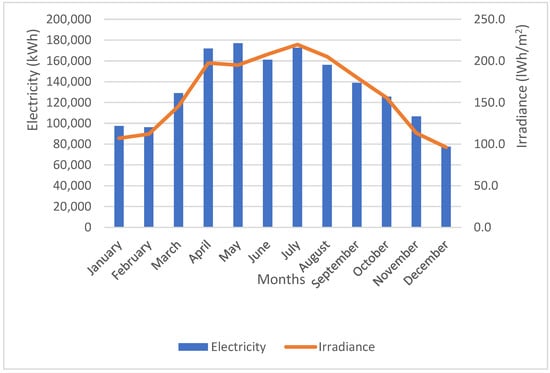
Figure 11.
Total monthly electricity production and global solar radiation in 2022.
Conversely, during the other months of the year, the radiation intensity is lower, averaging 121.6 kWh/m2 per month. Consequently, the energy production is also lower, with an average of 105,443 kWh per month.
These findings demonstrate the direct influence of solar radiation intensity on the energy production of a photovoltaic system. Months with higher radiation levels, namely, April to September, are more favorable for increased solar energy generation. On the other hand, the remaining months, characterized by lower radiation levels, result in decreased solar energy production.
In summary, the intensity of solar radiation plays a vital role in determining the energy output of a photovoltaic system.
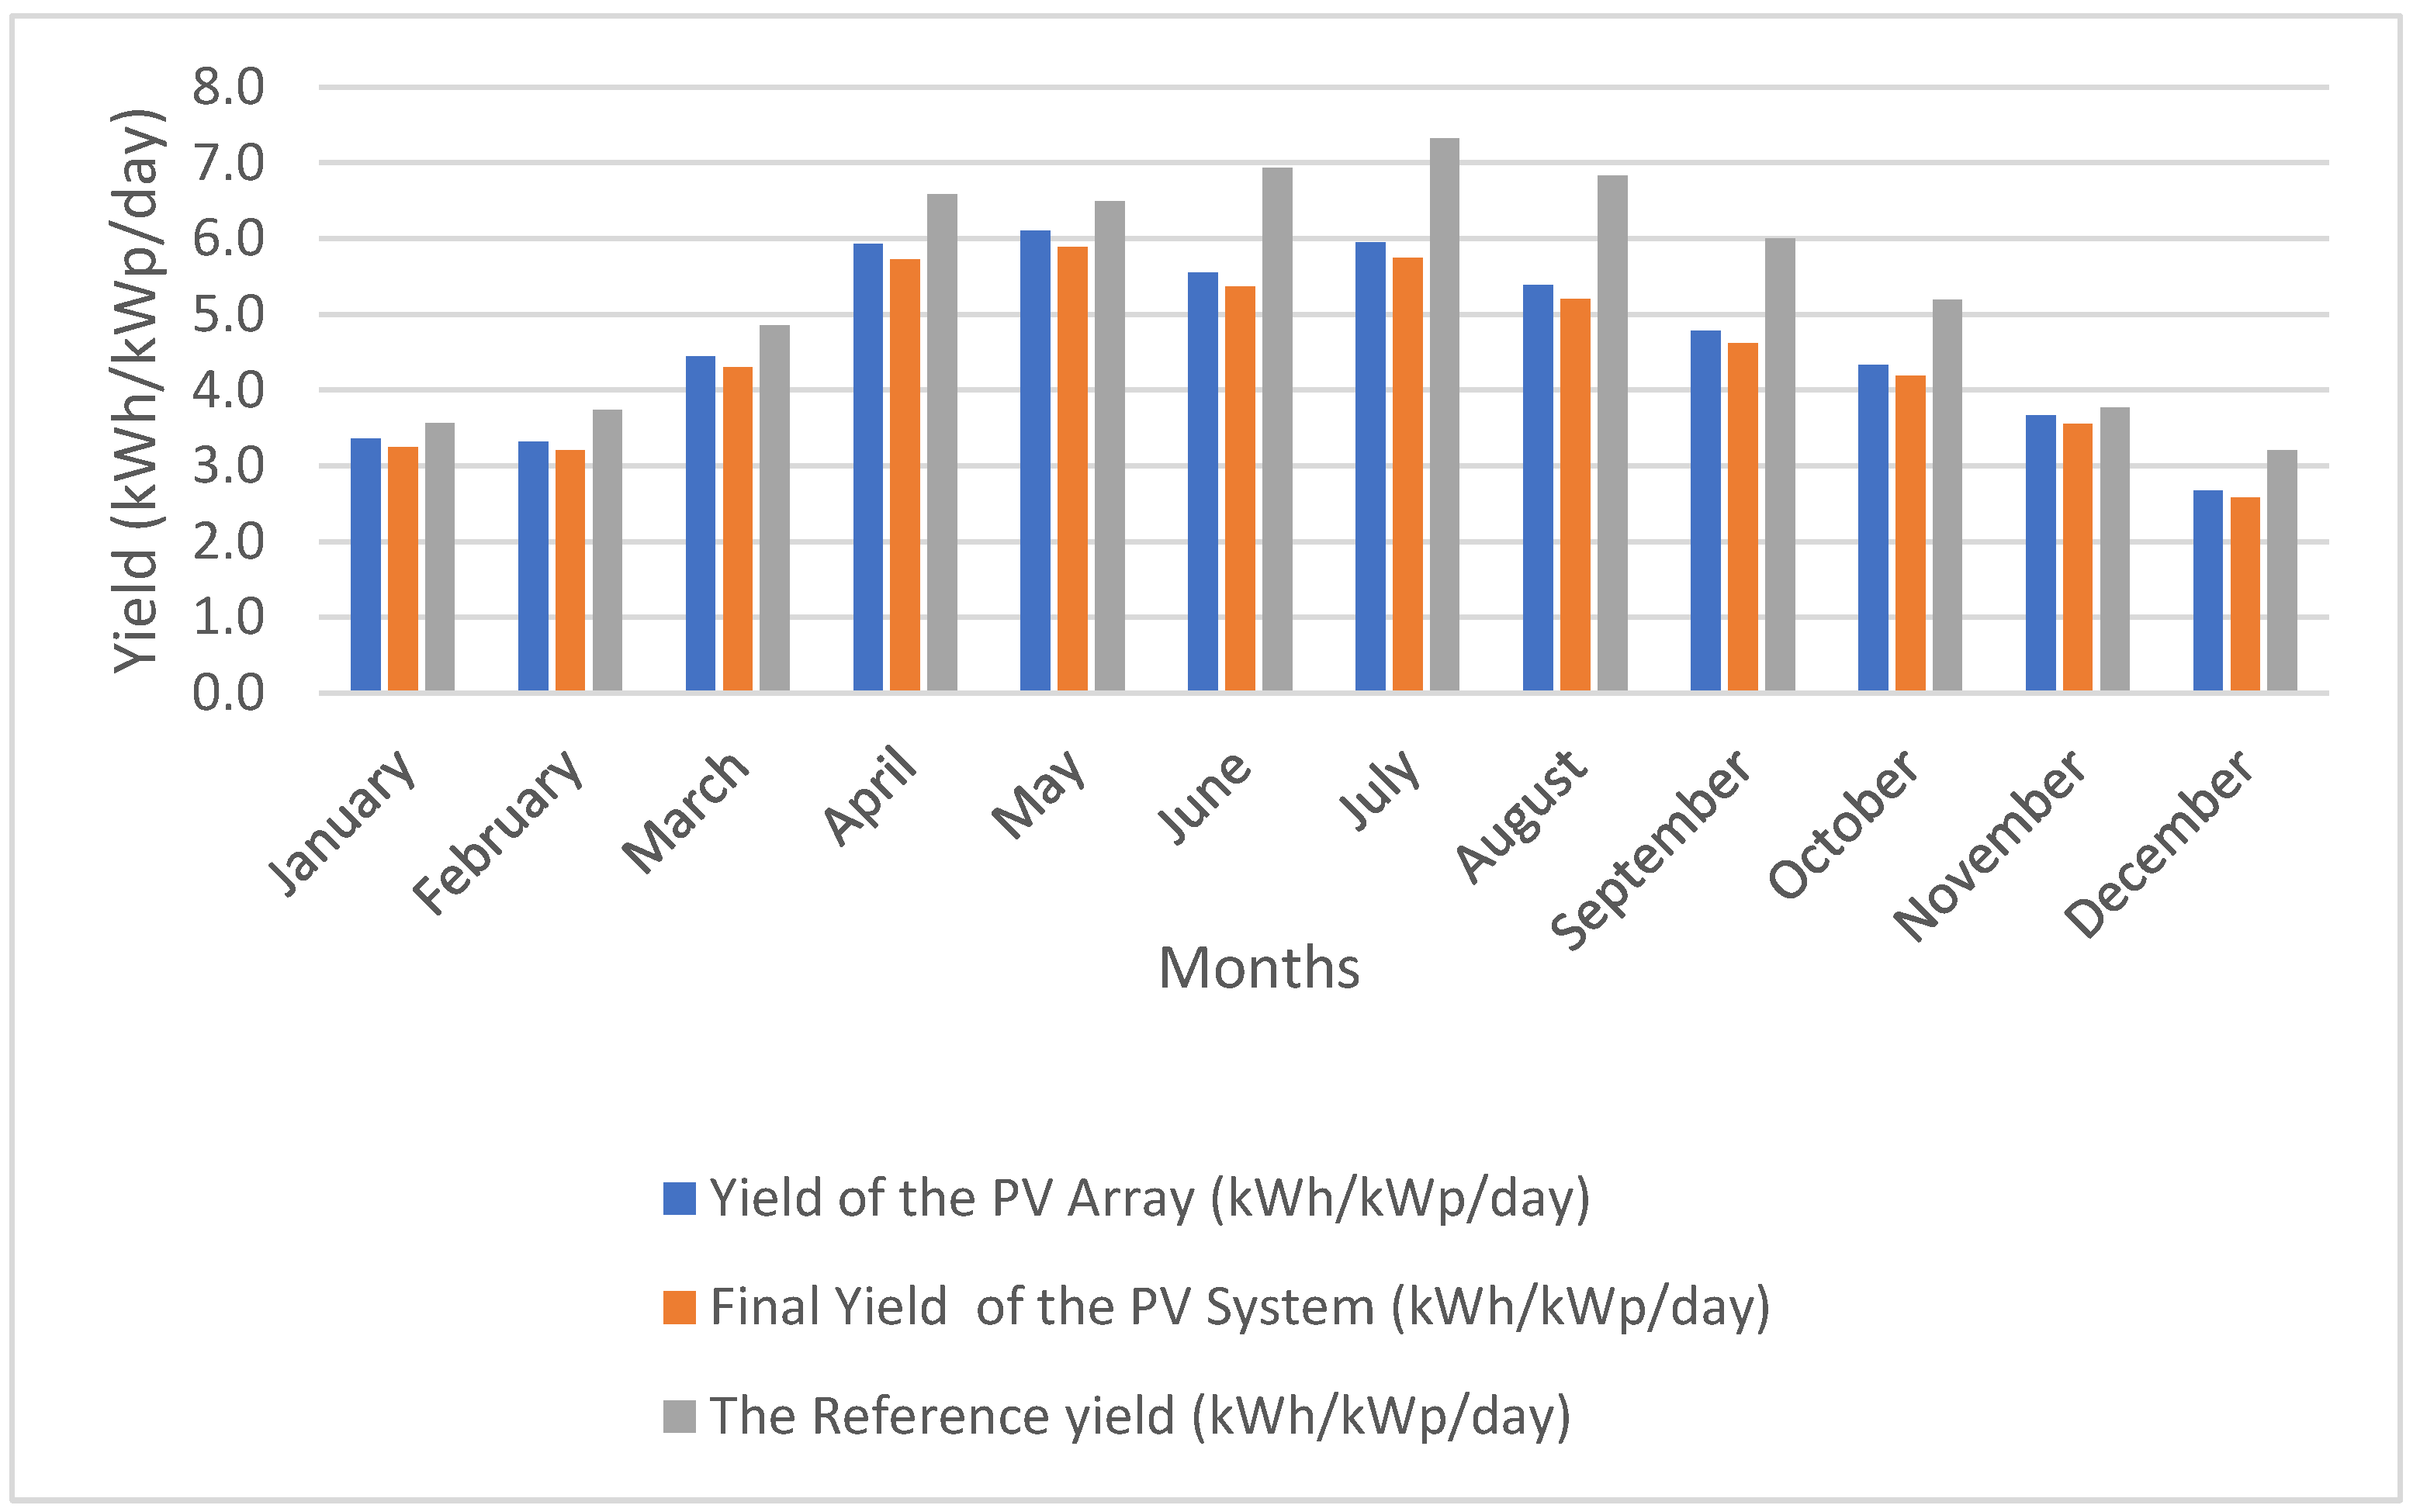
5.2. Yields: Yield of the PV Array, Final Yield of the PV System, and the Reference Yield
Figure 12 illustrates the yield of the PV array, the final yield of the PV system, and the reference yield of the grid-connected PV system throughout the monitored period from January to December 2022.
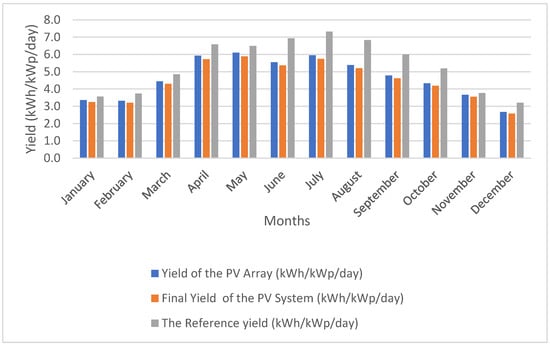
Figure 12.
Monthly averaged daily yield of the PV array, final yield of the PV system, and the reference yield.
The average daily final, array, and reference yields varied monthly as follows: In December, the yields were 2.6 kWh/kWp/day, 2.7 kWh/kWp/day, and 3.2 kWh/kWp/day, respectively. In May, the yields increased to 5.9 kWh/kWp/day, 6.1 kWh/kWp/day, and 7.3 kWh/kWp/day, respectively.
The lower yield values observed in December can be attributed to the reduced irradiation and shorter duration of sunshine during this period.
On the other hand, July and May experienced the highest energy production at 172,538 kWh and 176,941 kWh, respectively. July also had a significantly high radiation level of 219 kWh/m2, with a corresponding temperature of 23.14 °C.
It is important to consider that the yield of the PV array, the final yield of the PV system, and the reference yield can vary due to multiple factors, such as the quality of solar panels, panel orientation and inclination, ambient temperature, wiring losses, shading losses, etc.
5.3. Performance Ratio (PR)
The PV energy ratio pertains to the energy efficiency of photovoltaic (PV) solar panels, which enable the conversion of sunlight into electricity using specialized photovoltaic cells. Energy efficiency for solar PV panels is commonly quantified as a percentage, representing the proportion of captured solar energy that is successfully transformed into usable electrical energy.
It is important to note that the PV energy ratio does not directly indicate the power generation capacity of a PV system. For instance, a PV system with a high energy ratio in a location with low solar irradiance might generate less power compared with a PV system with a lower energy ratio in a location with high solar irradiance, and vice versa. The energy ratio is influenced by losses occurring during the conversion of solar energy to electricity, as well as losses associated with the inverter.
In a specific study, Figure 13 demonstrates that the PR is not representative of the actual power generation quantity of the PV system. A PV system with a high PR in a region with low solar irradiance can yield lower power output compared with a PV system with a low PR in a location with high solar irradiance, and vice versa. The value of PR is affected by losses incurred during the conversion of solar energy to electricity, as well as losses arising from the inverter.
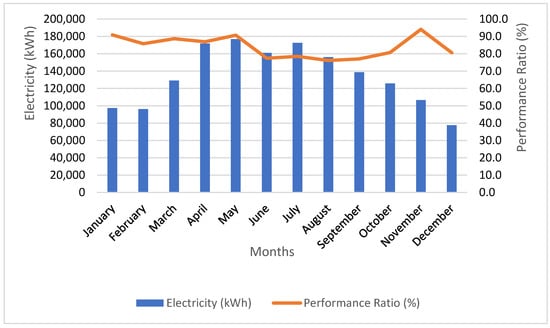
Figure 13.
The value of the performance ratio compared to energy production.
In the aforementioned study, the monthly average PR of the PV system ranged from 76.1% in August to 94.1% in November, with an average of 84%. This indicates that the PV system was capable of converting approximately 84% of the incident solar energy into usable electricity. However, it is worth noting that 16% of the solar energy captured by the photovoltaic generator was not converted into electricity.
To summarize, the PV energy ratio, when considering energy efficiency, denotes the effectiveness of photovoltaic solar panels in converting solar energy into usable electricity.
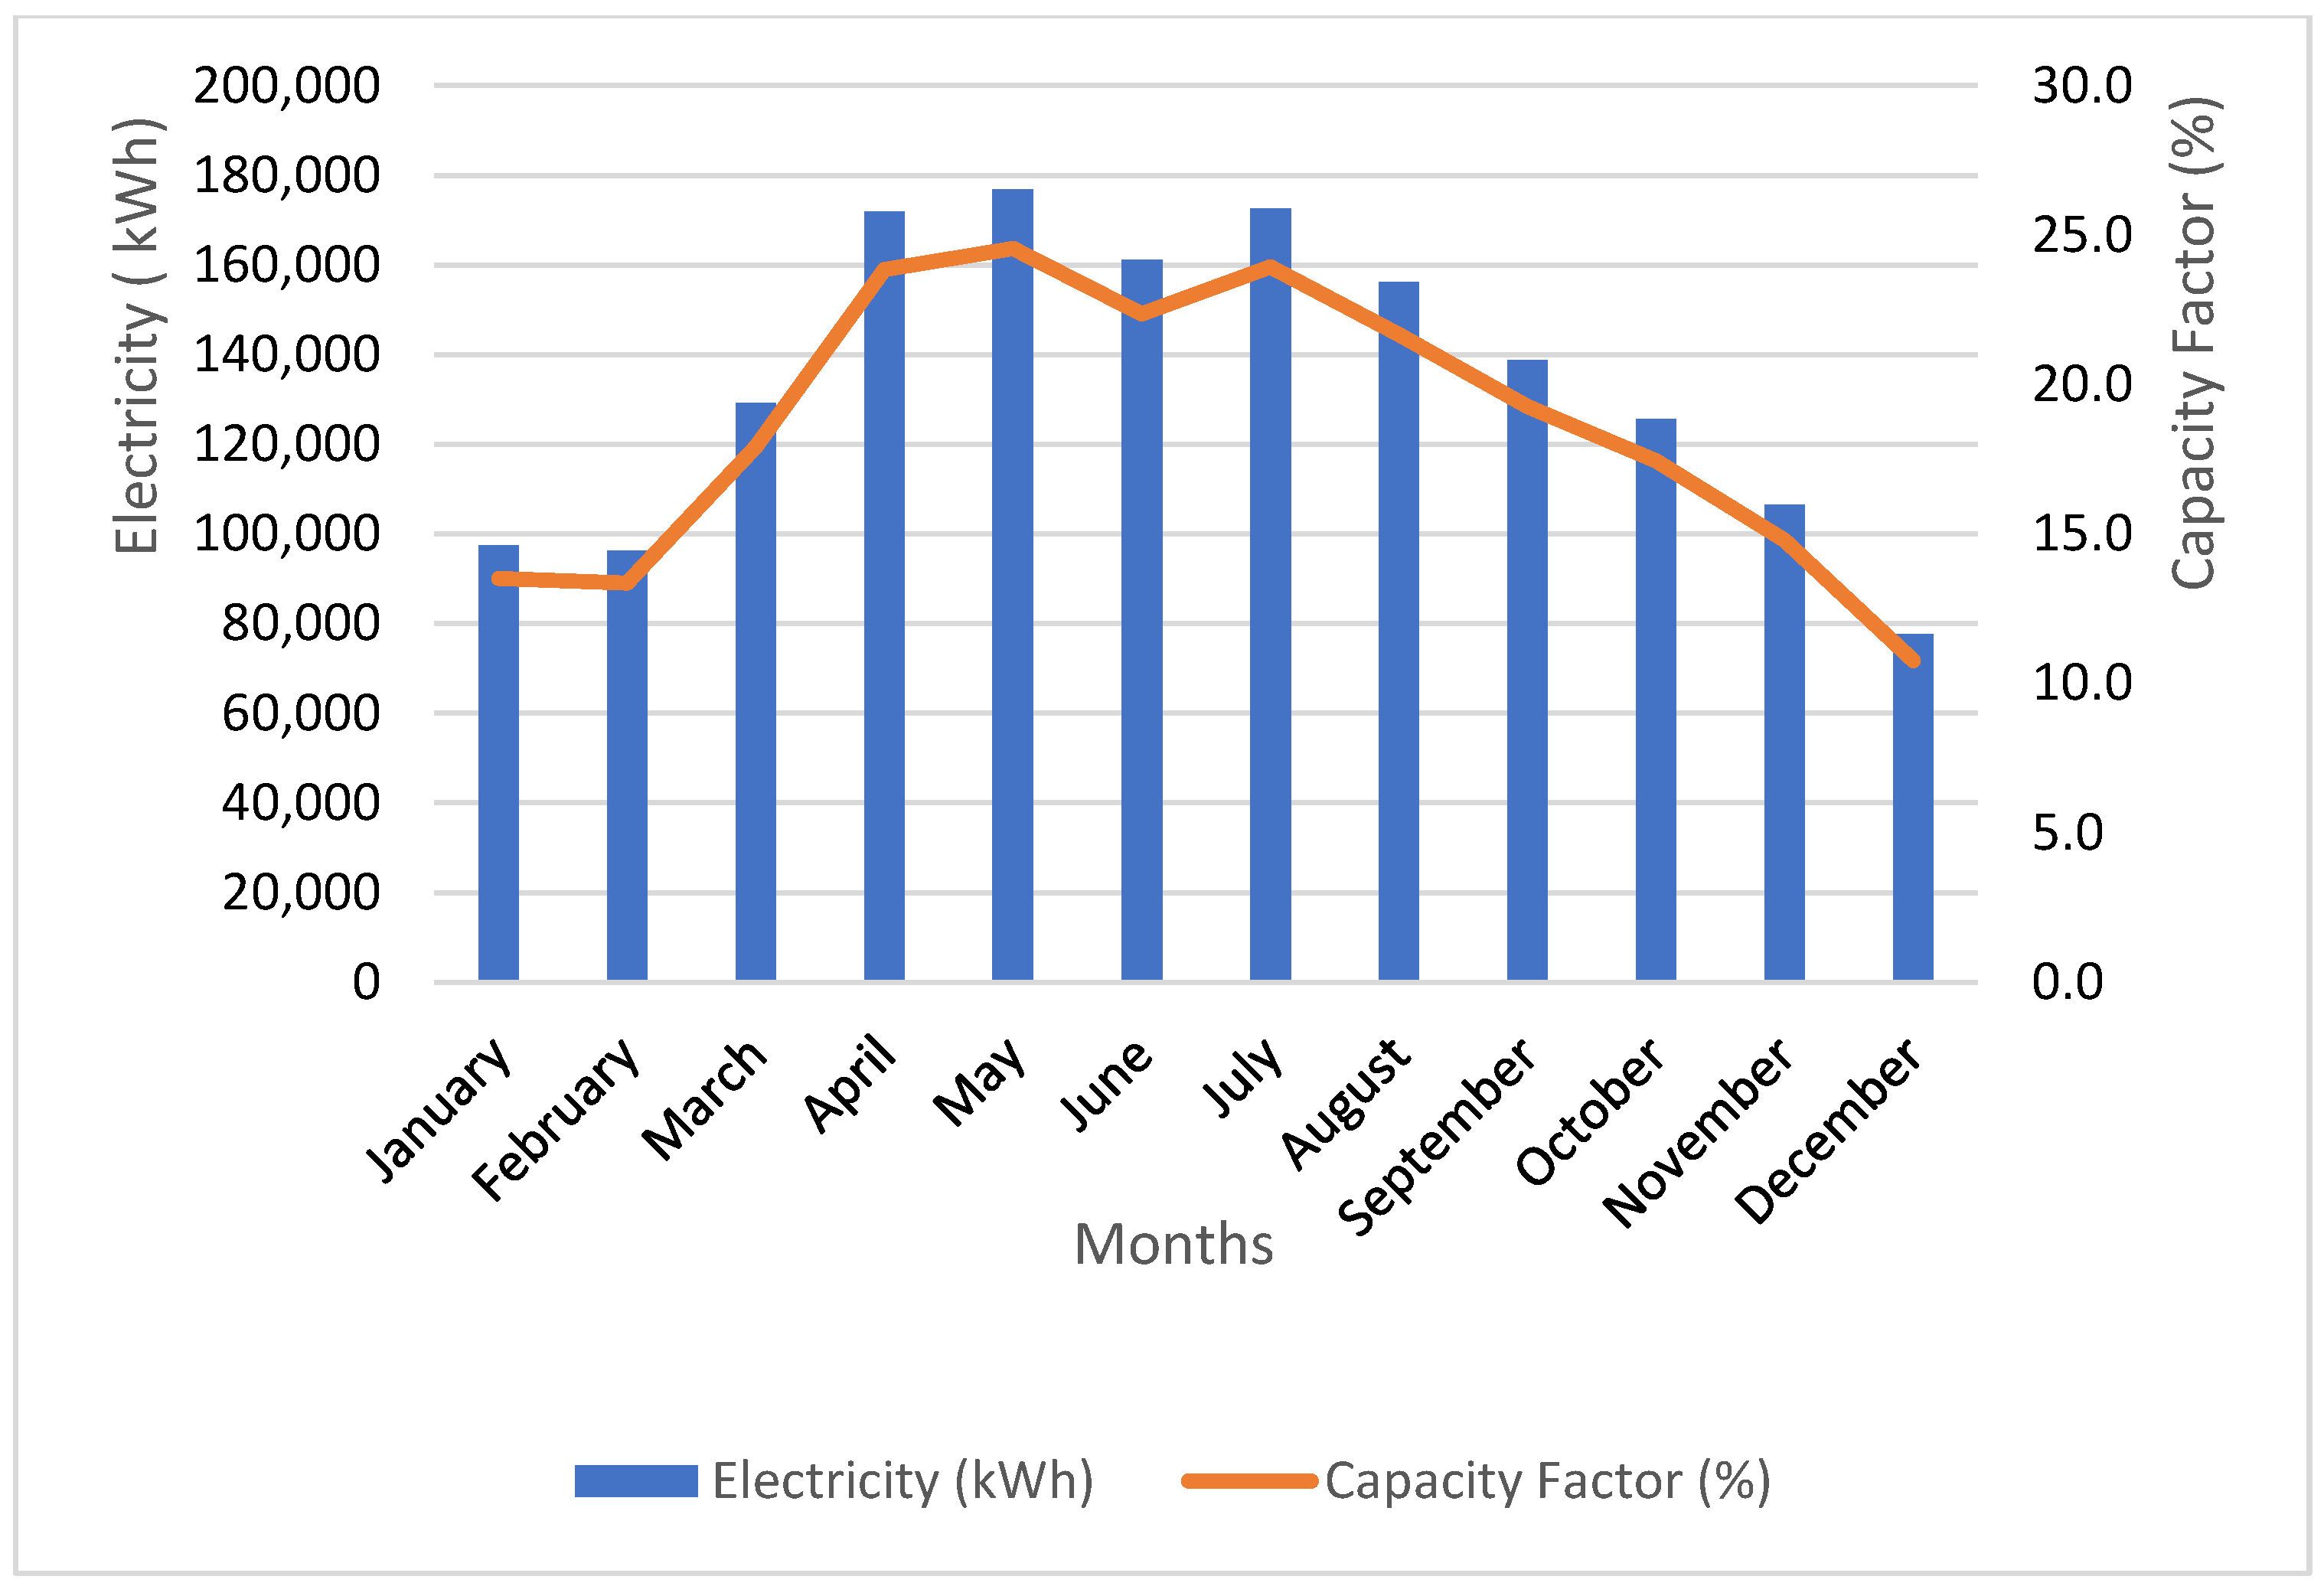
5.4. Capacity Factor (CF)
In this particular study, the capacity factor of a photovoltaic (PV) system was evaluated on a monthly basis, and the average was determined over a 12-month monitoring period spanning from January to December 2022.
The monthly capacity factor of the PV system exhibited variability, ranging from 10.8% in December 2022 to 24.6% in May 2022, with an average of 18.6%. This value represents the proportion of time during the monitoring period when the PV system operated at its maximum power capacity. Specifically, it indicates that the PV system was able to generate electricity at its full power for approximately 68 days out of the 12-month monitoring period (January 2022–December 2022). The relationship between the capacity factor and energy production is depicted in Figure 14. It is important to note that the capacity factor of a PV system can differ depending on the location and solar radiation conditions.

Figure 14.
The value of the capacity factor compared to energy production.
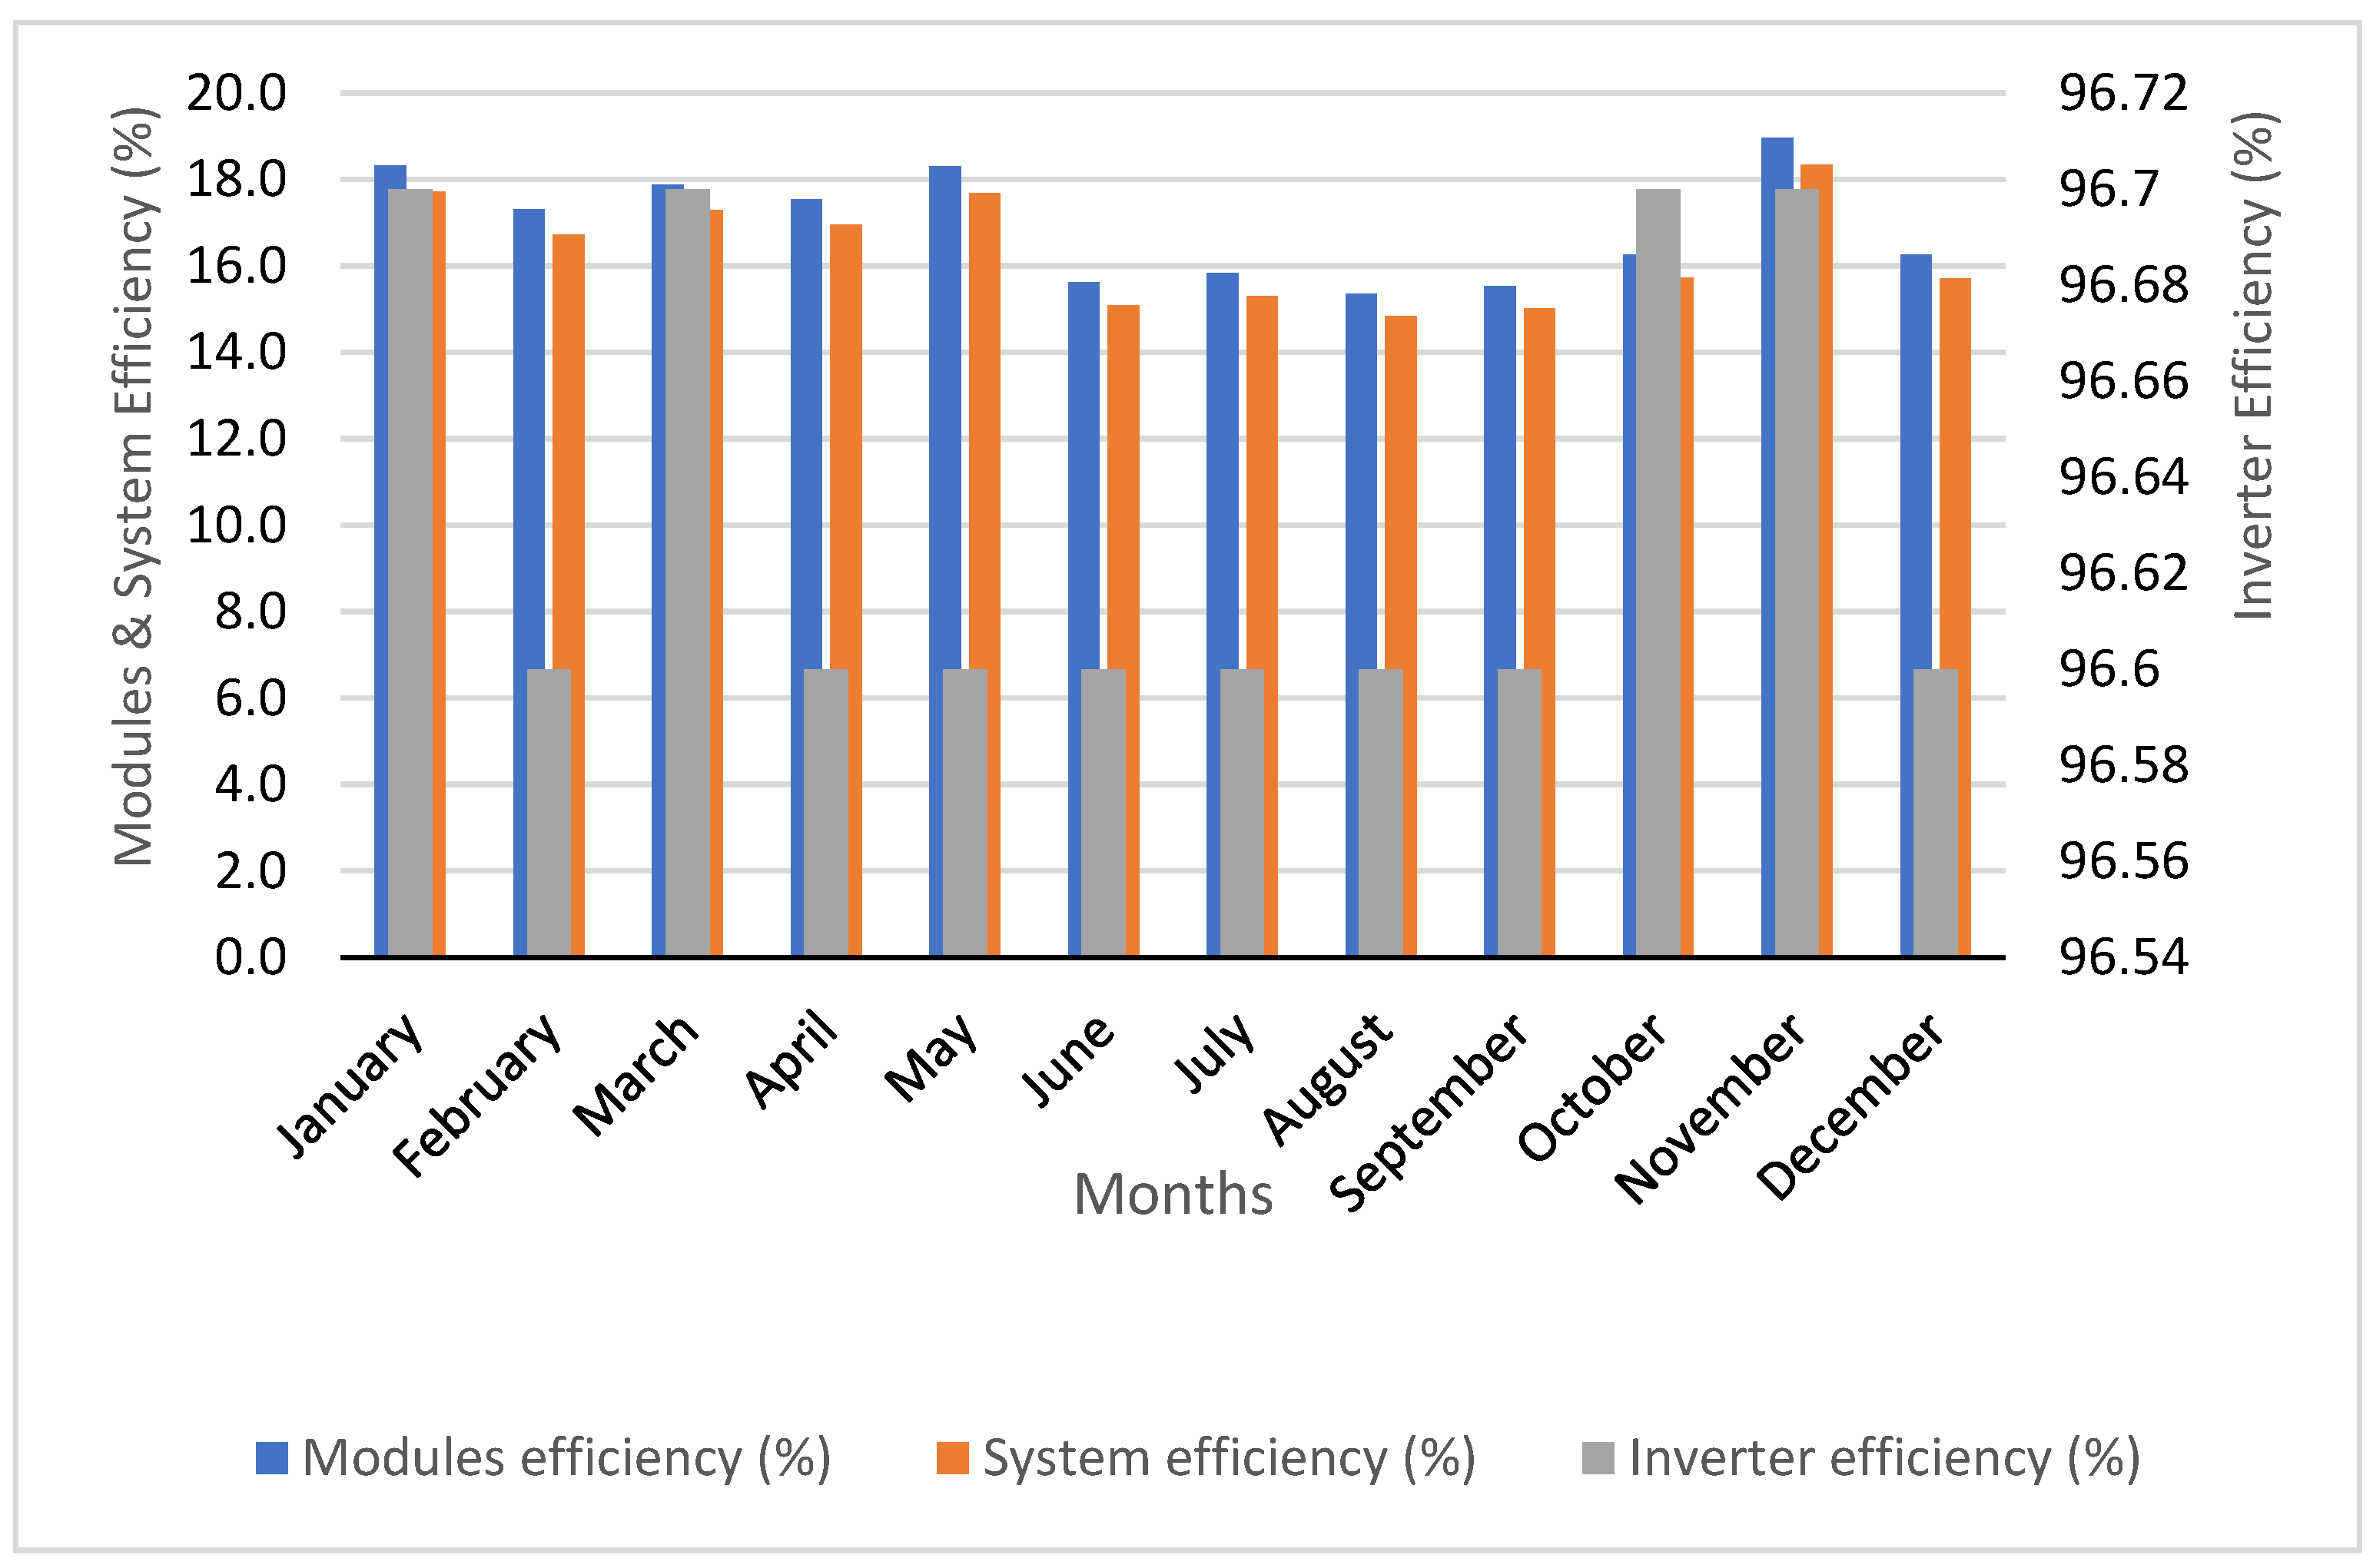
5.5. Energy Efficiencies
Module efficiency, system efficiency, and inverter efficiency are parameters utilized to assess the performance of photovoltaic (PV) systems.
As illustrated in Figure 15, the module efficiency varied from 15.4% in August to 19% in November. The system efficiency ranged from 14.8% in August to 17.7% in January, while the inverter efficiency ranged from 96.6% in February to 96.7% in November. On average, the module, system, and inverter efficiencies were measured at 16.9%, 16.4%, and 96.6%, respectively.
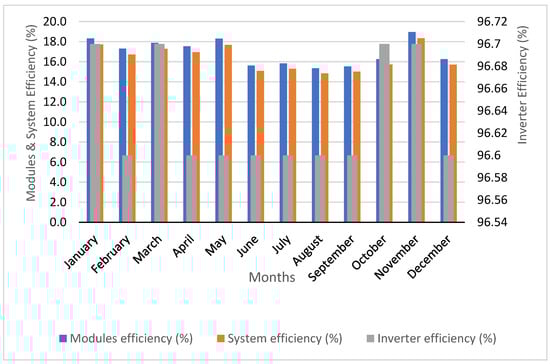
Figure 15.
Module, system, and inverter efficiency.
The module efficiency exhibited a decline from June to September due to the dry season and increased temperatures compared with other months, leading to a build-up of dust on the PV system. Conversely, the module efficiency increased from October to May as the dust on the PV modules was washed away by rainwater, resulting in improved efficiency. Consequently, we have made the decision this year, in 2023, to strengthen the manual cleaning of the solar panels to prevent dust accumulation and preserve their efficiency. Furthermore, in the upcoming years, we plan to invest in an automatic cleaning robot to further enhance the efficiency of our solar panels.
It is worth noting that system efficiency is influenced by both module efficiency and inverter efficiency. The results demonstrate that system efficiency gradually decreases from June to September and increases from October to May.
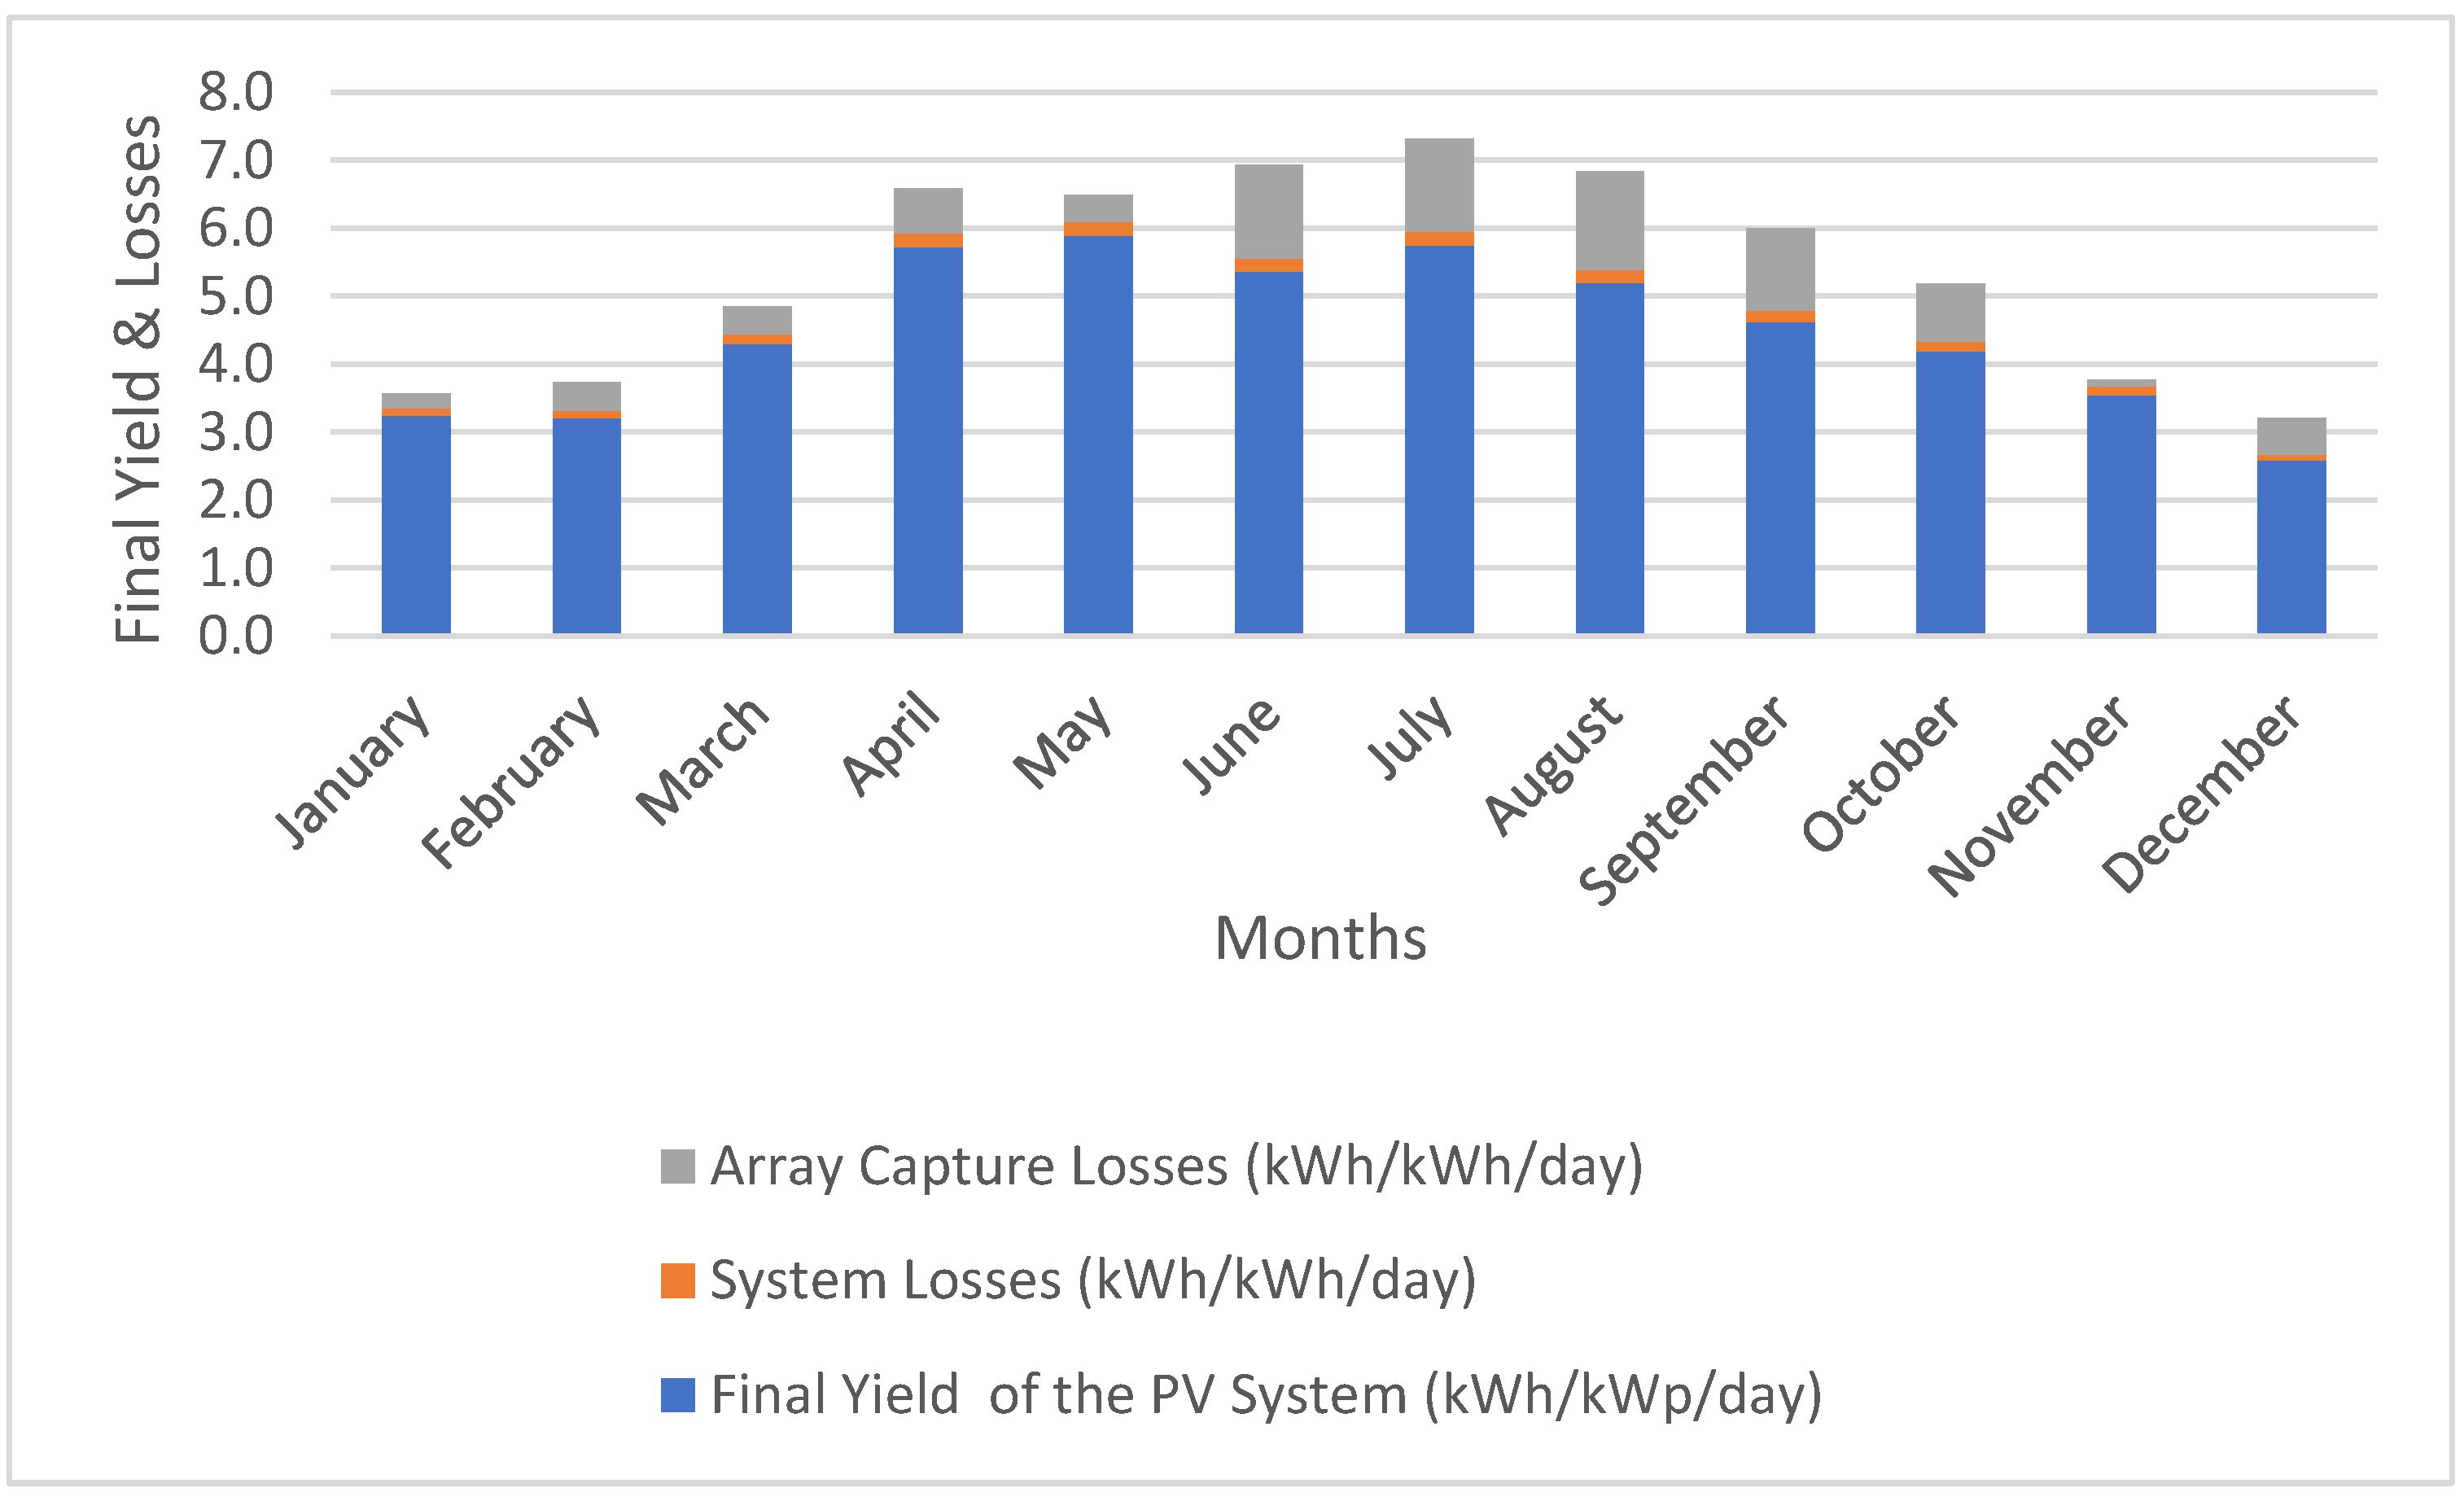
5.6. Losses
Monthly end yield, capture losses, and system losses are indicators utilized to evaluate the performance of a photovoltaic (PV) system.
As depicted in Figure 16, the value of capture losses increased from June to September. This increase can be attributed to the dry season that started in June and ended in September, resulting in the accumulation of dust and dirt on the PV generator during this period. Conversely, from November to March, high-intensity rains effectively removed the dust and cleaned the PV panels, leading to a reduction in capture losses during these months.

Figure 16.
Monthly final yield with corresponding array capture losses and system losses.
The system loss value has an impact on inverter efficiency, where higher system loss values correspond to lower efficiency. Notably, from April to September, the system loss reached its peak value, which resulted in decreased inverter efficiency during these months.
In this study, the PV system exhibited capture loss values ranging from 0.1 kWh/kWp/day in November to 1.45 kWh/kWp/day in November. The losses of the PV system varied from 0.09 kWh/kWp/day in December to 0.02 kWh/kWp/day in May. The average capture losses and system losses were calculated at 0.75 kWh/kWp and 0.15 kWh/kWp, respectively.
Using an analysis of these parameters, the overall efficiency of a PV system can be assessed and the sources of energy losses can be identified. By reducing these losses, system performance can be improved and solar power generation can be maximized.
5.7. Comparative Analysis of Results: Our Study vs. Previous Research
When carefully analyzing data illustrated in Table 7 from various studies conducted in different regions of the world on photovoltaic power plants, several parameters stand out in terms of performance. Our study conducted in Morocco in 2022 stands out particularly in these aspects, demonstrating the excellence of its solar installations.
Table 7.
Performance parameters for different grid-connected photovoltaic system locations.
Regarding the final yield kWh/kWp/day, we find that India in 2014 holds the record for the highest final yield (5.14 kWh/kWp/day). This exceptional performance can be attributed to favorable solar conditions, advanced photovoltaic technology, and efficient plant management. However, the lowest final yield value was recorded in a study in Malaysia in 2019 (2.08 kWh/kWp/day). This poor performance can be attributed to reduced sunlight, less efficient photovoltaic technology, or operational issues. In comparison, our solar station demonstrates a high yield of 4.5 kWh/kWp/day, placing it above the average. This outstanding performance can be explained by Morocco’s favorable climate conditions, including generous sunlight, as well as the use of modern photovoltaic technologies in our system. This remarkable performance suggests that Morocco has significant solar potential, and our system effectively harnesses this renewable energy source. However, it is essential to note that several factors, such as weather conditions, technology, and plant management, influence these performances, which can explain the variations observed between studies.
Regarding the performance ratio (%), Serbia, in 2015, achieved the highest performance ratio of 93.6%. This can be attributed to the use of high-quality panels and favorable environmental conditions. In contrast, in Ghana in 2017, a study using CIS panels recorded the lowest performance ratio at 52.8%. This may be due to lower-quality panels or maintenance issues. Our solar system with m-si panels has a performance ratio of 84%. While it is not the maximum, it is a solid result, indicating good overall photovoltaic system efficiency. This is attributed to the quality of the panels used, well-maintained installation, and favorable environmental conditions. The choice of panel type can explain these differences, but other factors such as maintenance, environmental conditions, and installation quality also play a crucial role.
Regarding the capacity factor (%), in 2013, the study conducted in Turkey achieved the highest capacity factor, reaching 23.2%. This exceptional performance can be attributed to Turkey’s abundant sunlight, which allows for more consistent electricity production throughout the day. However, a study in India in 2015 obtained the lowest capacity factor, at only 5.8%. This low value may result from a combination of factors such as unfavorable environmental conditions and system inefficiency. Our study records a capacity factor of 18.6%. While not the maximum, it represents a solid result, indicating efficient utilization of solar energy, with the favorable environmental conditions in Morocco contributing to this result. The capacity factor is influenced by the amount of available sunlight and system performance, explaining the variations observed between these studies.
Regarding panel efficiency (%), our solar installation has the highest value, reaching 16.9%. In contrast, the result found in India in 2014 (a-si) shows a low value of only 6.56%. This difference can be attributed to several factors, such as the type of solar panel. Our system uses monocrystalline silicon (m-si) solar panels, which are generally more efficient than amorphous silicon (a-si) panels. Monocrystalline panels have a better ability to convert sunlight into electricity. Additionally, advancements in solar panel technology have contributed to the efficiency of our system with the use of new technological advancements. Environmental conditions, such as sunlight, can also influence solar panel efficiency. Morocco, due to its climate, can benefit from better sunlight conditions compared with other locations. Furthermore, the size of the installation plays a crucial role, with larger installations having more efficient systems due to better design and more effective use of solar energy, as in our case.
Regarding the maximum inverter efficiency (%), the study conducted in Morocco in 2016 recorded an excellent inverter efficiency of 96.7%, demonstrating the efficient conversion of solar energy into electricity by the inverter. This high efficiency may result from the use of advanced inverter technologies. In contrast, the study in Japan in 2018 displayed the lowest inverter efficiency, at only 85.1%. This lower value can be attributed to less advanced inverter technologies or less optimal operating conditions, such as high temperatures. Our study also presented high inverter efficiency, at 96.6%, approaching the exceptional inverter performance in 2016. This is due to the use of advanced inverter technologies and proper system maintenance.
Regarding the overall system efficiency (%), our results show the highest system efficiency, with a value of 16.4%. This outstanding performance is the result of an efficient solar system from energy collection to electricity conversion. The reasons for this efficiency include the use of advanced technologies, high-quality components, and favorable environmental conditions. In contrast, India, in 2014, showed the lowest overall system efficiency, with a value of only 6.06%. This lower performance may result from various factors, such as less optimal design, lower-quality components, or unfavorable operational conditions. In conclusion, our system stands out for its high overall efficiency in solar systems, making it a leader among the examined studies.
In comparison with the other listed studies, our study in Morocco clearly stands out for its exceptional solar performance. Our results fall within the upper range of most parameters, indicating the efficiency of solar installations in this region during this period. Variations in performance are often due to specific environmental, technological, and management factors unique to each installation. These results can have significant implications for the future development of solar energy in Morocco and in other regions with similar conditions.
5.8. Results of Analysis by Infrared Thermal Cameras
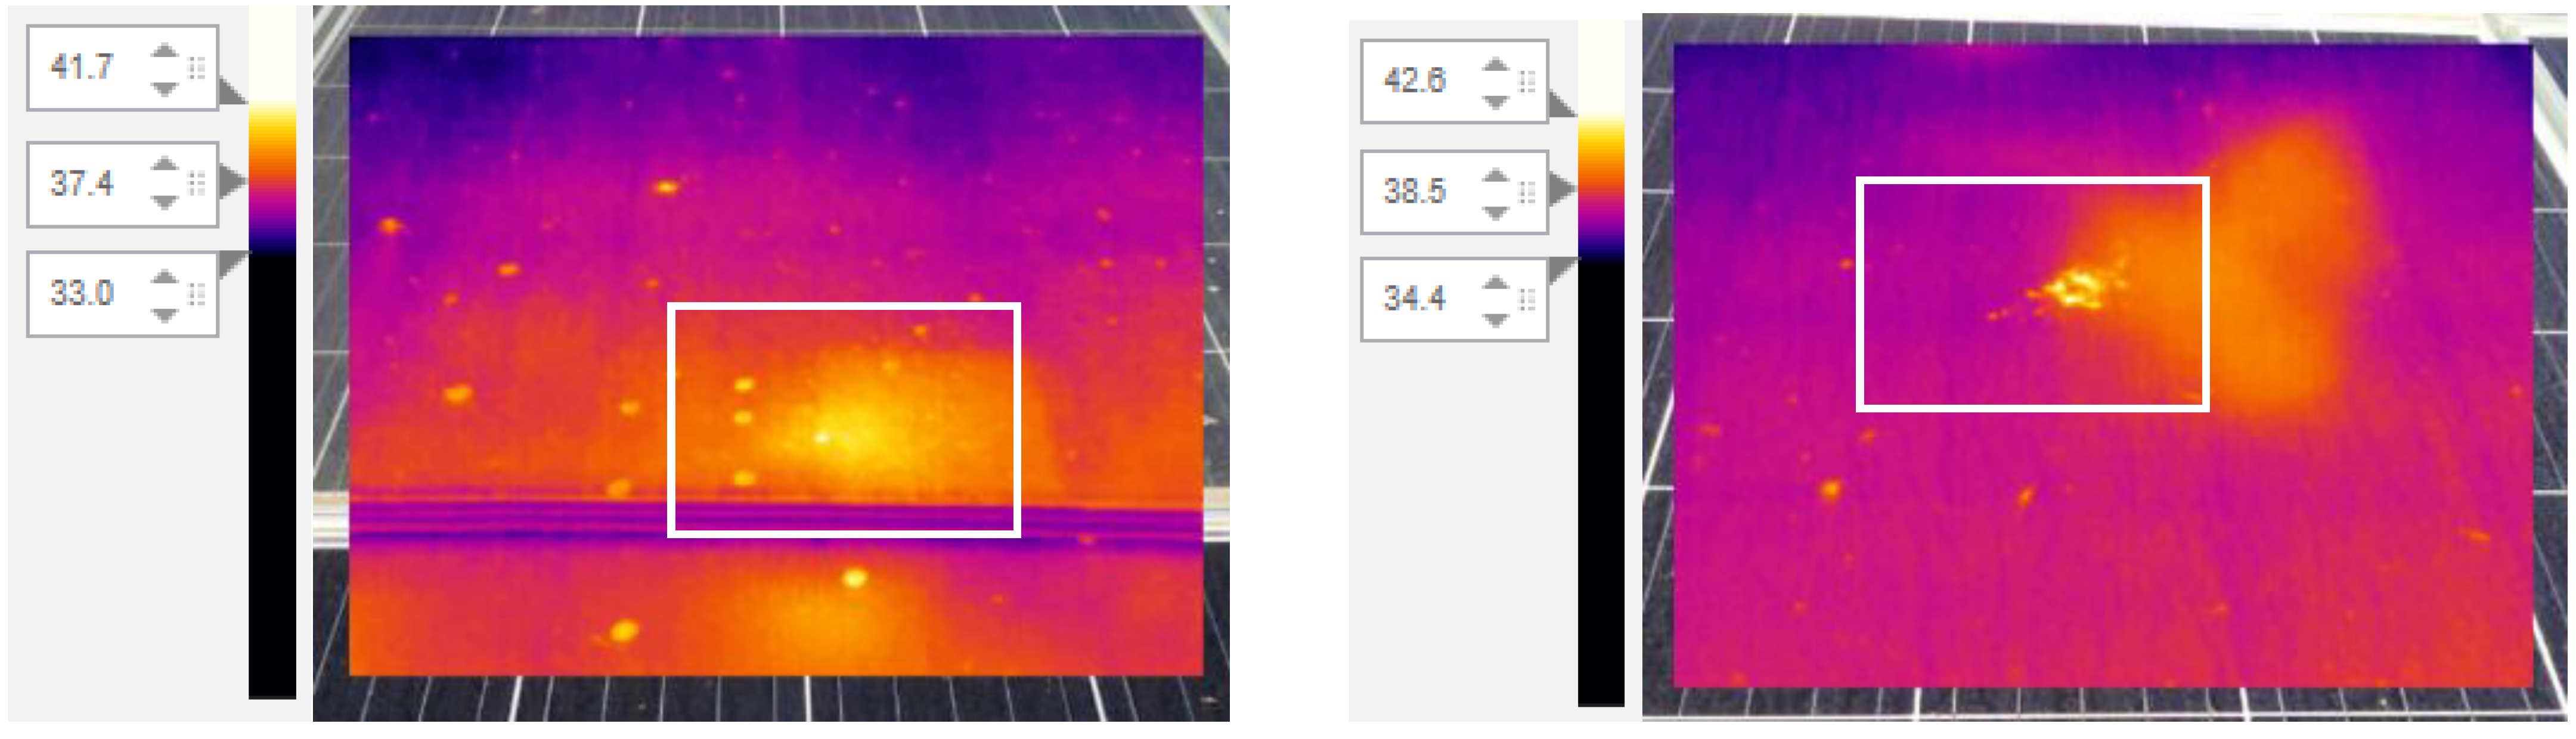
As illustrated in Figure 17, the presence of dirt created a partial shading area, which plays a crucial role in the formation of hotspots, as indicated. The hotspot shown in Figure 16 exhibits a temperature elevation of 3.24 °C compared with the average temperature.
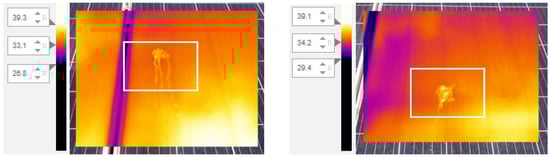
Figure 17.
Hotspot on a solar panel due to dirt.
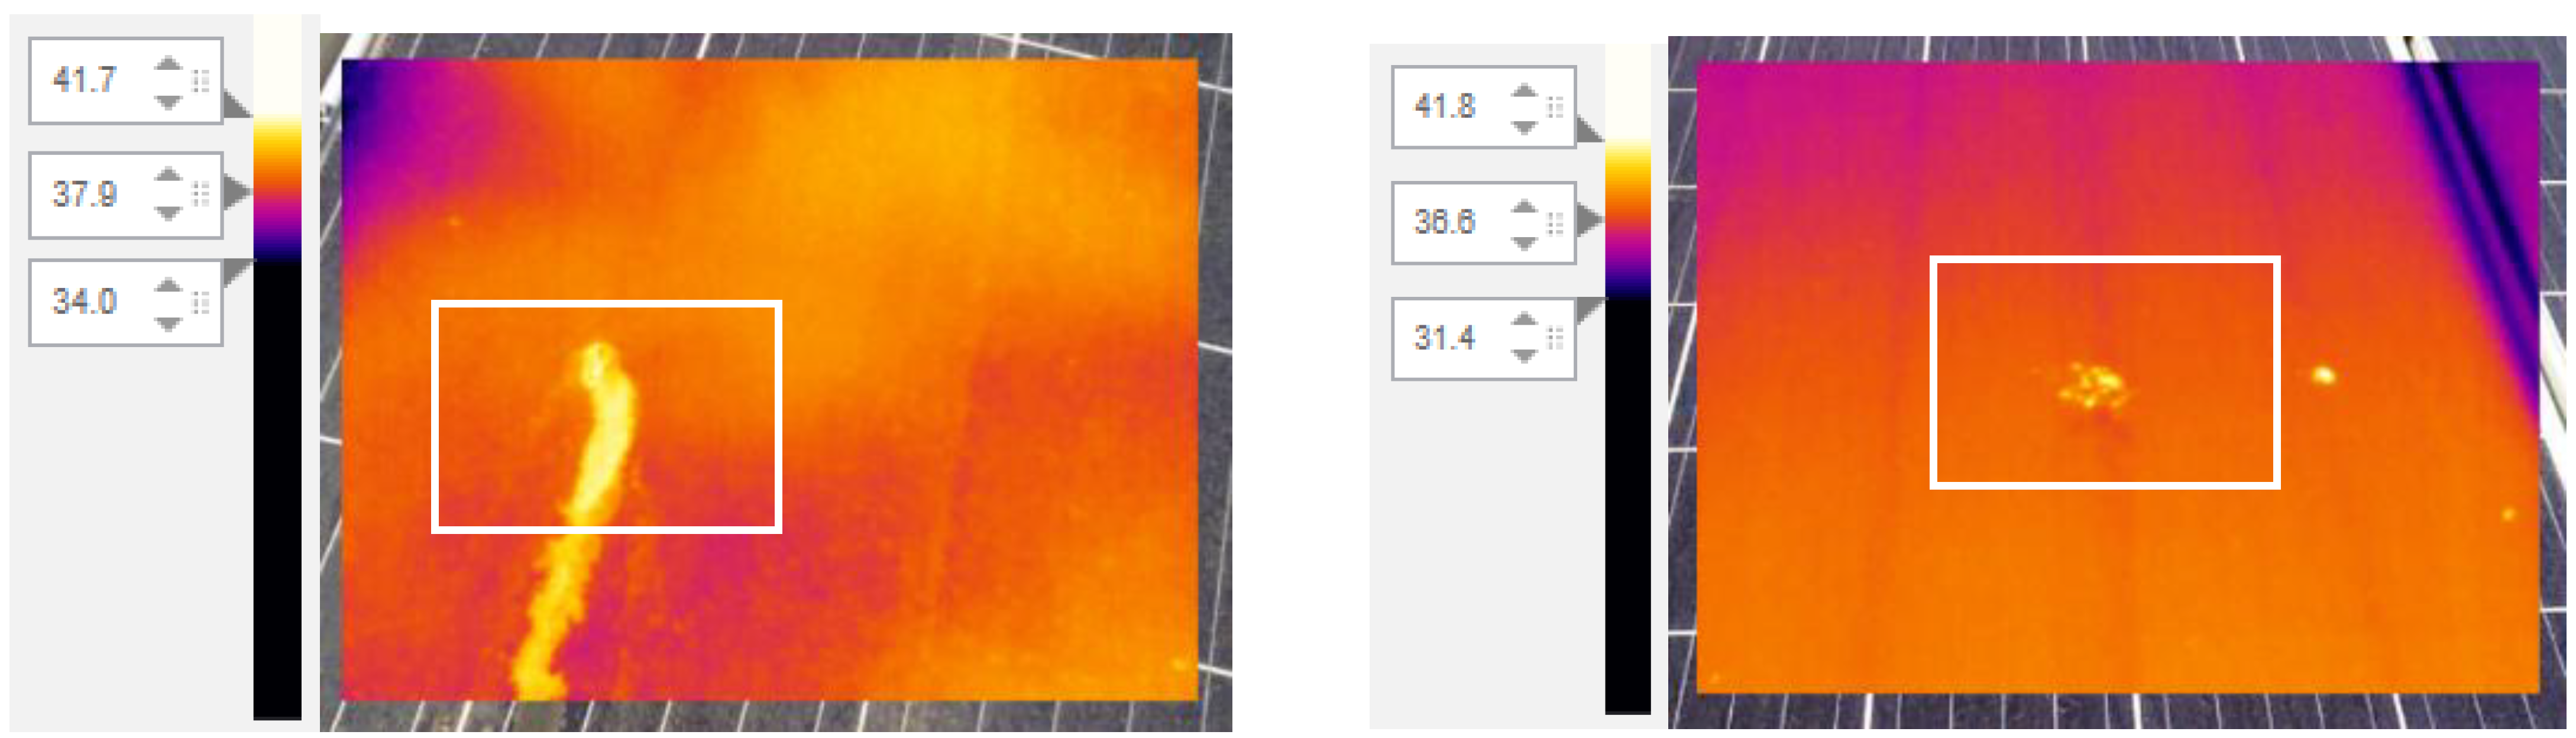
The non-uniform temperature distribution observed in the panel in Figure 18 is due to the accumulation of dust and dirt on the panel’s surface.
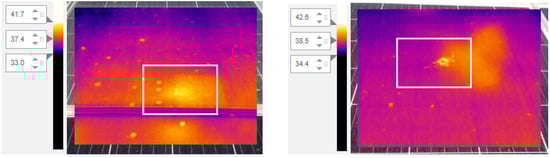
Figure 18.
Non-uniform temperature distribution due to the accumulation of dirt and bird droppings.
Figure 19 highlights a hotspot on a solar panel cell resulting from the presence of foreign objects on the solar panel’s surface. Partial shading caused by these materials led to a temperature increase of 3.07 °C compared with the average temperature.

Figure 19.
Hotspot caused by dirt on the surface of a solar panel.
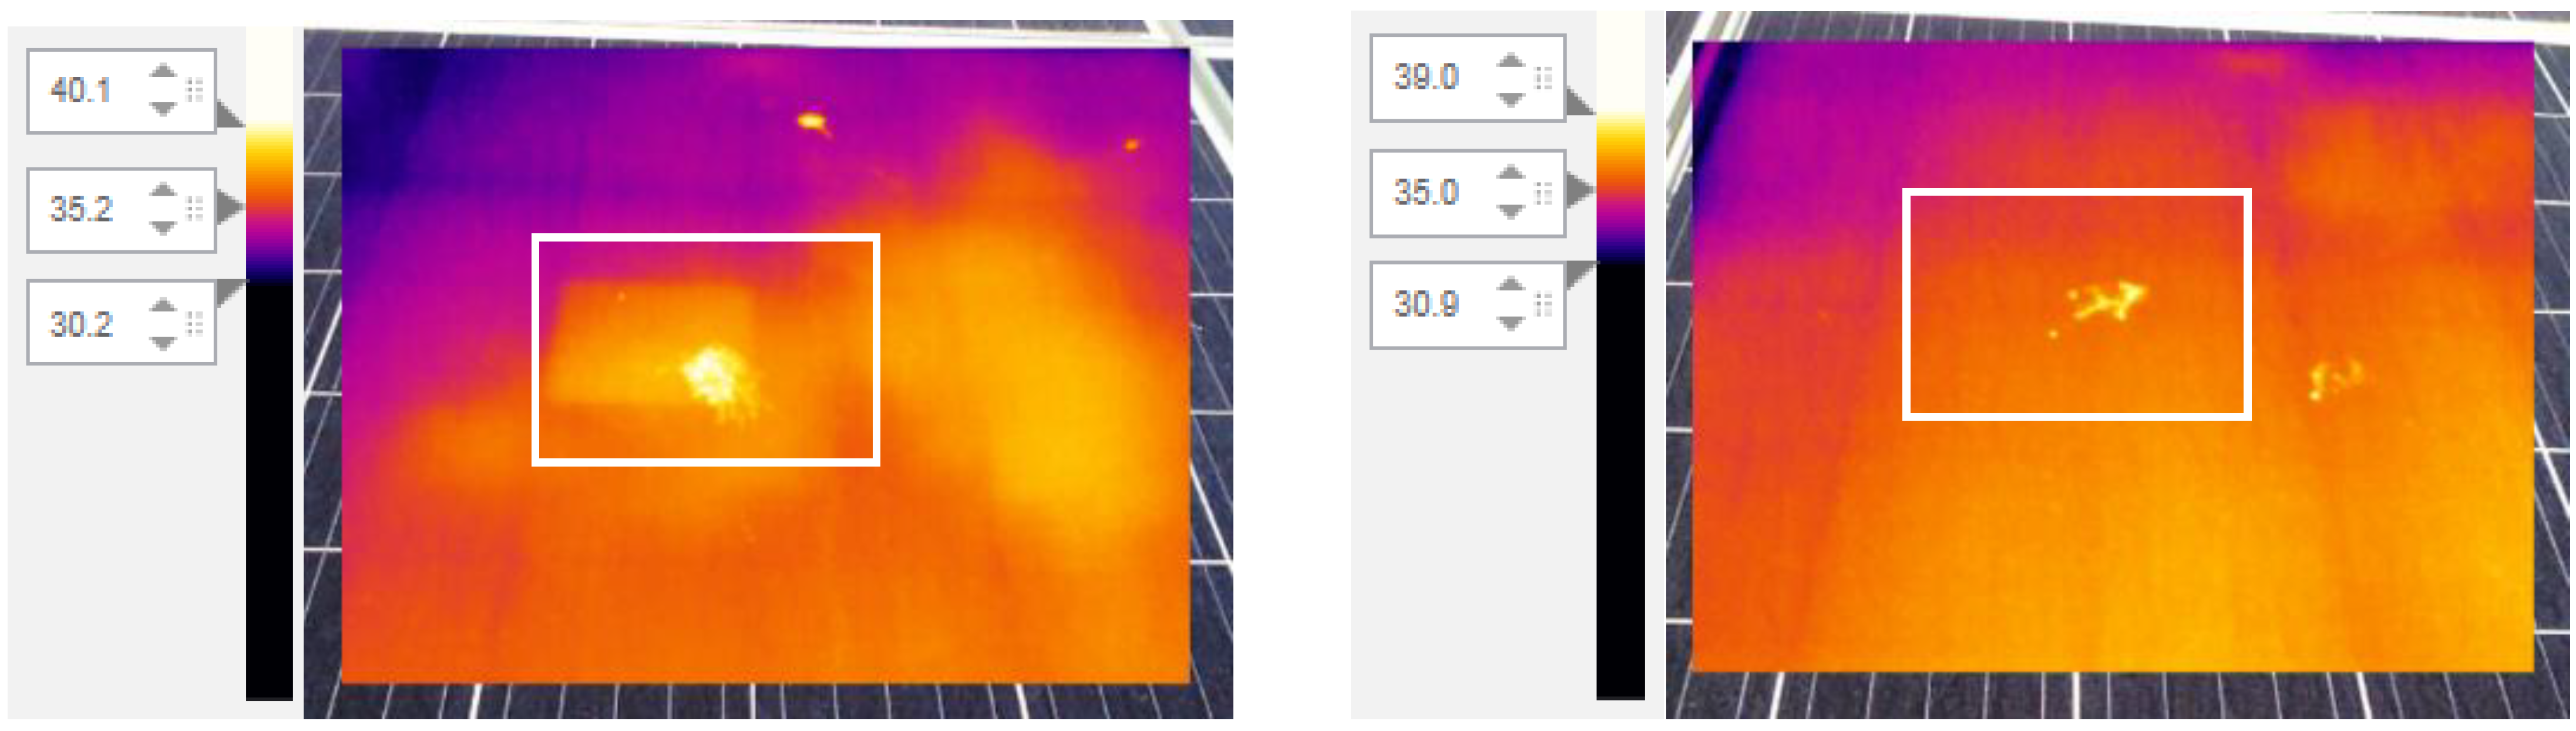
Figure 20 displays a single cell with an abnormal overheating of approximately 14 °C compared with the average temperature recorded in the other cells of the module. It is likely that this cell is damaged or defective, which could result in significant electricity production losses.
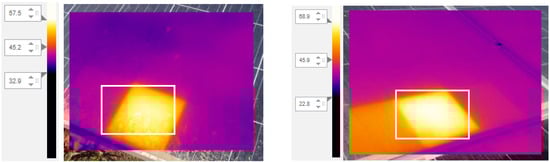
Figure 20.
Module with individual cell overheating.
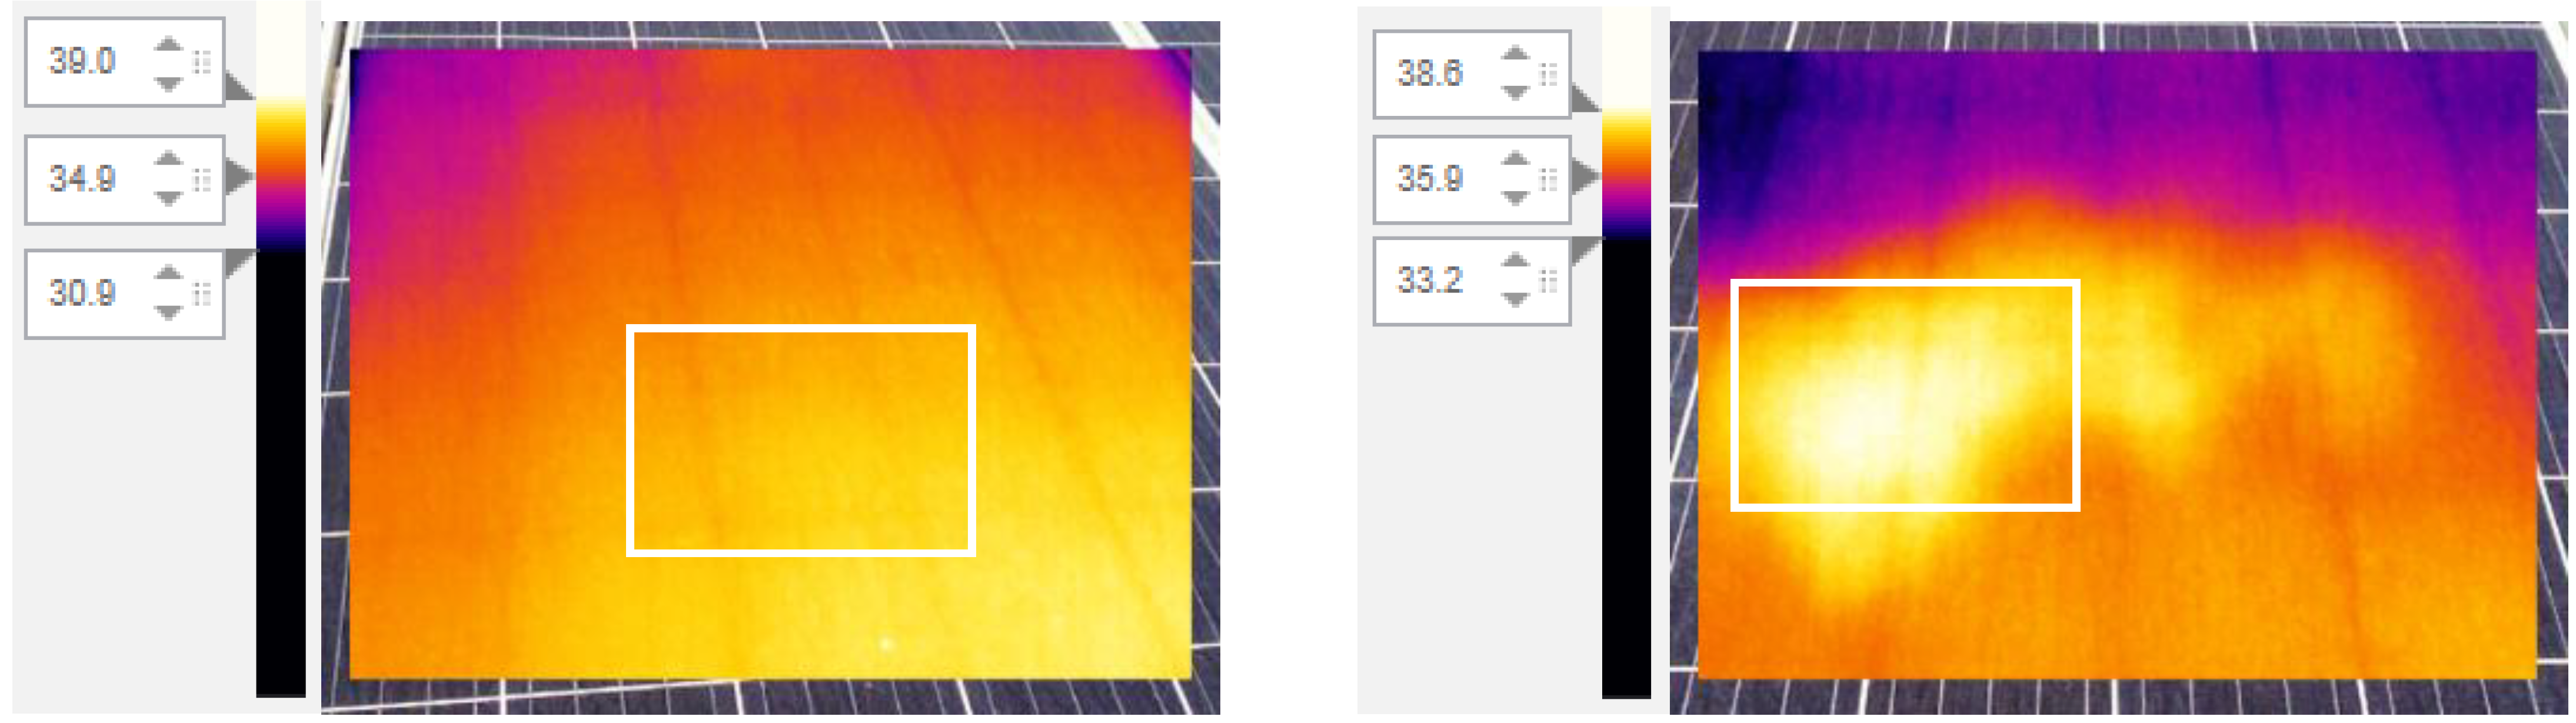
Figure 21 and Figure 22 depict a photovoltaic module experiencing a widespread increase in temperature, with average temperatures of 36.56 °C and 36.10 °C, respectively. This condition is likely a result of the widespread accumulation of dust on the surface of the photovoltaic module, leading to the formation of shadows. This accumulation may be due to the limited precipitation recorded in the region, which could contribute to the self-cleaning of the photovoltaic modules.
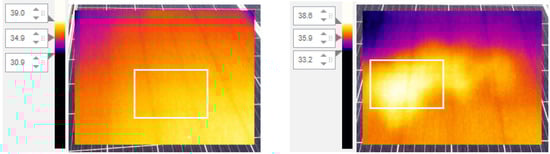
Figure 21.
Solar module illustrating widespread heating.
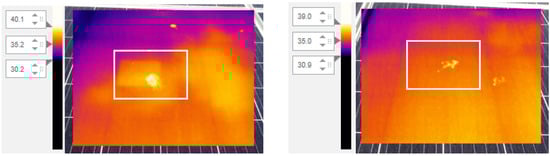
Figure 22.
Solar module illustrating widespread heating with some hotspot areas.
The thermographic analysis conducted on the 30 selected thermal image samples during this study reveals that 99% of these samples exhibit an average temperature difference of 5.02 °C between the hottest and coldest points. Temperature deviations of 14 °C indicate severe faults, while a temperature range of 10 °C to 30 °C suggests moderate severity issues. Any temperature deviations below 10 °C are considered normal.
Despite the current observation showing relatively minor severity issues with the solar panels, it is advisable to conduct regular thermal inspections in the future as the severity of issues may increase due to operational changes. Temperature variations exceeding 20 °C can lead to gradual system degradation over time, potentially resulting in more severe failures. Therefore, based on the findings of my thermographic analysis conducted on our 1 MW solar station, the photovoltaic system appears to be in good condition. However, more frequent cleaning of the solar panels can contribute to improving system performance.
5.9. Cleaning Photovoltaic Solar Panels
In general, the cleaning methods for photovoltaic solar panels can be classified into three categories: rain cleaning, manual cleaning, and robot cleaning. However, the focus of research on surface cleaning of PV modules has been limited.
For this purpose, we propose two methods for cleaning photovoltaic solar panels:
- Method 1: Dry cleaning: This method involves using cotton mops to remove dust from the panels. It is suitable for regular cleaning and can effectively eliminate encrusted stains on the panels. For stubborn stains, a second mop dampened with water should be used. It is important to clean in the direction of the wind to prevent dust from spreading onto already cleaned panels.
- Method 2: Cleaning with distilled water: Due to the high cost of distilled water, an alternative approach is to collect water from air conditioners and condensed water from factory boilers. It is important to avoid using brackish water from the mains to prevent potential corrosion issues. Cleaning with distilled water is planned to be carried out twice a year, while dry cleaning will be performed ten times a year. Monthly cleaning is recommended, except during months with high rainfall.
5.10. The Economic Profitability of the Photovoltaic Solar Power Plant
To calculate the levelized cost of electricity (LCOE) for our 1-megawatt (MW) solar station over a 25-year period, we use the following data:
- Initial Costs:
Investment costs: DHS 875,869.
Development and installation costs: DHS 291,956.
- 2.
- Operating and Maintenance (O&M) Costs:
Annual O&M costs: DHS 257,000 per year.
- 3.
- Electricity Production:
Projected Annual Production: 1600 MWh.
- 4.
- Expected Rate of Return:
Discount rate (IRR): 6% per year.
Now, let us calculate the LCOE by following these steps:
- Step 1:
- Calculate the total initial costs.
Total Initial Costs = Investment Costs + Development and Installation Costs
Total Initial Costs = 875,869 DHS + 291,956 DHS = 1167,826 DHS.
- Step 2:
- Calculate the total operating and maintenance costs over the 25-year lifespan.
Total O&M Costs = Annual O&M Costs × Lifespan
Total O&M Costs = 257,000 DHS per year × 25 years = 642,500 DHS
- Step 3:
- Calculate the total electricity production over the 25-year lifespan.
Total Electricity Production = Projected Annual Production × Lifespan
Total Electricity Production = 1600 MWh per year × 25 years = 40,000 MWh
- Step 4:
- Use the LCOE formula to calculate the present value cost of electricity.
LCOE = (Total Initial Costs + Total O&M Costs)/(Total Electricity Production discounted over the lifespan)
LCOE = (1,167,826 + 642,500)/(40,000 MWh/1000 MWh per GWh) × (1 GWh/1 MW) = 45.26 DHS/MWh.
Therefore, the LCOE for our solar station is DHS 45.26 per megawatt-hour (MWh) over a 25-year period with an expected rate of return of 6% per year. This means that the average present value cost of producing electricity per MWh from this solar facility is DHS 45.26.
To calculate the payback period for our 1 MW solar station with an initial investment of DHS 12,000,000 and an annual net income of DHS 1,465,485, we use the following formula:
Payback = Initial investment/Annual net income = 12,000,000/1,465,485 ≈ 8.18 years.
The payback period for our solar station is approximately 8.18 years, which means it will take about 8.18 years to recover the initial investment of DHS 12,000,000 with the annual net income generated by the project. After this period, the project will start generating a net profit.
This is a relatively short payback period, which is generally considered a good indicator of profitability for a project.
5.11. Environmental Impacts of the Photovoltaic System
As mentioned earlier, this photovoltaic solar system generated a total of 1600 MWh for the review year of 2022. By applying Equation (17), this generation corresponds to a carbon savings of 1051 tons of CO2 equivalent per year that can be avoided. To put it in perspective, this is equivalent to the emissions from 294 round-trip flights between Casablanca and Sydney or the carbon sequestration provided by 32,627 trees.
6. Conclusions
This article presents the monitoring and evaluation of a grid-connected PV system with a capacity of 1001 kWp installed at a factory in Morocco throughout the year 2022. The findings of the study are as follows:
- The total electricity delivered to the grid was 1,610,064 kWh.
- The average annual final yield of the system was determined to be 4.5 kWh/kWp.
- The average annual performance ratio of the system was found to be 84%.
- The average annual capacity factor, which indicates the actual energy output relative to the maximum potential output, was calculated to be 18.6%.
- The average module efficiency over the year was recorded at 16.9%.
- The average overall system efficiency throughout the year was measured at 16.4%.
- The inverter, responsible for converting DC power to AC power, demonstrated an average efficiency of 96.6% over the year.
The positive environmental impact of this project is significant, with an estimated reduction of 1051 tons of CO2. By generating (1,610,064 kWh) of clean electricity, the PV system helped reduce carbon emissions by replacing fossil fuel-based power generation. This reduction in emissions contributes to improved air quality and mitigates climate change.
Moreover, this project not only diversifies the factory’s energy sources by generating approximately 1.7 GWh of renewable energy per year but also enhances our sustainable energy profile. The total electricity delivered to the grid likely generated revenue with feed-in tariffs or power purchase agreements, contributing to the overall financial viability of the PV system. As a result, the factory experienced reduced energy procurement costs with the use of locally generated electricity. This cost-saving benefit is underscored by the impressive average module efficiency of 16.9% and the overall system efficiency of 16.4%, highlighting the effectiveness of harnessing solar energy to mitigate electricity expenses.
The results of this study demonstrate that the photovoltaic system operated efficiently throughout the year 2022, despite variations in environmental conditions in Morocco. The data obtained will serve as a reference for future comparisons with a new photovoltaic solar plant planned for the end of 2023, which will operate under similar climate conditions. The information gathered from running this PV system can play a significant role in advancing solar technology and knowledge in the global solar energy transition.
Author Contributions
Conceptualization, H.E.; methodology, H.E. and L.B.; validation, M.K. and A.E.A.; formal analysis, H.E.; investigation, H.E.; resources, H.E.; data curation, H.E.; writing—original draft preparation, H.E.; writing—review and editing, L.B., M.K. and A.E.A.; visualization, H.E.; supervision, M.K.; funding acquisition, H.E. All authors have read and agreed to the published version of the manuscript.
Funding
This research received no external funding.
Data Availability Statement
The data that support the findings of this study are available on request from the corresponding author, (H.E.), upon reasonable request.
Conflicts of Interest
The authors declare no conflict of interest.
References
- Country Indicators and Sdgs (IRENA: International Renewable Energy Agency). Available online: https://www.irena.org/-/media/Files/IRENA/Agency/Statistics/Statistical_Profiles/Africa/Morocco_Africa_RE_SP.pdf (accessed on 15 August 2023).
- Minister of Energy in Morocco, Annual Key Figures for the Energy Sector in 2021. Available online: https://www.mem.gov.ma (accessed on 21 April 2022).
- Shukla, A.K.; Sudhakar, K.; Baredar, P. Simulation and performance analysis of 110 kWp grid-connected photovoltaic system for residential building in India: A comparative analysis of various PV technology. Energy Rep. 2016, 2, 82–88. [Google Scholar] [CrossRef]
- Saeed, E.; Mehran, A.; Masoud, I. Comparative performance investigation of mono- and poly-crystalline silicon photovoltaic modules for use in grid-connected photovoltaic systems in dry climates. Appl. Energy 2015, 160, 255–265. [Google Scholar]
- Emziane, M.; Al Ali, M. Performance assessment of rooftop PV systems in Abu Dhabi. Energy Build 2015, 108, 101–105. [Google Scholar] [CrossRef]
- Padmavathi, K.; Daniel, S. Performance analysis of a 3 MWp grid connected solar photovoltaic power plant in India. Energy Sustain. Dev. 2013, 17, 615–625. [Google Scholar] [CrossRef]
- Yadav, S.; Sudhakar, K. Different domestic designs of solar stills: A review. Renew. Sustain. Energy Rev. 2015, 47, 718–731. [Google Scholar] [CrossRef]
- Shukla, K.N.; Rangnekar, S.; Sudhakar, K. Comparative study of isotropic and anisotropic sky models to estimate solar radiation incident on tilted surface: A case study for Bhopal, India. Energy Rep. 2015, 1, 96–103. [Google Scholar] [CrossRef]
- Shukla, K.N.; Sudhakar, K.; Rangnekar, S. A comparative study of exergetic performance of amorphous and polycrystalline solar PV modules. Int. J. Exergy 2015, 17, 433–455. [Google Scholar] [CrossRef]
- Shukla, A.K.; Sudhakar, K.; Baredar, P. Design, simulation and economic analysis of standalone roof top solar PV system in India. Sol. Energy 2016, 136, 437–449. [Google Scholar] [CrossRef]
- Babatunde, A.A.; Abbasoglu, S.; Senol, M. Analysis of the impact of dust, tilt angle, and orientation on the performance of PV Plants. Renew. Sustain. Energy Rev. 2018, 90, 1017–1026. [Google Scholar] [CrossRef]
- Dahmoun, M.E.H.; Bekkouche, B.; Sudhakar, K.; Guezgouz, M.; Chenafi, A.; Chaouch, A. Performance evaluation and analysis of grid-tied large scale PV plant in Algeria. Energy Sustain. Dev. 2021, 61, 181–195. [Google Scholar] [CrossRef]
- Sharma, R.; Goel, S. Performance analysis of a 11.2 kW roof top grid-connected PV system in Eastern India. Energy Rep. 2017, 3, 76–84. [Google Scholar] [CrossRef]
- 390W PERC Module. Available online: https://www.jasolar.com/uploadfile/2018/1215/20181215014429611.pdf (accessed on 20 December 2022).
- Specification Technique des Cellules Normafix. Available online: https://www.energytransfo.com (accessed on 12 June 2022).
- IEC Standard 61724; Photovoltaic System Performance Monitoring-Guidelines for Measurement Data Exchange and Analysis. IEC: London, UK, 1998.
- Dolara, A.; Grimaccia, F.; Leva, S.; Mussetta, M.; Faranda, R.; Gualdoni, M. Performance analysis of a single-axis tracking PV system. IEEE J. Photovolt. 2012, 2, 524–531. [Google Scholar] [CrossRef]
- Decker, B.; Jahn, U. Performance of 170 grid connected PV plants in Northern Germany—Analysis of yields and optimization potentials. Sol. Energy 1997, 59, 127–133. [Google Scholar] [CrossRef]
- Sidrach-de-Cardona, M.; Mora Lopez, L. Performance analysis of a grid-connected photovoltaic system. Energy 1999, 24, 93–102. [Google Scholar] [CrossRef]
- Ayompe, L.M.; Duffy, A.; McCormack, S.J.; Conlon, M. Measured performance of a 1.72 kW roof top grid connected photovoltaic system in Ireland. Energy Convers. Manag. 2011, 52, 816–825. [Google Scholar] [CrossRef]
- Chokmaviroj, S.; Wattanapong, R.; Suchart, Y. Performance of a 500 kWp grid connected photovoltaic system at Mae Hong Son Province, Thailand. Renew. Energy 2006, 31, 19–28. [Google Scholar] [CrossRef]
- Khatib, T.; Mohamed, A.; Sopian, K. A review of photovoltaic systems size opti-mization techniques. Renew. Sustain. Energy Rev. 2013, 22, 454–465. [Google Scholar] [CrossRef]
- Khatib, T.; Sopian, K.; Kazem, H. Actual performance and characteristic of a grid connected photovoltaic power system in the tropics: A short-term evaluation. Energy Convers. Manag. 2013, 71, 115–119. [Google Scholar] [CrossRef]
- Ya’acob, M.; Hizam, H.; Khatib, T.; Radzi, M. A comparative study of three types of grid connected photovoltaic systems based on actual performance. Energy Convers. Manag. 2014, 78, 8–13. [Google Scholar] [CrossRef]
- Congedo, P.M.; Malvoni, M.; Mele, M.; De Giorgi, M.G. Performance measurements of monocrystalline silicon PV modules in South-eastern Italy. Energy Convers. Manag. 2013, 68, 1–10. [Google Scholar] [CrossRef]
- Al-Otaibi, A.; Al-Qattan, A.; Fairouz, F.; Al-Mulla, A. Performance evaluation of photovoltaic systems on Kuwaiti schools’ rooftop. Energy Convers. Manag. 2015, 95, 110–119. [Google Scholar] [CrossRef]
- Micheli, D.; Alessandrini, S.; Radu, R.; Casula, I. Analysis of the outdoor performance and efficiency of two grid connected photovoltaic systems in northern Italy. Energy Convers. Manag. 2014, 80, 436–445. [Google Scholar] [CrossRef]
- Diez-Mediavilla, M.; Dieste-Velasco, M.I.; Rodrigues-Amigo, M.C.; Garcia-Calderon, T.; Alonso-Tristan, C. Performance of grid-tied PV facilities based on real data in Spain: Central inverter versus string system. Energy Convers. Manag. 2014, 86, 1128–1133. [Google Scholar] [CrossRef]
- Eltawil Mohamed, A.; Zhao, Z. Grid-connected photovoltaic power systems: Technical and potential problems—A review. Renew. Sustain. Energy Rev. 2010, 14, 112–129. [Google Scholar] [CrossRef]
- Spertino, F.; Corona, F. Monitoring and checking of performance in photovoltaic plants: A tool for design, installation and maintenance of grid-connected systems. Renew. Energy 2013, 60, 722–732. [Google Scholar] [CrossRef]
- Al-Sabounchi, A.; Yalyali, S.; Al-Thani, H. Design and performance evaluation of a photovoltaic grid-connected system in hot weather conditions. Renew. Energy 2013, 53, 71–78. [Google Scholar] [CrossRef]
- Mejia, F.; Kleissl, J.; Bosch, J. The effect of dust on solar photovoltaic systems. Energy Proc. 2014, 49, 2370–2376. [Google Scholar] [CrossRef]
- Almulla, A.; ElSherbini, A. Demand management through centralized control system using power line communication for existing buildings. Energy Convers. Manag. 2014, 79, 477–486. [Google Scholar] [CrossRef]
- Ya’acob, M.E.; Hizam, H.; Htay, M.T.; Radzi, M.A.M.; Khatib, T.; Adam, M.B. Calculating electrical and thermal characteristics of multiple PV array configurations installed in the tropics. Energy Convers. Manag. 2013, 75, 418–424. [Google Scholar] [CrossRef]
- Trinuruk, P.; Sorapipatana, C.; Chenvidhya, D. Estimating operating cell temperature of BIPV modules in Thailand. Renew. Energy 2009, 34, 2515–2523. [Google Scholar] [CrossRef]
- FLUKE Infrared Thermal Imaging Camera. Available online: https://www.fluke.com/fr-ch (accessed on 14 September 2023).
- Li, W.; Li, J.; Hu, Z.; Li, S.; Chan, P.W. A novel probabilistic approach to optimize stand-alone hybrid wind-photovoltaic renewable energy system. Energies 2020, 13, 4945. [Google Scholar] [CrossRef]
- Chimtavee, A.; Ketjoy, N. PV generator performance evaluation and load analysis of the PV microgrid system in Thailand. Procedia Eng. 2012, 32, 384–391. [Google Scholar] [CrossRef]
- Eke, R.; Demircan, H. Performance analysis of a multi-crystalline Si photovoltaic module under Mugla climatic conditions in Turkey. Energy Convers. Manag. 2013, 65, 580–586. [Google Scholar] [CrossRef]
- Tripathi, B.; Yadav, P.; Rathod, S.; Kumar, M. Performance analysis and comparison of two silicon material based photovoltaic technologies under actual climatic conditions in Western India. Energy Convers. Manag. 2014, 80, 97–102. [Google Scholar] [CrossRef]
- Kumar, K.A.; Sundareswaran, K.; Venkateswaran, P.R. Performance study on a grid-connected 20 kWp solar photovoltaic installation in an industry in Tiruchirappalli (India). Energy Sustain. Dev. 2014, 23, 294–304. [Google Scholar] [CrossRef]
- Mpholo, M.; Nchaba, T.; Monese, M. Yield and performance analysis of the first grid-connected solar farm at Moshoeshoe I International Air- port, Lesotho. Renew. Energy 2015, 81, 845–852. [Google Scholar] [CrossRef]
- Omkar, K.; Srikanth, M.V.; Swaroop, K.P.; Rao, R. Performance evaluation of 50 KWp rooftop solar PV plant. In Proceedings of the IEEE International Conference on Industrial Instrumentation and Control (ICIC), Pune, India, 28–30 May 2015. [Google Scholar]
- Milosavljevi’c, D.D.; Pavlovi´c, T.M.; Piršl, D.S. Performance analysis of A grid-connected solar PV plant in Niš, republic of Serbia. Renew. Sustain. Energy Rev. 2015, 44, 423–435. [Google Scholar] [CrossRef]
- Attari, K.; Elyaakoubi, A.; Asselman, A. Performance analysis and investigation of a grid-connected photovoltaic installation in Morocco. Energy Rep. 2016, 2, 261–266. [Google Scholar] [CrossRef]
- Shravanth Vasisht, M.; Srinivasan, J.; Ramasesha, S.K. Performance of solar photovoltaic installations: Effect of seasonal variations. Sol. Energy 2016, 131, 39–46. [Google Scholar] [CrossRef]
- Elhadj Sidi, C.E.B.; Ndiaye, M.L.; El Bah, M.; Mbodji, A.; Ndiaye, A.; Ndiaye, P.A. Performance analysis of the first large-scale (15 MWp) grid-connected photovoltaic plant in Mauritania. Energy Convers. Manag. 2016, 119, 411–421. [Google Scholar] [CrossRef]
- de Lima, L.C.; de Araújo Ferreira, L.; de Lima Morais, F.H.B. Performance analysis of a grid connected photovoltaic system in northeastern Brazil. Energy Sustain. Dev. 2017, 37, 79–85. [Google Scholar] [CrossRef]
- Quansah, D.A.; Adaramola, M.S.; Appiah, G.K.; Edwin, I.A. Performance analysis of different grid-connected solar photovoltaic (PV) system technologies with a combined capacity of 20 kW located in humid tropical climate. Int.J. Hydrogen Energy 2017, 42, 4626–4635. [Google Scholar] [CrossRef]
- Yadav, S.K.; Bajpai, U. Performance evaluation of a rooftop solar photovoltaic power plant in Northern India. Energy Sustain. Dev. 2018, 43, 130–138. [Google Scholar] [CrossRef]
- Tahri, F.; Tahri, A.; Oozeki, T. Performance evaluation of grid-connected photovoltaic systems based on two photovoltaic module technologies under tropical climate conditions. Energy Convers. Manag. 2018, 165, 244–252. [Google Scholar] [CrossRef]
- Akhter, M.N.; Mekhilef, S.; Mokhlis, H.; Olatomiwa, L.; Muhammad, M.A. Performance assessment of three grid-connected photovoltaic systems with combined capacity of 6.575 kWp in Malaysia. J. Clean. Prod. 2020, 277, 123242. [Google Scholar] [CrossRef]
- Mensah, L.D.; Yamoah, J.O.; Adaramola, M.S. Performance evaluation of a utility-scale grid-tied solar photovoltaic (PV) installation in Ghana. Energy Sustain. Dev. 2019, 48, 82–87. [Google Scholar] [CrossRef]
- Adebiyi, A.A.; Ojo, E.E.; Davidson, I.E. Performance Evaluation of a Grid-Tied PV System in the East Coast of South Africa. In Proceedings of the IEEE PES/IAS PowerAfrica, Nairobi, Kenya, 25–28 August 2020. [Google Scholar]
- Ayora, E.; Mathew Munji, M.; Kaberere, K.; Thomas, B. Performance analysis of 600 kWp grid-tied rooftop solar photovoltaic systems at strathmore university in Kenya. Results Eng. 2023, 19, 101302. [Google Scholar] [CrossRef]
- Owolabi, A.B.; Yakub, A.O.; Li, H.X.; Dongjun Suh, D. Performance evaluation of two grid-connected solar photovoltaic systems under temperate climatic conditions in South Korea. Energy Rep. 2022, 8, 12227–12236. [Google Scholar] [CrossRef]


Disclaimer/Publisher’s Note: The statements, opinions and data contained in all publications are solely those of the individual author(s) and contributor(s) and not of MDPI and/or the editor(s). MDPI and/or the editor(s) disclaim responsibility for any injury to people or property resulting from any ideas, methods, instructions or products referred to in the content. |
© 2023 by the authors. Licensee MDPI, Basel, Switzerland. This article is an open access article distributed under the terms and conditions of the Creative Commons Attribution (CC BY) license (https://creativecommons.org/licenses/by/4.0/).