Article

Numerical Prediction on In-Cylinder Mixture Formation and Combustion Characteristics for SIDI Engine Fueled with Hydrogen: Effect of Injection Angle and Equivalence Ratio

1
Graduate School, Department of Mechanical Engineering, Chosun University, 10, Chosundae 1-gil, Dong-gu, Gwangju 61452, Republic of Korea
2
Department of Mechanical Engineering, Chosun University, 10, Chosundae 1-gil, Dong-gu, Gwangju 61452, Republic of Korea
*
Author to whom correspondence should be addressed.
Energies 2023, 16(22), 7509; https://doi.org/10.3390/en16227509
Submission received: 17 October 2023 / Revised: 4 November 2023 / Accepted: 7 November 2023 / Published: 9 November 2023
(This article belongs to the Special Issue Vehicle Engines and Powertrains: Performance, Combustion and Emission)

Abstract

:
Although their ease of transport, storage, and use makes hydrocarbon fuels dominant in commercial energy systems, the emission of harmful gases, including greenhouse gases, is a fatal disadvantage. Despite ongoing research to improve thermal efficiency and reduce the emissions of internal combustion engines using conventional hydrocarbon fuels, achieving net-zero carbon requires decarbonizing fuels rather than reducing the use of internal combustion engines. Hence, transitioning away from hydrocarbon fuels and evolving internal combustion engines into clean engines using carbon-free fuels, such as hydrogen, is necessary. This study designs a 2.0 L research engine and numerically analyzes its combustion characteristics and spray behavior by varying the spray angle and equivalence ratio. When comparing the turbulence kinetic energy at a 45-degree spray angle with that at 30 degrees and 60 degrees, on average, there was a difference of approximately 37.54 m2/s2 and 26.21 m2/s2, respectively. However, misfires occur in the lean condition. Although hydrogen has a wide flammability range, poor mixture formation under lean conditions can result in misfires. The 60-degree spray angle resulted in the highest combustion temperatures and pressures for all equivalence ratio conditions, consequently leading to the highest emissions of nitrogen oxides. Specifically, at a lambda value of 2.5, the 60-degree spray angle emitted approximately 29 ppm, 0 ppm, and 161 ppm of nitrogen oxides for each respective spray angle.

1. Introduction

Hydrocarbon fuels currently hold a dominant position in global energy systems [1,2]. Hydrocarbon fuels can be easily used, stored, and transported but have a fatal disadvantage in that considerable amounts of harmful emissions, including greenhouse gases (GHGs), are emitted when they are burned [3]. As environmental issues emerge worldwide, nations and corporations are trying to achieve net-zero carbon through agreements such as the 2015 Paris Climate Agreement [4,5]. Many countries around the world have declared their commitment to achieving carbon neutrality, yet only 4.5% of them have actually reached this goal. The majority of countries have announced plans to achieve carbon neutrality by 2050 or 2070 [6]. Approximately 74.8% of GHG emissions are emitted from passenger cars and commercial vehicles [7]. Accordingly, many researchers are conducting a lot of research to maximize the performance and thermal efficiency of existing gasoline and diesel engines and reduce exhaust emissions and harmful vibration and acoustic impacts [5,8,9,10,11]. Research is being conducted using various experimental and analytical methods to use hydrogen and ammonia, known as carbon-free fuels, mixed with gasoline, diesel, and methane in the engines commonly used in transportation vehicles.
Meaningful experimental and numerical studies have been conducted on combustion characteristics, engine performance, and emission characteristics when hydrogen is mixed with gasoline engines [12,13,14,15]. When a certain fraction of hydrogen was mixed with gasoline engines, each study showed the same increasing trend in brake thermal efficiency (BTE) and the same or higher BTE than when driving with gasoline alone. In addition, as the hydrogen mixing rate increased, primary harmful emissions, such as CO, CO2, and HC, decreased. Regardless of the distinction between naturally aspirated and turbocharged engines and between experiments and numerical analysis, it was confirmed that performance, emission, and fuel economy were positively affected as the mixing fraction of hydrogen increased.
Park et al., Zhang et al., and Zhen et al. reported the addition of hydrogen to methane-fueled engines [16,17,18]. As the hydrogen mixture fraction in the methane engines increased, the combustion efficiency increased, and complete combustion became possible; thus, the lean operation limit was extended, and the heat release rate (HRR), in-cylinder combustion pressure, and temperature increased. As a result, mixing hydrogen with a methane engine tended to increase the BTE, and it was possible to improve the thermal and fuel efficiencies by reducing the brake-specific fuel consumption (BSFC). As the hydrogen mixture fraction increased, the emissions of CO, CO2, and HC decreased, similar to the performance shown by the gasoline–hydrogen mixture. Blending hydrogen into a methane-fueled engine showed improved performance in terms of BTE, BSFC, and noxious emissions.
Seelam et al. and Frost et al. reported studies on adding hydrogen and ammonia to diesel engines [19,20]. When hydrogen was mixed with the diesel engine, the BTE and HRR tended to increase as the fraction of hydrogen increased. In addition, BSFC and COx (carbon oxide) emissions decreased. When ammonia, which is being studied as a carbon-free fuel along with hydrogen, was mixed into a diesel engine, it helped the engine load, whereas nitrogen oxide (NOx) generation decreased by 20% compared to a single diesel fuel. As a result, when hydrogen or ammonia was mixed with a diesel engine, it showed improved performance compared to the previous engine in terms of BTE and emissions.
These studies showed that the overall performance, BTE, and emissions appear to have a more positive effect when hydrogen or ammonia is added to conventional fossil fuels. Although a mixture of carbon-free fuels can be directly applied to existing single-fuel engines, problems related to infrastructure and practicality are emerging with the use of dual fuels.
In addition, despite the above research, it is fundamentally necessary to use carbon-free fuel as the only fuel in engines to achieve the ultimate goal of net-zero carbon. Therefore, it is necessary to avoid using hydrocarbon fuels completely and pursue the selective evolution of internal combustion engines through hydrogen-converted engines, which are COx-free fuel alternatives that can replace them.
Because hydrogen is a completely carbon-free fuel, the hydrogen combustion engine does not emit carbon due to the fuel composition. However, a small amount of engine oil penetrates the engine combustion chamber and participates in combustion to emit a very small amount of COx; however, most environmental regulations are satisfied without additional after-treatment devices [21]. The only emission from hydrogen-converted engines is NOx, which is caused by a high combustion temperature and is known as thermal NOx. NOx emissions can be considerably reduced by pursuing low-temperature combustion operation and lowering the combustion pressure and temperature through lean operation. Additionally, by utilizing after-treatment technologies, such as water injection, exhaust gas recirculation, and selective catalytic reduction, the NOx emitted from the tailpipe can be reduced to meet the increasingly stringent environmental regulations (EURO7, SULEV) [22,23]. However, ammonia is considered a nitrogen-based fuel and requires consideration of fuel NOx emissions during combustion [24]. However, because of the chemical properties of ammonia, such as combustion instability, it is challenging to apply it directly to engines [25]. Furthermore, after-treatment devices for reducing NOx are essential because ammonia is a highly toxic fuel. Therefore, there is a risk of its direct application to existing systems without completely solving the issue of ammonia slip.
Kiesgen et al. reported on BMW Hydrogen7, which commercialized a hydrogen engine, and Ford succeeded in bringing a hydrogen engine to market [26,27,28]. BMW Hydrogen7 is a turbocharged V12 engine with a cryogenic storage system and PFI and is operated using mono- and bi-fuels with gasoline. Because the vehicle adopts an engine that uses hydrogen as fuel, the emissions from the tailpipe are almost zero, and the performance is compliant with the torque and power required by a typical car, and it shows 3.7 kg per 100 km in the FTP-75. However, as previously mentioned, the PFI in hydrogen engines lowers the engine volumetric efficiency, and despite optimized fuel injection, valve timing, and ignition timing, the risk of abnormal combustion, such as backfire, knocking, and pre-ignition, cannot be fully eliminated. Hence, using direct-injection systems is essential for hydrogen engines. In addition to the transportation sector, hydrogen engines should also benefit commercial vehicles, such as trucks, that primarily use diesel or CNG engines, and heavy equipment, such as excavators, mobile cranes, and loaders, that operate in harsh environments by reducing COx emissions and pursuing zero emissions. Therefore, to convert the energy available from hydrogen into the maximum engine output, DI systems must be applied to compensate for the disadvantages of PFI systems and solve safety issues.
Among the previously reported studies, an experimental study was conducted on the visualization of hydrogen spray for application to a hydrogen engine DI system [29]. These studies proved that hydrogen shows rapid diffusivity and permeability, unlike conventional hydrocarbon fuels, in various environments, and the unique behavior of hydrogen spray was confirmed.
This study created a virtual research engine to analyze the behavior, mixing, and combustion characteristics of hydrogen sprays in a reciprocating engine with a simplified geometry through 1D and 3D computational fluid dynamics (CFD) numerical analyses. Engine performance, emissions, and combustion characteristics were analyzed through a 1D numerical analysis, and a 3D CFD analysis was conducted based on the 1D numerical analysis results. Through 3D CFD analysis, the accuracy and reliability of the spray behavior and combustion characteristics analyses were pursued using the engine 3D modeling data, which is the limitation of the 1D analysis. In the context of 3D CFD analysis, we conducted an investigation by varying the spray angle of hydrogen to analyze the spray pattern and the behavior of hydrogen within a cylinder. Through case studies, we predicted and researched the impact of hydrogen spray angle and excess air ratio. This allowed us to analyze the characteristics of mixture formation and combustion under rich and lean conditions for hydrogen, depending on the spray angle. Furthermore, this research offers novelty by potentially aiding in the optimization of hydrogen spray patterns.

2. Materials and Methods

Reference Engine Specification

The study engine was a 2.0 L in-line 4-cylinder, 4-stroke, SI-DI engine with specifications commonly used in vehicles. The specifications and operating environments of the engine are listed in Table 1. In the 1D simulation environment, the designed research engine was simulated and analyzed at full scale, whereas in the 3D CFD analysis, only one cylinder was configured as the analysis domain to reduce the analysis load and accurately analyze the case.

3. 1D Simulation

This study performed a 1D numerical analysis by modeling the engine using the GT-POWER Engine library of GT-SUITE, a program for numerical engine analysis based on thermodynamics. The GT-POWER can predict the performance characteristics of an engine system under steady-state conditions or transient behavior. In the 1D simulation, the operating variables of the engine were analyzed using the factors for the primary operating variables as input data, as listed in Table 1. The target engine was supercharged by applying a turbocharger, and the boost pressure control simulated the wastegate and achieved and maintained the target boost pressure through PID control.
In GT-POWER, combustion is defined as the transfer of a defined mass of unburned fuel and air and its associated enthalpy from the unburned region to the burned region in a cylinder, calculating the chemical energy release of the fuel and air mixture and the species and concentrations that result from combustion. In addition, in the GT-POWER, the combustion rate was controlled by the burn rate. The burn rate can be predicted using experimental values as input data or by analysis, depending on the combustion model. The predictive combustion model uses the pressure, temperature, equivalence ratio, and residual fraction to predict and analyze the burn rate. This study used the spark-ignition turbulent flame model (SI-Turb), which predicts and calculates the burn rate of a spark-ignition engine. The SI-Turb prediction model considers the cylinder geometry, spark location and timing, air motion, and fuel characteristics.
In the SI-Turb combustion model, the laminar flame velocity was calculated using Equation (1), and the dilution effect was modified using a dilution effect multiplier, as shown in Equation (2).
S L = B m + B m 2 T u T r e f α ρ ρ r e f β f D i l u t i o n ;
f D i l u t i o n = 1 0.75 × C D E 1 1 0.75 × C D E × D i l u t i o n 7 ,
where  B m  is the maximum laminar velocity,  B  is the laminar velocity roll-off value,   is the equivalence ratio,  m  is the equivalence ratio at maximum velocity,  T u  is the unburned gas temperature,  T r e f  is 298 K,  ρ  is the pressure,  ρ r e f  is 101,325 Pa,  α  is the temperature exponent,  β  is the pressure exponent, and  D i l u t i o n  is the residual mass fraction in the unburned zone.
The unburned fuel and air mixture enters the flame front through the flame zone at a rate proportional to the sum of the turbulent and laminar flame velocities. The burn rate is proportional to the amount of unburned mixture behind the flame front and can be expressed by Equation (3), divided by the time constant  τ .
M e M b ,
where  M e  is the trapped mass and  M b  is the burned mass.
This combustion model requires a turbulent intensity and length scale to describe the in-cylinder flow. The effects of the turbulence intensity and length scale can be modified using the turbulent flame speed multiplier ( C T F S ) and Taylor length scale multiplier ( C T L S ). The initial growth rate of the flame kernel can be adjusted using a flame kernel growth multiplier ( C F K G ).
d M e d t = ρ u A e S T + S L ,
d M e d t = M e M b τ ,
τ = λ S L ,
S T = C T F S u 1 1 1 + C F K G R f L i 2 ,
λ = C T L S L i R e t ,
and   R e t = ρ u u L i μ u
Here,  S T  is the turbulent flame speed,  R f  is the flame radius,  A e  is the surface area at the flame front,  ρ u  is the unburned density,  t  represents time,  λ  is the Taylor microscale length,  L i  is the integral length scale,  u  is the turbulent intensity,  R e t  is the turbulent Reynolds number, and  μ u  is the unburned zone dynamic viscosity [30].

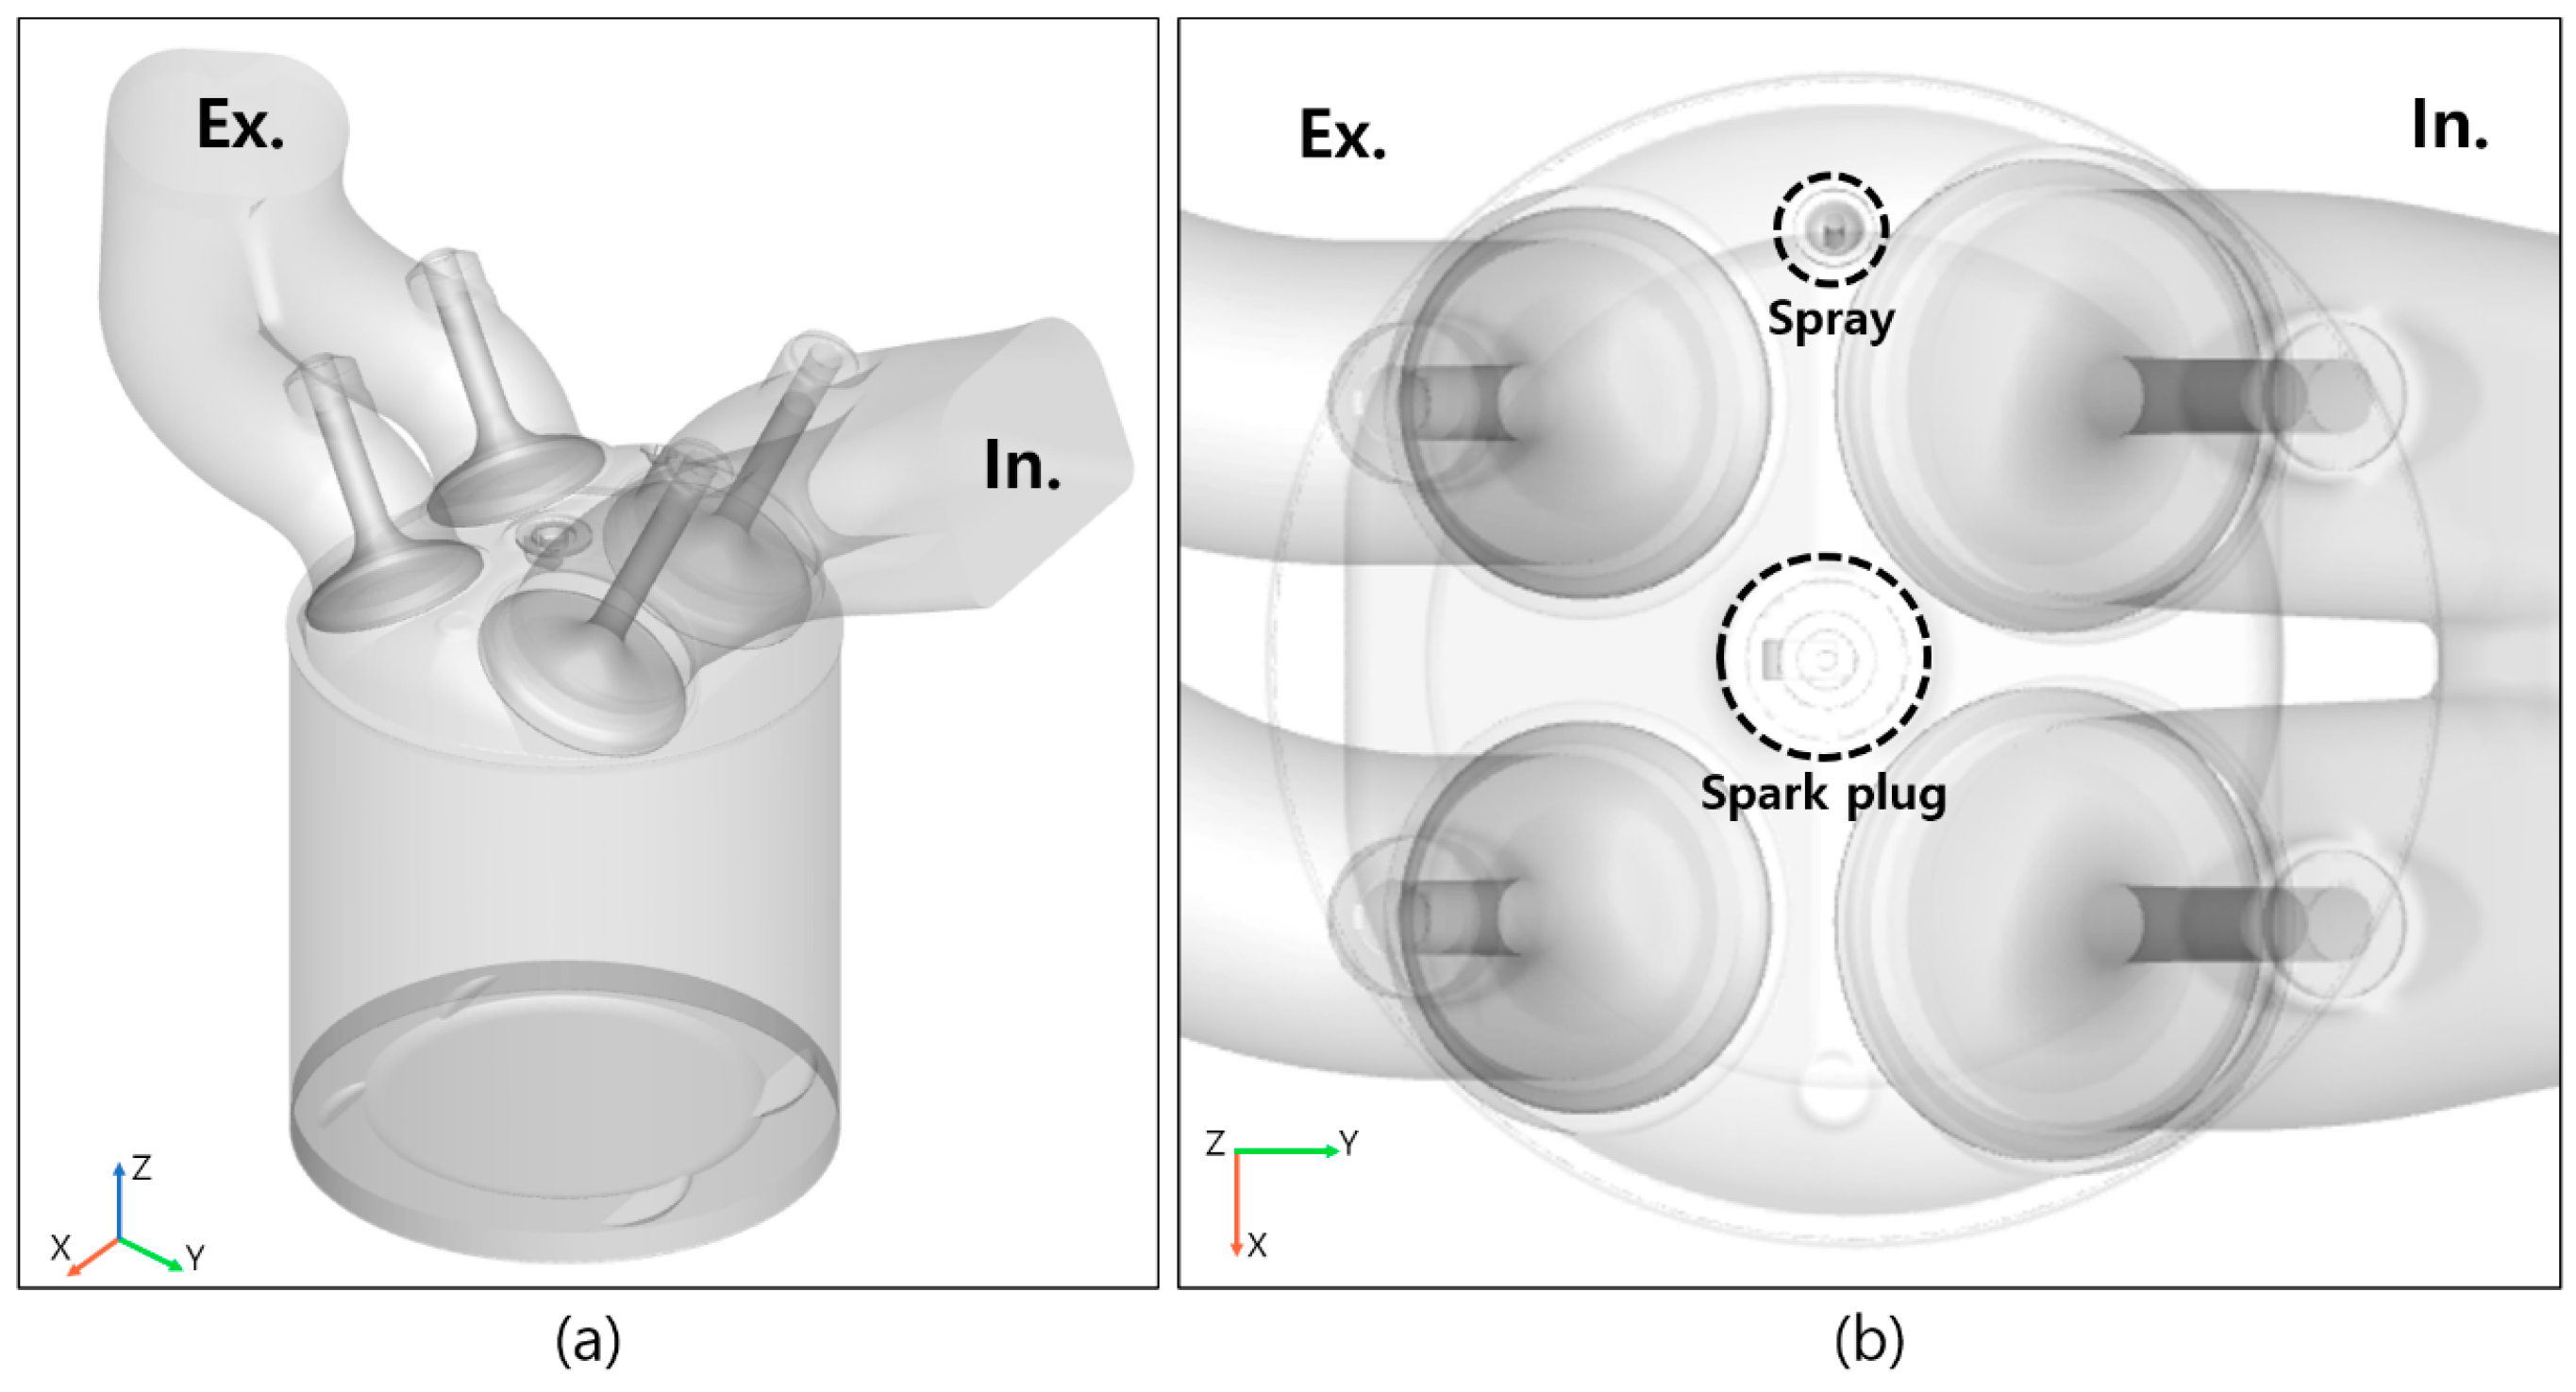
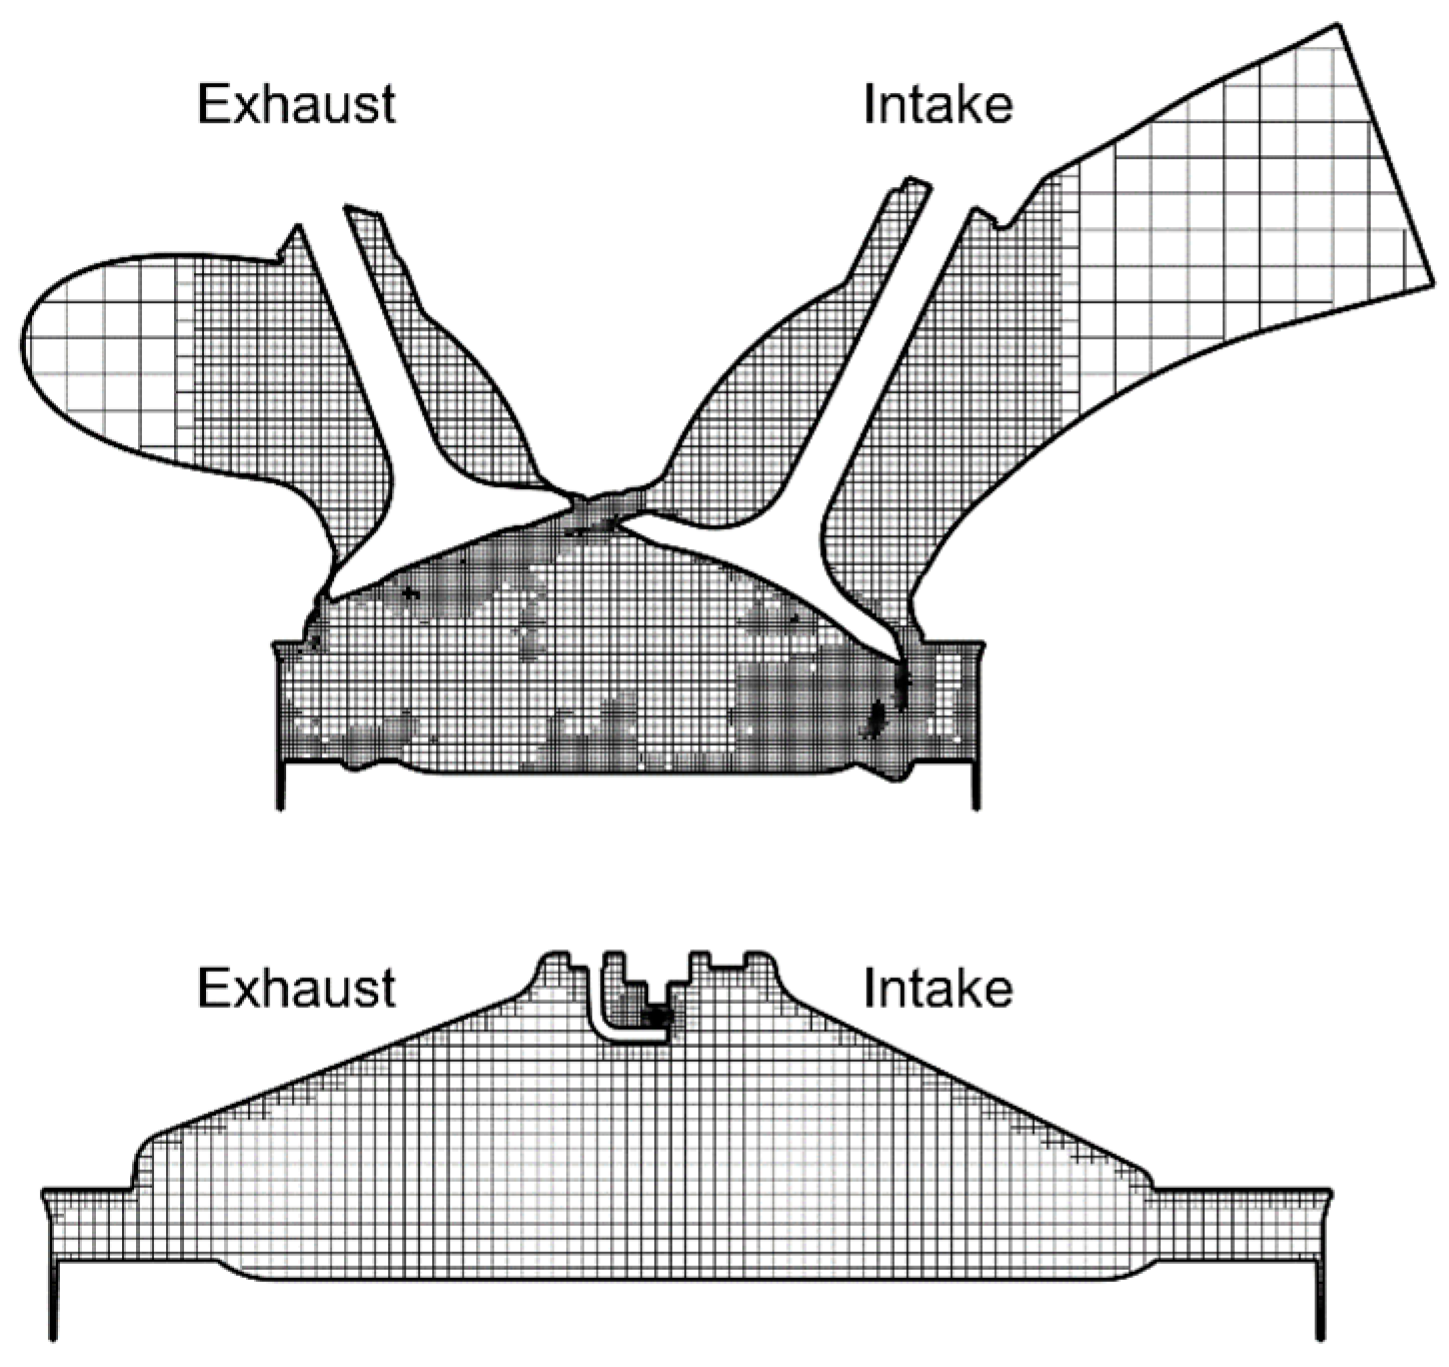
4. 3D CFD Simulation

This study performed a CFD analysis using CONVERGE v3.0 to analyze the in-cylinder flow and combustion characteristics through simulations. The engine model used in this analysis is shown in Figure 1.
In this analysis, the base grid was set to dx, dy, and dz = 4 mm. For an accurate analysis of the time from spark discharge to early flame development and flame propagation, the grid was subdivided into five and six scales, respectively, by applying a fixed embedding function with spherical shapes with diameters of 0.001 and 0.0005 m centered on the spark plug. In addition, fixed embedding was applied inside the cylinder at two scales by default, and fixed embedding was applied at three scales for accuracy near the injector and spray. Finally, adaptive mesh refinement was applied to the velocity and temperature fields to improve the accuracy of the cylinder internal flow and combustion simulations. The embeddings applied to each region are listed in Table 2. Figure 2 shows the mesh around the spark plug, cylinder, and valve in detail in the analysis domain.
The turbulence model was solved using the renormalization group (RNG) k-ε of the Reynolds-averaged Navier–Stokes turbulence model. RNG k-ε has good turbulence prediction in high-speed flows and can accurately calculate the interaction of large-scale and small-scale turbulence. The model is a turbulence model designed to improve computational stability and has low numerical instability, so it can predict turbulence intensity more accurately than the general k-ε model and calculate small-scale turbulence accurately [31,32].
We applied the SAGE (Stochastic Approach to Grid-based Engine) combustion model in this study. The SAGE model is capable of modeling both premixed and non-premixed combustion. With precise mechanisms provided, it can simulate ignition, premixed combustion, and mixture control.
This study analyzed the combustion model using the stochastic approach to a grid-based engine detailed chemical kinetics solver, which is commonly used to analyze the combustion process in internal combustion engines [33,34].
The NOx calculations were based on the extended Zel’dovich mechanism proposed by Heywood et al. The mechanism follows the reactions given below:
O + N 2 N O + N ;
N + O 2 N O + O ;
N + O H N O + H .

5. Boundary Conditions

The study engine was turbocharged and intercooled to simulate an environment where the supercharged air could be cooled. The engine was operated at 2000 RPM, the excess air ratio was increased by 0.5 from 1.5 to 2.5, and the spark timing was fixed at CA −25 deg ATDC for all variables. The compression ratio was 10:1, and the closing/opening overlap between the intake and exhaust valves was minimized to prevent backfiring of the intake valve. The injection pressure was set to 2.5 MPa to ensure a constant injection in all cases. In all cases, the start of injection (SOI) was fixed at CA −100 deg ATDC.
The boundary and initial conditions were set to be the same for the 1D and 3D analyses, as detailed in Table 3.
The injectors were located on the cylinder liner side of the engine head, and the detailed engine modeling is shown in Figure 1 and Figure 3.
The angle of the injector was varied at 15° intervals to 30°, 45°, and 60° with respect to the center of the cylinder for the three models. In addition, the diameter of the injector nozzle was 1.5 mm, and the spark plug was at the center of the cylinder head.

6. Results and Discussion

The analysis was conducted through CFD simulations to confirm the formation of a mixture of fuel and air and the combustion characteristics under the influence of the hydrogen spray angle and equivalence ratio inside the cylinder.
This section analyzed the combustion characteristics of the fixed ignition timing with CA −25 deg ATDC and CA −100 deg ATDC SOI when the spray angle was varied, the equivalence ratio was changed, and the two cases were combined.

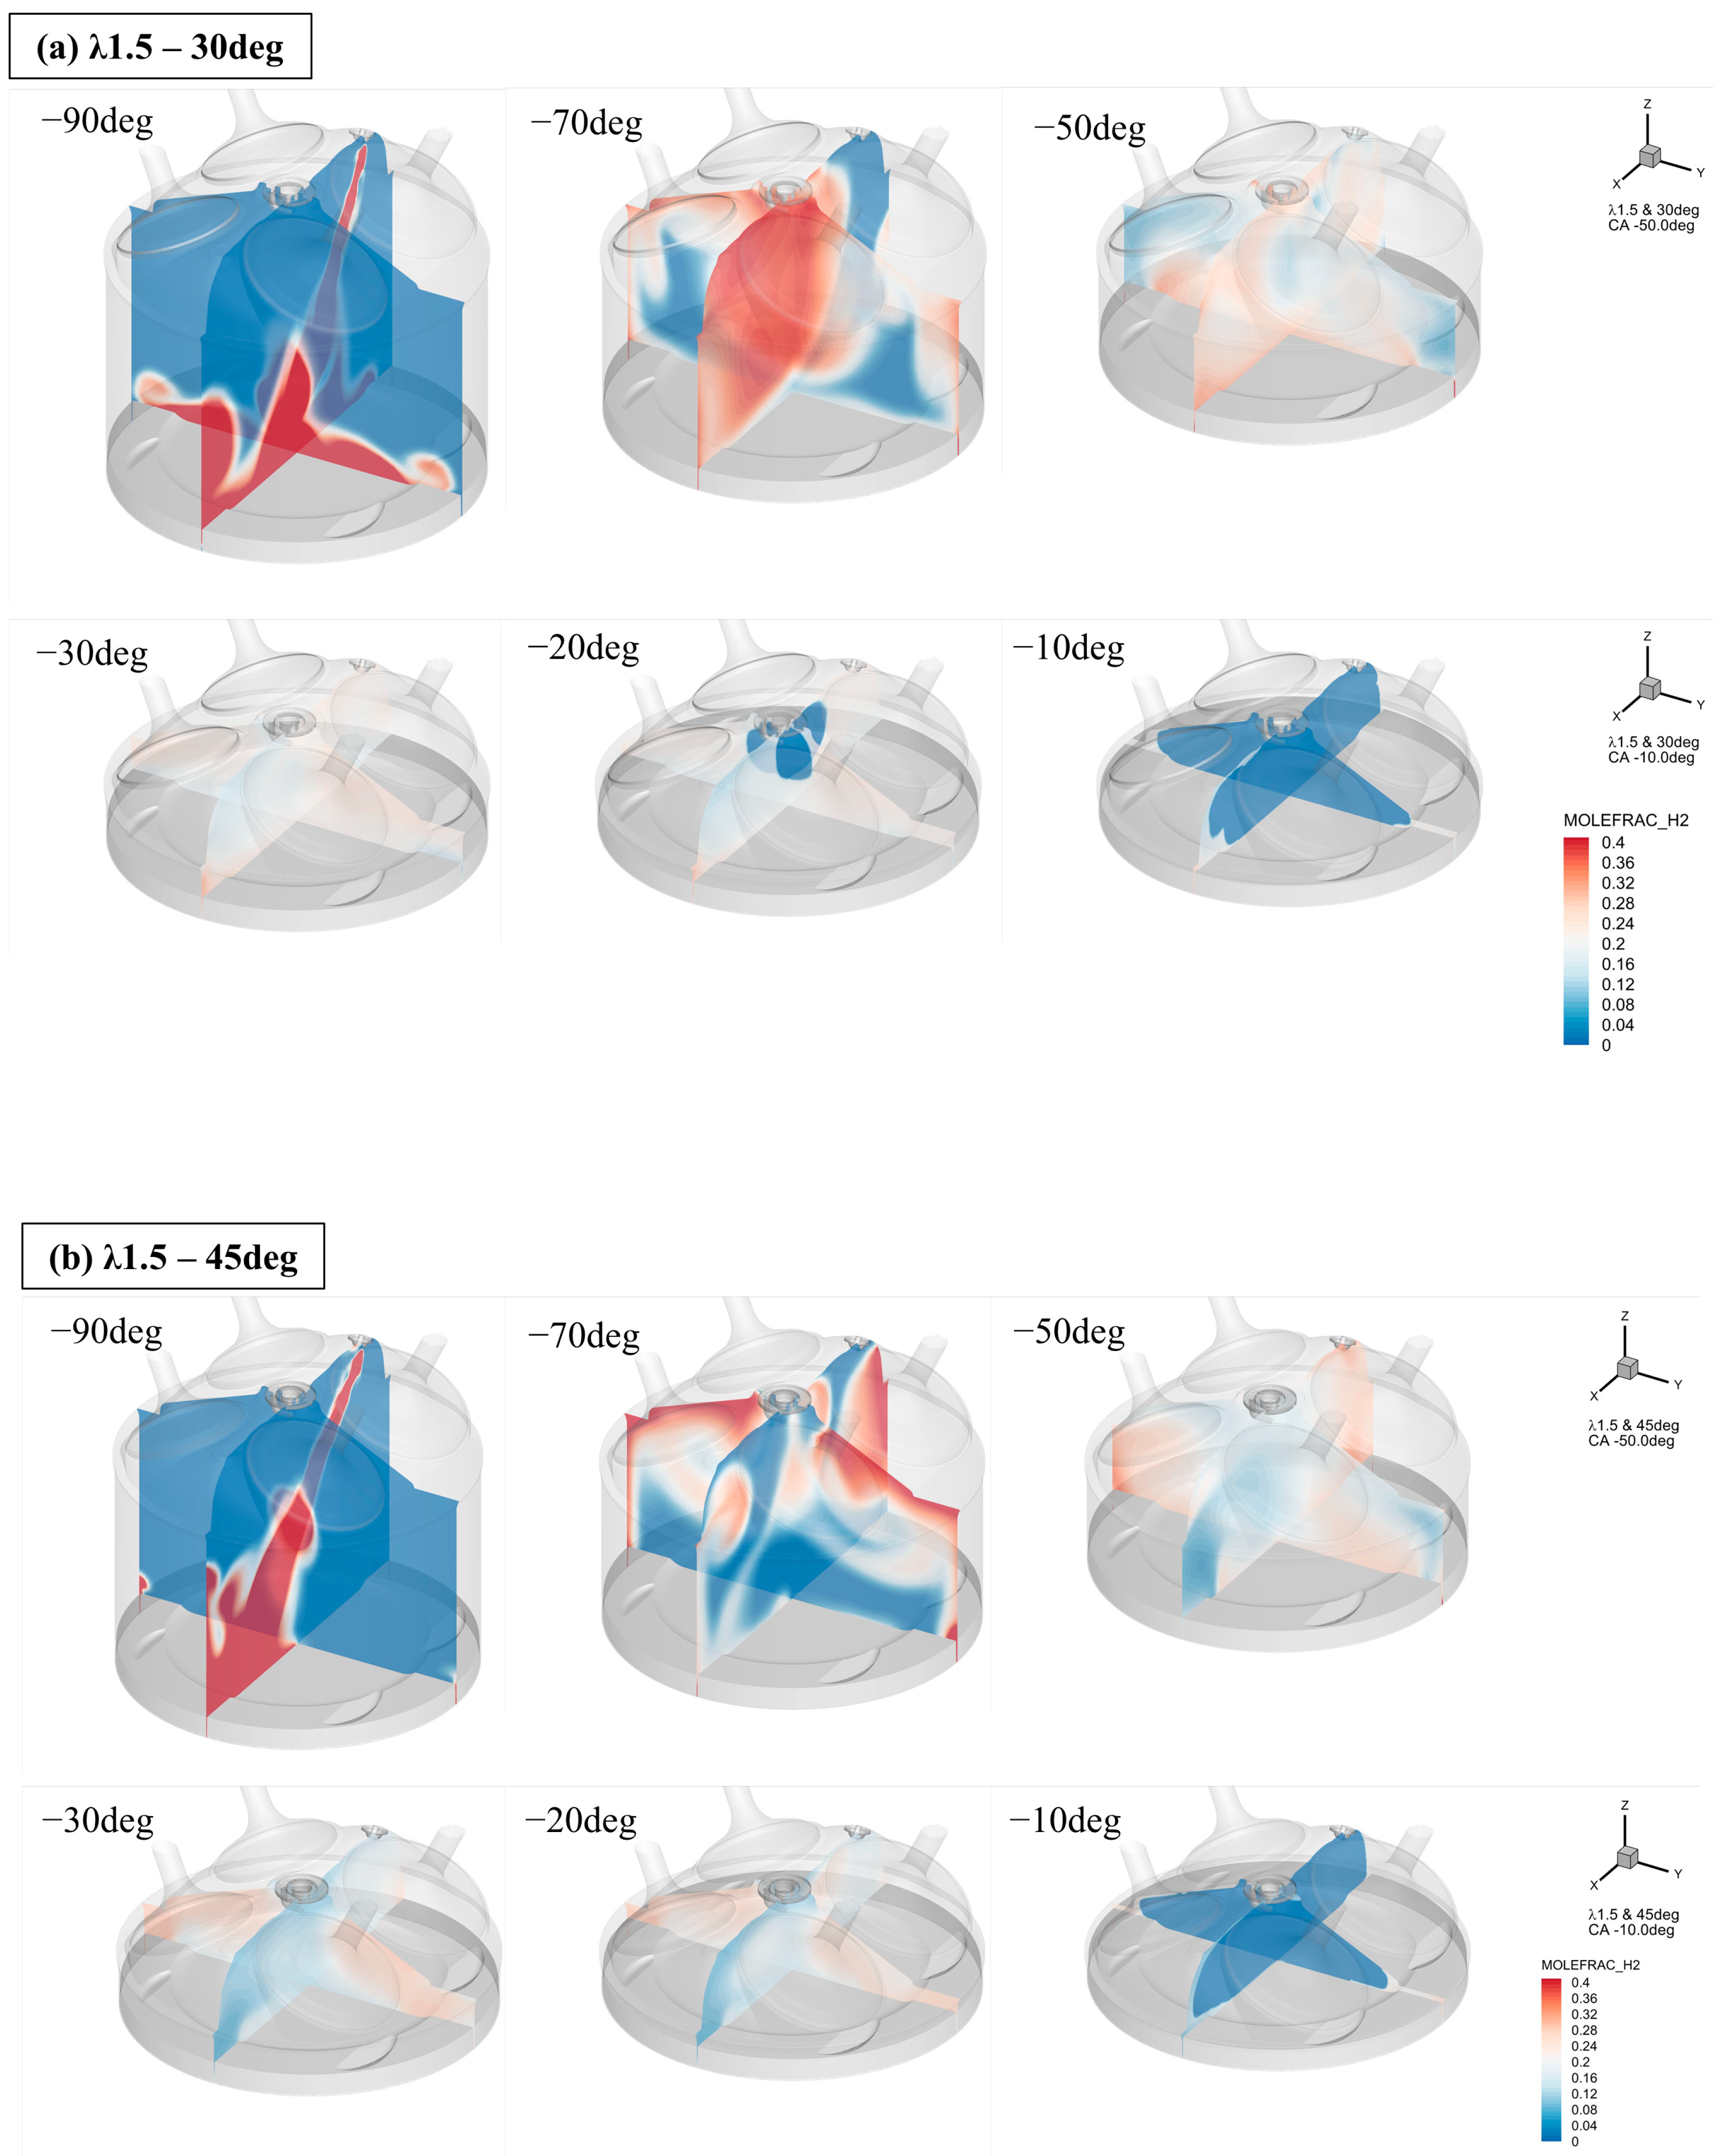
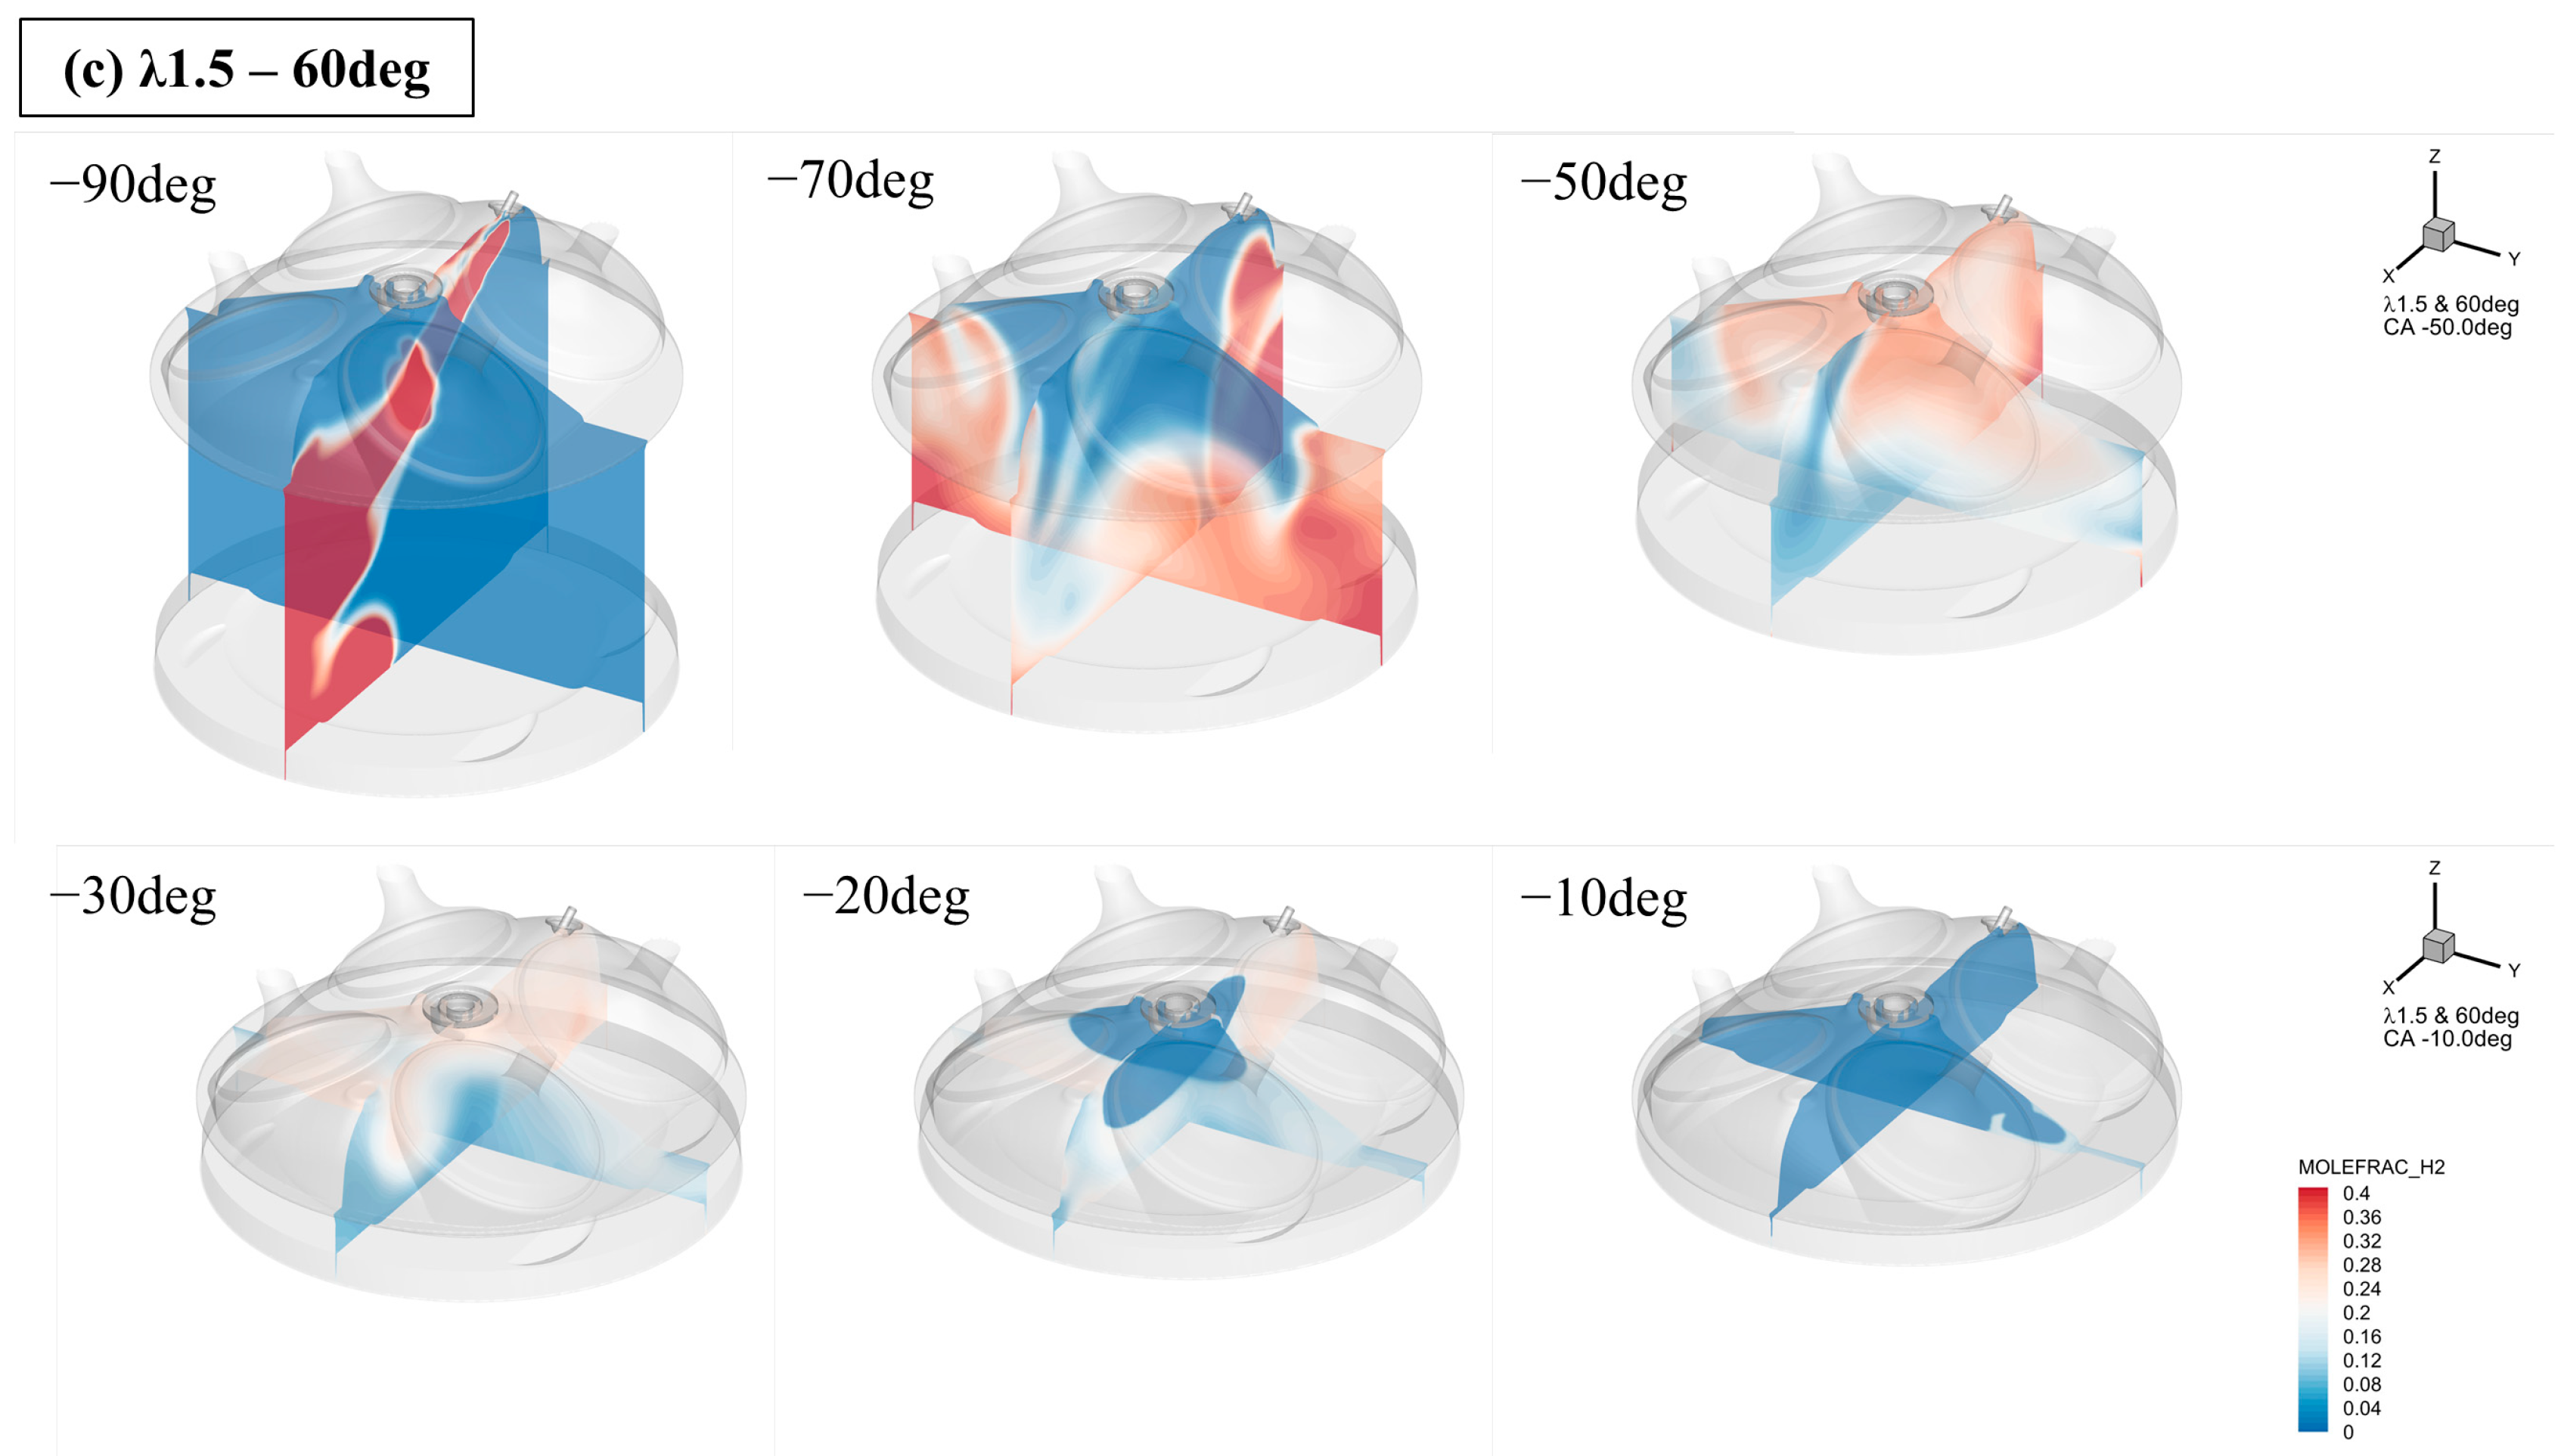
Effect of Injection Angle on Combustion Characteristics

The injection pressure was 2.5 MPa, which is relatively low. This section analyzed the in-cylinder mixture fraction and combustion characteristics as a function of the injector angle.
This section analyzes the mixer formation as a function of the spray flow in the cylinder and spray angle. Figure 4, Figure 5 and Figure 6 show the mole fraction of hydrogen in the cylinder as a function of the spray angle and excess air ratio. First, immediately after the SOI at a spray angle of 30°, the spray impacted the piston crown and splits into two streams. As shown in Figure 4a, the spray impacted the piston crown with the momentum from the injection pressure, splitting it into two plumes to form a stream, which then mixed with the charged air in the cylinder. After impacting the piston crown, the spray was separated in the x+ and x directions in the xz plane and in the y+ and y directions in the yz plane. From the xz plane, the spray split into two streams after hitting the piston crown. Because the injector is located on the side of the cylinder head and the injection direction is towards the center of the cylinder (x+ direction), there was a moment of inertia in the x+ direction. Therefore, when separated into two streams, the stream in the x+ direction formed a larger flow.
The mole fraction image in the xz plane showed a large main vortex in the x+ direction and a relatively small vortex in the x direction. The mole fraction at CA −70 deg ATDC after the end of injection (EOI) timing showed that a spray-induced vortex was formed on the x+ side of the cylinder. During the movement of the cylinder to the TDC, this vortex again collided with the piston crown, causing the vortex to partially dissipate and transform into a flow to the left of the cylinder (x−). Even though the vortex was partially dissipated, the vortex formed owing to the moment of inertia of the spray has a certain momentum; therefore, we can see that the fuel is directed to the cylinder head during the piston’s movement to the TDC.
It was then confirmed that a mixture was formed around the spark plug. By analyzing the spray again in the yz plane, the mole fraction contour shows that the spray impinged on the piston crown and split symmetrically in the y+ and y− directions at CA −90 deg ATDC, forming two streams. This resulted in two vortices in the y+ and y− directions, respectively, and a significant amount of fuel was transferred to the cylinder head at CA −70 deg ATDC.
The two streams that came up the cylinder head in the y+ and y− directions formed a plume, which then collided with each other to form a flow that came down the center of the cylinder in the z-direction. It then collided again with the piston crown as it headed toward the TDC. The two colliding plumes formed a flow directed toward the cylinder liner in the two plumes and maintained the flow by forming a vortex around the bottom of the valve. This resulted in a richer region at the bottom of the valve (combustion face) than around the spark plug at the center of the cylinder. This is believed to affect the initial flame development after spark discharge and is discussed in more detail in the next section on combustion.
Figure 6 shows the turbulence kinetic energy (TKE) inside the cylinder as a function of the spray angle. According to Figure 7, regardless of the excess air ratio, the TKE in the cylinder was similar at spray angles of 30° and 60° and showed a different trend only at a spray angle of 45°. The results showed that the TKE was slightly higher at a spray angle of 45°, significantly increasing after the SOI. Comparing the average values of TKE during the SOI and EOI periods, the TKE was higher at a 45° spray angle compared to 30° and 60° at 37.54  m 2 / s 2  and 26.21  m 2 / s 2 , respectively. The 30-degree spray angle had a longer sustained TKE than the other spray angles after EOI until just before ignition. In the CA-57 deg ATDC, the difference in the TKE between the 30- and 60-degree spray angles was approximately 45  m 2 / s 2 .
Immediately after SOI, at an injection angle of 45°, it impacted the piston crown and separated into two streams, forming two vortices, as did an injection angle of 30°. The −90 and −70 deg ATDC at λ1.5 in Figure 4b shows that the spray was concentrated between the piston crown x+ boundary and the liner and formed a large flow in the cylinder head direction (z+ direction). In Figure 4b, looking at the −70 deg ATDC in the yz plane, we can see that the impinging spray split in the y+ and y− directions, heading toward the cylinder head, with some flow going in the x direction.
The two flows in the x+ and x− directions and along the y-axis collided to form two streams along the y-axis. The flow formed by the collision was affected by the piston facing the TDC, creating a deflected flow in the y direction in the xz plane. The flow was concentrated in the area adjacent to the liner in the cylindrical head, thereby creating a relatively lean region around the spark plug. A minimum mole fraction of 0.1% was observed around the spark plug until just before spark discharge.
Figure 8 shows the ratio of tumbles x about the y-axis in the yz plane to the tumbles y about the x-axis in the xz plane. The tumble ratio in Figure 8 at a spray angle of 45° shows that the in-cylinder tumble was weaker than that in other cases. In tumble Y, the gradient of the increase in tumble was smaller than that in the other cases, and the maximum value was also lower. The difference in tumble ratio between the 30 and 60° spray angles was about one depending on the excess air ratio, whereas the difference in tumble ratio at 45° was approximately two. The larger the excess air ratio, the greater the reduction in tumble strength for the 45-degree spray angle case. The significant decrease in tumble after EOI and the tumble ratio as a function of spray angle indicate that the moment of inertia caused by the spray angle and injection pressure are the primary factors in the formation of the tumble. Based on CA −62 deg ATDC, spray angles of 30° and 45° reversed the tumble ratio value in all excess air ratio conditions.
At a spray angle of 60°, the spray plume did not impinge on the piston crown, and the interaction with the cylinder liner was dominant. After EOI, the spray impinged on the cylinder liner and formed an overall flow directed in the x direction along the rounded cylinder liner surface and piston crown. As the flow formed in the X− and Z+ directions at −70 deg ATDC, as shown in Figure 3c, the flow progressed by forming a plume in the form of a wave instead of forming two streams at spray angles of 30° and 45°. At −50 deg ATDC in Figure 4c, a wave-shaped flow formed a thickening zone near the cylinder head, and the spray flow in the cylinder rotated around the y-axis. The center of the vortex that formed the flow was eccentric in the x+ direction relative to the center of the cylinder, and the vortex was maintained and developed relative to the eccentric axis as the piston reciprocated.
The tumble ratio in Figure 8 shows that the 60-degree spray angle had a tumble ratio symmetrical to the 30° and 45° cases. Tumble y shows that the 60-degree spray angle case was symmetrical to all other cases, regardless of the excess air ratio. This was observed in the mole fraction contours. At a spray angle of 60°, the spray plume impinged on the cylindrical liner, and after splitting into two streams, the plume was directed to the piston crown. By contrast, spray angles of 30° and 45° caused the spray plume to split after impacting the piston crown, and the plume moved to the cylinder head guided by the cylinder liner. As the flow direction was reversed, the direction of the tumble became symmetrical.
The spray angles of 30° and 60° had similar initial tumble ratio increase slopes; however, after EOI, the tumble ratio at a spray angle of 30° had a steeper decreasing gradient, and the tumble ratio y at λ1.5 shows that the tumble was reversed at CA −53 deg ATDC. At a spray angle of 60°, the decreasing slope of the tumble ratio after EOI was relatively gentle, although it was initially similar to that at 30°. In tumbles x and y, spray angles of 30° and 45° were symmetrical to the spray angle of 60°. This can also be seen in the tumble ratio graph and mole fraction.
In tumble x, there was a tumble caused by supercharging. As shown in Figure 4c, in the yz plane at a spray angle of 60°, the fuel was eccentric in the y direction at CA −40 and −30 deg ATDC, indicating the influence of charge flow. It is believed that during the intake process, as the intake valve draws in supercharged air, a tumble is formed along the x-axis, causing an interaction with the spray flow. The tumble ratio shows that the in-cylinder tumble x in the + direction remained approximately 0.3 until just before the SOI timing. This suggests that supercharging may have helped develop tumble x at a 60° spray angle.
The mole fraction at a spray angle of 30° indicated that, after the spray impingement on the piston crown, the plume was directed into the cylinder head. A sufficient mixer was formed near the spark plug allowing rapid initial flame development at the time of spark discharge. In the y-plane direction, flame propagation and development were symmetrical; however, in the x-plane, flame development after spark discharge tended to develop in the x-direction first because the flow was formed and maintained in the x-direction (see CA-20 deg ATDC in the xz-plane in Figure 4a).
In the xy plane, checking the mixer formation characteristics just before the spark discharge, the enriched region was evenly distributed near the injector at CA −30 deg ATDC. In contrast, in the opposite direction, the x direction, some enriched regions were in the form of spots, indicating that there were areas where the fuel and air were not well mixed. Additionally, we can see the initial flame chariot direction was in the x direction because the two streams were heading in the x direction. For the three-spray angle cases, the combustion pressure and temperature exhibited different trends depending on the initial flame development rate and HRR; however, the peak values were mostly similar. However, in the 1D analysis, the combustion pressure and temperature tended to be higher than the other cases (see Figure 9a–c). The combustion pressure was similar in all cases except for λ2. However, the combustion temperature had a temperature difference of approximately 500 K in λ1.5 and 2 and approximately 300 K in λ2.5 compared to a spray angle of 60°. At a spray angle of 30°, the combustion pressure was relatively low, independent of the excess air ratio, and was approximately 0.5 MPa lower than at a spray angle of 60°, which produced the highest pressure when compared to each excess air ratio condition.
After the spark discharge at a spray angle of 45°, a relatively lean region was maintained around the spark plug, resulting in slow initial flame development (shown in Figure 4, Figure 5 and Figure 6, yz plane CA −20 deg ATDC). In the xz plane, flame propagation occurred in the x direction because the flow continued in the x direction. Flame development and subsequent flame propagation were rapid owing to the formation of a relatively dense region in the x direction. However, the initial flame development and overall combustion rate were lower in the lean case. Furthermore, regardless of the excess air ratio, the 45-degree spray angle had the slowest combustion rate compared to the other atomization angles. The MFB in Figure 10 shows that a spray angle of 45° was perceived to be 2.5° and 3.9° greater than spray angles of 30° and 60°, respectively, at the initial flame development angle 0–10 ( θ d ). At this time, the apparent heat release rate (AHRR) in Figure 10 was retarded by approximately 5°. This may have contributed to the long ignition delays. The flame development angle retarded gradually, and a misfire occurred at a 45-degree spray angle in λ2.5.
The flow formed in the cylinder head at a spray angle of 60° led to the formation of an enriched region with a mole fraction of 0.25 under λ1.5 conditions, which resulted in a fast flame propagation rate after spark discharge, and the flame propagated rapidly along the tumble flow in the cylinder in the initial flame development. In Figure 11, the graphs of apparent heat release (AHR) and AHRR show that combustion proceeded faster at a spray angle of 60° than at 30° and 45°. Comparing the  θ d  at a 30° spray angle versus that at a 60° spray angle in λ2, the flame development angle was approximately CA −12.7 deg ATDC at a 30° spray angle compared to CA −11.7 deg ATDC at a 60° spray angle, which is approximately 1° faster. Subsequently, if you check again at the rapid-burning angle of 10–90 ( θ b ), it as CA 12 deg ATDC at a spray angle of 30° and approximately 5° faster at a spray angle of 60° with CA 7 deg ATDC at a spray angle of 60°. As a result, in λ2, the initial flame development was faster at a spray angle of 30°, but a spray angle of 60° showed a faster burning rate before entering the flame end stage after flame propagation.

7. Effect of Equivalence Ratio on Combustion Characteristics

The TKE plot in Figure 7 shows a significant increase in TKE starting at the SOI, followed by a steady increase throughout the injection duration. The longer the injection duration, the higher the TKE because the injection pressure, which is the primary source of the moment in the spray, is provided to the spray for the duration of the injection. Therefore, the lower the excess air ratio, the stronger the turbulence in the cylinder. Comparing the leanest case, λ2.5, with the richer case, λ1.5, shows a difference in turbulence intensity of up to 50  m 2 / s 2  at a spray angle of 45°. Because the excess air ratio controls the duration of the injection, it is one of the primary factors providing momentum to the spray.
Checking the mole fraction, when only the excess air ratio was changed but at the same spray angle, showed that the rich and lean cases had similar in-cylinder flow trends, with the only difference being the fuel fraction in the cylinder as the excess air ratio changed.
Thus, it was confirmed that the spray angle is the parameter that forms the dominant flow in the cylinder, and it was determined that a large TKE in the cylinder could be formed even with a short injection duration by changing the spray pressure.
As the excess air ratio increased, the initial flame development angle was retarded, and the flame propagation speed decreased. This is confirmed by the MFB shown in Figure 10. In addition, the overall combustion rate was slow, and a misfire occurred because the mixture in the cylinder was not formed at λ2.5 when the spray angle was 45°. As the injection duration decreased, the TKE was insufficient to form a mixture in the cylinder. The proper mixture was not formed according to the flow characteristics in the cylinder formed according to the spray angle.
To prevent the combustion rate from slowing as the excess air ratio increases, the EOI must be advanced to compensate for the decrease in TKE because of the shorter injection duration. This is likely compensated for by increasing the injection pressure. The effect of injection pressure was likely to be insignificant in this study because the spray pattern in the cylinder affected by the spray angle was sprayed at a relatively low pressure. Therefore, the high-pressure injection case from 10 MPa to 30 MPa and the ultra-high-pressure injection of more than 30 MPa should be analyzed comprehensively according to the formation of strong turbulence intensity in the cylinder.
Depending on the injection angle, the mixture in the cylinder has different flow characteristics, resulting in different combustion rates. In λ1.5, the higher the injection angle, the faster the combustion speed and the higher the combustion temperature and pressure (refer to Figure 9a–c). The initial flame development was characterized by different spray angles; however, the result was lower NOx emissions owing to lower combustion temperatures and pressures at lower spray angles. λ2 had the slowest combustion rate and the longest combustion duration due to the poor formation of fuel and air with a 45-degree spray angle. The initial flame development rate was the fastest with a spray angle of 30° but was reversed at a spray angle of 60° in the later stage.
As the spray angle increased from 30° to 45°, the NOx emissions decreased, whereas the NOx emissions increased significantly from 45° to 60°. The larger the slope of the HRR, the more instantaneous the heat release; therefore, as the combustion temperature increased, the NOx emissions increased owing to the increase in thermal NOx generation (refer to Figure 12). In λ2.5, there was a change in flame propagation time and combustion duration from the time of spark discharge as the spray angle increased. spray angle of 30° showed a perceptible increase in the flame development period compared to that at 60°; however, the flame propagation time afterward showed a positive trend.
Overall, the heat release was higher at a spray angle of 60°, which resulted in a higher combustion temperature and, hence, higher NOx emissions. At spray angles of 30° and 60°, the final heat release was 569 J and 632 J, respectively. The calorific value differed by approximately 63 J. The thermal efficiency varied with the spray angle towards lean conditions, indicating that the spray angle has a considerable influence on the combustion and thermal efficiencies under lean conditions. Therefore, the fuel spray angle should be optimized to achieve lean operation in hydrogen direct-injection engines.

8. Conclusions

This study analyzed the combustion characteristics and NOx emissions of a hydrogen SI-DI engine as a function of the spray angle and excess air ratio using 1D and CFD 3D numerical simulations. The primary conclusions can be summarized as follows:
  • The in-cylinder mixer formation and combustion characteristics in each case were investigated by varying the spray angle (30°, 45°, and 60°) and the excess air ratio. Different spray angles showed different combustion characteristics. Although there was no specific trend as the spray angle increased from 30° to 60°, there was a trend as the excess air ratio increased.
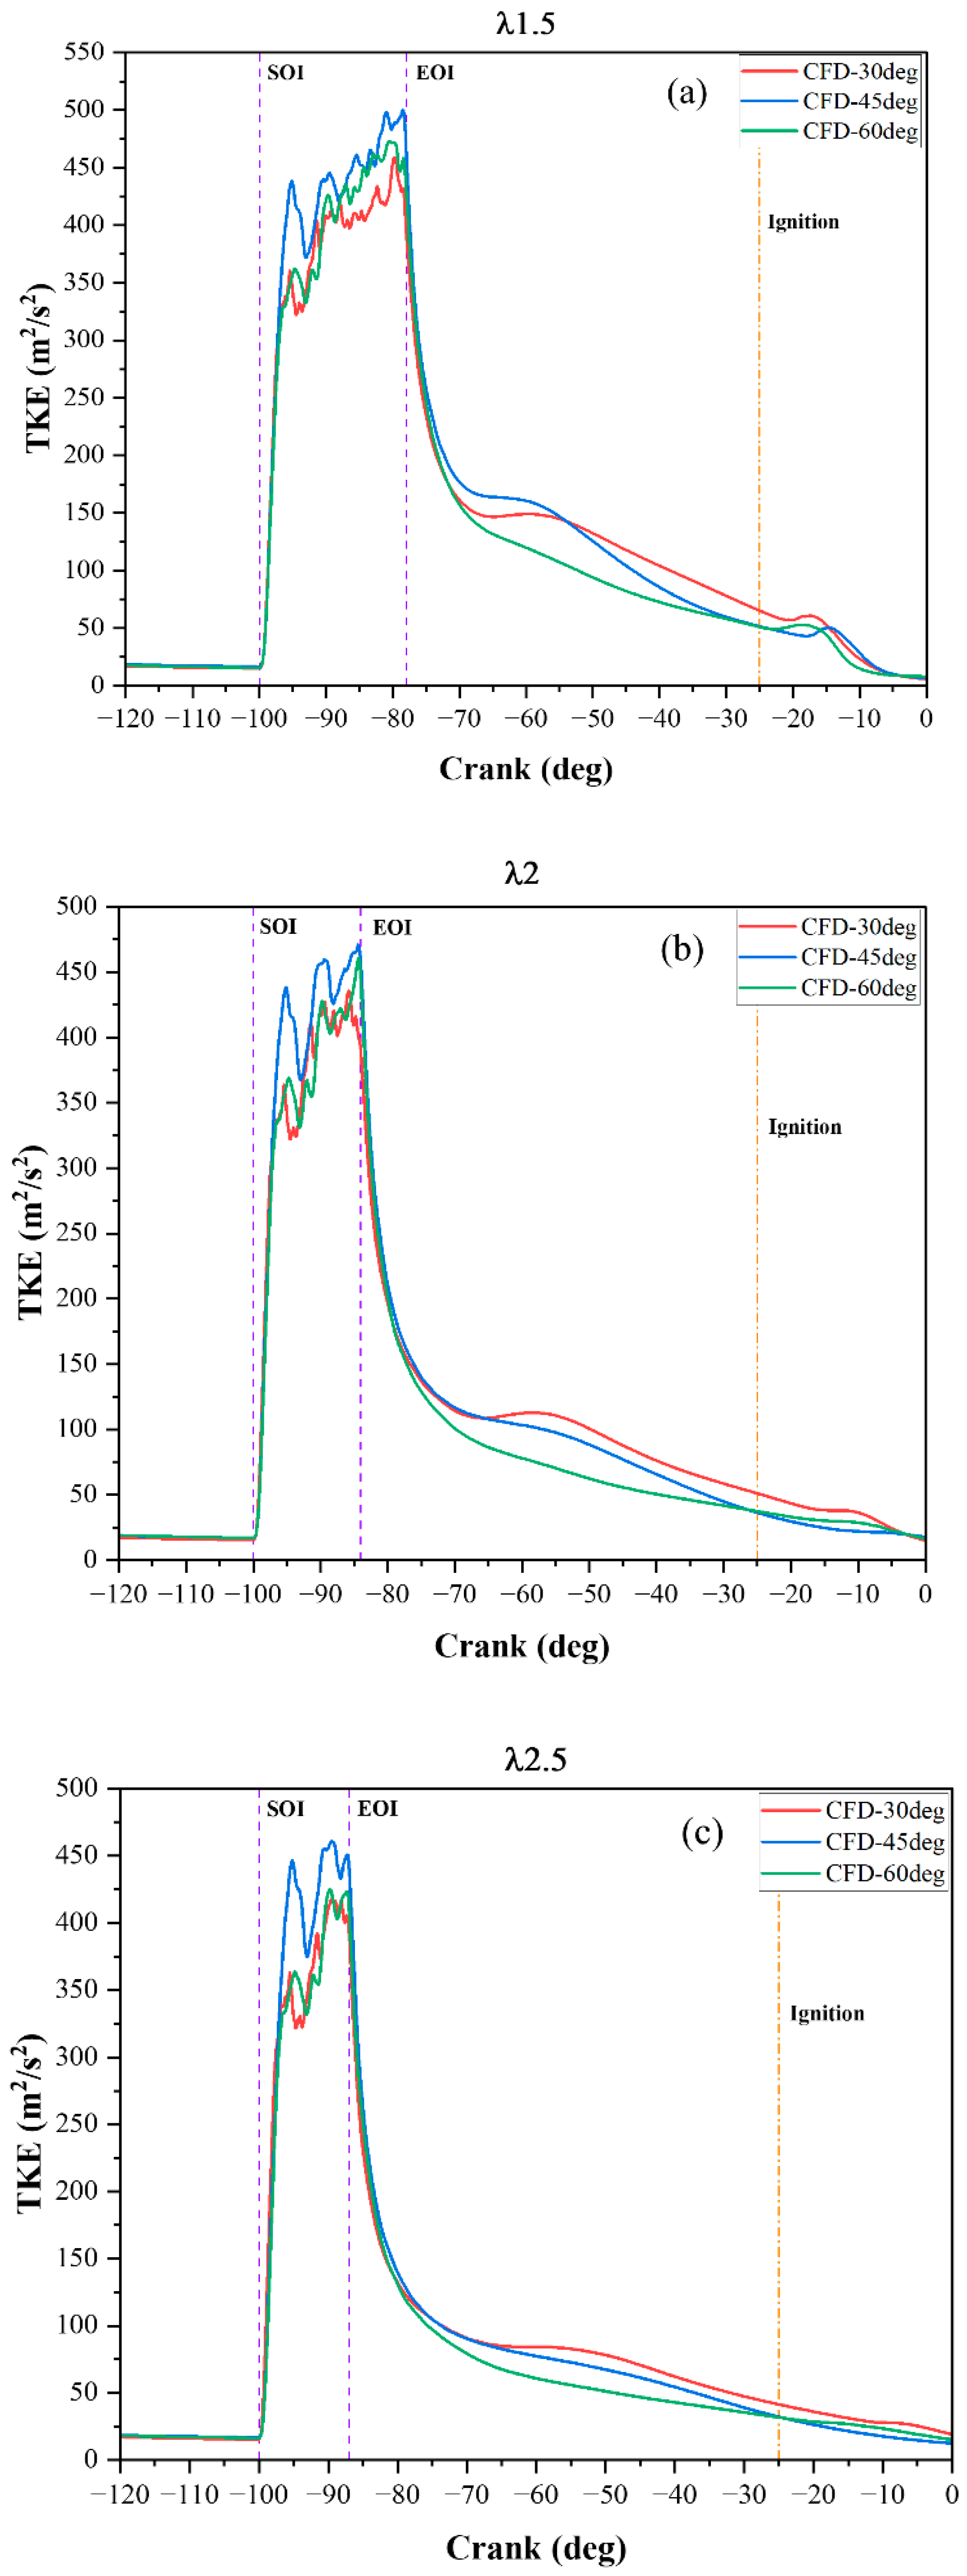
  • A spray angle of 45° showed the highest TKE value compared to the other cases for all the equivalence ratio conditions. The cylinder achieved high turbulence intensity, but misfires occurred under λ2.5 conditions. This confirms that the turbulence intensity and spray behavior as functions of the spray angle have a considerable impact on the combustion characteristics under lean conditions.
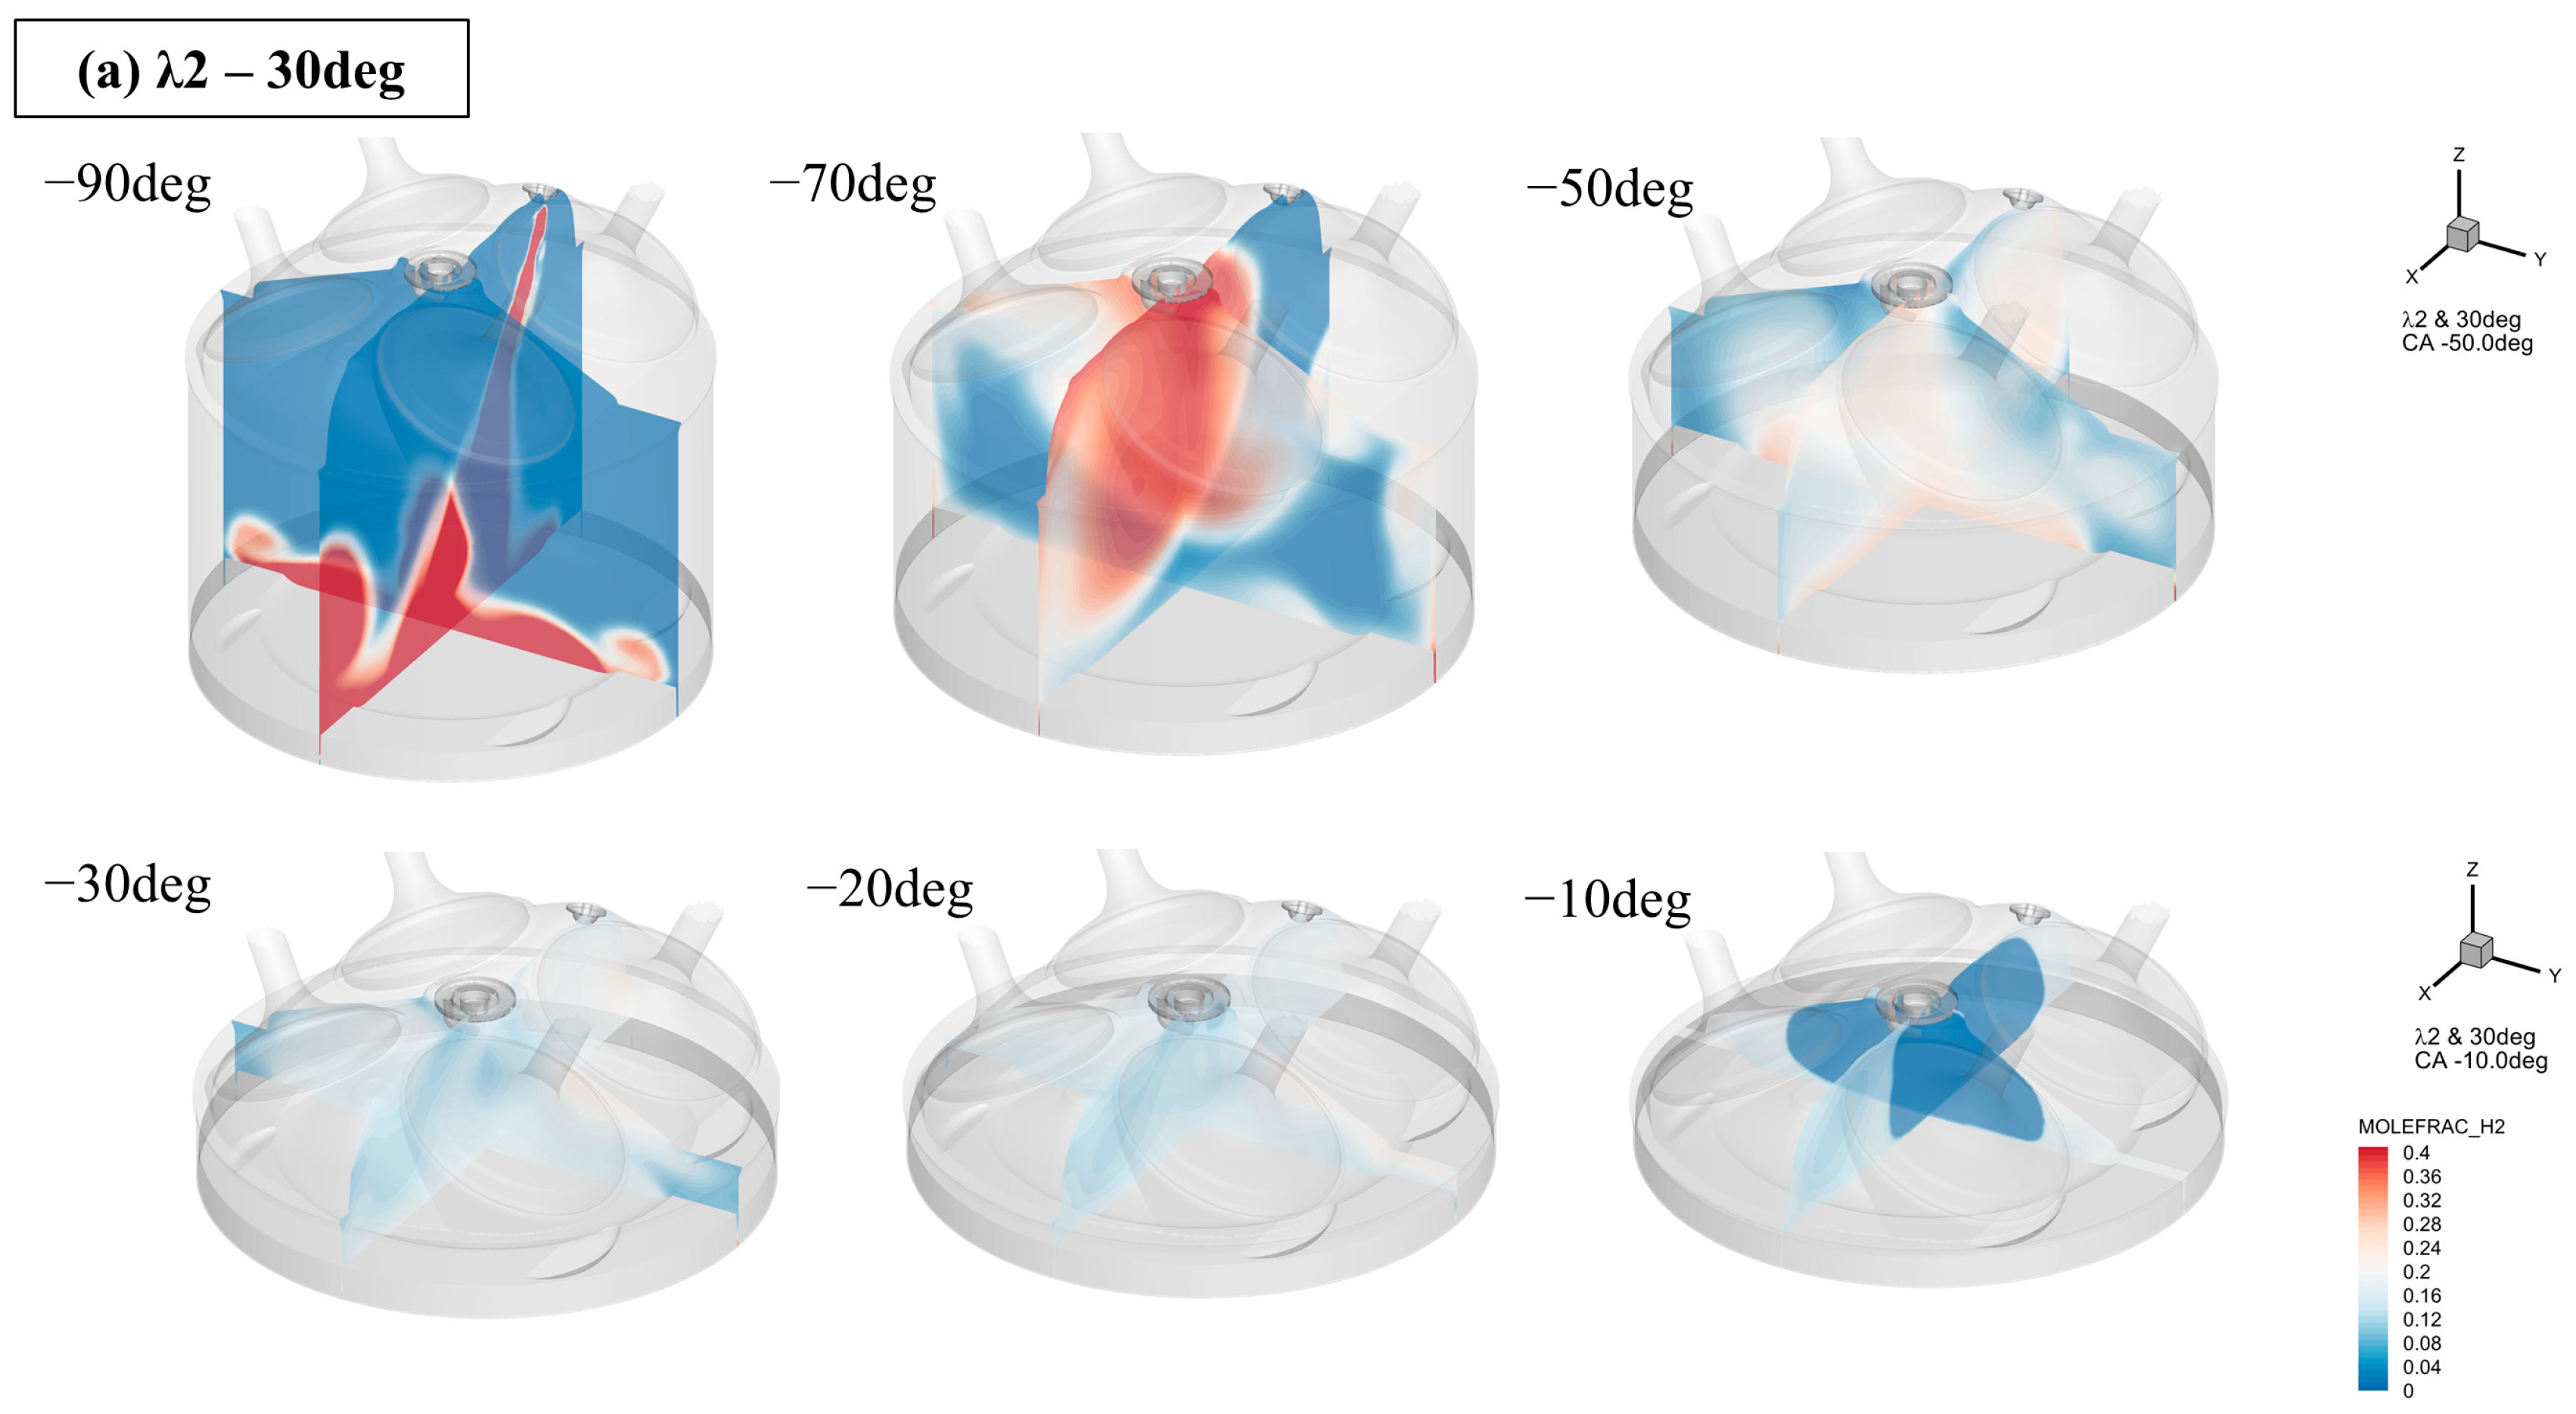
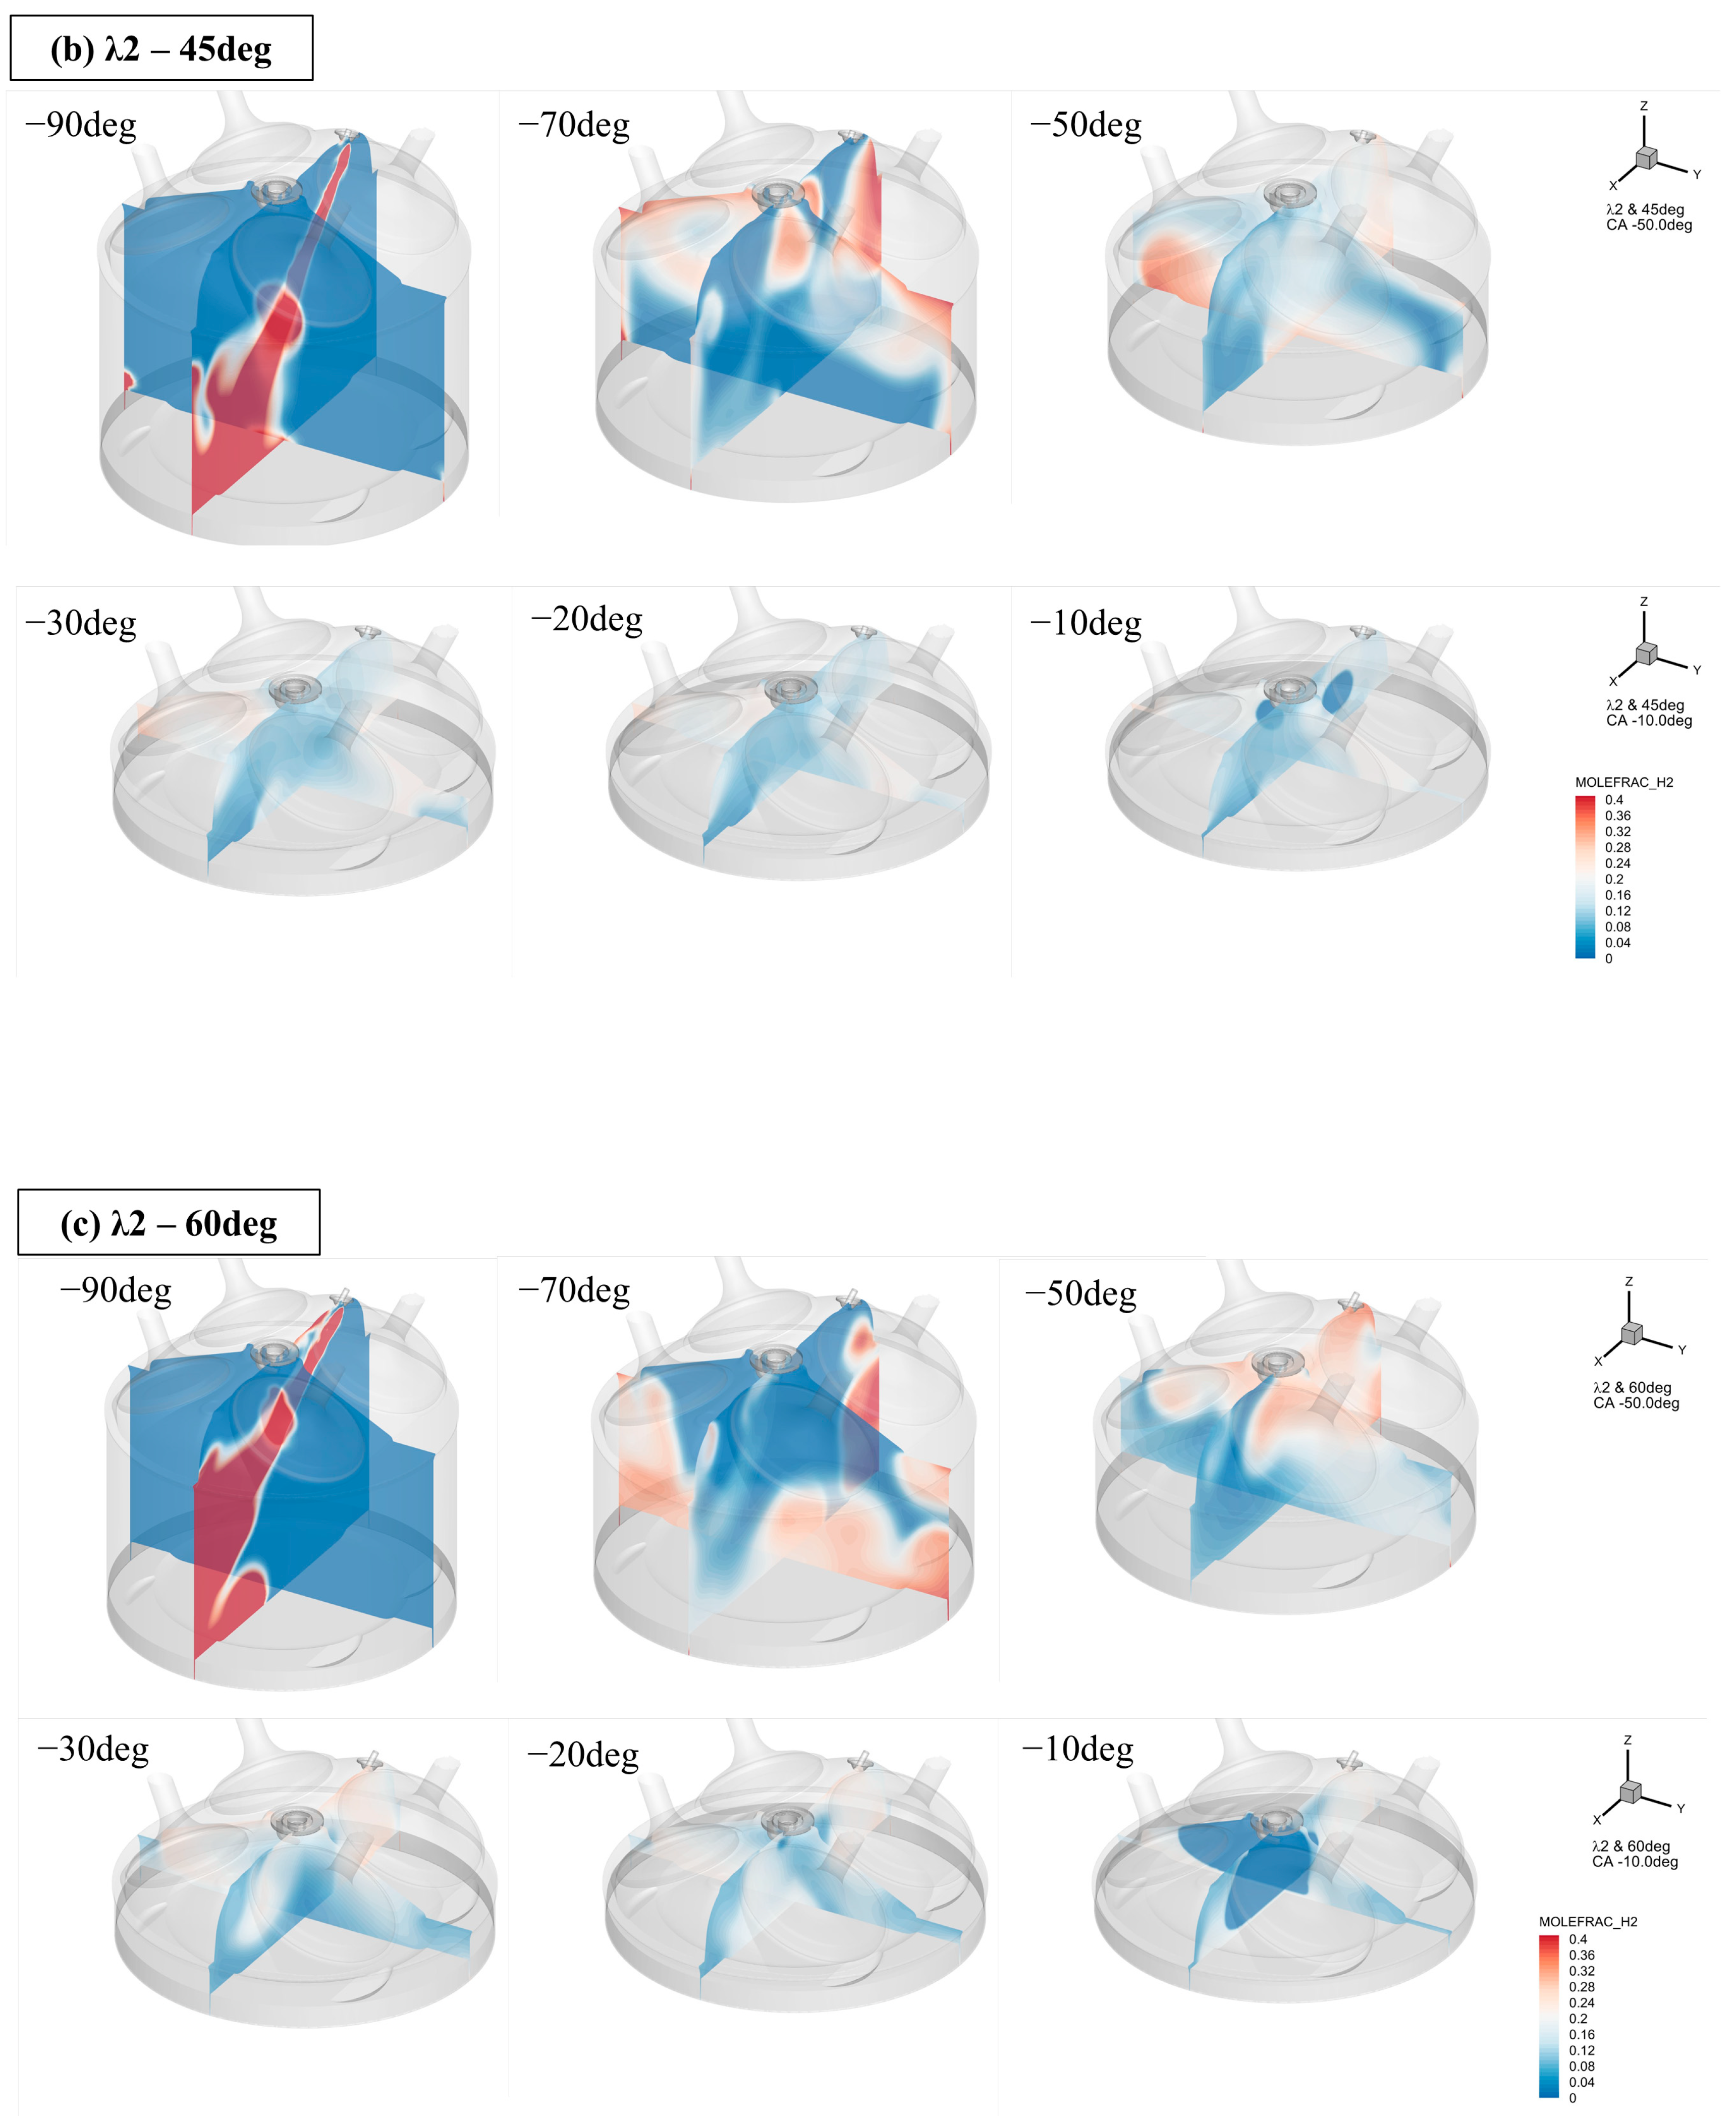
  • At spray angles of 30° and 45°, the SOI spray impinged on the cylinder liner and piston crown, respectively, and separated into two streams, each forming two plumes. The formed plumes could interact with each other by forming a vortex, especially around the spark plug, forming lean or rich regions depending on the spray angle.
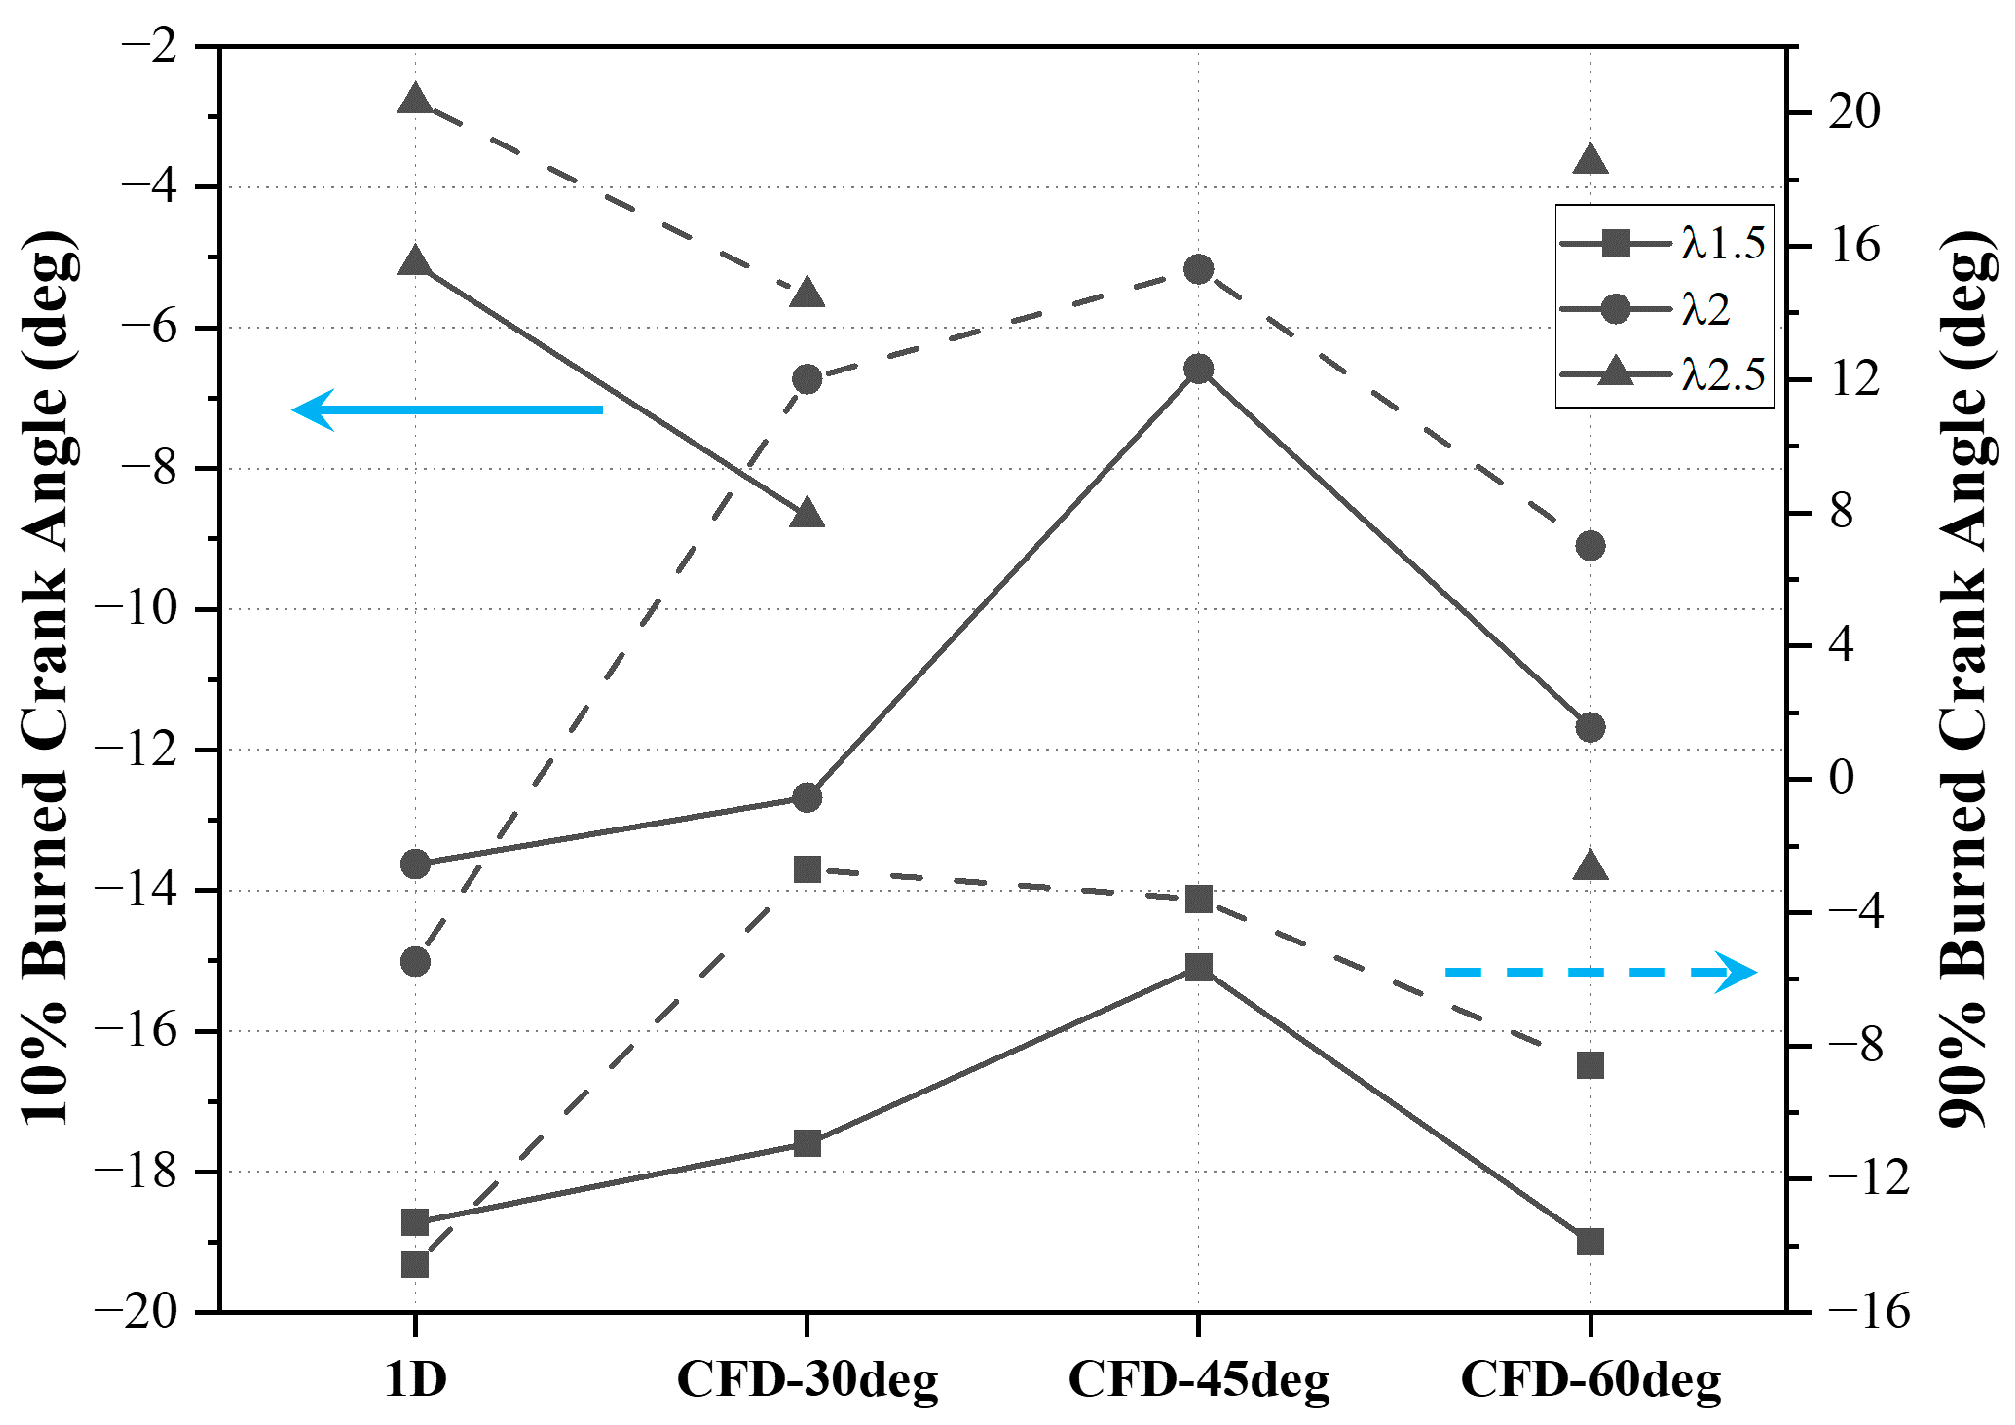
  • Lean and rich regions formed around the spark plug, resulting in differences in the initial flame development rate for each spray angle. Spray angles of 30° and 60° showed a similar trend for MFB 10%, but at 45°, misfires were detected, more so in lean conditions, and misfires occurred in λ2.5.
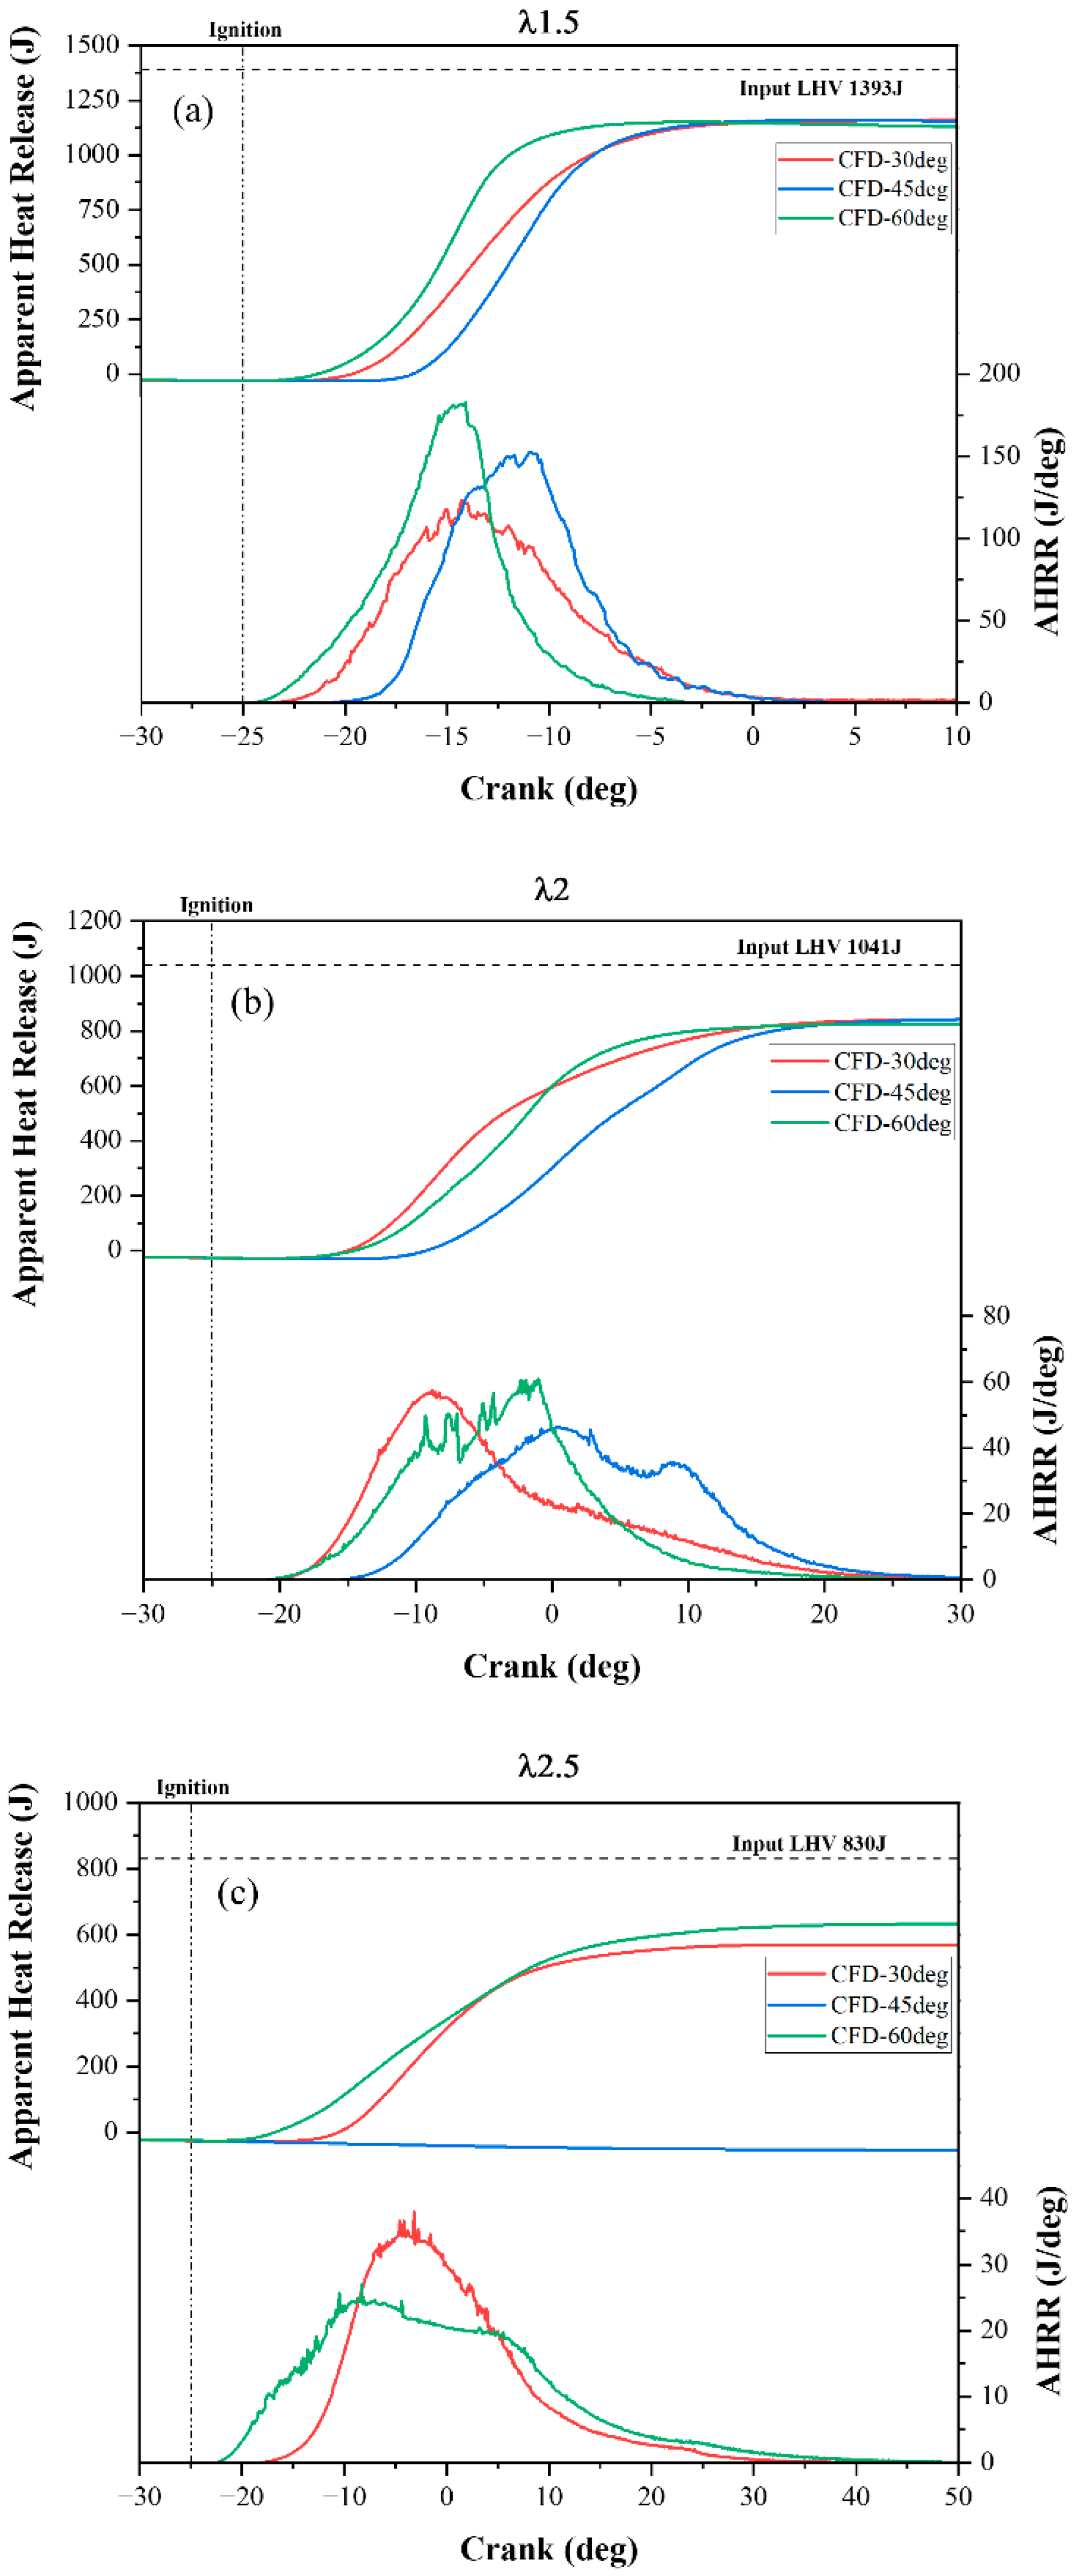
  • After the initial flame development, the flame propagation was the fastest at a spray angle of 60° and was significantly retarded at other spray angles. In particular, the initial flame development angle was perceived at a 45° spray angle; however, the flame termination stage of MFB90 exhibited a faster burning rate than the perceived initial flame development.
  • Depending on the spray angle, the combustion pressure and temperature were also affected by the differences in the initial flame development and flame propagation velocity, resulting in different combustion characteristics depending on the mixer formation conditions in the cylinder. For all excess air ratios, the combustion pressure and temperature were the highest at a spray angle of 60°.
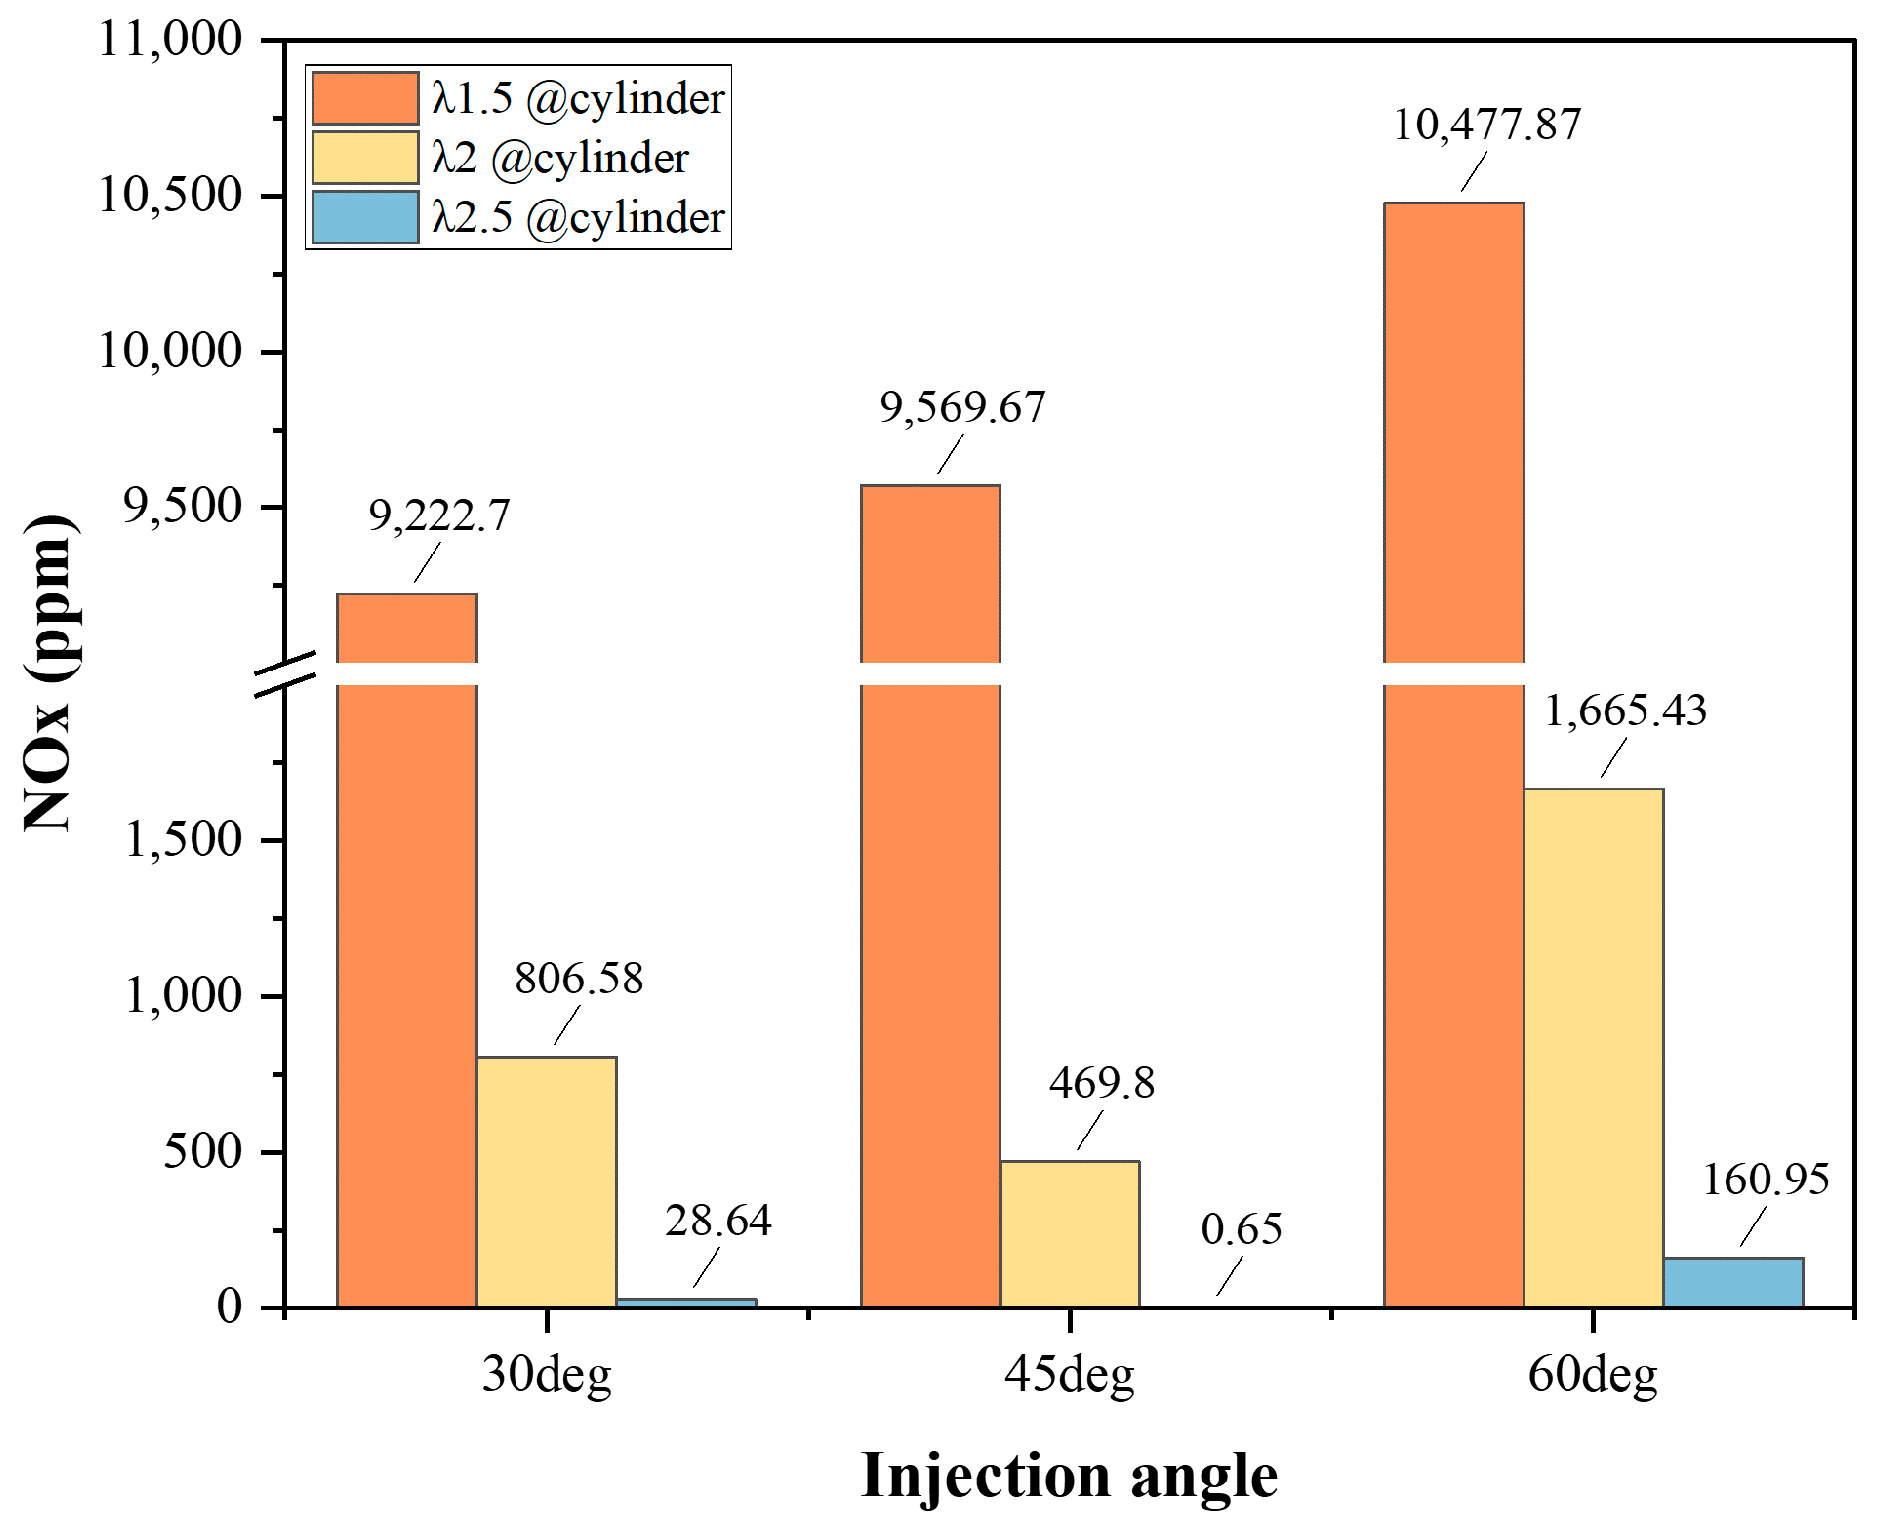
  • As the excess air ratio increased, the NOx emissions decreased significantly as the combustion pressure and temperature decreased, especially at λ2.5, which showed low NOx emissions of 28.6 ppm at a 30-degree spray angle and 160.96 ppm at a 60-degree spray angle. It is believed that the NOx emissions at a 60-degree spray angle were high because the combustion pressure and temperature were relatively high.
Despite the wide flammability limit range of hydrogen, poor mixer formation under lean conditions can cause misfires. Therefore, a method to increase the mixing degree of fuel and air in the cylinder should be devised under lean conditions, and it is necessary to conduct a study under high-spray pressure conditions through CFD analysis using a large eddy simulation model that can more accurately calculate the local equivalence ratio in the cylinder.

Author Contributions

Conceptualization, S.O.; Validation, S.O.; Investigation, S.O.; Resources, J.P.; Writing—original draft, S.O.; Writing—review & editing, J.P.; Supervision, J.P.; Funding acquisition, J.P. All authors have read and agreed to the published version of the manuscript.

Funding

This study was funded by Ministry of Trade, Industry and Energy (MOTIE), Korea (Grant number: 20018492) and Chosun University (2021, Grant number: K207469005-1).

Data Availability Statement

Data are contained within the article.

Conflicts of Interest

The authors declare no conflict of interest.

Nomenclature

  S L laminar flame velocity
  B m maximum laminar velocity
  B laminar velocity roll-off value
  the equivalence ratio
  m equivalence ratio at maximum velocity
  T u unburned gas temperature
  T r e f 298 K
  ρ pressure
  ρ r e f 101,325 Pa
  α temperature exponent
  β pressure exponent
  D i l u t i o n residual mass fraction in the unburned zone
Me M e trapped mass
  M b burned mass
  C T F S turbulent flame speed multiplier
  C T L S Taylor length scale multiplier
  C F K G flame kernel growth multiplier
  S T turbulent flame speed
  R f flame radius
  A e surface area at the flame front
  ρ u unburned density
  t represents time
  λ Taylor microscale length or excess air ratio
  L i integral length scale
  u turbulent intensity
  R e t turbulent Reynolds number
  μ u unburned zone dynamic viscosity

References

  1. BP. Statistical Review of World Energy. 2022. Available online: https://www.bp.com/en/global/corporate/energy-economics/statistical-review-of-world-energy.html (accessed on 28 June 2022).
  2. Gómez, D.R.; Watterson, J.D.; Americano, B.B.; Ha, C.; Marland, G.; Matsika, E.; Namayanga, L.N.; Osman-Elasha, B.; Saka, J.D.K.; Treanton, K.; et al. Guidelines for National Greenhouse Gas Inventories; Intergovernmental Panel on Climate Change (IPCC): Geneva, Switzerland, 2006. [Google Scholar]
  3. Andres, R.J.; Boden, T.A.; Bréon, F.M.; Ciais, P.; Davis, S.; Erickson, D.; Gregg, J.S.; Jacobson, A.; Marland, G.; Miller, J.; et al. A synthesis of carbon dioxide emissions from fossil-fuel combustion. Biogeosciences 2012, 9, 1845–1871. [Google Scholar] [CrossRef]
  4. Falkner, R. The Paris Agreement and the new logic of international climate politics. Int. Aff. 2016, 92, 1107–1125. [Google Scholar] [CrossRef]
  5. Schleussner, C.F.; Rogelj, J.; Schaeffer, M.; Lissner, T.; Licker, R.; Fischer, E.M.; Knutti, R.; Levermann, A.; Frieler, K.; Hare, W. Science and policy characteristics of the Paris Agreement temperature goal. Nat. Clim. Change 2016, 6, 827–835. [Google Scholar] [CrossRef]
  6. Chen, L.; Msigwa, G.; Yang, M.; Osman, A.I.; Fawzy, S.; Rooney, D.W.; Yap, P.S. Strategies to achieve a carbon neutral society: A review. Environ. Chem. Lett. 2022, 20, 2277–2310. [Google Scholar] [CrossRef]
  7. IEA. Transport Sector CO2 Emissions by Mode in the Sustainable Development Scenario; IEA: Paris, France, 2019; pp. 2000–2030. [Google Scholar]
  8. Abdel-Rahman, A. On the emissions from internal-combustion engines: A review. Int. J. Energy Res. 1998, 22, 483–513. [Google Scholar] [CrossRef]
  9. Alagumalai, A. Internal combustion engines: Progress and prospects. Renew. Sustain. Energy Rev. 2014, 38, 561–571. [Google Scholar] [CrossRef]
  10. Afanaseva, O.; Bezyukov, O.; Pervukhin, D. Perspective Technical Solutions for the Cylinder-Piston Group Vibrations Reduction; Taylor& Francis Group: Abingdon, UK, 2018; pp. 293–300. [Google Scholar]
  11. Afanaseva, O.; Bezyukov, O.; Pervukhin, D.; Tukeev, D. Experimental Study Results Processing Method for the Marine Diesel Engines Vibration Activity Caused by the Cylinder-Piston Group Operations. Inventions 2023, 8, 71. [Google Scholar] [CrossRef]
  12. Ji, C.; Wang, S. Effect of hydrogen addition on combustion and emissions performance of a spark ignition gasoline engine at lean conditions. Int. J. Hydrogen Energy 2009, 34, 7823–7834. [Google Scholar] [CrossRef]
  13. Kim, J.; Chun, K.M.; Song, S. Thermal efficiency improvement of a range extender based on the T-GDI engine for a medium-size electric bus using on-board gasoline fuel reforming with steam addition. Fuel 2021, 300, 120965. [Google Scholar] [CrossRef]
  14. Yu, X.; Li, G.; Du, Y.; Guo, Z.; Shang, Z.; He, F.; Shen, Q.; Li, D.; Li, Y. A comparative study on effects of homogeneous or stratified hydrogen on combustion and emissions of a gasoline/hydrogen SI engine. Int. J. Hydrogen Energy 2019, 44, 25974–25984. [Google Scholar] [CrossRef]
  15. Cho, J.; Song, S. Prediction of hydrogen-added combustion process in T-GDI engine using artificial neural network. Appl. Therm. Eng. 2020, 181, 115974. [Google Scholar] [CrossRef]
  16. Park, J.; Cha, H.; Song, S.; Chun, K.M. A numerical study of a methane-fueled gas engine generator with addition of hydrogen using cycle simulation and DOE method. Int. J. Hydrogen Energy 2011, 36, 5153–5162. [Google Scholar] [CrossRef]
  17. Zhang, R.; Chen, L.; Pan, J.; Wei, H.; Zhou, L.; Liu, C. Effects of direct-injected hydrogen addition on methane combustion performance in an optical SI engine with high compression-ratio. Int. J. Hydrogen Energy 2020, 45, 3284–3293. [Google Scholar] [CrossRef]
  18. Zhen, X.; Li, X.; Wang, Y.; Liu, D.; Tian, Z. Comparative study on combustion and emission characteristics of methanol/hydrogen, ethanol/hydrogen and methane/hydrogen blends in high compression ratio SI engine. Fuel 2020, 267, 117193. [Google Scholar] [CrossRef]
  19. Seelam, N.; Gugulothu, S.K.; Reddy, R.V.; Bhasker, B.; Kumar Panda, J. Exploration of engine characteristics in a CRDI diesel engine enriched with hydrogen in dual fuel mode using toroidal combustion chamber. Int. J. Hydrogen Energy 2022, 47, 13157–13167. [Google Scholar] [CrossRef]
  20. Frost, J.; Tall, A.; Sheriff, A.M.; Schönborn, A.; Hellier, P. An experimental and modelling study of dual fuel aqueous ammonia and diesel combustion in a single cylinder compression ignition engine. Int. J. Hydrogen Energy 2021, 46, 35495–35510. [Google Scholar] [CrossRef]
  21. Li, H.; Karim, G.A. Exhaust emissions from an SI engine operating on gaseous fuel mixtures containing hydrogen. Int. J. Hydrogen Energy 2005, 30, 1491–1499. [Google Scholar] [CrossRef]
  22. Chaichan, M.T. EGR effects on hydrogen engines performance and emissions. Int. J. Sci. Eng. Res. 2016, 7, 80–90. [Google Scholar]
  23. Dhyani, V.; Subramanian, K.A. Control of backfire and NOx emission reduction in a hydrogen fueled multi-cylinder spark ignition engine using cooled EGR and water injection strategies. Int. J. Hydrogen Energy 2019, 44, 6287–6298. [Google Scholar] [CrossRef]
  24. Xin, G.; Ji, C.; Wang, S.; Meng, H.; Chang, K.; Yang, J. Effect of ammonia addition on combustion and emission characteristics of hydrogen-fueled engine under lean-burn condition. Int. J. Hydrogen Energy 2022, 47, 9762–9774. [Google Scholar] [CrossRef]
  25. Chai, W.S.; Bao, Y.; Jin, P.; Tang, G.; Zhou, L. A review on ammonia, ammonia-hydrogen and ammonia-methane fuels. Renew. Sustain. Energy Rev. 2021, 147, 111254. [Google Scholar] [CrossRef]
  26. Kiesgen, G.; Klüting, M.; Bock, C.; Fischer, H. The New 12-Cylinder Hydrogen Engine in the 7 Series-The H2 ICE Age Has Begun. SAE Tech. Pap. Ser. 2006, 1, 0431. [Google Scholar]
  27. Tang, X.; Kabat, D.M.; Natkin, R.J.; Stockhausen, W.F. Ford P2000 Hydrogen Engine Dynamometer Development. SAE Tech. Pap. Ser. 2022, 111, 631–642. [Google Scholar]
  28. Jaura, A.K.; Ortmann, W.; Stuntz, R.; Natkin, B.; Grabowski, T. Ford’s H2RV-An Industry First HEV Propelled with a H2 Fueled Engine-A Fuel Efficient and Clean Solution for Sustainable Mobility. SAE Tech. Pap. Ser. 2004, 1, 0058. [Google Scholar]
  29. Lee, S.; Kim, G.; Bae, C. Behavior of hydrogen hollow-cone spray depending on the ambient pressure. Int. J. Hydrogen Energy 2021, 46, 4538–4554. [Google Scholar] [CrossRef]
  30. Gamma Technologies. Engine_Performance Application Manual; Version 2022; Gamma Technologies: Westmont, IL, USA, 2022. [Google Scholar]
  31. Han, Z.; Reitz, R.D. Turbulence modeling of internal combustion engines using RNG κ-ε models. Combust. Sci. Technol. 1995, 106, 267–295. [Google Scholar] [CrossRef]
  32. Yakhot, V.; Orszag, S.A. Renormalization group analysis of turbulence. I. Basic theory. J. Sci. Comput. 1986, 1, 3–51. [Google Scholar] [CrossRef]
  33. Lucchini, T.; D’Errico, G.; Fiocco, M. Multi-Dimensional Modeling of Gas Exchange and Fuel-Air Mixing Processes in a Direct-Injection, Gas Fueled Engine. SAE Tech. Pap. Ser. 2011, 24, 0036. [Google Scholar]
  34. Convergent Science. CONVERGE 3.0 Manual; Version 3.0; Convergent Science: Madison, WI, USA, 2021. [Google Scholar]
Figure 1. Engine geometry in CFD analysis: (a) oblique view; (b) plan view.
Energies 16 07509 g001
Figure 2. Details of the base grid with AMR and fixed embedding in the spark plug region and intake and exhaust port regions.
Energies 16 07509 g002
Figure 3. Injector and nozzle geometry.
Energies 16 07509 g003
Figure 4. (a) Mole fraction of H2 with respect to injection angle for λ1.5–30deg. (b) Mole fraction of H2 with respect to injection angle for λ1.5–45deg. (c) Mole fraction of H2 with respect to injection angle for λ1.5–60deg.
Energies 16 07509 g004aEnergies 16 07509 g004b
Figure 5. (a) Mole fraction of H2 with respect to injection angle for λ2–30deg. (b) Mole fraction of H2 with respect to injection angle for λ2–45deg. (c) Mole fraction of H2 with respect to injection angle for λ2–60deg.
Energies 16 07509 g005aEnergies 16 07509 g005b
Figure 6. (a) Mole fraction of H2 with respect to injection angle for λ2.5–30deg. (b) Mole fraction of H2 with respect to injection angle for λ2.5–45deg. (c) Mole fraction of H2 with respect to injection angle for λ2.5–60deg.
Energies 16 07509 g006aEnergies 16 07509 g006b
Figure 7. (a) Turbulent kinetic energy in the cylinder as a function of the injection angle for λ1.5. (b) Turbulent kinetic energy in the cylinder as a function of the injection angle for λ2. (c) Turbulent kinetic energy in the cylinder as a function of the injection angle for λ2.5.
Energies 16 07509 g007
Figure 8. Tumble ratio according to spray angle and excess air ratio. (a) Tumble ratio X; (b) Tumble ratio Y.
Energies 16 07509 g008
Figure 9. (a) Variation of combustion pressure and temperature in the cylinder with respect to injection angle for λ1.5. (b) Variation of combustion pressure and temperature in the cylinder with respect to injection angle for λ2. (c) Variation of combustion pressure and temperature in the cylinder with respect to injection angle for λ2.5.
Energies 16 07509 g009
Figure 10. Mass fractions of 10% and 90% burned for each injection angle and excess air ratio.
Energies 16 07509 g010
Figure 11. (a) Apparent heat release and apparent heat release rate of a cylinder from CFD analysis as a function of spray angle for λ1.5. (b) Apparent heat release and apparent heat release rate of a cylinder from CFD analysis as a function of spray angle for λ2. (c) Apparent heat release and apparent heat release rate of a cylinder from CFD analysis as a function of spray angle for λ2.5.
Energies 16 07509 g011
Figure 12. NOx emissions in the cylinder and exhaust manifold for each injection angle and excess air ratio.
Energies 16 07509 g012
Table 1. Engine specifications and operating conditions.
ParameterSpecification
Virtual engine type4cylinder DI-SI engine
Bore × Stroke [mm]86 × 86
Displacement [cc]1998
Compression ratio10:1
Intake valve timing2aTDC—70aBDC
Exhaust valve timing13bBDC—38aTDC
RPM2000
Start of injection (SOI)−100 aTDC
Injection pressure [MPa]2.5
Boosting systemTurbocharger
Boost pressure [MPa]0.125
Excess air ratio [λ]1.5–2.5
Spark timing (ST)−25 aTDC
Table 2. Mesh refinement strategies.
RegionStrategyEmbedding Level
In-cylinderAMR (velocity, temperature)
Fixed embedding (cylinder)
3
2
InjectorFixed embedding (cylinder)3
Spark plugFixed embedding (sphere)5, 6
Piston headFixed embedding (boundary)3
Piston skirtFixed embedding (boundary)3
Cylinder headFixed embedding (boundary)3
Table 3. Boundary conditions and initial conditions.
Parameter1D3D-CFD
Inlet pressure1.25 bar
Inlet temperature300 K
Outlet pressure1.01325 bar
Outlet temperature800 K
Cylinder temperature800 K
Liner temperature350 K
Head temperature350 K
Fuel temperature300 K
Disclaimer/Publisher’s Note: The statements, opinions and data contained in all publications are solely those of the individual author(s) and contributor(s) and not of MDPI and/or the editor(s). MDPI and/or the editor(s) disclaim responsibility for any injury to people or property resulting from any ideas, methods, instructions or products referred to in the content.

