Article

Development of a Novel Control Scheme to Achieve the Minimum Unbalance Factor and Real Power Fluctuations under Asymmetrical Faults

Institute of Electrical Power Systems, Graz University of Technology, Inffeldgasse 18, 8010 Graz, Austria
*
Author to whom correspondence should be addressed.
Energies 2023, 16(22), 7511; https://doi.org/10.3390/en16227511
Submission received: 29 September 2023 / Revised: 2 November 2023 / Accepted: 7 November 2023 / Published: 9 November 2023
(This article belongs to the Section A1: Smart Grids and Microgrids)

Abstract

:
The increasing share of converter-based renewable energy sources in the power system has forced the system operators to demand voltage support from the converters in case of faults. In the case of symmetric faults, all the phases have equal voltage support, but in the case of asymmetric faults, selective voltage support is required. The grid codes define the voltage support required in the case of symmetric/asymmetric faults, which is the reactive current injection in the respective sequence proportional to its voltage dip, but studies confirm that it does not result in a minimum unbalance factor in the case of asymmetric faults. The unbalance factor is an indication of the level of imbalance voltage among the phases. Moreover, it also results in fluctuated active power injection in the case of asymmetric faults, which causes dc link voltage fluctuations, and the power reversal may also occur due to such fluctuations, which leads to higher protection costs for the dc link. In order to (1) enhance the uniformity of voltage among different phases in the case of asymmetric faults and (2) minimize the real power fluctuations in such conditions, a novel control scheme is presented in this paper. It optimally distributes the negative sequence current phasor into its active and reactive components to achieve the minimum voltage unbalance factor. It also confirms the minimum real power fluctuations by adjusting the positive and negative sequence current phasors. The proposed scheme also ensures the current limit of the converter. The proposed scheme is developed in Matlab/Simulink and tested under different faulty conditions. The results confirm the better performance of the proposed scheme against the grid code recommendation under different faulty conditions.

1. Introduction

Renewable energy sources are gaining more attention due to the depletion of conventional energy sources and increasing greenhouse gas emissions. Converter-based renewable energy sources are the future of modern power systems. They are capable of providing flexible control along with clean energy and low production costs. In 2022, 30% of the total global electricity generation was from renewable sources, and it is experiencing an increasing trend [1]. This share is expected to reach 75% by 2027 [2]. The shift to renewable energy is mainly led by converter-based sources (solar and wind), as they make up 92% of the new renewable energy installations [1]. The large penetration of converter-based sources has a huge impact on the reliability of the system, particularly under faulty conditions. The converter’s performance under such conditions defines the response of the modern power system. Hence, research on the converter’s response under such conditions is vital for the stability of modern power systems. The introduction is arranged into three different subparts, as given below.
  • Motivation and Incitement.
  • Literature Review.
  • Major Contributions and Manuscript Structure.

1.1. Motivation and Incitement

Due to the increasing penetration of converter-based power sources, the grid operators define grid codes for the response of the converter in a particular situation. Among these situations, low-voltage ride-through (LVRT) is gaining more attention in cases of unbalanced faults. The LVRT capability curve for the distributed generators is discussed in [3] and presented in Figure 1.
The normalized voltage, given in Figure 1, is the ratio of the minimum measured line-to-line rms voltage against the rated line-to-line rms voltage. Initially, the converters were required just to keep feeding the power system in case of voltage dips/sags [4]. The new converters are capable of providing capacitive reactive power in LVRT conditions that make them suitable to support the grid voltage under such conditions. To minimize the chances of voltage collapse, most of the power system operators demand a particular reactive current injection in the case of LVRT to obtain the voltage support from the converters. The conventional control schemes are able to provide the same voltage support to all phases, irrespective of the type of fault. It often results in over voltage in the healthy phase(s) and more voltage difference among the phases as most of the faults are asymmetric in nature [5,6].
The relationship between the unbalanced three-phase voltage and its positive and negative sequence systems is presented in Figure 2. It shows that an unbalanced three-phase system can be presented into balanced positive and negative sequence systems where the negative sequence phasor rotates in the opposite direction as compared to the positive sequence phasor. Moreover, the resultant voltage phasor has an elliptical trajectory, but the sequence phasors have a circular trajectory.
The subscripts ‘p’ and ‘n’ represent the positive and negative sequence parameters, respectively. The unbalance factor (UF) can be an indicator to confirm the uniformity of the voltage among different phases. It is the ratio between the negative sequence voltage phasor’s magnitude and the positive sequence voltage phasor’s magnitude (|vn|/|vp|). During unbalanced faults, due to the presence of negative sequence systems, the UF will be non-zero. The severe unbalanced faults result in higher negative sequence voltage phasors, which results in a higher UF. In ideal conditions, it should be zero. To obtain selective voltage support, the recent grid codes (VDEAR-N 4110) demand specific negative sequence reactive current injection. This not only helps achieve selective voltage support and minimizes the voltage difference among the phases but also helps in selective fault clearing. Figure 3 shows the recent grid code (VDEAR-N 4110) requirement under asymmetrical faults [7,8].
The symbol ‘∆’ shows the change in a particular parameter from its pre-fault value. In various papers, the authors show that only a reactive current injection in the negative sequence does not result in the minimum UF. To achieve the minimum UF, certain grid characteristics at the point of connection (POC) are required, i.e., an X/R ratio of grid and fault, short circuit power of the grid, and fault impedance, etc. These parameters are often not easy to define in real time at the POC. Moreover, negative sequence current injection results in real power fluctuations in most cases as the positive and negative sequence current phasors are generated explicitly, which causes dc link voltage fluctuations and power reversal. The motivation behind this research is to develop a new control strategy to optimally distribute the negative sequence current into its active and reactive components to achieve a minimum UF while ensuring the minimum real power fluctuations, which will result in reduced protection for the dc link. Moreover, some control simplifications are also focused, e.g., direct reference current calculation for the negative sequence in the stationary reference frame.

1.2. Literature Review

There are different control strategies to inject selective current in each phase in the case of asymmetrical faults. The selection of a particular control strategy is also dependent on the hardware of the converter, e.g., three-phase three-leg converters, three-phase four-leg converters, etc. In [9], the authors discussed these control strategies for different converters. The main control strategies include the symmetrical component-based and the per-phase-based strategies. Due to its comparatively simpler control and applicability to most of the converter types, the symmetrical component-based control strategy is applied in this paper. In [5], the authors discussed possible applications of the negative sequence current injection, e.g., to minimize the UF, improve the injected power quality, and reduce the DC link voltage ripples, but they did not use it to achieve multiple objectives. In [8], the authors show that the recent grid code recommendations do not result in minimum UF in most of the faulty conditions, but they did not discuss the assessment of the optimal angle for the negative sequence current phasor corresponding to the minimum UF. Moreover, the real power fluctuations are also not discussed.
In [10], the authors proposed a control scheme to achieve uniform voltage among all the phases. However, this scheme needs an estimated angle, which is hard to assess. It also did not discuss the fluctuations in the injected real power. In [11], the authors presented the impact of different k-values on selective fault detection. Two priority injection schemes were discussed. However, only the reactive current injection in the negative sequence was considered. It also did not discuss the fluctuations in real power. In [12], the authors injected a non-zero active component of current in the negative sequence and studied its impact on the stability of a phase-locked loop (PLL) under weak grid conditions. However, the impact on the UF was not discussed.
In [13], the authors discussed different priority injections and observed their effect on the UF. They introduced a new current limiting scheme to use the converter’s current capacity effectively. However, they did not discuss the non-zero active current injection in the negative sequence. In most of the manuscripts where the UF is discussed, only the reactive current injection in the negative sequence is considered [14,15,16].
In [17], the authors investigated the impact of non-zero active current injections in the negative sequence over real and reactive power fluctuations. However, they did not discuss the impact of such injections on the UF. Moreover, the optimal distribution of negative sequence currents among its components was also not discussed. In [18], the authors used negative sequence current injection to minimize the real power fluctuations. However, they did not discuss the impact on the UF. In [19], the authors presented a control scheme that injects more current in the faulty phase(s) and minimizes the real power fluctuations. It also confirmed that both real and reactive power fluctuations cannot be minimized simultaneously. However, it did not discuss the impact on the UF, and the associated current distribution among its components was also not discussed. In [20], the authors presented a control scheme to minimize the real power fluctuations, but they did not discuss its impact on the UF.
The literature review confirms that the impact of non-zero active current injection in the negative sequence is not addressed widely, but few publications confirm its effectiveness as far as UF is concerned. The negative sequence current injection also has an impact on the real power fluctuations. It is important to find the optimal k-factor and current distribution for the negative sequence current injection to achieve the minimum UF and lower real power fluctuations while ensuring the current limit of the converter.

1.3. Major Contributions and Manuscript Structure

The aim of this paper is to design a simplified control scheme for grid-tied converters that offers selective voltage support in the case of asymmetrical faults and results in minimum UF and real power fluctuations while ensuring the current limit of the converter. The proposed control scheme does not require additional measurements/information for the estimation of the optimal angle of injection of negative sequence current. It offers a direct reference current calculation for the negative sequence in the stationary reference frame. Hence, the stability issues related to the PLL of the negative sequence are excluded. It uses a unified inner current controller for both sequence injections. The major points discussed in the manuscript are given below.
  • Estimation of optimal angle injection (associated with the current distribution among its components) for the negative sequence current to achieve the minimum possible UF.
  • Calculation of kn to achieve the minimum real power fluctuations for a particular distribution of negative sequence current phasor.
  • Ensuring the current limit of the converter while achieving minimum UF and real power fluctuations.
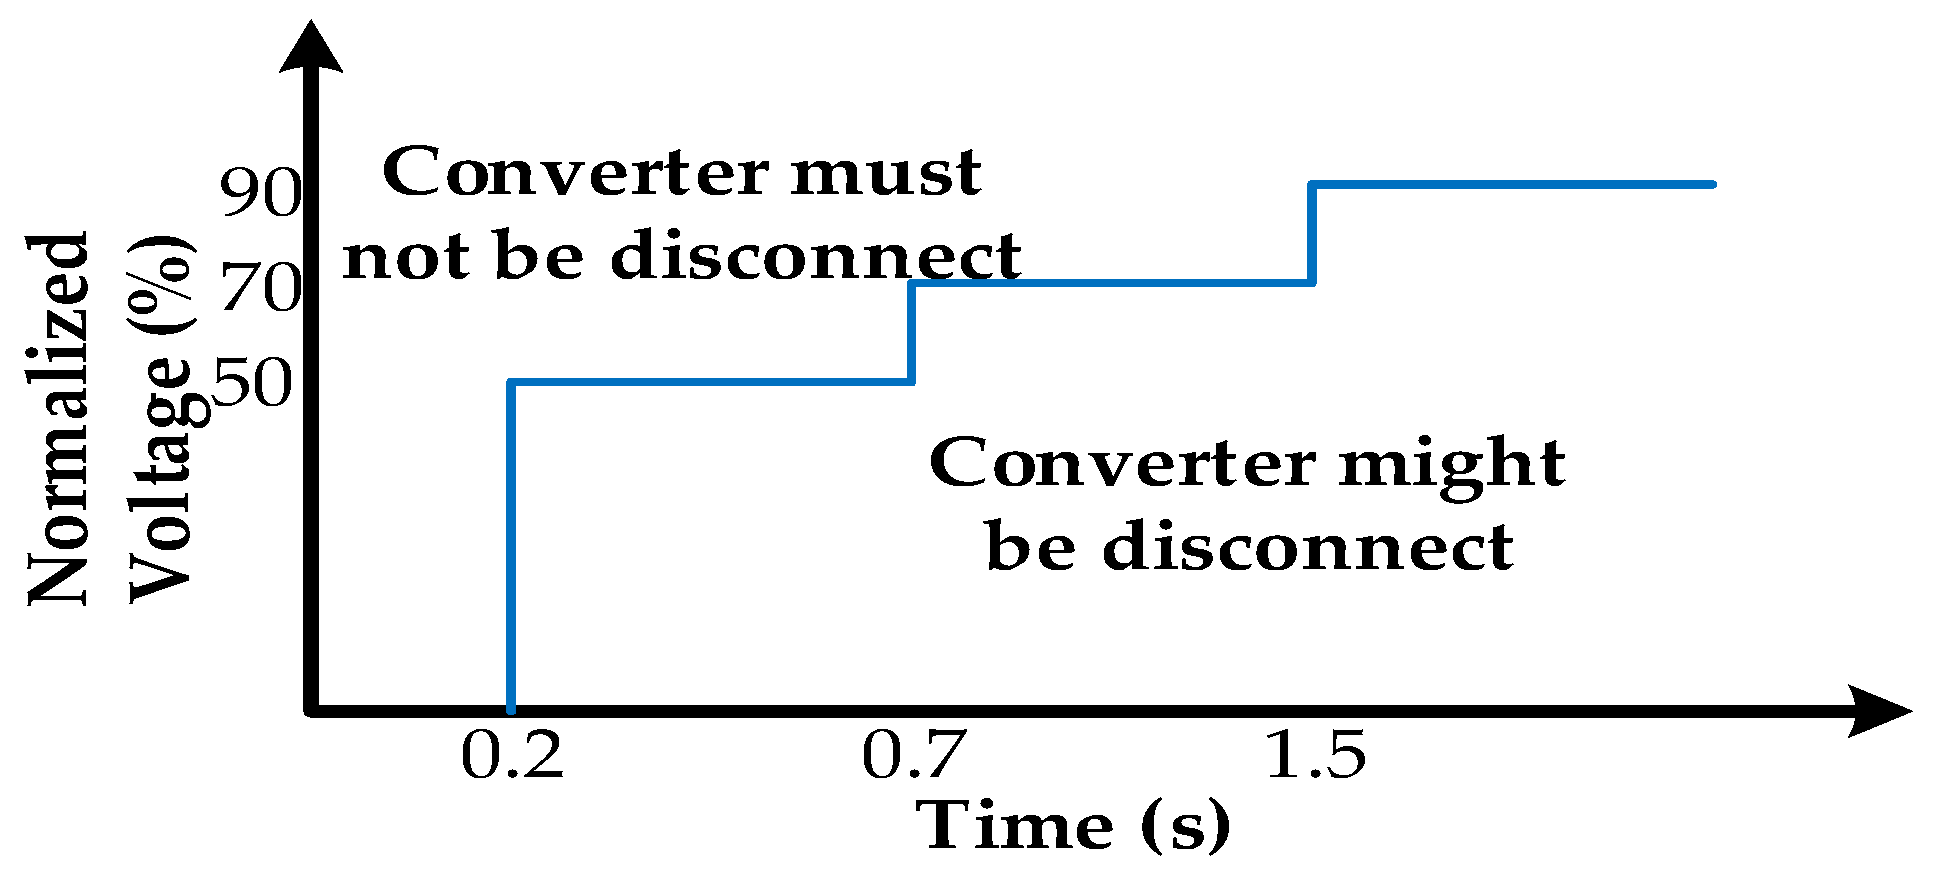
  • Comparison with the recommendations of recent grid codes (VDEAR-N-4110).
The optimal distribution (associated with the minimum UF) of the negative sequence current phasor into its components is dependent on the type of fault, short circuit power at POC, X/R ratio of the grid and fault, etc. These parameters are hard to assess in different fault conditions. Hence, in this paper, this information is not used to estimate such a distribution.
The layout of the manuscript is as follows: The test setup is explained in Section 2. It also presents different parameters of the test setup. The control schemes for the minimum UF and minimum real power fluctuations are discussed in Section 3. It also presents the combined control scheme along with the current limiting strategy. Section 4 presents the performance comparison of the newly developed schemes with the grid code recommendations for different types of faults. The paper is finally concluded in Section 5. It also presents the operating limitations of the newly developed schemes, along with the possibility of further research.

2. Layout of Test Setup
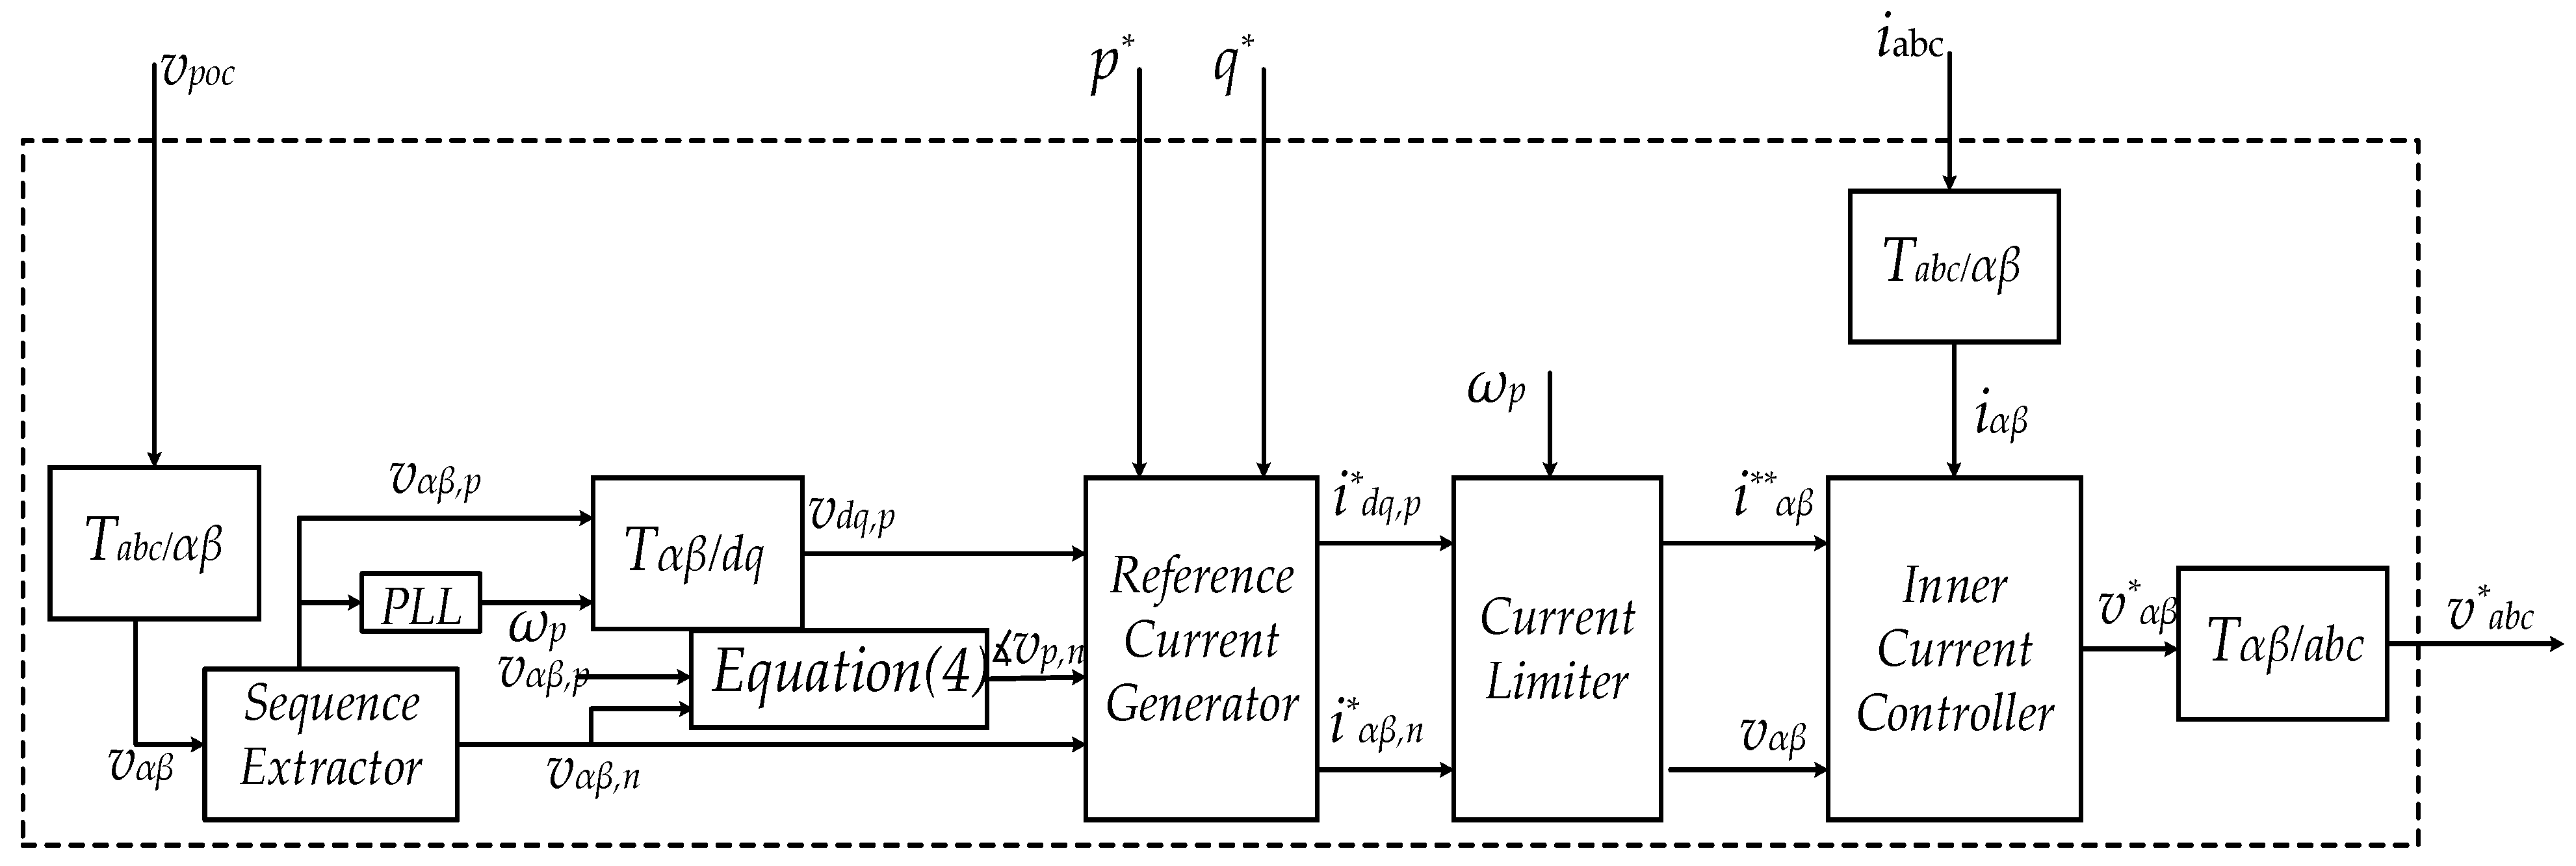
The layout of the test setup is shown in Figure 4.
The primary energy source is connected to the grid with the help of a two-level, three-phase, three-leg converter. An LCL filter is used to suppress the harmonic injection. A step-up transformer in ∆-Y configuration is used to step up the voltage to the grid voltage. The three-phase voltage and current are measured at POC. The control unit is capable of estimating the optimal angle for the negative sequence current injection, which corresponds to the minimum UF. It generates the reference currents for the positive and negative sequences and ensures the minimum real power fluctuations under asymmetrical faults. The detailed control scheme will be discussed in the coming section. The output of the control unit is passed to the modulation unit, which uses pulse width modulation (PWM) to generate gating pulses for the converter switches. An unbalanced fault is introduced at POC. The parameters related to the grid, transformer, filter, and converter are given in Table 1. 12 MVA is used as base power and 20 kV as base rms line-to-line voltage for the per unit (p.u) calculations.

3. Control Scheme

A control scheme is presented in Figure 5 to provide selective voltage support in the case of asymmetrical faults. It transforms the measured three-phase voltage and current into its symmetrical sequence components. As the converter is a three-phase, three-leg converter that is unable to inject the zero-sequence component, only positive and negative sequence controls are discussed here.
Addressing the different blocks presented in Figure 5, the transformations from one reference frame to the other are well defined, and their transfer functions are available in the literature. Ignoring the zero-sequence component, the transfer matrices for different transformations are given in (1).
T a b c / α β = 2 3 0 1 3 1 3 1 3 1 3 ;   T α β / a b c = 1 1 2 1 2 0 3 2 3 2 T α β / d q = c o s ( θ ) s i n ( θ ) s i n ( θ ) c o s ( θ ) ;   T d q / α β = c o s ( θ ) s i n ( θ ) s i n ( θ ) c o s ( θ )
The major parts of the control scheme are discussed below.

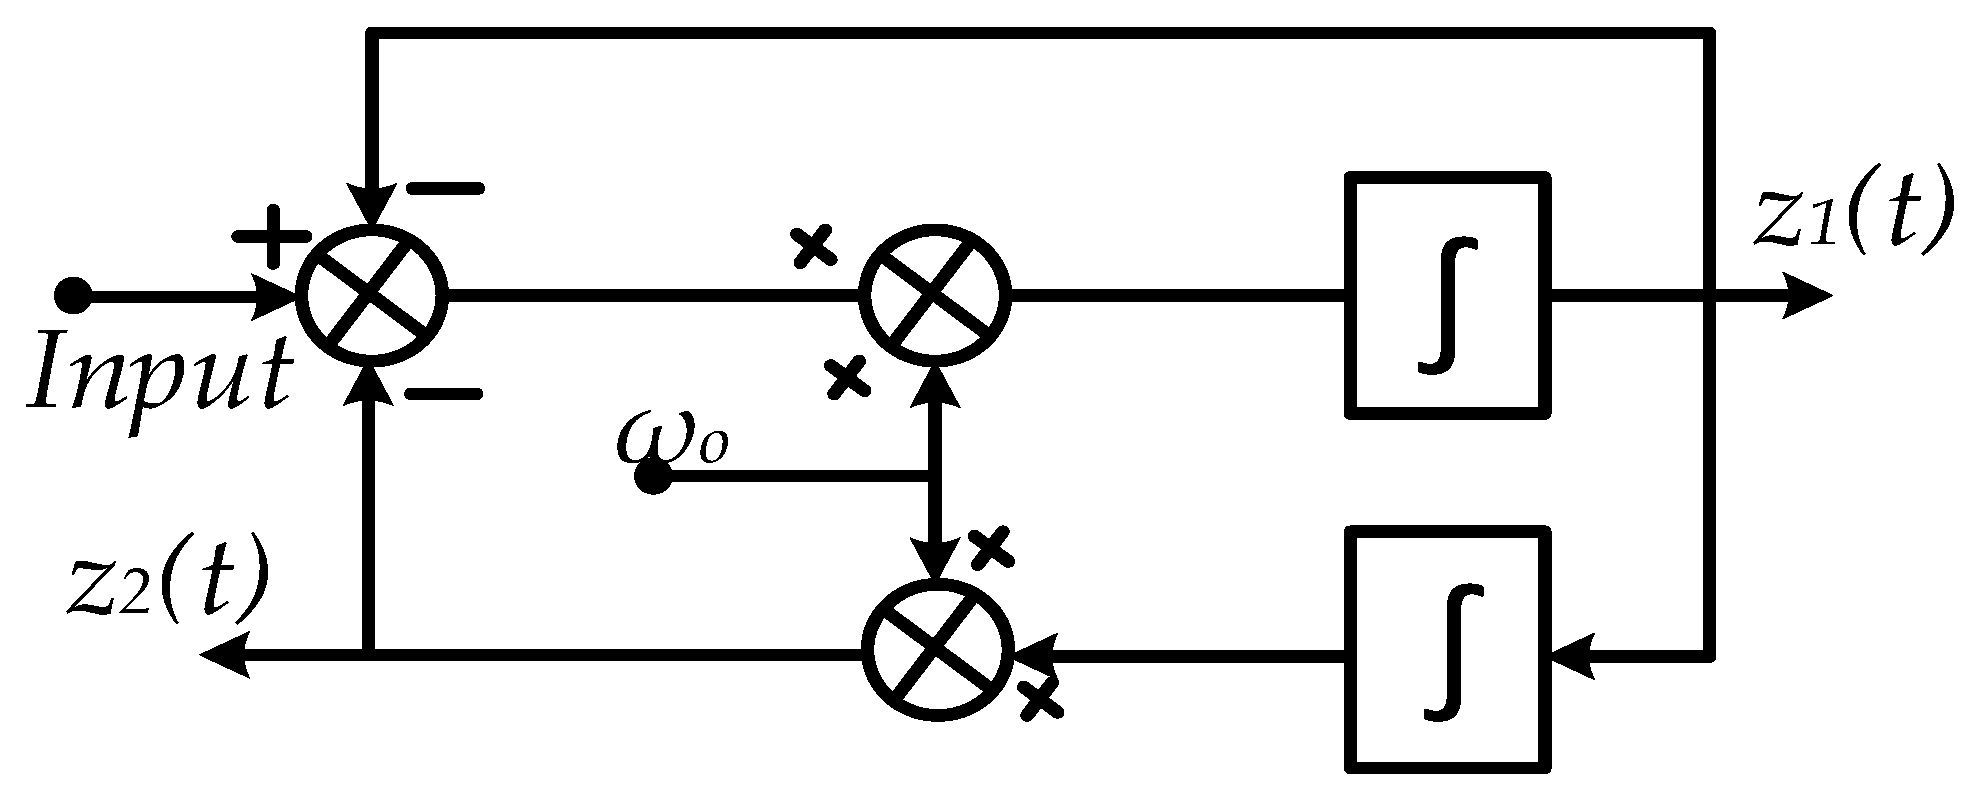
3.1. Sequence Extractor

In the literature, there are different sequence extraction schemes available [21,22,23,24,25]. Most of these sequence extraction techniques use the fundamental equation in the stationary reference frame that is given in (2).
v α p ( t ) v β p ( t ) v α n ( t ) v β n ( t ) = 1 2 v α ( t ) v β ( t ) T v α ( t ) + v β ( t ) T v β ( t ) + v α ( t ) T v β ( t ) v α ( t ) T
The superscript ‘T’ denotes the orthogonal of the corresponding components. To find the orthogonal of a signal in real time, different integrator techniques are used. In this manuscript, the second-order generalized integrator (SOGI) is used to compute the orthogonal of a signal in real time. It also serves as an active filter because it requires the fundamental frequency. The general layout of the SOGI is given in Figure 6.
o is the fundamental frequency that is used to compute the orthogonal of the signal. If the frequency of the input signal is o, then z1(t) is the same as the input, and z2(t) is the orthogonal of the input signal. The mathematical expressions for the SOGI are discussed in [13].

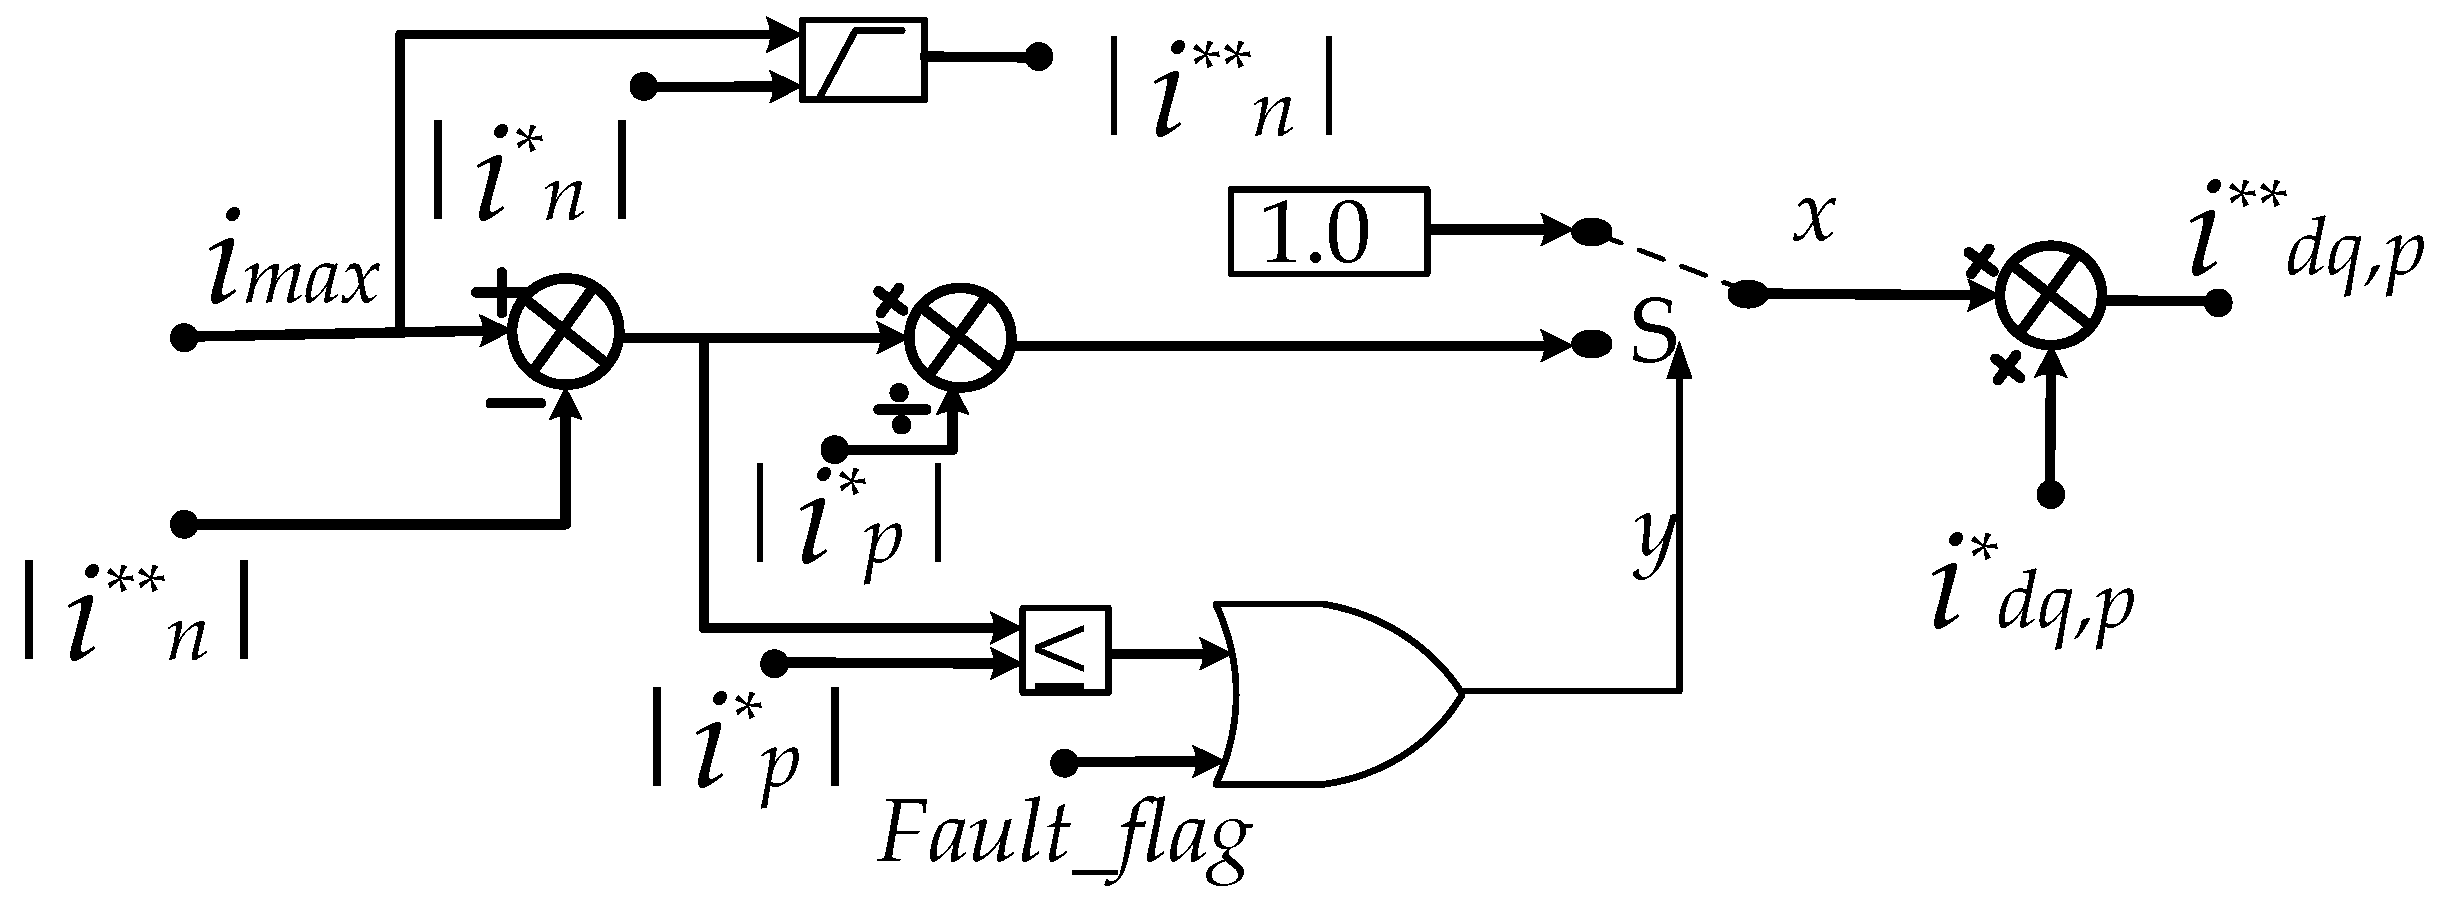
3.2. Current Limiter

The positive and negative sequence phasors rotate with the same rotational frequency but in opposite directions, due to which the resultant phasor has an elliptical trajectory instead of a circular trajectory [13]. The current limiter block in Figure 5 ensures that the maximum phase current does not exceed the converter current limit. It adjusts the reference current’s magnitude to ensure safe operation of the converter. The control layout of the current limiter is given in Figure 7.
The superscript ‘*’ represents the reference quantities, and ‘**’ shows the reference values after applying the current limit. The ‘Fault_flag’ is an indication of the LVRT condition. The magnitude of negative sequence current phasors is calculated to keep real power fluctuations to a minimum. The negative sequence current injection is prioritized over the positive sequence current injection. The fundamental equations related to the current limit are given in (3), with ‘y’ being the indication of the conditions associated with the current limitations for the positive sequence.
i * p + i * n i max x = 1.0                             i f   y = 0 i max i * * n i * p         i f   y = 1
From (3), it is clear that the phase angle for the reference sequence currents is not changed by the current limiting scheme. It changes the magnitude of the circular current for both sequence injections.

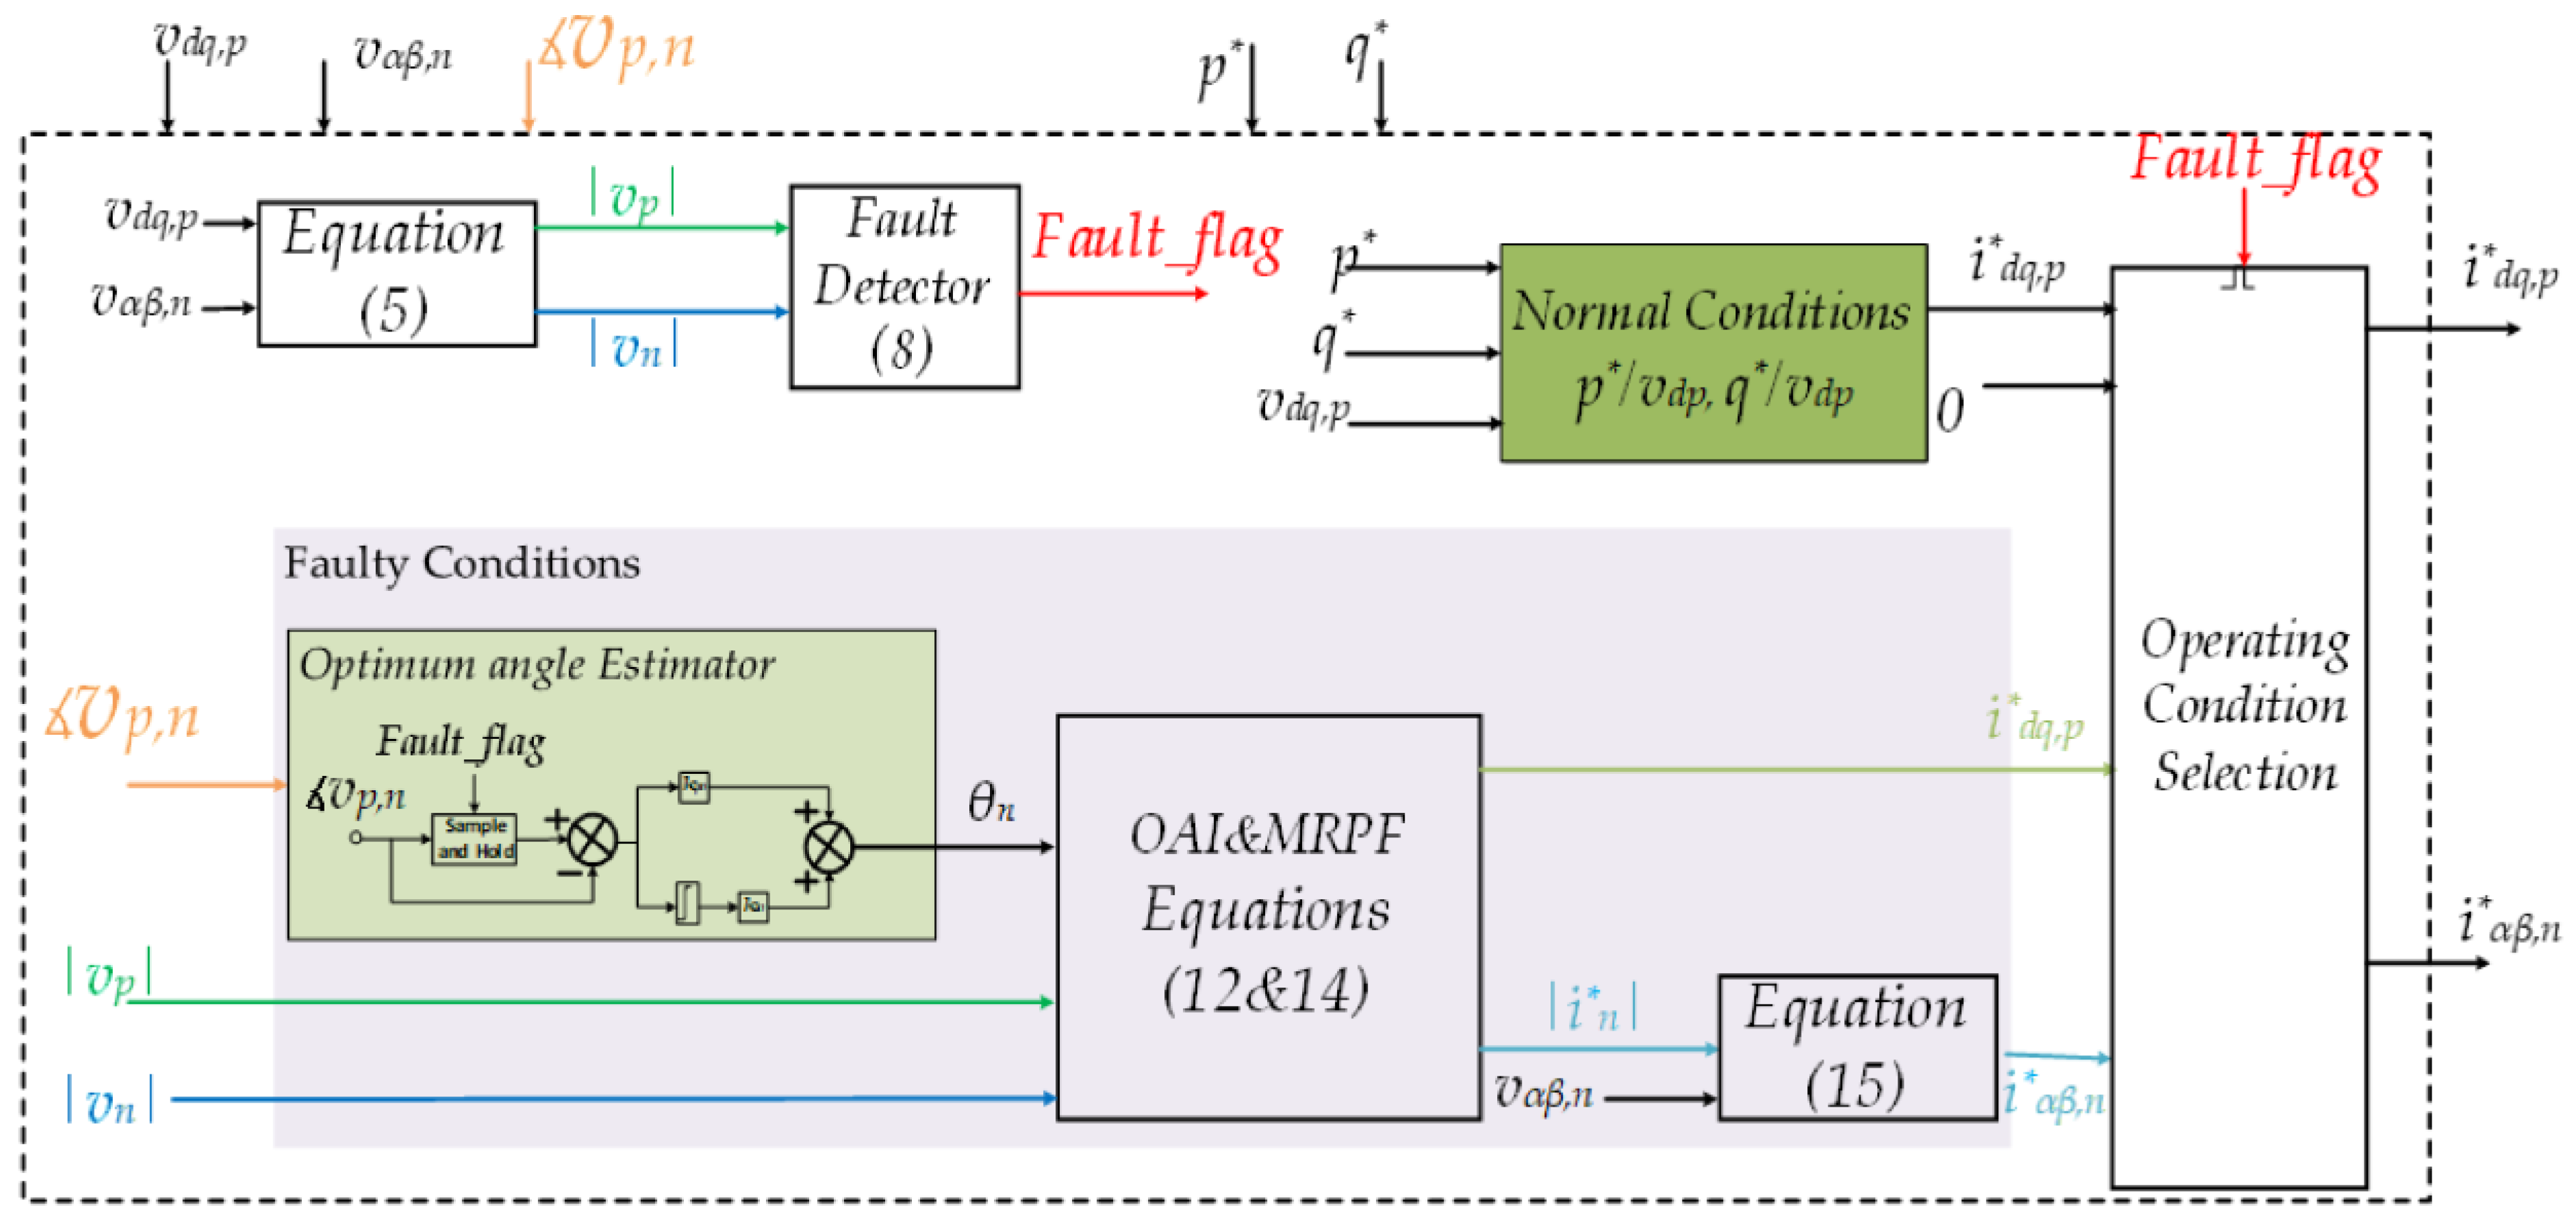
3.3. Reference Current Generator

The reference current generator is the main part of the control scheme that decides the reference currents for both sequences in normal and faulty conditions. The reference currents in normal conditions are proportional to the reference’s real and reactive power. In faulty conditions, the reference currents are calculated to maintain the minimum real power fluctuations and the minimum UF. The authors have discussed the reference current generation for the normal conditions in detail in their other publication [13]. As the focus of this manuscript is on the converter’s performance in asymmetrical faults, the reference current generation in the case of asymmetrical faults will be discussed here. Before discussing the expressions for the reference currents, the optimal angle (associated with minimum UF) for the negative sequence injection needs to be estimated and is discussed in the following subsection.

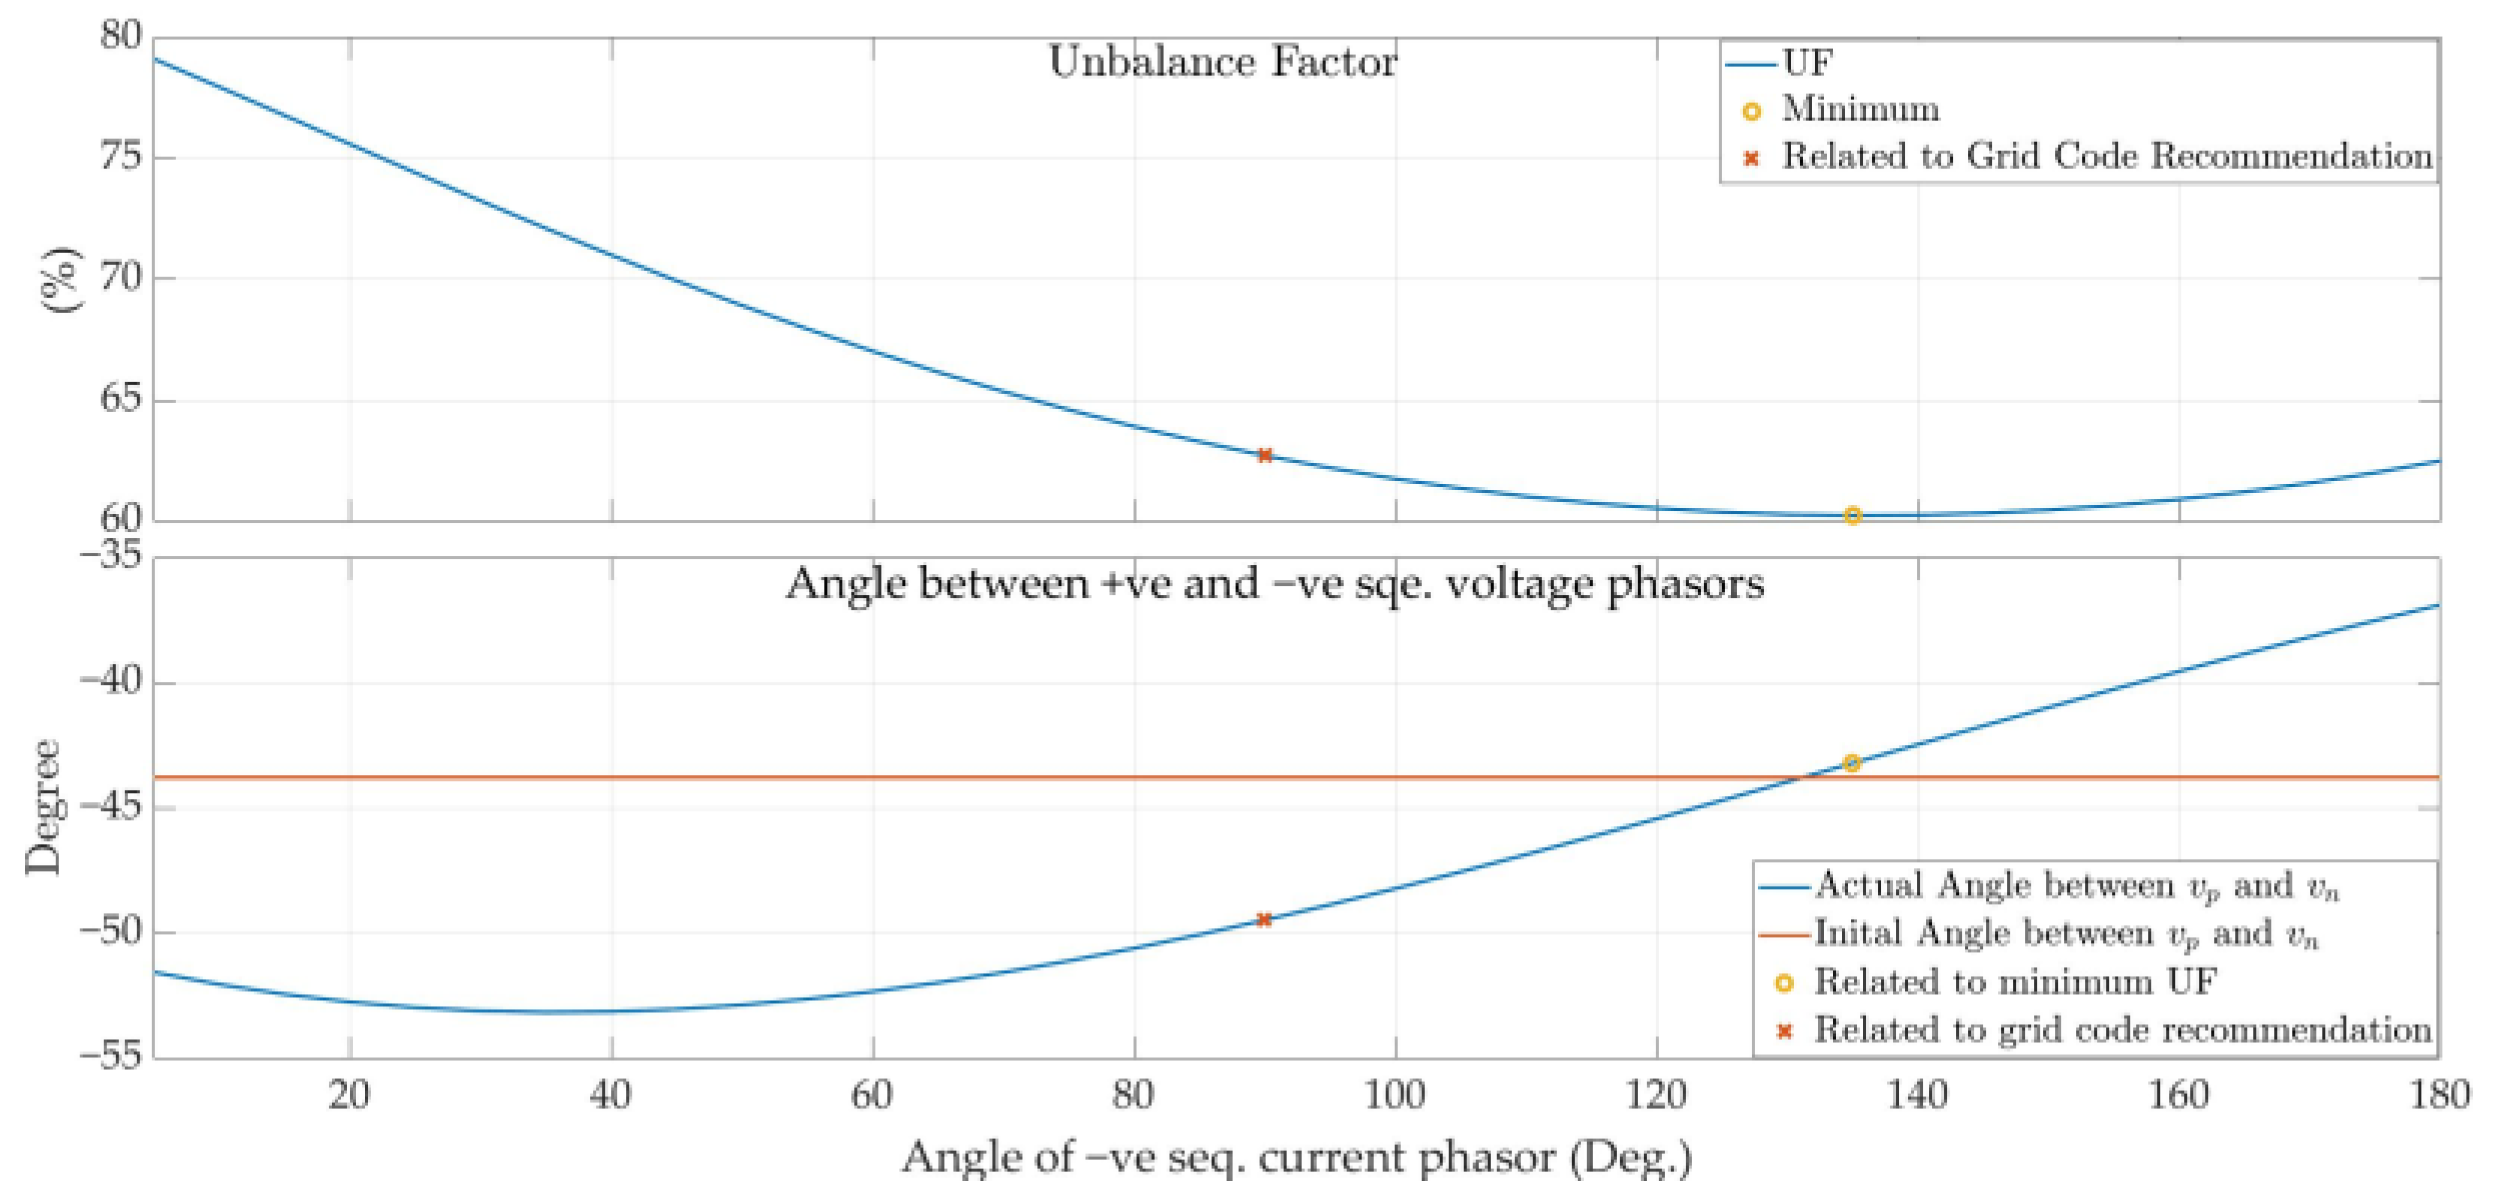
3.3.1. Optimal Angle Estimation

In [8], the authors presented a comparative study to observe the impact of non-zero active current injection in the negative sequence on the UF. It confirms that in most of the faulty conditions, the grid code recommendation does not result in a minimum UF. The challenge, however, with the optimal angle injection is the estimation of the true optimal angle in real time. This angle is dependent on various parameters, which are often unknown, e.g., the X/R ratio of the grid and fault, the short-circuit power of the grid, and the type of fault, etc. In this manuscript, a scheme is presented to estimate this angle from the measurements at the POC. The optimum angle is estimated from the angle between the positive and negative sequence voltage phasors.
In [8], the authors proved that the optimal angle can be between 0 and 180 degrees. The setup given in Figure 4 is used, and a line-to-line fault is introduced; the angle of the negative sequence current injection varies from 0 to 180 degrees with a step of 5 degrees. The UF and the angle between the positive and negative sequence voltage phasors are observed and plotted against the angle of the negative sequence current phasor (Figure 8). The magnitude of negative sequence current injections is selected according to the recommendations of the grid codes. The fault impedance is chosen as 2 Ω.
Figure 8 confirms that the minimum UF is achieved when the angle difference between the positive and negative sequence voltage phasors is corrected to its pre-fault value. It can be used to estimate the optimal angle for the negative sequence current phasor. This value can be easily captured with the help of sample and hold functions. Different types of faults are introduced with different X/R ratios of the fault to verify the dependence of optimal angles of negative sequence currents on the angle between positive and negative sequence voltage phasors. Table 2 represents the converter response for different faults with different X/R ratios of the fault.
Where the subscript ‘pre’ stands for pre-fault conditions, subscript ‘min’ corresponds to the minimum value, and the subscript ‘f’ stands for fault. For generating Table 2, the X/R ratio of the grid is chosen as 10. Table 2 confirms the following points.
  • If the type of fault is the same, then the optimum angle for the minimum UF is also the same, but the corresponding angle between the voltage phasors of sequence components can be different.
  • Moreover, keeping the same test conditions, the type of fault changes the optimum angle for the negative sequence current injection.
  • When the fault is highly inductive, then the optimum angle is close to the grid code recommendations, but this is a rare case.
  • In all the scenarios, the angle between voltage sequence phasors, corresponding to the optimal angle injection for the negative sequence current, is in good agreement with its initial value (columns 3 and 6).
Table 2 validates the findings of Figure 8. To find the optimum angle for the negative sequence current, a PI controller is used, where the input is the change in the angle between the positive and negative sequence voltage phasors. The arrangement for estimating the optimum angle is shown in Figure 9.
The angle between the positive and negative sequence voltage phasors can be calculated from its stationary components. This is given in (4).
v p , n = sin 1 v α p v β n + v β p v α n v p v n
The proportional gain (kpo) is selected as 0.2 and the integral gain (kio) as 100 for the PI controller shown in Figure 9. This scheme is tested against the scenarios discussed in [8], and the estimation is fairly accurate for various types of faults.

3.3.2. k-Factors Calculations

The other objective is to calculate the k-factors to achieve the minimum real power oscillations in the case of unbalanced faults. The voltage and current phasors can be converted into symmetric positive and negative sequence phasors. The resultant phasor is the vector sum of the respective positive and negative sequence components in the stationary reference frame. The mathematical expressions in the stationary reference frame are discussed in [20] and given below.
v α ( t ) v β ( t ) = v α p ( t ) v β p ( t ) + v α n ( t ) v β n ( t ) v p = v α p 2 + v β p 2 ;   v n = v α n 2 + v β n 2
The reference currents corresponding to the faulty conditions are discussed in this section. The authors presented the expressions for the reference currents in normal conditions in [13]. For the sake of comparison, the reference current phasor’s magnitude for the negative sequence is selected according to the recommendation of the VDEAR-N 4110. The summary of VDEAR-N 4110 can be found in [7,26], and its corresponding equations are given in (6).
i q p * = k p Δ v p + i q p , p r e * ;   i d p * = f v p , p * i q n * = k n Δ v n ;   i d n * = 0
The subscript ‘pre’ stands for the pre-fault value. The grid codes require a reactive current injection in the negative sequence, but in this scheme, it is distributed between active and reactive current components depending upon the optimum angle. Mathematical expressions for the proposed scheme are presented in (7).
i q p * = k p Δ v p + i q p , p r e * ;   i d p * = f v p , p * i n * = k n Δ v n i q n * = i n * c o s ( θ n ) ;   i d n * = i n * s i n ( θ n )
It is clear from the above expressions that the magnitude of the negative sequence current phasor is selected according to the recommendations of the grid codes, but it is distributed into active and reactive components with the help of the optimum angle, which is estimated by the arrangement given in Figure 9. This scheme is termed optimal angle injection (OAI) in this manuscript.
The grid codes define the range of the k-factors (kp and kn). It ranges from 2 to 6. To achieve the minimum real power fluctuations, a suitable value of k-factors needs to be calculated. As it is discussed in [19] that both the real and reactive power fluctuations cannot be minimized simultaneously in a faulty situation, only the mathematical expressions will be discussed for the minimization of the real power fluctuations. In [27], the authors presented the mathematical expression for the real power in a stationary reference frame that is rewritten in (8).
p = p o + p ˜ p o p ˜ = v α p v α n v β p v β n v α n v α p v β n v β p i * * α p i * * β p i * * α n i * * β n
The first term in the expression of ‘p’ results in a constant value, while the second term causes real power fluctuations (with double the grid frequency). To reduce the real power fluctuations, the second term should be minimized. The detailed expressions are given in (9).
p ˜ = 0     ( v α p i * * α n + v β p i * * β n ) = ( v α n i * * α p + v β n i * * β p ) v α p = v p c o s ( ω t + φ p ) ; v β p = v p s i n ( ω t + φ p ) v α n = v n c o s ( ω t φ n ) ; v β n = v n s i n ( ω t φ n ) i * * α p = i * * p c o s ( ω t + φ p + θ p ) ; i * * β p = i * * p s i n ( ω t + φ p + θ p ) i * * α n = i * * n c o s ( ω t φ n θ n ) ; i * * β n = i * * n s i n ( ω t φ n θ n ) v p i * * n c o s ( 2 ω t + φ p + φ n + θ n ) = v n i * * p c o s ( 2 ω t + φ p + φ n + θ p )
The above expression can be simplified if the angle of the positive sequence current phasor is the same as the negative sequence current phasor. In this case, the cosine terms cancel out, and it results in a simpler expression between the magnitude of positive and negative sequence current phasors, which is given in (10).
v p i * * n = v n i * * p     i * * n = v n i * * p v p
If the same procedure is repeated to minimize the reactive power, the following expression can be derived:
v p i * * n = v n i * * p     i * * n = v n i * * p v p
Hence, from (10) and (11), it is clear that the fluctuations in both real and reactive power cannot be minimized simultaneously. The mathematical expressions for the reference currents corresponding to the minimum real power fluctuations are given in (12).
i q p * = k p Δ v p + i q p , p r e * ;   i d p * = i q p * t a n ( θ ) i n * = k n Δ v n i q n * = i n * c o s ( θ ) ;   i d n * = i n * s i n ( θ )
The active component of the positive sequence current is computed from its reactive component and the negative sequence current phasor’s angle. This is performed to ensure that both the phasors are in line, which is one of the conditions to achieve minimum real power fluctuations and is also important for the current limitation. In (12), if θ is 90°, the grid code recommendations are fulfilled for LVRT conditions along with the minimum real power fluctuations. This scheme is termed the minimum real power fluctuation (MRPF) scheme in the rest of this paper. It will result in zero real power injections in the case of unbalanced faults. If θ is the same as θn, then the minimum UF is achieved along with the minimum real power fluctuations. As the combined scheme provides the benefits of the OAI and MRPF schemes, it is denoted as (OAI&MRPF) in this paper. By using the expressions given In (10) and (12), the expression for the k-factor of a negative sequence can be derived, which corresponds to the minimum real power fluctuations.
k n Δ v n = v n i * * p v p   Δ v n = v n   k n = i * * p v p
In (13), the magnitude of reference positive sequence currents is used after passing through the current limiter block. If the expressions given in (3), (12), and (13) are used, the expression for the k-factor of negative sequence injections can be further simplified, which is given in (14).
k n = i * * p v p x = i max i * * n i * p i * * p = x i * p k n = i max i * * n v p k n = i max i * * n v p i * * n = k n Δ v n k n = i max v p + Δ v n
In this manuscript, reference currents for the positive sequence are computed in a synchronously rotating reference frame, whereas reference currents for the negative sequence are calculated in a stationary reference frame. Only one PLL is used in this scheme. The control gains for PLL are discussed in [28]. The expressions for the negative sequence of current components are discussed in [8] and given in (15).
i * * α β , n = i * * n v n v α n c o s ( θ n ) + v β n s i n ( θ n ) + j v β n c o s ( θ n ) v α n s i n ( θ n )
A detailed layout of the reference current generation schemes is given in Figure 10. The governing equations for the rest of the reference current generation schemes have already been explained.
A combined inner current controller is used, which is a quasi-proportional controller. Its control gains are discussed in [29]. The authors also discussed the true fault detection scheme in [8]. The overall test setup, along with the combined control scheme, is developed in Matlab/Simulink and given in Figure 11.

4. Results and Discussions

In this section, three different reference current generation strategies, i.e., MRPF, OAI, and OAI&MAPF, are compared with the grid code recommendation (GCR). The current limiter scheme works well for all four different reference current generation schemes. The optimal angle injection does not affect the performance of the current limiter, as it just distributes the total negative sequence current magnitude into its components without changing its magnitude. The performance of the current limiter with these strategies can be presented in the form of a numerical example.

4.1. Numerical Example

A line-to-line fault is introduced at the POC on the network, as shown in Figure 11. The measured and calculated quantities discussed in this section are per unit. The corresponding base quantities are given in Section 2. The fault impedance is 2 Ω, and it is purely resistive. It results in |vp| ≈ 0.66 p.u and |vn| ≈ 0.414 p.u. The reference real power is 0.95 p.u, while the reference reactive power is 0. The maximum current capacity of the converter (imax) is 1.2 times its rated current.

4.1.1. GCR Scheme

The reference currents for the GCR are calculated from (6). The k-factors are selected as 2. The active component of current for the positive sequence is also limited to the maximum rating of the converter before passing it to the current limiter; otherwise, its value may be very high in cases of low impedance faults, which can allow a very small reactive current injection in the positive sequence. The reference currents are given below.
|i*qp| ≈ 0.68; |i*dp| ≈ 1.439; |i*qn| ≈ 0.827; |i*dn| ≈ 0
|i*p| ≈ 1.592; |i*n| ≈ 0.827
|i**n| = Minimum (imax, |i*n|) ≈ 0.827
|i**qn| ≈ 0.827; |i**dn| ≈ 0
x ≈ 0.234; |i**qp| ≈ 0.159; |i**dp| ≈ 0.337
|i**p| ≈ 0.373
|i**p| + |i**n| ≈ 1.2

4.1.2. MRPF Scheme

The reference currents corresponding to the minimum real power fluctuations can be computed using the expressions given in (12). The negative sequence injection is purely reactive. To keep real power fluctuations at a minimum, the initial angle of the positive and negative sequence currents is the same. The k-factor for the positive sequence current is chosen as 2, and the k-factor for the negative sequence is calculated using (14) to correspond to the minimum real power fluctuations. This scheme results in |vp| ≈ 0.695 p.u and |vn| ≈ 0.462 p.u. The reference currents and corresponding limits are given below.
|i*qp| ≈ 0.61; |i*dp| ≈ 0; |i*p| ≈ 0.61
kn ≈ 1.037; |i*n| ≈ 0.479; |i*qn| ≈ 0.479; |i*dn| ≈ 0
|i**n| = Minimum (imax, |i*n|) ≈ 0.479
|i**qn| ≈ 0.479; |i**dn| ≈ 0
x ≈ 1.182; |i**qp| ≈ 0.721; |i**dp| ≈ 0
|i**p| ≈ 0.721
|i**p| + |i**n| ≈ 1.2

4.1.3. OAI Scheme

The reference currents corresponding to the optimal angle injection can be computed from the expressions given in (7). The negative sequence current is not purely reactive but is distributed between its active and reactive components corresponding to the optimal angle, which is estimated by a control scheme presented in Figure 9. The k-factors for the positive and negative sequence injections are chosen as 2. The optimal angle scheme estimates the angle at 131.2°. This scheme results in |vp| ≈ 0.687 p.u and |vn| ≈ 0.414 p.u. The reference currents and corresponding limits are given below.
|i*qp| ≈ 0.627; |i*dp| ≈ 1.384; |i*p| ≈ 1.519
|i*n| ≈ 0.827; |i*qn| ≈ 0.622; |i*dn| ≈ 0.545
|i**n| = Minimum (imax, |i*n|) ≈ 0.827
|i**qn| ≈ 0.622; |i**dn| ≈ 0.545
x ≈ 0.246; |i**qp| ≈ 0.154; |i**dp| ≈ 0.34
|i**p| ≈ 0.373
|i**p| + |i**n| ≈ 1.2

4.1.4. OAI&MRPF Scheme

The reference currents corresponding to the optimal angle injection along with the minimum real power fluctuations can be computed from the expressions given in (12) and (14). The optimum angle is estimated by the control scheme given in Figure 9, and its value is passed on to (12). The value of the k-factor for the positive sequence injection is chosen as 2 here as well. The optimal angle scheme estimates the angle at 141.6°. This scheme results in |vp| ≈ 0.714 p.u and |vn| ≈ 0.464 p.u. The reference currents and corresponding limits are given below.
|i*qp| ≈ 0.572; |i*dp| ≈ 0.722; |i*p| ≈ 0.921
kn ≈ 1.019; |i*n| ≈ 0.473; |i*qn| ≈ 0.294; |i*dn| ≈ 0.371
|i**n| = Minimum (imax, |i*n|) ≈ 0.473
|i**qn| ≈ 0.294; |i**dn| ≈ 0.371
x ≈ 0.789; |i**qp| ≈ 0.451; |i**dp| ≈ 0.57
|i**p| ≈ 0.727
|i**p| + |i**n| ≈ 1.2
It confirms the safe operation of the converter, as the current limit is ensured in each scheme. Moreover, it also shows that the magnitude of the voltage phasors of the positive sequence increases from the MRPF scheme to the combined scheme, while the magnitude of the voltage phasors for the negative sequence decreases. This confirms a better UF. The further comparison will be performed in time-domain simulations.

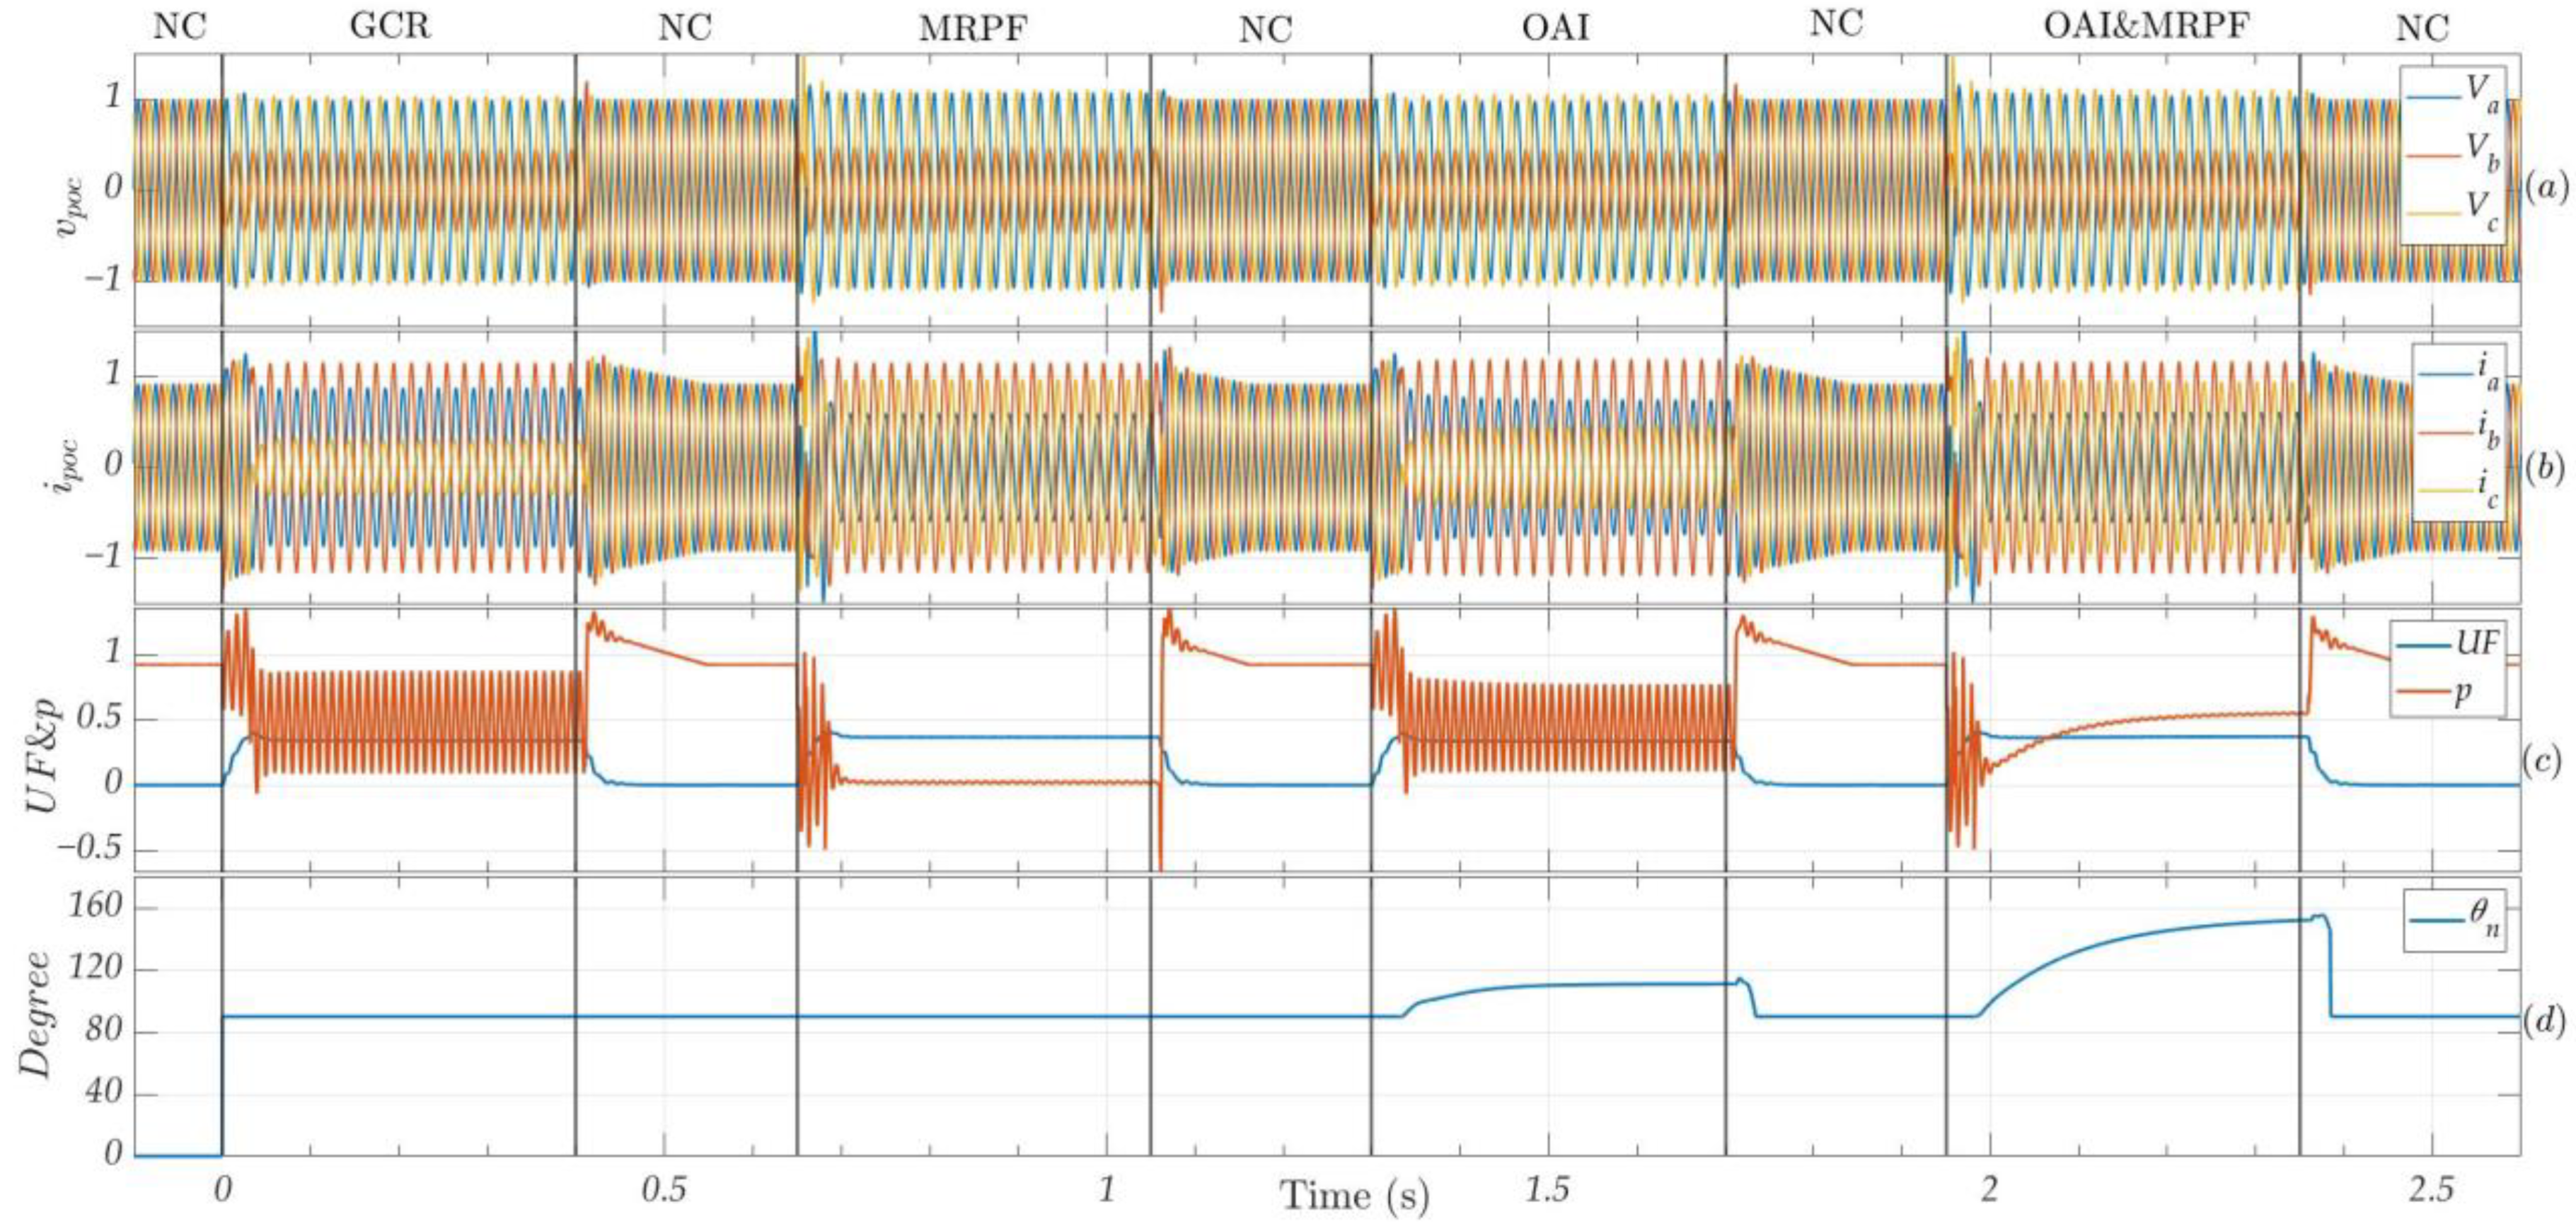
4.2. Simulation Results

The four schemes discussed in the numerical example are tested consecutively on the test setup. Different types of faults are applied to test the performance of the proposed control scheme. The first fault occurs after achieving the steady state for the pre-fault condition. The faults are repeated with a period of 0.65 s and a fault duration of 0.4 s. There is a post-fault duration of 0.25 s in which the control scheme settles to its pre-fault steady state condition.
In the first fault event, the reference currents for the positive and negative sequence injections are generated according to the GCR scheme with k-factors equal to 2. In the second fault event, the MRPF scheme, with a k-factor for the positive sequence equal to 2, is activated. In the third fault event, the reference currents are calculated based on the OAI scheme. This scheme also considers both k-factors equal to 2. In the last fault event, the combined scheme of optimum angle injection along with minimum real power fluctuations (OAI&MRPF) is activated. This scheme also considers the k-factor for the positive sequence injection as 2.
For these simulations, the reference real power is 0.95 p.u, while the reference reactive power is zero. Similarly, the maximum current capacity of the converter is 1.2 times its rated current, and the fault impedance is 2 Ω. Moreover, the active current component of the positive sequence is rate-limited for normal conditions; thus, it does not allow a sudden change in its reference value.

4.2.1. Single Line to Ground Fault

A single line to ground (SLG) fault is repeatedly introduced at the POC on phase ‘b’. The responses of the four different schemes are given in Figure 12. The subplot (a) presents the phase-to-ground voltages at the POC. The converter’s line currents are shown in subplot (b). The UF and real power are plotted in subplot (c), and, finally, the negative sequence current injection angle is plotted in subplot (d). All the quantities are plotted in p.u except for subplot (d), which is in degrees. The ‘NC’ stands for normal operating conditions. When an unbalanced fault occurs, the scheme does not inject the negative sequence current immediately but waits for a definite period to let the sequence extraction settle down, so for one initial cycle, the balanced three-phase currents are fed to the fault.
Subplot (a) shows that the voltage of faulty phase(s) is higher with the OAI scheme compared to the GCR scheme and results in more uniform voltage among the phases compared to the GCR scheme, which is also evident with the help of UF. As the MRPF scheme results in lower kn compared to the GCR scheme, it causes a small increase in the healthy phase(s) voltage. Subplot (b) confirms the working of the current limiting scheme, as no phase current exceeds the maximum current capacity of the converter. Moreover, it also shows that the maximum current is fed to the faulty phase in all four schemes, which is one of the requirements for selective fault detection and improving the UF.
From subplot (c), it is clear that the real power fluctuations in the case of the GCR scheme and the OAI scheme are quite high compared to the MRPF and combined scheme. Among all the control strategies, the OAI&MRPF scheme offers non-zero real power with minimum fluctuations. Moreover, the UF’s graph confirms that the OAI scheme offers a lower UF compared to the GCR scheme. As the k-factor also affects the UF, it is fair to compare the GCR scheme with the OAI scheme to determine the performance of the OAI, and it is clear that it offers a lower UF. The subplot (d) shows that the optimum angle is different from GCR, and it deviates more with the low kn.

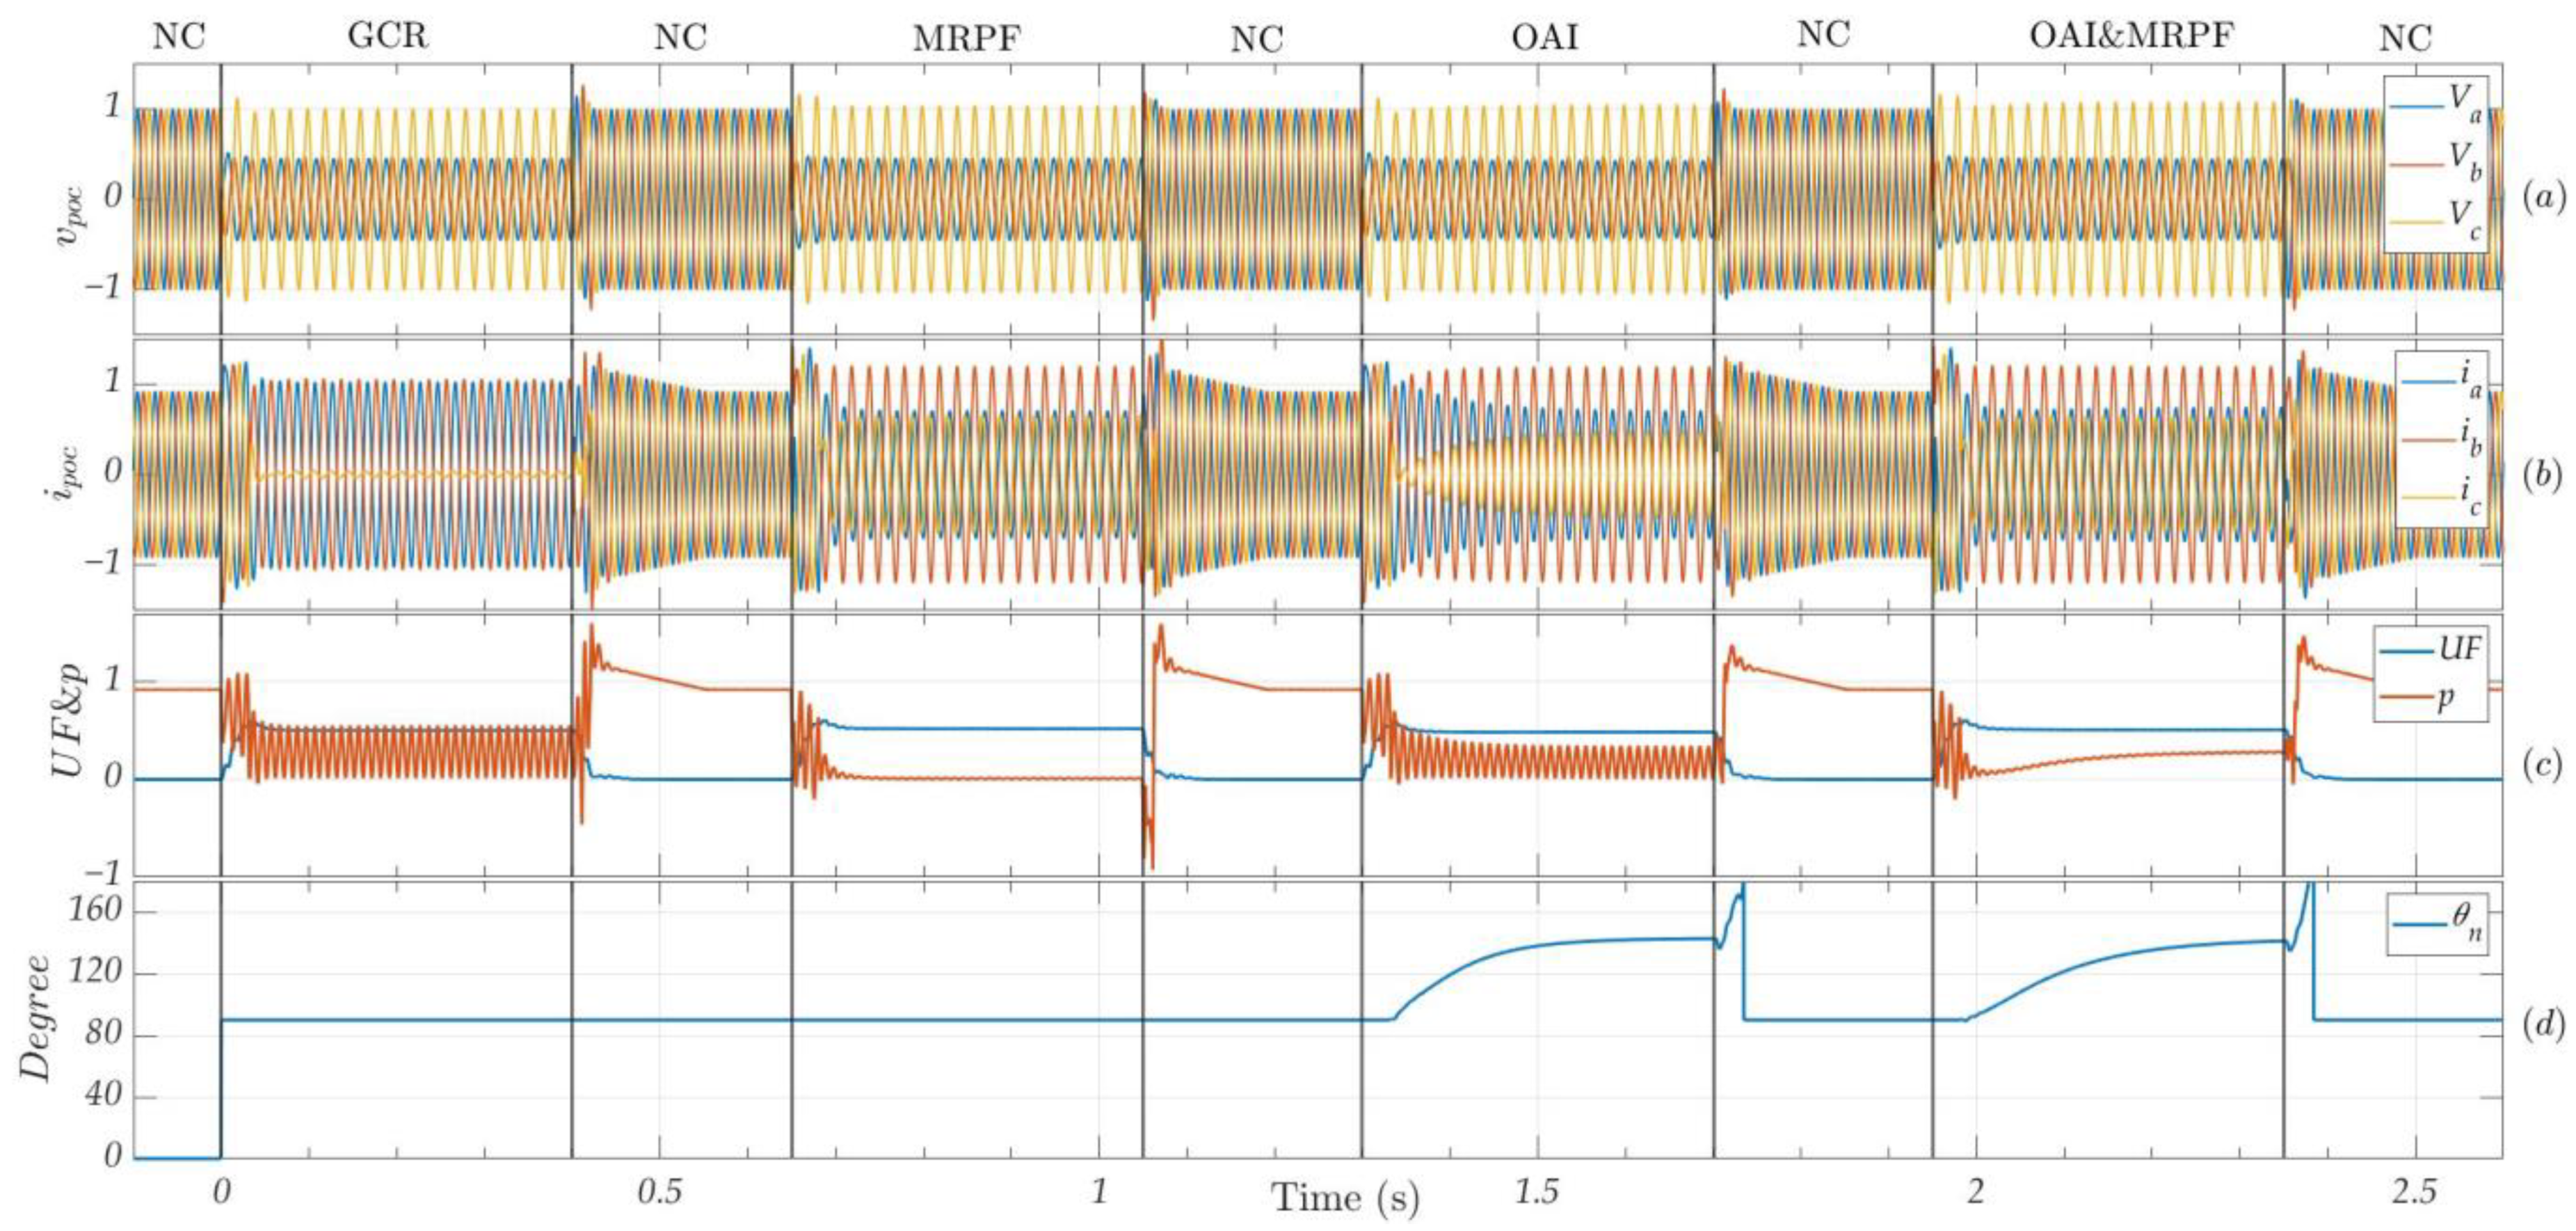
4.2.2. Line-to-Line Fault

A line-to-line (L-L) fault is applied between phases ‘b’ and ‘c’ repeatedly at the POC, and the response of the different control schemes is given in Figure 13. From subplot (a), it is clear that the healthy phase(s) voltage is higher in the case of MRPF, followed by OAI&MRPF. The reason for this is the lower kn with the MRPF scheme, which allows more currents in the positive sequence. Similarly, the OAI provides more voltage in the faulty phase(s) compared to the GCR and causes lower UF than the GCR scheme. Due to the optimal angle injection, the combined scheme also provides a better voltage profile as compared to the MRPF scheme.
Subplot (b) shows that phase currents do not exceed the current rating of the converter for any control strategy, which confirms the safe operation of the converter. From subplot (b), it is also clear that the selective voltage support among the faulty phases is better with the combined scheme compared to the GCR.
Subplot (c) shows that the real power fluctuations are suppressed with the MRPF scheme. Moreover, instantaneous real power is negative for the GCR scheme, which requires a dc chopper for the safety of the dc link, and it also has a negative impact on the frequency stability. Moreover, the combined scheme offers a non-zero constant real power injection in such conditions. Its value depends on the optimum angle corresponding to the minimum UF. Moreover, the UF is minimal with the OAI strategy as compared to the GCR. Similarly, if MRPF and OAI&MRPF are compared, the latter scheme provides lower UF. Subplot (d) confirms that the optimum angle corresponding to the minimum UF is different than that of GCR, and it is also dependent on the kn.

4.2.3. Double Line to Ground Fault

Phases ‘a’ and ‘b’ are grounded to introduce a double line to ground (DLG) fault at the POC. The response of the different control schemes for the DLG fault is shown in Figure 14. Subplot (a) confirms the better voltage profile with the OAI scheme compared to the GCR. This effect is dominant in weak grids. Subplot (b) shows that the maximum phase current in GCR is less than the maximum allowed limit. This is because the initial angles of the sequence current phasors are not the same, due to which it is unable to utilize the converter’s current capacity effectively. Moreover, like previous faults, there is more current in the faulty phase(s), and the distribution among the faulty phases is dependent on the particular control strategy.
Subplot (c) confirms the minimum real power fluctuations with the MRPF scheme compared to the GCR. Similarly, it also confirms the low UF with the OAI scheme compared to the GCR. The combined scheme provides non-zero constant real power with an acceptable UF. The UF in this case is a bit higher compared to GCR due to the fact that a lower value of kn results in a higher UF and minimum real power fluctuations result in a lower kn. Subplot (d) presents the angle of the negative sequence current, which shows that the angle corresponding to the minimum UF is different than that of GCR.
Table 3 provides a quantitative comparison of the above-discussed control schemes for the different types of faults. The key indicators for these comparisons are the UF, real power fluctuations’ amplitude, and peak current in the faulty phase(s). Different colors are used to rank the performance of these schemes against a particular indicator. The green color represents the best performance, followed by the light green, orange, and red color, respectively. Additionally, the numeric summation of the positive and negative sequence currents is performed to verify the current limiter performance. The percentage reduction in UF and real power fluctuations are computed with respect to the GCR scheme.
For the SLG fault, it is clear from Table 3 that the OAI scheme results in a minimum UF compared to the GCR. It is important to mention here that normally the higher kn value results in a lower UF, but the kn corresponding to the minimum real power fluctuations has a lower value. This is the reason why the UF is higher with OAI&MRPF compared to GCR. Furthermore, it is also clear that the OAI results in smaller real power fluctuations compared to the GCR scheme, and the combined scheme results in minimum real power fluctuations among all the schemes. As far as the better utilization for the converter’s current rating is concerned, the OAI and OAI&MRPF schemes inject maximum current in the faulty phase compared to the other schemes. The numeric summation of the positive and negative sequence current phasors’ magnitudes confirms the safer operation of the converter, as the sum is limited to the converter’s current rating.
For the L-L fault, the OAI scheme results in a minimum UF compared to the GCR scheme. The minimum real power fluctuations are caused by OAI&MRPF, followed by MRPF, OAI, and GCR, respectively. In such faulty conditions, the maximum phase current is caused by MRPF, followed by OAI&MRPF, OAI, and GCR, respectively. One reason for this is that the MRPF and combined scheme ensure the same initial angle for the positive and negative sequence current phasors, which is also assumed in the current limiting strategy. As far as the performance of the current limiter scheme is concerned, it works fine with all four reference current generation strategies. For the DLG fault, the ranking of the control schemes is the same as in the case of the L-L fault for the minimum UF and minimum real power fluctuations. The difference between the performance of the MRPF and OAI&MRPF is further reduced against the maximum faulty phase current.
If the performance of the OAI scheme is compared with the GCR scheme against all types of faults, it is clear that it provides better results than GCR as far as minimum UF, minimum real power fluctuations, and maximum current in faulty phase(s) are concerned. There is a higher percentage reduction in the UF for the severe unbalanced faults that occur, i.e., L-L, DLG, and SLG, respectively. However, a higher reduction in real power fluctuations is observed for the DLG fault, followed by the SLG and L-L faults, respectively. Similarly, the MRPF scheme provides a huge reduction in real power fluctuations compared to the GCR against all types of faults. As the OAI also causes a reduction in real power fluctuations, the combined control scheme provides even more reduction in real power fluctuations when compared to the response of the GCR scheme against all types of faults.
From the grid’s perspective, the uniform voltage among phases is a key parameter that is improved by using the OAI scheme. From the converter’s perspective, the higher real power fluctuations can cause a higher rating of the dc chopper and more protection for the dc link, which can be minimized using the MRPF scheme. In order to achieve a better UF with minimum real power fluctuations, the OAI&MRPF scheme can be implemented.

5. Conclusions

In this manuscript, the optimum angle for the negative sequence current injection corresponding to the minimum unbalanced factor is estimated. The estimation strategy works fine for different types of faults. Furthermore, the expression for the k-factor of the negative sequence current is derived, which corresponds to the minimum real power fluctuations. A current limiter scheme is presented, which ensures the safe operation of the converter under unbalanced faults with any of the discussed reference current generation schemes. Some comparisons of these schemes are also presented to discuss the performance of these schemes under different faulty conditions.
The results show that the optimum angle injection for the negative sequence results in a better UF compared to the grid code recommendations. The percentage reduction in UF is higher for more severe faults. The effect of OAI will be dominant in future grids with higher penetration of renewable energy sources and lower short-circuit power. Moreover, the results confirm the minimum real power fluctuations with a combined scheme followed by the MRPF scheme, which can reduce the dc link protection cost. The current limiting strategy confirms the safe operation of the converter under different fault conditions.
The limitations of the proposed scheme are given below.
  • The angle between the positive and negative sequence voltage phasors is used for the estimation of the optimal angle for the negative sequence current injection. The angle between the positive and negative sequence voltage phasors is dependent on the sequence extraction scheme and may cause inaccuracy due to the extraction scheme.
  • Similarly, if the fault type changes during a fault, it can cause the wrong angle estimation for the negative sequence current injection.
Future works must study the impact of the OAI&MRPF scheme on fault detection schemes, which use negative sequence currents for this purpose. This also involves modifying the estimation scheme for the optimum negative sequence angle to work well if the fault type changes during a fault.

Author Contributions

Conceptualization, M.A. and H.R.; Methodology, M.A.; Software, M.A.; Validation, M.A., H.R. and R.S.; Formal Analysis, M.A. and H.R.; Investigation, M.A. and H.R.; Resources, R.S.; Data Curation, M.A.; Writing—Original Draft Preparation, M.A.; Writing—Review and Editing, M.A., H.R. and R.S.; Visualization, M.A.; Supervision, H.R.; Project Administration, H.R. and R.S.; Funding Acquisition, H.R. and R.S. All authors have read and agreed to the published version of the manuscript.

Funding

This research was funded by the “Higher Education Commission, Pakistan” and “Agency for Education, and Internationalization (OeAD), Austria” under the program “OSS-III/HEC Overseas Scholarships for PhD in Selected Fields, Phase III, Batch 1”.

Data Availability Statement

The data presented in this study are available on request from the corresponding author.

Acknowledgments

Supported by TU Graz Open Access Publishing Fund. Open Access Funding by the Graz University of Technology.

Conflicts of Interest

The authors declare no conflict of interest.

Nomenclature

SymbolDescription
vdcDC link voltage
vgGrid’s voltage phasor
LgGrid’s inductance
RgGrid’s resistance
CfFilter’s capacitance
LfFilter’s inductance
kp,nk-factor for the positive and negative sequence currents
imaxMaximum converter’s current
p*Reference real power
q*Reference reactive power
vpocThree-phase voltage at point of connection (POC)
vαβMeasured voltage components in stationary reference frame
vαβ,pPositive sequence voltage components in stationary reference frame
ωpAngular frequency for the positive sequence voltage
vdq,pPositive sequence voltage components in rotating reference frame
vαβ,nNegative sequence voltage components in stationary reference frame
|vp| Positive sequence voltage phasor’s magnitude
|vn| Negative sequence voltage phasor’s magnitude
φp,nInitial angle of the corresponding voltage phasors
vp,nAngle between positive and negative sequence voltage phasors
iabcConverter’s line currents
iαβMeasured current components in stationary reference frame
|∆iqp| Change in magnitude of reactive current injection for positive sequence
|∆iqn| Change in magnitude of reactive current injection for negative sequence
i*dq,pPositive sequence reference current components in rotating reference frame
|i*p| Magnitude of the reference positive sequence current phasor
i*αβ,nNegative sequence reference current components in stationary reference frame
i*dq,nNegative sequence reference current components in rotating reference frame
|i*n| Magnitude of the reference negative sequence current phasor
θp,nInitial angle of the corresponding current phasors
xPositive sequence current multiplier to ensure current limit
i**dq,pReference positive sequence current components in rotating reference frame after applying current limit
|i**p| Magnitude of the reference positive sequence current phasor after applying current limit
i**dq,nReference negative sequence current components in rotating reference frame after applying current limit
|i**n| Magnitude of the reference negative sequence current phasor after applying current limit
i**αβReference current components in stationary reference frame after current limiter
v*αβReference voltage components in stationary reference frame
v*abcConverter’s reference phase voltage
oFundamental angular frequency for second-order generalized integrator
X/RReactance to resistance ratio

References

  1. REN21. Renewables 2023 Global Status Report; REN21 Secretariat: Paris, France, 2023; Available online: https://www.ren21.net/wp-content/uploads/2019/05/GSR-2023_Energy-Supply-Module.pdf (accessed on 30 October 2023).
  2. IEA. Renewables 2022; IEA: Paris, France, 2022; Available online: https://www.iea.org/reports/renewables-2022 (accessed on 30 October 2023).
  3. Yamashita, K.; Renner, H.; Martinez Villanueva, S.; Vennemann, K.; Martins, J.; Aristidou, P.; Van Cutsem, T.; Song, Z.; Lammert, G.; Pabon Ospina, L.; et al. Modelling of Inverter-Based Generation for Power System Dynamic Studies; CIGRE: Paris, France, 2018. [Google Scholar]
  4. Martín-Martínez, S.; Gómez-Lázaro, E.; Molina-Garcia, A.; Vigueras-Rodriguez, A.; Milligan, M.; Muljadi, E. Participation of wind power plants in the Spanish power system during events. In Proceedings of the IEEE Power and Energy Society General Meeting, San Diego, CA, USA, 22–26 July 2012; pp. 1–8. [Google Scholar]
  5. Bollen, M.H.J.; IEEE Industry Applications Society; IEEE Power Electronics Society; IEEE Power Engineering Society. Understanding Power Quality Problems: Voltage Sags and Interruptions; IEEE Press: New York, NY, USA, 2000. [Google Scholar]
  6. Abubakar, M.; Akbari, H.; Renner, H. Development of reference current calculation scheme for grid-side converter during unbalanced faults. In Proceedings of the Second International Conference on Sustainable Mobility Applications, Renewables and Technology (SMART), Cassino, Italy, 23–25 November 2022; pp. 1–9. [Google Scholar]
  7. VDE-AR-N 4110; Technical Requirements for the Connection and Operation of Customer Installations to the Medium-Voltage Network. VDE: Frankfurt, Germany, 2018.
  8. Abubakar, M.; Hackl, P.; Renner, H.; Schürhuber, R. Investigation of Optimal Share of Active and Reactive Current Injection in Negative Sequence in Case of Unbalanced Faults in Grid Following Converter. In Proceedings of the Cigre B4 Colloquium 2023, Vienna, Austria, 12–14 September 2023. [Google Scholar]
  9. Aboelsaud, R.; Ibrahim, A.; Garganeev, A. Review of three-phase inverters control for unbalanced load compensation. Int. J. Power Electron. Drive Syst. (IJPEDS) 2019, 10, 242. [Google Scholar] [CrossRef]
  10. Azevedo, G.; Rocabert Delgado, J.; Cavalcanti, M.; Neves, F.; Rodriguez, P. A Negative-sequence Current Injection Method to Mitigate Voltage Imbalances in Microgrids. Eletrônica Potência 2011, 16, 296–303. [Google Scholar] [CrossRef]
  11. Villén, M.T.; Comech, M.P.; Martinez Carrasco, E.; Prada Hurtado, A.A. Influence of Negative Sequence Injection Strategies on Faulted Phase Selector Performance. Energies 2022, 15, 6018. [Google Scholar] [CrossRef]
  12. Li, X.; Wang, Z.; Zhu, L.; Guo, L.; Wang, C. Analytical Dual-Sequence Current Injections Feasible Region of Weak-Grid Connected VSC Under Asymmetric Grid Faults. IEEE Trans. Power Syst. 2022, 38, 5546–5559. [Google Scholar] [CrossRef]
  13. Abubakar, M.; Renner, H.; Schürhuber, R. Development of a Novel Control Scheme for Grid-Following Converter under Asymmetrical Faults. Energies 2023, 16, 1276. [Google Scholar] [CrossRef]
  14. Shabestary, M.M.; Mohamed, Y.A.R.I. Asymmetrical Ride-Through and Grid Support in Converter-Interfaced DG Units under Unbalanced Conditions. IEEE Trans. Ind. Electron. 2019, 66, 1130–1141. [Google Scholar] [CrossRef]
  15. Almeida, V.A.F.; Taranto, G.N.; Marinho, J.M.T. Phasor-domain Dynamic Model of Asymmetric Current Injection Controller for Converter-interfaced Generator. J. Mod. Power Syst. Clean Energy 2021, 9, 1269–1278. [Google Scholar] [CrossRef]
  16. Camacho, A.; Castilla, M.; Miret, J.; Velasco, M.; Guzman, R. Positive-Sequence Voltage Control, Full Negative-Sequence Cancellation, and Current Limitation for Static Compensators. IEEE J. Emerg. Sel. Top. Power Electron. 2021, 9, 6613–6623. [Google Scholar] [CrossRef]
  17. Jundi, J.; Guangya, Y.; Nielsen, A.H. Investigation of grid-connected voltage source converter performance under unbalanced faults. In Proceedings of the IEEE PES Asia-Pacific Power and Energy Engineering Conference (APPEEC), Xi’an, China, 25–28 October 2016; pp. 609–613. [Google Scholar]
  18. Wang, H.; Liu, Y.; Watson, N.R. Enhanced grid-tie converter control under unbalanced conditions with no PLL. In Proceedings of the 7th IEEE Workshop on the Electronic Grid (eGRID), Auckland, New Zealand, 29 November–2 December 2022; pp. 1–5. [Google Scholar]
  19. Wang, L.; Xu, Z.; Xiangyang, X.; Zhang, Y.; Zhou, K.; Tan, L.; Tan, X.; Wu, C.; Jiang, D. Research on ride-through control of power conversion system in energy storage converter under unbalanced grid voltage fault condition. In Proceedings of the China International Conference on Electricity Distribution (CICED), Changsha, China, 7–8 September 2022; pp. 925–929. [Google Scholar]
  20. Pal, S.; Mishra, M.; Verma, A.; Kasari, P.R.; Das, B.; Chakraborti, A. Control of grid connected converters under unbalanced grid faults. In Proceedings of the IEEE International Conference on Power Electronics, Drives and Energy Systems (PEDES), Chennai, India, 18–21 December 2018; pp. 1–6. [Google Scholar]
  21. Meligy, A.; Qoria, T.; Colak, I. Assessment of Sequence Extraction MethodsApplied to MMC-SDBC STATCOM Under Distorted Grid Conditions. IEEE Trans. Power Deliv. 2022, 37, 4923–4932. [Google Scholar] [CrossRef]
  22. Du, L.; Xiong, L.; Li, M.; Tang, Z.; Xiu, L.; Ma, X. Fast positive sequence component detection schemes based on delay operational period filter. CSEE J. Power Energy Syst. 2020, 9, 235–243. [Google Scholar] [CrossRef]
  23. Hamed, H.A.; Abdou, A.F.; Bayoumi, E.; El-Kholy, E.E. Effective design and implementation of GSS-PLL under voltage dip and phase interruption. IET Power Electron. 2018, 11, 1018–1028. [Google Scholar] [CrossRef]
  24. Pinto, J.; Carvalho, A.; Rocha, A.; Araújo, A. Comparison of DSOGI-Based PLL for Phase Estimation in Three-Phase Weak Grids. Electricity 2021, 2, 244–270. [Google Scholar] [CrossRef]
  25. Svensson, J.; Bongiorno, M.; Sannino, A. Practical Implementation of Delayed Signal Cancellation Method for Phase-Sequence Separation. IEEE Trans. Power Deliv. 2007, 22, 18–26. [Google Scholar] [CrossRef]
  26. Technical Connection Rules for Medium-Voltage (VDE-AR-N 4110). Available online: https://www.vde.com/en/fnn/topics/technical-connection-rules/tcr-for-medium-voltage (accessed on 9 October 2023).
  27. Gao, S.; Zhao, H.; Gui, Y. Dual grid voltage modulated direct power control of grid-connected voltage source converter under unbalanced network condition. In Proceedings of the IEEE Innovative Smart Grid Technologies—Asia (ISGT Asia), Chengdu, China, 21–24 May 2019; pp. 2167–2172. [Google Scholar]
  28. Li, X.; Lin, H. A Design Method of Phase-Locked Loop for Grid-Connected Converters Considering the Influence of Current Loops in Weak Grid. IEEE J. Emerg. Sel. Top. Power Electron. 2020, 8, 2420–2429. [Google Scholar] [CrossRef]
  29. Nowak, M.; Binkowski, T.; Piróg, S. Proportional-Resonant Controller Structure with Finite Gain for Three-Phase Grid-Tied Converters. Energies 2021, 14, 6726. [Google Scholar] [CrossRef]
Figure 1. LVRT capability curve.
Energies 16 07511 g001
Figure 2. Vector representation of unbalanced system and its positive and negative sequence systems.
Energies 16 07511 g002
Figure 3. VDEAR-N 4110 requirement under asymmetrical faults.
Energies 16 07511 g003
Figure 4. Layout of test setup, superscript ‘*’ indicates reference quantities.
Energies 16 07511 g004
Figure 5. Layout of control scheme to provide selective voltage support.
Energies 16 07511 g005
Figure 6. Layout of SOGI.
Energies 16 07511 g006
Figure 7. Layout for current limiter.
Energies 16 07511 g007
Figure 8. Estimation of optimal angle for negative sequence current injection.
Energies 16 07511 g008
Figure 9. Control layout for estimating the optimum angle for negative sequence current injection.
Energies 16 07511 g009
Figure 10. Detailed layout of reference current generation block.
Energies 16 07511 g010
Figure 11. Test setup along with OAI&MRPF control scheme in Simulink.
Energies 16 07511 g011
Figure 12. Response of different control strategies for SLG fault (a) phase to ground voltage at POC, (b) converter’s line currents, (c) UF and real power output, and (d) negative sequence current angle.
Energies 16 07511 g012
Figure 13. Response of different control strategies for L-L fault (a) phase to ground voltage at POC, (b) converter’s line currents, (c) UF and real power output, and (d) negative sequence current angle.
Energies 16 07511 g013
Figure 14. Response of different control strategies for DLG fault (a) phase to ground voltage at POC, (b) converter’s line currents, (c) UF and real power output, and (d) negative sequence current angle.
Energies 16 07511 g014
Table 1. Test setup parameters.
Grid’s Parameters
Voltage (L-L)FrequencyShort Circuit PowerX/R
20 kV50 Hz100 MVA10
Filter’s Parameters
Inductance (Lf)Capacitance (Cf)
4.2 µH17.9 mF
Transformer’s Parameters
TypeRated FrequencyVoltageRated PowerReactanceResistance
Dy1150 Hz20 k/400 V25 MVA0.015 p.u1.2 × 10−3 p.u
Converter’s Parameters
Rated Voltage (L-L)DC link voltage (vdc)Rated Power
400 V800 V12 MVA
Table 2. Relation between optimal angle and angle between positive and negative sequence voltage phasors; ‘A’,’B’,’C’ stands for each phase and ‘G’ for ground.
(X/R)fFault Type(∡vp,n)preUFminθn(∡vp,n)min
(Deg)(%)(Deg)(Deg)
0 (pure resistive)AB78.160.313576.8
BC−41.3−43.2
CA−161.5−163.2
ABG7048.613566.71
BCG−50.7−53.3
CAG−176.3−173.3
AG143.633.6110144
BG22.5324
CG−96.4−96
1AB98.349.211599
BC−19−21
CA−141.3−141
ABG95.539.811594.9
BCG−22.4−25.1
CAG−145.4−145.1
AG159.626.8100161.5
BG39.641.5
CG−79.8−78.5
5AB113.746.795115.1
BC−6.6−4.9
CA−126.3−124.9
ABG113.837.895114.6
BCG−7.4−5.4
CAG−127−125.4
AG173.425.395175.7
BG53.655.7
CG−66.5−64.3
pure inductiveAB119.246.890120.8
BC−1.50.8
CA−120.9−119.2
ABG120.137.990121.4
BCG−1.11.4
CAG−120.8−118.6
AG17825.490180
BG58.460
CG−62−60
Table 3. Comparison of the control schemes.
Fault TypeParameterGCR
MRPF
OAI
OAI&MRPF
UF Reduction with OAI (%)Real Power Fluctuation Reduction with OAI, MRPF and OAI&MRPF (%)
SLGVoltage unbalance factor (%)3436.5833.61371.15[14.32, 97.3, 97.7]
Real power fluctuation amplitude0.7820.0210.670.0182
Peak current in faulty phase(s) (p.u)1.151.151.191.17
Positive sequence current magnitude0.6610.8790.6620.876
Negative sequence current magnitude0.5390.3210.5380.324
Numeric sum of pos. and neg. seq. currents1.21.21.21.2
L-LVoltage unbalance factor (%)62.7366.5160.2865.013.9[12.03, 97.5, 97.9]
Real power fluctuation amplitude0.9450.0240.83130.02
Peak current in faulty phase(s) (p.u)1.111.191.1421.185
Positive sequence current magnitude0.3720.7210.3720.727
Negative sequence current magnitude0.8280.4790.8280.473
Numeric sum of pos. and neg. seq. currents1.21.21.21.2
DLGVoltage unbalance factor (%)50.2652.1448.5650.913.4[34.2, 96.8, 97]
Real power fluctuation amplitude0.5430.01760.3410.0164
Peak current in faulty phase(s) (p.u)1.061.21.191.2
Positive sequence current magnitude0.6130.7890.6170.795
Negative sequence current magnitude0.5870.4110.5830.405
Numeric sum of pos. and neg. seq. currents1.21.21.21.2
Disclaimer/Publisher’s Note: The statements, opinions and data contained in all publications are solely those of the individual author(s) and contributor(s) and not of MDPI and/or the editor(s). MDPI and/or the editor(s) disclaim responsibility for any injury to people or property resulting from any ideas, methods, instructions or products referred to in the content.

