Abstract
Faults in solar photovoltaic (PV) modules often result from component damage, leading to voltage fluctuations and decreased stability in the power system. In this study, the original voltage signals of different PV modules show little variation. Therefore, a solution that combines symmetrized dot pattern (SDP) and AlexNet for fault detection in PV modules was proposed. This solution investigates three common faults: poor welding, cracking, and bypass diode failure, which can be applied to fault-free modules. First, a high-frequency signal was input into the PV module, and the raw signal was captured using an NI PXI-5105 high-speed data acquisition card. Next, we used SDP to process the signal and create images with specific snowflake-like features. These images were used as a basis for fault diagnosis. Finally, deep-learning algorithms were used to perform status detection on the PV module. This research also used 3200 training samples and 800 test samples (200 for each type) to evaluate a new method for diagnosing faults in PV modules. The results show that the accuracy of the new method reached 99.8%, surpassing traditional convolutional neural networks (CNN) and extension neural networks (ENN), whose accuracies were 99.5% and 91.75%, respectively. Furthermore, this study compares the proposed method with more traditional numerical fault diagnosis methods. SDP effectively extracts fault signals and presents them as images. With AlexNet used for fault identification, the method excels in accuracy, training time, and testing time, thereby enhancing the stability and reliability of future energy systems.
1. Introduction
According to an analysis of solar photovoltaic module faults, poor workmanship is one of the main causes of damage to solar photovoltaic modules and significantly impacts the overall failure rate of solar photovoltaic power systems [1]. A fault in solar photovoltaic modules affects the stability of power generation. Damage can occur during the manufacturing, installation, and transportation processes of solar photovoltaic modules. In addition, incorrect installation methods are also a contributing factor to failures. Therefore, early detection of faults in solar photovoltaic modules can greatly enhance the stability and safety level of the power system.
In many solar PV incident reports, common fault types include poor soldering [2], cracking [3], bypass diode failure [4], partial shading of bypass diodes, and short-circuit faults [5]. Fault diagnosis techniques for photovoltaic modules have been extensively discussed in many sources. These methods can be divided into two main categories: electrical methods and image processing methods. For example, methods such as maximum power point tracking (MPPT), I–V curve analysis, electroluminescence (EL) imaging, photoluminescence (PL) imaging, and infrared thermal imaging have been widely applied [6,7,8,9,10,11]. With the development of machine learning and artificial intelligence, various diagnostic methods for photovoltaic modules have been proposed in recent years. For instance, Chouay et al. proposed an approach based on artificial neural networks (ANN), where data from eight artificial photovoltaic module models were trained and recognized to effectively classify the modules [12]. They also used EL imaging for feature selection and employed a support vector machine (SVM) classifier for fault diagnosis of photovoltaic modules [13]. In addition, Lu et al. presented a diagnostic method based on an ENN and chaos synchronization detection, where three types of photovoltaic modules were artificially constructed. This method features data compression and effective feature selection [14]. In [14], the ENN method is introduced as a technique that uses numerical features for fault identification. This method relies on manually set features and requires human adjustments if the predictions are inaccurate, making the process more time consuming. In contrast, the AlexNet method proposed in this study utilizes images as feature maps for fault detection. This algorithm autonomously evaluates the accuracy of its predictions through its own neural network, ensuring higher accuracy and saving time. Lu et al. also proposed a hybrid algorithm combining chaos synchronization detection and CNN and conducted experimental evaluations using four different photovoltaic module conditions. This approach utilizes chaos synchronization detection to reduce the number of raw measurement data and accurately identifies the fault states of photovoltaic modules using CNN, as the subtle variations in the output signal can be effectively displayed in images [15].
There are also other methods applied to solar PV fault diagnosis. Methods for extracting solar PV arrays can be categorized into machine learning and deep learning. The former typically employs manually selected classification features to classify image pixels, while the latter uses segmentation models for image extraction [16]. Chen et al. proposed a PV panel fault diagnosis method based on an improved ShuffleNet V2 network and infrared images of PV components. Initially, grayscale enhancement and data augmentation were used to improve the quality of the existing dataset. Improved ShuffleNet V2 was subsequently employed for identification, ultimately achieving an accuracy rate of 84.06% [17]. AlexNet, a deep-learning method used in this study, has the advantages of fast testing time and a high fault identification rate, as seen in [18,19,20]. Fan et al. used AlexNet for fault diagnosis of biomimetic robotic fish and found that the maximum recognition accuracy could reach up to 99%, thereby enhancing its practicality [18]. In addition, Sun et al. used AlexNet for fault diagnosis of circuit breaker vibration signals. Their results indicated that the recognition accuracy could reach 99.46% [19]. Mohiuddin et al. focused on fault diagnosis of bearings in rotating machinery. After collecting vibration signals from the bearings, they input these into AlexNet for fault identification. Their results indicated that the recognition accuracy was 97.5%. Even when a signal–noise ratio (SNR) of −10 dB was introduced, the recognition accuracy remained at 96.5% [20]. Therefore, in this study, we combined the advantages of AlexNet with the faulty components of solar PV modules for an innovative fault diagnosis method.
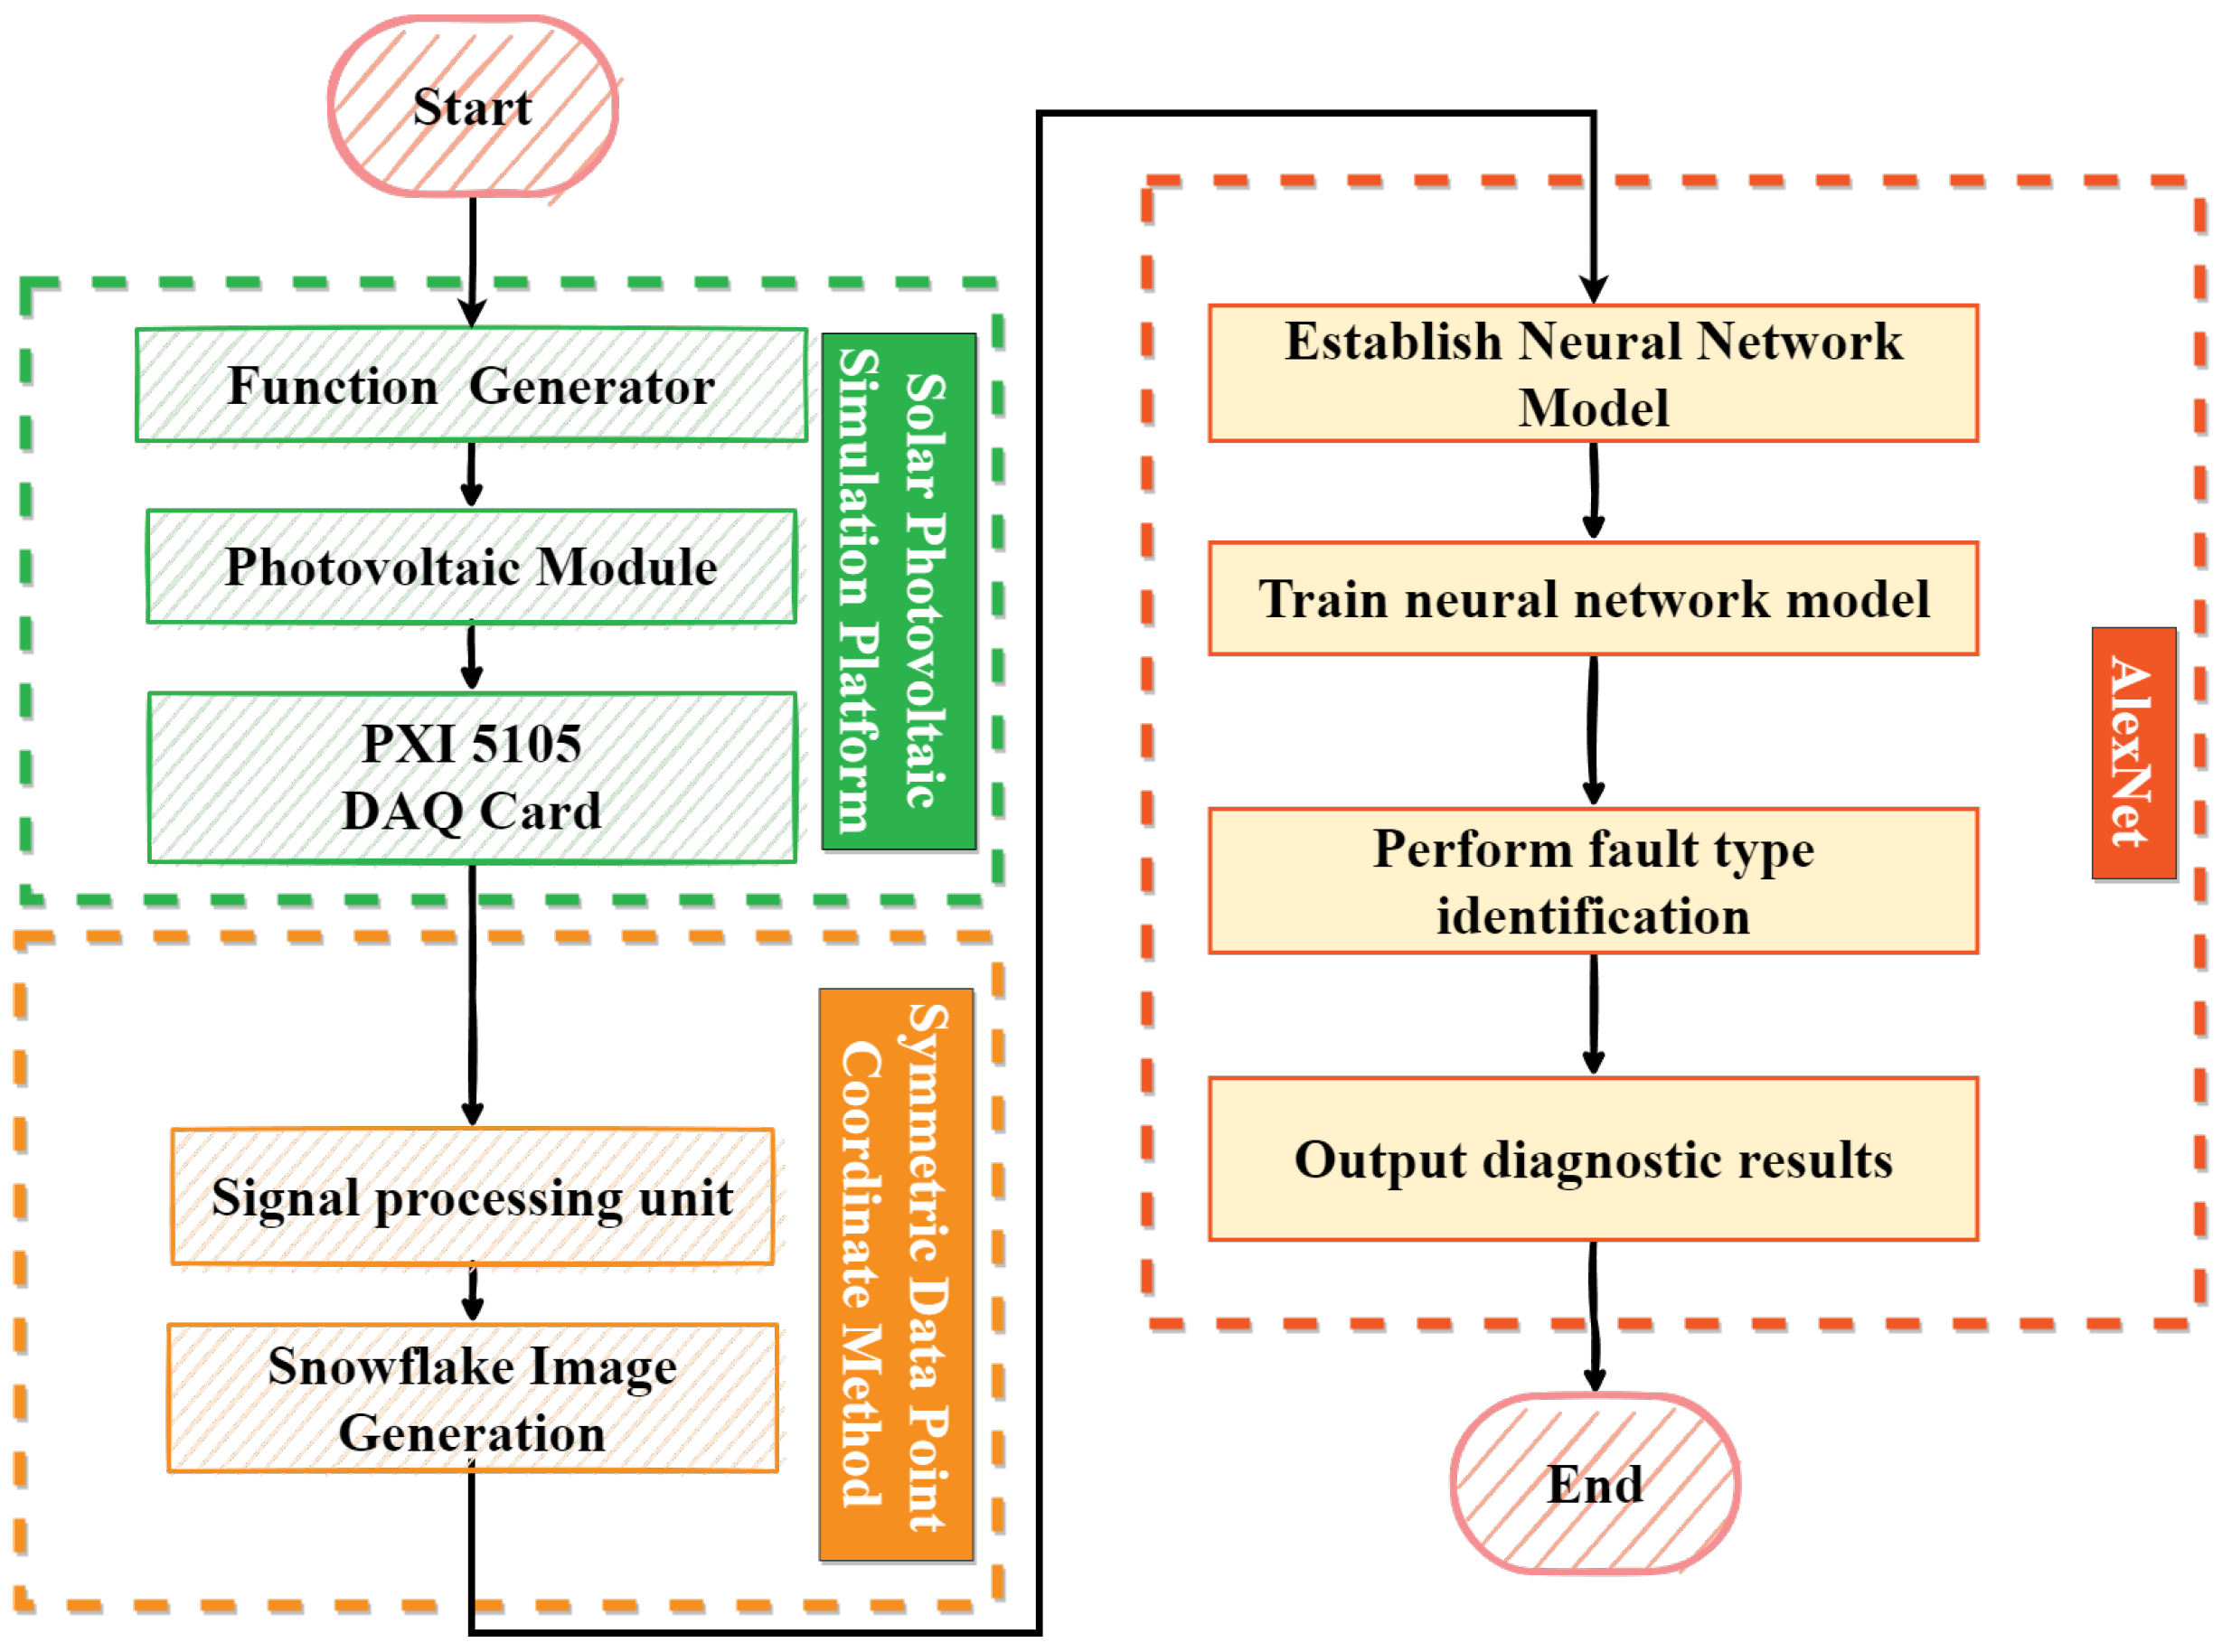
The primary issue addressed in this study is the difficulty of observing voltage variations due to the acquired time–domain waveforms after collecting fault model signals for each type of solar photovoltaic module. Such a mechanism affects the operation of the electrical power system. Hence, we transformed these time–domain waveforms into polar coordinate graphs, where the changes in the graph are clearly visible. Concurrently, the features of these graphs serve as the feature maps for subsequent deep learning. This study integrates the SDP [21] method with AlexNet [22] to identify three types of faults in solar photovoltaic modules. During the identification process, we employed the signals detected by the NI PXI-5105 from the solar photovoltaic modules. The SDP method is utilized as input, and image features are extracted and recognized using AlexNet. Meanwhile, we compared the proposed method with the traditional histogram of oriented gradient (HOG) image feature extraction method and CNN to evaluate the recognition accuracy of the classifier. The research results indicate that this method can effectively identify the types of solar photovoltaic modules and achieve the highest recognition accuracy.
2. Sunlight Photovoltaic Module Platform Testing
The production, transportation, and installation processes of solar photovoltaic modules pose potential risks of installation defects and damages. Thus, in addressing these issues, this study focuses on two specific scenarios for detection: nighttime and situations where the solar photovoltaic system fails to generate electricity. Experimental platforms and fault model establishment were developed for detection in the aforementioned scenarios, as follows:
2.1. Establishment of Solar Photovoltaic Module Experimental Platform Translation
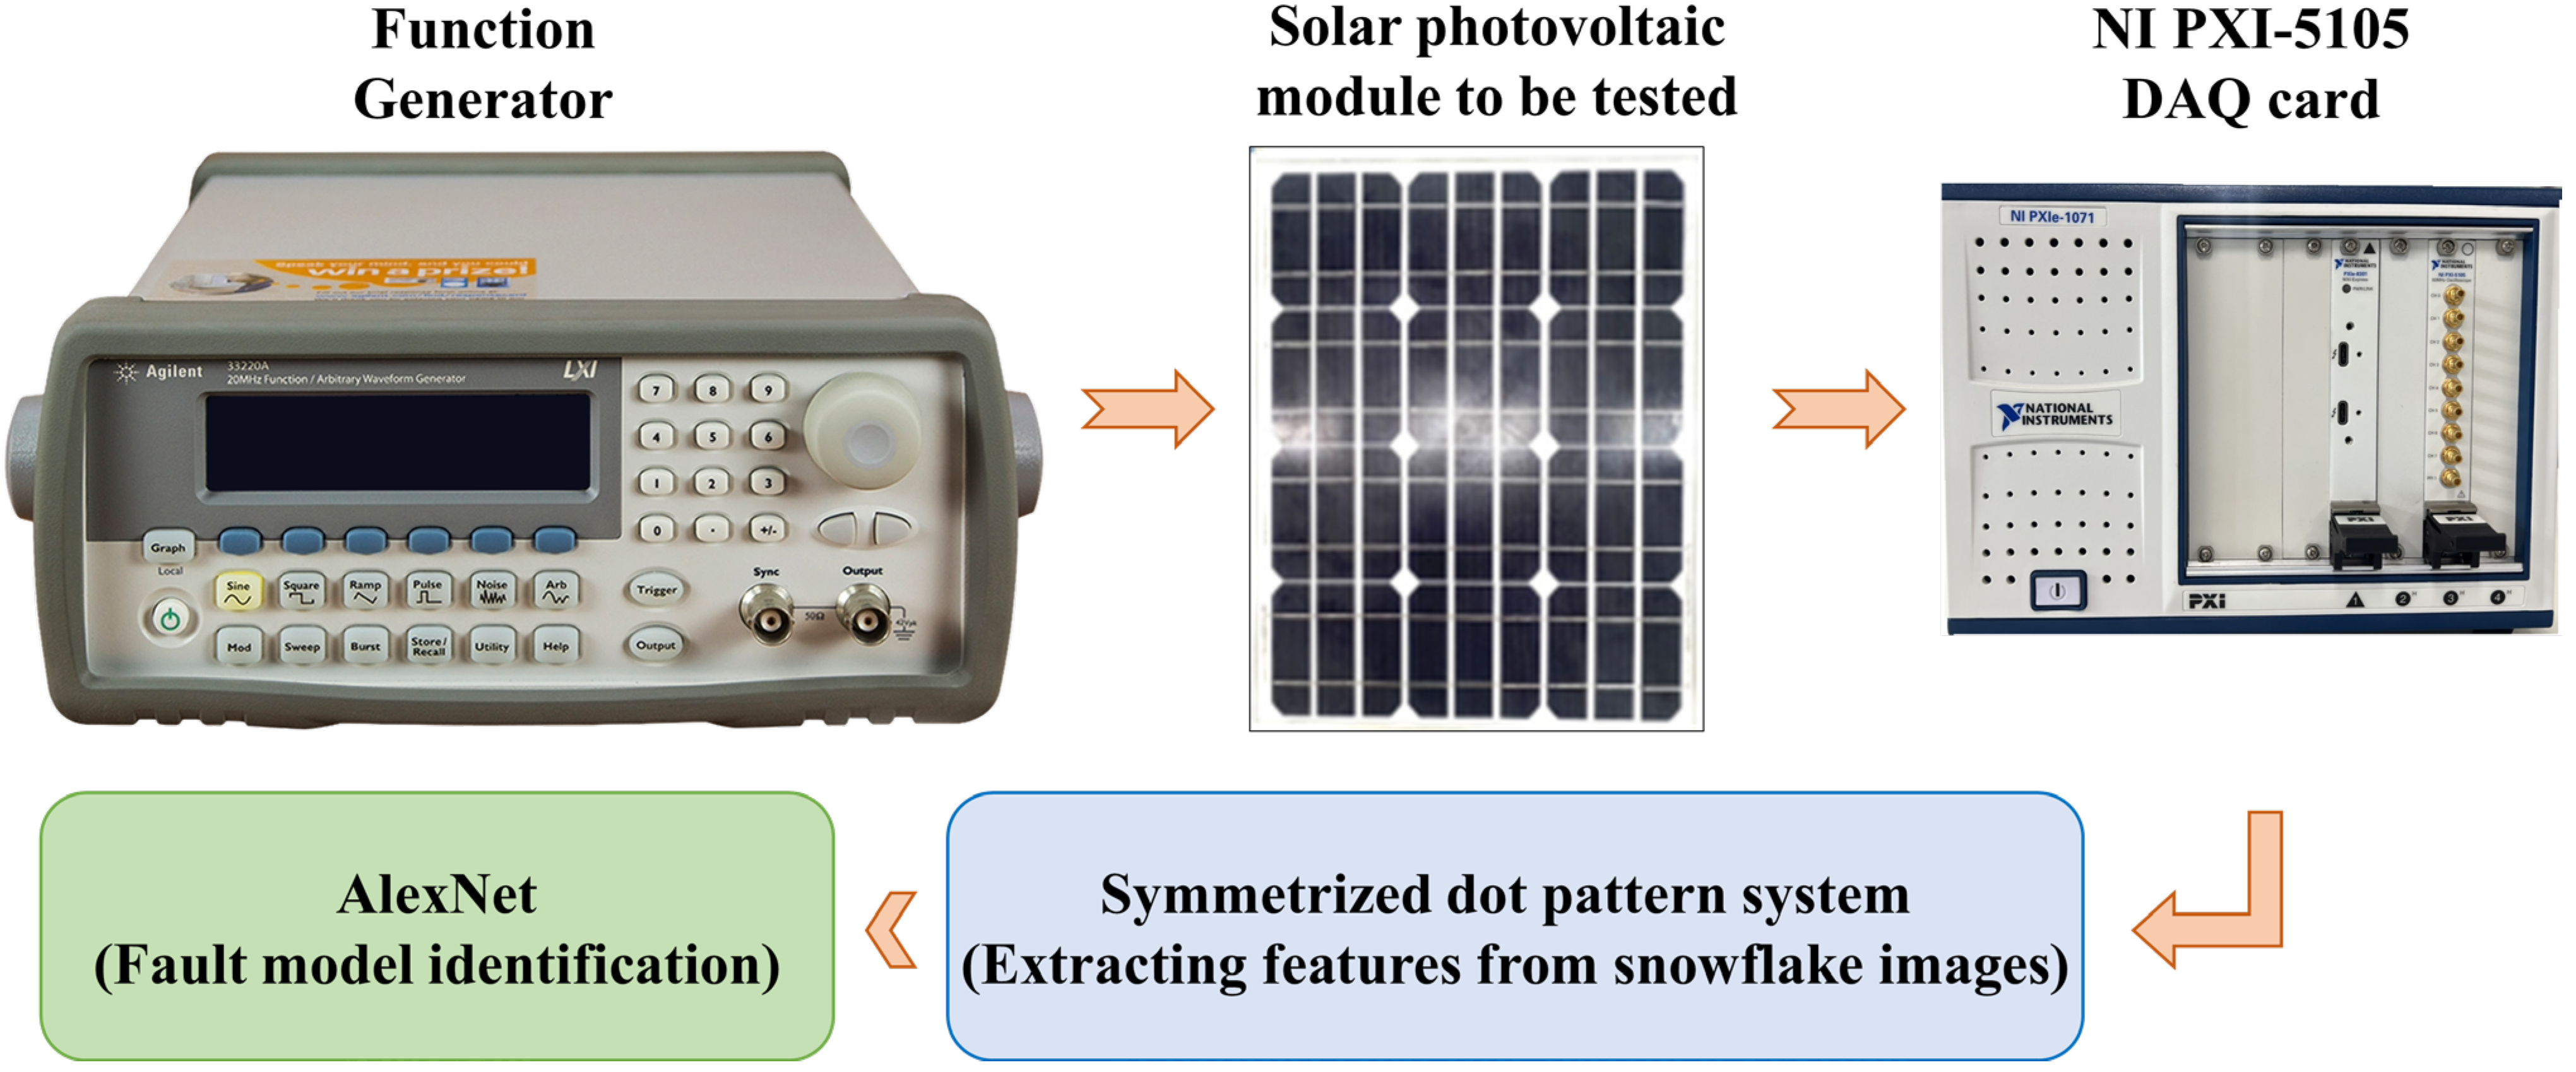
Figure 1 illustrates the testing procedure for the solar photovoltaic module designed in this study. In order to obtain the signals from the Type 1 solar photovoltaic module, we utilized a waveform generator to input a high-frequency signal into the module under test. Subsequently, a high-speed data acquisition card was used to receive the output signals from the solar photovoltaic module for further analysis.
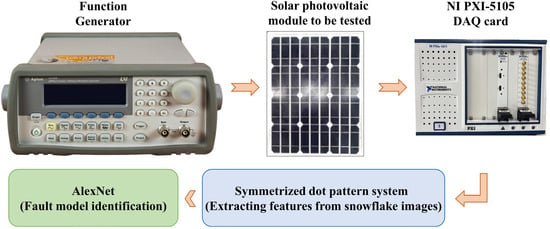
Figure 1.
Solar photovoltaic module testing process flowchart.
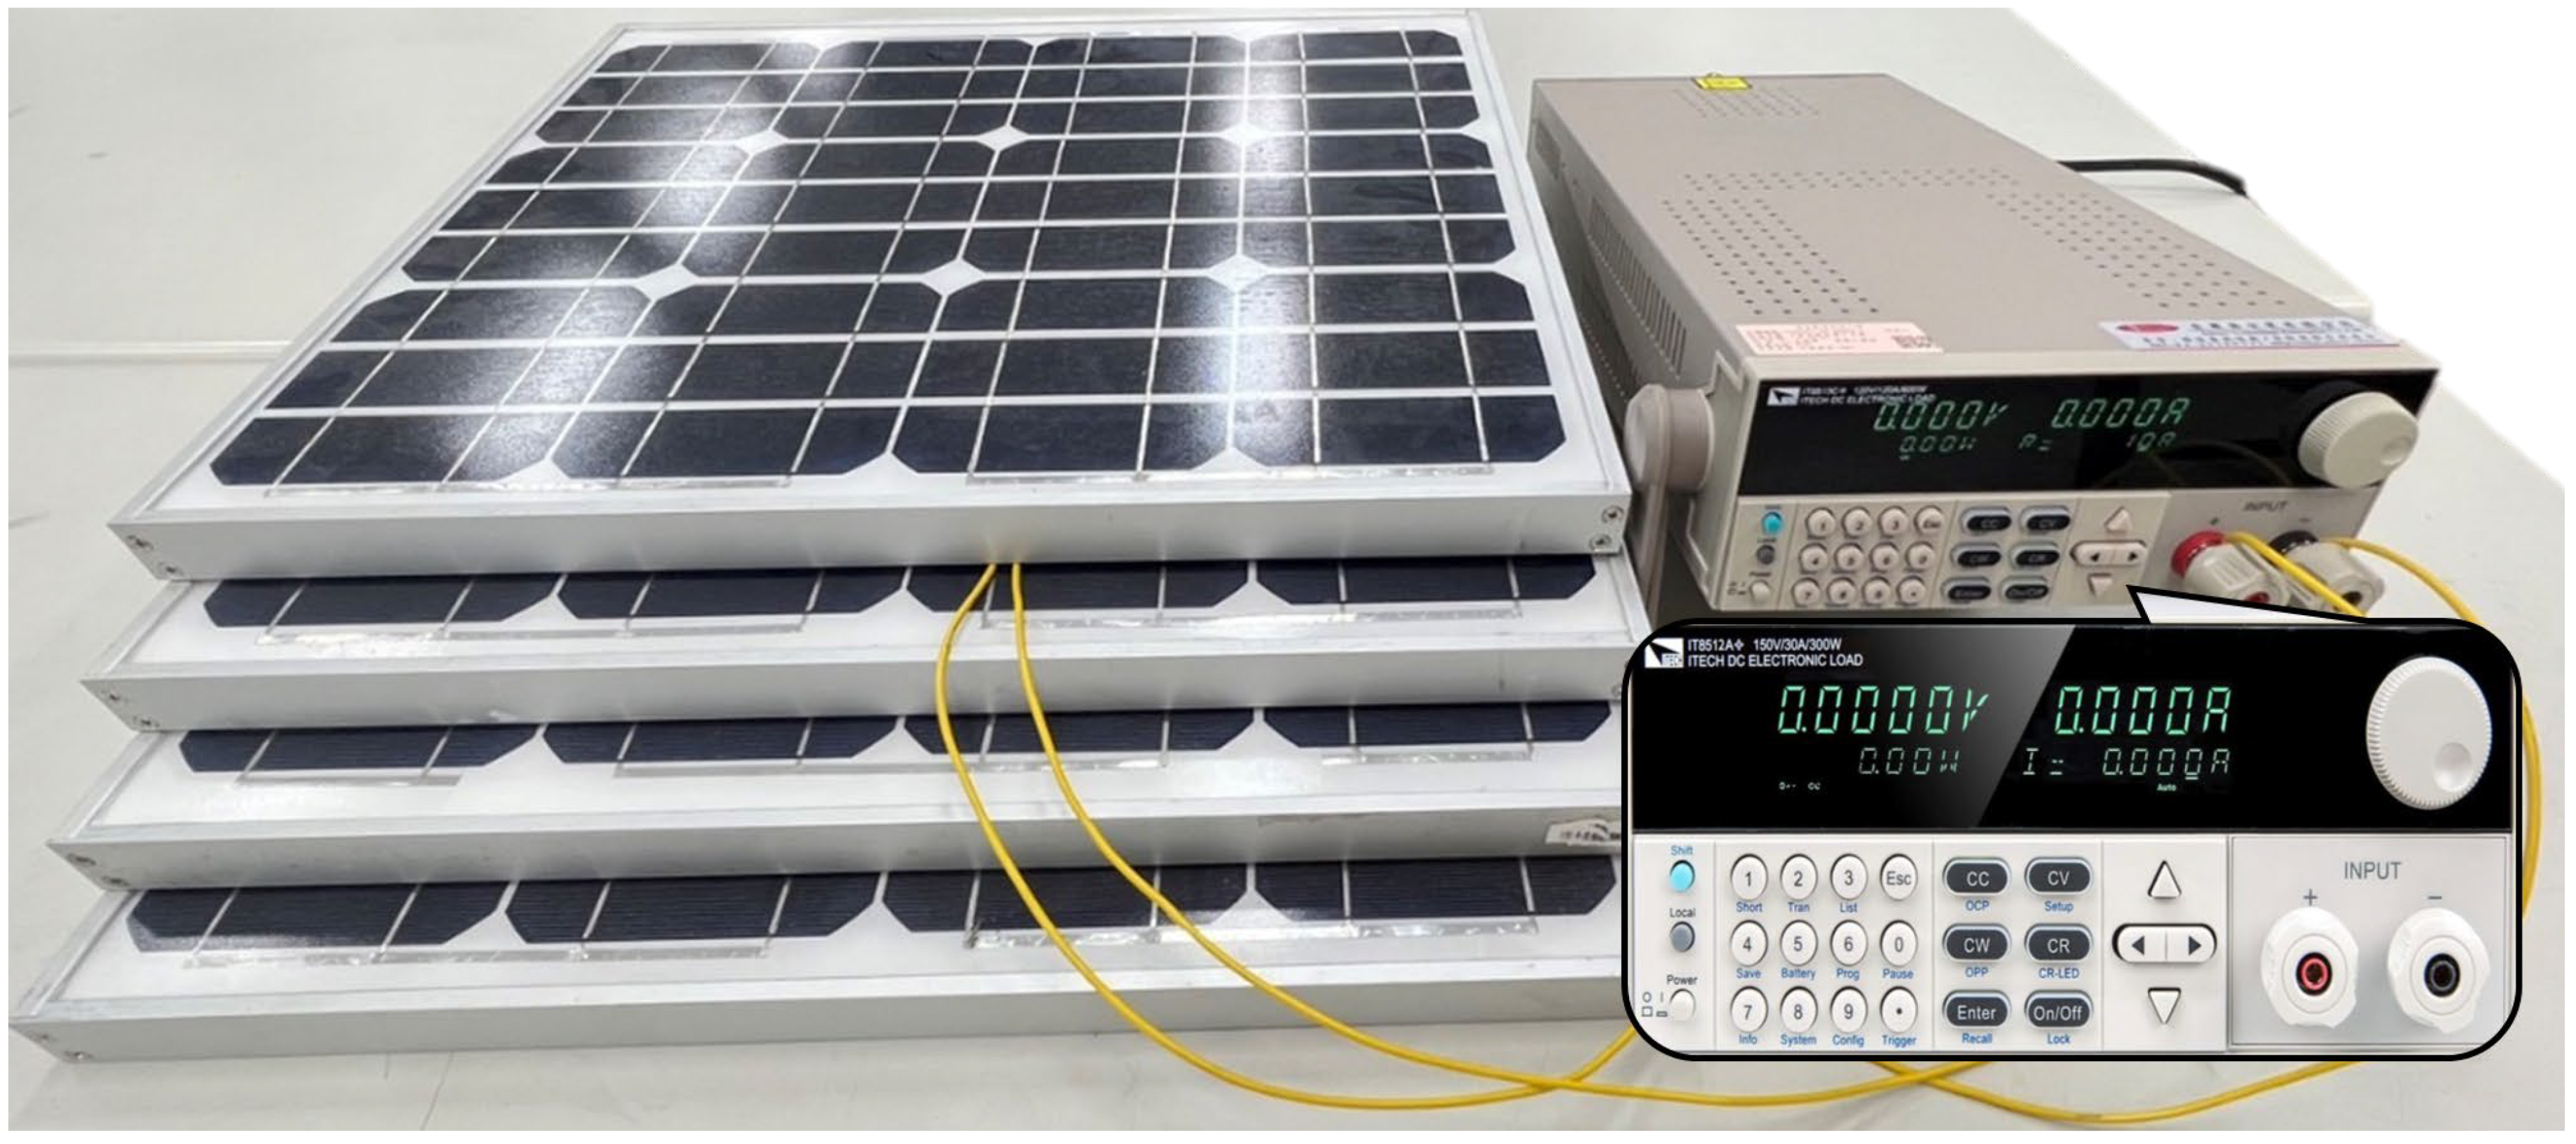
Figure 2 illustrates the experimental setup employed in this study, utilizing the NI PXI-5105 high-speed data acquisition card with the NI PXIe-1071 chassis for fault signal detection. This device offers outstanding performance characteristics, including a sampling frequency of up to 60 MHz, 8 synchronous channels, and a resolution of 12 bits. It is also equipped with built-in memory and instrument drivers, encompassing data streaming and analysis capabilities, enabling us to capture comprehensive details of the fault signals in solar photovoltaic modules.
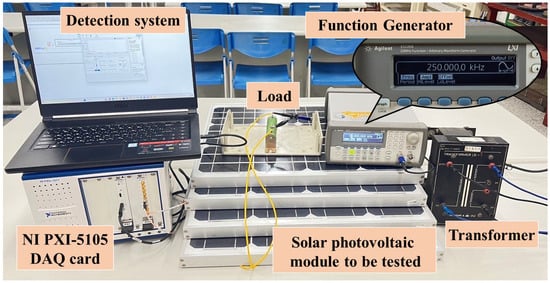
Figure 2.
Solar photovoltaic module testing platform.
2.2. Fault Models for Photovoltaic Modules
In order to investigate common issues in the production, handling, and installation processes of photovoltaic modules, this study selected a 20-watt monocrystalline silicon photovoltaic module. The module has a rated voltage of 18.2 V and a rated current of 1.10 A under standard test conditions (STC). The open-circuit voltage is 22.4 V, and the short-circuit current is 1.19 A. This study focused on three common fault models of the PV module. The specifications of the experimental setup and fault models are shown in Table 1:

Table 1.
The specifications of the experimental setup and photovoltaic modules.
2.2.1. Normal Fault Type of Solar PV Modules (Type 1)
In this study, we used a 20 W monocrystalline silicon PV module. Under the standard test condition, the irradiance level was at 1000 W/m2, the air mass was at 1.5, and the temperature was at 25 °C. The rated voltage, rated current, open-circuit voltage, and short-circuit current of the PV module were 18.2 V, 1.10 A, 22.4 V, and 1.19 A, respectively.
2.2.2. Poor Connection Fault Type of Solar PV Modules (Type 2)
Extended operation or variations in environmental temperature can lead to the loosening or detachment of power line screws or crimped terminals in electrical equipment, posing a safety risk. This situation can occur regardless of the material type or installation structure. According to the study in Ref. [23], the main causes of degradation or failure of electrical equipment in dry, desert environments are adhesive detachment and grid line interface rupture.
This study aims to address this issue by proposing a method for improving photovoltaic modules. In particular, the method involves adding an electronic load to the photovoltaic module and studying the poor connection conditions using externally applied 2 Ω and 10 Ω loads. To establish an aging failure model, we divided the resistance into 10 equal parts, ranging from 1 Ω to 10 Ω, as shown in Figure 3.
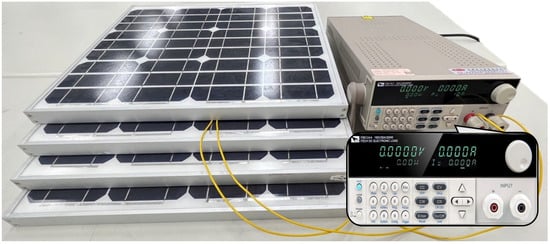
Figure 3.
Establishing aging failure model using electronic load.
2.2.3. Cracking Fault Type of Solar PV Modules (Type 3)
Based on prior research [24], the structural integrity of solar photovoltaic modules is susceptible to variations in environmental factors. In the classification of module malfunctions, safety issues and performance deficiencies are explicitly differentiated, with fractures in solar photovoltaic modules falling under safety failures.
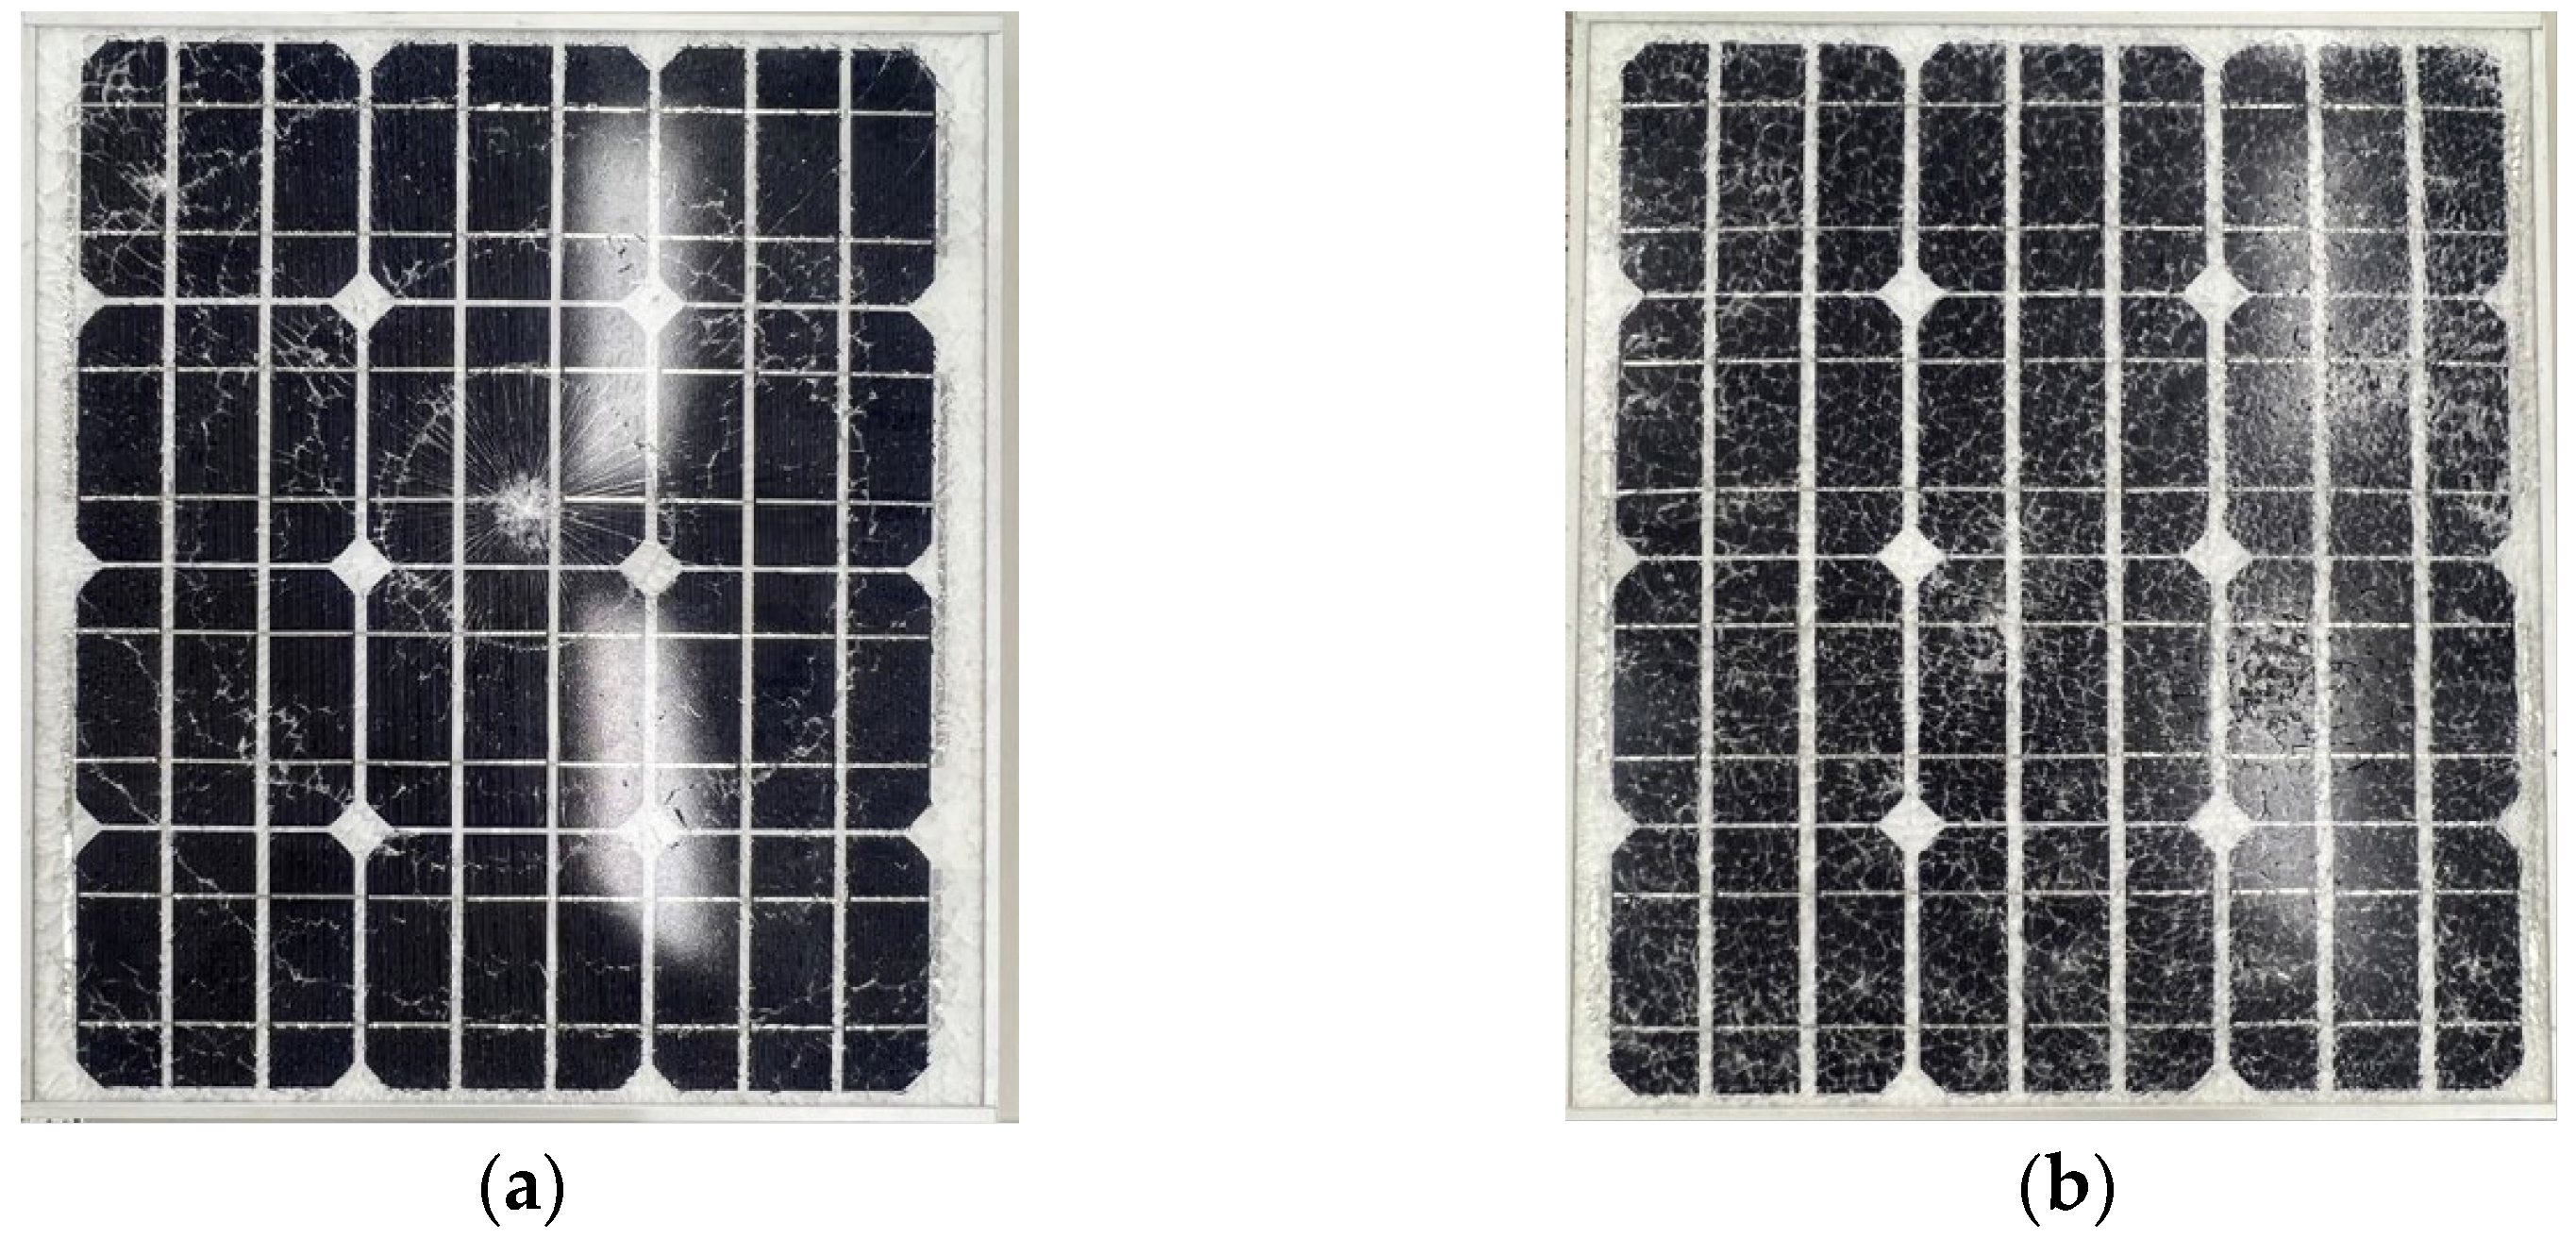
This study aims to simulate potential instances of human-induced damage and impacts from foreign objects during the installation process by subjecting a complete set of solar photovoltaic modules to external force collisions, thereby exploring the associated fracture patterns. The research findings indicate that when solar photovoltaic modules experience severe damage, fractures propagate from the impact point to adjacent regions, consequently impeding the normal functioning of other silicon wafers. Specific observations can be observed in Figure 4.
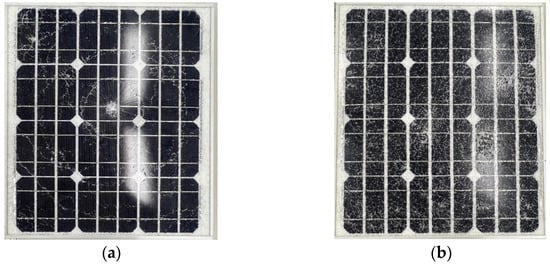
Figure 4.
Physical images of solar photovoltaic module failure: (a) minor; (b) severe.
2.2.4. Bypass Diode Failure of Solar PV Modules (Type 4)
According to Ref [25]—consistent with the modular approach in this paper—solar energy conversion is susceptible to external factors that can affect power generation and lead to failures. For instance, the presence of dirt or obstructions can result in a decrease in electrical output. When the battery is damaged—or the solar cell area is obstructed—heat generation occurs. Therefore, the bypass path plays a crucial role in diverting current around the shaded photovoltaic modules, which reduces the impact of hot-spot effects. In accordance with the methodology presented in this paper, we employed a bypass fault by short-circuiting the normal solar photovoltaic module and then disconnecting the bypass diode by soldering a wire, as illustrated in Figure 5.
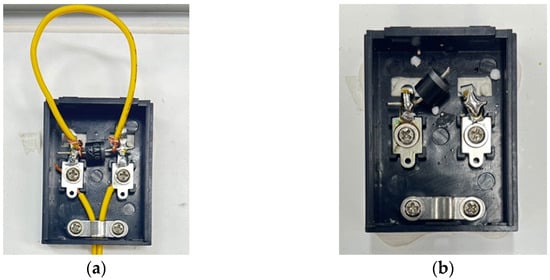
Figure 5.
Physical representation of diode failure in a photovoltaic module, showcasing two distinct scenarios: (a) short circuit; (b) open circuit.
3. Methodology
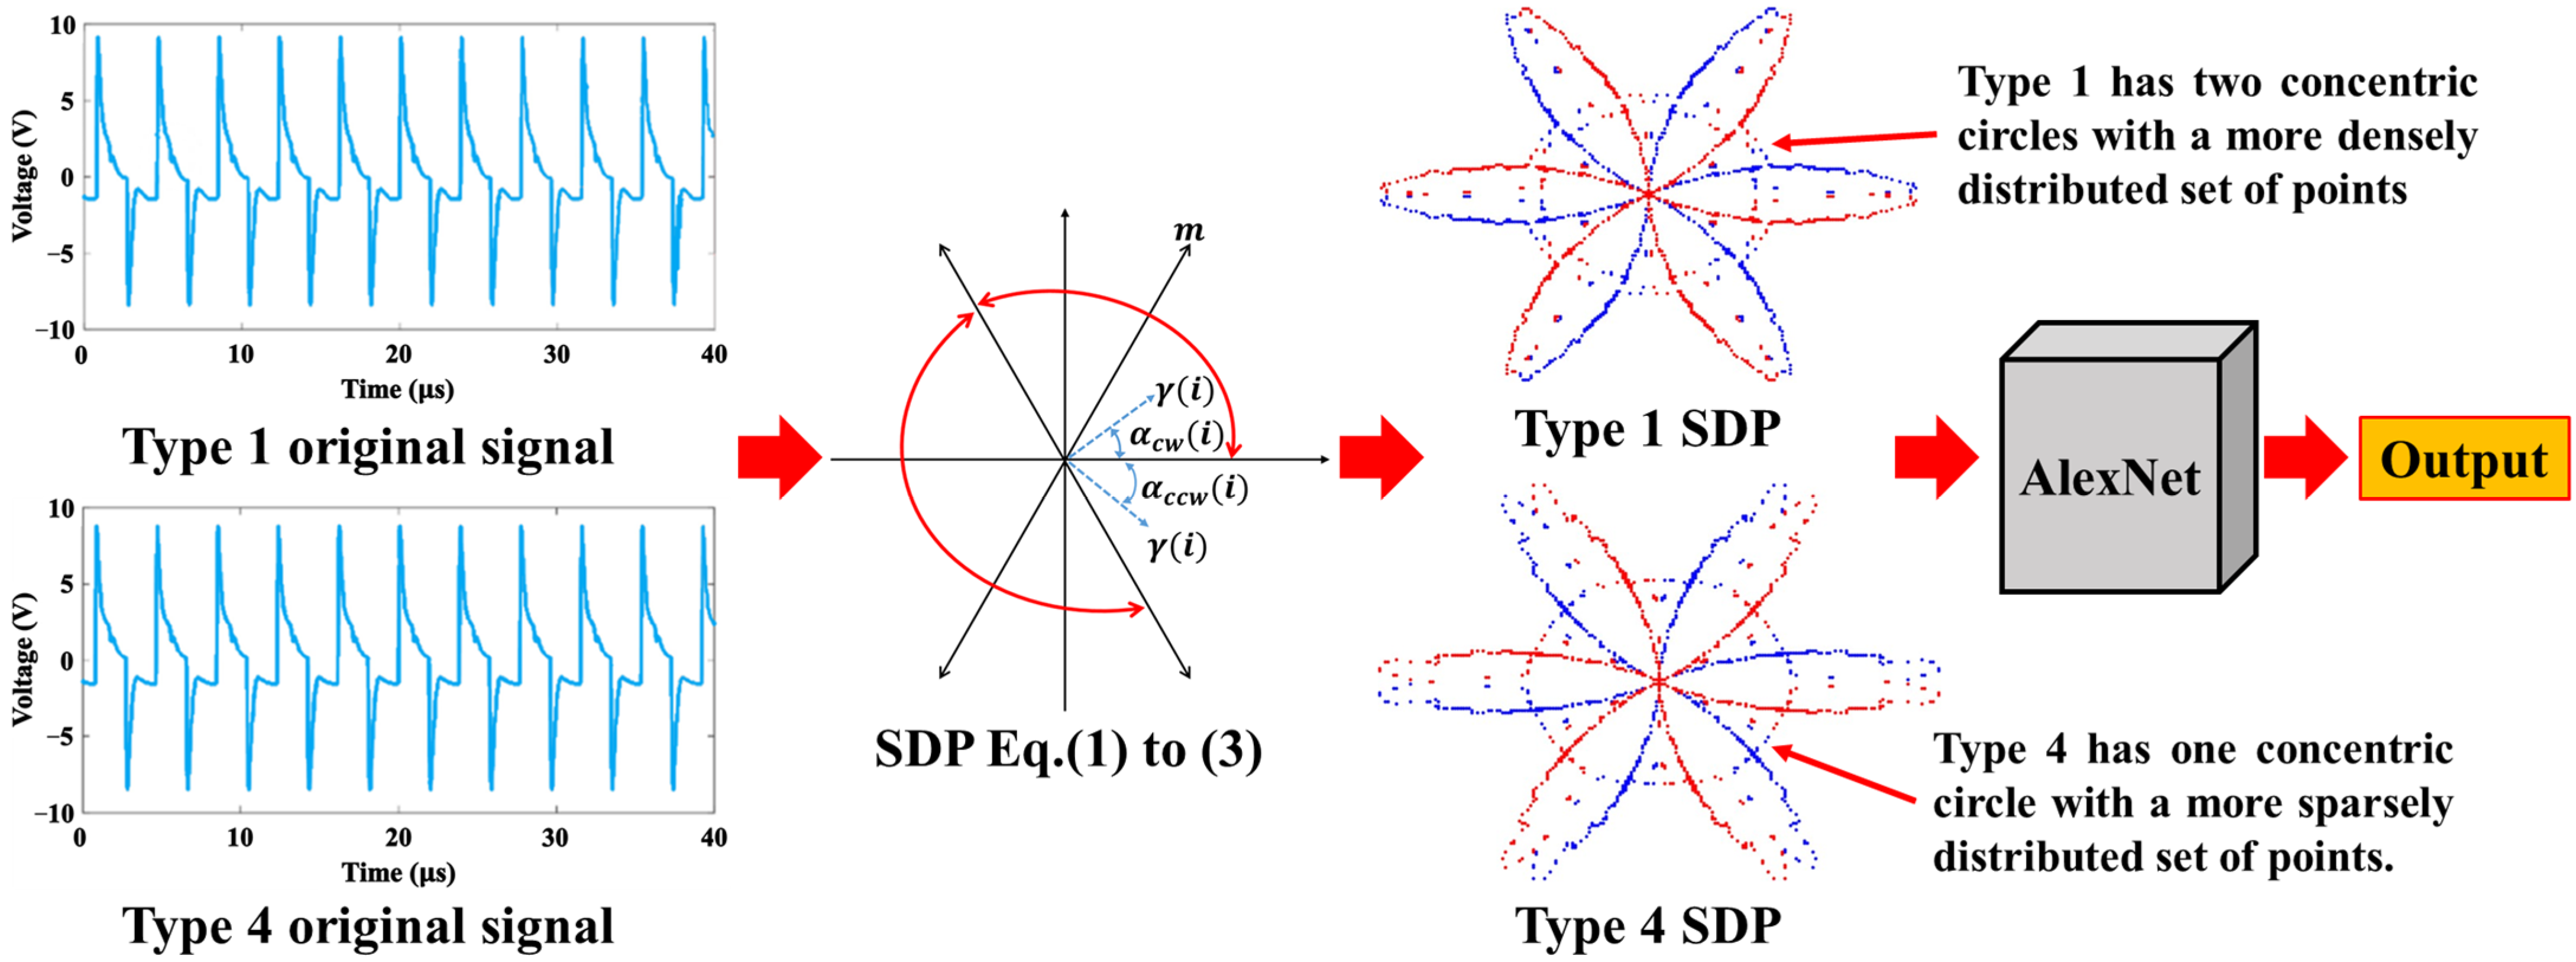
The initial step in solar photovoltaic module condition monitoring involves feeding a high-frequency signal into the solar photovoltaic module under test to extract the raw output waveform signal. This paper presents an approach that integrates the raw signals of the solar photovoltaic module with SDP for handling the raw signals from both normal and three different fault types of solar photovoltaic modules. The proposed method generates four unique symmetrical feature snowflake images. Then, fault recognition is performed using the AlexNet algorithm. The flowchart of the algorithm is depicted in Figure 6.
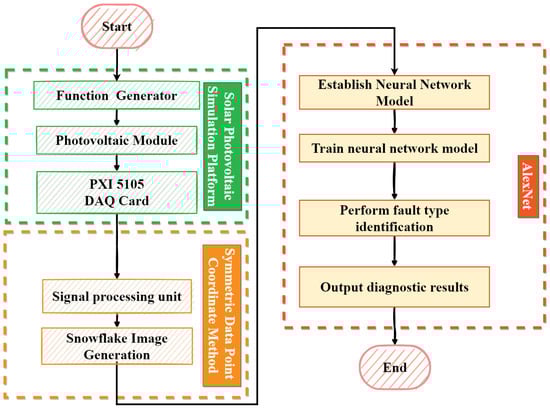
Figure 6.
Flowchart of the solar photovoltaic module detection process integrated with AlexNet using SDP.
3.1. Symmetrized Dot Pattern Coordinate Method
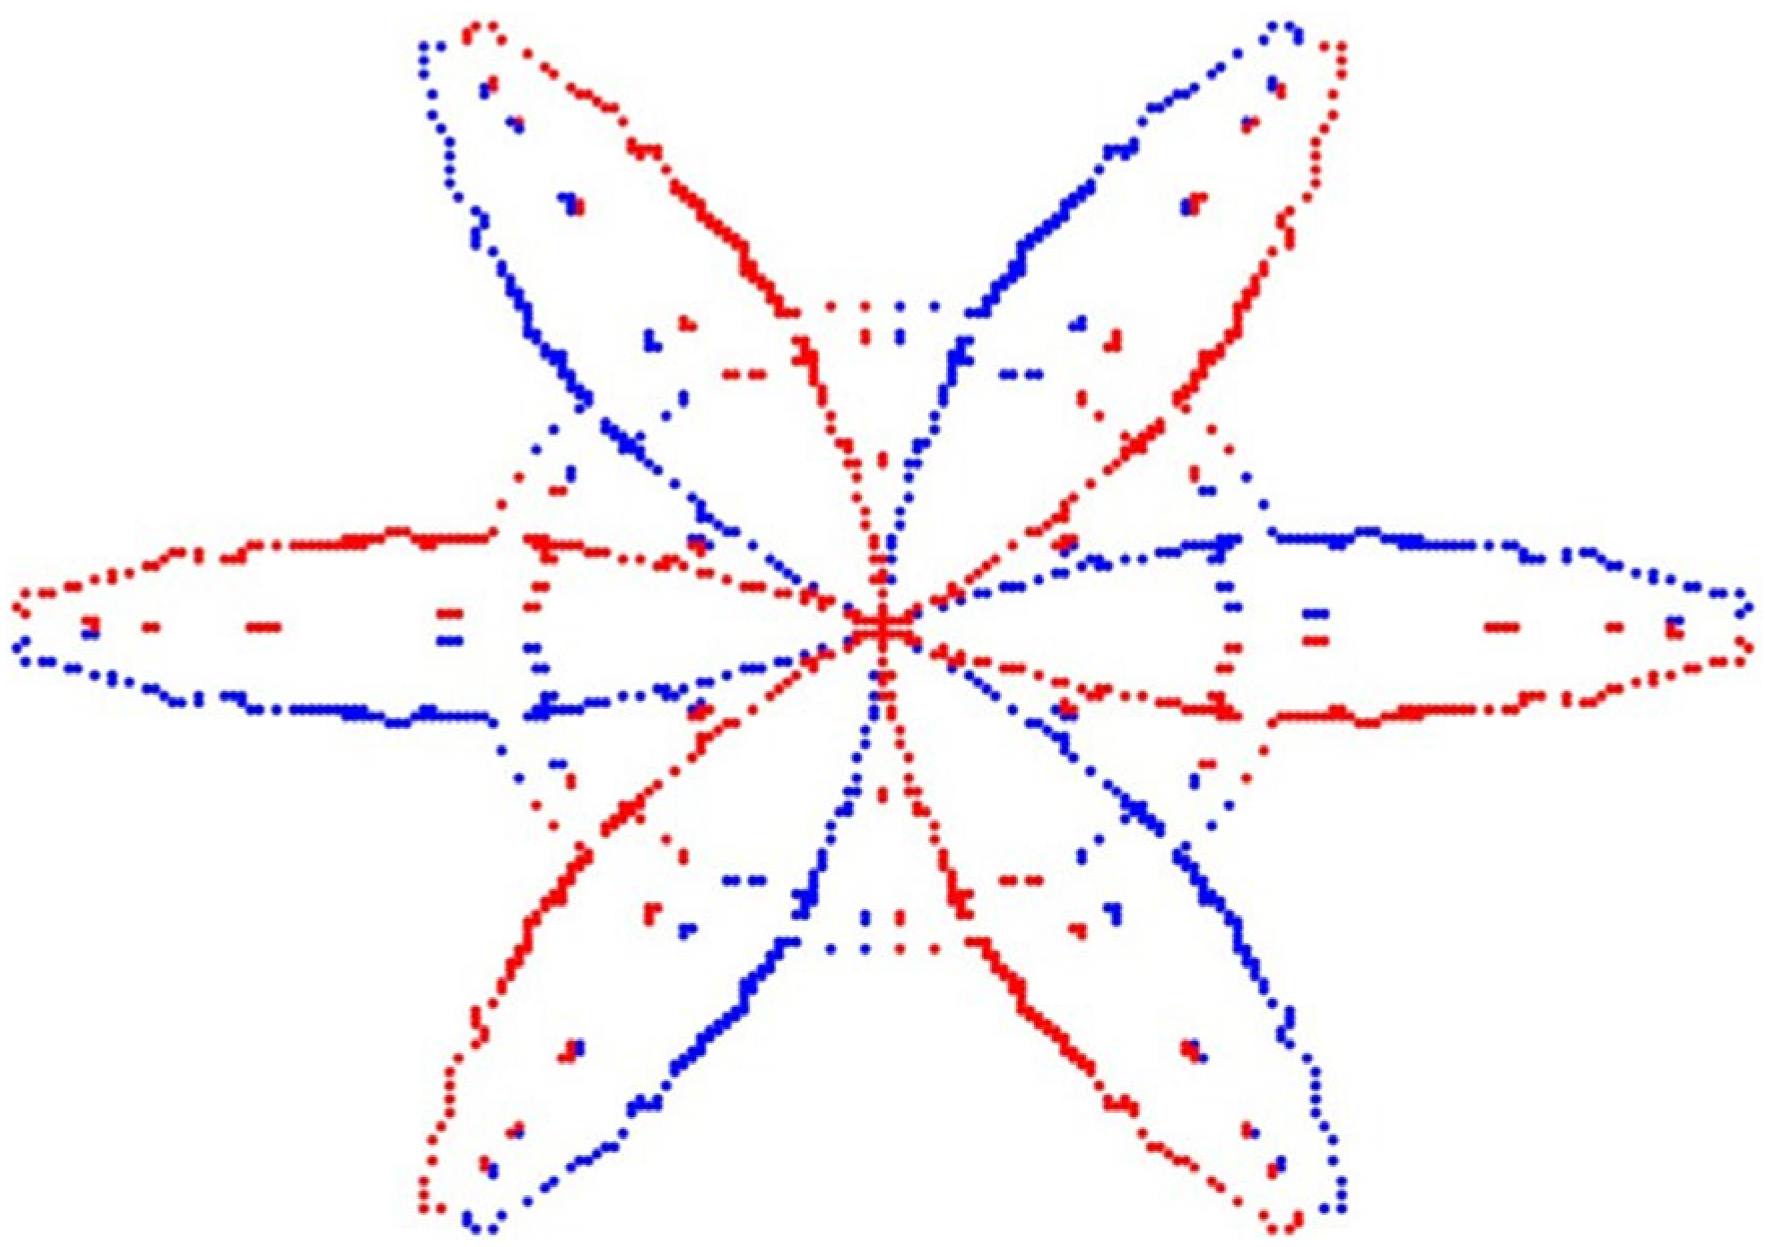
This research introduces a method for diagnosing faults in solar photovoltaic (PV) modules using the SDP coordinate approach. By employing the output SDP coordinate method to plot graphs, we observed shapes resembling snowflake patterns. Hence, we refer to this approach as the snowflake diagram. By capturing signal variations generated during different types of faults in solar PV modules, we were able to generate distinct snowflake diagrams, which serve as diagnostic features. This paper presents typical snowflake diagrams, as shown in Figure 7.
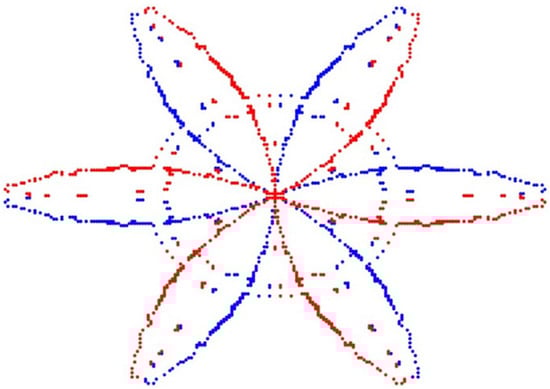
Figure 7.
Representative snowflake diagram of a photovoltaic module.
The symmetrized dot pattern coordinate method [26] is a data transformation technique used for processing time–domain square wave signals. This method involves converting the signal into a polar coordinate feature image through a data extraction system. Figure 8 illustrates the principle of this method, where radius (i), clockwise rotation angle (), and counterclockwise rotation angle () are the three main features of the image. In the sampled square wave data of the solar photovoltaic module’s state signal, each signal sampling point represents the signal intensity at the -th time, while the signal sampling point represents the signal intensity at the -th time. By substituting these data into Equations (1)–(3), the transformed polar coordinate point O(r(i), , ()) can be obtained. Further, different coordinate symmetric images of the solar photovoltaic module’s state signal can be generated by varying the initial rotation angle. In conclusion, the symmetrized dot pattern coordinate method is an effective signal processing technique that aids in the analysis and understanding of the state of solar photovoltaic modules.
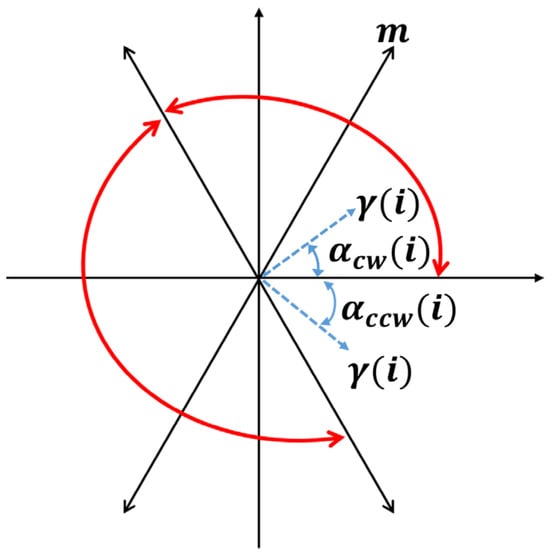
Figure 8.
Symmetrized dot pattern coordinate diagram.
The feature map parameters in this study are designed for the analysis and identification of faults in solar photovoltaic modules. The definitions of these parameters are as follows: represents the maximum value of the original signal, represents the minimum value of the original signal, τ represents the time interval parameter between signals (1 ≤ ≤ 10), represents the initial deviation angle of the x-axis, and represents the amplification coefficient of the rotation angle () Through experimental testing, it has been found that setting to 60°, to 3, and to 3 effectively assists in the fault identification and analysis of solar photovoltaic modules. According to empirical values stated in [26,27,28], = 60° is typically considered an interval. The parameter , which is the rotation angle of the mirror symmetry plane, is commonly set at 0°, 60°, 120°, 180°, 240°, or 300°. Furthermore, based on the authors’ experience described in [29,30], we found that such values yield better identification results. In other words, these feature map parameters can be considered crucial factors for more accurate identification of faults in solar photovoltaic modules.
3.2. AlexNet
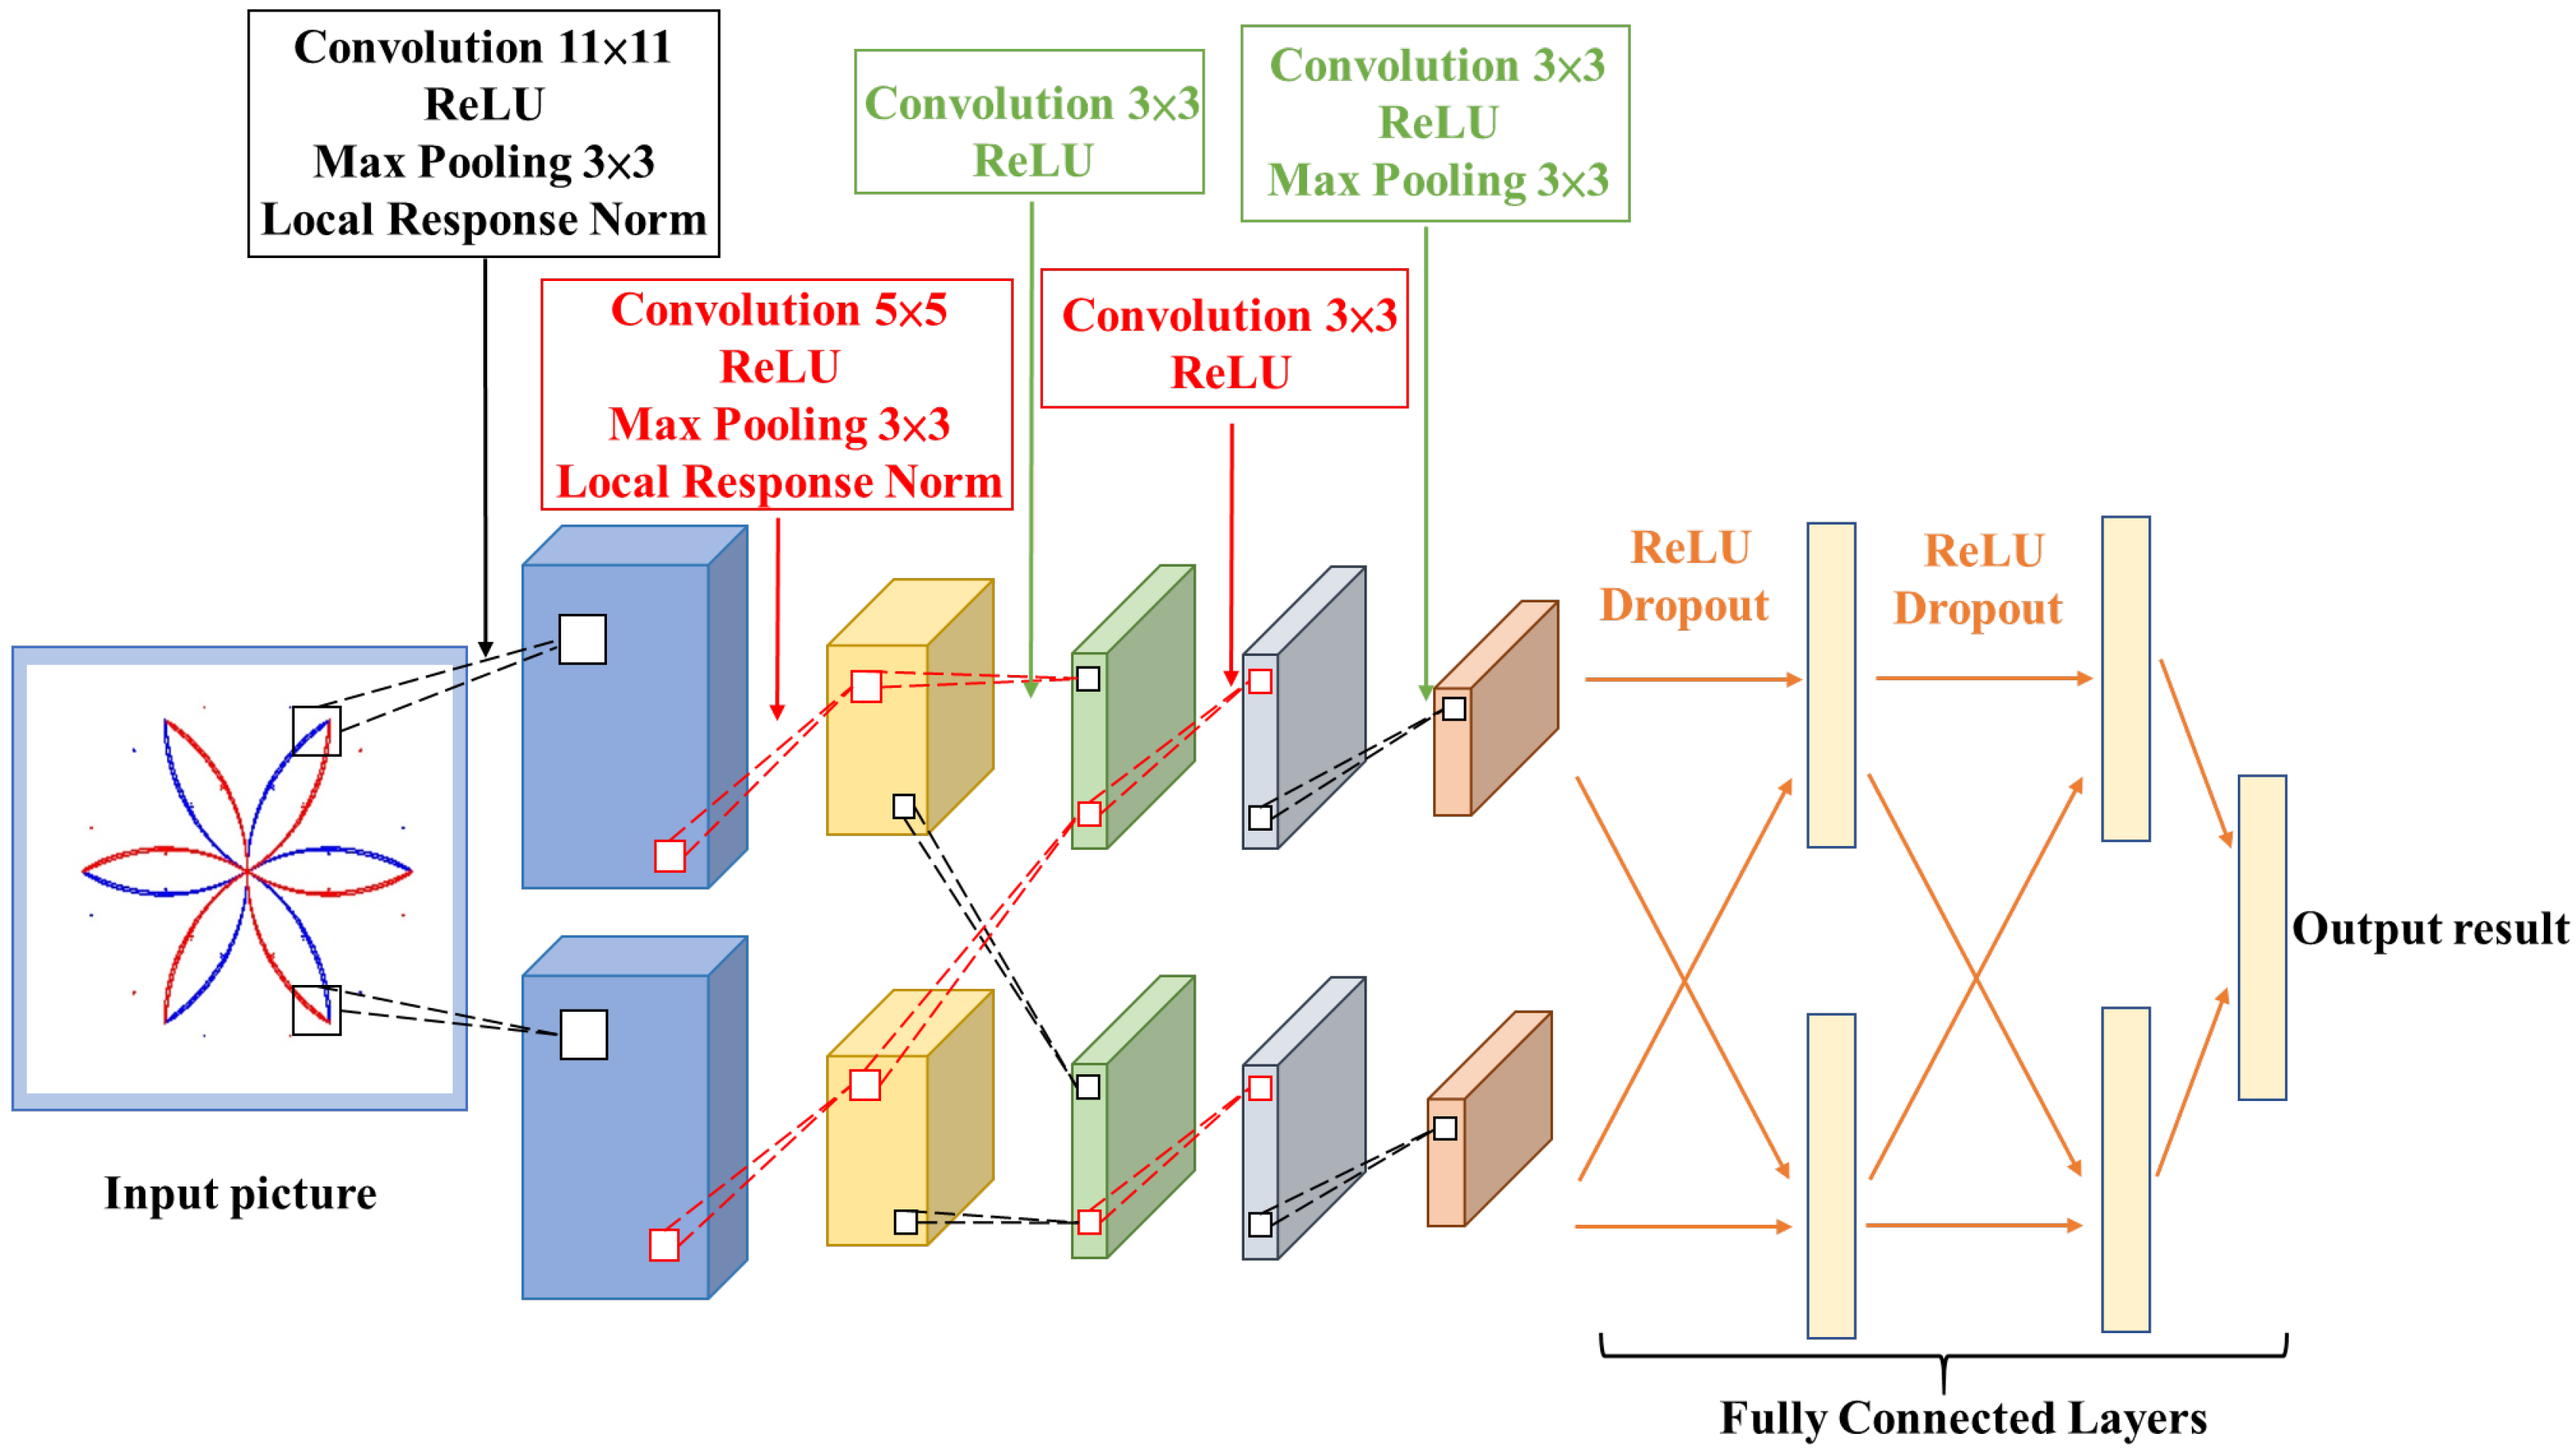
AlexNet, proposed by Alex Krizhevsky, Ilya Sutskever, and Geoffrey Hinton in 2012, emerged as a highly successful deep-learning model in the ImageNet Large Scale Visual Recognition Challenge (ILSVRC) of the same year. It achieved remarkable performance by reducing the error rate to 15.3%, surpassing the second-ranked model by 10%. This accomplishment marked a significant milestone in the field of image classification, with ILSVRC being an annual competition that involves a vast image dataset (ImageNet) for visual image recognition.
In recent years, AlexNet has found wide-ranging applications, primarily in image classification and object detection. It has been applied to various domains, such as facial recognition [31], medical image analysis [32], and fault diagnosis [33]. By extracting useful information from a large number of data, AlexNet has helped save substantial human resources and time. Its success has also fostered the development of deep learning in the field of computer vision and paved the way for the emergence of numerous deep convolutional neural network models. The architecture of the AlexNet model is illustrated in Figure 9.
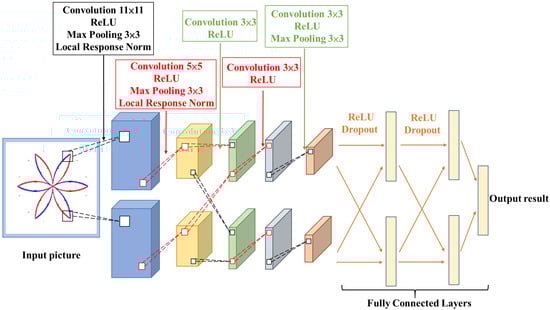
Figure 9.
Architecture diagram of the AlexNet model.
The AlexNet architecture is predominantly composed of 5 convolutional layers and 3 fully connected layers. The connectivity pattern within the convolutional layers is such that the kernels in the second, fourth, and fifth layers are exclusively linked to the kernels in the preceding layer on the same Graphics Processing Unit (GPU). The fully connected layers generate a final output consisting of 1000 categories, while the traditional sigmoid activation function has been substituted with the ReLU activation function. During the training process, AlexNet incorporates critical techniques like dropout and data augmentation, which effectively address overfitting concerns, improve the model’s ability to generalize, and enhance its robustness.
3.2.1. Dual GPU Training
AlexNet employs two GPUs to train the model. Each GPU is assigned half of the neural network layers. During the training process, each GPU conducts forward propagation, backward propagation, and parameter updates on its allocated data. This mechanism ensures consistent training performance between the two GPUs. AlexNet synchronizes the actions of the two GPUs during GPU training to ensure parameter consistency.
Traditionally, this synchronization was achieved by periodically transmitting model parameters between the GPUs. However, in maximizing GPU efficiency, an asynchronous updating method is now being employed. Each GPU independently performs gradient descent and weight updates on its dedicated training set.
Furthermore, AlexNet utilizes data parallelism techniques to accelerate training speed and improve model accuracy. This method enables the training of more precise deep neural network models in a shorter timeframe.
3.2.2. Dropout Regularization
Dropout regularization is a commonly used technique in neural networks, particularly in the field of electrical engineering. It addresses overfitting by randomly dropping some neuron outputs, thereby preventing neurons from becoming too dependent on each other and reducing the similarity of weights within neurons. This approach is based on the principle of setting the outputs of certain neurons to zero during the training process, ensuring that each neuron does not overly rely on other neurons. Consequently, dropout regularization helps the model learn more robust features, leading to improved generalization capabilities. It is typically applied only during training. It is not applied during testing because it is crucial to ensure stable and predictable model outputs in this phase and the random dropping of neuron outputs could introduce instability. Therefore, dropout regularization is not employed during the testing phase to maintain model stability and predictability.
3.2.3. Local Response Normalization (LRN)
Local Response Normalization (LRN) is a commonly used normalization technique in deep-learning neural networks. It is typically applied after convolutional layers to normalize neighboring regions of neurons, thereby enhancing the clarity of features. This method improves the model’s generalization capability and effectively reduces overfitting. The LRN implementation normalizes the output of each neuron based on its surrounding neighborhood. The size of the neighborhood is determined by hyperparameter tuning. Within the local neighborhood, the output value of each neuron is divided by a normalization term, which is obtained by summing the squared values of all neurons within the neighborhood and adding a small constant. The mathematical expression for this formula is presented as Equation (4), where represents the output value of the neuron at spatial coordinates (x, y) in the -th channel. is the normalized value of a, N is the total number of channels, and k, , , and n are parameters. This implementation method gained widespread use in AlexNet and achieved significant performance in image recognition competitions at the time.
4. Experimental Results
4.1. Raw Waveform Measurement
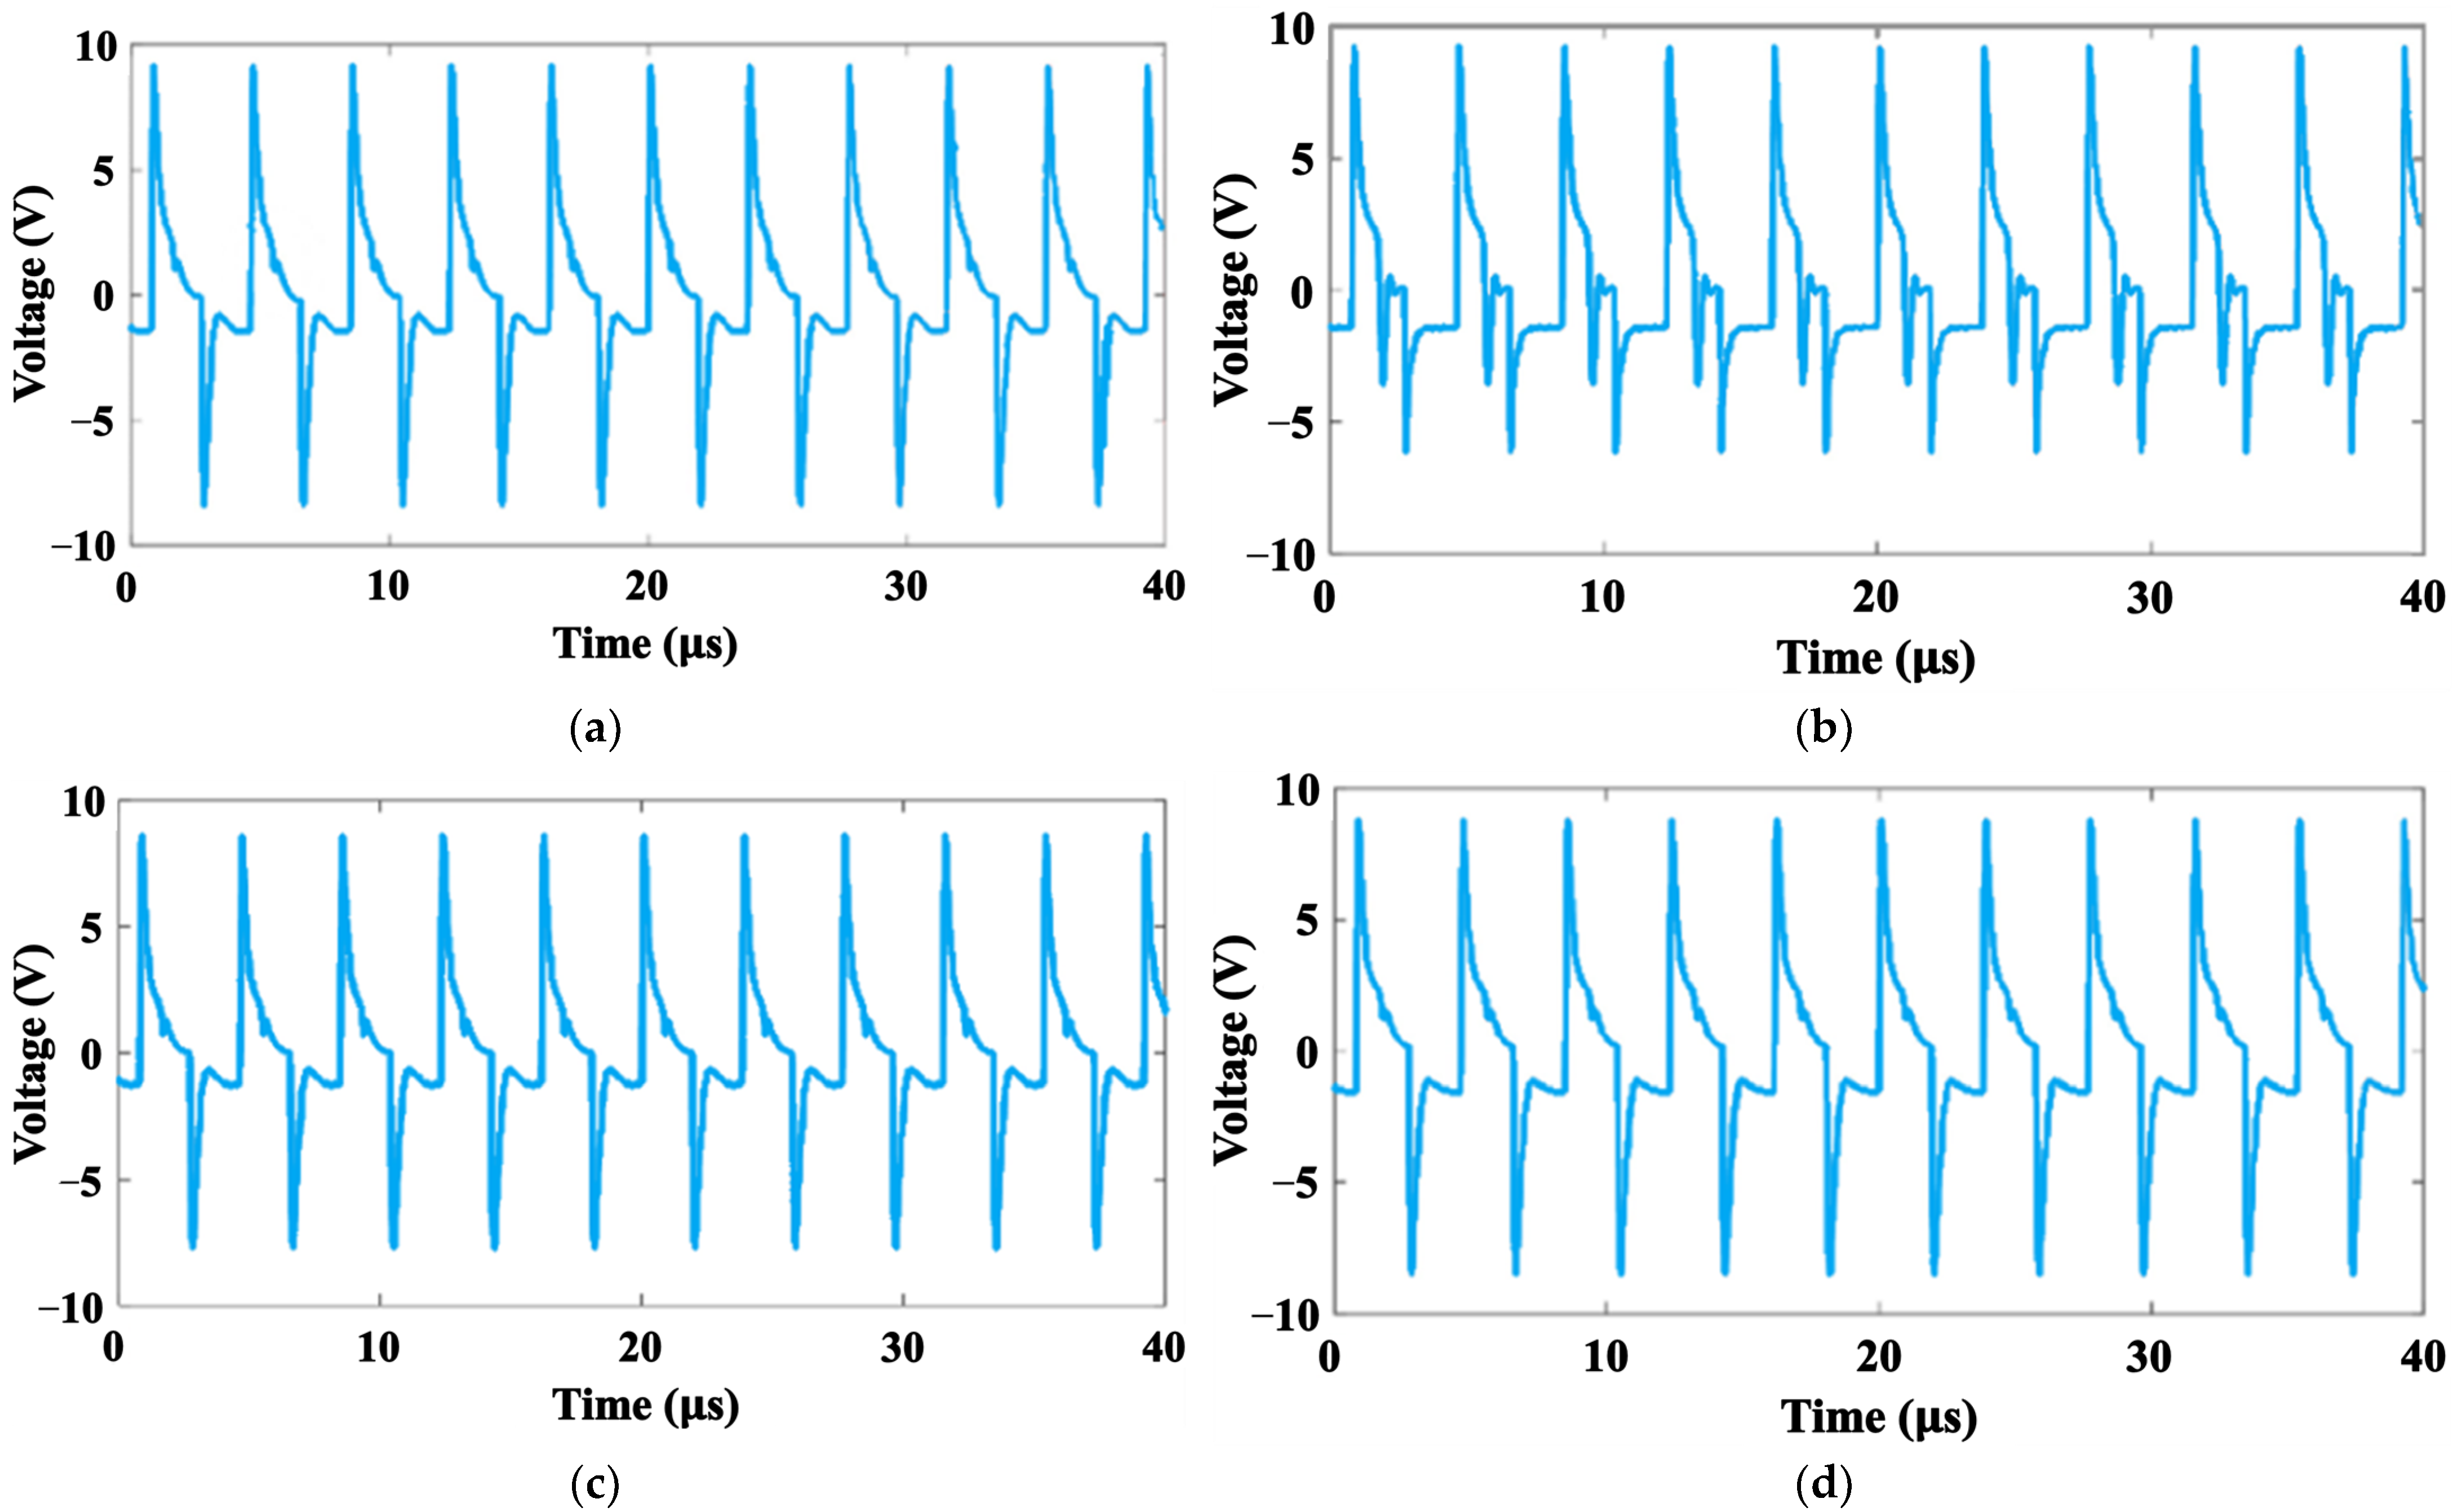
The acquired signal of the solar photovoltaic module is shown in Figure 10. First, we input a high-frequency signal with a frequency of 250 kHz, which is a high-frequency square wave signal with a peak-to-peak voltage of 20 V. We performed measurements with a data sampling time of 40 μs, covering data from 10 cycles. The data for each fault condition consist of 3200 sampling points, from which we selected 200 data points for each state, resulting in a total of 800 data points used for experimental research.
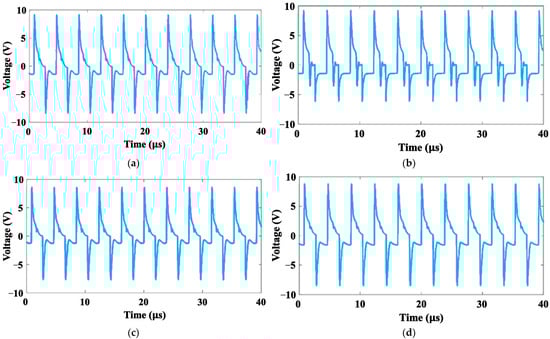
Figure 10.
Waveform signals of different module faults in solar photovoltaic modules: (a) normal solar photovoltaic module; (b) poor connection; (c) cracked; (d) diode failure.
Figure 10 shows that the output voltage waveform of the solar photovoltaic module is affected by the voltage drop across the components within the module, resulting in a decrease in peak voltage. No significant changes were observed during the negative half-cycle, while a small drift phenomenon between 0 V and 5 V was observed during the positive half-cycle, which can serve as a characteristic feature for signal identification. Due to the subtle nature of these variations, they are not easily discernible from waveform observation alone, hence the use of SDP to highlight the main features.
In addition, the signal caused by poor module connection was observed, as shown in Figure 10, which exhibits a slightly lower peak-to-peak voltage compared to the normal signal of the solar photovoltaic module. Additionally, we also observed the signal generated by module breakage, as depicted in Figure 10, where significant and drastic changes are clearly visible within the range of −10 V to 5 V compared to the normal signal of the solar photovoltaic module. Lastly, the signal generated by diode failure was observed, as shown in Figure 10, where the output waveform resembles the normal signal of the solar photovoltaic module but with a longer time required to observe voltage differences.
4.2. Application of Symmetrical Point Coordinate Method in Solar Photovoltaic Modules
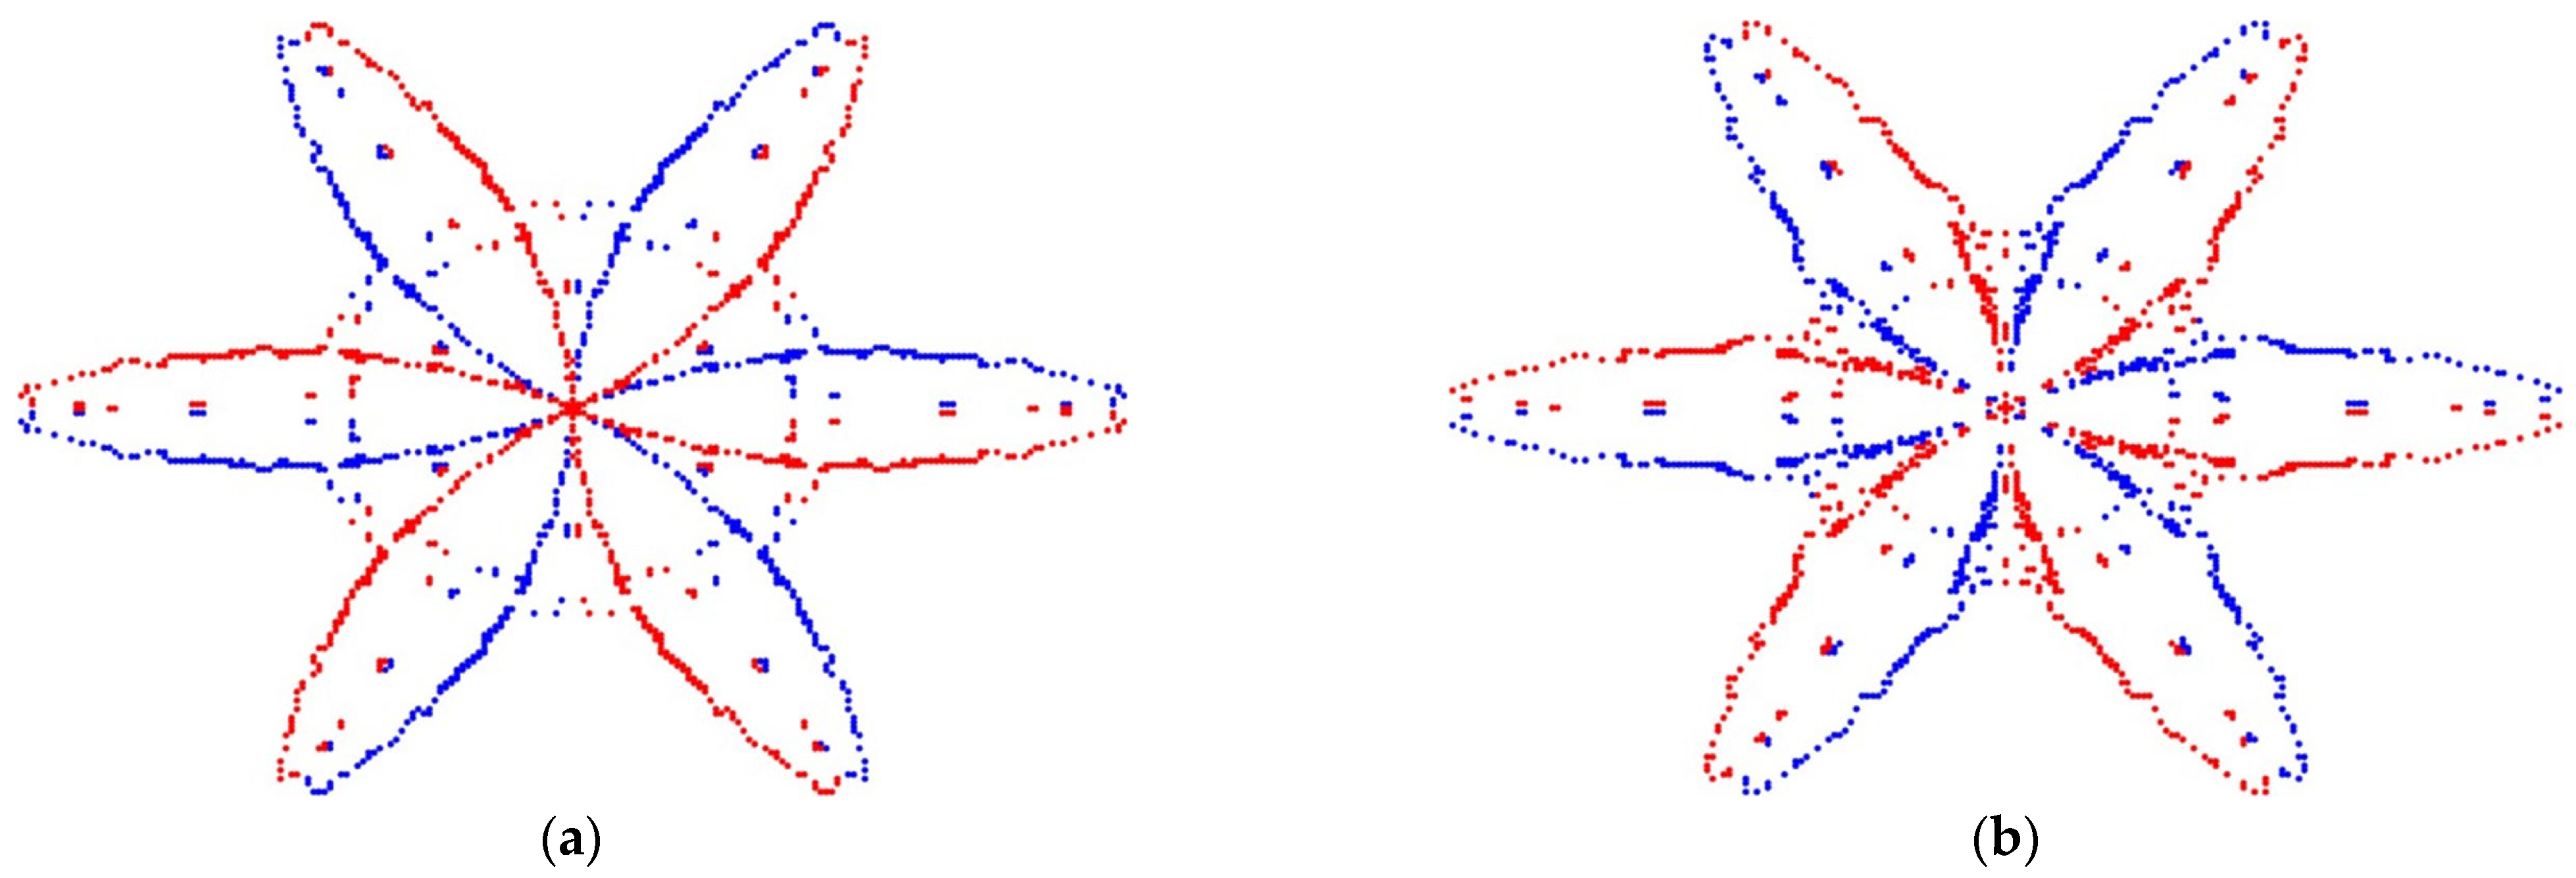
This research focuses on analyzing the waveform signals generated by solar photovoltaic modules and inputting their data into the SDP system to generate corresponding feature maps. Figure 11 presents feature pattern images for four types of faults in solar photovoltaic modules—crucial for fault detection and diagnosis.
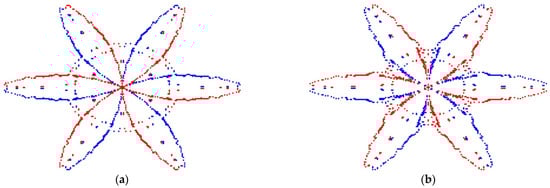
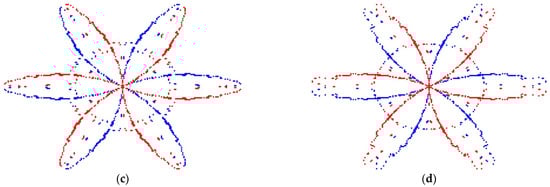
Figure 11.
Characteristic snowflake diagrams of different types of photovoltaic modules: (a) normal; (b) poor connection; (c) cracking; (d) bypass diode failure.
The snowflake patterns displayed by photovoltaic modules under different fault states exhibit distinct characteristics. They are utilized for the identification of various types of faults, and the distribution and density of these characteristic snowflake images vary depending on the type of fault. Normal photovoltaic modules exhibit a relatively smooth distribution, while severe module damage results in snowflake patterns with a jagged appearance. Consequently, this feature is further applied in the training and recognition of faults using AlexNet.
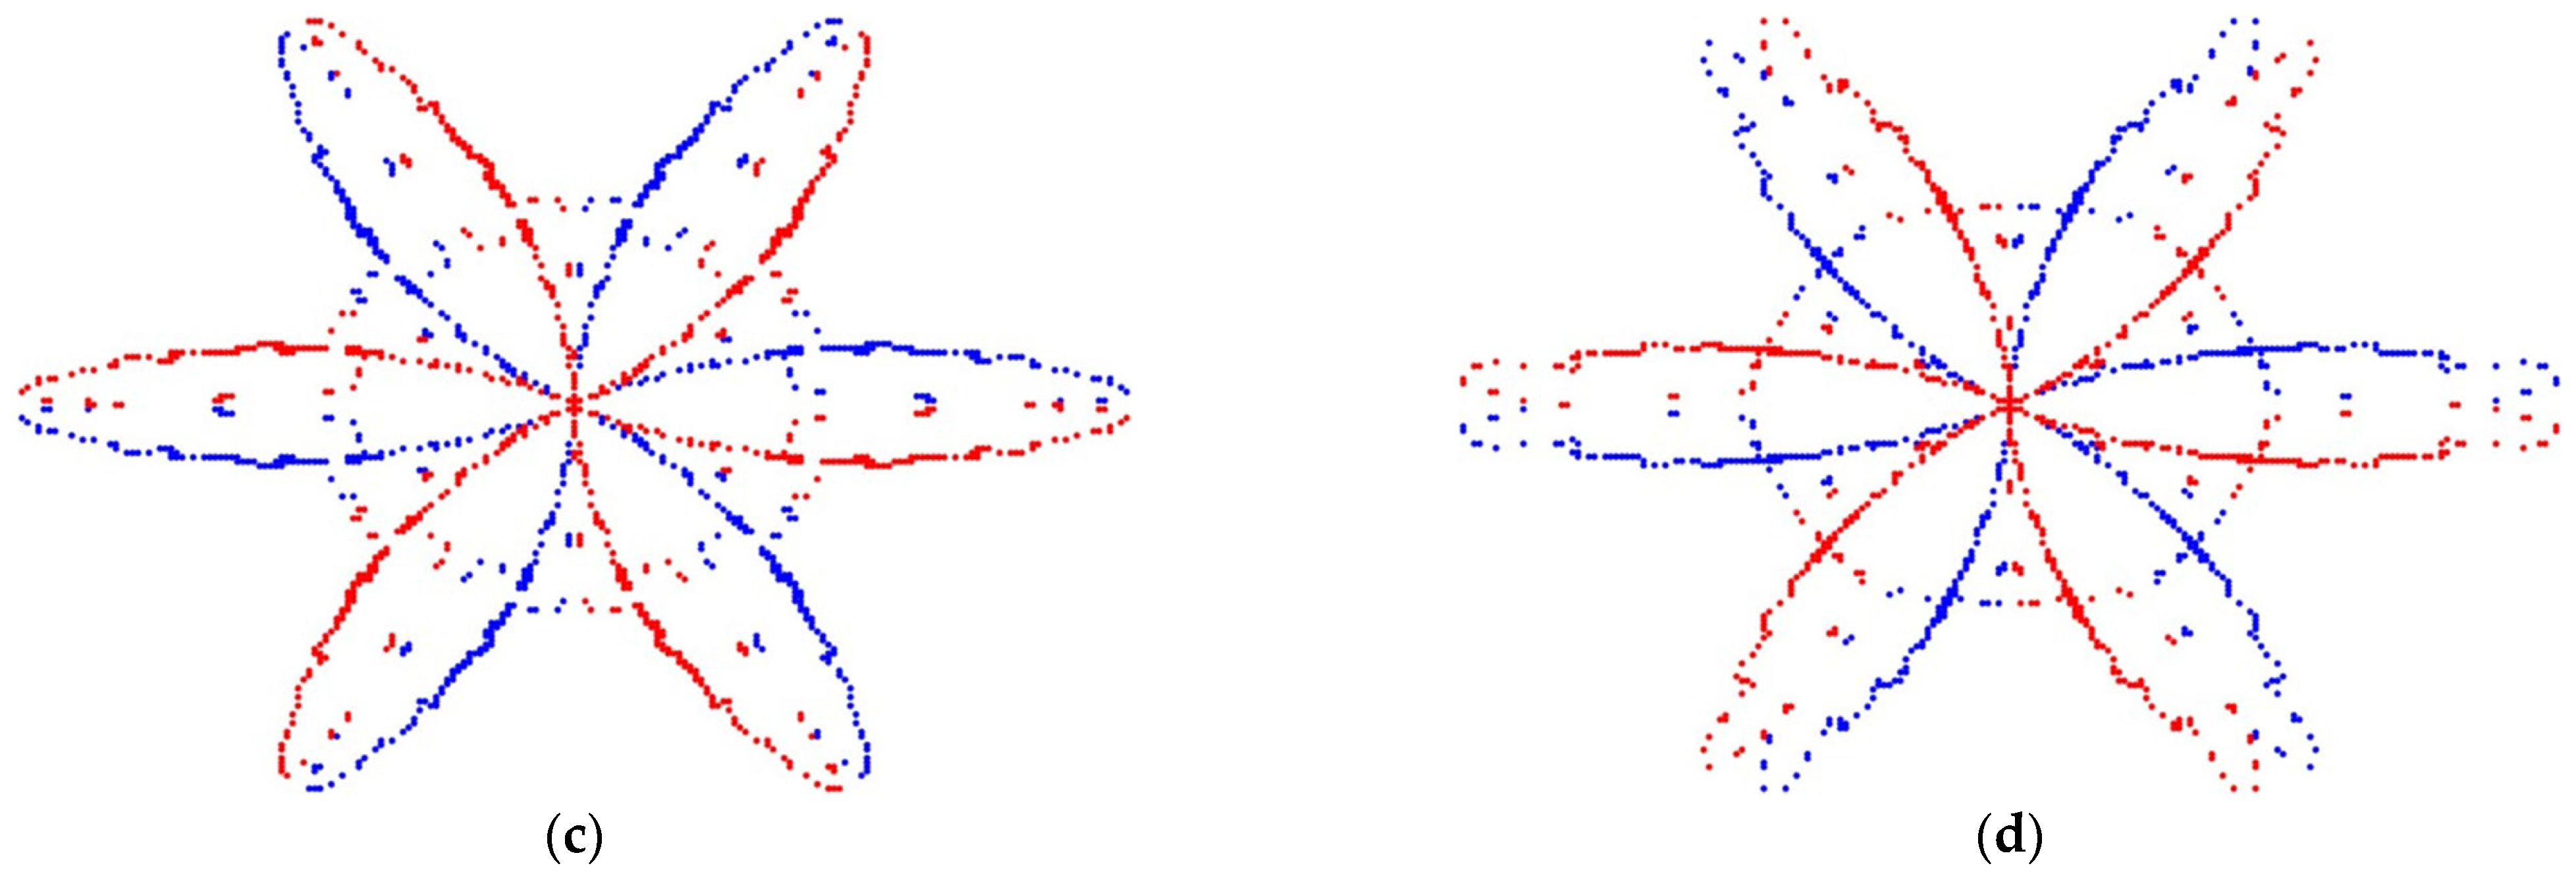
Due to the similarity between the signals of bypass diode failure (Type 4) and normal condition (Type 1), extended observation is required to discern voltage differences. Figure 12 shows the patterns generated by SDP processing of the raw signals for Type 1 and Type 4, revealing distinct differences. Type 1 features two concentric circles with a more densely distributed set of data points, while Type 4 has only one concentric circle with a sparser distribution of data points. Therefore, using SDP can transform less apparent time–domain waveforms into more distinctly varying snowflake patterns, facilitating further fault diagnosis.
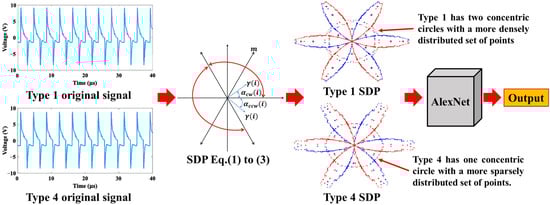
Figure 12.
Schematic diagram of the differences in snowflake pattern between Type 1 and Type 4.
4.3. Recognition Results of AlexNet
This research employed the AlexNet architecture, comprising five convolutional layers, three fully connected layers, and pooling layers utilizing the ReLU activation function and Max Pooling filters.
The objective of this study was to utilize this architecture for identifying fault types in photovoltaic modules. MATLAB 2020b software was used with a 12th Gen Intel(R) Core(TM) i7-12700 CPU @ 2.1 GHz processor, NVIDIA GeForce RTX 2060 graphics card, and Windows Professional 64-bit operating system.
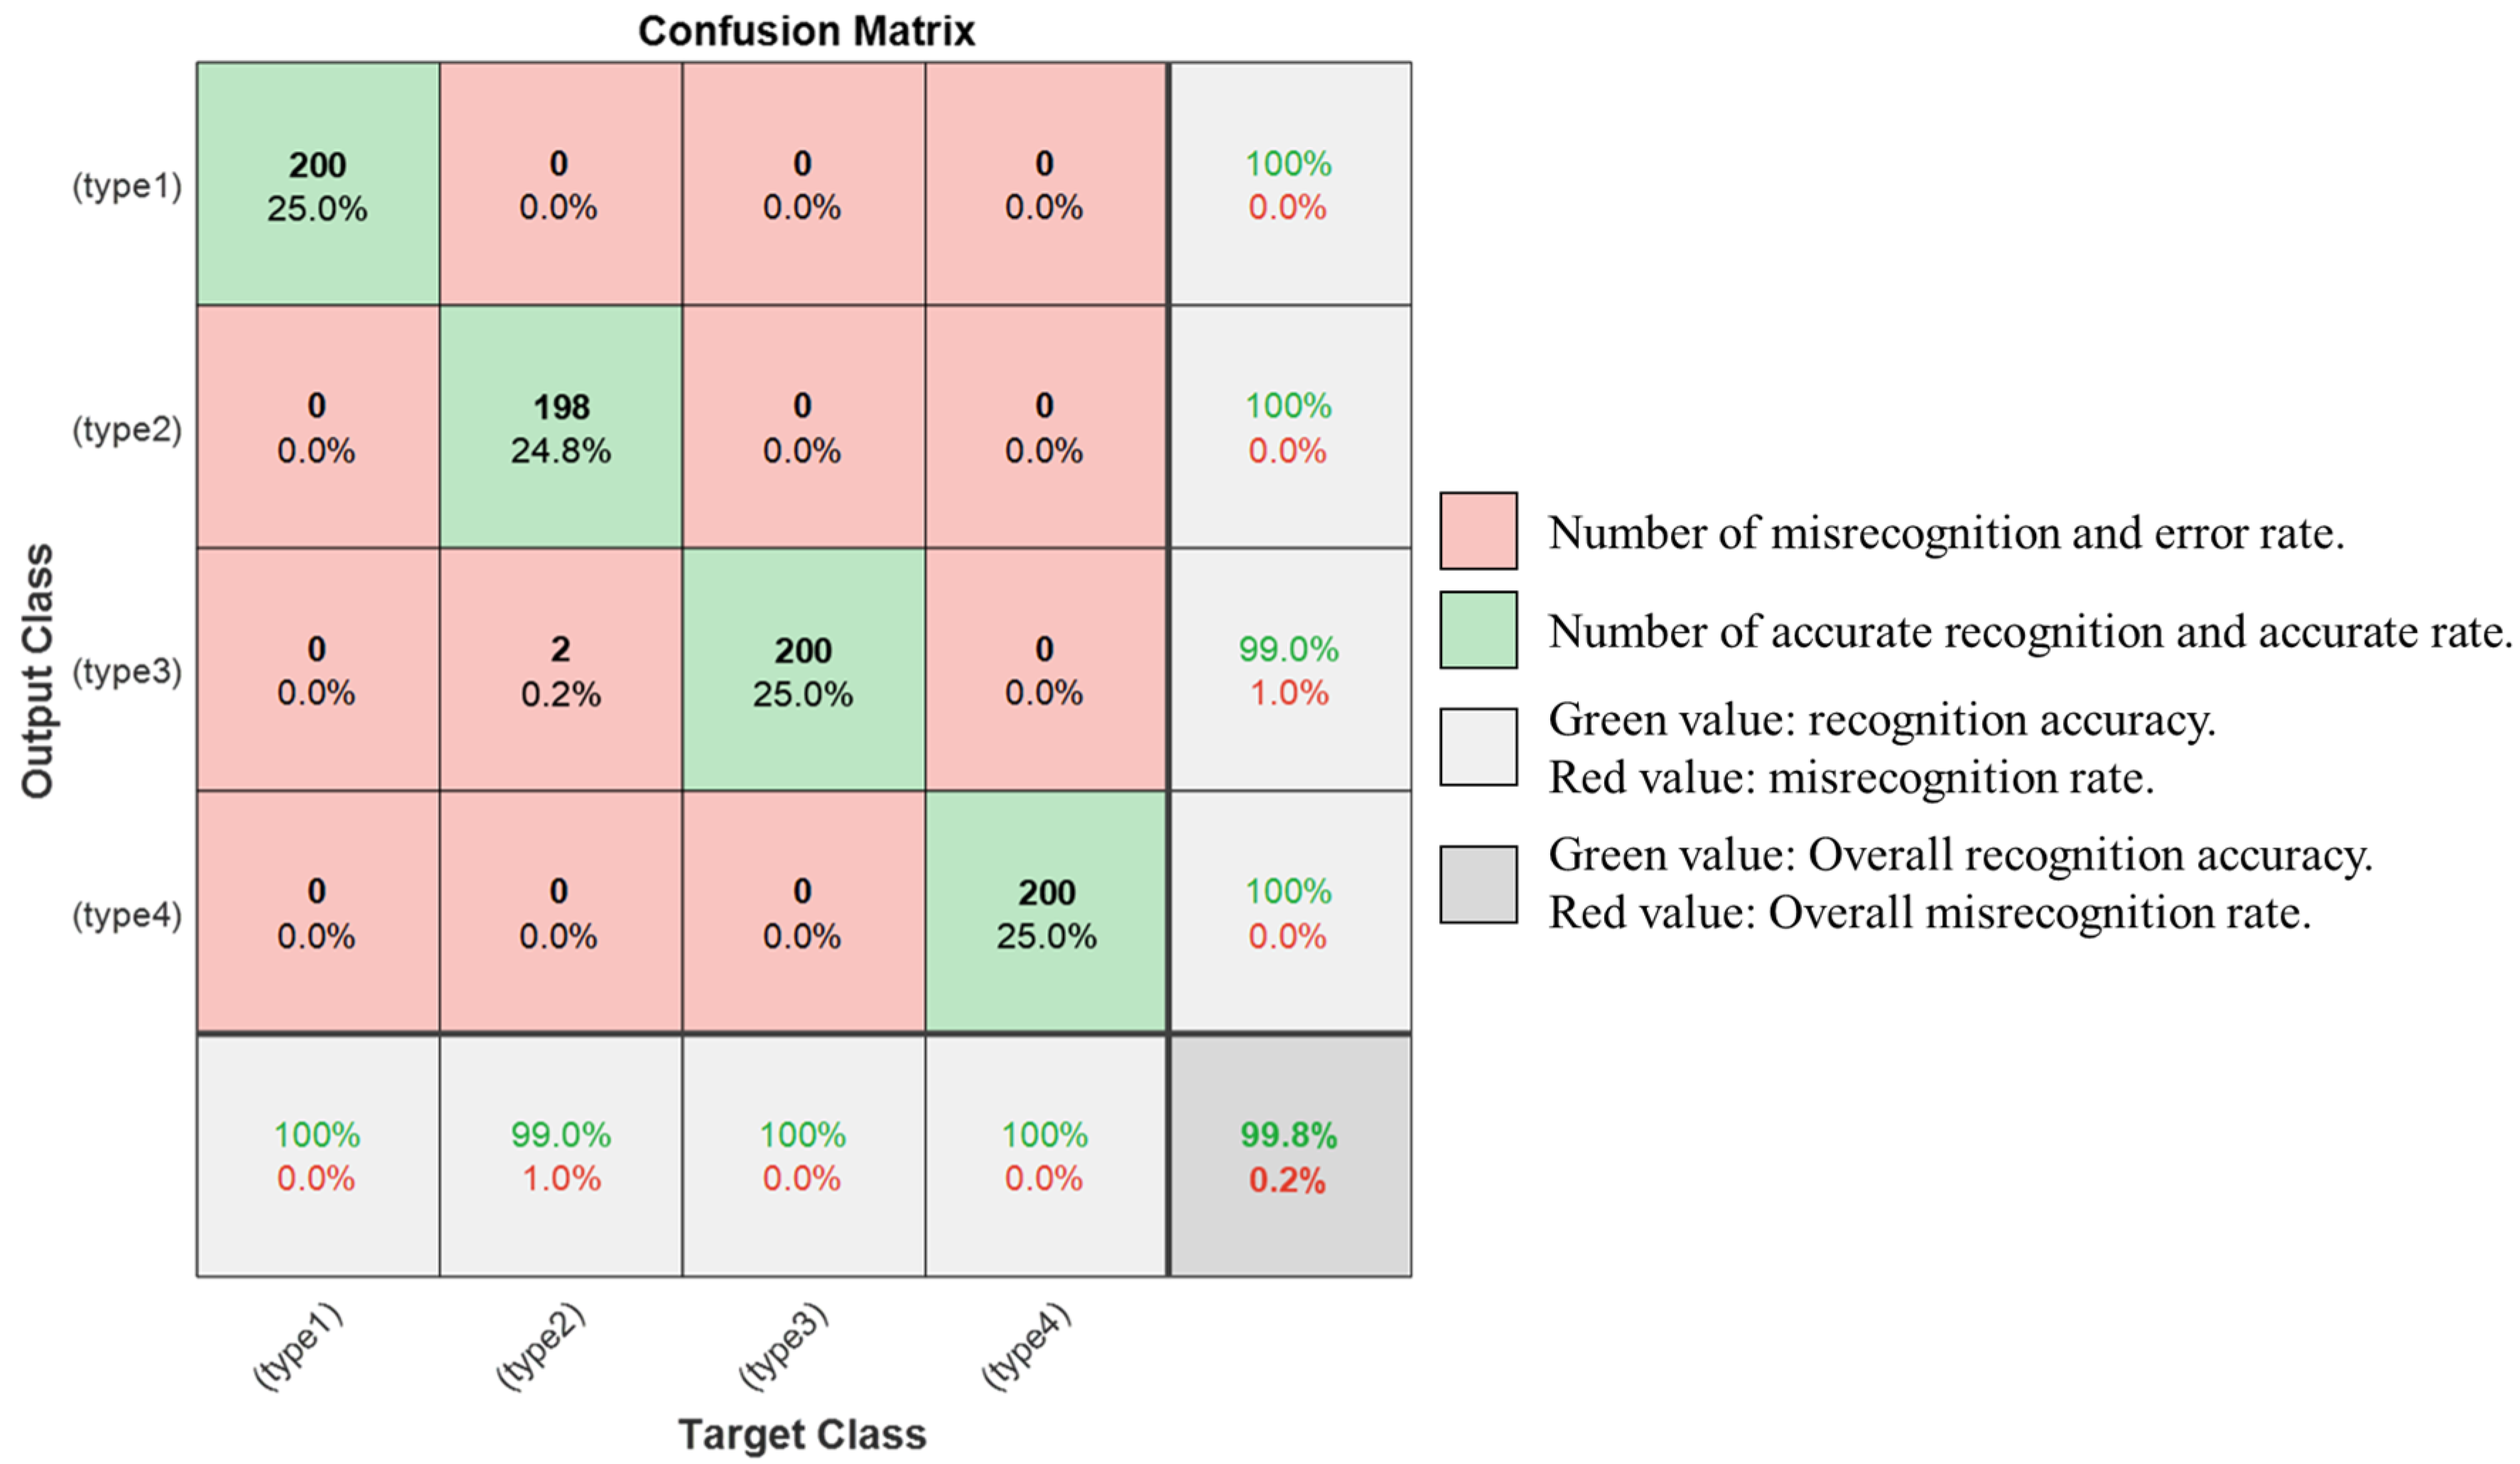
Further, the AlexNet neural network model was used to recognize photovoltaic modules in this study, with feature snowflake images serving as identification samples. In training the AlexNet model for fault type identification in photovoltaic modules, 3200 feature snowflake images were used, with each fault type containing 800 samples. Moreover, 800 feature snowflake images were employed for testing—with each fault type comprising 200 samples—to assess the recognition capability of the AlexNet model for different fault types in photovoltaic modules. As depicted in Figure 13, this method demonstrated efficient classification of various fault types in photovoltaic modules, achieving a recognition accuracy of 99.8%.
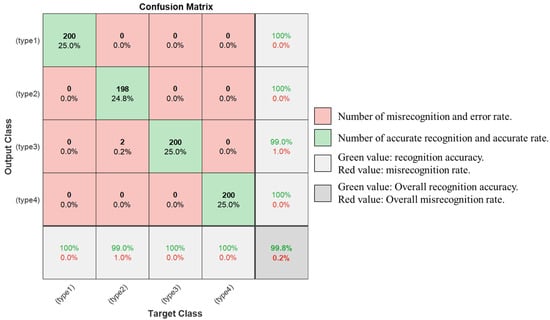
Figure 13.
Confusion matrix for AlexNet-based fault diagnosis of solar photovoltaic modules.
This study compares the recognition performance of AlexNet and traditional image recognition methods in identifying different types of faults in photovoltaic solar modules. The results are shown in Table 2. In particular, the fault recognition accuracy for SDP+AlexNet is 99.8%, 99.5% for SDP+CNN, 93.8% for SDP+HOG+SVM, 91.75% for SDP+HOG+ENN, and 90.9% for SDP+HOG+BPNN. These results indicate that, compared to AlexNet, CNN’s accuracy is slightly lower by 0.3 percentage points, SDP+HOG+SVM’s accuracy is significantly lower by 6 percentage points, and SDP+HOG+ENN’s accuracy is significantly lower by 8.05 percentage points.
Table 2.
Performance comparison between AlexNet and conventional detection methods.
In terms of training time, SDP+AlexNet completed training in 143 s, while SDP+CNN took 181 s, 38 s faster than AlexNet. SDP+HOG+SVM was the quickest among all algorithms, completing its training in just 10.7 s. SDP+HOG+ENN took the longest time, with a training duration of 3518 s, followed by SDP+HOG+BPNN at 243 s. As for testing time, both deep-learning algorithms demonstrated rapid testing durations. However, AlexNet was 12 times faster in testing time than CNN and 45.5 times faster than SDP+HOG+SVM. SDP+HOG+ENN required 1.63 s for testing, while SDP+HOG+BPNN needed 1.12 s. Combining SDP with AlexNet yields the best results in terms of recognition accuracy, training time, and testing time.
Additionally, the recognition accuracy in Ref [14] is lower than the methods presented in this study because their approach relies on numerical recognition, where feature values have to be manually set and are constrained by the weight values of the neural network, making it more time consuming and less accurate. Meanwhile, our study employs image recognition. After inputting feature maps into the neural network, it automatically searches for their features and classifies them based on the characteristics of its own algorithms. As a result, our method requires less time and achieves higher accuracy.
5. Conclusions
This research aimed to conduct defect detection in solar photovoltaic modules. In solar photovoltaic systems, the modules often serve as a major source of faults. Therefore, this study designed four common types of defects in solar photovoltaic modules for detection. This study compares the detection performance of five algorithms, namely, three machine learning, SDP+HOG+SVM, SDP+HOG+ENN, and SDP+HOG+BPNN, and two deep learning, SDP+CNN and SDP+AlexNet. Simultaneously, it compares with specific references regarding the fault diagnosis of PV modules, improving upon the shortcomings of the original numerical recognition methods.
The test results indicate that utilizing SDP combined with AlexNet for defect detection in PV modules achieves an accuracy rate as high as 99.8%, surpassing CNN and traditional methods like SVM, ENN, and BPNN. Although SDP+HOG+SVM has the fastest training time, training time is not the primary consideration. Therefore, these results validate the effectiveness of the method proposed in this study. Although the accuracy of SDP+AlexNet improved by only 0.3% compared to SDP+CNN, it outperforms SDP+CNN in both training and testing time, being faster by 38 s and 0.22 s, respectively. The reason for the inaccuracy of SDP+HOG+ENN is constrained by the neural network model of ENN. Features are input into ENN, and the output results are determined by the weights within the ENN model. The range of these weights is relatively large, making it difficult to achieve good performance within a limited number of epochs.
Finally, this study transforms signals with subtle changes into more noticeably varying snowflake diagrams. These graphs are then input into AlexNet, which is fast in both training and testing, for fault diagnosis. The results have confirmed the practicality of the proposed method.
Author Contributions
Conceptualization, M.-H.W. and C.-C.K.; methodology, M.-H.W.; software, C.-C.H. and Z.-H.L.; formal analysis, C.-C.H. and Z.-H.L.; investigation, C.-C.H. and Z.-H.L.; resources, M.-H.W. and S.-D.L.; writing—original draft, C.-C.H.; writing—review & editing, M.-H.W. and S.-D.L.; visualization, S.-D.L.; supervision, M.-H.W., S.-D.L. and C.-C.K.; project administration, M.-H.W. and S.-D.L. All authors have read and agreed to the published version of the manuscript.
Funding
The authors gratefully acknowledge the financial support of the National Science and Technology Council of Taiwan, under contract number: NSTC 110-2221-E-167-008-MY3.
Data Availability Statement
Data are contained within the article.
Conflicts of Interest
The authors declare no conflict of interest.
References
- Barki, D.; Prasad, N.R.; Popuri, S.; Reddy, Y.; Prasad, D.V.B.; Madan, G. Root-cause and Failure Analysis of Solar modules in a Solar Power Plant. In Proceedings of the 2020 47th IEEE Photovoltaic Specialists Conference (PVSC), Calgary, AB, Canada, 15 June–21 August 2020. [Google Scholar]
- Lv, R.; Tang, J.; Jaubert, J.N.; Xing, G. Highly Accelerated Thermal Cycling Test for New Type of Crystalline Silicon Photovoltaic Modules. In Proceedings of the 2019 IEEE 46th Photovoltaic Specialists Conference (PVSC), Chicago, IL, USA, 16–21 June 2019. [Google Scholar]
- Predan, F.; Franke, A.; Hoehn, O.; Lackner, D.; Helmers, H.; Siefer, G.; Bett, A.W.; Dimroth, F. Wafer-bonded GaInP/GaAs/GaInAs//GaSb Four-Junction Solar Cells with 43.8% Efficiency under Concentration. In Proceedings of the 2020 47th IEEE Photovoltaic Specialists Conference (PVSC), Calgary, AB, Canada, 15 June–21 August 2020. [Google Scholar]
- Golive, Y.R.; Zachariah, S.; Bhaduri, S.; Dubey, R.; Chattopadhyay, S.; Singh, H.K.; Kottantharayil, A.; Shiradkar, N.; Vasi, J. Analysis and Failure Modes of Highly Degraded PV Modules Inspected during the 2018 All India Survey of PV Module Reliability. In Proceedings of the 2020 4th IEEE Electron Devices Technology & Manufacturing Conference (EDTM), Penang, Malaysia, 6–21 April 2020. [Google Scholar]
- Zhang, J.; Ai, C.; Zheng, Z.; Ding, K.; Chen, X.; Liu, Y.; Chen, L. Module-Level Fault Diagnosis of Photovoltaic Array based on Wireless Sensor Networks and Inverter Activated I–V Scanning. In Proceedings of the 2022 IEEE 5th International Electrical and Energy Conference (CIEEC), Nangjing, China, 27–29 May 2022. [Google Scholar]
- Ciani, L.; Cristaldi, L.; Faifer, M.; Lazzaroni, M.; Rossi, M. Design and Implementation of a On-Board Device for Photovoltaic Panels Monitoring. In Proceedings of the 2013 IEEE International Instrumentation and Measurement Technology Conference (I2MTC), Minneapolis, MN, USA, 6–9 May 2013. [Google Scholar]
- Chine, W.; Mellit, A.; Pavan, A.M.; Lughi, V. Fault Diagnosis in Photovoltaic Arrays. In Proceedings of the 2015 International Conference on Clean Electrical Power (ICCEP), Taormina, Italy, 16–18 June 2015. [Google Scholar]
- Otamendi, U.; Martinez, I.; Quartulli, M.; Olaizola, I.G.; Viles, E.; Cambarau, W. Segmentation of Cell-Level Anomalies in Electroluminescence Images of Photovoltaic Modules. Sol. Energy 2021, 220, 914–926. [Google Scholar] [CrossRef]
- Mellit, A.; Kalogirou, S. Artificial Intelligence and Internet of Things to Improve Efficacy of Diagnosis and Remote Sensing of Solar Photovoltaic Systems: Challenges, Recommendations and Future Directions. Renew. Sustain. Energy Rev. 2021, 143, 110889. [Google Scholar] [CrossRef]
- Alves, R.H.F.; de Deus Junior, G.A.; Marra, E.G.; Lemos, R.P. Automatic Fault Classification in Photovoltaic Modules Using Convolutional Neural Networks. Renew. Energy 2021, 179, 502–516. [Google Scholar] [CrossRef]
- Ali, M.U.; Khan, H.F.; Masud, M.; Kallu, K.D.; Zafar, A. A Machine Learning Framework to Identify the Hotspot in Photovoltaic Module Using Infrared Thermography. Renew. Energy 2021, 208, 643–651. [Google Scholar] [CrossRef]
- Chouay, Y.; Ouassaid, M. An intelligent method for fault diagnosis in photovoltaic systems. In Proceedings of the 2017 International Conference on Electrical and Information Technologies (ICEIT), Rabat, Morocco, 15–18 November 2017. [Google Scholar]
- Juan, R.O.S.; Kim, J. Photovoltaic Cell Defect Detection Model based-on Extracted Electroluminescence Images using SVM Classifier. In Proceedings of the 2020 International Conference on Artificial Intelligence in Information and Communication (ICAIIC), Fukuoka, Japan, 19–21 February 2020. [Google Scholar]
- Lu, S.D.; Wei, S.E.; Wang, M.H.; Sian, H.W.; Kuo, C.C. Hybrid Methodology Based on Extension Neural Network for Fault Diagnosis of Photovoltaic Module. Sens. Mater. 2021, 33, 2925–2941. [Google Scholar] [CrossRef]
- Lu, S.-D.; Wang, M.-H.; Wei, S.-E.; Liu, H.-D.; Wu, C.-C. Photovoltaic Module Fault Detection Based on a Convolutional Neural Network. Processes 2021, 9, 1635. [Google Scholar] [CrossRef]
- Li, L.; Lu, N.; Jiang, H.; Qin, J. Impact of Deep Convolutional Neural Network Structure on Photovoltaic Array Extraction from High Spatial Resolution Remote Sensing Images. Remote Sens. 2023, 15, 4554. [Google Scholar] [CrossRef]
- Chen, H.; Zhang, A.; Gong, C.; Liang, W.; Wang, Z. Fault Diagnosis Method for Photovoltaic Panels Based on Improved ShuffleNet V2 and Infrared Images. In Proceedings of the 2022 7th International Conference on Power and Renewable Energy (ICPRE), Shanghai, China, 23–26 September 2022. [Google Scholar]
- Fan, X.; Deng, S.; Wu, Z.; Fan, J.; Zhou, C. Spatial Domain Image Fusion with Particle Swarm Optimization and Lightweight AlexNet for Robotic Fish Sensor Fault Diagnosis. Biomimetics 2023, 8, 489. [Google Scholar] [CrossRef] [PubMed]
- Sun, S.; Zhang, T.; Li, Q.; Wang, J.; Zhang, W.; Wen, Z.; Tang, Y. Fault Diagnosis of Conventional Circuit Breaker Contact System Based on Time–Frequency Analysis and Improved AlexNet. IEEE Trans. Instrum. Meas. 2021, 70, 3508512. [Google Scholar] [CrossRef]
- Mohiuddin, M.; Islam, M.S.; Islam, S.; Miah, M.S.; Niu, M.-B. Intelligent Fault Diagnosis of Rolling Element Bearings Based on Modified AlexNet. Sensors 2023, 23, 7764. [Google Scholar] [CrossRef] [PubMed]
- Lu, H.; Zhao, X.; Tao, B.; Yin, Z. Online Process Monitoring Based on Vibration-Surface Quality Map for Robotic Grinding. IEEE/ASME Trans. Mechatron. 2020, 25, 2882–2892. [Google Scholar] [CrossRef]
- Tan, J.C.; Lim, K.M.; Lee, C.P. Enhanced AlexNet with Super-Resolution for Low-Resolution Face Recognition. In Proceedings of the 2021 9th International Conference on Information and Communication Technology (ICoICT), Yogyakarta, Indonesia, 3–5 August 2021. [Google Scholar]
- Shrestha, S.M.; Mallineni, J.K.; Yedidi, K.R.; Knisely, B.; Tatapudi, S.; Kuitche, J.; TamizhMani, G. Determination of Dominant Failure Modes Using FMECA on the Field Deployed c-Si Modules under Hot-Dry Desert Climate. IEEE J. Photovolt. 2015, 5, 174–182. [Google Scholar] [CrossRef]
- Tatapudi, S.; Libby, C.; Raupp, C.; Srinivasan, D.; Kuitche, J.; Bicer, B.; TamizhMani, G. Defect and Safety Inspection of 6 PV Technologies from 56,000 Modules Representing 257,000 Modules in 4 Climatic Regions of the United States. In Proceedings of the 2016 IEEE 43rd Photovoltaic Specialists Conference (PVSC), Portland, OR, USA, 5–10 June 2016. [Google Scholar]
- Brooks, A.E.; Cormode, D.; Cronin, A.D.; Kam-Lum, E. PV System Power Loss and Module Damage Due to Partial Shade and Bypass Diode Failure Depend on Cell Behavior in Reverse Bias. In Proceedings of the 2015 IEEE 42nd Photovoltaic Specialist Conference (PVSC), New Orleans, LA, USA, 14–19 June 2015. [Google Scholar]
- Yang, J.; Yan, R. A Multidimensional Feature Extraction and Selection Method for ECG Arrhythmias Classification. IEEE Sens. J. 2021, 21, 14180–14190. [Google Scholar] [CrossRef]
- Wang, H.; Xu, J.; Yan, R. Bearing Fault Diagnosis Based on Visual Symmetrized Dot Pattern and CNNs. In Proceedings of the 2019 IEEE International Instrumentation and Measurement Technology Conference (I2MTC), Auckland, New Zealand, 20–23 May 2019. [Google Scholar]
- Zhu, X.; Zhao, J.; Hou, D.; Han, Z. An SDP Characteristic Information Fusion-Based CNN Vibration Fault Diagnosis Method. Shock Vib. 2019, 2019, 3926963. [Google Scholar] [CrossRef]
- Wang, M.-H.; Chen, F.-H.; Lu, S.-D. Research on Fault Diagnosis of Wind Turbine Gearbox with Snowflake Graph and Deep Learning Algorithm. Appl. Sci. 2023, 13, 1416. [Google Scholar] [CrossRef]
- Wang, M.-H.; Lu, S.-D.; Hung, C.-C. Application of Deep Learning and Symmetrized Dot Pattern to Detect Surge Arrester Status. Appl. Sci. 2022, 12, 650. [Google Scholar] [CrossRef]
- Mahesh, S.; Ramkuma, G.; Anjaneyulu, K. Smart Face Detection and Recognition in Pose Variant Images Using Alexnet CNN Compare Accuracy With SVM. In Proceedings of the 2022 International Conference on Cyber Resilience (ICCR), Dubai, United Arab Emirates, 6–7 October 2022. [Google Scholar]
- Agarwal, A.; Patni, K.; Rajeswari, D. Lung Cancer Detection and Classification Based on Alexnet CNN. In Proceedings of the 2021 6th International Conference on Communication and Electronics Systems (ICCES), Coimbatre, India, 8–10 July 2021. [Google Scholar]
- Ma, Z.; Liu, B.; Tang, R. GIS Mechanical Fault Diagnosis and Test Analysis Based on S Transform-SVM-AlexNet Model. In Proceedings of the 2020 12th IEEE PES Asia-Pacific Power and Energy Engineering Conference (APPEEC), Nanjing, China, 20–23 September 2020. [Google Scholar]


Disclaimer/Publisher’s Note: The statements, opinions and data contained in all publications are solely those of the individual author(s) and contributor(s) and not of MDPI and/or the editor(s). MDPI and/or the editor(s) disclaim responsibility for any injury to people or property resulting from any ideas, methods, instructions or products referred to in the content. |
© 2023 by the authors. Licensee MDPI, Basel, Switzerland. This article is an open access article distributed under the terms and conditions of the Creative Commons Attribution (CC BY) license (https://creativecommons.org/licenses/by/4.0/).