Abstract
At least 24 liquefied natural gas (LNG) rollover incidents have been reported since 1960. During rollover, because of the heat ingress through the tank walls, a stratified LNG may be suddenly homogenized while releasing massive amounts of vapor. It can result in an overpressure in the tank and significant amounts of potentially explosive LNG vapor being vented out. Both of these factors represent considerable hazards. Rollover is a physical mixing process in a single tank with two or more different cells of LNG of different compositions, temperatures, and densities that can manifest in large boil-off rates. It can exceed venting equipment capacities, and vapor pressure in tank increases rapidly and in extreme cases can lead to tank damage. This paper presents numerical approach for determination of time of rollover occurrence in storage tank. The presented model is based on the energy balance of the stratified cryogenic liquid and the gas phase as separate three thermodynamic systems in the storage tank. As a result of proposed model, for the adopted assumptions and cylindrical tank volume of 78,500 m3, the approximate time of the rollover occurrence was determined for two cases. In the first case, for heavier LNG, the rollover phenomenon will occur 193.25 h after the start of the calculations from the assumed initial conditions. In the second case, for light LNG with a higher initial liquid level in the tank, the rollover will occur after 150.25 h.
1. Introduction
The role of liquefied natural gas (LNG) over the last few decades has grown as a key alternative for reduction of greenhouse gas emissions from solid fuels in the future. The clear development of the LNG market is possible through the ability to change the volume of natural gas after liquefaction and reduce it by 600 times, which is also the main advantage of LNG in the process of storage and transport. The demand for LNG is expected to increase in the next 20 years [1]. The first estimates indicate that the COVID-19 pandemic also did not hit the LNG sector in the long term. On the other hand, new geopolitical conflicts, in particular those involving significant traditional suppliers (e.g., Russia) of natural gas, cause natural gas consumers are rapidly looking for other sources of this fuel. LNG in particular is considered in this case as the most advantageous alternative as stable source of natural gas deliveries. The development of the LNG market results in an increase in LNG supplies (from 270 Mtonnes LNG in 2016 to 389.2 Mtonnes in 2022), which launches new sources of this fuel (especially in the US).
LNG delivered from different sources has different composition and, consequently, various physical and quality properties. A consequence of diversity of LNG sources is the need to store LNG with different compositions in the same terminal, in the same tanks. Density variability of LNG available on the market causes certain technological problems in the process of its storage. Slight differences in LNG density, even less than 2–4 kg/m3 (min. 0.5–1%) may disturb the stability of the storage process. Incorrect management of the storage process may lead to the stratification of the cryogenic liquid in the tank. The consequences of undetected liquid stratification in the tank may cause severe damage of a storage tank which is not properly secured. When liquid stratification occurs, free evaporation from the bottom layer of LNG is not possible, as a consequence of its increase of temperature and decrease of density. When the density of the bottom layer equalizes to that of the top layer, the LNG in the tank will mix rapidly with the evaporation of significant amounts of overheated LNG from the bottom layer. This phenomena is called rollover.
Only 24 rollovers incidents were reported by the GIIGNL group [2] from the last 60 year period, including the most documented incidents from La Spezia in 1971 [3] and Partington in 1993 [4]. Additionally, more recently, rollover phenomena has become a one of main issues for the rapidly developing floating storage and regasification units (FSRU) industry which has experienced more than twenty rollover incidents in a 10 year period [5]. Most of these rollovers are caused by frequent refilling of FSRU units which have limited monitoring equipment onboard the vessels compared to the onshore LNG plants [6]. Consequently, rollovers are currently considerably more frequent onboard FSRU and pose a more frequent safety risk. Rollover incidents have motivated the interest of many researchers to carry out both theoretical and experimental studies [5]. Some experiments in small scale with mixtures of Freon 11, Freon 113, and salt water conducted in 1980s by Nakano [7] and Morioka and Enya [8]. Also the rollover phenomenon was analyzed in a larger scale (about 500 m3) tank in Nantes [9]. The first several parameter models were successively developed by Chatterjee and Geist [10] and Germeles [11] to predict rollover occurrence during storage process. These research was developed on the same fundamental concepts by Heedstand and Shipman [12], Bates and Morrison [13], and Deshpande et al. [14]. These mentioned models are focused on the heat and mass transfers between bottom and top layers which are determined by empirical formulas and correlations primarily applied for pure or binary liquids. In these models impact of the hydrodynamics during rollover phenomenon is not fully appreciated. Hydrodynamic effect at the beginning of rollover is the source of the heat and mass transfers between top and bottom liquid layers, also the complexity of this multicomponent liquid has an additional influence on the course of the phenomenon. Despite some imperfections, these models are used widely in the LNG industry [5].
Rollover phenomena were observed before 1980s. Many numerical models were developed on basis of some experiments and observations of rollovers, and proposed explanation of the sequence of events leading to the situation in which the rollover phenomenon may occur [6]. Most of the authors focused on the role of the liquid separating layers with different properties and the importance of the boundary layer between the LNG layers in the storage tank [10,11,12,13,14,15,16,17,18,19,20,21,22]. It should be noticed that most of these models are based on the few well-measured rollover events that occurred during period from 1970s to end of 1990s: in La Spezia (Italy) in 1971 [3]; in Fosssur-Mer (France) in 1978 [16]; and Partington (United Kingdom) in 1993 [4]. The results of these tests and analysis performed on the basis of various models are often summarized in GIINL reports (e.g., [2,23]). Presently, the initiation process of both the stratification of the cryogenic liquid and the initiation of the rollover phenomenon itself is still not fully recognized. Despite the development of LNG technology to the mature stage, experimental research in this area is still performed [24,25,26].
The rollover models available in the open literature based on various numerical calculation methods and measured data often are not connected in results with real accidents on the occurrence time of the rollover phenomenon [14,26,27]. Most publications on the LNG storage process, including the rollover phenomenon, focus on the evaporation rate as the main indicator [28], while few studies describe the stratification process and the pressure profiles of cryogenic liquids in storage tanks [29,30,31]. The methods of heat balance and mass balance in the storage tank for describing the LNG weathering process have been described in several papers [32,33,34,35]. Pellegrini et al. proposed model does not require knowledge of the boil-off rate (BOR) as amount of evaporated gas per day, in terms of the amount of liquid volume relative to the initial volume of LNG [35]. In the case of liquid stratification in the tank and the introduction of an additional layer of liquid as a separate thermodynamic system, these methods have been used in a few research [25,28].
In recent years, a completely different approach to modelling the processes leading to the rollover phenomenon has appeared; analytical models are increasingly supplemented by numerical modelling. For example, the evolution of the rollover phenomenon was modelled using the ANSYS FLUENT program depending on different ambient temperatures [36]. Numerical simulations of the influence of the difference in density of individual layers of cryogenic liquid on the occurrence of the rollover phenomenon were considered in the work of Liu et al. [37]. A very important element of research on the rollover phenomenon is the numerical determination of the factors influencing the formation of cryogenic liquid stratification and modelling of heat and mass flow [38]. Many works use the finite elements method and computational fluid dynamics (CFD) method to model and predict the occurrence of the rollover phenomenon [5,39,40,41]. Some studies investigate the effect of the forced convection caused by the cargo tank motions from sea waves on the heat and mass transfer between LNG layers and its impact on rollover occurrence [42]. A summary and review of knowledge regarding the rollover phenomenon is presented in [43].
The main novelty of presented approach is an extension of the non-equilibrium LNG weathering model presented by Migliore et al. 2015 and 2017 [32,33,34] for a storage tank with stably stratified cryogenic liquid. This approach has not been used earlier to determine the time of the rollover phenomenon. In addition, several modifications were made in performed approach compared to the model proposed in Migliore et al. 2015 and 2017 works [32,33,34], i.e., parallel (not sequential calculations mainly used in earlier methods) execution of calculations for three computational cells (two liquid layers and a vapor phase) with simultaneously performing equilibrium calculations between the top liquid layer and the vapor phase within the iteration step. Many earlier works describe the rollover phenomenon, but there has been no model analogous or similar to the one presented in this article for determining the time of occurrence of the rollover phenomenon and the possibility of determining the physical parameters of LNG and its vapors in the tank.
2. LNG Properties and Stratification Causes
Liquefied natural gas is a cryogenic liquid stored at around temperature of 113 K (−160 °C) under the atmospheric pressure or pressure slightly above the atmospheric pressure in strongly insulated tanks. It is composed of methane (around 95% and higher for light LNG, and about 90% and less for heavy LNG). LNG also contains some amounts of heavier hydrocarbons, such as ethane, propane, butane and some traces of nitrogen (less than 1%) [9]. The composition and density of LNG depend on its source (Table 1) [44]. Due to the process of the preferential evaporation of its most volatile components (nitrogen with bubble point temperature 77 K (−196 °C) and methane with 112 K (−161 °C), respectively), the composition of LNG changes during storage and more significantly during its marine transportation [45,46,47]. As a result, both the growing number of liquefaction sites as well as the “weathering” process contribute to the diversification of LNG compositions and its properties.

Table 1.
LNG compositions from various export sources, based on [44].
Due to its physical properties, and, in particular, high sensitivity to temperature changes, LNG is very unstable. The factors influencing the instability of the gas storage process in liquefied form include (i) LNG storage for a long period, (ii) fluctuations in the composition of the stored LNG, (iii) cyclic processes of filling and emptying the storage tank, and (iv) high nitrogen content in stored LNG (above 1%) [48,49,50]. Each of these factors could contribute to the stratification of the stored LNG into two layers of different densities [4,13,51]. The risk of cryogenic fluid stratification appears when there are two separate layers with different densities. The liquid in the top, lighter layer was heated by the influx of heat from the surroundings and was evaporated. During evaporation, the changes initially concerned only the surface layer of the liquid. Light hydrocarbons evaporated as the most volatile ones, which resulted in changes in the composition of this layer. With longer heating, changes in composition entailed significant changes in the density of the top layer. The top layer was getting heavier. The liquid in the bottom layer was also heated, but it did not evaporate because the hydrostatic pressure exerted by the top layer increased the temperature of the bubble point. As a result of this process, the lower layer became warmer and warmer and at the same time its density decreased.
3. LNG Stratification and Rollover
Rollover occurs in stratified fluids as a result of fill-induced stratification or an auto-stratification. Fill-induced stratification (as the most often cause of stratification leading to rollover occurrence) is caused by loading of a new LNG delivery in a tank with old LNG from previous deliveries. Stratification may occur after bottom filling an LNG with higher density than old LNG. Simple way to prevent fill-induced stratification is use the mixing effect in tank by refilling with heavier LNG from above or lighter from the bottom. An example diagram of rollover phenomenon stages is presented in Figure 1.
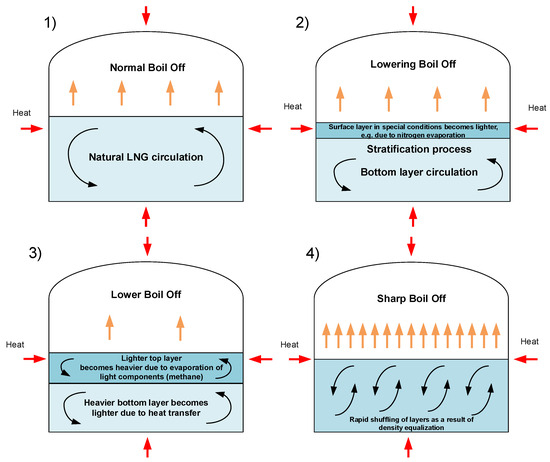
Figure 1.
Stages of process leading to rollover phenomena.
The key issue in the description of the storage process is the phenomenon of spontaneous stratification of the cryogenic liquid. The process of liquid stratification formation in the LNG storage tank has already been described in the works of Heestand and Shipman, 1983; Sarsten et al., 1972; Łaciak, 2013 [3,12,49]. In this research, the stage of cryogenic liquid stratification was omitted and the process of storing the stratified liquid in the tank until the possible occurrence of the previously discussed rollover phenomenon was analyzed. Following the occurrence of the discussed cases, the level of safety in the process of liquefied natural gas storage was significantly increased. Sensors are installed in the storage tanks that allow for the continuous monitoring of the temperature, pressure and density profiles of the stored LNG. The accepted tolerances do not allow the liquid to stratify in the tank. In a situation where, on the basis of real-time data, the system detects an unacceptable difference in the density of the liquid at different depths, special pumps are activated to mix the liquid in the storage tank. These pumps are not used continuously because natural circulation (convection) occurs in the cryogenic fluid, which causes the density of the liquid to remain almost constant throughout the vertical dimension of the tank. Natural convection consists in the exchange of heat by the movement of the liquid in the tank. Warmer layers of liquid have lower densities and are displaced upwards. If the natural convection of the liquid is disturbed, the liquid in the tank may stratify. Despite a significant improvement in the safety of the storage process, the possibility of the rollover phenomenon is still a real threat to the safe operation of the LNG unloading terminal. In recent years, available scientific publications have appeared on the subject of the rollover phenomenon, in which mainly simulation calculations related to the phenomenon itself have been presented. The analytical solutions of the stratified liquid storage process is insufficiently described.
The process leading to the rollover phenomenon is characterized by several distinct stages [6,47]. The zero stage consists of weathering processes of LNG or its incorrect filling as the causes of stratification. In this stage natural convection throughout the entire volume is slowly fading away. In stage 1, cryogenic liquid is stably stratified in LNG tank and there is only slight mass transfer between the layers due to slow diffusion and convection processes. In this stage the boil-off rate is lower in comparison to normal operational conditions. Lower layer cannot evaporate, and mass transferred to vapor phase comes from upper layer. Temperature of bottom layer increases and as a result of this process its density decreases. Stage 1 has duration of several hours to even few days, depending on many factors. Stage 2 is characterized by specific symptoms of mass transfer initiation from the bottom layer to the top layer. The first discontinuities in the boundary between the layers can be observed, the point heated LNG from the lower layer migrates to the upper layer due to lower density of heated bottom layer. Kulitsa and Wood pointed to a several processes resulting from shear-convection flow at the interface which cause this migration. The most significant of them are strengthening double-diffusive and penetrative convection cycles; mass entrainment by penetrative convection of a vertical oscillating interface layer; mechanical entrainment by penetrative convection of vertical oscillating interface layer; and mechanical entrainment of part of the bottom layer into the top layer along the tank vertical walls [6].
The tank pressure is not stable due to increasing of boil-off rate as a result of increased the top layer volume by starting migration of hotter mass from the bottom layer. BOR increase is the last warning sign before a proper rollover, in which there is rapid mixing of the layers. The duration of stage 2 typically varies from few hours to about one day, depending on differences in layers volume and density. A proper rollover is stage 3; it occurs when the densities of the top and bottom layers equalize. Simultaneously, the bottom layer has a higher temperature and higher saturation pressure, with a relatively colder top layer. This initiates rapid mixing of the entire LNG mass, but initially this process is not homogeneous. In this stage, the rapid mixing of both layers is observed with multiple increased boil-off rate (about 20 times) often exceeding the vapor phase discharge capacity from the tank. Also, the maximum pressure of all processes is measured in stage 3. Stage 3 is relatively short; its duration is about several minutes. Stage 4 is the post-rollover period with fully mixed LNG in tank. Boil-off rate and LNG temperature are stabilized. Liquefied natural gas returns to stable conditions with lower levels in storage tank and different composition in comparison to period before stratification. Stabilization process is relatively short and lasts about 1 h; after that LNG in tank is stable with natural convection started in full volume [6].
4. Analytical Prevention Model—Stable Stratification Model (SSM)
4.1. Physical Description
The purpose of this analysis is to indicate the time after which the rollover phenomenon will occur from the moment a stable stratification of the cryogenic liquid is recognized. This issue is particularly important from the storage tank operational point of view. The proposed model for determining the time of rollover occurrence is a more advanced development of the non-equilibrium LNG storage model presented by i.e., Migliore [32,33,34], in which the liquid phase and the gas phase are considered as separate systems. It follows that gas phase heats up faster than the liquid phase (due to the lower heat capacity for vapor phase in the temperature range close to the boiling point) and it is confirmed by industrial experience. Due to the faster heating of vapor phase, part of the heat will be transferred from gas phase to liquid LNG, which will accelerate the evaporation process as a result of increasing the total amount of heat supplied to the liquid. Non-equilibrium models with heat exchange between phases were proposed, among others, by Migliore et al. [32,33,34]. However, they present assumptions in which heat transferred to the tank through the roof in the developed model with heat exchange between the phases can be neglected, considering that the suspended roof with poured expanded perlite constitute an almost perfect insulating barrier. In fact, there are no ideal insulating barriers, heat flow through the roof of the storage tank is explicitly considered in the model presented in this paper.
With the proposed model the time of rollover occurrence determined from the moment of stable stratification occurrence of the tank is the most advanced development of the model with heat exchange between the phases. Hence, the proposed model name is stable stratification model (SSM). Additionally, the liquid phase is divided into two separate thermodynamic systems, which constitute individual layers formed in the stratification process. Apart from the heat transferred from the vapor phase to the top layer of the liquid phase, the heat exchanged between the bottom layer and the top layer was also included. In case of bottom layer is warmer than the top layer, it accelerates the evaporation process due to the increase in the total amount of heat supplied to the top layer of the liquid. Illustrative assumptions of the model with heat exchange between phases is presented in Figure 2.
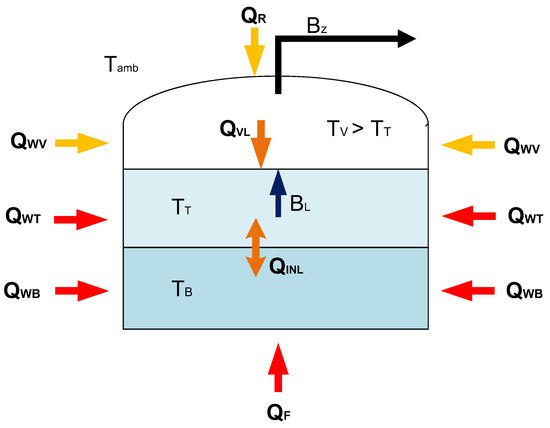
Figure 2.
Illustrative diagram of the LNG storage tank, including the stable stratification of the cryogenic liquid in the non-equilibrium model.
Convenient set of liquid–vapor equilibrium (VLE) conditions is obtained using the fugacity) of a given ingredient, which are directly related with Gibbs free energy. The use of fugacity significantly simplifies equilibrium calculations. Equilibrium conditions are described by the equality of fugacity for a given component in the liquid and gas phases:
In the general case, when considering the behavior of a real gas or liquid, the fugacity of each component is a function of both temperature and pressure. Furthermore, the fugacity of pure ingredients is usually expressed by the fugacity coefficient as defined:
The fugacity of a component in a mixture in the gas phase is described by the relationship:
for liquid phase:
where: Ci—Poynting correction factor:
After inserting Equations (3)–(5) into Equation (1), the transformed equation for equilibrium conditions (VLE equilibrium state) is obtained:
where is the fugacity coefficient (defined as the ratio of fugacity to pressure), x is the liquid composition (assumed equal to the liquid subsystem composition and provided as input to the VLE calculations), y denotes the composition of the vapor phase (evaporated gas from liquid phase) at the near-liquid vapor layer (film layer) (which is mixed with the vapor subsystem), psat is the saturation pressure, whereas T denotes temperature of the liquid and vapor subsystems in the film interface under saturation pressure.
In the presented model, the process of liquid stratification formation in the storage tank itself is not investigated; this process is well described in the literature of Łaciak, 2013 [49]; Bates and Morrison, 1997 [13]; Heestand and Shipman, 1983 [12]. Therefore the height of bottom and top layers is a model parameter that must be known in advance. The proposed model assumes that the stratification process has already ended and that the liquid in the tank is stably stratified. The model determines the time of the rollover occurrence and changes in the parameters of the stratified liquid layers and the gas phase.
Equation (7) describes the energy balance of the storage tank in the storage process. In the analyzed model, including liquid stratification, Equation (7) should also include the division of the liquid phase into two separate components corresponding to each of the layers. The solution of Equation (7) is obtained analogously by means of numerical methods of the Euler method. The heat balance of the entire tank is as follows:
In the case of the stratification model, it should be assumed that the gas phase and the layers of the liquid phase constitute separate thermodynamic systems. The heat input through the side walls should be considered separately for the gas phase (8) and the top layer (9) and the bottom layer (10) of the liquid phase:
Modelling of the LNG storage process with a stable liquid stratification in the tank in a given time interval is performed in a given time step by separately determining the energy balance for both layers of the liquid phase and the LNG vapors in the tank, including the heat input to each of the phases in the considered time step. Under this model, the calculation procedure assumes a parallel solution of the energy balance for the lower layer of the liquid phase, the upper layer of the liquid phase and the gas phase. In this approach, it is necessary to determine three unknown temperatures at the end of the time step for each of the discussed systems. The proposed model procedure is innovative in relation to the known and previously proposed solutions, it is based on parallel calculations of the energy balance for three thermodynamic systems, including interactions between these systems in the form of heat exchange between the layers or evaporation from the upper layer.
Compared to the previous analysed solutions, e.g., Migliore [32], the greatest differences occur in the calculation of the energy balance of the liquid phase. In the case of the top layer, it is assumed that the liquid has a temperature close to the boiling point, therefore it is possible to perform equilibrium calculations, assuming that the amount of the gas phase at the boiling point is minimal and can be omitted in terms of the energy balance for the upper layer. The boiling point of LNG is taken as the initial temperature in the time step for the top layer. The liquid in the bottom layer has a given composition and an initial temperature lower than its boiling point. Then the heat input from the environment is determined for each of the systems. Heat is supplied to the lower layer of the liquid phase through the bottom plate, side walls to the height of the border between the bottom and top layers. The top layer is heated by the side walls from the boundary of the layers to the LNG level in the tank, heat is also transferred from the warmer vapor phase and from the bottom layer if is warmer. The heat supplied to the top layer is used for the evaporation process. As a result of the application of heat, a new thermodynamic equilibrium is established for the top layer, where part of it (BL) evaporates to the gas phase, the top layer has a new temperature at the end of the time step. The heat balance equation for the top layer is as follows:
after expanding:
where HT, hT are overall enthalpy and molar enthalpy for the liquid phase in the top layer, BL is the amount of vaporized gas, QVL—the amount of heat transferred from the gas phase, hVo—unit enthalpy of LNG vapor in the state of equilibrium, QINL—the amount of heat exchanged with the bottom layer.
For the non-evaporative bottom layer, the heat balance equation is:
after expanding:
HB, hB are overall enthalpy and molar enthalpy for the liquid phase in the bottom layer, QF—the amount of heat penetrating through the bottom of the tank, QINL—the amount of heat exchanged with the top layer.
The heat balance for the gas phase in the time interval from t = ti to t = ti+1 is defined as follows:
The temperature of the gas phase for a given height in its space is calculated using the error function [52]. This equation combines the law of heat conduction and the conservation of energy law for the gas phase:
Huerta and Vesovic presented a modernized model for determining the gas phase temperature [52], but preliminary verification with real data from the LNG storage process does not confirm the conclusions obtained in that analysis, the real temperature increase of the vapor phase in the LNG tank is higher.
With above equation it is possible to determine an approximate profile of the gas phase temperature as a function of the height in the space occupied by the gas phase at a given time step. Due to the fact that the gas phase is cooled by the colder liquid phase, it is necessary to determine an average temperature representative for the determination of the heat balance, which, as mentioned above, will be its solution. Figure 3 shows the temperature distribution in the storage tank with included temperature profile of the vapor phase for assumed calculations variants. To determine the average temperature of vapor phase, the trapezoidal numerical integration method was used, where the integration was performed by Equation (18). The height of the space occupied by the gas phase zV was divided into a given number of integration intervals.
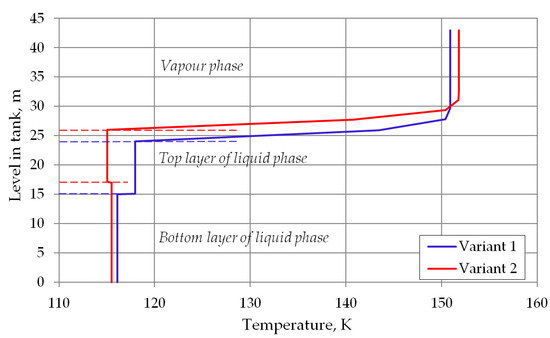
Figure 3.
Temperature profile in storage tank with stable stratified cryogenic liquid.
The result of the integration is the average temperature of the gas phase in a given time step. After determining the average temperature, it is possible to determine the amount of heat transferred from the gas phase to the liquid phase QVL:
where CpV is the specific heat of the gas phase, TVi is the temperature of the gas phase at the beginning of the time step, TVav is the temperature of the gas phase at the end of the time step.
4.2. Model Algorithm
The presented model algorithm for determination of time of rollover occurrence includes the interphase heat exchange. An integrated calculation procedure combining the energy balance of the system with equilibrium calculations for a given time step to calculate changes in thermodynamic parameters of the liquid and gas phases and the amount of evaporated LNG.
The solution of the heat balance of the gas phase is fulfilled only by a temperature at the end of the iterative step. The initial temperature of the gas phase at the beginning of the first iteration step is taken as equal to the boiling point of LNG. This approach corresponds to industrial experience from the storage of liquefied natural gas, where immediately after each filling of the storage tank, the temperature of the vapor phase is close to the temperature of LNG.
As mentioned earlier, in the stratification model, apart from the assumptions analogous to the model with heat exchange between phases, the division of the liquid phase into top and bottom layers was included. Therefore, the calculations for the gas phase and the two layers of the liquid phase must be performed in parallel. The estimation of three interdependent quantities, i.e., the new boiling point of the top LNG layer and the new temperature of the bottom LNG layer, as well as the new temperature of LNG vapors results is necessary to perform non-linear system of equations including numerical equilibrium calculations solved for each time step.
Similarly, the temperature of the vapor phase is calculated first, then the amount of heat transferred from the vapor phase to the liquid top layer is calculated by solving the heat balance equation for the vapor phase. In the next step, the new boiling point temperature is determined based on the heat balance of the liquid top layer corrected by the heat supplied from vapor phase. At the same time, calculations of the heat balance for the bottom layer of the liquid phase are performed and the amount of heat transferred between the layers is determined. The algorithm for the stratification model presented in Figure 4 contains, similarly to the variant of non-equilibrium model, an integrated calculation procedure combining the energy balance of the system with equilibrium calculations using REFPROP 9.0 libraries for a given time step.
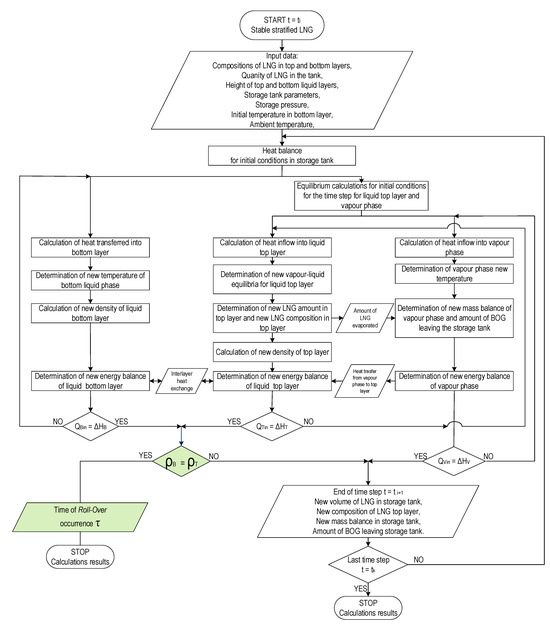
Figure 4.
Algorithm of Stable Stratification Model (SSM) for prediction the time of rollover occurrence.
The description of the calculation algorithm for the stable stratification model (SSM) according to the presented flowchart is presented on Figure 4. The start of the time step is indicated as ti, and the end of the time step ti+1, the computational procedure is completed when the iteration counter of the time steps reaches the value k and the end time is indicated as tk. The presented model is based on an algorithm in which input data (storage tank data, operational data, layer composition) are determined for time ti. Then, equilibrium calculations are performed for the initial state (calculation of the boiling point of the top liquid layer and the initial temperature of the vapor phase). In the next steps, subsequent calculations are performed in parallel for both layers of the liquid phase and the vapor phase, with the equilibrium calculations covering the top liquid layer and the vapor phase. The new mass balance of each layer of the liquid phase and gas phase and energy balance of these layers is checked in next steps. If the energy balance of the liquid layers, i.e., the supplied heat, is equal to the enthalpy increase, the condition of equal density of both layers of the liquid phase is checked. In the stable stratification model, the final criterion, in addition to the assumed number of time steps, is the equalization of the density of both layers of the liquid phase as a necessary condition for the rollover phenomenon. The result of calculations made using the SSM model in this case is the time of the rollover occurrence and results describing the parameters of the liquid layers (including compositions) and the gas phase in time tk.
5. Assumptions
For the presented computational model, a number of assumptions were made to reflect the normal operating conditions of a cryogenic tank with a stably stratified cryogenic liquid. The adopted assumptions can be divided into two groups, the first is the technical parameters of the storage tank (Table 2) and the second is the operational parameters of the storage process (Table 3). In case of technical parameters, it should be considered an example of the geometry of the storage tank—the model is applicable for any dimensions of the storage tank and any structure of the walls of the tank, its bottom, or roof. For operational data, the key parameters are the initial temperature of the bottom layer and the top layer of the stratified cryogenic liquid. The pressure in the storage tank, the initial level of LNG in the tank and the determination of the thickness of the layers of cryogenic liquid, as well as the molar composition of LNG in both layers (Table 3); moreover, the ambient temperature (of the air surrounding the tank and the ground) also plays a key role.
Table 2.
Selected storage tank parameters used for model development.
Table 3.
Selected operational parameters used for calculations.
The calculations were performed for two variants of the composition of the stored stratified LNG and two variants of storage pressures for the assumed time step of 6 h. The first variant was performed for heavy LNG containing a greater amount of heavier hydrocarbons, while the second variant was for light LNG with low content of heavier hydrocarbons. In the first variant, the LNG density was slightly above 450 kg/m3, and in the second variant, it was about 435 kg/m3. Differences in the density between top and bottom layers for both variants are approx. 1.5 kg/m3. The presented calculations assume a stably stratified liquid in the storage tank, the composition and physical properties of individual layers are described in Table 3.
6. Results and Discussion
This section presents the results of analytical modelling of a stably stratified cryogenic liquid in storage tank with use the developed SSM model. The presented analysis covers the changes:
- (1)
- densities of top and bottom layers;
- (2)
- temperatures of the bottom layer and the top layer of LNG;
- (3)
- vapor phase temperature;
- (4)
- boil off rate (BOR);
- (5)
- thicknesses of bottom and top layers;
- (6)
- heat transferred into storage tank and between phases and layers in tank.
In the SSM model, calculations are completed at the time of the basic requirement of the rollover phenomenon, i.e., the equalization of the densities of both liquid layers in the tank. In both of these cases, the initial temperature of the bottom layer is entered in the model as assumed value. Temperature of top layer is a result of vapor–liquid equilibrium calculations. An important issue in the adopted calculation assumptions is the heat exchange between the top and bottom layers. In most cases, the temperatures of the each layer is different, it translates into heat transfer from the layer with the higher temperature to the layer with the lower temperature. The temperature difference between the layers is insignificant, up to a few Kelvin, but the lack of a thermal barrier between the layers means that the amount of heat transferred is significant. The heat transfer coefficient between the layers was determined from the equation [25]:
where C′—correlation coefficient, ρB—density of bottom layer, ρT—density of top layer, ν—kinematic viscosity.
Figure 5 and Figure 6 show the changes in LNG density in the bottom and in the top layer. In the first analyzed case, the top layer does not contain nitrogen, so its density will increase due to the evaporation of the lightest hydrocarbon component, i.e., methane. In the second variant, a residual amount of nitrogen remains in the top layer so that in the first hours of the simulation, the density of the top layer slightly decreases, and after nitrogen evaporation, it begins to increase, because at this stage the methane starts to evaporate. The density of the bottom layer in both cases decreases due to the considerable increase in temperature of this layer and the inability to evaporate due to the hydrostatic pressure exerted by the top layer. The most important result of this analysis is the determination of time the rollover phenomenon. In the first case, for heavier LNG, with a slightly lower level of LNG in the tank, the rollover phenomenon will occur 193.25 h after the start of the calculations from the assumed initial conditions. In the second case, for light LNG with a higher initial liquid level in the tank, the density equalization of both layers will occur after 150.25 h. Simulation results for variants 1 and 2 for selected time steps are presented respectively in Table 4 and Table 5.
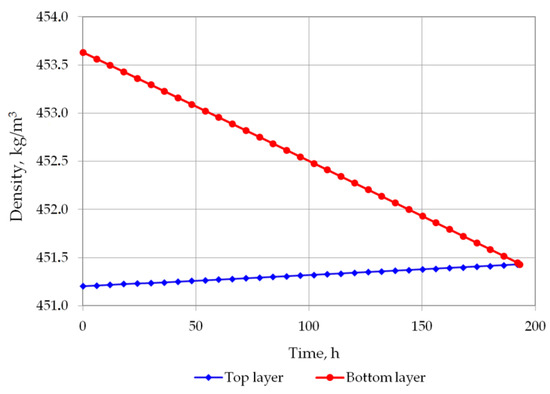
Figure 5.
LNG density changes in top and bottom layers in variant 1.
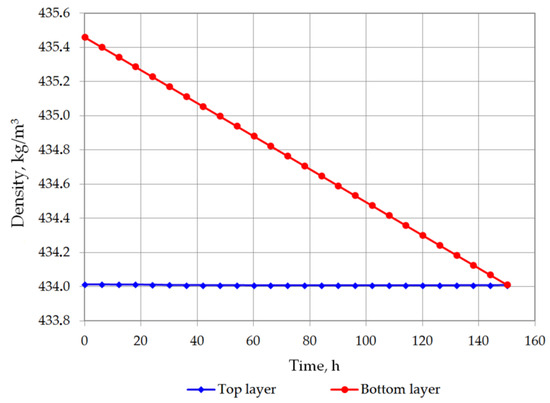
Figure 6.
LNG density changes in top and bottom layers in variant 2.
Table 4.
Simulation results for variant 1 in selected time steps.
Table 5.
Simulation results for variant 2 in selected time steps.
The temperature of the bottom layer increases more dynamically than the top layer in both cases. The heat supplied to the top layer is largely devoted for evaporation, so that the temperature of the top layer changes slowly. The bottom layer heats up more quickly; however, due to the hydrostatic pressure of the top layer, it does not reach the bubble point. The bottom layer will be heated from a temperature of 116.12 K to a temperature of 117.71 K for variant 1 (Figure 7), and from 115.5 K to 116.48 K for variant 2 (Figure 8). The temperature of the gas phase, until the appearance of the rollover phenomenon in the variant 1, increased to a maximum of 203.32 K, while in the variant 2 to 182 K (Figure 9).
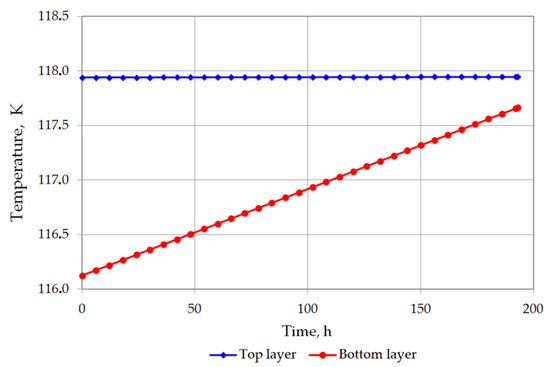
Figure 7.
Temperature changes of top and bottom layers in variant 1.
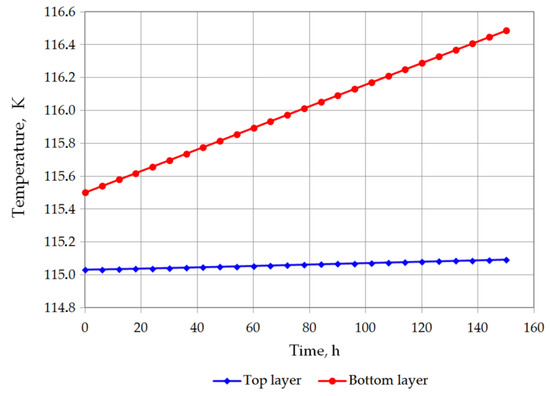
Figure 8.
Temperature changes of top and bottom layers in variant 2.
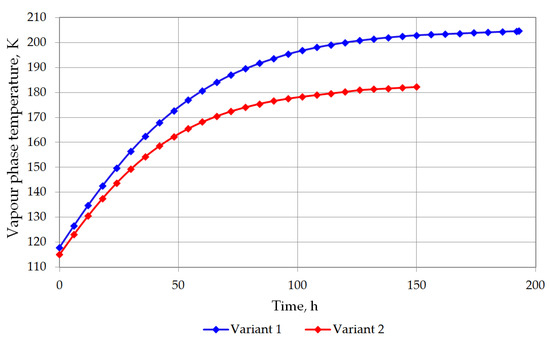
Figure 9.
Vapor phase temperature changes for both variants.
The analysis of the non-equilibrium model for the stratified cryogenic liquid in the storage tank shows interesting results in relation to the evaporation rate before the rollover phenomenon occurs. If the total volume of stratified LNG will be considered for boil-off rate, it is possible that the LNG level in the tank will slightly increase. This is caused by lower value of the BOR evaporation coefficient, because only the top layer evaporates, while the liquid in the bottom layer increases its volume due to the thermal expansion of the liquid as a result of its temperature increase. Certainly, this situation also depends on the composition of LNG. In case of stratification occurrence in the tank where heavy LNG is stored, the volume increase caused by rising temperature of the bottom layer significantly exceeds the volume loss of the top layer resulting from the lower BOR coefficient for heavy LNG (Figure 10 and Figure 11). For light LNG, the situation is different; initially there is a slight increase in the total volume of stratified LNG in tank. After approx. 12 h, the efficiency of evaporation of light LNG from the top layer, clearly higher for light LNG at a lower pressure in the tank, exceeds the volume increase caused by rising temperature of the bottom layer (Figure 12).
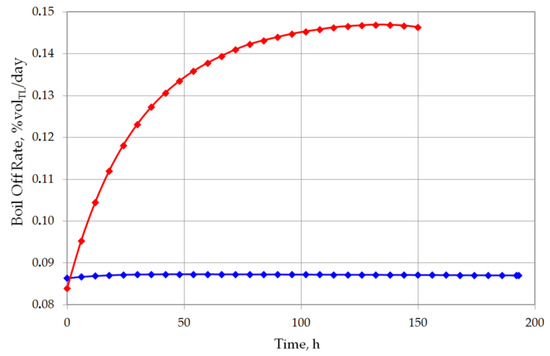
Figure 10.
Boil off rate as percent of top layer evaporated volume for both variants.
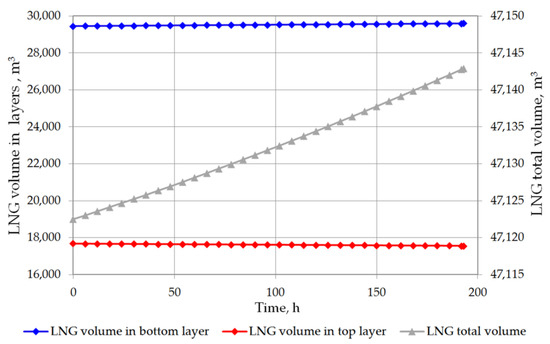
Figure 11.
Total LNG volume and both layers volume in storage tank for variant 1.
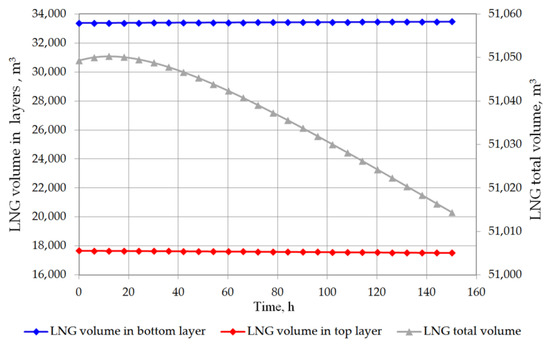
Figure 12.
Total LNG volume and both layers volume in storage tank for variant 2.
Another considered issue in performed analysis was the detailed heat balance of the storage tank. Heat transfer to the tank, to both liquid layers, between the vapor phase and the top layer of the liquid, and the heat exchange between the layers in the stratified LNG are described in detail. While the heat inflow from the ambient environment is based primarily on the difference between the ambient temperature and the temperature in the tank, the heat flow inside the tank is strictly dependent on the temperatures of the vapor phase and the layers of the stratified liquid. The heat transfer into the liquid phase can be assumed as approximately constant because the liquid temperature changes slightly and the model assumptions assume a constant ambient temperature. For the prediction of the rollover case, the phenomenon of heat transfer between the layers of the stratified liquid is also important issue. Due to the fact that the temperatures of both layers do not differ significantly, the heat flow between the layers is relatively insignificant. In variant 1, the initial temperature difference between the layers is higher, whereby the amount of heat transferred between the layers is primarily influenced by the temperature difference (Figure 13). In the case of variant 2, with a lower temperature difference between the layers, the amount of heat transferred at this time from the bottom layer to the top layer depends primarily on the difference in the density of the layers resulting from Formula (21) (Figure 14). In this case, the amount of heat exchanged between the layers (from bottom to top layer—bottom layer is warmer) initially increases and then decreases with decreasing the difference in density between the layers begins to decline. Temperature of the vapor phase increases faster, in both cases, the amount of heat transferred to the vapor phase decreases as a function of time, but at the same time the amount of heat transferred to the liquid phase from the vapor phase increases.
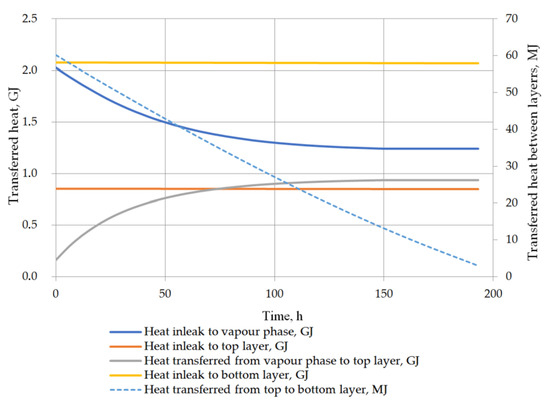
Figure 13.
Heat balance in storage tank for variant 1.
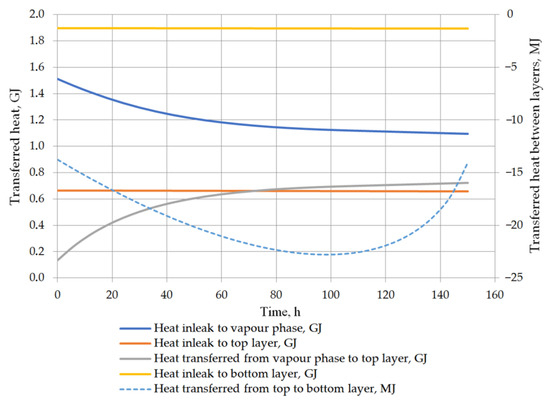
Figure 14.
Heat balance in storage tank for variant 2.
7. Conclusions
The literature review of incident data in LNG industry confirms the 24 rollover incidents have occurred since 1970s, fewer incidents have been reported in last 20 years but rollover phenomena in LNG storage process can still occur. This implies that the rollover phenomena is still important issue for LNG industry which has lessons to be learnt for better understanding of this problem. The detailed principles of stratification process initiation are still not carefully recognized. In present time, LNG tanks are equipped with sophisticated tank measurement armature that the most important LNG parameters in the tank such as level, temperature, and density profiles can be observed in real time with high accuracy.
Nevertheless, tools are still needed to avoid a situation where the LNG stratification phenomenon occurs in the tank or, when it does occur, to determine how much time the LNG terminal operator has to prevent rollover as a consequence of stratification. For this purpose, an analytical stable stratification model (SSM) was prepared, based on the energy balance in the storage tank using vapor–liquid equilibrium calculations based on REFPROP 9.0 libraries. With the proposed model the time of rollover occurrence can be determined from the moment of stable stratification occurrence of the tank is the most advanced development of the model with heat exchange between the phases. In order to determine the time of rollover occurrence, the densities of both layers of the liquid phase in a given time step are determined, the time when these densities will equalize is considered the time of rollover phenomena occurrence.
A performed model is proposed also for estimation other important parameters i.a. of the boil off rate in a LNG storage tank as a result of heat transfer, temperatures of vapor phase and both layers of liquid phase, heat transferred to the tank (to vapor phase and both layers of liquid phase), and LNG level in tank. Models can obtain results for wide range of assumptions manipulating pressure, initial temperature of bottom layer, ambient temperature and other initial conditions. In practice, when the user knows the composition of the layers and the initial temperature of the layers, the analytical model developed in the present work can be used to predict the rollover occurrence by describing the detailed heat balance in storage tank.
To confirm the feasibility of the model, two different cases are presented for an exemplary storage tank in which the LNG stratification phenomenon occurred. In the first case, stratified heavy LNG (approx. 90% methane) at 1.5 bar storage pressure was analyzed, in the second case, light LNG stratification (approx. 95% methane) at 1.3 bar storage pressure. In both cases, the difference in layer density was about 1.5 kg/m3.
In the presented model, for the adopted assumptions, the approximate time of the rollover occurrence was determined for both cases. In the first case, for heavier LNG, with a slightly lower level of LNG in the tank, the rollover phenomenon will occur 193.25 h after the start of the calculations from the assumed initial conditions. In the second case, for light LNG with a higher initial liquid level in the tank, the density equalization of both layers will occur after 150.25 h. The accuracy of the model strictly depends on the length of the time step; extending the time step, it is more difficult to precisely determine the time of rollover occurrence.
A developed model is used to predict changes of the parameters of stratified LNG and time of rollover occurrence in the storage tank. The possibility of rollover time determination directly affects the increase in the process safety level. The analytical approach to determination of the rollover occurrence provides a reference for further studies on this issue. A more comprehensive study on the heat transfer between the layers connected with equilibrium calculations and detailed temperature distribution model in liquid layers are required to investigate the time of rollover more precisely.
Author Contributions
Conceptualization, T.W. and M.Ł.; methodology, T.W.; software, T.W.; validation, T.W. and M.Ł.; formal analysis, M.Ł.; investigation, T.W.; resources, T.W.; data curation, M.Ł.; writing—original draft preparation, T.W.; writing—review and editing, M.Ł.; visualization, T.W.; supervision, M.Ł.; funding acquisition, M.Ł. All authors have read and agreed to the published version of the manuscript.
Funding
This work has been prepared as a part of Natural Gas Department research at AGH University of Krakow, Drilling, Oil & Gas Faculty, no. 16.16.190.779.
Data Availability Statement
Data are contained within the article.
Conflicts of Interest
The authors declare no conflict of interest.
Nomenclature
| A | area of heat transfer, m2 |
| BL | liquid vaporized (boil off gas), moles |
| B | vapor vented from tank, moles |
| Cp | isobaric heat capacity, J/mole |
| f | fugacity, Pa |
| H | enthalpy, J |
| h | molar enthalpy, J/mole |
| k | thermal conductivity, W/(m·K) |
| N | total moles, moles |
| Q | heat transferred, J |
| T | temperature, K |
| U | heat transfer coefficient, W/(m2·K) |
| z | height, m |
| Greek symbols | |
| α | thermal diffusivity, m2/s |
| ν | kinematic viscosity, m2/s |
| ρ | density, kg/m3 |
| φ | fugacity coefficient |
| Subscripts | |
| amb | ambient |
| av | average |
| B | liquid bottom layer |
| F | y tank bottom slab (foundation) |
| i | initial, beginning of time step |
| i + 1 | end of time step, initial of next step |
| in | inleak |
| INL | interlayer |
| R | by tank roof |
| T | liquid top layer |
| V | vapor phase (vapor layer) |
| VL | vapor to liquid |
| VZ | vapor phase at z height |
| W | by tank side wall |
| Acronyms | |
| LNG | Liquefied natural gas |
| BOR | Boil off rate |
| SSM | Stable stratification model |
References
- International Gas Union. World LNG Report—2015 Edition; C/O Statoil ASA; International Gas Union, Office of the Secretary General: Oslo, Norway, 2015. [Google Scholar]
- GIIGNL. LNG Custody Transfer Handbook, 4th ed.; (Version 4); GIIGNL: Paris, France, 2015; p. 104. [Google Scholar]
- Sarsten, J.A. LNG stratification and rollover. Pipeline Gas J. 1972, 199, 37–42. [Google Scholar]
- Baker, N.; Creed, M. Stratification and rollover in liquefied natural gas storage tanks. Trans. IChemE 74 (Part B) 1996, 74 Pt B, 25–30. [Google Scholar]
- Hubert, A.; Dembele, S.; Denissenko, P.; Wen, J. Predicting Liquefied Natural Gas (LNG) rollovers using Computational Fluid Dynamics. J. Loss Prev. Process Ind. 2019, 62, 103922. [Google Scholar] [CrossRef]
- Kulitsa, M.; Wood, D.A. LNG rollover challenges and their mitigation on Floating Storage and Regasification Units: New perspectives in assessing rollover consequences. J. Loss Prev. Process Ind. 2018, 54, 352–372. [Google Scholar] [CrossRef]
- Nakano, R.; Sugawara, Y.; Yamagata, S.; Nakamura, J. An experimental study on the mixing of stratified layers using liquid freon. In Proceedings of the Gastech 82 LNG-LPG Conference, Paris, France, 5–8 October 1982; pp. 383–391. [Google Scholar]
- Morioka, M.; Enya, S. Natural convection of density-stratified layers in a vessel. Heat Transf. Jpn. Res. 1984, 12, 48–69. [Google Scholar]
- Gorieu, O.; Uznanski, D.; DuPont, P. How to operate LNG terminals with flexibility/ safety despite the diversification of unloaded LNG qualities. In Proceedings of the 14th International Conference and Exhibition of Liquefied Natural Gas, Doha, Qatar, 21–24 March 2004; pp. 1–10. [Google Scholar]
- Chatterjee, N.; Geist, J.M. The effects of stratification on boil-off rate in LNG tanks. Pipeline Gas J. 1972, 99, 40–45. [Google Scholar]
- Germeles, A.E. A model for LNG tank Rollover. Adv. Cryog. Eng. 1975, 21, 326–336. [Google Scholar]
- Heestand, J.; Shipman, C.W.; Meader, J.W. A predictive model for rollover in stratified LNG tanks. AIChE J. 1983, 29, 199–207. [Google Scholar] [CrossRef]
- Bates, S.; Morrison, D. Modelling the behaviour of stratified liquid natural gas in storage tanks: A study of the rollover phenomenon. Int. J. Heat Mass Transf. 1997, 40, 1875–1884. [Google Scholar] [CrossRef]
- Deshpande, K.B.; Zimmerman, W.B.; Tennant, M.T.; Webster, M.B.; Lukaszewski, M.W. Optimization methods for the real-time inverse problem posed by modelling of liquefied natural gas storage. Chem. Eng. J. 2011, 170, 44–52. [Google Scholar] [CrossRef][Green Version]
- Kamiya, A.; Tahsita, M.; Sugawara, Y. An Experimental Study of LNG Rollover Phenomenon; American Society of Mechanical Engineers: New York, NY, USA, 1985; pp. 1–11. [Google Scholar]
- Agbabi, T. Rollover and Interfacial Studies in LNG Mixtures. Institute of Cryogenics. Ph.D. Thesis, University of Southampton, Southampton, UK, 1987; p. 187. [Google Scholar]
- Morrison, D.S.; Richardson, A. An experimental study on the stability of stratified layers and rollover in LNG storage tanks. In Proceedings of the Low Temperature Engineering and Cryogenics Conference, Southampton, UK, 13–15 July 1990. [Google Scholar]
- Gursu, S.; Sherif, S.A.; Veziroglu, T.N.; Sheffield, J.W. Analysis and Optimization of Thermal Stratification and Self-Pressurization Effects in Liquid Hydrogen Storage Systems—Part 1: Model Development. J. Energy Resour. Technol. 1993, 115, 221–227. [Google Scholar] [CrossRef]
- Shi, J.; Beduz, C.; Scurlock, R. Numerical modelling and flow visualization of mixing of stratified layers and rollover in LNG. Cryogenics 1993, 33, 1116–1124. [Google Scholar] [CrossRef]
- Munakata, T.; Lior, N. A study of double diffusive rollover in cylindrical enclosures. Proc. ASME Heat Tran. Div. 1995, 317, 279–291. [Google Scholar]
- Tanasawa, I. Experimental techniques in natural convection. Exp. Therm. Fluid Sci. 1995, 10, 503–518. [Google Scholar] [CrossRef]
- Sheats, D.; Capers, M. Density stratification in LNG storage. Cold Facts 1999, 15, 3. [Google Scholar]
- SIGTTO. Guidance for the Prevention of Rollover in LNG Ships, 1st ed.; SIGTTO: London, UK, 2012. [Google Scholar]
- Scurlock, R.G. Stratification, Rollover and Handling of LNG, LPG and Others Cryogenic Mixtures; Springer International Publishing: Berlin/Heidelberg, Germany, 2016; 134p, ISBN 978-3-319-20695-0. [Google Scholar]
- Arjomandnia, P. Simulation of Rollover in Stratified LNG Storage Tanks. Master’s Thesis, University of Western Australia, Perth, Australia, 2010. [Google Scholar]
- Arjomandnia, P.; Tade, M.O.; Pareek, V.; May, E.F. Analysis of available data from liquefied natural gas rollover incidents to determine critical stability ratios. AIChE J. 2013, 60, 362–374. [Google Scholar] [CrossRef]
- Zimmerman, W.B.; Rees, J.M. Rollover instability due to double diffusion in a stably stratified cylindrical tank. Phys. Fluids 2007, 19, 123604. [Google Scholar] [CrossRef]
- Kim, H.; Shin, M.-W.; Yoon, E.S. Optimization of operating procedure of LNG storage facilities using rigorous BOR model. In Proceedings of the 17th World Congress the International Federation of Automatic Control, Seoul, Republic of Korea, 6–11 July 2008; pp. 10923–10926. [Google Scholar]
- Ludwig, C.; Dreyer, M.; Hopfinger, E. Pressure variations in a cryogenic liquid storage tank subjected to periodic excitations. Int. J. Heat Mass Transf. 2013, 66, 223–234. [Google Scholar] [CrossRef]
- Ren, J.-J.; Shi, J.-Y.; Liu, P.; Bi, M.-S.; Jia, K. Simulation on thermal stratification and de-stratification in liquefied gas tanks. Int. J. Hydrog. Energy 2013, 38, 4017–4023. [Google Scholar] [CrossRef]
- Shi, J.; Ren, J.; Liu, P.; Bi, M. Experimental research on the effects of fluid and heater on thermal stratification of liquefied gas. Exp. Therm. Fluid Sci. 2013, 50, 29–36. [Google Scholar] [CrossRef]
- Migliore, C.; Salehi, A.; Vesovic, V. A non-equilibrium approach to modelling the weathering of stored Liquefied Natural Gas (LNG). Energy 2017, 124, 684–692. [Google Scholar] [CrossRef]
- Migliore, C.; Salehi, A.; Vesovic, V. Weathering of stored Liquefied Natural Gas (LNG). In Proceedings of the 10th International Conference on Thermal Engineering: Theory and Applications, Muscat, Oman, 26–28 February 2017. [Google Scholar]
- Migliore, C.; Tubilleja, C.; Vesovic, V. Weathering prediction model for stored liquefied natural gas (LNG). J. Nat. Gas Sci. Eng. 2015, 26, 570–580. [Google Scholar] [CrossRef]
- Pellegrini, L.A.; Moioli, S.; Brignoli, F.; Bellini, C. LNG Technology: The Weathering in Above-Ground Storage Tanks. Ind. Eng. Chem. Res. 2014, 53, 3931–3937. [Google Scholar] [CrossRef]
- Zakaria, Z.; Baslasl, M.S.O.; Samsuri, A.; Ismail, I.; Supee, A.; Haladin, N.B. Rollover Phenomenon in Liquefied Natural Gas Storage Tank. J. Fail. Anal. Prev. 2019, 19, 1439–1447. [Google Scholar] [CrossRef]
- Lu, Y.; Liang, C. Rollover of Liquid Natural Gas in a Storage Tank: A Numerical Simulation. In Proceedings of the 2nd International Conference on Green Energy, Environment and Sustainable Development (GEESD2021), Shanghai, China, 26–27 June 2021; Dobrota, D., Cheng, C., Eds.; IOS Press: Amsterdam, The Netherlands, 2021. [Google Scholar]
- Wang, Z.; Han, F.; Liu, Y.; Li, W. Evolution Process of Liquefied Natural Gas from Stratification to Rollover in Tanks of Coastal Engineering with the Influence of Baffle Structure. J. Mar. Sci. Eng. 2021, 9, 95. [Google Scholar] [CrossRef]
- Zhao, B.; Han, S.; Xu, L.; Shi, C.; Gao, D.; Zhang, Y.D. Rollover Mechanism Methodology of LNG Tank with Gas-Liquid Stratification Based on Curvelet Finite Element Method and Large Eddy Simulation Technology. J. Appl. Fluid Mech. 2018, 11, 779–786. [Google Scholar] [CrossRef]
- Saleem, A.; Farooq, S.; Karimi, I.A.; Banerjee, R. CFD Analysis of Stratification and Rollover Phenomena in an Industrial-Scale LNG Storage Tank. Ind. Eng. Chem. Res. 2020, 59, 14126–14144. [Google Scholar] [CrossRef]
- Hubert, A.; Dembele, S.; Denissenko, P.; Wen, J. Numerical Predictions of the Rollover Phenomenon Using Computational Fluid Dynamics; Symposum Series No. 162; IChemE: Rugby, UK, 2017. [Google Scholar]
- Yumeng, L.; Jinshu, L.; Junjie, S. Effect of Rolling on the Stratification and Rollover Phenomenon of LNG Cargo Tank, ISOPE-I-21-3202. In Proceedings of the 31st International Ocean and Polar Engineering Conference, Rhodes, Greece, 26 June–1 July 2021. [Google Scholar]
- Huang, B.; Li, J.; Fu, C.; Guo, T.; Feng, S. A Comprehensive Review of Stratification and Rollover Behavior of Liquefied Natural Gas in Storage Tanks. Processes 2022, 10, 1360. [Google Scholar] [CrossRef]
- International Group of LNG Exporters (GIIGNL). Annual Report 2018; International Group of LNG Exporters: Paris, France, 2018. [Google Scholar]
- Miana, M.; del Hoyo, R.; Rodrigálvarez, V.; Valdés, J.R.; Llorens, R. Calculation models of liquefied natural gas (LNG) ageing during ship transportation. Appl. Energy 2010, 87, 1687–1700. [Google Scholar] [CrossRef]
- Miana, M.; del Hoyo, R.; Rodrigálvarez, V. Comparison of evaporation rate and heat flow models for prediction of Liquefied Natural Gas (LNG) ageing during ship transportation. Fuel 2016, 177, 87–106. [Google Scholar] [CrossRef]
- Kulitsa, M.; Wood, D.A. Floating storage and regasification units face specific LNG rollover challenges: Consideration of saturated vapor pressure provides insight and mitigation options. Nat. Gas Ind. B 2018, 5, 391–414. [Google Scholar]
- Łaciak, M. Liquefied Natural Gas storage of variable composition. Arch. Min. Sci. 2015, 60, 225–238. [Google Scholar]
- Łaciak, M. Thermodynamic processes involving liquefied natural gas at the receiving terminals. Arch. Min. Sci. 2013, 58, 349–359. [Google Scholar]
- Bashiri, A. Modelling and simulation of Rollover in LNG Storage Tanks. In Proceedings of the 23rd World Gas Conference, Amsterdam, The Netherlands, 5–9 June 2006. [Google Scholar]
- Bird, R.; Warren, S.; Lightfoot, E. Transport Phenomena, 2nd ed.; John Wiley & Sons, Inc.: Hoboken, NJ, USA, 2007. [Google Scholar]
- Huerta, F.; Vesovic, V. A realistic vapour phase heat transfer model for the weathering of LNG stored in large tanks. Energy 2019, 174, 280–291. [Google Scholar] [CrossRef]


Disclaimer/Publisher’s Note: The statements, opinions and data contained in all publications are solely those of the individual author(s) and contributor(s) and not of MDPI and/or the editor(s). MDPI and/or the editor(s) disclaim responsibility for any injury to people or property resulting from any ideas, methods, instructions or products referred to in the content. |
© 2023 by the authors. Licensee MDPI, Basel, Switzerland. This article is an open access article distributed under the terms and conditions of the Creative Commons Attribution (CC BY) license (https://creativecommons.org/licenses/by/4.0/).