

Global Decarbonization: Current Status and What It Will Take to Achieve Net Zero by 2050


Abstract
:1. Introduction
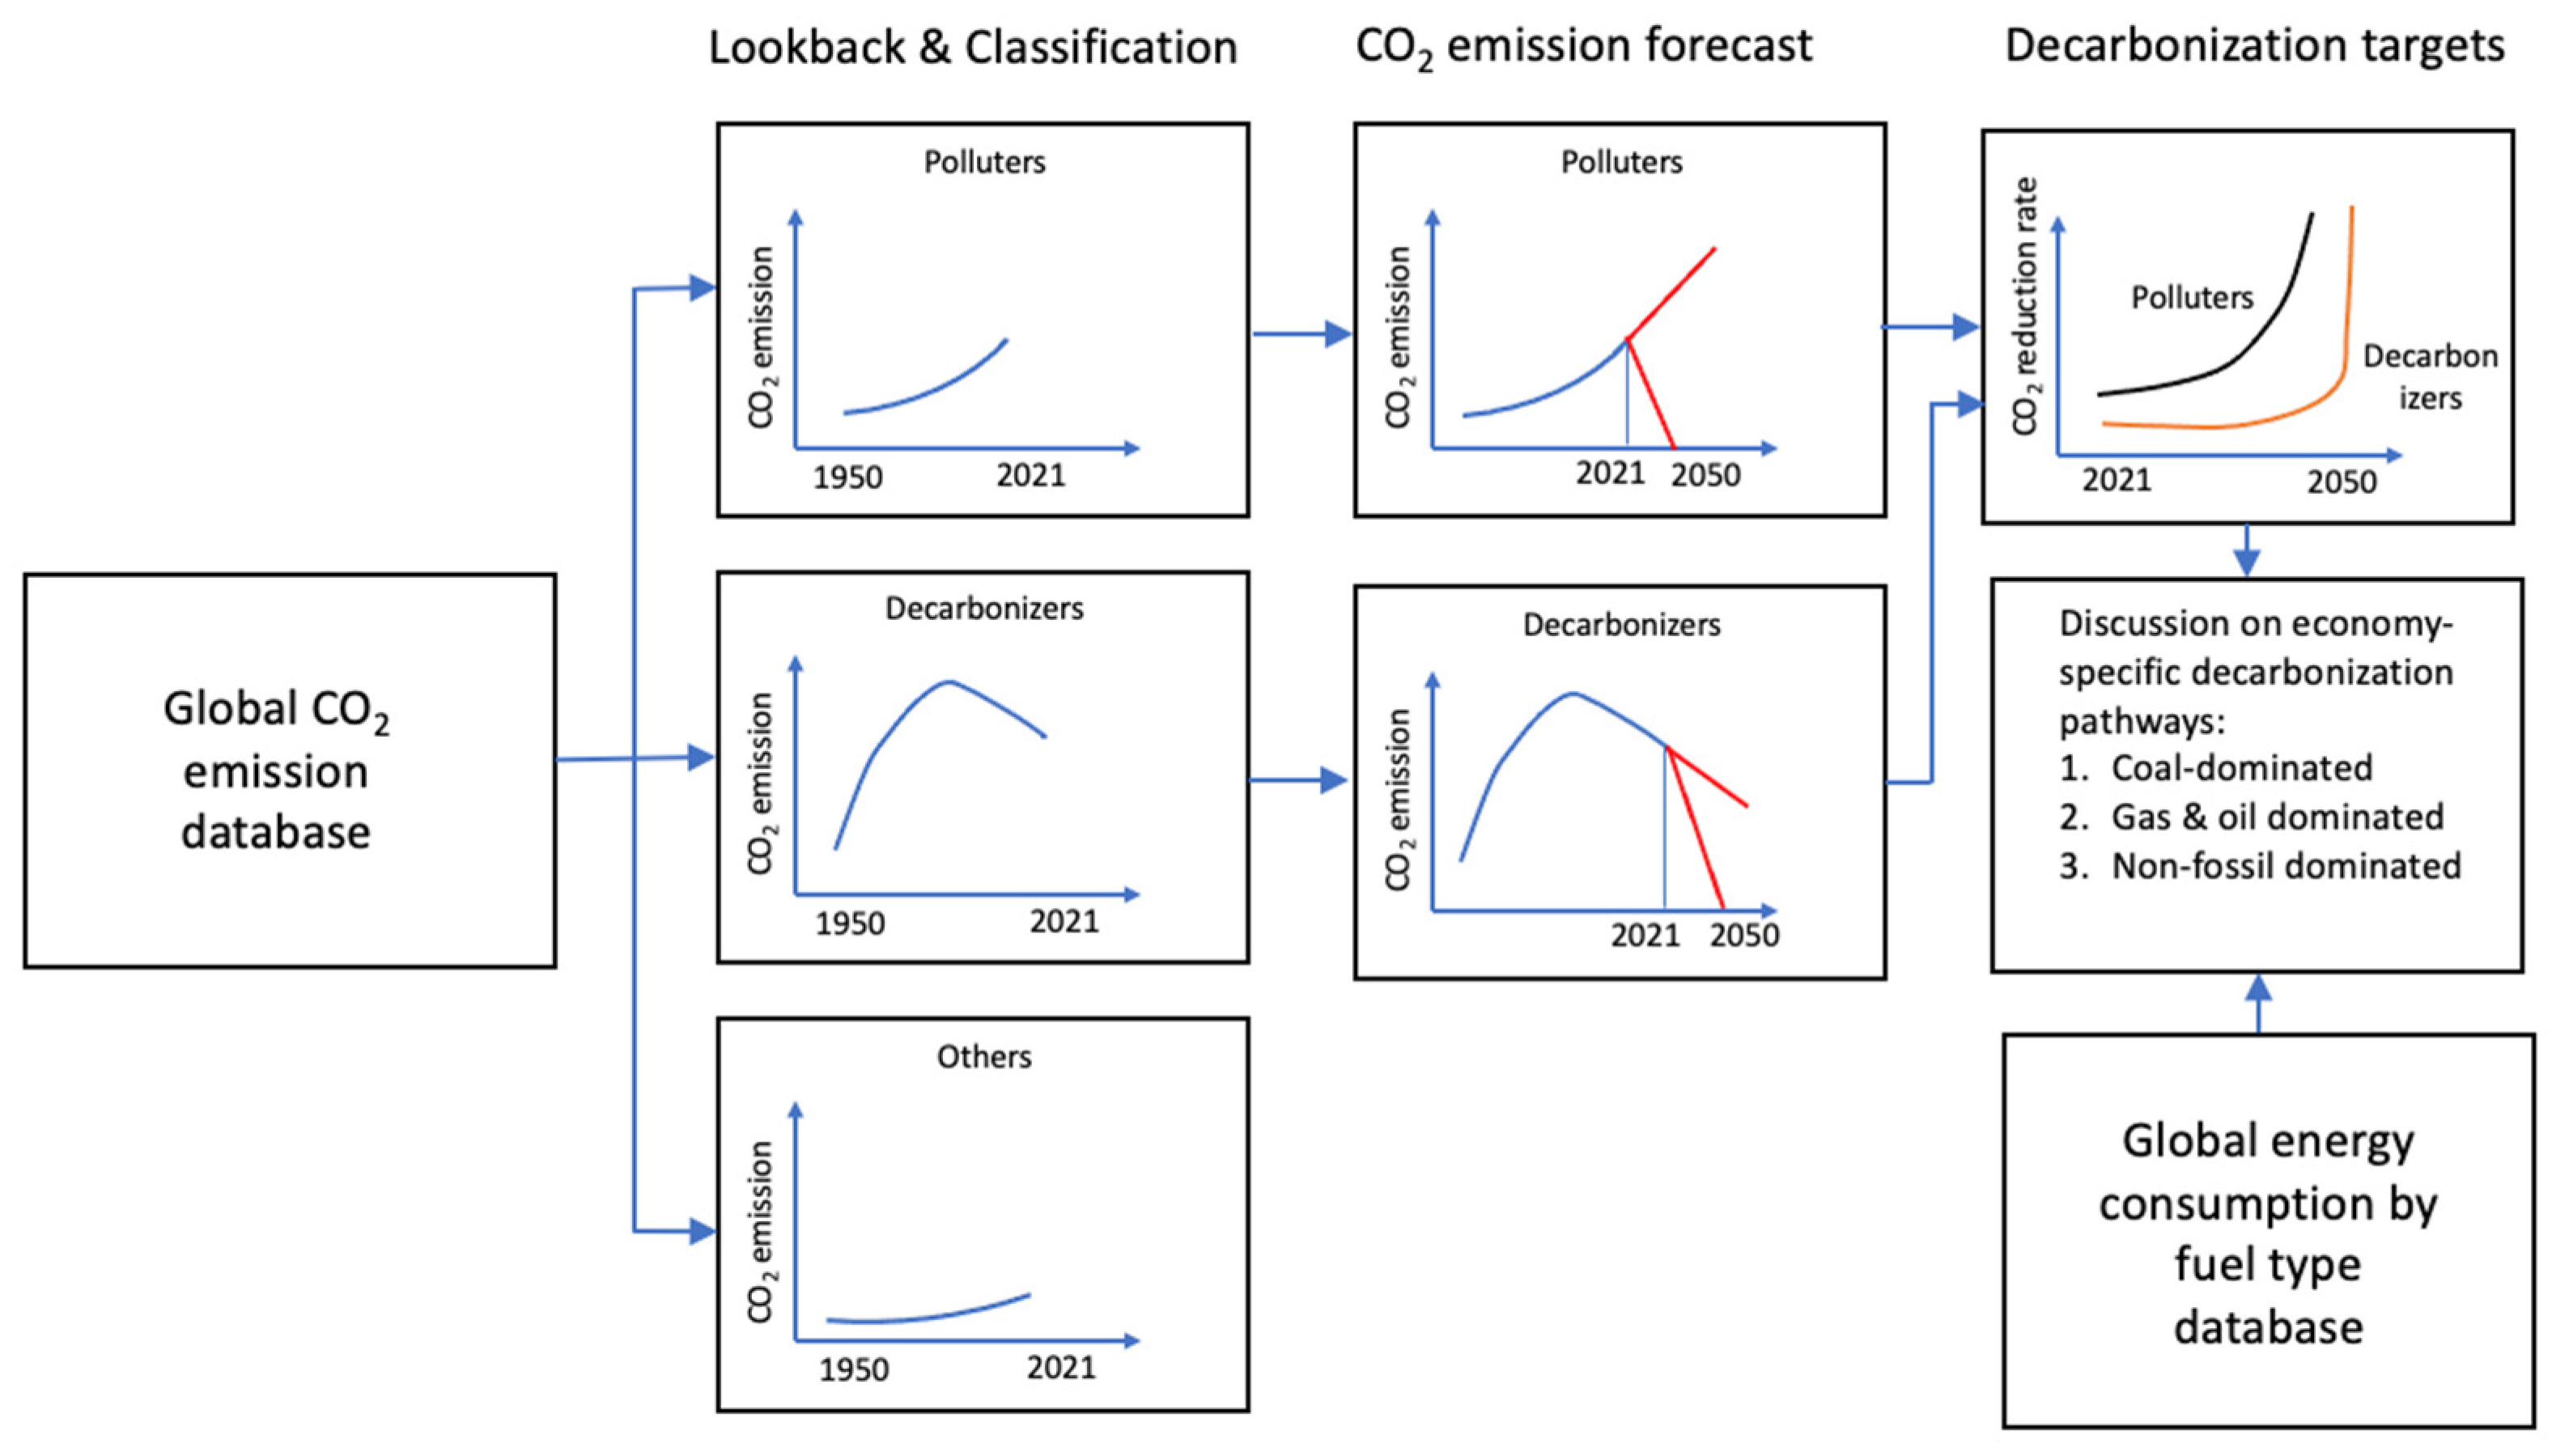
2. Objectives and Methodology
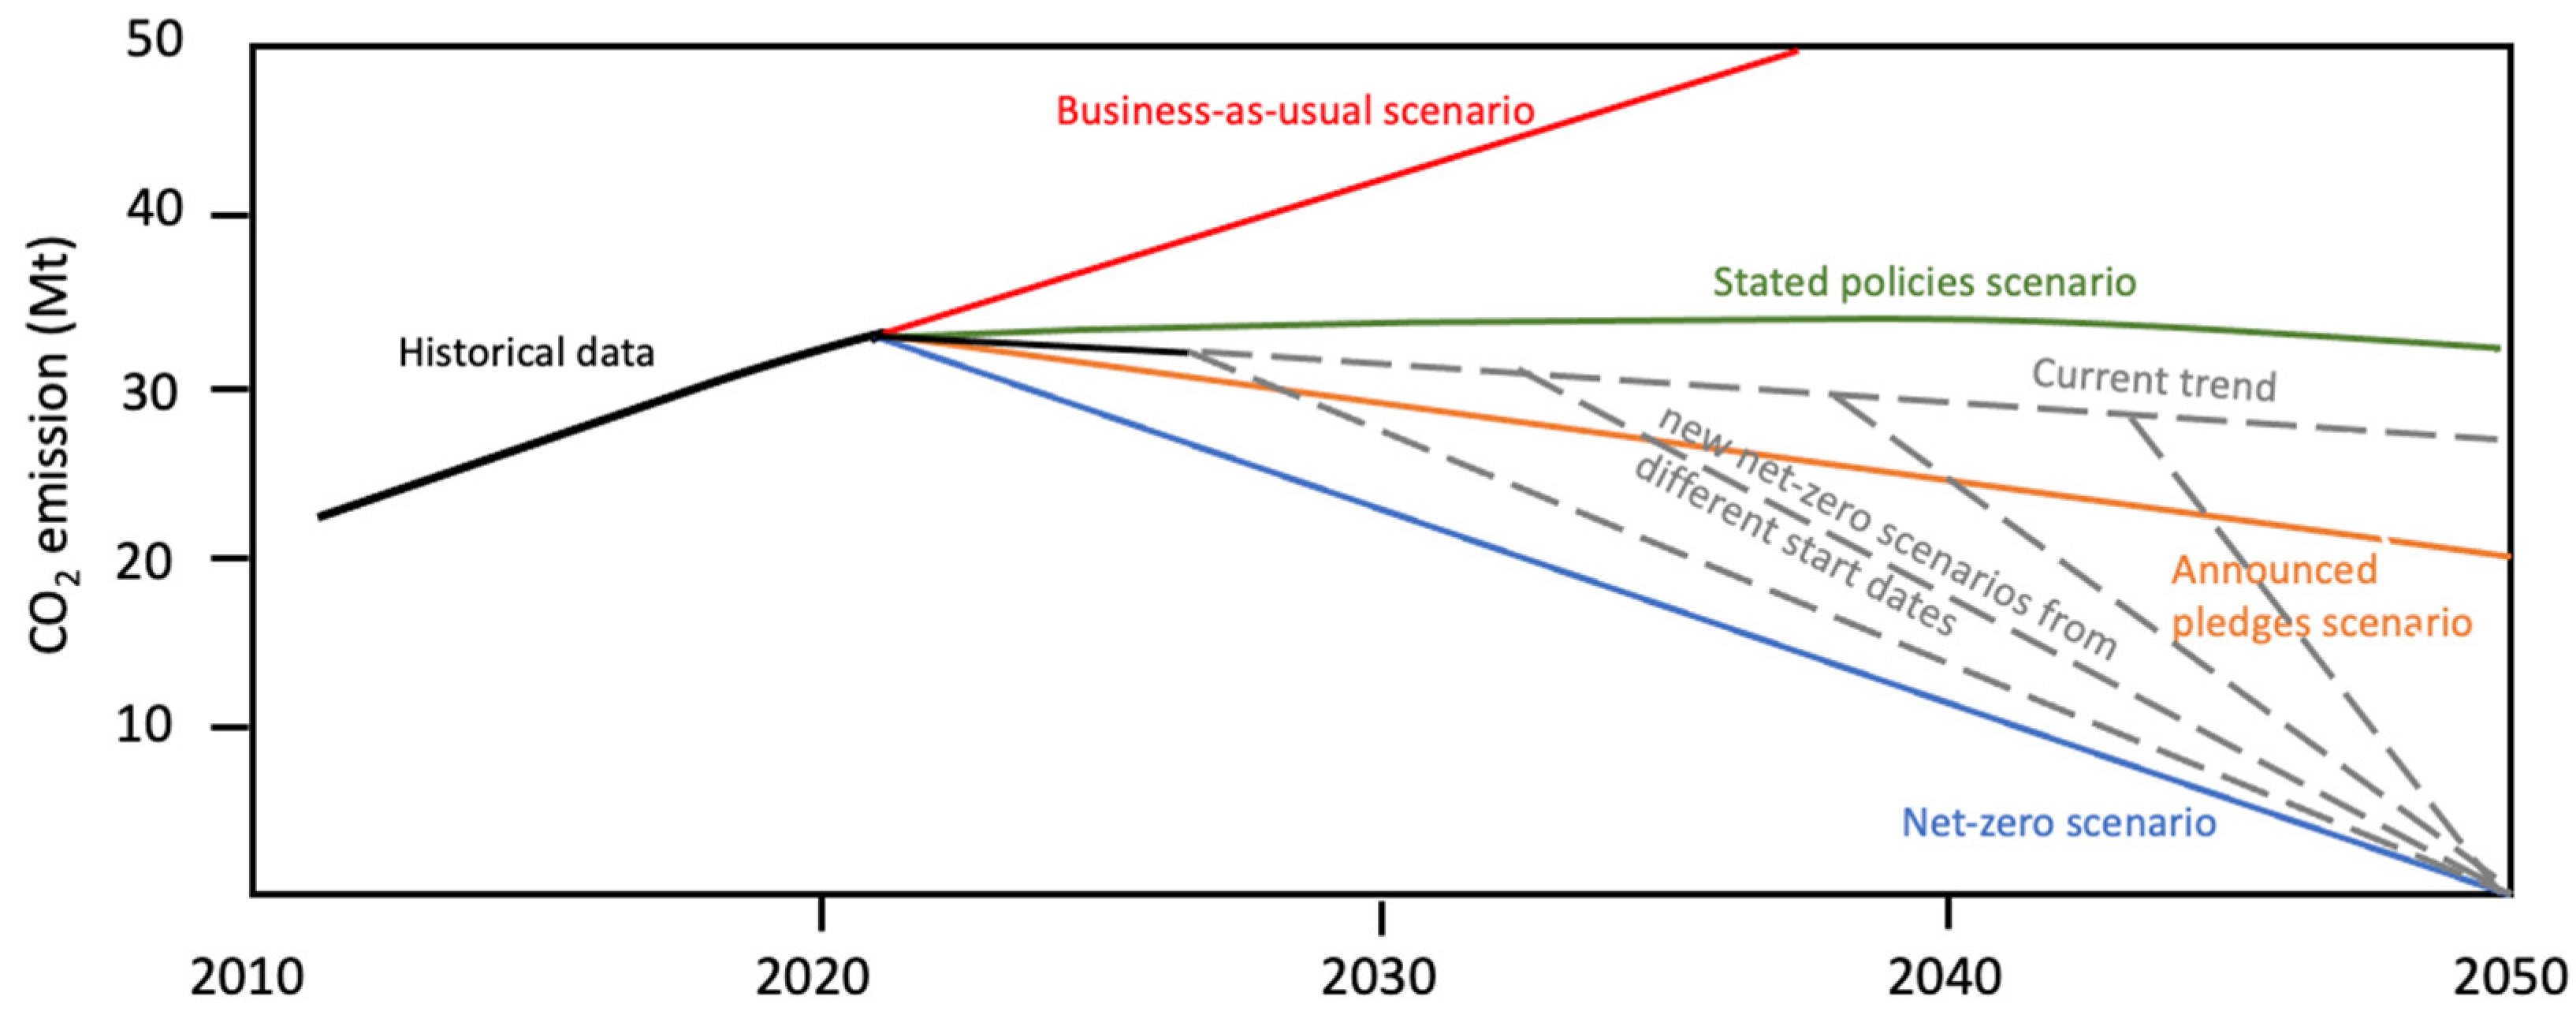
Comparison of Study Methodology with IEA Scenarios
3. Look Back and Classification
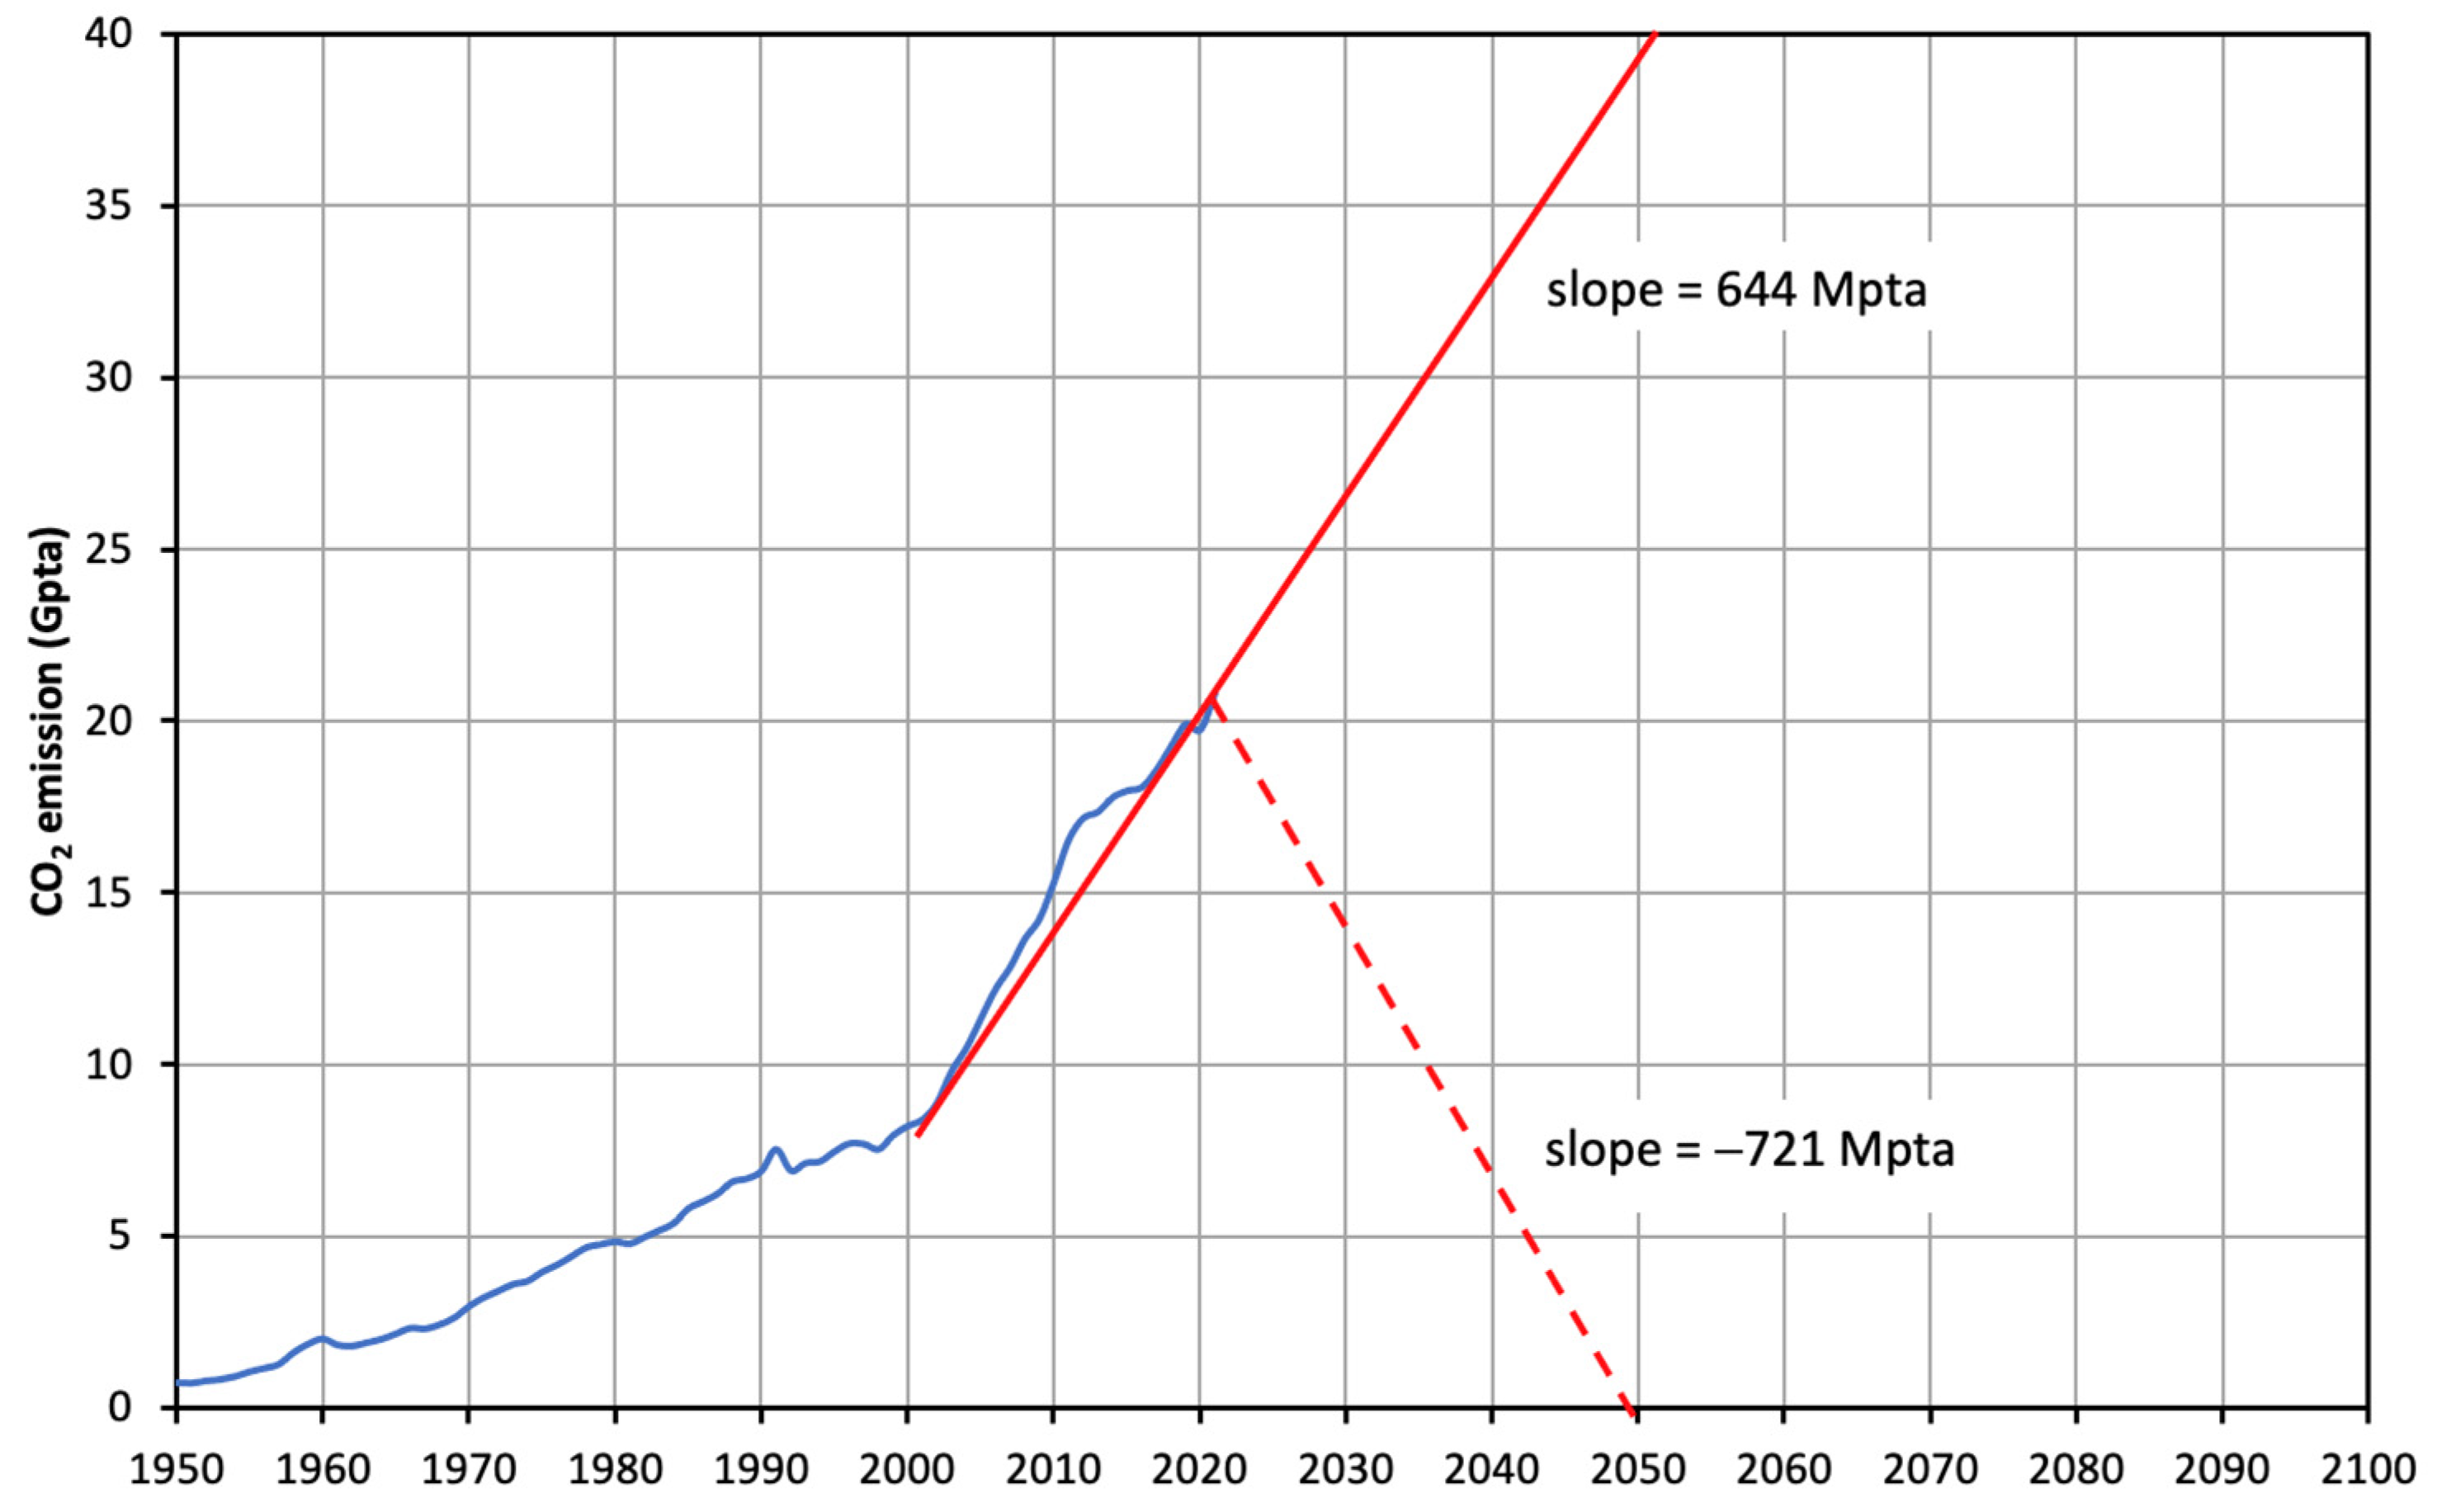
4. Global CO2 Emissions Forecast
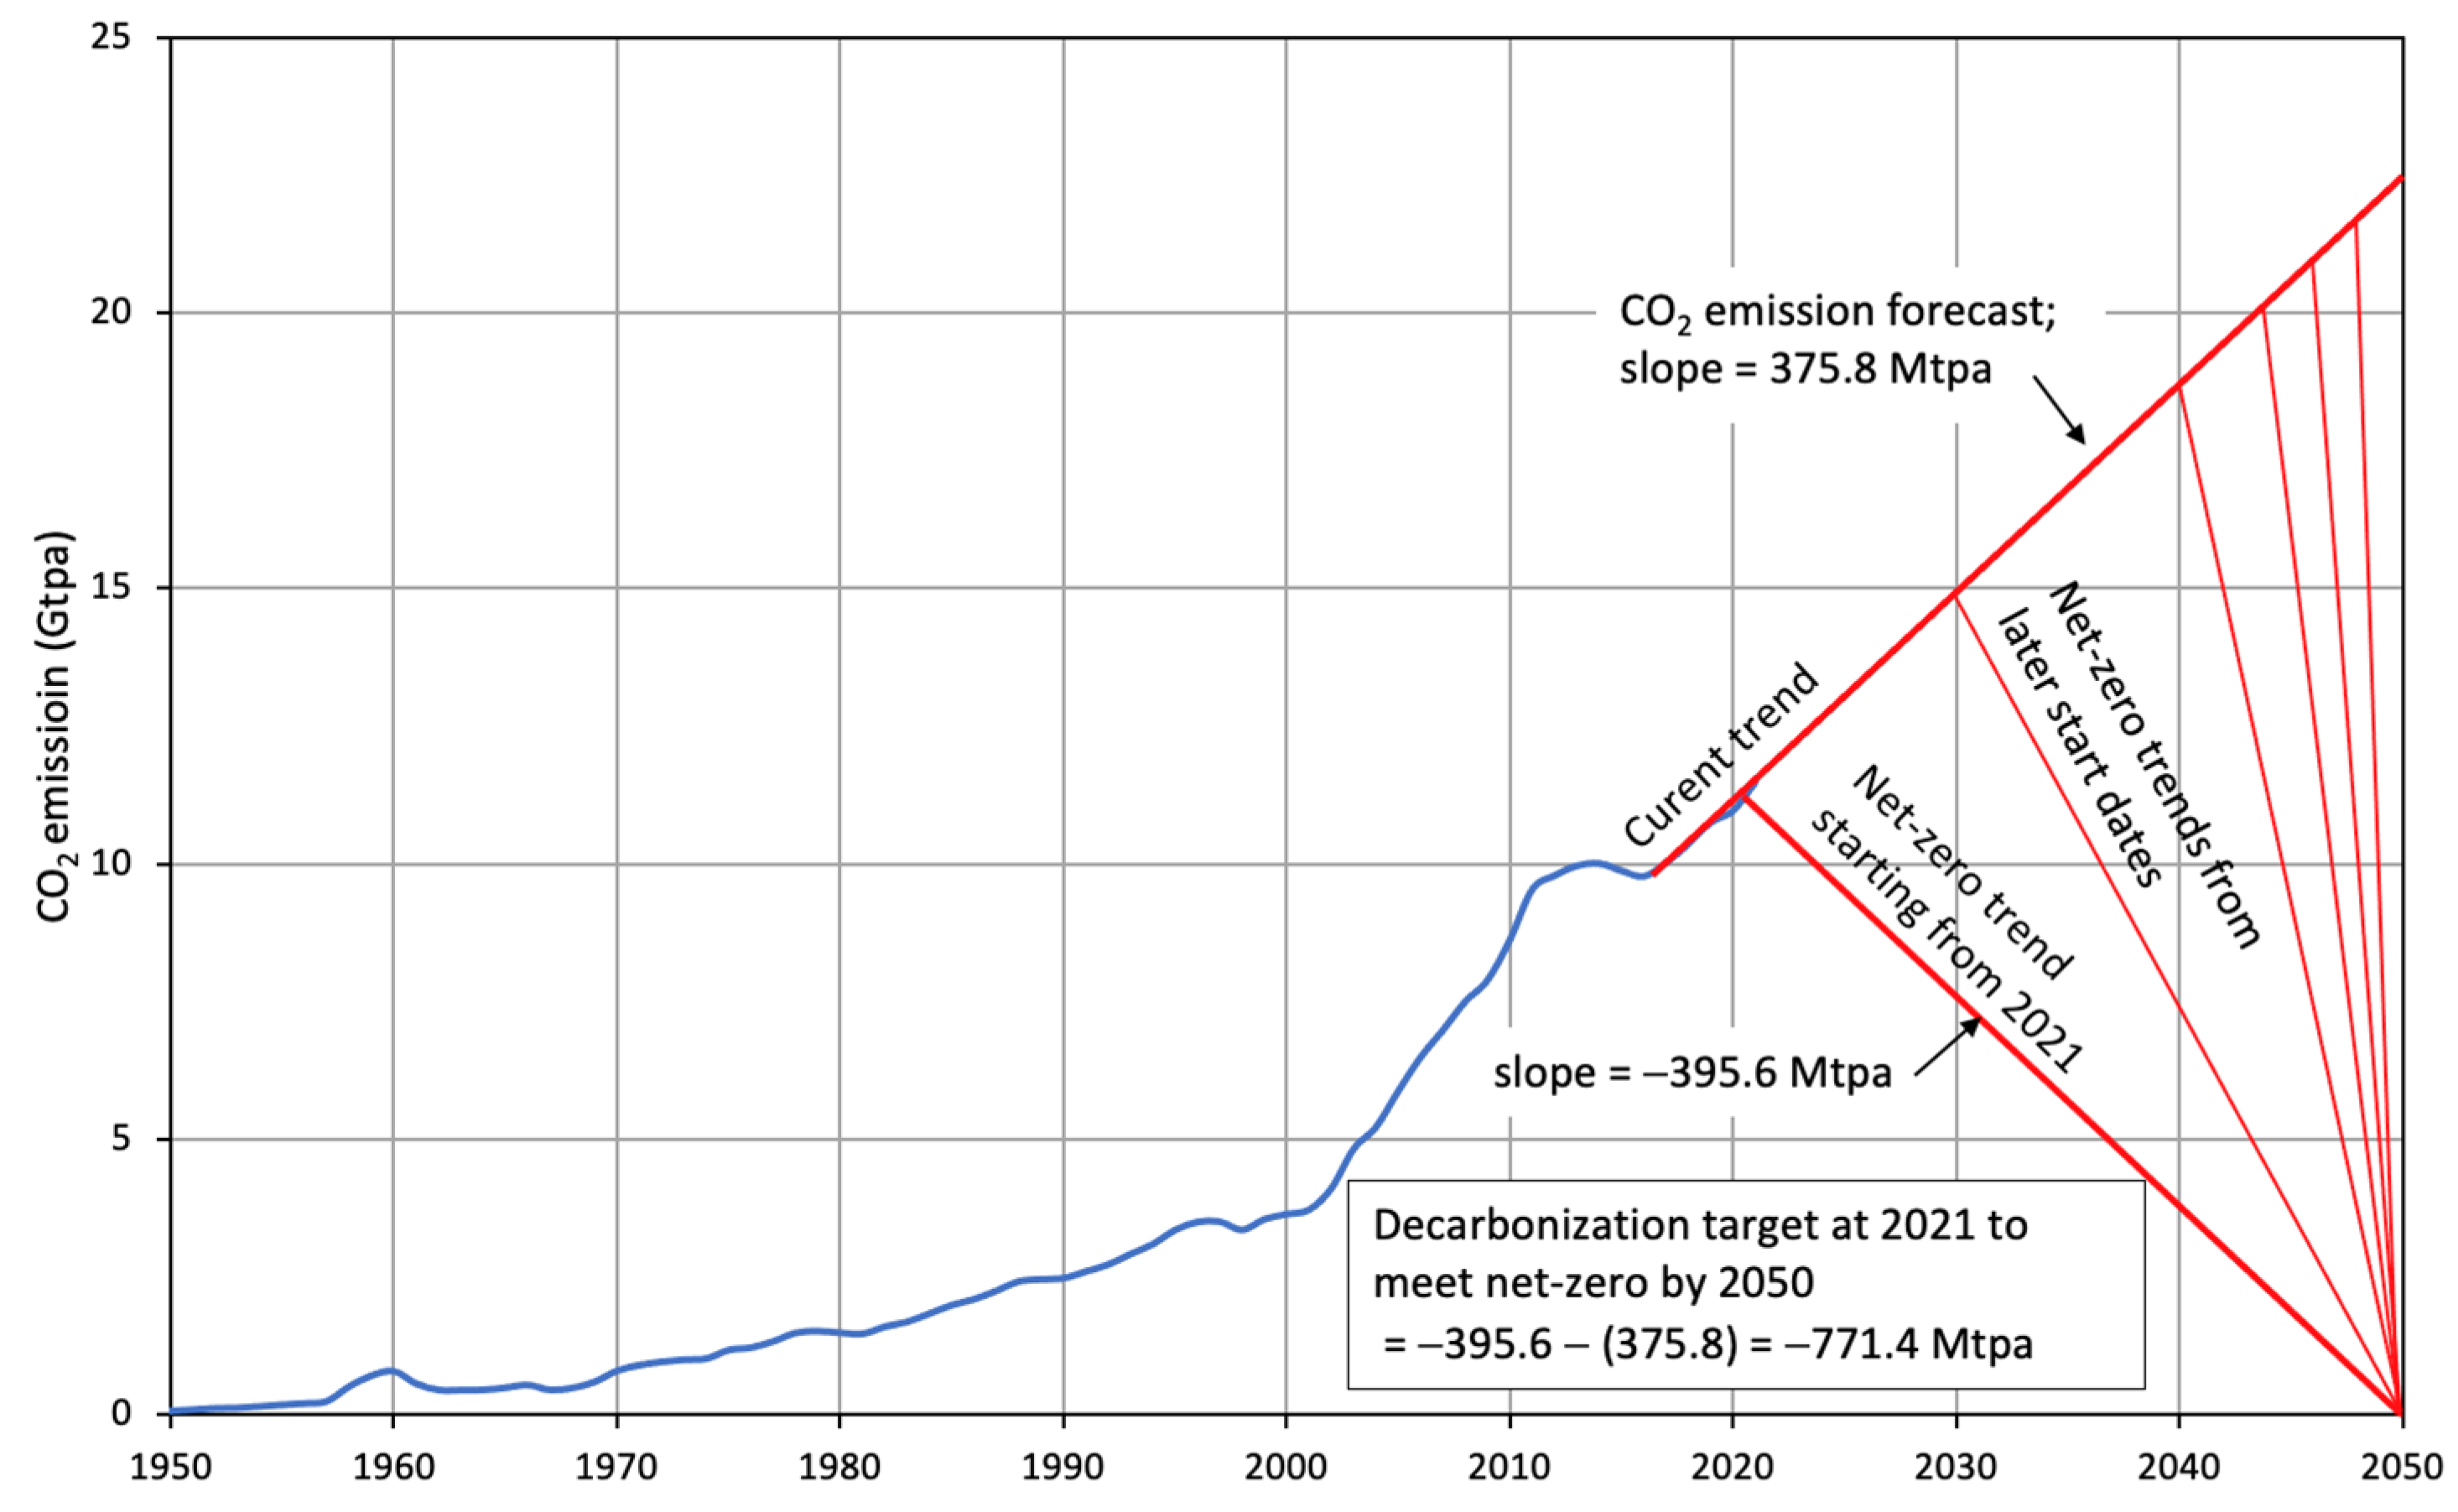
5. Decarbonization Target to Achieve Net Zero by 2050
6. Decarbonization Pathways
6.1. Decarbonization Technologies

| Renewable Energies | Low-Carbon Fossil Energies | Nuclear Energy | Hydrogen | |
|---|---|---|---|---|
| Main types |
|
|
|
|
| Main use |
|
|
|
|
| Comments |
|
|
|
|
6.2. Slow Pace of Addition of Renewable Energy Capacity
6.3. Decarbonization for Coal-Dominated Economies
6.4. Decarbonization of Gas-and-Oil-Dominated Economies
6.5. Decarbonization of Non-Fossil-Energy-Dominated Economics
7. Discussion
8. Policy Implications
9. Conclusions
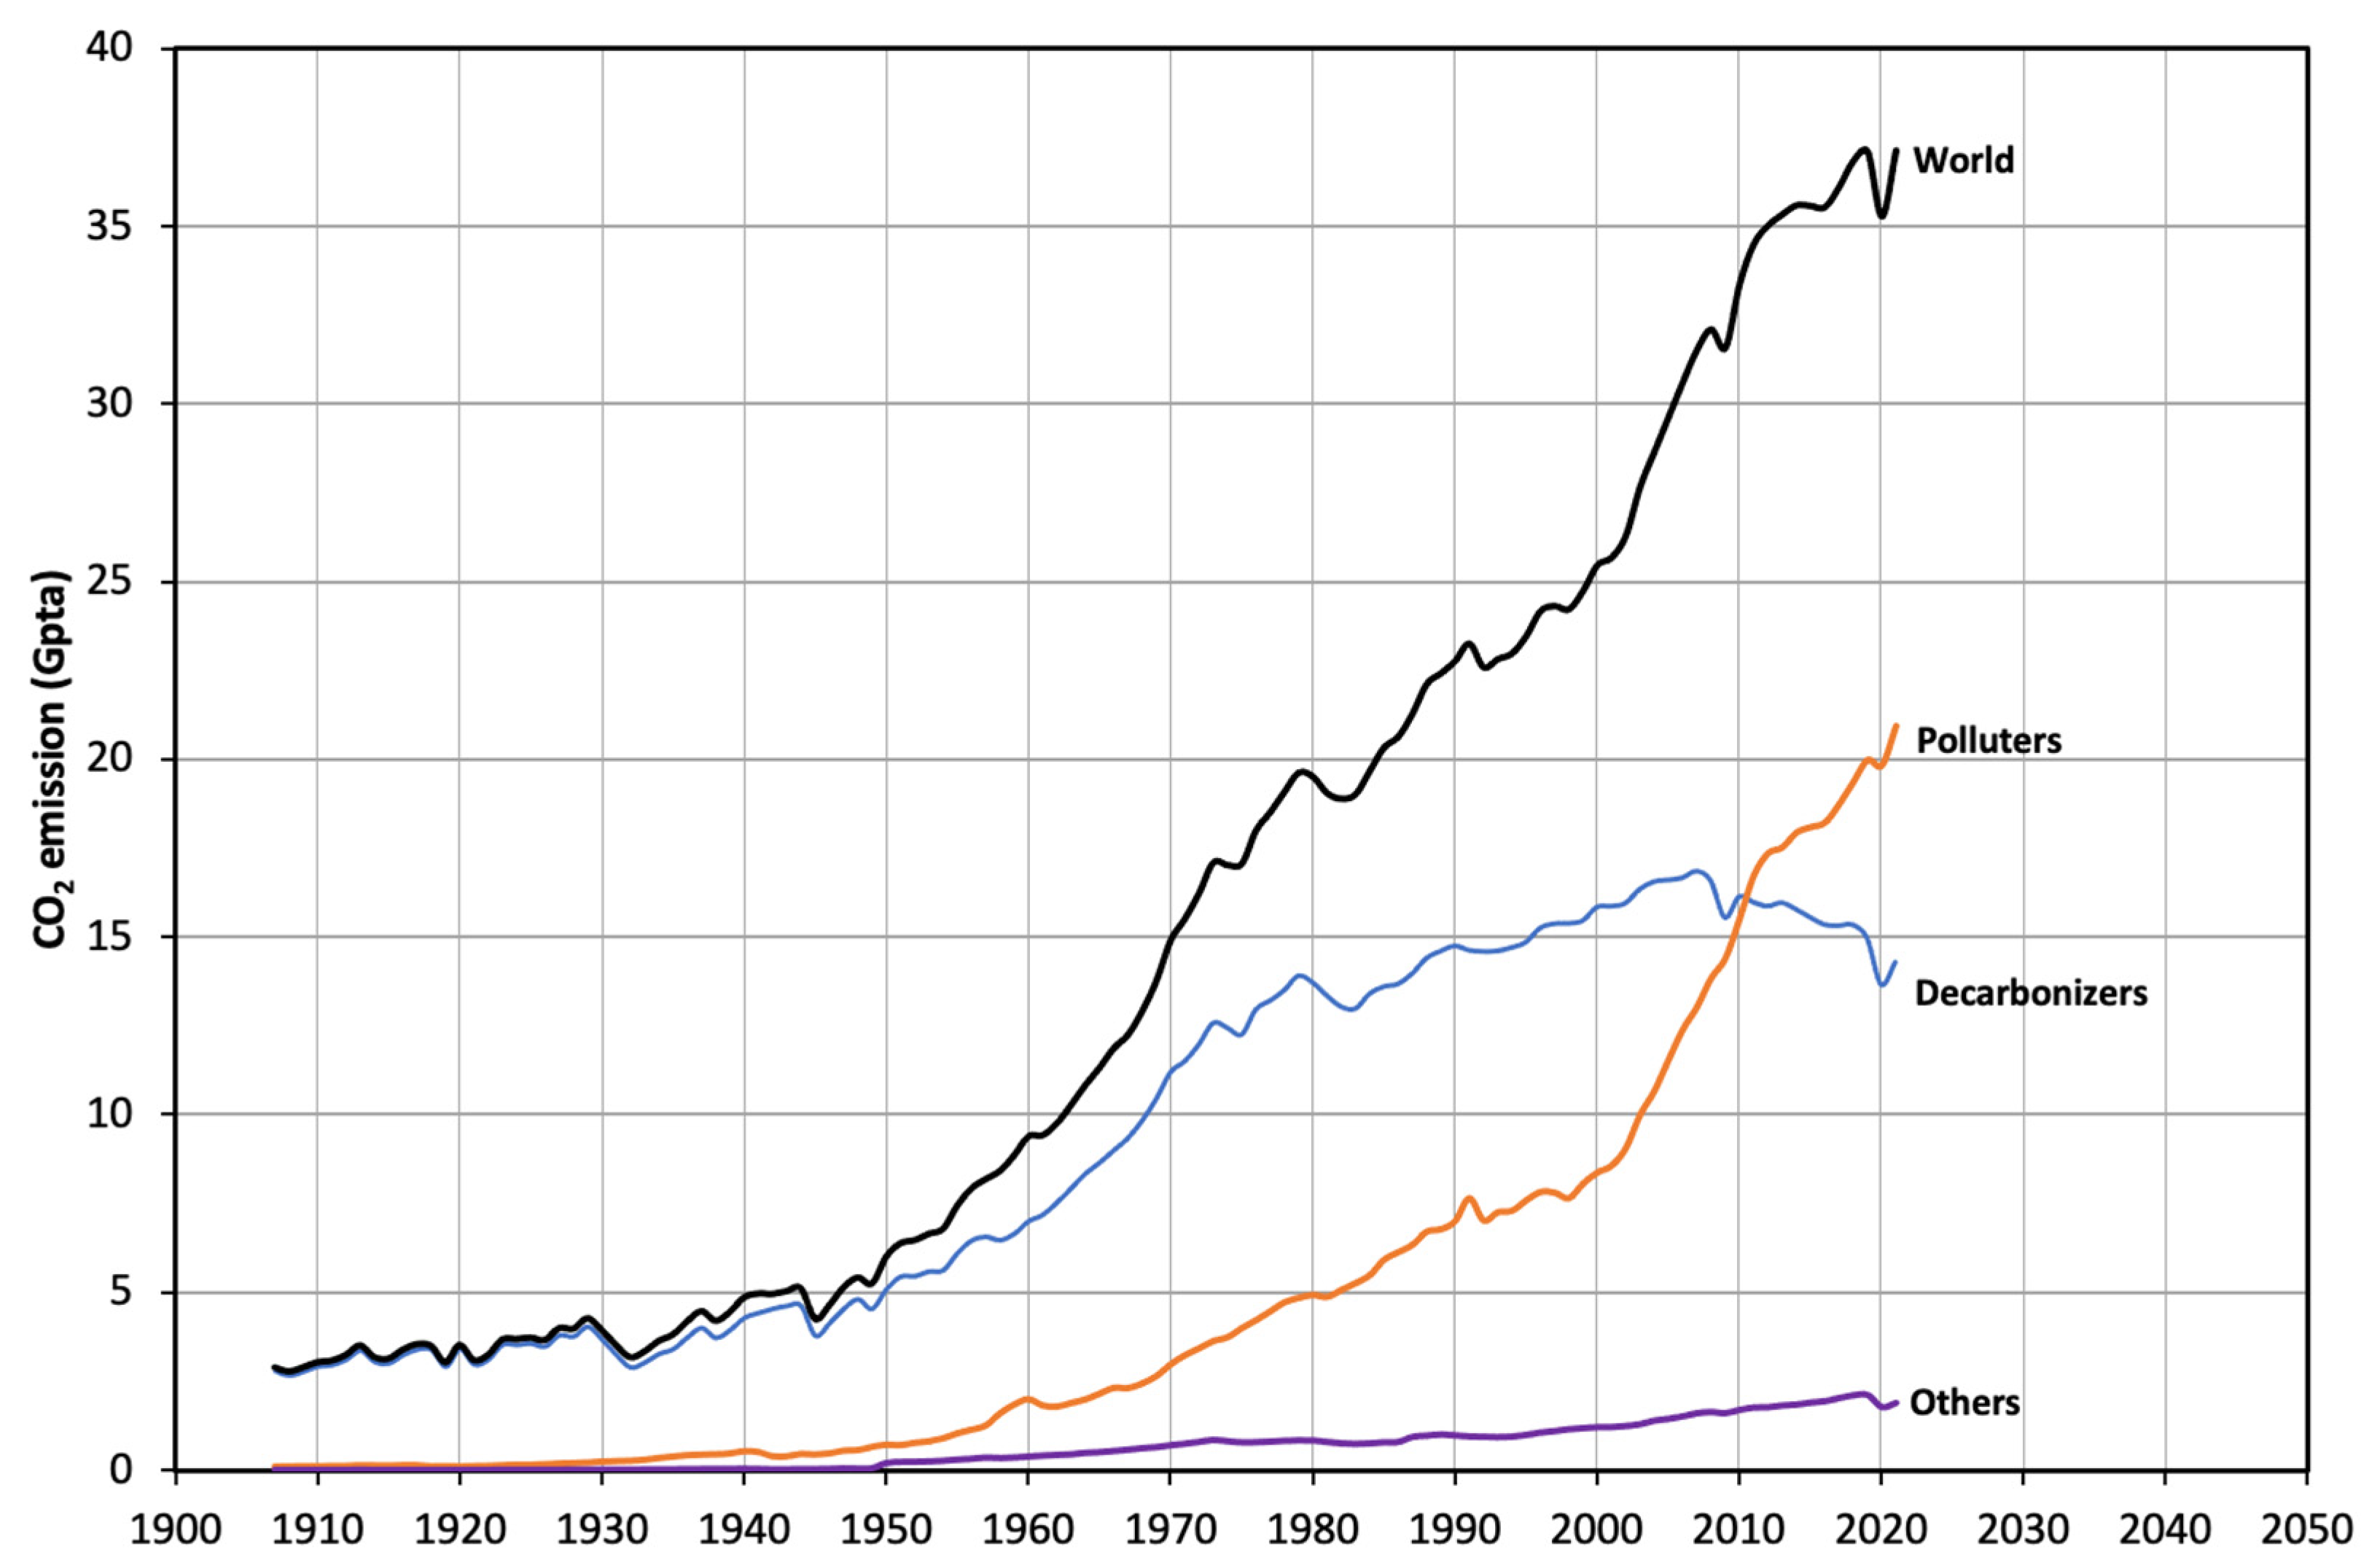
- The top 80 CO2 emitters contributed 95% of the global emissions in 2021. Among them, 55 were decarbonizers, where emissions had either peaked or were in decline; 25 were polluters, where emissions were increasing.
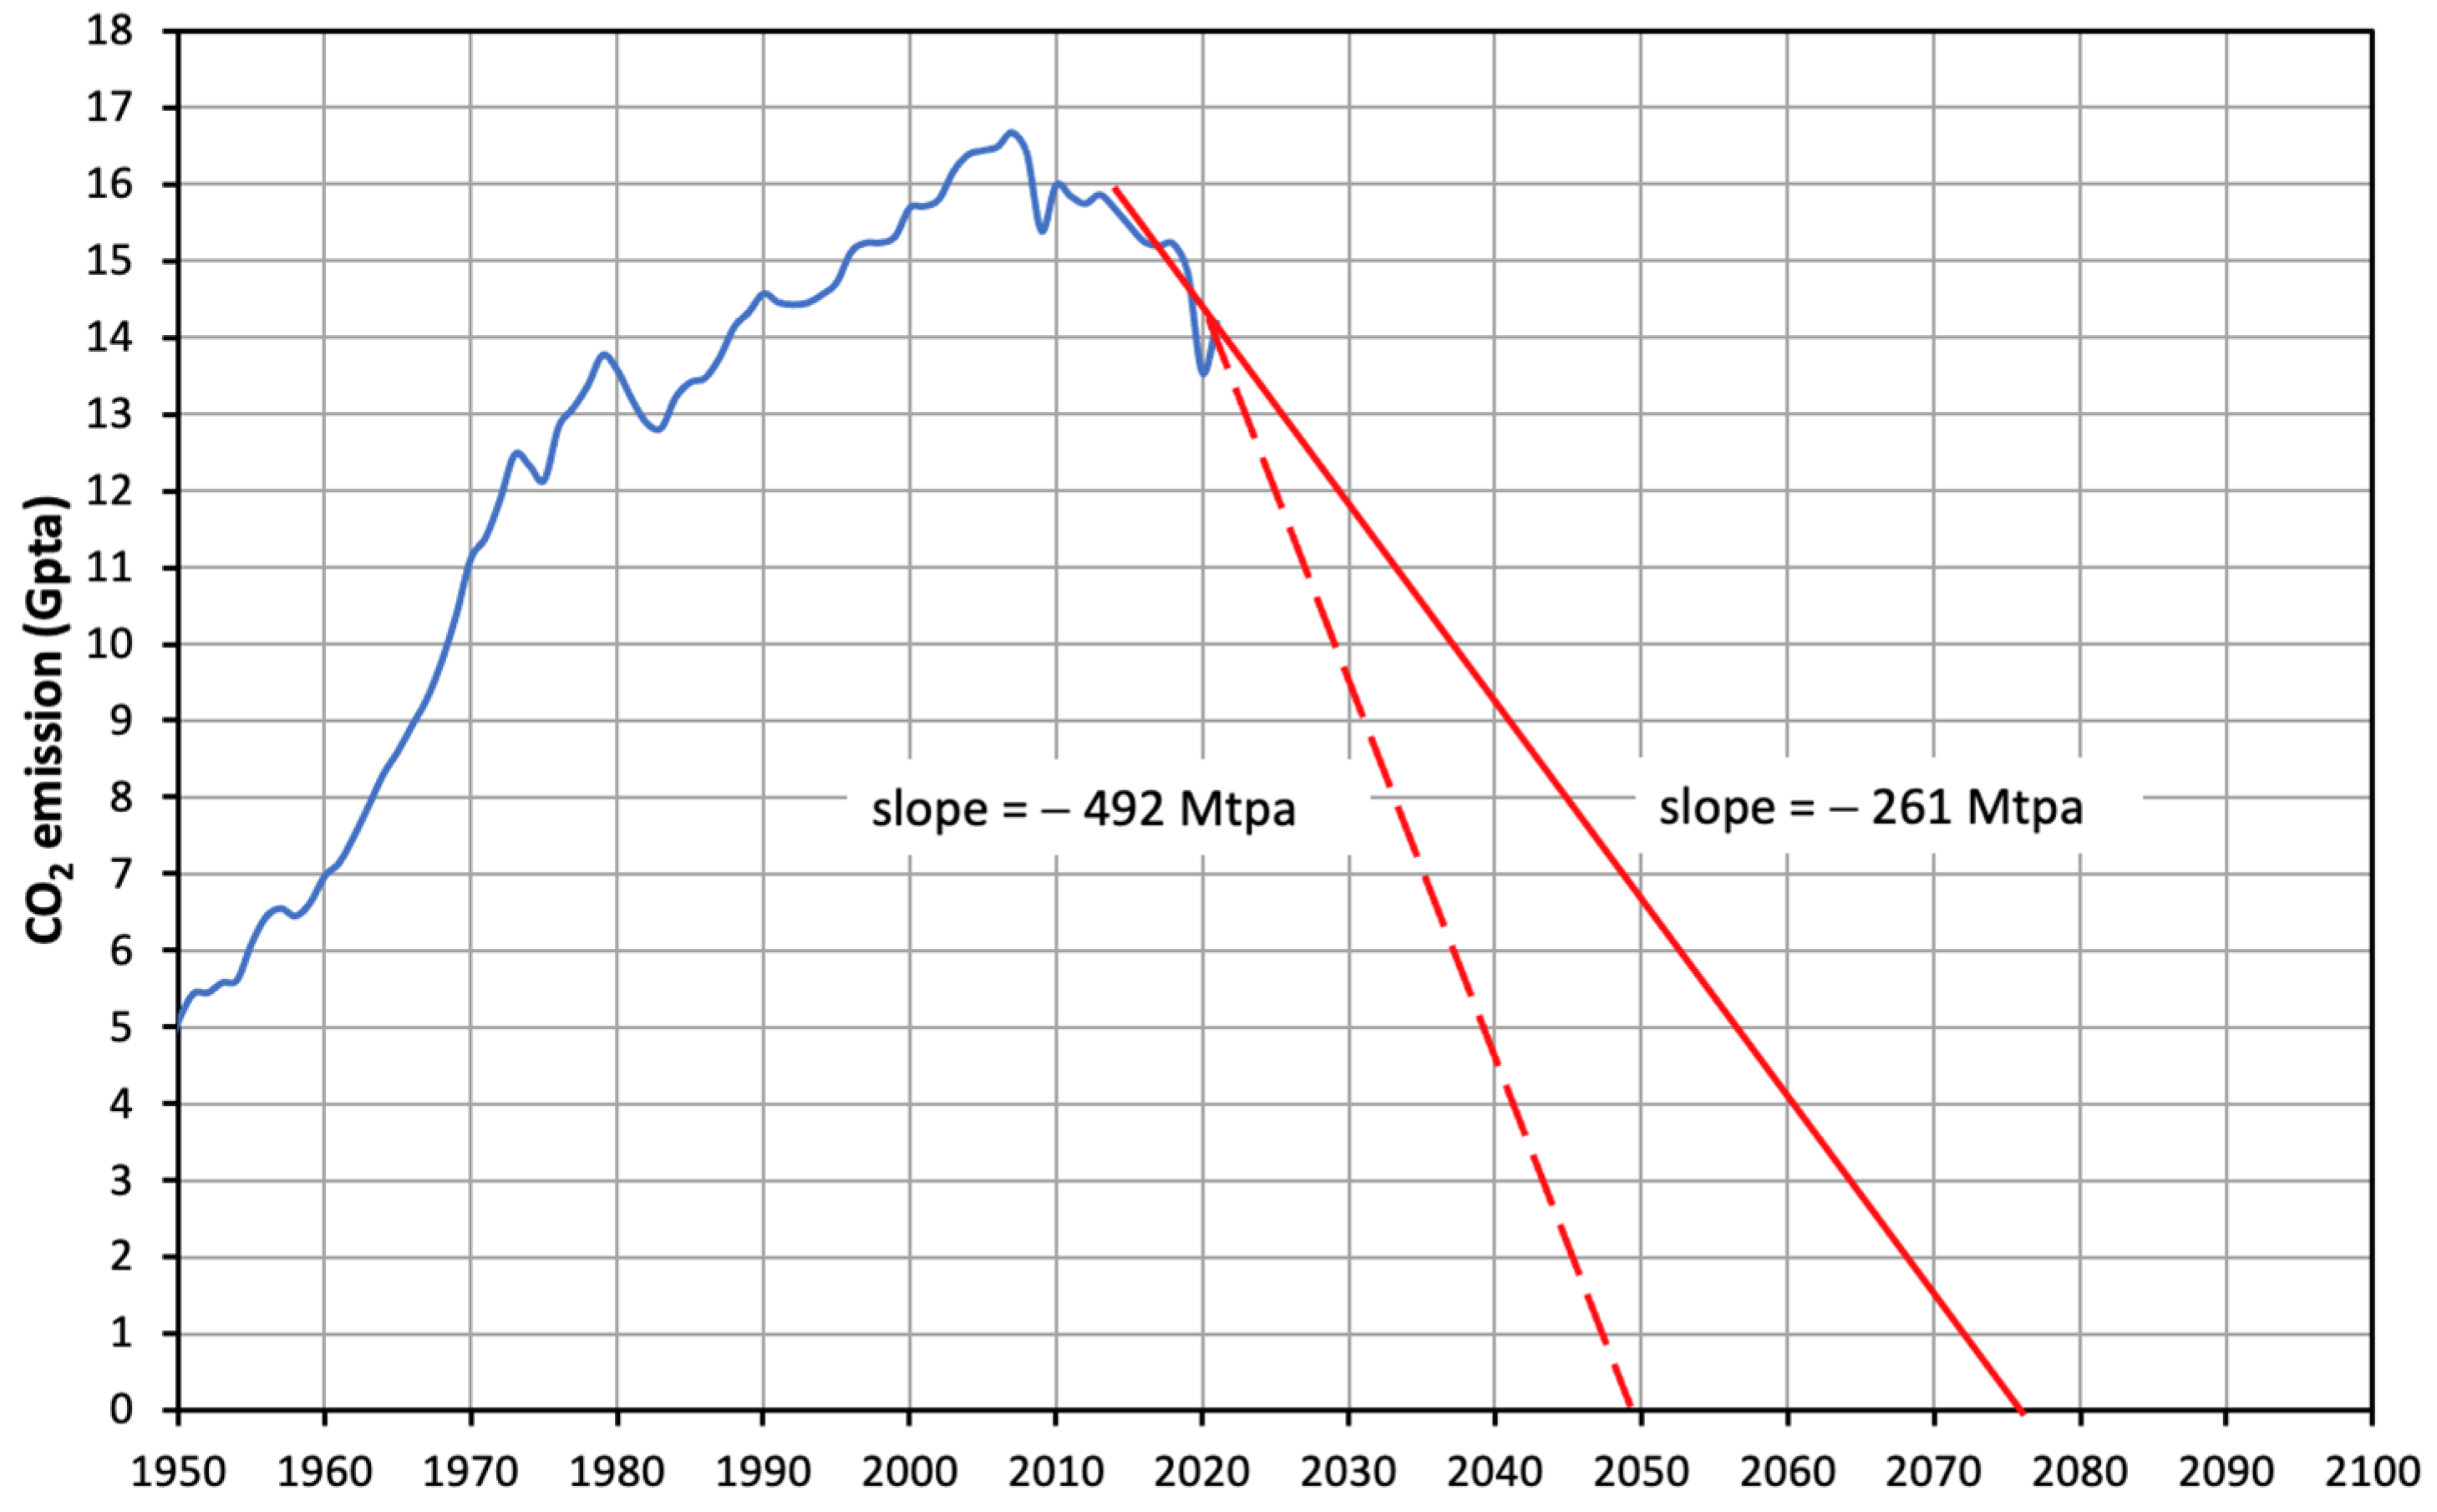
- A linear history matching and forecasting method was applied to historical CO2 emissions data. The results show that global CO2 emissions will increase from 37.1 Gtpa in 2021 to 49.3 Gtpa in 2050 with polluters contributing to 81% and decarbonizers 14% of global CO2 emissions. Furthermore, only 14 economies will achieve net zero by 2050. They are the UK, Italy, Spain, Ukraine, Greece, Portugal, Finland, Serbia, Denmark, Estonia, Trinidad and Tobago, Venezuela, South Korea and Japan.
- The target decarbonization rates to achieve net zero by 2050, over and above current efforts, were estimated for the 80 economies. These rates will increase rapidly as 2050 is approached. Therefore, decarbonization must start as soon as possible and any delay will only make future efforts more costly and difficult.
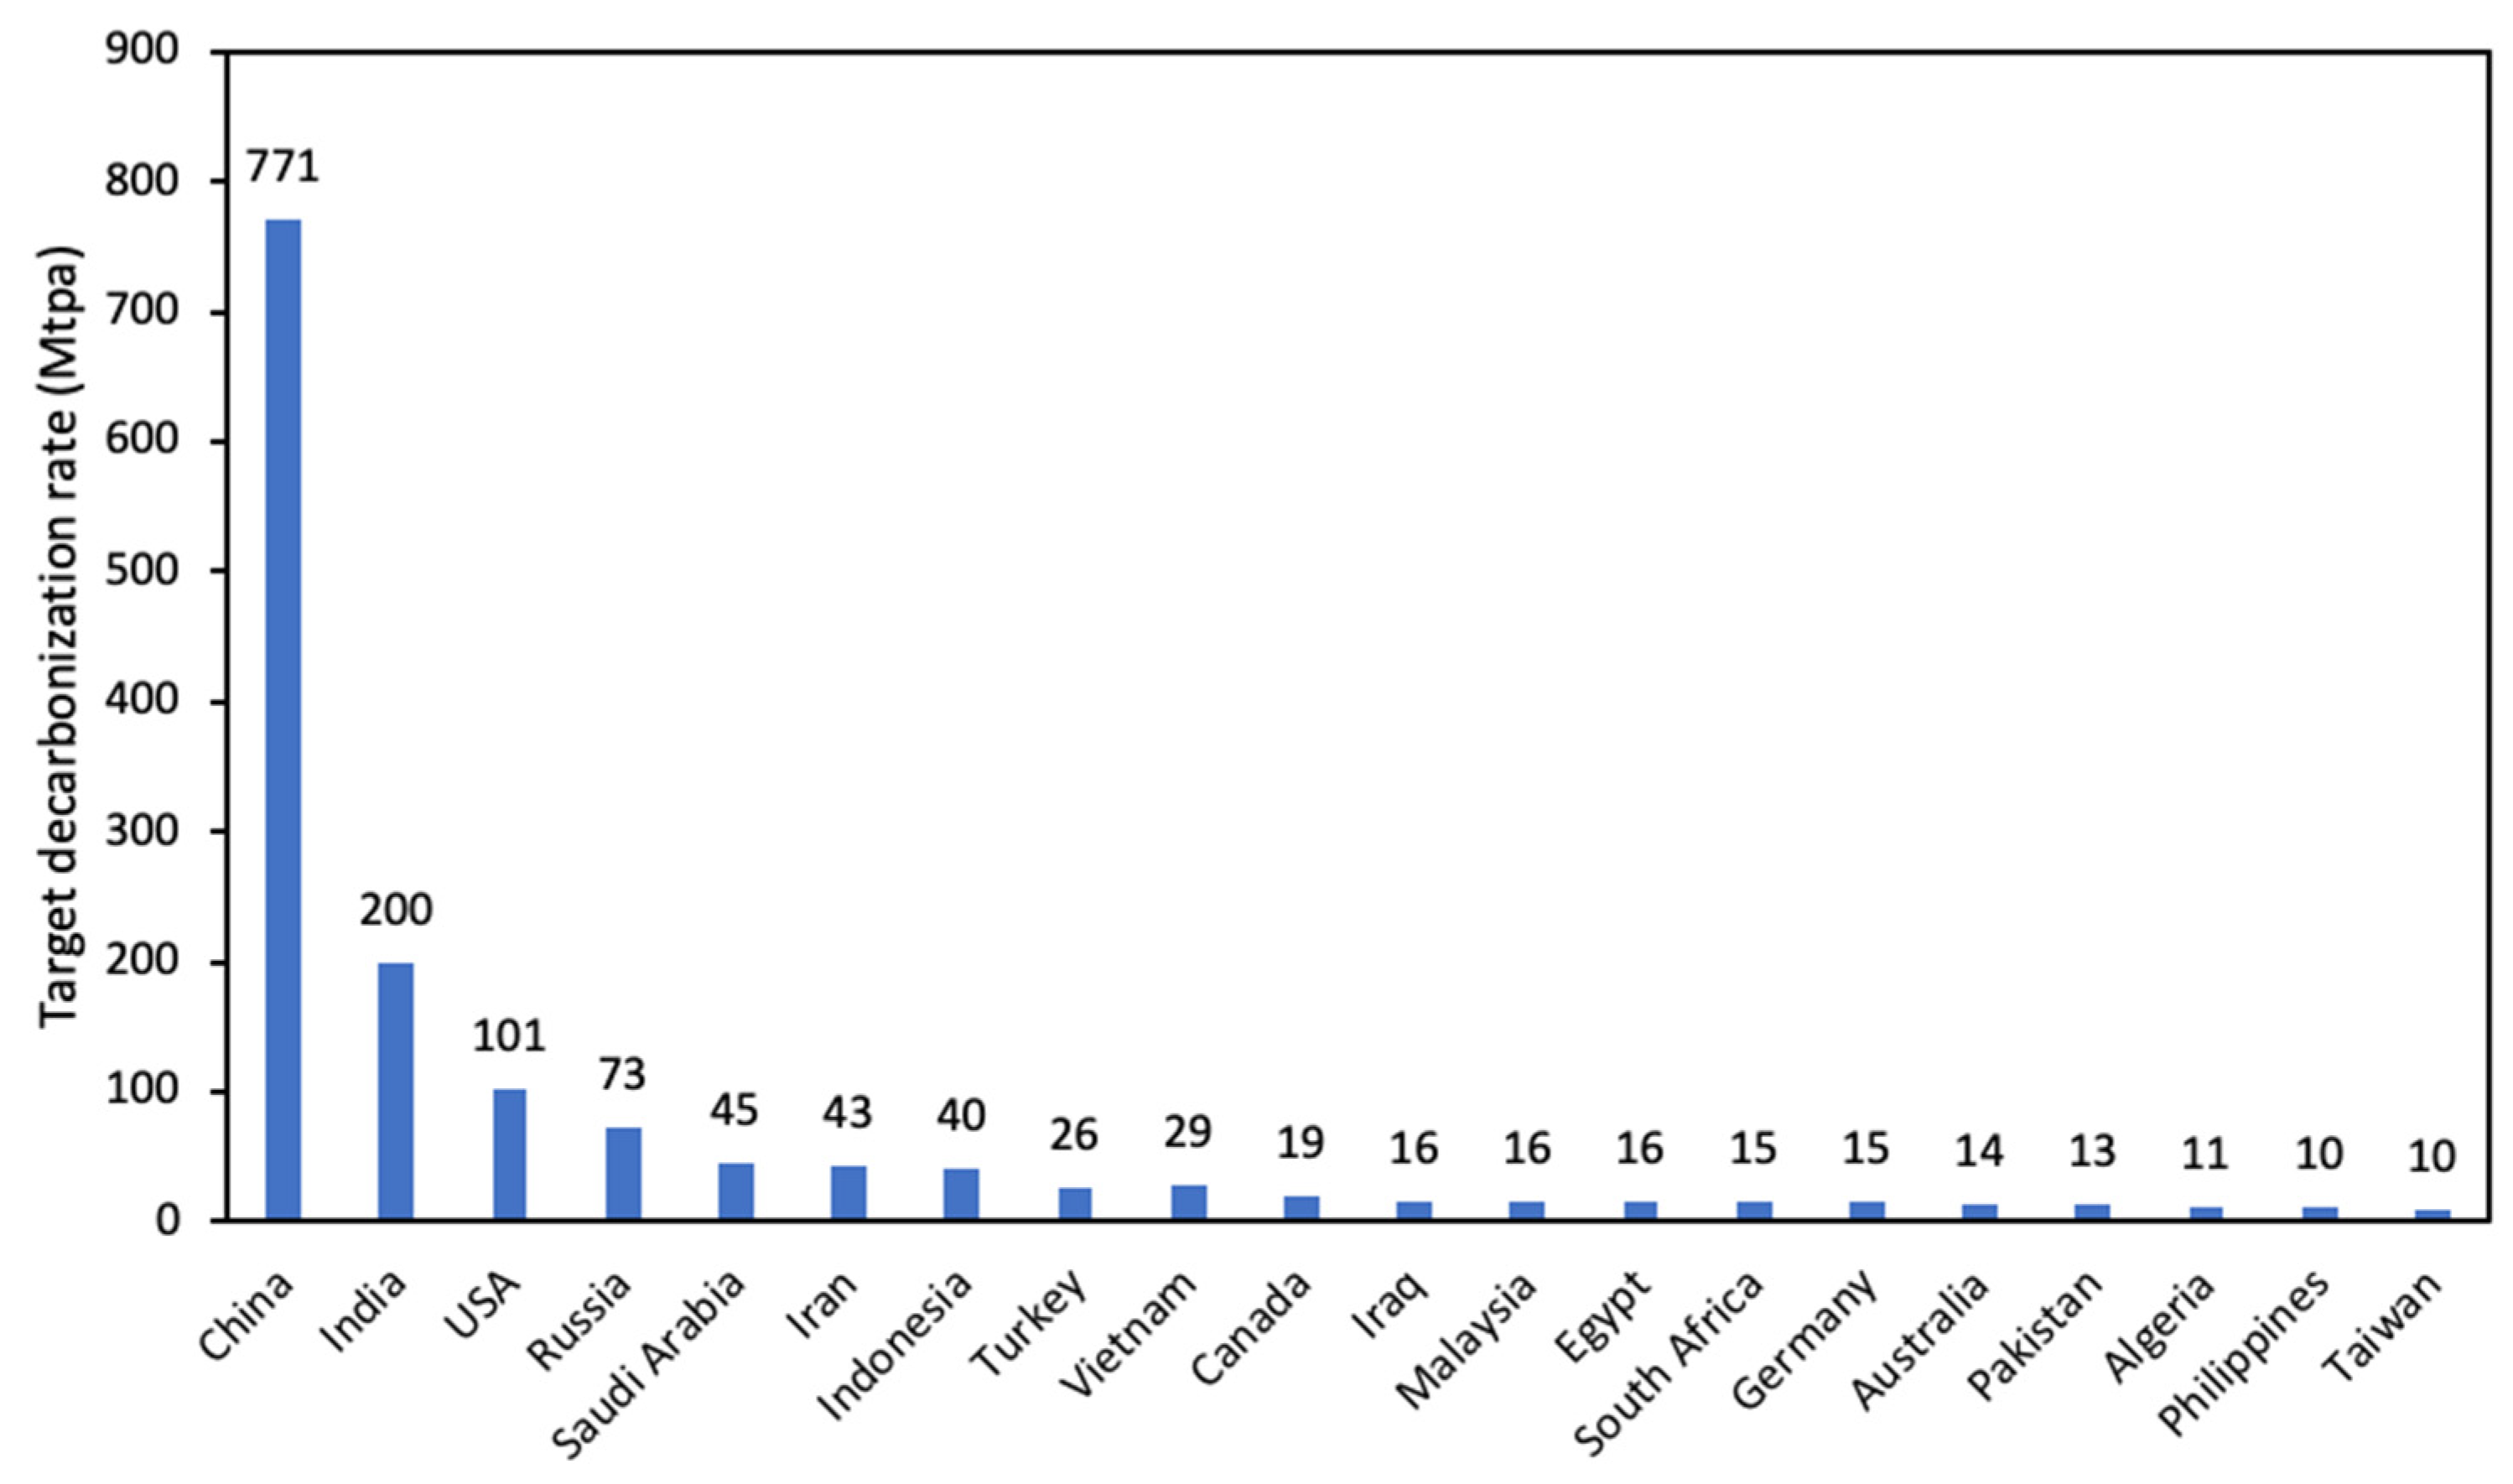
- China, India, the USA, Russia, Saudi Arabia, Iran, Indonesia, Turkey, Vietnam and Canada have the largest decarbonization targets. Their efforts will determine the future of global decarbonization.
- The average increase in RE’s share in TFEC was 0.4 pp per year for most economies over the last decade. Even if this rate were tripled, it is still inadequate to allow RE’s share in TFEC to approach 100% by 2050. Therefore, other decarbonization methods are urgently needed. They will vary with each country’s energy mix. Pathways for coal-dominated, gas-and-oil-dominated, and non-fossil-energy-dominated economies are suggested and their policy implications are discussed.
Author Contributions
Funding
Data Availability Statement
Conflicts of Interest
Nomenclature
| APS | IEA’s announced pledges scenario |
| BAU | Business-as-usual scenario |
| CCS | Carbon capture and storage |
| Coal → gas | Switching from coal to gas in power generation |
| CP-CCS | Use of CCS in coal-fired power plants |
| Coal → H2-CCS | Production of blue hydrogen through coal gasification and CCS |
| Gas → H2-CCS | Production of blue hydrogen through steam methane reforming and CCS |
| GP-CCS | Use of CCS in gas-fired power plants |
| GHG | Greenhouse gas |
| IEA | International Energy Agency |
| Ind-CCS | Use of CCS in industrial plants |
| NA | Not available |
| NREL | National Renewable Energy Laboratory |
| NZE | IEA’s net-zero scenario |
| pp | Percentage point |
| RE | Renewable energy |
| R&D | Research and development |
| SDS | IEA’s sustainable development scenario |
| SMR | Advanced small modular nuclear reactor |
| STEP | IEA’s stated policies scenario |
| TFEC | Total final energy consumption |
| UK | United Kingdom |
| Gtpa | 109 tonnes per annum |
| Mtpa | 106 tonnes per annum |
References
- The Paris Agreement. United Nations. Available online: https://www.un.org/en/climatechange/paris-agreement (accessed on 18 November 2023).
- Climate Change: Atmospheric Carbon Dioxide. NOAA. Available online: https://www.climate.gov/news-features/understanding-climate/climate-change-atmospheric-carbon-dioxide (accessed on 21 March 2023).
- Climate Change: Evidence and Causes. Royal Society. Available online: https://royalsociety.org/topics-policy/projects/climate-change-evidence-causes/basics-of-climate-change/ (accessed on 21 March 2023).
- Home—Climate Science, Risk & Solutions. Available online: https://climateprimer.mit.edu/ (accessed on 21 March 2023).
- Solomon, S.; Plattner, G.K.; Knutti, R.; Friedlingstein, P. Irreversible Climate Change Due to Carbon Dioxide Emissions. Proc. Natl. Acad. Sci. USA 2009, 106, 1704–1709. [Google Scholar] [CrossRef]
- Princiotta, F.T. The Climate Mitigation Challenge—Where Do We Stand? J. Air Waste Manag. Ass. 2021, 71, 1234–1250. [Google Scholar] [CrossRef] [PubMed]
- CO2 Emissions—Our World in Data. Available online: https://ourworldindata.org/co2-emissions (accessed on 21 March 2023).
- Renewable Energy—Powering a Safer Future. United Nations. Available online: https://www.un.org/en/climatechange/raising-ambition/renewable-energy (accessed on 21 March 2023).
- Net Zero Targets. Climate Action Tracker. Available online: https://climateactiontracker.org/methodology/net-zero-targets/ (accessed on 22 March 2023).
- Net Zero Coalition. United Nations. Available online: https://www.un.org/en/climatechange/net-zero-coalition (accessed on 22 March 2023).
- International Renewable Energy Agency. China’s Route to Carbon Neutrality: Perspectives and the Role of Renewables; International Renewable Energy Agency: Abu Dhabi, United Arab Emirates, 2022; ISBN 9789292604493. [Google Scholar]
- The Long-Term Strategy of the United States: Pathways to Net-Zero Greenhouse Gas Emissions by 2050—United States Department of State. Available online: https://www.state.gov/tackling-the-climate-crisis-together/longtermstrategy-3/ (accessed on 18 November 2023).
- COP26: India PM Narendra Modi Pledges Net Zero by 2070—BBC News. Available online: https://www.bbc.com/news/world-asia-india-59125143 (accessed on 17 November 2023).
- An EU Energy Scenario Compatible with the Paris Agreement—CAN Europe. Available online: https://caneurope.org/an-eu-energy-scenario-compatible-with-paris-agreement/ (accessed on 18 November 2023).
- Achieving Net-Zero Emissions. Shell Global. Available online: https://www.shell.com/powering-progress/achieving-net-zero-emissions.html (accessed on 22 March 2023).
- Reaching Net Zero by 2050—Equinor. Available online: https://www.equinor.com/magazine/our-plan-the-energy-transition (accessed on 22 March 2023).
- Chevron Sets Net Zero Aspiration and New GHG Intensity Target—Chevron. Available online: https://www.chevron.com/newsroom/2021/q4/chevron-sets-net-zero-aspiration-and-new-ghg-intensity-target (accessed on 22 March 2023).
- ExxonMobil Announces Ambition for Net Zero Greenhouse Gas Emissions by 2050. ExxonMobil. Available online: https://corporate.exxonmobil.com/News/Newsroom/News-releases/2022/0118_ExxonMobil-announces-ambition-for-net-zero-greenhouse-gas-emissions-by-2050?utm_source=google&utm_medium=cpc&utm_campaign=XOM+%7C+Corp+%7C+Traffic+%7C+OT+%7C+Brand+%7C+Greenhouse+Gas&utm_content=OT+%7C+Brand+%7C+Net+Zero&utm_term=exxon+net+zero&gclid=Cj0KCQjw8e-gBhD0ARIsAJiDsaWtga359jZeiaTRybenUGpjgVi5QanErFgsjNm99nMwnX52awSTsxkaAsJqEALw_wcB&gclsrc=aw.ds (accessed on 22 March 2023).
- Net Zero in 2050, Together with Society. Available online: https://totalenergies.com/company/transforming/ambition/net-zero-2050 (accessed on 22 March 2023).
- Getting to Net Zero: Climate Advocacy in the US. Who We Are. Home. Available online: https://www.bp.com/en_us/united-states/home/who-we-are/advocating-for-net-zero-in-the-us.html?utm_source=google&utm_medium=cpc&utm_campaign=us_netzero_direct&utm_term=net%20zero%20gas&gclid=Cj0KCQjw8e-gBhD0ARIsAJiDsaVzzv2_9FzxfKpjedU7D-sBCKoybrfaQAPRflH6VKWGHEezvr5bhoEaAu8rEALw_wcB (accessed on 22 March 2023).
- Lau, H.C.; Ramakrishna, S.; Zhang, K.; Radhamani, A.V. The Role of Carbon Capture and Storage in the Energy Transition. Energy Fuels 2021, 35, 7364–7386. [Google Scholar] [CrossRef]
- The Net-Zero Transition What It Would Cost, What It Could Bring McKinsey Global Institute in Collaboration with McKinsey Sustainability and McKinsey’s Global Energy & Materials and Advanced Industries Practices. 2022. Available online: https://www.mckinsey.com/~/media/mckinsey/business%20functions/sustainability/our%20insights/the%20net%20zero%20transition%20what%20it%20would%20cost%20what%20it%20could%20bring/the-net-zero-transition-what-it-would-cost-and-what-it-could-bring-final.pdf (accessed on 1 October 2023).
- Jackson, R.B.; Le Quéré, C.; Andrew, R.M.; Canadell, J.G.; Korsbakken, J.I.; Liu, Z.; Peters, G.P.; Zheng, B. Global Energy Growth Is Outpacing Decarbonization. Environ. Res. Lett. 2018, 13, 120401. [Google Scholar] [CrossRef]
- Rockström, J.; Gaffney, O.; Rogelj, J.; Meinshausen, M.; Nakicenovic, N.; Schellnhuber, H.J. A Roadmap for Rapid Decarbonization. Science 2017, 355, 1269–1271. [Google Scholar] [CrossRef] [PubMed]
- Urpelainen, J. The Limits of Carbon Reduction Roadmaps. Science 2017, 356, 1019. [Google Scholar] [CrossRef] [PubMed]
- Lau, H.C.; Ramakrishna, S.; Zhang, K.; Hameed, M.Z.S. A Decarbonization Roadmap for Singapore and Its Energy Policy Implications. Energies 2021, 14, 6455. [Google Scholar] [CrossRef]
- Lau, H.C.; Ramakrishna, S. A Roadmap for Decarbonization of Singapore and Its Implications for ASEAN Opportunities for 4IR Technologies and Sustainable Development. Asian Pac. Tech Monit. 2021, 38, 29–39. [Google Scholar]
- Lau, H.C. Decarbonization Roadmaps for ASEAN and Their Implications. Energy Rep. 2022, 8, 6000–6022. [Google Scholar] [CrossRef]
- Lau, H.C. Decarbonizing Thailand’s Economy: A Proposal. Energies 2022, 15, 9498. [Google Scholar] [CrossRef]
- Zhang, K.; Bokka, H.K.; Lau, H.C. Decarbonizing the Energy and Industry Sectors in Thailand by Carbon Capture and Storage. J. Pet. Sci. Eng. 2022, 209, 109979. [Google Scholar] [CrossRef]
- Bokka, H.K.; Lau, H.C. Decarbonising Vietnam’s Power and Industry Sectors by Carbon Capture and Storage. Energy 2023, 262, 125361. [Google Scholar] [CrossRef]
- Lau, H.C.; Tsai, S.C. A Decarbonization Roadmap for Taiwan and Its Energy Policy Implications. Sustainability 2022, 14, 8425. [Google Scholar] [CrossRef]
- Zhang, K.; Lau, H.C.; Chen, Z. Regional Carbon Capture and Storage Opportunities in Alberta, Canada. Fuel 2022, 322, 124224. [Google Scholar] [CrossRef]
- Zhang, K.; Lau, H.C.; Chen, Z. Using Blue Hydrogen to Decarbonize Heavy Oil and Oil Sands Operations in Canada. ACS Sustain. Chem. Eng. 2022, 10, 10003–10013. [Google Scholar] [CrossRef]
- Archive. ATB. NREL. Available online: https://atb.nrel.gov/archive (accessed on 18 November 2023).
- Gagnon, P.; Brown, M.; Steinberg, D.; Brown, P.; Awara, S.; Carag, V.; Cohen, S.; Cole, W.; Ho, J.; Inskeep, S.; et al. 2022 Standard Scenarios Report: A U.S. Electricity Sector Outlook. 2022. Available online: https://www.nrel.gov/docs/fy23osti/84327.pdf (accessed on 1 October 2023).
- Scenario Analysis. ConocoPhillips. Available online: https://www.conocophillips.com/sustainability/managing-climate-related-risks/strategy/scenario-analysis/ (accessed on 18 November 2023).
- Scenario Analysis and Resiliency. Exxon Mobil Corporation (XOM). Available online: https://investor.exxonmobil.com/esg/climate/scenario-analysis-and-resiliency (accessed on 18 November 2023).
- Energy Economics. Home. Available online: https://www.bp.com/en/global/corporate/energy-economics.html (accessed on 18 November 2023).
- New Energy Security Scenarios Explore How the World Could Evolve. Shell Global. Available online: https://www.shell.com/media/news-and-media-releases/2023/new-energy-security-scenarios-explore-how-the-world-could-evolve.html (accessed on 18 November 2023).
- Understanding GEC Model Scenarios—Global Energy and Climate Model—Analysis—IEA. Available online: https://www.iea.org/reports/global-energy-and-climate-model/understanding-gec-model-scenarios (accessed on 17 November 2023).
- Stated Policies Scenario (STEPS)—Global Energy and Climate Model—Analysis—IEA. Available online: https://www.iea.org/reports/global-energy-and-climate-model/stated-policies-scenario-steps (accessed on 17 November 2023).
- Introducing the Sustainable Development Scenario—Event—IEA. Available online: https://www.iea.org/events/introducing-the-sustainable-development-scenario (accessed on 17 November 2023).
- Renewable Energy 101. National Geographic—YouTube. Available online: https://www.youtube.com/watch?v=1kUE0BZtTRc&ab_channel=NationalGeographic (accessed on 21 March 2023).
- End New Oil, Gas and Coal Funding to Reach Net Zero, Says IEA. Reuters. Available online: https://www.reuters.com/business/environment/radical-change-needed-reach-net-zero-emissions-iea-2021-05-18/ (accessed on 22 March 2023).
- Pathway to Critical and Formidable Goal of Net-Zero Emissions by 2050 Is Narrow but Brings Huge Benefits, According to IEA Special Report—News—IEA. Available online: https://www.iea.org/news/pathway-to-critical-and-formidable-goal-of-net-zero-emissions-by-2050-is-narrow-but-brings-huge-benefits (accessed on 22 March 2023).
- We Must Stop Fossil Fuels Causing Global Warming, before the World Stops Using Fossil Fuels—Prof Myles Allen. University of Oxford. Available online: https://www.ox.ac.uk/news/2022-11-10-we-must-stop-fossil-fuels-causing-global-warming-before-world-stops-using-fossil-fuels (accessed on 22 March 2023).
- 8 Reasons Why We Need to Phase Out the Fossil Fuel Industry—Greenpeace USA. Available online: https://www.greenpeace.org/usa/research/8-reasons-why-we-need-to-phase-out-the-fossil-fuel-industry/ (accessed on 22 March 2023).
- International Energy Agency. Net Zero by 2050—A Roadmap for the Global Energy Sector; International Energy Agency: Paris, France, 2021. [Google Scholar]
- bp Statistical Review of World Energy 2022. Available online: https://www.bp.com/content/dam/bp/business-sites/en/global/corporate/pdfs/energy-economics/statistical-review/bp-stats-review-2022-full-report.pdf (accessed on 1 October 2023).
- Tsai, W.-H.; Sundaramoorthy, S.; Kamath, D.; Nimbalkar, S.; Price, C.; Wenning, T.; Cresko, J. Energy Efficiency as a Foundational Technology Pillar for Industrial Decarbonization. Sustainability 2023, 15, 9487. [Google Scholar] [CrossRef]
- Li, J.; Xu, G. Circular Economy towards Zero Waste and Decarbonization. Circ. Econ. 2022, 1, 100002. [Google Scholar] [CrossRef]
- Boyle, G. Renewable Energy: Power for Sustainable Future, 3rd ed.; Oxford University Press: Oxford, UK, 2012. [Google Scholar]
- Lau, H.C. Evaluation of Decarbonization Technologies for ASEAN Countries via an Integrated Assessment Tool. Sustainability 2022, 14, 5827. [Google Scholar] [CrossRef]
- Lau, H.C. Decarbonization of ASEAN’s Power Sector: A Holistic Approach. Energy Rep. 2023, 9, 676–702. [Google Scholar] [CrossRef]
- U.S. Energy Information Administration—EIA—Independent Statistics and Analysis. Available online: https://www.eia.gov/environment/emissions/co2_vol_mass.php (accessed on 22 March 2023).
- Maldal, T.; Tappel, I.M. CO2 Underground Storage for Snøhvit Gas Field Development. Energy 2004, 29, 1403–1411. [Google Scholar] [CrossRef]
- Zhang, K.; Lau, H.C.; Chen, Z. Extension of CO2 Storage Life in the Sleipner CCS Project by Reservoir Pressure Management. J. Nat. Gas Sci. Eng. 2022, 108, 104814. [Google Scholar] [CrossRef]
- Global Status of CCS 2022—Global CCS Institute. Available online: https://www.globalccsinstitute.com/resources/global-status-of-ccs-2022/ (accessed on 22 March 2023).
- Section 45Q Credit for Carbon Oxide Sequestration—Policies—IEA. Available online: https://www.iea.org/policies/4986-section-45q-credit-for-carbon-oxide-sequestration (accessed on 22 March 2023).
- Bui, M.; Adjiman, C.S.; Bardow, A.; Anthony, E.J.; Boston, A.; Brown, S.; Fennell, P.S.; Fuss, S.; Galindo, A.; Hackett, L.A.; et al. Carbon Capture and Storage (CCS): The Way Forward. Energy Environ. Sci. 2018, 11, 1062–1176. [Google Scholar] [CrossRef]
- The Colors of Hydrogen: An Overview. EWE AG. Available online: https://www.ewe.com/en/shaping-the-future/hydrogen/the-colours-of-hydrogen (accessed on 22 March 2023).
- Lau, H.C. The Role of Fossil Fuels in a Hydrogen Economy. In Proceedings of the International Petroleum Technology Conference, Virtual, 23–25 March 2021. [Google Scholar] [CrossRef]
- Advanced Small Modular Reactors (SMRs). Department of Energy. Available online: https://www.energy.gov/ne/advanced-small-modular-reactors-smrs (accessed on 21 March 2023).
- Total Final Consumption—Energy Education. Available online: https://energyeducation.ca/encyclopedia/Total_final_consumption (accessed on 22 March 2023).
- Lau, H.C. The Contribution of Carbon Capture and Storage to the Decarbonization of Coal-Fired Power Plants in Selected Asian Countries. Energy Fuels 2023, 37, 15919–15934. [Google Scholar] [CrossRef]
- Longship CCS Project—Gassnova. Available online: https://gassnova.no/en/full-scale-ccs (accessed on 22 March 2023).
- Northern Lights—CCUS around the World in 2021—Analysis—IEA. Available online: https://www.iea.org/reports/ccus-around-the-world-in-2021/northern-lights (accessed on 18 November 2023).
- Porthos—The CCUS Hub. Available online: https://ccushub.ogci.com/focus_hubs/rotterdam-porthos/ (accessed on 22 March 2023).
- Porthos Carbon Capture and Storage Project, Rotterdam, Netherlands. Available online: https://www.nsenergybusiness.com/projects/porthos-carbon-capture-and-storage-ccs-project/ (accessed on 22 March 2023).
- Aramis—The CCUS Hub. Available online: https://ccushub.ogci.com/focus_hubs/aramis/ (accessed on 22 March 2023).
- East Coast Cluster. Available online: https://eastcoastcluster.co.uk/ (accessed on 22 March 2023).
- East Coast Cluster—The CCUS Hub. Available online: https://ccushub.ogci.com/focus_hubs/east-coast-cluster/ (accessed on 22 March 2023).
- Joint Venture Bayou Bend CCS Finalized—Chevron. Available online: https://www.chevron.com/newsroom/2022/q2/chevron-talos-and-carbonvert-announce-closing-of-joint-venture-expansion (accessed on 18 November 2023).
- Equinor Joins Chevron, Talos on Bayou Bend CCS Project. Offshore. Available online: https://www.offshore-mag.com/energy-transition/article/14298218/equinor-joins-chevron-talos-on-bayou-bend-ccs-project (accessed on 18 November 2023).
- Talos Eyes Big Carbon Capture Role in the US and Beyond. Available online: https://jpt.spe.org/talos-eyes-big-carbon-capture-role-in-the-us-and-beyond (accessed on 18 November 2023).
- Houston CCS Alliance. Available online: https://houstonccs.com/?gclid=Cj0KCQjw8e-gBhD0ARIsAJiDsaVMT6IFCHW8LrSSjrza_8HAuJy2c69pcTBQGCT7MWPRJj542mntP0saAnJIEALw_wcB (accessed on 22 March 2023).
- 2022 Carbon Tax Rates in Europe. European Countries with a Carbon Tax. Available online: https://taxfoundation.org/carbon-taxes-in-europe-2022/ (accessed on 22 March 2023).
- 45Q Carbon Capture Credit Raised to $85 From $50—Carbon Herald. Available online: https://carbonherald.com/45q-carbon-capture-tax-credit-raised-to-85/ (accessed on 1 October 2023).
- Aramco Jubail—The CCUS Hub. Available online: https://ccushub.ogci.com/focus_hubs/aramco-jubail-ccs-hub/ (accessed on 18 November 2023).
- Saudi Aramco Identifying Fields for EOR with CO2 Injection from Jubail CCS Plant. S&P Global Commodity Insights. Available online: https://www.spglobal.com/commodityinsights/en/market-insights/latest-news/oil/022023-saudi-aramco-identifying-fields-for-eor-with-co2-injection-from-jubail-ccs-plant (accessed on 18 November 2023).
- Saudi Aramco Poised to Tender Huge Carbon Capture Project Targeting Multiple Gas Plants. Upstream Online. Available online: https://www.upstreamonline.com/exclusive/saudi-aramco-poised-to-tender-huge-carbon-capture-project-targeting-multiple-gas-plants/2-1-1389566 (accessed on 18 November 2023).
- Carbon Capture, Utilization & Storage. Aramco. Available online: https://www.aramco.com/en/sustainability/climate-change/managing-our-footprint/carbon-capture-utilization-and-storage?gclid=CjwKCAiAgeeqBhBAEiwAoDDhnwDoK2iYlz7CXovyBuBEDLgY_fFU0tg6Hfys4VpfcIO5WfEo9DSDghoCp7wQAvD_BwE (accessed on 18 November 2023).
- Malaysia Energy Carbon Capture and Storage. Available online: https://www.trade.gov/market-intelligence/malaysia-energy-carbon-capture-and-storage (accessed on 18 November 2023).
- Kasawari Carbon Capture and Sequestration (CCS) Project, Malaysia. Available online: https://www.nsenergybusiness.com/projects/kasawari-carbon-capture-and-storage-project/ (accessed on 18 November 2023).
- Topics. Mitsui Concludes Agreement on the Joint Development of CCS Project in Malaysia—MITSUI & Co., Ltd. Available online: https://www.mitsui.com/jp/en/topics/2023/1246779_13949.html (accessed on 18 November 2023).
- Indonesia Regulates Carbon Capture and Storage in Upstream Operations. Upstream Online. Available online: https://www.upstreamonline.com/carbon-capture/indonesia-regulates-carbon-capture-and-storage-in-upstream-operations/2-1-1435246 (accessed on 18 November 2023).
- Indonesia to Be the Pioneer of CCS in the Region: Collaboration in Maintaining Growth towards Low Emission Future. Available online: https://www.prnewswire.com/apac/news-releases/indonesia-to-be-the-pioneer-of-ccs-in-the-region-collaboration-in-maintaining-growth-towards-low-emission-future-301917455.html (accessed on 18 November 2023).
- Chinese Energy Giant Strives for Carbon Neutrality, Launching Mega Carbon Capture Project-Xinhua. Available online: https://english.news.cn/20230603/ee847bb037b142a182152f1a0485348c/c.html (accessed on 18 November 2023).
- Wang, P.; Shi, B.; Li, N.; Kang, R.; Li, Y.; Wang, G.; Yang, L. CCUS Development in China and Forecast Its Contribution to Emission Reduction. Sci. Rep. 2023, 13, 17811. [Google Scholar] [CrossRef]
- Is It Time to Go “All In” on Electric Vehicles? Econofact. Available online: https://econofact.org/is-it-time-to-go-all-in-on-electric-vehicles (accessed on 22 March 2023).
- Global EV Outlook 2023—Analysis—IEA. Available online: https://www.iea.org/reports/global-ev-outlook-2023 (accessed on 18 November 2023).
- Alternative Fuels Data Center: Developing Infrastructure to Charge Electric Vehicles. Available online: https://afdc.energy.gov/fuels/electricity_infrastructure.html (accessed on 22 March 2023).
- Electric Cars Will Challenge State Power Grids. The Pew Charitable Trusts. Available online: https://www.pewtrusts.org/en/research-and-analysis/blogs/stateline/2020/01/09/electric-cars-will-challenge-state-power-grids (accessed on 22 March 2023).
- Ahmed, S.; Bloom, I.; Jansen, A.N.; Tanim, T.; Dufek, E.J.; Pesaran, A.; Burnham, A.; Carlson, R.B.; Dias, F.; Hardy, K.; et al. Enabling Fast Charging—A Battery Technology Gap Assessment. J. Power Sources 2017, 367, 250–262. [Google Scholar] [CrossRef]
- Global Hydrogen Strategies. ITM Power. Available online: https://itm-power.com/global-h2-strategies (accessed on 22 March 2023).
- International Renewable Energy Agency. Geopolitics of the Energy Transformation: The Hydrogen Factor; International Renewable Energy Agency: Abu Dhabi, United Arab Emirates, 2022. [Google Scholar]
- Countries Roll Out Green Hydrogen Strategies, Electrolyzer Targets. Available online: https://www.powermag.com/countries-roll-out-green-hydrogen-strategies-electrolyzer-targets/ (accessed on 22 March 2023).
- Lau, H.C. The Color of Energy: The Competition to Be the Energy of the Future. In Proceedings of the International Petroleum Technology Conference, Online, 23–25 March 2021. [Google Scholar]


| Economy | CO2 Emissions in 2021 (Mtpa) [7] | Estimated Net-Zero Date | Est. CO2 Emissions in 2050 (Mtpa) | Current CO2 Increase Rate (Mtpa) | CO2 Increase Rate to Reach Net Zero by 2050 (Mtpa) | Decarbonization Target in 2021 to Achieve Net Zero by 2050 (Mtpa) | Confidence Level of Forecast * | |
|---|---|---|---|---|---|---|---|---|
| 1 | USA | 5007 | 2091 | 2900 | −71.40 | −172.67 | −101.27 | M |
| 2 | Japan | 1067 | 2050 | 60 | −33.80 | −36.81 | −3.01 | M |
| 3 | Germany | 674 | 2108 | 510 | −8.50 | −23.27 | −14.77 | H |
| 4 | South Korea | 616 | 2050 | 0 | −19.41 | −19.41 | 0.00 | L |
| 5 | Brazil | 489 | 2074 | 215 | −8.90 | −16.86 | −7.96 | M |
| 6 | Mexico | 407 | 2064 | 132 | −9.60 | −14.04 | −4.44 | M |
| 7 | UK | 347 | 2045 | 0 | −14.10 | −11.96 | 2.14 | H |
| 8 | Italy | 329 | 2047 | 0 | −11.90 | −11.33 | 0.57 | H |
| 9 | Poland | 329 | 2083 | 147 | −4.51 | −11.33 | −6.82 | L |
| 10 | France | 306 | 2060 | 80 | −7.60 | −10.55 | −2.95 | H |
| 11 | Thailand | 278 | 2100 | 177 | −3.50 | −9.60 | −6.10 | L |
| 12 | Spain | 234 | 2042 | 0 | −10.00 | −8.06 | 1.94 | M |
| 13 | UAE | 202 | 2098 | 126 | −2.60 | −7.04 | −4.44 | L |
| 14 | Ukraine | 204 | 2042 | 0 | −9.70 | −6.96 | 2.74 | L |
| 15 | The Netherlands | 141 | 2097 | 91 | −1.90 | −4.86 | −2.96 | L |
| 16 | Czechia | 97.1 | 2061 | 25 | −2.40 | −3.35 | −0.95 | M |
| 17 | Belgium | 95.7 | 2069 | 36 | −1.90 | −3.30 | −1.40 | M |
| 18 | Columbia | 91.7 | 2100 | 58 | −1.14 | −3.16 | −2.02 | L |
| 19 | Venezuela | 79.5 | 2027 | 0 | −14.10 | −2.75 | 11.35 | M |
| 20 | Romania | 79.3 | 2055 | 11 | −2.04 | −2.74 | −0.71 | M |
| 21 | Austria | 64.6 | 2114 | 45 | −0.70 | −2.23 | −1.53 | L |
| 22 | Belarus | 59.6 | NA | 60 | 0.00 | −2.06 | −2.06 | L |
| 23 | North Korea | 56.4 | NA | 56 | 0.00 | −1.94 | −1.94 | L |
| 24 | Greece | 56.3 | 2035 | 0 | −4.10 | −1.94 | 2.16 | H |
| 25 | Israel | 54.5 | 2055 | 8 | −1.60 | −1.88 | −0.28 | L |
| 26 | Hungary | 48.4 | 2088 | 26 | −0.67 | −1.67 | −1.00 | L |
| 27 | Bulgaria | 42.6 | 2068 | 15 | −0.85 | −1.47 | −0.62 | M |
| 28 | Ecuador | 41.3 | NA | 41 | 0.00 | −1.42 | −1.42 | L |
| 29 | Norway | 40.9 | 2077 | 20 | −0.73 | −1.41 | −0.69 | L |
| 30 | Portugal | 40.8 | 2047 | 0 | −1.56 | −1.41 | −0.15 | M |
| 31 | Finland | 37.6 | 2040 | 0 | −2.10 | −1.30 | 0.80 | H |
| 32 | Ireland | 37.5 | 2076 | 17 | −0.66 | −1.29 | −0.63 | L |
| 33 | Trinidad & Tobago | 36.1 | 2047 | 0 | −1.40 | −1.25 | 0.15 | M |
| 34 | Sweden | 35.8 | 2063 | 12 | −0.95 | −1.24 | −0.29 | M |
| 35 | Slovakia | 35.3 | 2070 | 13 | −0.65 | −1.22 | −0.57 | M |
| 36 | Switzerland | 34.9 | 2060 | 8 | −0.88 | −1.20 | −0.32 | M |
| 37 | Serbia | 30.9 | 2050 | 0 | −1.33 | −1.06 | 0.26 | L |
| 38 | Denmark | 29.6 | 2036 | 0 | −1.90 | −1.02 | 0.88 | H |
| 39 | Syria | 27.0 | NA | 27 | 0.00 | −0.93 | −0.93 | L |
| 40 | Sri Lanka | 20.8 | 2086 | 12 | −0.33 | −0.72 | −0.39 | L |
| 41 | Croatia | 17.7 | 2057 | 3.2 | −0.48 | −0.61 | −0.13 | M |
| 42 | Lithuania | 13.9 | NA | 13.9 | 0.00 | −0.48 | −0.48 | L |
| 43 | Slovenia | 12.5 | 2057 | 2.6 | −0.36 | −0.43 | −0.07 | L |
| 44 | Estonia | 10.4 | 2035 | 0 | −0.82 | −0.36 | 0.46 | L |
| 45 | Luxembourg | 8.4 | 2058 | 1.9 | −0.23 | −0.29 | −0.06 | M |
| 46 | Canada | 545 | NA | NA | 0.00 | −18.81 | −18.81 | L |
| 47 | South Africa | 436 | NA | NA | 0.00 | −15.03 | −15.03 | L |
| 48 | Australia | 391 | NA | NA | 0.00 | −13.49 | −13.49 | L |
| 49 | Taiwan | 283 | NA | NA | 0.00 | −9.75 | −9.75 | L |
| 50 | Kazakhstan | 277 | NA | NA | 0.00 | −9.54 | −9.54 | L |
| 51 | Argentina | 186 | NA | NA | 0.00 | −6.43 | −6.43 | L |
| 52 | Uzbekistan | 122 | NA | NA | 0.00 | −4.19 | −4.19 | L |
| 53 | New Zealand | 33.8 | NA | NA | 0.00 | −1.17 | −1.17 | L |
| 54 | Singapore | 32.5 | NA | NA | 0.00 | −1.12 | −1.12 | L |
| 55 | Hong Kong | 31.7 | NA | NA | 0.00 | −1.09 | −1.09 | L |
| Total | 14,310 | −261 | −492 | −230 |
| Economy | CO2 Emissions in 2021 (Mtpa) [7] | Est. CO2 Emissions in 2050 (Mtpa) | Current CO2 Increase Rate (Mtpa) | CO2 Increase Rate to Reach Net Zero by 2050 (Mtpa) | Decarbonization Target in 2021 to Achieve Net Zero by 2050 (Mtpa) | Confidence Level of Forecast * | |
|---|---|---|---|---|---|---|---|
| 1 | China | 11,472 | 22,400 | 375.80 | −395.60 | −771.40 | M |
| 2 | India | 2710 | 5900 | 106.70 | −93.44 | −200.14 | H |
| 3 | Russia | 1756 | 2100 | 12.00 | −60.54 | −72.54 | M |
| 4 | Iran | 749 | 1250 | 17.30 | −25.82 | −43.12 | H |
| 5 | Saudi Arabia | 672 | 1360 | 21.60 | −23.19 | −44.79 | H |
| 6 | Indonesia | 619 | 1210 | 19.00 | −21.35 | −40.35 | H |
| 7 | Turkey | 446 | 760 | 10.71 | −15.39 | −26.10 | H |
| 8 | Vietnam | 326 | 840 | 17.78 | −11.24 | −29.02 | M |
| 9 | Malaysia | 256 | 490 | 7.25 | −8.83 | −16.08 | M |
| 10 | Egypt | 250 | 480 | 7.04 | −8.61 | −15.65 | M |
| 11 | Pakistan | 229 | 370 | 5.00 | −7.91 | −12.91 | M |
| 12 | Iraq | 186 | 522 | 10.00 | −6.40 | −16.40 | L |
| 13 | Algeria | 176 | 328 | 4.96 | −6.08 | −11.04 | M |
| 14 | Philippines | 144 | 295 | 5.28 | −4.97 | −10.25 | M |
| 15 | Nigeria | 137 | 252 | 3.98 | −4.71 | −8.70 | L |
| 16 | Kuwait | 106 | 156 | 1.90 | −3.66 | −5.56 | M |
| 17 | Qatar | 95 | 200 | 3.30 | −3.30 | −6.60 | M |
| 18 | Bangladesh | 93 | 190 | 3.33 | −3.21 | −6.54 | H |
| 19 | Chile | 85 | 154 | 0.20 | −2.95 | −3.15 | H |
| 20 | Turkmenistan | 83 | 168 | 2.83 | −2.86 | −5.69 | M |
| 21 | Oman | 81 | 167 | 2.93 | −2.79 | −5.72 | H |
| 22 | Libya | 75 | 108 | 1.18 | −2.57 | −3.75 | L |
| 23 | Morocco | 71 | 118 | 1.70 | −2.43 | −4.13 | H |
| 24 | Peru | 56 | 94 | 1.28 | −1.94 | −3.22 | L |
| 25 | Azerbaijan | 38 | 53 | 0.47 | −1.33 | −1.80 | L |
| Total | 20,913 | 39,965 | 644 | −721 | −1365 |
| Number | Country | Coal’s Share of TFEC (Fraction) | Oil’s Share of TFEC (Fraction) | Gas’s Share of TFEC (Fraction) | RE’s Share of TFEC (Fraction) | Nuclear’s Share of TFEC (Fraction) | CO2 Emissions (Mtpa) | ΔRE Share of TFEC (2011–2021) (pp) |
|---|---|---|---|---|---|---|---|---|
| 1 | South Africa | 0.710 | 0.209 | 0.028 | 0.034 | 0.018 | 436 | 3.02 |
| 2 | India | 0.567 | 0.266 | 0.063 | 0.093 | 0.011 | 2710 | 2.34 |
| 3 | China | 0.547 | 0.194 | 0.086 | 0.150 | 0.023 | 11,470 | 8.26 |
| 4 | Kazakhstan | 0.544 | 0.220 | 0.195 | 0.042 | 0.000 | 277 | 1.19 |
| 5 | Vietnam | 0.497 | 0.217 | 0.060 | 0.226 | 0.000 | 326 | 8.03 |
| 6 | Poland | 0.423 | 0.311 | 0.189 | 0.077 | 0.000 | 329 | 4.93 |
| 7 | Philippines | 0.401 | 0.416 | 0.061 | 0.122 | 0.000 | 144 | −3.70 |
| 8 | Indonesia | 0.395 | 0.341 | 0.160 | 0.104 | 0.000 | 619 | 6.58 |
| 9 | Taiwan | 0.336 | 0.386 | 0.197 | 0.030 | 0.050 | 283 | 1.11 |
| 10 | Czechia | 0.321 | 0.244 | 0.196 | 0.071 | 0.167 | 97 | 3.28 |
| 11 | Morocco | 0.320 | 0.567 | 0.031 | 0.082 | 0.000 | 71 | NA |
| 12 | Australia | 0.284 | 0.337 | 0.248 | 0.131 | 0.000 | 391 | 9.36 |
| 13 | Ukraine | 0.284 | 0.138 | 0.281 | 0.063 | 0.234 | 202 | 4.39 |
| 14 | Japan | 0.271 | 0.373 | 0.210 | 0.116 | 0.031 | 1067 | 5.98 |
| 15 | Turkey | 0.255 | 0.277 | 0.302 | 0.166 | 0.000 | 446 | 5.52 |
| 18,868 a | 4.31 b |
| Number | Country | Coal’s Share of TFEC (Fraction) | Oil’s and Gas’s Share of TFEC (Fraction) | RE’s Share of TFEC (Fraction) | Nuclear’s Share of TFEC (Fraction) | CO2 Emissions (Mtpa) | ΔRE Share of TFEC (2011–2021) (pp) |
|---|---|---|---|---|---|---|---|
| 1 | Turkmenistan | 0.000 | 1.000 | 0.000 | 0.000 | 83 | 0.00 |
| 2 | Qatar | 0.000 | 1.000 | 0.000 | 0.000 | 95 | 0.00 |
| 3 | Kuwait | 0.000 | 1.000 | 0.000 | 0.000 | 106 | NA |
| 4 | Trinidad & Tobago | 0.000 | 1.000 | 0.000 | 0.000 | 36 | 0.00 |
| 5 | Saudi Arabia | 0.000 | 0.999 | 0.001 | 0.000 | 672 | 0.09 |
| 6 | Oman | 0.007 | 0.993 | 0.000 | 0.000 | 81 | NA |
| 7 | Singapore | 0.009 | 0.988 | 0.003 | 0.000 | 33 | 0.29 |
| 8 | Algeria | 0.008 | 0.988 | 0.004 | 0.000 | 176 | 0.16 |
| 9 | Iraq | 0.000 | 0.986 | 0.014 | 0.000 | 186 | NA |
| 10 | Azerbaijan | 0.000 | 0.985 | 0.015 | 0.000 | 38 | 0.90 |
| 11 | Iran | 0.006 | 0.979 | 0.013 | 0.002 | 749 | 0.09 |
| 12 | UAE | 0.015 | 0.951 | 0.011 | 0.022 | 202 | 1.10 |
| 13 | Uzbekistan | 0.036 | 0.939 | 0.026 | 0.000 | 122 | −1.86 |
| 14 | Egypt | 0.013 | 0.924 | 0.063 | 0.000 | 250 | NA |
| 15 | Belarus | 0.027 | 0.919 | 0.009 | 0.045 | 60 | 0.90 |
| 16 | Bangladesh | 0.085 | 0.909 | 0.006 | 0.000 | 93 | −0.63 |
| 17 | Mexico | 0.034 | 0.844 | 0.106 | 0.016 | 407 | 4.89 |
| 18 | Argentina | 0.020 | 0.840 | 0.111 | 0.029 | 186 | −0.40 |
| 19 | Hong Kong | 0.172 | 0.828 | 0.000 | 0.000 | 32 | 0.00 |
| 20 | The Netherlands | 0.066 | 0.801 | 0.124 | 0.009 | 141 | 9.68 |
| 21 | Israel | 0.152 | 0.790 | 0.057 | 0.000 | 55 | 5.71 |
| 22 | Italy | 0.036 | 0.780 | 0.184 | 0.000 | 329 | 7.88 |
| 23 | Thailand | 0.159 | 0.771 | 0.070 | 0.000 | 278 | 3.84 |
| 24 | Russia | 0.109 | 0.760 | 0.066 | 0.064 | 1756 | 1.19 |
| 25 | UK | 0.029 | 0.734 | 0.180 | 0.057 | 347 | 13.98 |
| 26 | Greece | 0.067 | 0.733 | 0.200 | 0.000 | 56 | 13.77 |
| 27 | Hungary | 0.059 | 0.723 | 0.218 | 0.000 | 48 | 4.38 |
| 28 | Venezuela | 0.000 | 0.714 | 0.286 | 0.000 | 80 | 7.21 |
| 29 | Belgium | 0.037 | 0.702 | 0.092 | 0.169 | 96 | 5.87 |
| 30 | Malaysia | 0.212 | 0.702 | 0.086 | 0.000 | 256 | 6.14 |
| 31 | USA | 0.114 | 0.700 | 0.107 | 0.080 | 5007 | 5.39 |
| 32 | Pakistan | 0.174 | 0.683 | 0.106 | 0.036 | 229 | NA |
| 33 | Ecuador | 0.000 | 0.671 | 0.329 | 0.000 | 41 | 15.47 |
| 34 | Peru | 0.041 | 0.669 | 0.289 | 0.000 | 41 | 4.65 |
| 35 | Portugal | 0.011 | 0.663 | 0.326 | 0.000 | 41 | 9.68 |
| 36 | Spain | 0.029 | 0.657 | 0.224 | 0.091 | 234 | 8.93 |
| 37 | Romania | 0.121 | 0.621 | 0.186 | 0.071 | 79 | 8.26 |
| 38 | Sri Lanka | 0.154 | 0.615 | 0.231 | 0.000 | 21 | NA |
| 39 | South Korea | 0.179 | 0.607 | 0.037 | 0.114 | 616 | 3.05 |
| 40 | Canada | 0.034 | 0.607 | 0.299 | 0.060 | 545 | 2.78 |
| 41 | Columbia | 0.068 | 0.602 | 0.330 | 0.000 | 545 | 1.45 |
| 42 | Germany | 0.168 | 0.587 | 0.195 | 0.049 | 674 | 13.77 |
| 43 | Chile | 0.156 | 0.575 | 0.269 | 0.000 | 85 | 8.50 |
| 44 | Austria | 0.075 | 0.551 | 0.374 | 0.000 | 65 | 10.40 |
| 45 | New Zealand | 0.083 | 0.512 | 0.405 | 0.000 | 34 | 0.99 |
| 11,024 a | 4.58 b |
| Number | Country | Coal’s Share of TFEC (Fraction) | Oil’s and Gas’s Share of TFEC (Fraction) | RE’s Share of TFEC (Fraction) | Nuclear’s Share of TFEC (Fraction) | Non-Fossil’s Share of TFEC (Fraction) | CO2 Emissions (Mtpa) | ΔRE Share of TFEC (2011–2021) (pp) |
|---|---|---|---|---|---|---|---|---|
| 1 | Norway | 0.015 | 0.260 | 0.725 | 0.000 | 0.725 | 41 | 7.88 |
| 2 | Sweden | 0.026 | 0.258 | 0.507 | 0.210 | 0.717 | 36 | 12.83 |
| 3 | Finland | 0.103 | 0.362 | 0.345 | 0.190 | 0.536 | 38 | 14.99 |
| 4 | Switzerland | 0.000 | 0.467 | 0.374 | 0.159 | 0.533 | 35 | 9.38 |
| 5 | France | 0.024 | 0.473 | 0.138 | 0.364 | 0.502 | 306 | 10.45 |
| 6 | Brazil | 0.056 | 0.471 | 0.462 | 0.010 | 0.472 | 489 | 6.98 |
| 944 a | 10.42 b |
| Coal-Dominated Economies | Oil-and-Gas-Dominated Economies | Non-Fossil-Energy-Dominated Economies | |
|---|---|---|---|
| Number of economies | 15 | 45 | 6 |
| Characteristics | Coal’s share of TFEC > 25% | Oil and gas share of TFEC > 50% | Non-fossil-energy’s share of TFEC > 45% |
| Biggest CO2 emitters | China, India, Australia, Indonesia, Japan | USA, Russia, UK, Iran, Saudi Arabia, Germany, South Korea | Brazil, France |
| Primary decarbonization pathway |
|
|
|
| Secondary decarbonization pathway |
|
|
|
Disclaimer/Publisher’s Note: The statements, opinions and data contained in all publications are solely those of the individual author(s) and contributor(s) and not of MDPI and/or the editor(s). MDPI and/or the editor(s) disclaim responsibility for any injury to people or property resulting from any ideas, methods, instructions or products referred to in the content. |
© 2023 by the authors. Licensee MDPI, Basel, Switzerland. This article is an open access article distributed under the terms and conditions of the Creative Commons Attribution (CC BY) license (https://creativecommons.org/licenses/by/4.0/).
Share and Cite
Lau, H.C.; Tsai, S.C. Global Decarbonization: Current Status and What It Will Take to Achieve Net Zero by 2050. Energies 2023, 16, 7800. https://doi.org/10.3390/en16237800
Lau HC, Tsai SC. Global Decarbonization: Current Status and What It Will Take to Achieve Net Zero by 2050. Energies. 2023; 16(23):7800. https://doi.org/10.3390/en16237800
Chicago/Turabian StyleLau, Hon Chung, and Steve C. Tsai. 2023. "Global Decarbonization: Current Status and What It Will Take to Achieve Net Zero by 2050" Energies 16, no. 23: 7800. https://doi.org/10.3390/en16237800
APA StyleLau, H. C., & Tsai, S. C. (2023). Global Decarbonization: Current Status and What It Will Take to Achieve Net Zero by 2050. Energies, 16(23), 7800. https://doi.org/10.3390/en16237800