Article

Performance of Cu/ZnO/Al2O3 Catalysts Prepared by Sol–Gel Methods on Methanol Steam Reforming

1
School of Energy and Environmental Engineering, University of Science and Technology Beijing, 30 Xueyuan Road, Haidian District, Beijing 100083, China
2
Beijing Key Laboratory of Energy Conservation and Emission Reduction for Metallurgical Industry, Beijing 100083, China
*
Authors to whom correspondence should be addressed.
Energies 2023, 16(23), 7803; https://doi.org/10.3390/en16237803
Submission received: 8 November 2023 / Revised: 23 November 2023 / Accepted: 24 November 2023 / Published: 27 November 2023
(This article belongs to the Section A5: Hydrogen Energy)

Abstract

:
Cu/ZnO/Al2O3 catalysts were prepared for online methanol steam reforming (MSR) using a conventional sol–gel method in this study. The optimal preparation conditions, including the calcination temperature, Cu loading, molar ratio of citric acid to metal ions (CA/M), and pH, were investigated. CZA50 exhibited the highest MSR activity among all catalysts. It was prepared at a calcination temperature of 350 °C; Cu, Zn, and Al molar fractions of 50%, 30%, and 20%; CA/M of 1.5; and without adjusting pH. Furthermore, a modified sol–gel method was proposed to enhance the mechanical strength of Cu/ZnO/Al2O3 catalysts by using γ-Al2O3 powders as catalyst precursors instead of aluminum nitrates. In this modified method, part of Cu2+ and Zn2+ ions were impregnated firstly on γ-Al2O3 powders, and then the remaining metal ions formed sol–gel with citric acid. MCZA-0.25 catalysts prepared by this modified method showed superior catalytic activity at an Al/(Cu+Zn) ratio of 0.25. The methanol conversion rates of CZA50, MCZA-025, and CZA-Commercial were 82.9%, 79.4%, and 74.7% at the temperature of 200 °C and methanol liquid phase space velocity (LHSV) of 1.0/h, respectively. The average crushing strength of CZA50, MCZA-0.25, and CZA-Commercial were measured as 28 N/cm, 37 N/cm, and 32 N/cm, respectively.

Graphical Abstract

1. Introduction

The massive consumption of fossil fuels is a major source of carbon dioxide emissions, which causes global warming and has become an urgent global issue [1,2]. Hydrogen is recognized as a potential fuel to offer carbon-free solutions, and hydrogen fuel cell technology is a promising clean and efficient energy technology [3]. Hydrogen fuel cell vehicles (HFCVs) will take the place of fossil fuel vehicles and pure electric vehicles in the transportation sectors. At present, HFCVs have shown a potential for commercialization. However, the high storage and transportation costs of compressed hydrogen and liquid hydrogen have limited the commercialization of hydrogen fuel cells [4]. Hydrogen production from the reforming of liquid fuels is an alternative way for hydrogen storage and transportation. In terms of liquid fuels, methanol, which can be obtained from a variety of sources and has a high hydrogen storage density with no C–C bonds, is considered an appropriate option [5,6,7]. Moreover, the existing gasoline storage and transportation facilities can be fully utilized. One of the main resources of methanol is coal-to-methanol, and the low-cost coal-to-methanol industry can play a crucial role in producing hydrogen. Some scholars have proposed methanol as a hydrogen carrier, which can be produced through the hydrogenation of CO2 with “green hydrogen” [8,9]. CO2 is obtained from carbon capture and storage (CCS) plants, and “green hydrogen” is acquired from water electrolysis through renewable energy power renewable energy [10]. The technical path of methanol storage–transportation–refueling–online hydrogen production–fuel cell can make it possible to efficiently utilize coal, biomass, and CO2 resources.
The methods of hydrogen production from methanol include methanol decomposing (MD), methanol steam reforming (MSR), partial oxidation of methanol (POM), and oxidative steam reforming of methanol (OSRM) [11,12,13]. Among these methods, MSR can obtain the highest hydrogen yield and the lowest CO concentration in reformed gas. The combustion of fuel cell anode tail gases can provide the exact heat of methanol aqueous solution vaporization and MSR reaction. Therefore, MSR is the most suitable online methanol hydrogen production technology for fuel cells.
Cu/ZnO/Al2O3 catalysts have been widely used as MSR catalysts because of their relatively high activity and low price. Many researchers have made many efforts to enhance the activity and stability by improving preparation methods, support materials, and promoters [14,15,16]. The main drawbacks of Cu/ZnO/Al2O3 are high CO selectivity and serious deactivation due to high temperature and frequent start-ups and shut-downs for an online MSR application [17]. It is highly desired to improve the activity and mechanical strength of Cu/ZnO/Al2O3 catalysts. Recently, sol–gel methods have been highlighted by some researchers as providing homogeneous and high-purity crystalline oxides [18]. Moreover, another advantage of this method is that there is no need to wash the catalytic material, leading to a radical reduction in wastewater amounts [19,20]. Velinov et al. [21] found that the copper-based catalysts prepared by a sol–gel method showed high activity of MD and water–gas shift (WGS) reactions. Jha et al. [22] prepared copper–nickel-based catalysts by using a sol–gel method, co-precipitation method, hydrothermal method, and impregnation method for the high-temperature WGS reaction. The catalyst prepared by the sol–gel method performed the best dispersibility and activity as compared with the other methods. Accordingly, the highest CO conversion of 85% can be obtained at 450 °C and gas hourly space velocity (GHSV) of 84,000/h. Fornari et al. [23] also prepared Cu/ZnO/Al2O3 catalysts by using a sol–gel method, and they calculated the optimal Cu composition without taking into account the amount of Zn.
Sol–gel methods exhibited a promising application in the preparation of Cu/ZnO/Al2O3 catalysts. Nevertheless, these methods are vulnerable to the impact of gel conditions, such as gel temperature and pH. Catalyst powders easily form agglomeration in the calcination process, which results in a decrease in catalytic activity. The mechanical strength and catalytic activity stability of Cu/ZnO/Al2O3 catalysts are critical for onboard application scenarios. In this paper, Cu/ZnO/Al2O3 catalysts were prepared by a conventional sol–gel method, and effect factors, including calcination temperature, Cu loading, the molar ratio of citric acid to metal ions, and pH, were studied. A modified sol–gel method by combining an impregnation method with the conventional sol–gel method was proposed to improve the performance and mechanical strength of Cu/ZnO/Al2O3 catalysts, in which method γ-Al2O3 powders instead of aluminum nitrates were used as support materials. The effects of the preparation conditions on the MSR performance and mechanical strength were illustrated with XRD, BET, TGA, H2-TPR, and XPS.

2. Experimental Section

2.1. Preparation Processes

The preparation process of Cu/ZnO/Al2O3 with a conventional sol–gel method and modified sol–gel method are shown in Figure 1. Cu(NO3)2, Zn(NO3), and Al(NO3)3 (Beijing Sinopharm Group Co., Ltd., Beijing, China) were used as catalyst precursors in the conventional sol–gel method. Nitrates and citric acid (CA) were dissolved slowly in deionized water, and then ammonia was added to adjust pH if needed. The sol solution was transformed into a gel by evaporating at 80 °C, and then the gel was placed in an oven with a constant temperature to dry at 105 °C for 12 h. The xerogel was calcined in a muffle furnace at a certain temperature of 250–500 °C for 3 h. Catalyst powders were mixed with 2 wt.% polyvinyl methanol, and then the powders were pressed into cakes on a tablet press under 20 MPa for 2 min, and the cakes were calcined under the same conditions.
The molar ratio of Cu to Zn was 5:3, and γ-Al2O3 powers (Chinalco Shandong Co., Ltd., Zibo, China, medium particle size D50 is 6.0 um) were used as support materials in the modified sol–gel method. The other processes were the same as the conventional sol–gel method. Catalysts were denoted as CZA and MCZA according to preparation methods, as shown in Table 1. The commercial catalyst CZA-Commercial (molar ratio of Cu: Zn: Al is about 45:44:11) was purchased from SiChuanShutai Chemical Co., Ltd. (Suining, China), which was prepared by a co-precipitation method.

2.2. Material Characterization

Thermogravimetric analyses (TGA) on citric acid, xerogel, CZA50, and MCZA50 were conducted with a simultaneous thermal analyzer (Setaram Labsys Evo). The citric acid and xerogel samples were placed in an alumina crucible and heated to 500 °C at a rate of 10 °C/min. CZA50 and MCZA-0.25 were heated to 400 °C at 10 °C/min in a gas of 10% H2-90% N2. The mass and heat flow changes were measured simultaneously during the heating process. The diffraction pattern of catalysts was recorded using an X-ray diffractometer (Rigaku Ultima IV, Japan, Cu-Kα radiation, Ni filter, 40 mA, 40 kV). The average crystallite sizes of CuO and ZnO were calculated using the Scherer equation [24]. H2-TPR was performed on a chemical adsorption instrument (Micromeritics 2920, Micromeritics Instrument Co., Ltd., Norcross, GA, USA). A 0.5 g sample was loaded into a U-shaped quartz tube. The sample was heated to 200 °C at a rate of 10 °C/min and maintained for 60 min under Ar gas. After the pretreatment, the sample was cooled to room temperature. When the TCD signal was stable, the gas was switched to a 10% H2/Ar of 30 mL/min. The sample was heated to 600 °C at a rate of 10 °C/min, and the signal values were recorded synchronously. The XPS of catalysts was obtained on electron spectroscopy (ESCALAB 250Xi, Thermo Fisher Scientific Co., Ltd., Waltham, MA, USA), with the target material Al (1486.6 eV). The binding energy of the tested elements was calibrated using the C 1s binding energy (284.8 eV). The specific surface area of catalysts was calculated using the Brunner–Emmette–Teller (BET) method using a Micromeritics ASAP 2020 instrument (Micromeritics Instrument Co., Ltd., America). The crushing strength of catalysts was recorded by a ZQJ-II intelligent particle strength tester (Dalian Intelligent Testing Machine Factory, Dalian, China), and the average crushing strength of 20 samples was calculated.

2.3. Experimental Process

The experimental apparatus mainly includes gas cylinders, an evaporator, a reactor, and gas chromatography (GC), as shown in Figure 2. The reactor consists of a controller, an electric heating furnace, a thermocouple, etc. The flows of production gas and methanol aqueous solution are controlled by gas mass flow controllers (MFCs, uncertainty: ±1.0% F.S, HORIBA METRON) and constant-flow pump (CFP, P220, uncertainty: ±0.3%, Dalian Elite Analytical Instruments Co., Ltd., Dalian, China), respectively. An amount of 5 mL (5.24 g) catalysts were loaded on the catalytic layer, and the catalytic layer temperature was monitored via a K-type thermocouple. Before experiments, catalysts were reduced in situ using 10% H2/N2 of 1000 mL/min at 240 °C for 3 h. The molar ratio of steam to methanol (S/C) was 1.5, methanol LHSV was 1.0/h, and the reaction temperature was at a range of 180–260 °C in these experiments. The reforming gas was analyzed every 10 min until the composition reached stability. The methanol conversion rate and hydrogen yield were calculated according to carbon and hydrogen balance, referring to the previous paper [25].

3. Results and Discussion

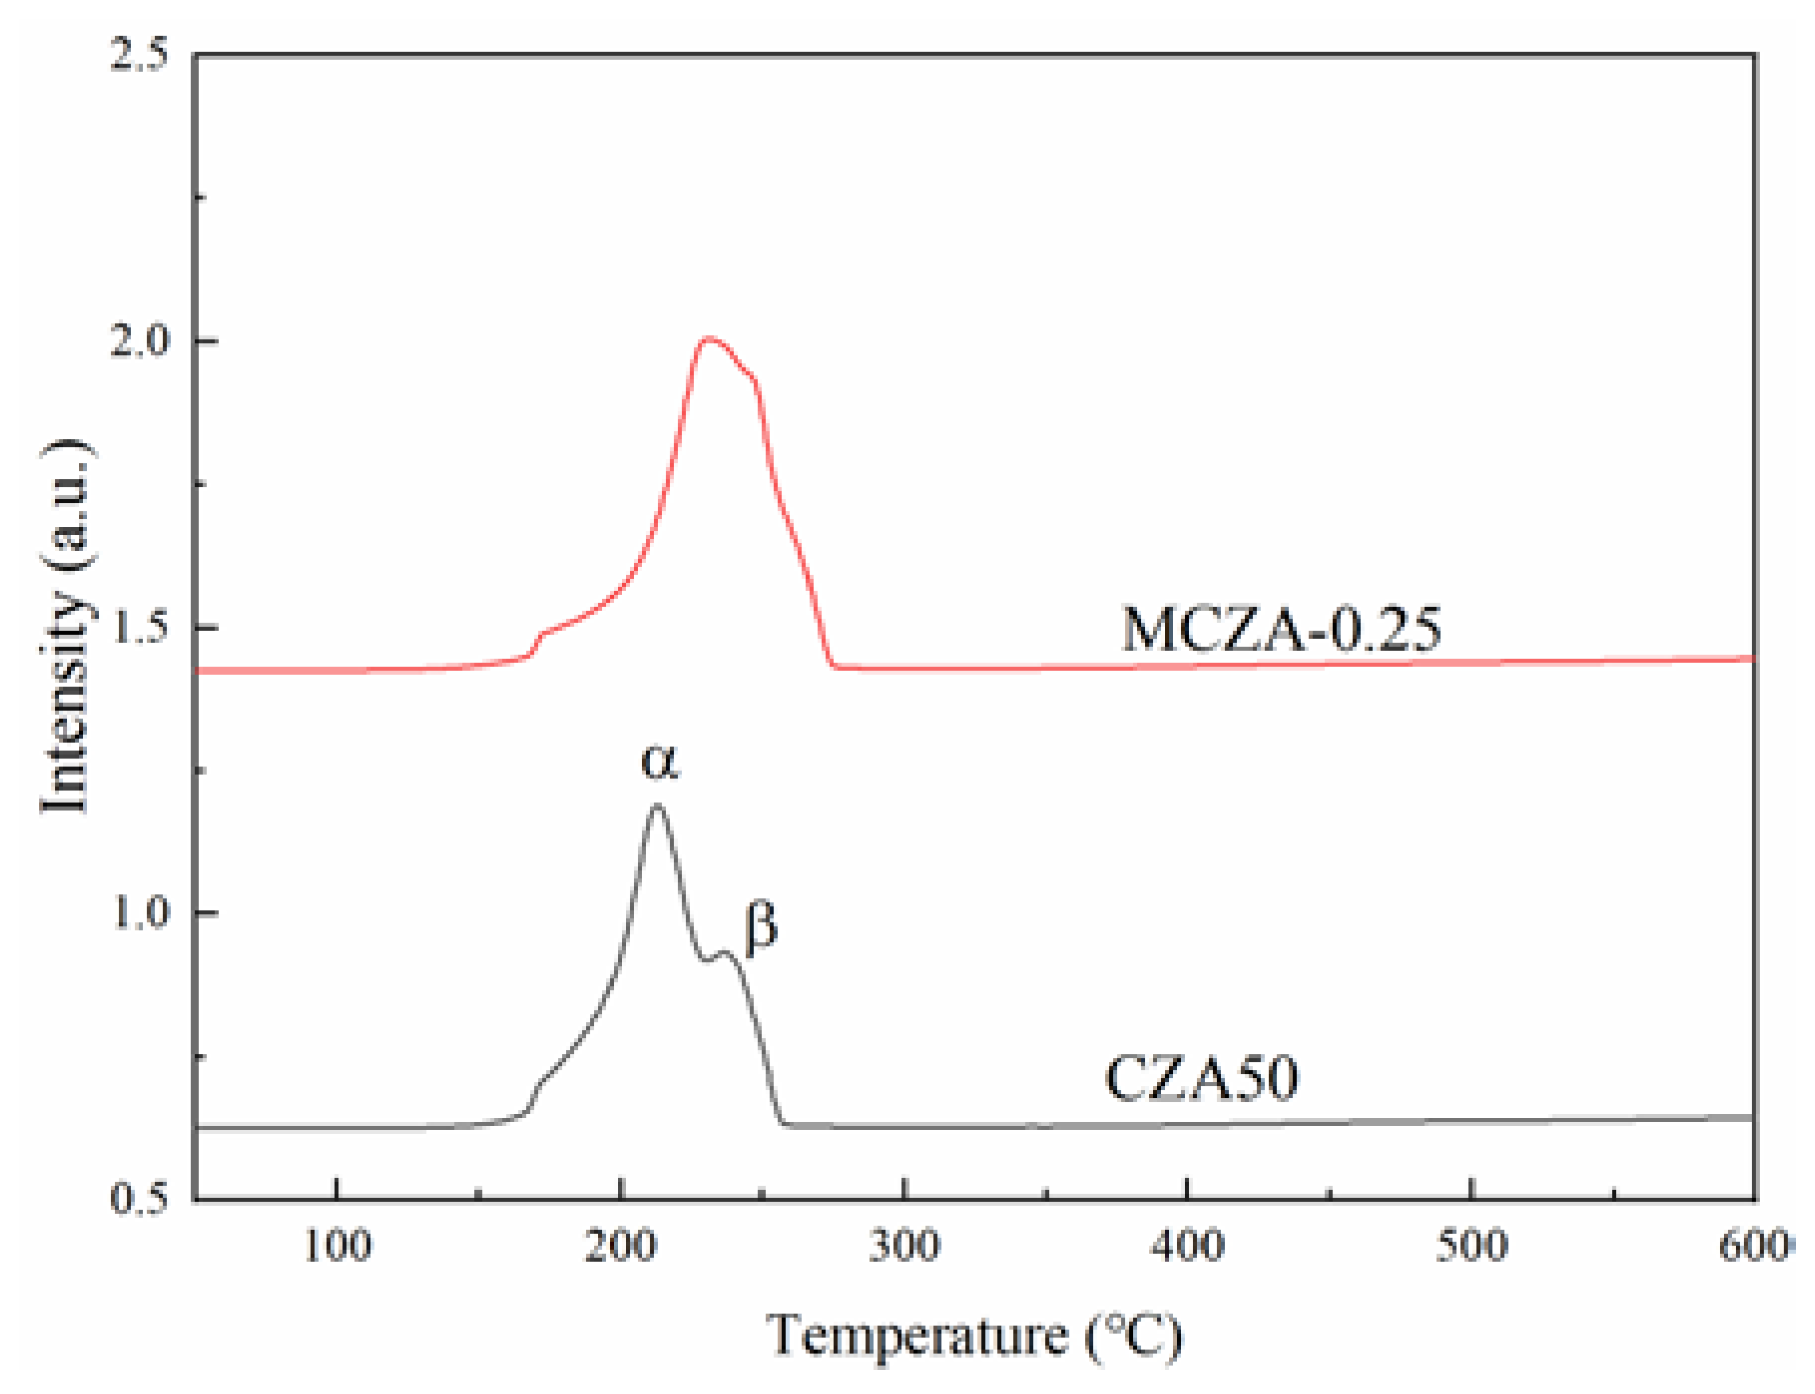
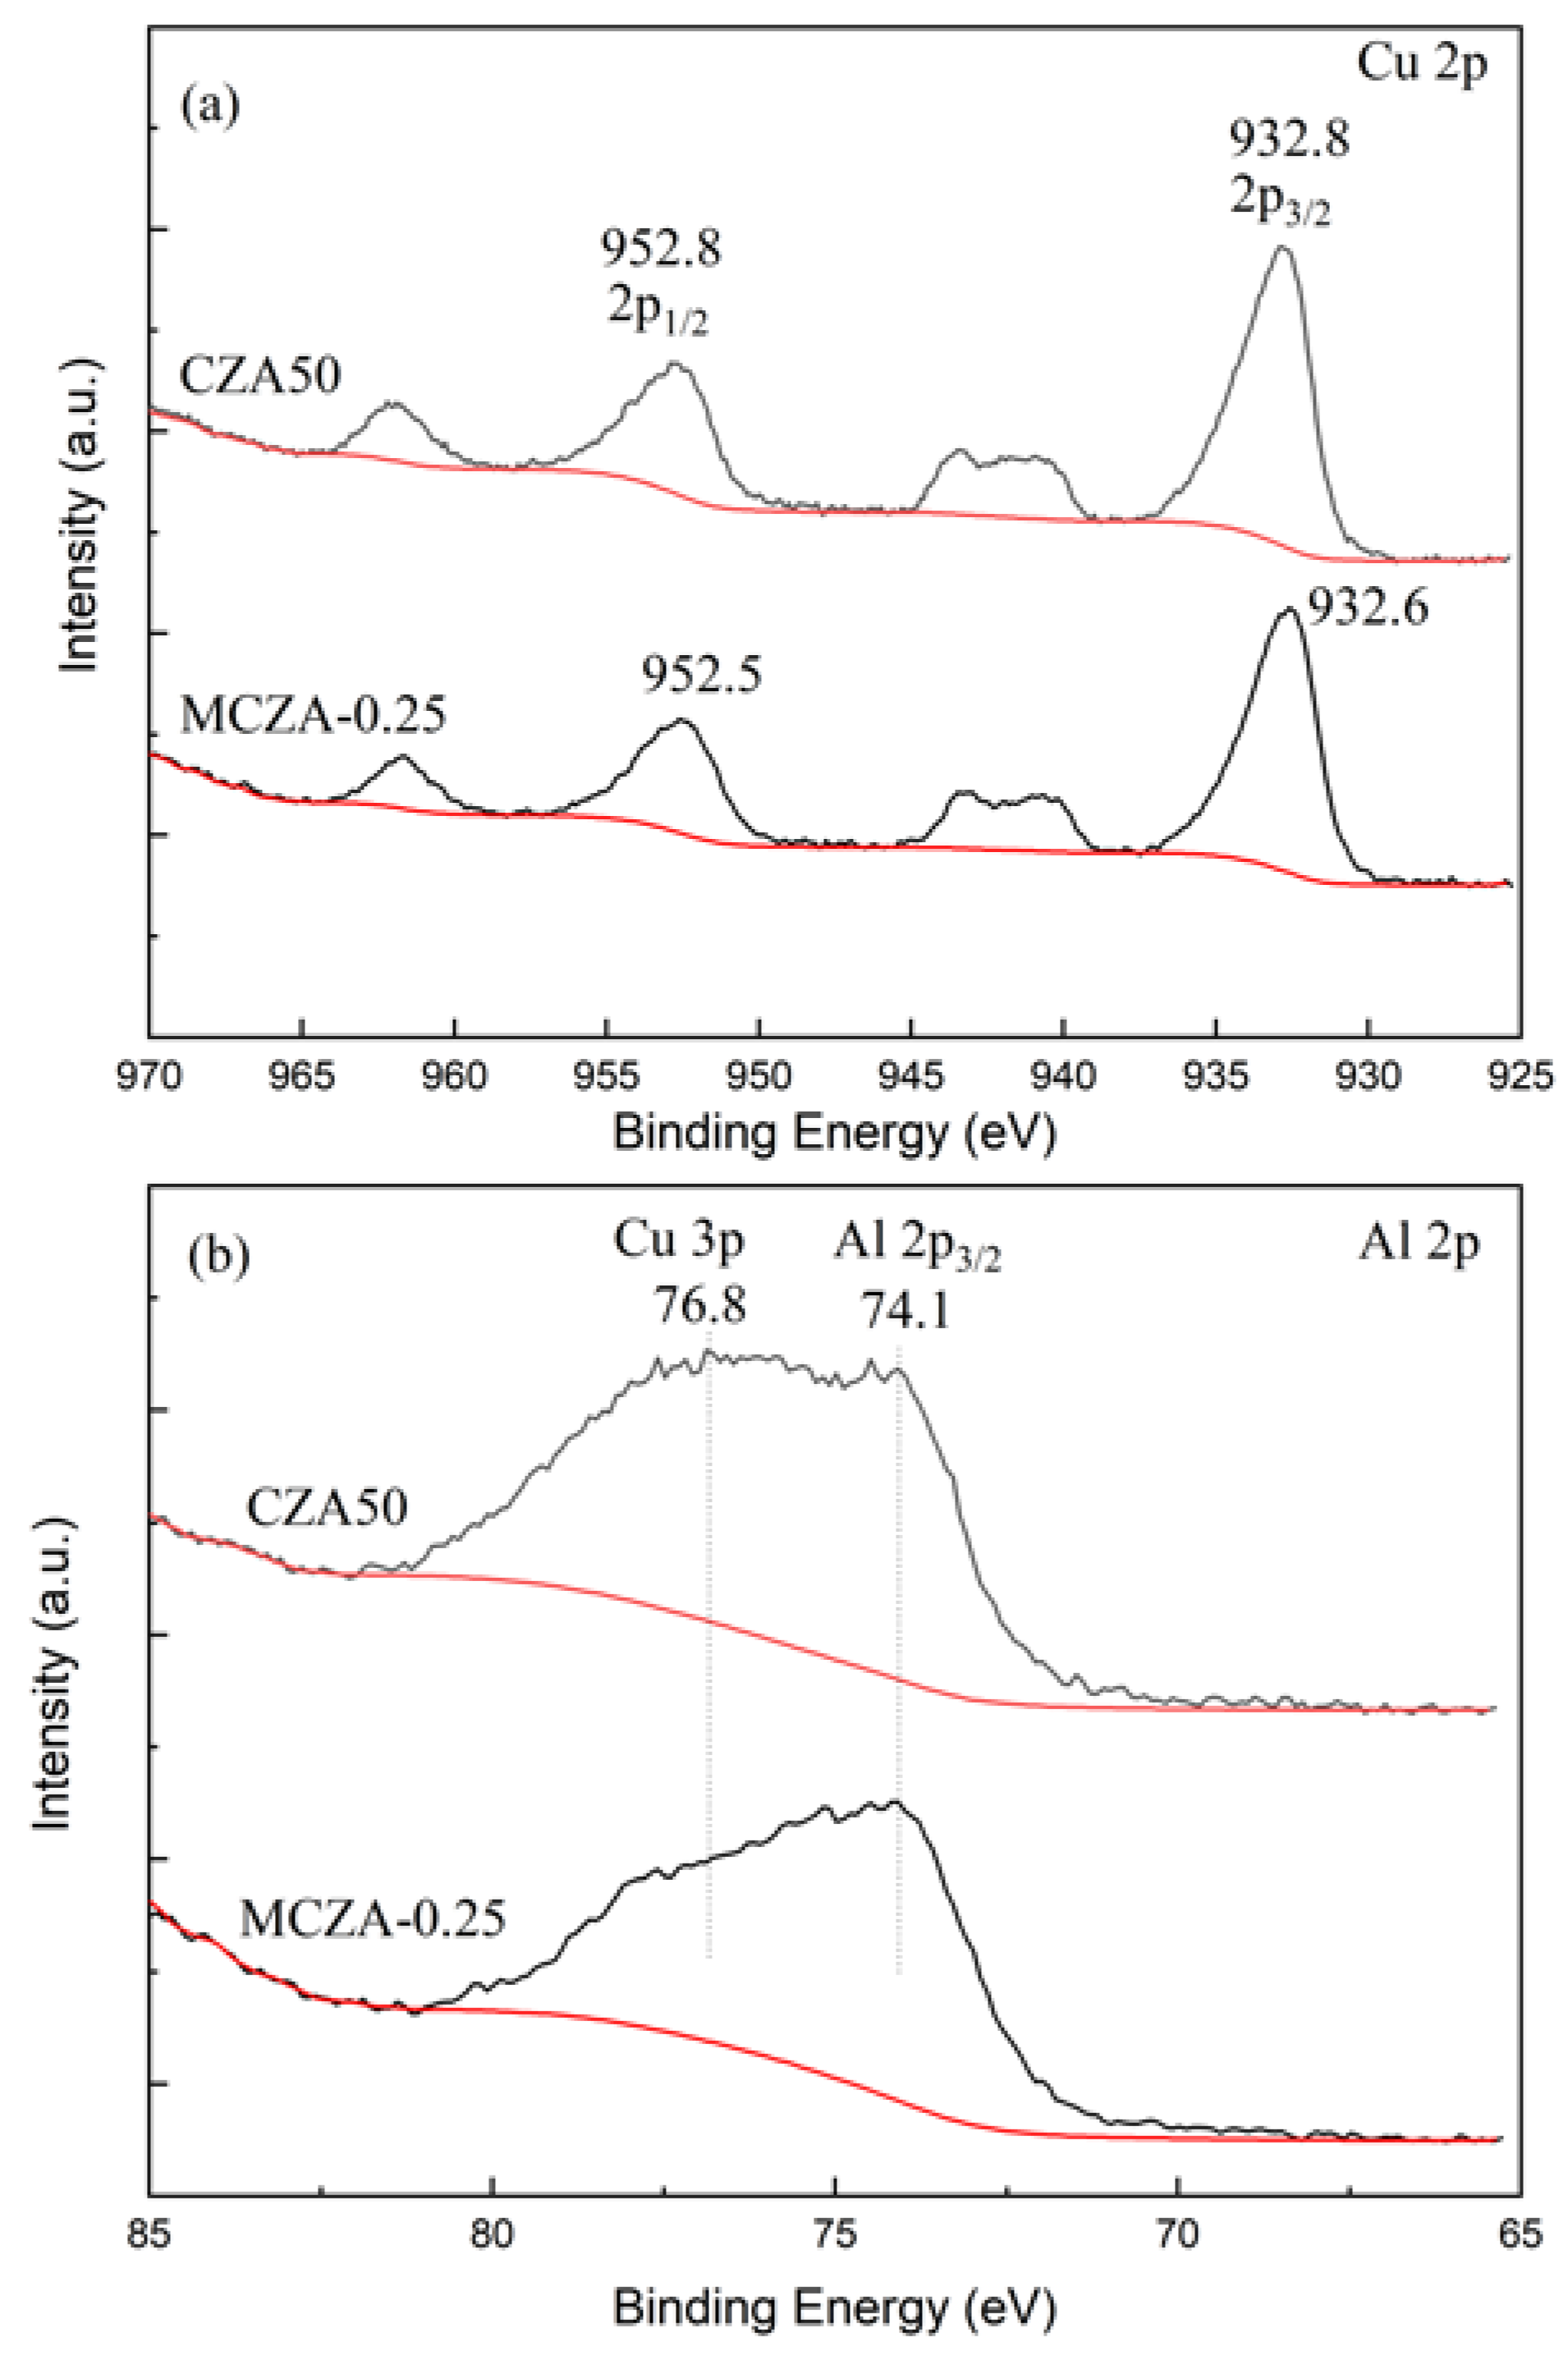
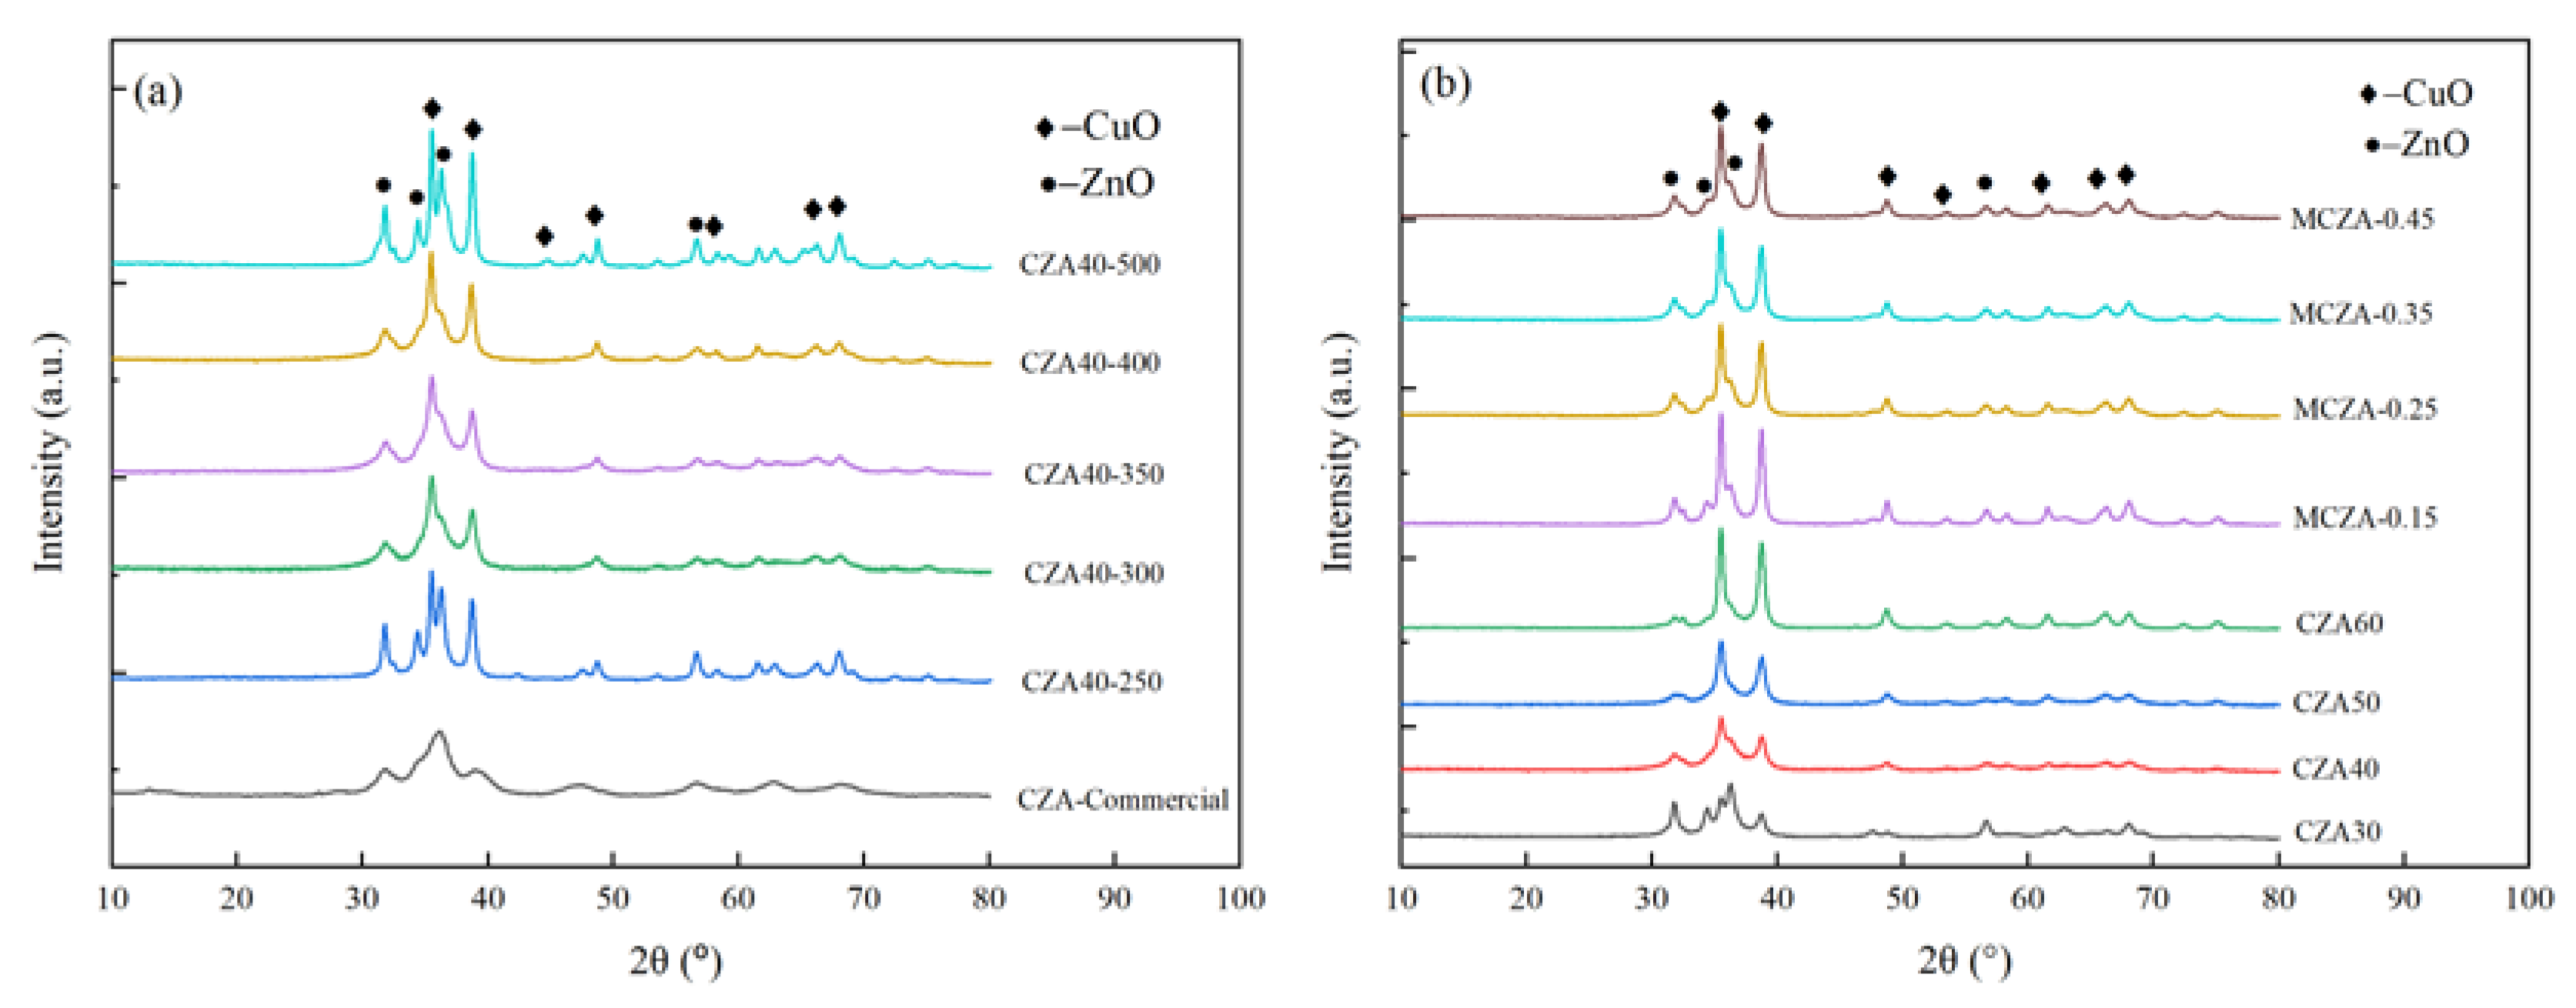
3.1. Characterization Results

The thermogravimetric characteristic of citric acid was analyzed firstly because the xerogel calcination process would be affected by the excessive citric acid. The TGA curve of citric acid is shown in Figure 3a. Two endothermic peaks appear between 150 °C and 250 °C, indicating that the dehydration reaction occurs first, followed by water evaporation. Above 250 °C, the residual hydrocarbons are gradually oxidized by air. The TG and heat flow curves of the CZA50 precursor (xerogel) are shown in Figure 3b. The heat flow peak around 200 °C represents the heat absorption of free citric acid decomposition. The three exothermic peaks between 200 °C and 450 °C indicate the decomposition of several complexes. The weight loss rate of xerogel reaches 78.8% at 500 °C. As shown in Figure 3c, the H2-TGA curve of CZA50 shows that the sample (28.9 mg) weight loss rate reaches 43% when the heat flow peak center temperature is 237 °C. The mass fraction of metal Cu in CZA50 can be calculated as 48% according to the weight loss (oxygen) at 500 °C, which coincides with the data in Table 1. The weight loss rate of MCZA-0.25 reached 53.8% when the heat flow peak center temperature was 267 °C, as shown in Figure 3d.
The H2-TPR characterization results of CZA50 and MCZA-0.2 are shown in Figure 4. The H2-TPR carve of CZA50 displays two reduction peaks, where α represents the reduction peak of highly dispersed CuO on the surface, and β represents the reduction peak of bulk CuO [26]. The peak center temperatures are 212 °C and 236 °C, respectively. The H2-TPR carve of MCZA-0.25 exhibits two reduction peaks that overlap, and the peak center temperature is about 230 °C. According to the TGA and H2-TPR results, the initial reduction temperature of CZA50 is lower, which can be attributed to the better CuO dispersion.
The Cu 2p XPS spectra have four characteristic peaks, as depicted in Figure 5a. The characteristic peak at 952.8 eV can be attributed to the electron binding energy of Cu 2p1/2 level. The characteristic peak at 937.5–946.8 eV is the satellite peak of Cu 2p, and the characteristic peak at 932.8 eV can be attributed to the electron binding energy of Cu 2p3/2 level. As shown in Figure 5b, the binding energy peak at 72.5~76.4 eV in the XPS spectrum belongs to Al 2p3/2. The XPS surface composition analysis results are listed in Table 2. MCZA-0.25 has lower surface Cu and Al content than CZA50, indicating that Cu is embedded in γ-Al2O3 particles and Al is dispersed in ZnO. Additionally, the surface Cu to Zn ratio of CZA50 is closer to 5:3 than that of MCZA-0.25, suggesting a better dispersion.
The XRD diffraction spectra of fresh catalysts are presented in Figure 6. Distinctive peaks of CuO (JCPDS Card no. 67850) and ZnO (JCPDS Card no. 29272) are observed in all the curves. However, the peaks of Al2O3 cannot be identified due to a good dispersion. Moreover, the peak intensity of CuO does not show a significant change because the molar ratio of Al/(Cu+Zn) in MCZA has little effect on the Cu mass loading (Table 1).
The CuO and ZnO crystal size and specific surface area analysis results are listed in Table 3. The CuO crystal size increases from 14 nm to 17 nm when the calcination temperature increases from 300 °C to 500 °C, indicating that an increase in the calcination temperature promotes crystal growth. For CZA-250, its CuO crystal size is about twice that of other temperatures. Combined with the TGA analysis, it can be concluded that the copper complex decomposed first, while the decomposition rates of zinc and aluminum complexes were low at 250 °C, resulting in a slight aggregation of copper particles. Unless otherwise specified, the catalysts are prepared under conditions of a molar ratio of citric acid to metal ions of 1.5 and calcination at 350 °C for 3 h. The specific surface area increases first and then decreases with the increase in Cu loading and Al/(Cu+Zn); that is, the overall dispersion of the catalyst can be improved by appropriately increasing Cu and Al content. However, the crystal size of CuO increases from 13 nm to 19 nm when the Cu loading increases from 30% to 60%. Both the crystal sizes of CuO and ZnO decrease when the Al/(Cu+Zn) increases from 0.15 to 0.45, indicating that increasing Al/(Cu+Zn) can promote the dispersion of CuO and ZnO. CZA and MCZA catalysts underwent a redox process during the calcination, while CZA-Commercial did not. The fresh CZA-Commercial shows the highest specific surface area. However, the specific surface area of CZA-Commercial decreases to 27 m2/g, and the crystal sizes of CuO increase to 13 nm after redox, as presented in our other paper [25].

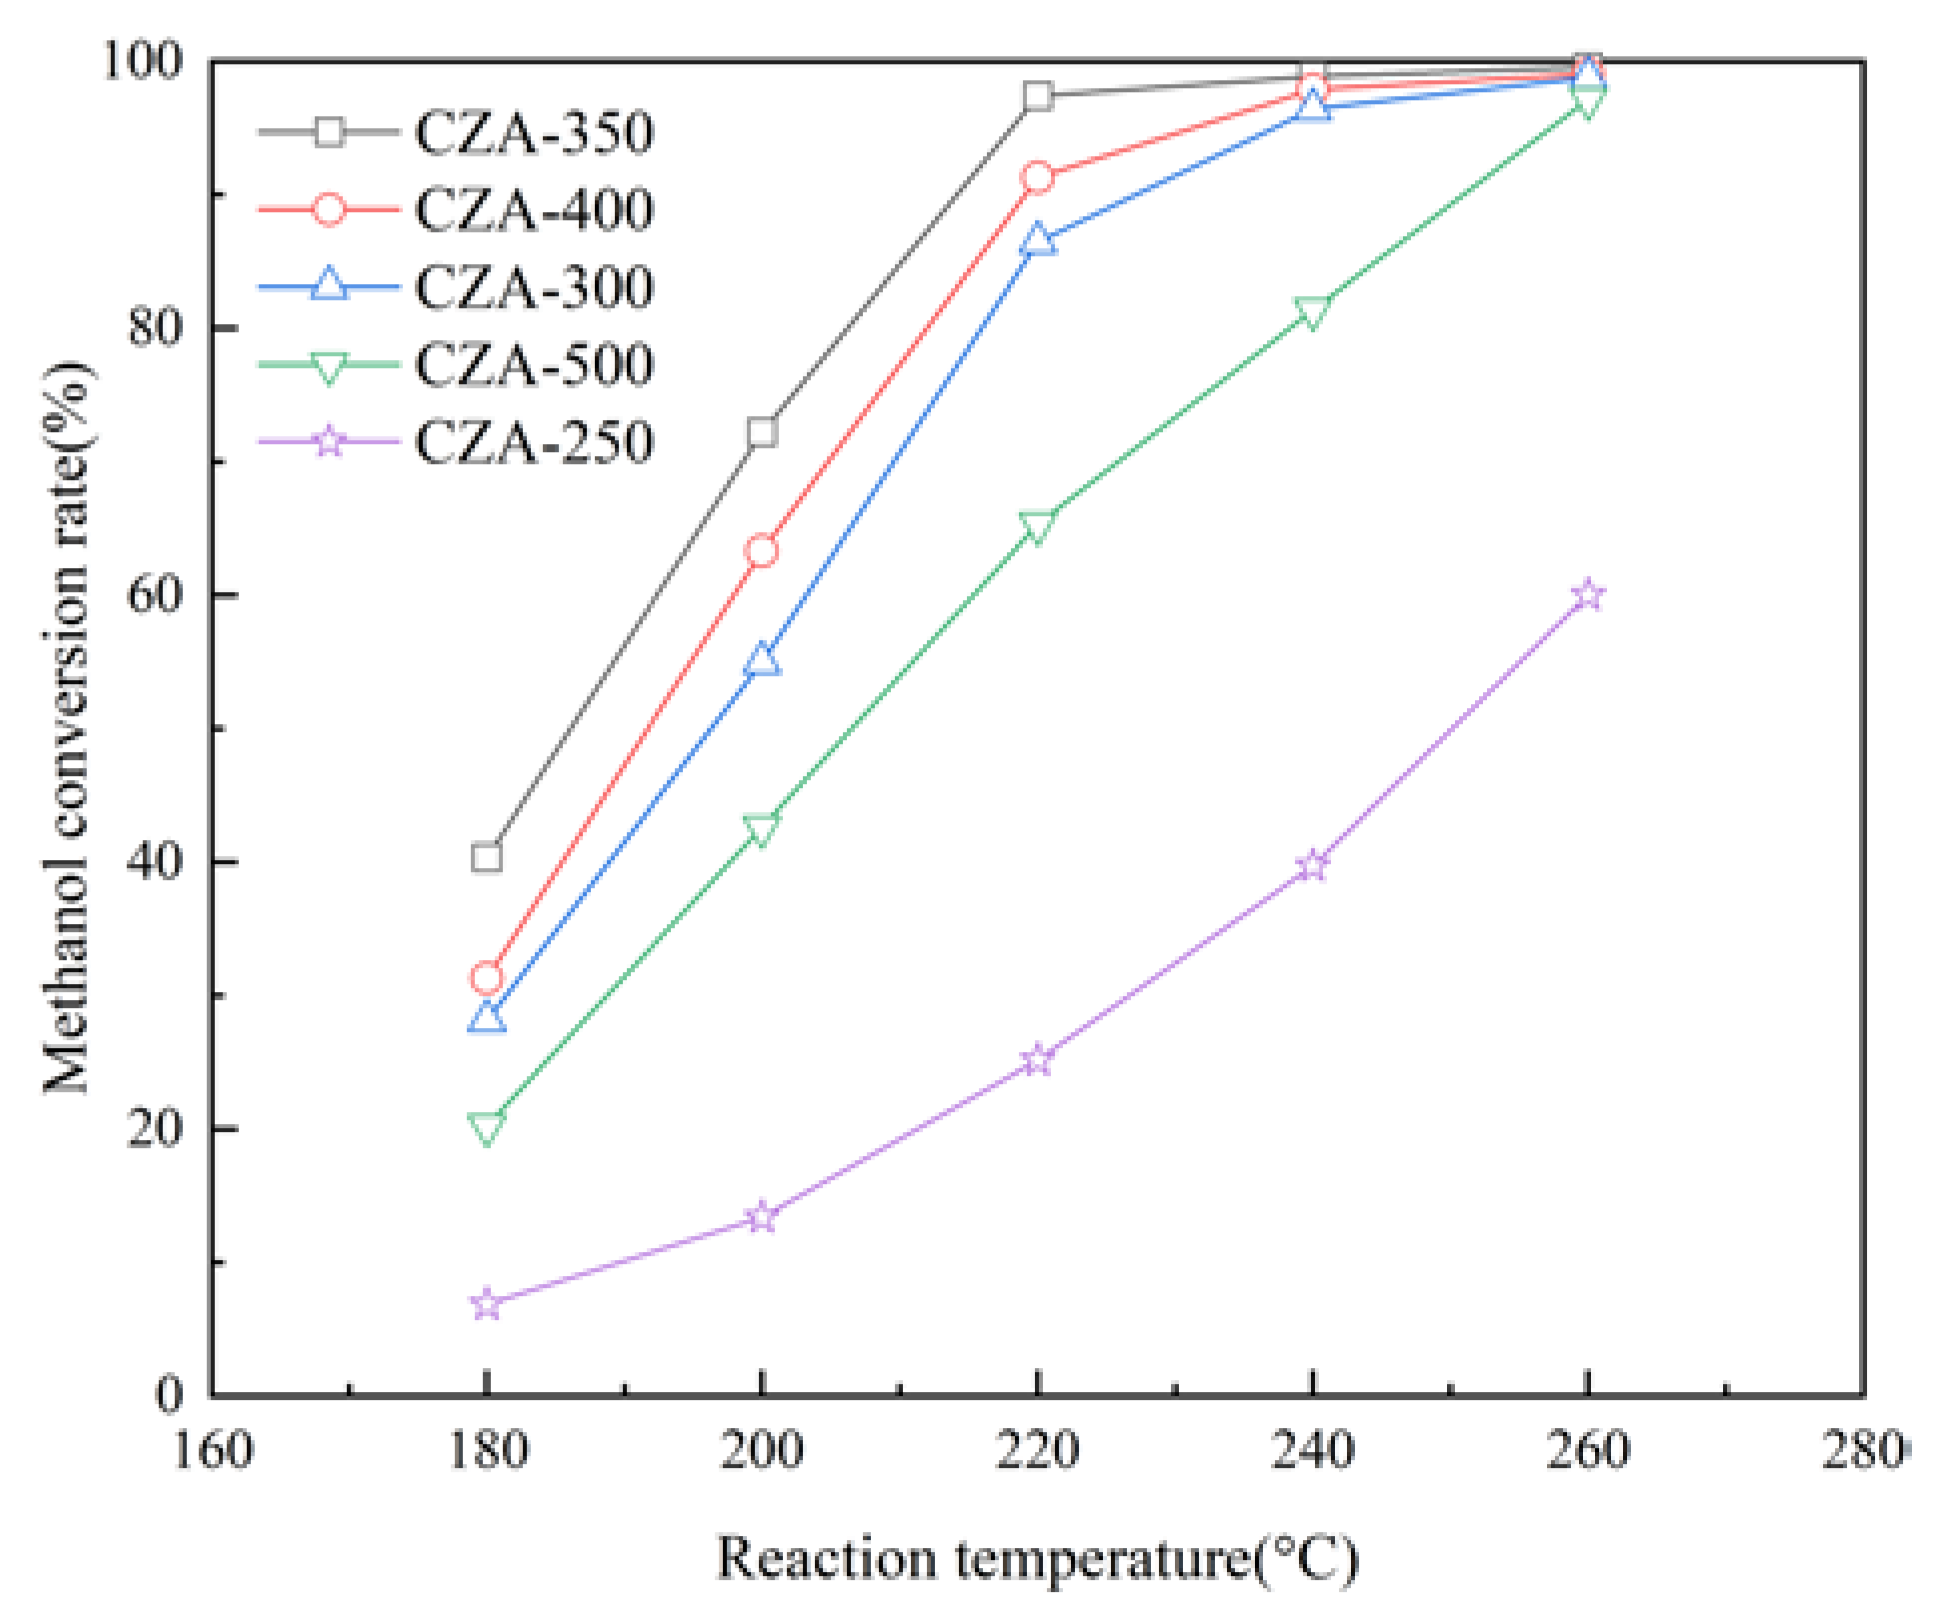
3.2. Effect of Calcination Temperature on Catalytic Performance

As shown in Figure 7, the methanol conversion rate increases with the increase in reaction temperature because MSR is an endothermic equilibrium-limited reaction. The methanol conversion rate exhibits an initial increase followed by a decrease with increasing the calcination temperature. The CZA-350 catalyst shows the highest methanol conversion rate when the calcination temperature is 350 °C. At the methanol LHSV of 1.0/h and reaction temperature of 220 °C, the methanol conversion rates of CZA-350, CZA-400, CZA-300, CZA-500 and CZA-250 are 97.4%, 91.3%, 86.4%, 65.3%, and 25.2%, respectively. Characterization results indicate that the low activity of CZA-250 can be attributed to incomplete decomposition of complexes. The activity of CZA-500 significantly decreases compared with that of CZA-400 due to the agglomeration and sintering phenomena observed in copper. Therefore, the subsequent catalysts were calcined at 350 °C for 3 h.
Similar sintering phenomena have been reported in other literature. Fornari et al. [23] studied the effect of calcination temperature on MSR activity. In their study, increasing calcination temperature (>350 °C) reduced the specific area because higher temperatures favor the coalescence of Cu and Zn and increase the crystal size. Also, they calculated the optimum Cu loading of 33 g/g without considering Zn content. In fact, the Zn and Al content can also affect the MSR activity, which is discussed in Section 3.3 and Section 3.5.

3.3. Effect of Cu Loading on Catalytic Performance

The CZA50 catalyst exhibits the highest MSR activity when the Cu loading is 50% in the conventional sol–gel method, as depicted in Figure 8. The methanol conversion rate significantly improves with an increase in Cu loading from 30% to 50%. However, further increasing the Cu loading to 60% results in a decrease in the methanol conversion rate. The methanol conversion rate can exceed 97.3% at a Cu loading of 40% and reaction temperature from 220 °C to 260 °C. A moderate increase in Cu loading promotes an augmentation of the active substance copper, thereby enhancing the catalytic activity. Nevertheless, an excessive Cu loading leads to a reduction in the specific surface area and the accumulation of CuO particles according to the XRD results, which is consistent with the findings of Yang et al. [27,28].

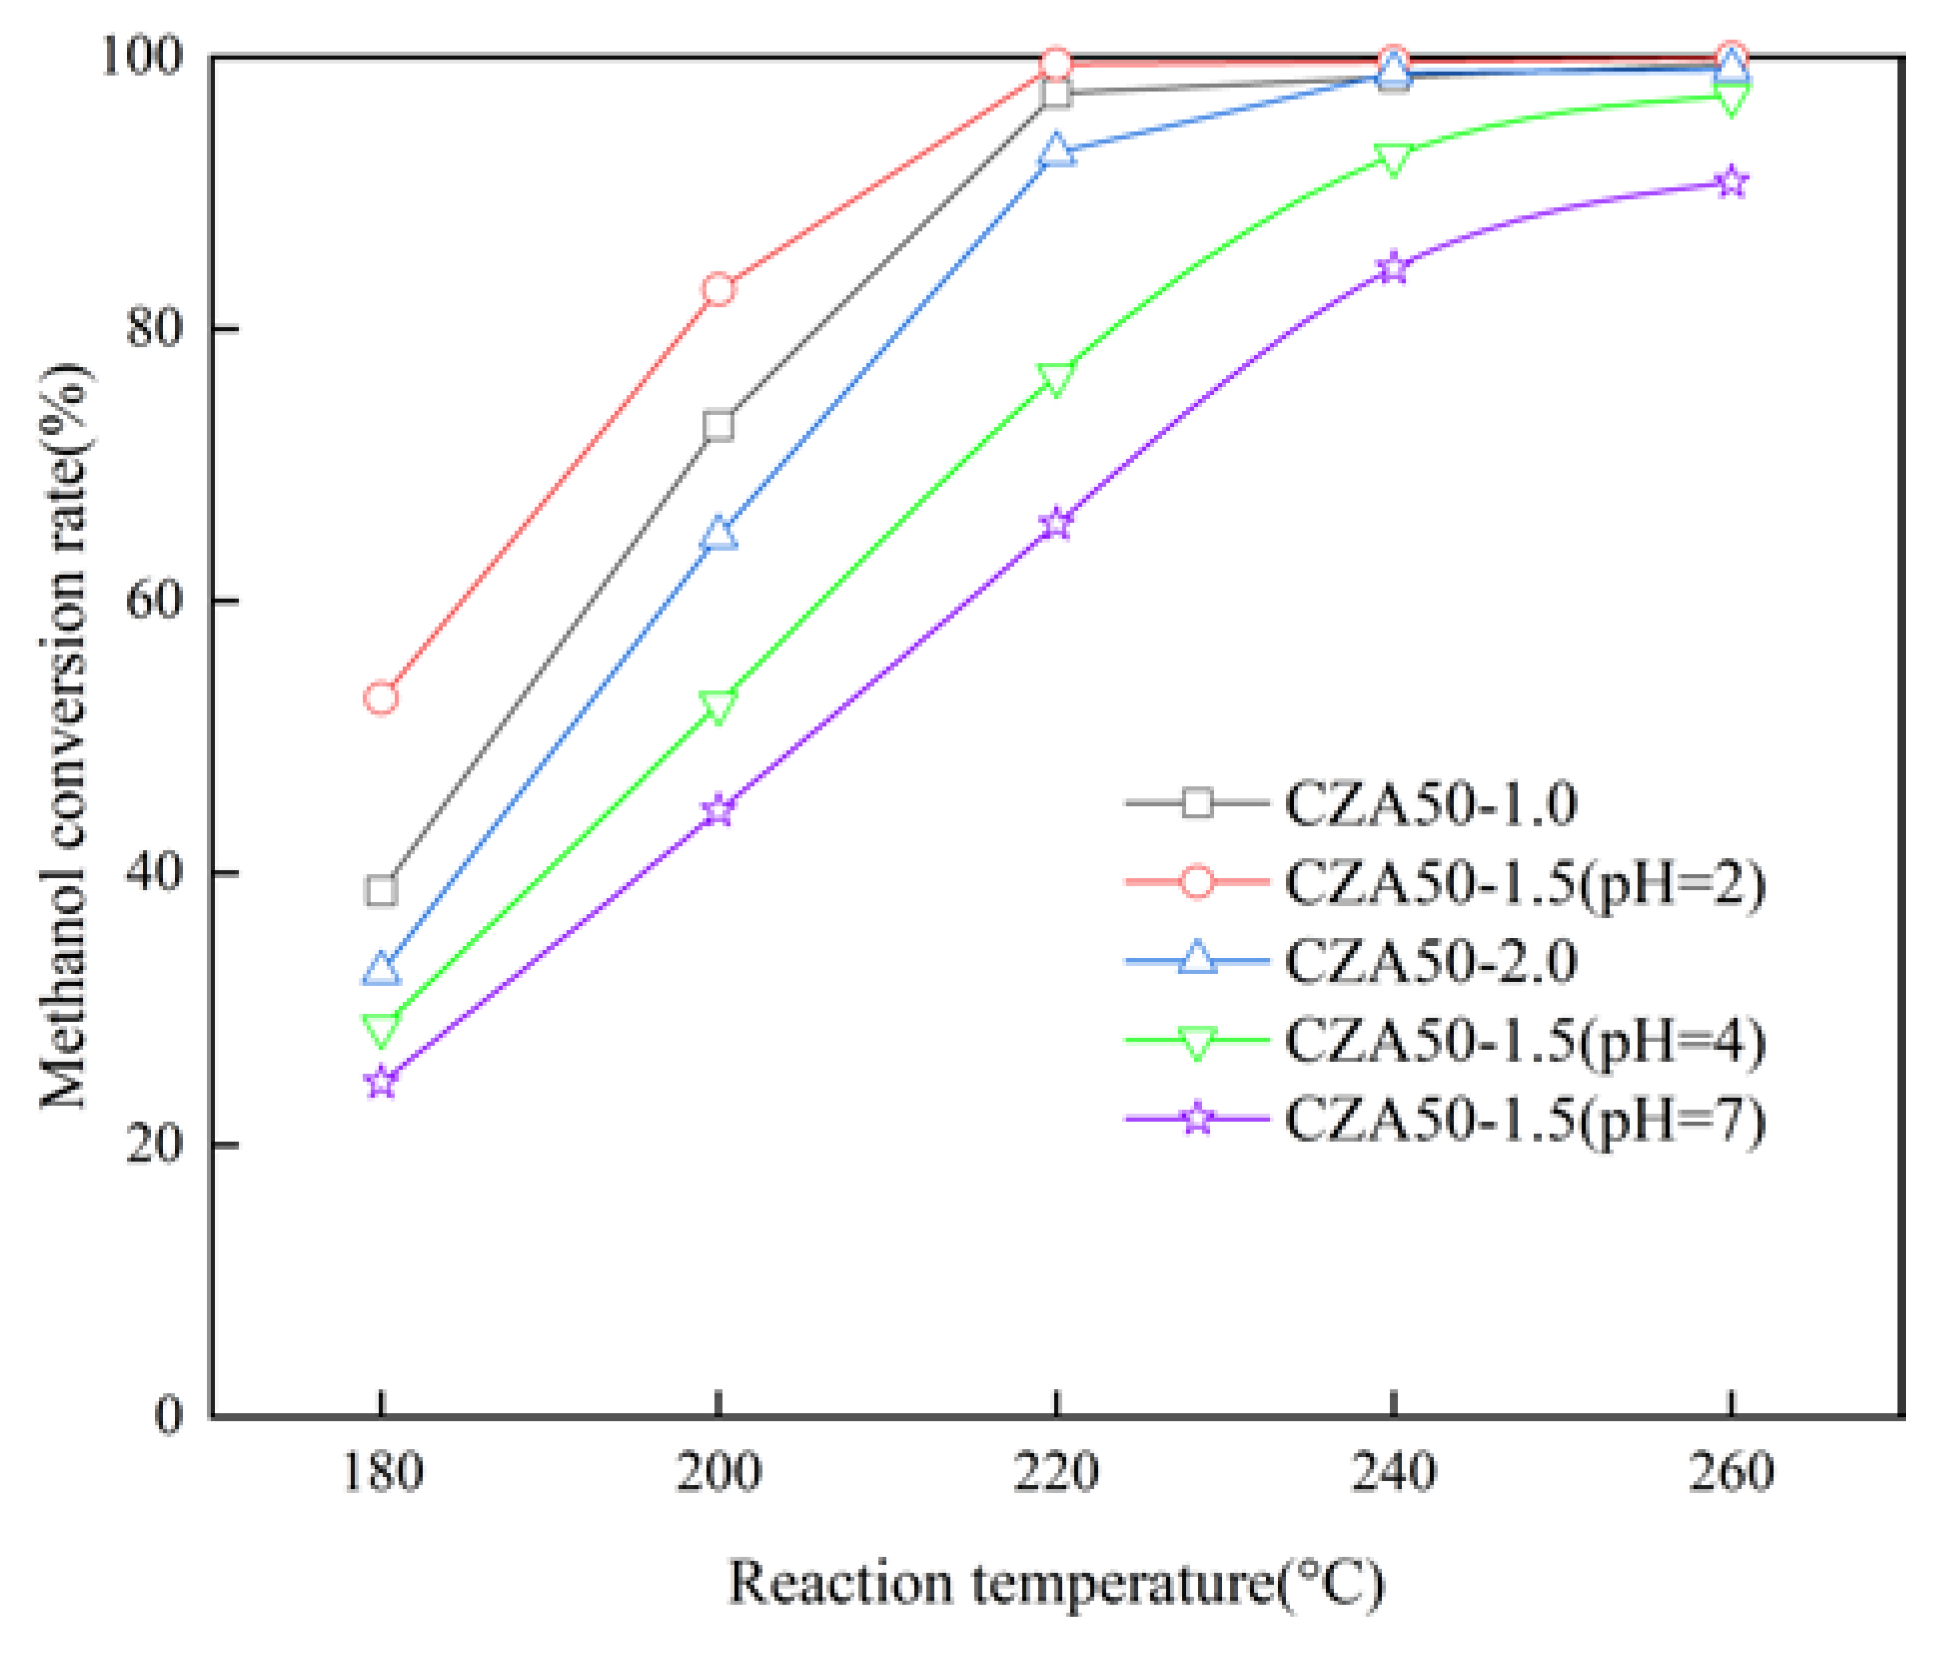
3.4. The Citric Acid to Metal Ions Molar Ratio (CA/M) and pH

The CA/M and pH were studied by adjusting the quantities of citric acid and ammonia water. CZA50-1.0, CZA50-1.5 (pH = 2), and CZA50-2.0 did not incorporate any ammonia water during the sol–gel process. As depicted in Figure 9, when the mole ratio of citric acid to metal ions reaches 1.5, which is close to the stoichiometric ratio of 1.4 in the complexation reaction of metal ions and citric acid [29], CZA50-1.5 (pH = 2) performs the highest catalytic activity.
Additionally, it is observed that increasing pH leads to a decrease in the methanol conversion rate. The sol–gel solution turned from light blue to dark blue upon the addition of ammonia water due to the easier complexation ability of Cu2+ ions with ammonia compared to carboxylic acid. While a copper–ammonia complex formed rapidly, Zn2+ and Al3+ gradually formed complexes as the solvent evaporated. Gao et al. [30] studied the impact of pH on copper-based catalysts prepared via the sol–gel method and found that CuO particles increased with pH increase, indicating that the addition of ammonia water was unfavorable for Cu dispersity. Similarly, Velinov et al. [31] reported that CuFeMn catalysts without adding ammonia water exhibited smaller crystal sizes and higher catalytic activity than those adding ammonia water. Ammonia makes it easier to form Cu complex than carboxylic acid, which prevents the dispersion of Cu in other metal ions.

3.5. Effect of Al/(Cu+Zn) on Catalytic Performance

Figure 10 illustrates the effect of Al/(Cu+Zn) on the methanol conversion rate. The optimal mole ratio for Al/(Cu+Zn) is determined as 0.25 based on its superior catalytic performance. It can be observed that the methanol conversion rate follows the following order: MCZA-0.25 > MCZA-0.35 > MCZA-0.15 > MCZA-0.45. At temperature of 220 °C and methanol of 1.0/h, the respective methanol conversion rates of MCZA-0.25, MCZA-0.35, MCZA-0.15, and MCZA-0.45 are 98.7%, 95.9%, 90.8%, and 84.9%. The amount of γ-Al2O3 can regulate Cu dispersion and further affect the catalytic activity according to characterization results of the specific surface area and the crystal size of CuO.

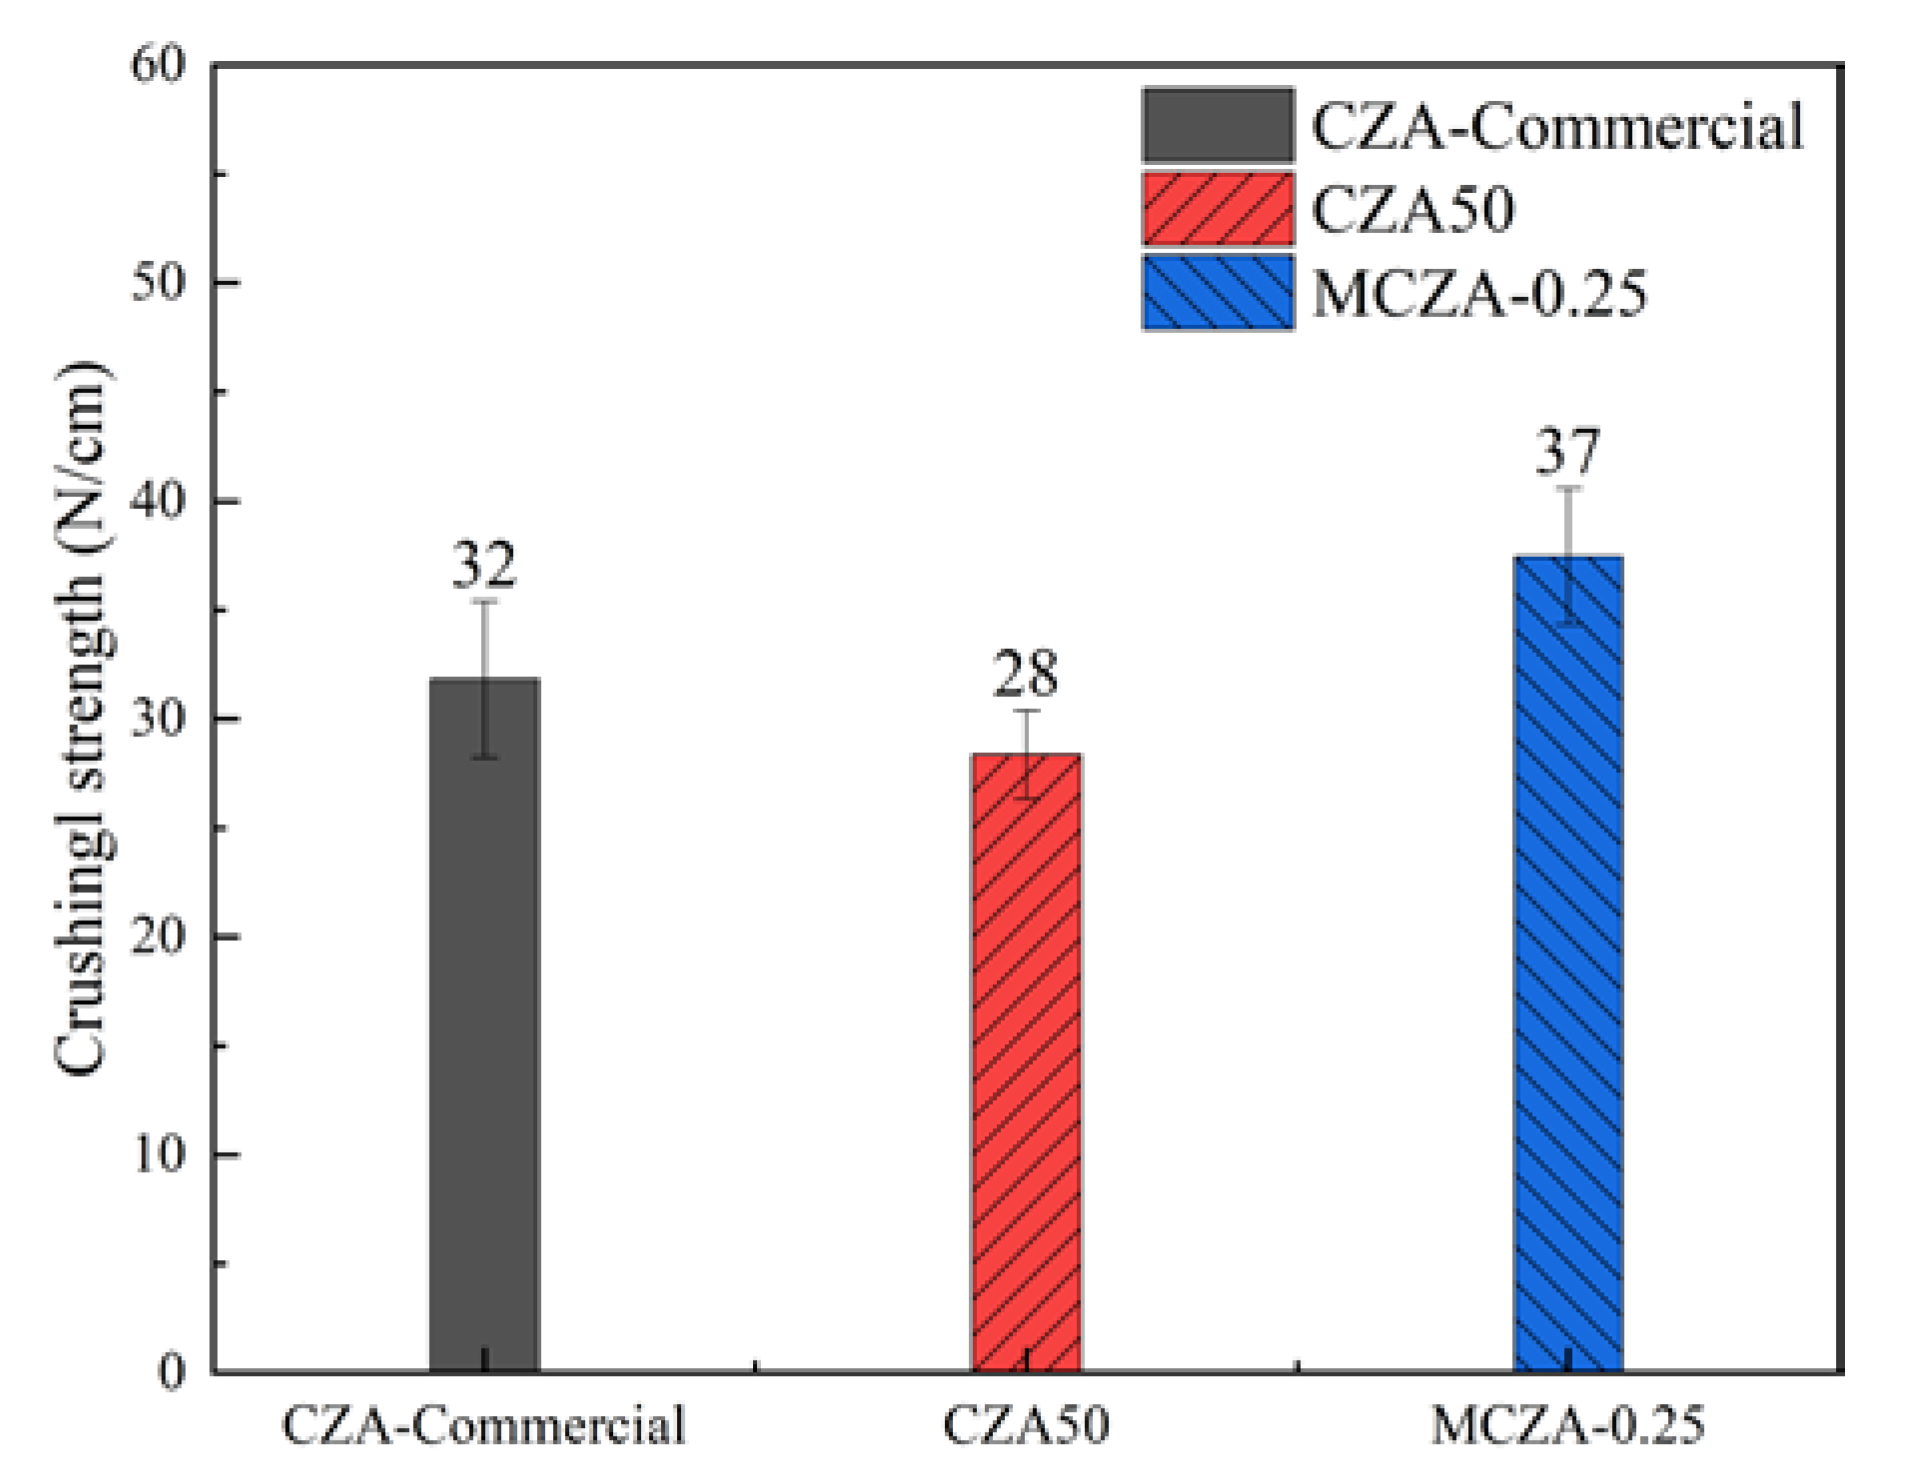
3.6. Comparison with Commercial Catalysts

The methanol conversion rate, H2 yield, and CO concentration over three catalysts are presented in Figure 11. CZA50 exhibits a higher rate compared with MCZA-0.25 and CZA-Commercial at the reaction below 220 °C. At a temperature of 200 °C and LHSV of 1.0/h, the methanol conversion rates of CZA50, MCA-025, and CZA-Commercial are 82.9%, 79.4%, and 74.7%, respectively. Both CZA50 and MCZA-0.25 methanol conversion rates achieve nearly 100% at temperatures at 220 °C, while CZA-commercial reaches a conversion rate of 97.5% under the same conditions. The exceptional catalytic activity of CZA50 can be attributed to a high Cu atom concentration on the surface and the small crystal size of CuO.
One drawback of using methanol as an online hydrogen source for low-temperature PEMFCs is the formation of CO. However, by improving the low-temperature activity of Cu/ZnO/Al2O3 catalysts, it is possible to reduce the CO content significantly. The trend observed in hydrogen yield follows a similar pattern to that seen in methanol conversion rates, as shown in Figure 11b. The hydrogen yield increases initially with increasing temperature before stabilizing when temperatures reach above 220 °C.
As depicted in Figure 12, the average crushing strengths of CZA-Commercial, CZA50, and MCZA-0.25 were 32 N/cm, 28 N/cm, and 37 N/cm, respectively. In our previous study, the average crushing strength of CZA-Commercial decreased from 32 N/cm to 4 N/cm after a hundred times cold start-up of an online MSR system [25]. The modified sol–gel method inherited the advantages of the high-loading capacity of the conventional sol–gel method and the high mechanical strength of the impregnation method. Compared with CZA50 and CZA-Commercial, the average crushing strength of MCZA-0.25 is higher by 32.1% and 15.6%, respectively. The mechanical strength was improved mainly because of the support and dispersion effect of γ-Al2O3 powders. Additionally, raw material costs can be reduced by using γ-Al2O3 powders to prepare Cu/ZnO/Al2O3 catalysts because the price of γ-Al2O3 powders is lower than aluminum nitrates. The preparation process is easy to operate and saves many water resources. Therefore, the MCZA-025 shows commercial potential in terms of the preparation cost and catalytic activity.
In addition, although three catalysts showed good stability in catalytic activity after running for about 20 h, further experiments, including catalytic activity and mechanical strength tests, are pending tests after a long time running and frequent start-ups and shut-downs.

3.7. Reaction Condition Optimization

The effect of methanol LHSV and reaction temperature was studied over MCZA-0.25 to achieve a reforming gas with low CO concentration and high H2 production. As shown in Figure 13a, the CO concentration increases with the increasing reaction temperature, whereas it decreases with the increasing LHSV. There exists a maximum methanol LHSV when the methanol conversion rate reaches 100% at a specific temperature, where the corresponding CO concentration can reach the minimum value. Furthermore, Figure 13b demonstrates a linearly positive relationship between the maximum methanol LHSV and reaction temperature. The corresponding CO concentration increases as the temperature increases. Consequently, a low CO concentration or a high H2 production can be acquired by adjusting the reaction temperature and methanol LHSV for different application situations. For example, high reaction temperature and methanol LHSV are suitable for high-temperature PEMFCs since they can tolerate up to 1% of CO content. Conversely, low reaction temperature and high methanol LHSV are necessary for minimizing CO concentrations in low-temperature PEMFCs where their CO tolerance is usually not more than 10 ppm [32]. At a temperature of 180 °C and the maximum methanol LHSV of 0.3/h, the reforming gas achieves a CO concentration as low as 0.15%. Although this gas cannot be directly utilized in low-temperature PEMFCs, reducing its CO content helps decrease costs associated with CO deep removal processes such as preferential oxidation and pressure swing adsorption (PSA).

4. Conclusions

The Cu/ZnO/Al2O3 catalysts were prepared using sol–gel methods for methanol steam reforming, and the preparation conditions, including calcination temperature, Cu loading, citric acid to metal ions molar ratio, and pH, were studied. The catalytic activity was found to decrease at lower calcination temperatures due to the incomplete decomposition of citrates. Also, the catalytic activity declined at a high calcination temperature due to the agglomeration of CuO. Among the catalysts studied, CZA50 exhibited the highest activity with a 50% Cu loading, a calcination temperature of 350 °C, and a citric acid to metal ion ratio of 1.5. Furthermore, it was observed that increasing pH by adding ammonia led to a decrease in catalytic activity.
MCZA-0.25 prepared using the modified sol–gel method showed superior mechanical strength compared with CZA50 and CZA-Commercial. The maximum methanol LHSV and the minimum CO concentration under different temperatures were tested. Suitable operating conditions of MSR can be selected for different application scenarios, such as high-temperature fuel cells and low-temperature fuel cells. MCZA-0.25 performed a high activity and mechanical strength and has potential applications in various fields such as online methanol reforming fuel cell systems, which can be applied to new energy vehicles, mobile/backup power supply, distributed energy systems, unmanned aerial vehicles (UAV), and methanol-powered ships, etc.

Author Contributions

Conceptualization, Q.S.; methodology, Y.L.; validation, Y.L.; formal analysis, Y.L.; investigation, Y.L.; writing—original draft preparation, Y.L.; writing—review and editing, C.L. and Q.S.; supervision, Q.S.; funding acquisition, C.L. All authors have read and agreed to the published version of the manuscript.

Funding

This research was funded by the Fundamental Research Funds for the Central Universitie, grant number [FRF-TP-18-010A3] and [FRF-BD-20-09A].

Data Availability Statement

Data are contained within the article.

Conflicts of Interest

The authors declare no conflict of interest.

References

  1. Singh, J.; Nozari, H.; Herreros, J.M.; Tsolakis, A. Synergies between aliphatic bio-alcohols and thermo-chemical waste heat recovery for reduced CO2 emissions in vehicles. Fuel 2021, 304, 121439. [Google Scholar] [CrossRef]
  2. Madeira, J.G.F.; Oliveira, E.M.; Springer, M.V.; Cabral, H.L.; do Carmo Barbeito, D.F.; Souza, A.P.G.; da Silva Moura, D.A.; Delgado, A.R.S. Hydrogen production from swine manure biogas via steam reforming of methane (SRM) and water gas shift (WGS): An ecological, technical, and economic analysis. Int. J. Hydrogen Energy 2021, 46, 8961–8971. [Google Scholar] [CrossRef]
  3. Ishaq, H.; Dincer, I.; Crawford, C. A review on hydrogen production and utilization: Challenges and opportunities. Int. J. Hydrogen Energy 2022, 47, 26238–26264. [Google Scholar] [CrossRef]
  4. Wei, Q.S.; Zhang, X.; Oh, B.S. The effect of driving cycles and H2 production pathways on the lifecycle analysis of hydrogen fuel cell vehicle: A case study in South Korea. Int. J. Hydrogen Energy 2021, 46, 7622–7633. [Google Scholar] [CrossRef]
  5. Lian, H.Y.; Liu, J.L.; Li, X.S.; Zhu, X.; Weber, A.Z.; Zhu, A.M. Plasma chain catalytic reforming of methanol for on-board hydrogen production. Chem. Eng. J. 2019, 369, 245–252. [Google Scholar] [CrossRef]
  6. Tang, L.; Kuai, L.; Li, Y.; Li, H.; Zhou, Y.; Zou, Z. ZnxCd1−xS tunable band structure-directing photocatalytic activity and selectivity of visible-light reduction of CO2 into liquid solar fuels. Nanotechnology 2017, 29, 064003. [Google Scholar] [CrossRef]
  7. Yong, S.T.; Ooi, C.W.; Chai, S.P.; Wu, X.S. Review of methanol reforming-Cu-based catalysts, surface reaction mechanisms, and reaction schemes. Int. J. Hydrogen Energy 2013, 38, 9541–9552. [Google Scholar] [CrossRef]
  8. Han, Z.; Tang, C.; Sha, F.; Tang, S.; Wang, J.; Li, C. CO2 hydrogenation to methanol on ZnO-ZrO2 solid solution catalysts with ordered mesoporous structure. J. Catal. 2021, 396, 242–250. [Google Scholar] [CrossRef]
  9. Liu, X.; Hong, H.; Zhang, H.; Cao, Y.; Qu, W.; Jin, H. Solar methanol by hybridizing natural gas chemical looping reforming with solar heat. Appl. Energy 2020, 277, 115521. [Google Scholar] [CrossRef]
  10. Wang, J.J.; Han, Z.; Li, C.; Chen, S.; Tang, C.; Sha, F.; Tang, S.; Yao, T. Liquid sunshine methanol. Chem. Ind. Eng. Prog. 2022, 41, 1309–1317. [Google Scholar]
  11. Simon Araya, S.; Liso, V.; Cui, X.; Li, N.; Zhu, J.; Sahlin, S.L.; Jensen, S.H.; Nielsen, M.P.; Kær, S.K. A Review of The Methanol Economy: The Fuel Cell Route. Energies 2020, 13, 596. [Google Scholar] [CrossRef]
  12. Xu, X.; Shuai, K.; Xu, B. Review on Copper and Palladium Based Catalysts for Methanol Steam Reforming to Produce Hydrogen. Catalysts 2017, 7, 183. [Google Scholar] [CrossRef]
  13. Zhu, J.; Araya, S.S.; Cui, X.; Sahlin, S.L.; Kær, S.K. Modeling and Design of a Multi-Tubular Packed-Bed Reactor for Methanol Steam Reforming over a Cu/ZnO/Al2O3 Catalyst. Energies 2020, 13, 610. [Google Scholar] [CrossRef]
  14. Zhang, Z.; Chen, X.; Kang, J.; Yu, Z.; Tian, J.; Gong, Z.; Jia, A.; You, R.; Qian, K.; He, S.; et al. The active sites of Cu-ZnO catalysts for water gas shift and CO hydrogenation reactions. Nat. Commun. 2021, 12, 4331. [Google Scholar] [CrossRef]
  15. Shen, Q.; Cai, Z.; Shao, Z.; Yang, G.; Li, S. Improved performance of bimetallic oxides CuO-Y2O3 synthesized by sol-gel for methanol steam reforming. J. Am. Ceram. Soc. 2022, 105, 6839–6850. [Google Scholar] [CrossRef]
  16. Cao, A.; Wang, Z.; Li, H.; Elnabawy, A.O.; Nørskov, J.K. New insights on CO and CO2 hydrogenation for methanol synthesis: The key role of adsorbate-adsorbate interactions on Cu and the highly active MgO-Cu interface. J. Catal. 2021, 400, 325–331. [Google Scholar] [CrossRef]
  17. Li, Y.; Luo, C.; Xu, J.; Su, Q. A cold start-up method with combining chemical-looping combustion and catalytic combustion for a methanol reformer. Int. J. Hydrogen Energy 2023. [Google Scholar] [CrossRef]
  18. Huang, T.; Qiu, Z.; Hu, Z.; Lu, X. Novel method of preparing hierarchical porous CoFe2O4 by the citric acid-assisted sol-gel auto-combustion for supercapacitors. J. Energy Storage 2021, 35, 102286. [Google Scholar] [CrossRef]
  19. Kowalik, P.; Antoniak-Jurak, K.; Próchniak, W.; Wiercioch, P.; Konkol, M.; Bicki, R.; Michalska, K.; Walczak, M. The Evaluation of Synthesis Route Impact on Structure, Morphology and LT-WGS Activity of Cu/ZnO/Al2O3 catalysts. Catal. Lett. 2017, 147, 1422–1433. [Google Scholar] [CrossRef]
  20. Shi, L.; Zeng, C.; Jin, Y.; Wang, T.; Tsubaki, N. A sol-gel auto-combustion method to prepare Cu/ZnO catalysts for low-temperature methanol synthesis. Catal. Sci. Technol. 2012, 2, 2569–2577. [Google Scholar] [CrossRef]
  21. Velinov, N.; Petrova, T.; Genova, I.; Ivanov, I.; Tsoncheva, T.; Idakiev, V.; Kunev, B.; Mitov, I. Synthesis and Mossbauer spectroscopic investigation of copper-manganese ferrite catalysts for water-gas shift reaction and methanol decomposition. Mater. Res. Bull. 2017, 95, 556–562. [Google Scholar] [CrossRef]
  22. Jha, A.; Jeong, D.W.; Jang, W.J.; Lee, Y.L.; Roh, H.S. Hydrogen production from water–gas shift reaction over Ni–Cu–CeO2 oxide catalyst: The effect of preparation methods. Int. J. Hydrogen Energy 2015, 40, 9209–9216. [Google Scholar] [CrossRef]
  23. Fornari, A.C.; Menechini Neto, R.; Lenzi, G.G.; dos Santos, O.A.A.; de Matos Jorge, L.M. Utilization of Sol-Gel CuO-ZnO-Al2O3 catalysts in the methanol steam reforming for hydrogen production. Can. J. Chem. Eng. 2017, 95, 2258–2271. [Google Scholar] [CrossRef]
  24. Tuza, P.V.; Manfro, R.L.; Ribeiro, N.F.; Souza, M.M. Production of renewable hydrogen by aqueous-phase reforming of glycerol over Ni–Cu catalysts derived from hydrotalcite precursors. Renew. Energy 2013, 50, 408–414. [Google Scholar] [CrossRef]
  25. Li, Y.S.; Luo, C.H.; Su, Q.Q. Cold start-up study of methanol reformer based on chemical-looping combustion. Fuel 2022, 317, 12850. [Google Scholar] [CrossRef]
  26. Wang, L.-B.; Wang, H.-H.; Zhang, L.; Qing, S.-J.; Liu, D.-M.; Gao, Z.-X.; Zhang, H.-J.; Guan, G.-Q. Effect of citric acid content on the hydrothermal synthesis of CuO/Ce0.8Zr0.2O2 catalytic water gas shift hydrogen production performance. J. Fuel Chem. Technol. 2022, 50, 337–345. [Google Scholar]
  27. Yang, B.; Deng, W.; Guo, L.; Ishihara, T. Copper-ceria solid solution with improved catalytic activity for hydrogenation of CO2 to CH3OH. Chin. J. Catal. 2020, 41, 1348–1359. [Google Scholar] [CrossRef]
  28. Mateos-Pedrero, C.; Azenha, C.; Tanaka, D.A.P.; Sousa, J.M.; Mendes, A. The influence of the support composition on the physicochemical and catalytic properties of Cu catalysts supported on Zirconia-Alumina for methanol steam reforming. Appl. Catal. B-Environ. 2020, 277, 119243. [Google Scholar] [CrossRef]
  29. Kong, X.-Q.; Tang, X.-J.; Xu, S.; Wang, X.-L. Preparation of CuO-ZnO/Al2O3 by Sol-gel Auto-combustion Method and Its Catalytic Property for Methanol Synthesis from CO2 Hydrogenation. J. Mol. Catal. 2013, 27, 159–165. [Google Scholar]
  30. Gao, W.G.; Mao, W.S.; Na, W.; Ma, R.K.; Yan, X.; Huo, H.H. Preparation of Cu-ZnO-ZrO2 Catalyst by Citric Acid Sol-gel Method: Effect of pH on Its Properties. Fine Chem. 2019, 36, 1625–1633. [Google Scholar]
  31. Velinov, N.; Petrova, T.; Tsoncheva, T.; Genova, I.; Koleva, K.; Kovacheva, D.; Mitov, I. Auto-combustion synthesis, Mössbauer study and catalytic properties of copper-manganese ferrites. Hyperfine Interact. 2016, 237, 24. [Google Scholar] [CrossRef]
  32. Park, S.S.; Jeon, Y.; Park, J.M.; Kim, H.; Choi, S.W.; Kim, H.; Shul, Y.G. The Operation of Polymer Electrolyte Membrane Fuel Cell using Hydrogen Produced from the Combined Methanol Reforming Process. J. Electrochem. Sci. Technol. 2016, 7, 146–152. [Google Scholar] [CrossRef]
Figure 1. Flow chart of the catalyst preparation process.
Energies 16 07803 g001
Figure 2. Schematic diagram of the experimental apparatus.
Energies 16 07803 g002
Figure 3. TGA curve: (a) citric acid; (b) xerogel; (c) CZA50; (d) MCZA-0.25.
Energies 16 07803 g003
Figure 4. H2-TPR profiles of CZA50 and MCZA-0.25.
Energies 16 07803 g004
Figure 5. The XPS spectra of Cu 2p and Al 2p of CZA50 (a) and MCZA-0.25 (b).
Energies 16 07803 g005
Figure 6. The XRD patterns of Cu/ZnO/Al2O3: (a) calcination temperature; (b) Cu loading of CZA and Al/(Cu+Zn) ratio in MCZA.
Energies 16 07803 g006
Figure 7. Effect of the calcination temperature on the methanol conversion rate.
Energies 16 07803 g007
Figure 8. Effect of Cu loading on the methanol conversion rate.
Energies 16 07803 g008
Figure 9. Effect of the CA/M and pH on the methanol conversion rate.
Energies 16 07803 g009
Figure 10. Effect of the Al/(Cu+Zn) on the methanol conversion rate.
Energies 16 07803 g010
Figure 11. (a) methanol conversion rate and CO concentration; (b) hydrogen yield.
Energies 16 07803 g011
Figure 12. The average crushing strength of catalysts.
Energies 16 07803 g012
Figure 13. (a) Effect of methanol LHSV on methanol conversion rate and CO cncentrationCO; (b) Effect of reaction temperature on maximum methanol LHSV and CO concentration.
Energies 16 07803 g013
Table 1. Composition and preparation conditions.
SamplesThe Mole Ratio of Cu: Zn:AlWeight Fraction of Cu/%Calcination Temperature/°CMole Ratio of Citric Acid to Metal Ions
CZA40-25040:40:20382501.5
CZA40-30040:40:20383001.5
CZA40-35040:40:20383501.5
CZA40-40040:40:20384001.5
CZA40-50040:40:20385001.5
CZA3030:50:20273501.5
CZA50 (-1.5)50:30:20483501.5
CZA6060:20:20593501.5
CZA50-1.050:30:20483501.0
CZA50-2.050:30:20483502.0
MCZA-0.1550:30:12513501.5
MCZA-0.2550:30:20483501.5
MCZA-0.3550:30:28453501.5
MCZA-0.4550:30:36433501.5
Table 2. XPS surface composition analysis results.
SamplesSurface Atom Concentration (%)
CuZnAlOC
CZA504.68.524.436.725.8
MCZA-0.254.117.520.238.120.1
Table 3. The crystal size and specific surface area analysis results.
SamplesSpecific Surface Area (m2/g)CuO Crystal Size (nm)ZnO Crystal Size (nm)
CZA-250-3118
CZA-300-1414
CZA-350-1415
CZA-500-1716
CZA30231314
CZA40621512
CZA50651515
CZA60591921
MCZA-0.15522221
MCZA-0.25631916
MCZA-0.35611715
MCZA-0.45541414
CZA-Commercial9966
Disclaimer/Publisher’s Note: The statements, opinions and data contained in all publications are solely those of the individual author(s) and contributor(s) and not of MDPI and/or the editor(s). MDPI and/or the editor(s) disclaim responsibility for any injury to people or property resulting from any ideas, methods, instructions or products referred to in the content.

