Article

Levelized Cost Analysis for Blast Furnace CO2 Capture, Utilization, and Storage Retrofit in China’s Blast Furnace–Basic Oxygen Furnace Steel Plants

1
School of Energy and Mining Engineering, China University of Mining and Technology, Beijing (CUMTB), Beijing 100083, China
2
School of Environment, Tsinghua University, Beijing 100084, China
3
Railway Engineering Research Institute, China Academy of Railway Sciences Corporation Limited, Beijing 100081, China
*
Authors to whom correspondence should be addressed.
Energies 2023, 16(23), 7817; https://doi.org/10.3390/en16237817
Submission received: 23 October 2023 / Revised: 21 November 2023 / Accepted: 25 November 2023 / Published: 28 November 2023
(This article belongs to the Special Issue Risk Assessment of Innovative Energy Systems)

Abstract

:
As the largest carbon emitter in China’s manufacturing sector, the low-carbon transition of the steel industry is urgent. CO2 capture, utilization, and storage (CCUS) technology is one of the effective measures to reduce carbon emissions in steel industry. In this paper, a comprehensive assessment model of source–sink matching-levelized cost in China’s steel industry is constructed to evaluate the potential, economy, and spatial distribution of CCUS retrofits of blast furnaces in the BF-BOF steel industry. The results show that, if no extra incentive policy is included, the levelized cost of carbon dioxide (LCOCD) of 111 steel plants with a 420.07 Mt/a CO2 abatement potential ranges from −134.87 to 142.95 USD/t. The levelized cost of crude steel (LCOS) range of steel plants after the CCUS retrofits of blast furnaces is 341.81 to 541.41 USD/t. The incentives such as carbon market and government subsidies will all contribute to the early deployment of CCUS projects. The CCUS technology could be prioritized for deployment in North China, Northwest China, and East China’s Shandong Province, but more powerful incentives are still needed for current large-scale deployment. The research results can provide references for the early deployment and policy formulation of CCUS in China’s steel industry.

1. Introduction

The series of climate change issues caused by the increase in global greenhouse gases, mainly carbon dioxide (CO2), has become one of the global challenges [1]. As the world’s largest developing country in terms of CO2 emissions [2], China committed to mitigating global climate change and proposed the goal of “peaking CO2 emissions by 2030 and striving to achieve carbon neutrality by 2060” in 2020, which fully demonstrates China’s ambition in carbon emission reduction.
Due to its reliance on the blast furnace–basic oxygen furnace (BF-BOF) process, a coal-based process [3], the steel industry has become one of the main contributors to global CO2 emissions [4]. In 2020, China’s steel industry accounts for about 16% of the country’s total CO2 emissions [5], making it the second largest emission industry after the power industry. Meanwhile, China produced 1.065 billion tons of crude steel in 2020 [6], of which 87.1% came from the BF-BOF process [7]. Therefore, it is urgent to explore the low-carbon transition path of China’s steel industry, especially the BO-BOF process steel plants.
Currently, China’s steel plants have only operated for an average of 12 years (with a maximum average lifespan of 40 years, using 2019 as the base year) [8], and the abolition of such a large number of young steel plants to achieve carbon emission reduction will inevitably result in huge sunk cost losses, which has led to a certain development inertia of the already mature BF-BOF process in China. In a BF-BOF process steel plant, approximately two-thirds of the carbon emissions are discharged from the blast furnace in the form of blast furnace gas [9,10,11]. By capturing CO2 in the blast furnace flue gas, while achieving certain carbon reduction, the remaining flue gas’s calorific value and CO content will also be correspondingly increased, thereby better utilizing these flue gases [12]. Therefore, reducing carbon emissions during the blast furnace ironmaking process will be a more reasonable development direction for carbon reduction in China’s steel industry in the near future [13].
Among the numerous carbon reduction methods that contribute to the deep low-carbon transition of the steel industry, carbon capture, utilization, and storage (CCUS) technology will play an important role [14,15,16,17,18,19,20]. There are many and scattered CO2 emission point sources within steel plants [21], and the abatement potential and avoidance costs of capturing CO2 from different emission sources using different methods vary [22,23,24,25,26]. Even if CO2 capture is performed on the same emission source (such as a blast furnace), the CO2 abatement potential and avoidance costs vary depending on the capture rate and the method used [22,27,28,29,30]. The lack of assessment of CO2 capture in the entire steel industry in the above studies is compensated to some extent by Wei et al. [31]. However, it ignores the differences in capture costs between different emission sources in steel plants and does not consider the impact of incentive measures.
An effective technical evaluation indicator is crucial for addressing stakeholders’ negative views on CCUS technology [32]. Levelized cost generally refers to the levelized cost of electricity (LCOE), which is widely used to demonstrate the economic feasibility of a certain power generation technology [33,34,35,36], such as tidal energy projects [37], variable renewable energy [38], photovoltaic power generation [39,40,41], technical and economic evaluation of straw-fed biomass power plants [42], and investment in wind farms [43,44,45]. However, research on the levelized cost of CCUS retrofits for blast furnaces in steel plants in a specific country/region is still lacking.
Considering the emission characteristics of blast furnaces in China’s BF-BOF process steel plants, this study thoroughly investigates the source–sink matching layout of the whole technology chain of blast furnace CO2 capture, pipeline transportation, and land–sea sequestration, as well as the impacts of the CCUS retrofits of the blast furnaces on the economics of BF-BOF process steel plants. The main innovations and contributions of this paper are as follows:
(1)
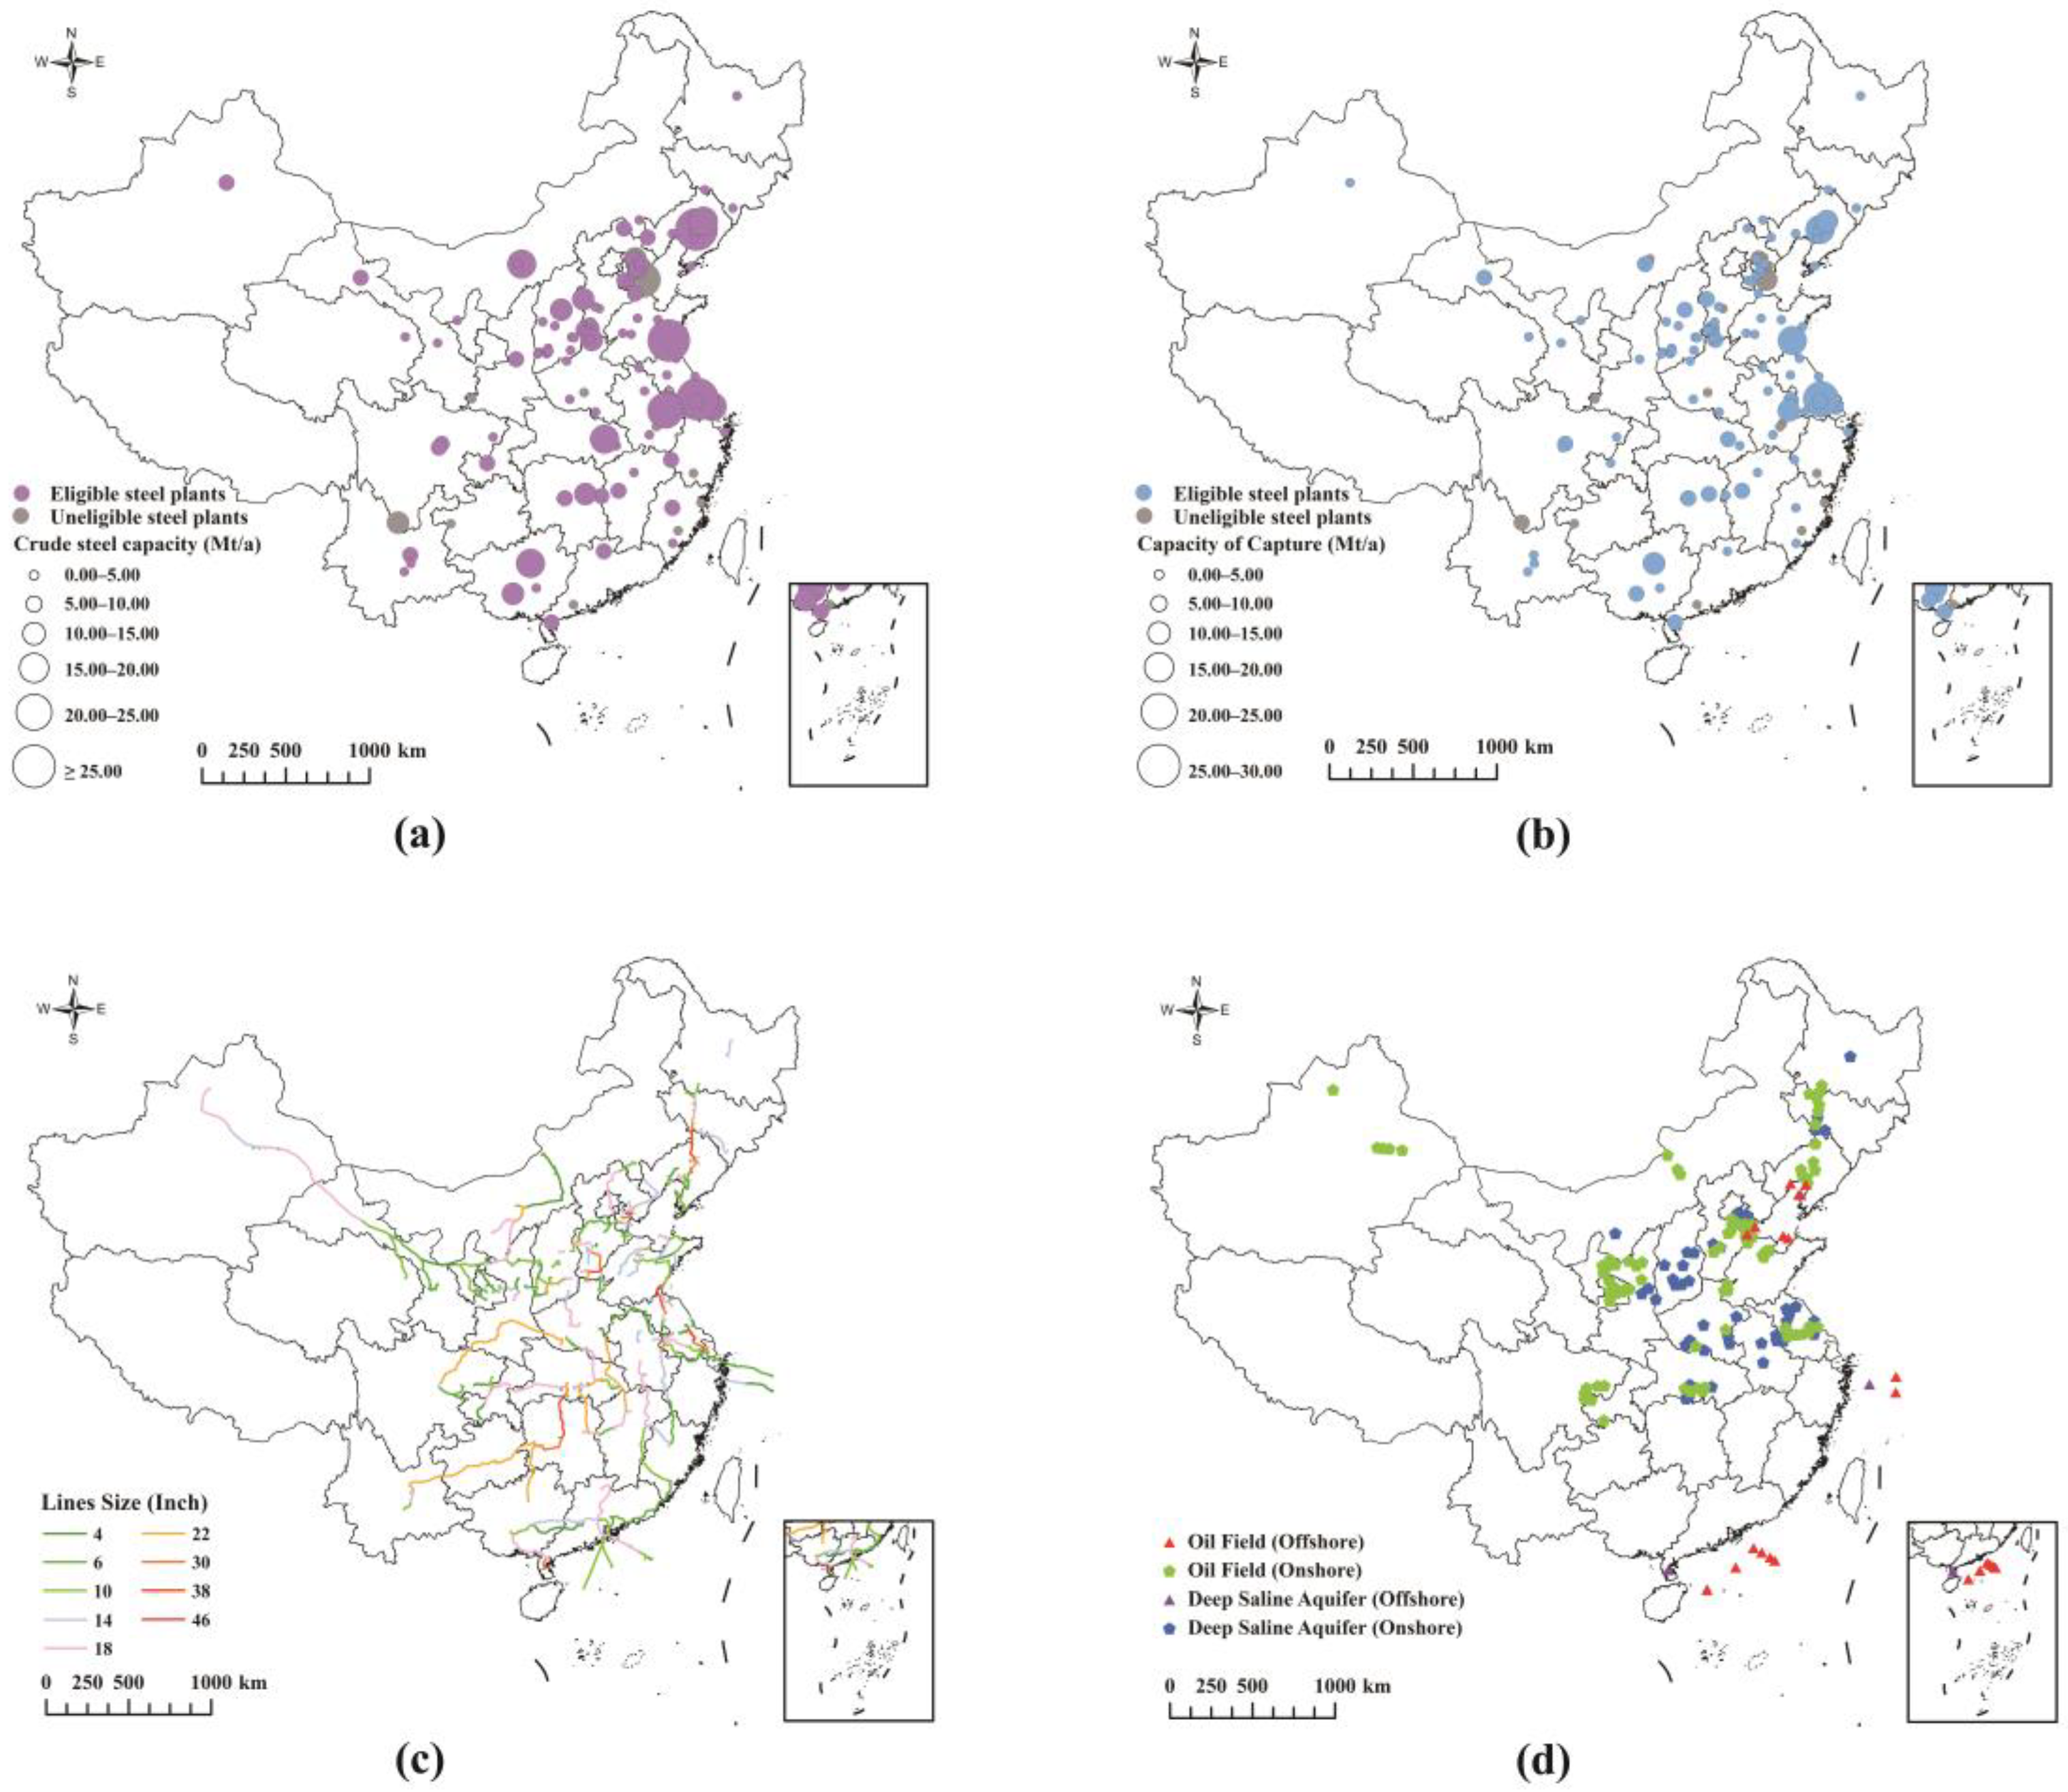
The study has built a CO2 emission database for blast furnaces in China’s BF-BOF process steel plants, established candidate pipeline databases based on existing national highways and land–sea natural gas pipelines in China, and added data for offshore storage sites on top of onshore storage sites.
(2)
Based on the above databases, relevant technical parameters, and provincial-level economic indicators for steel plants and the CCUS retrofits of blast furnaces, this study constructs a comprehensive assessment model of source–sink matching-levelized cost in China’s steel industry.
(3)
Considering factors such as the future development level of CCUS technology and the carbon market, policy incentives, etc., this study obtains the economic and spatial differences of blast furnace CCUS projects and steel plants after blast furnace CCUS retrofits at the steel plant level.
Section 2 introduces the relevant model methods and provides the required data. Section 3 analyzes the results. Section 4 is the conclusion.

2. Materials and Methods

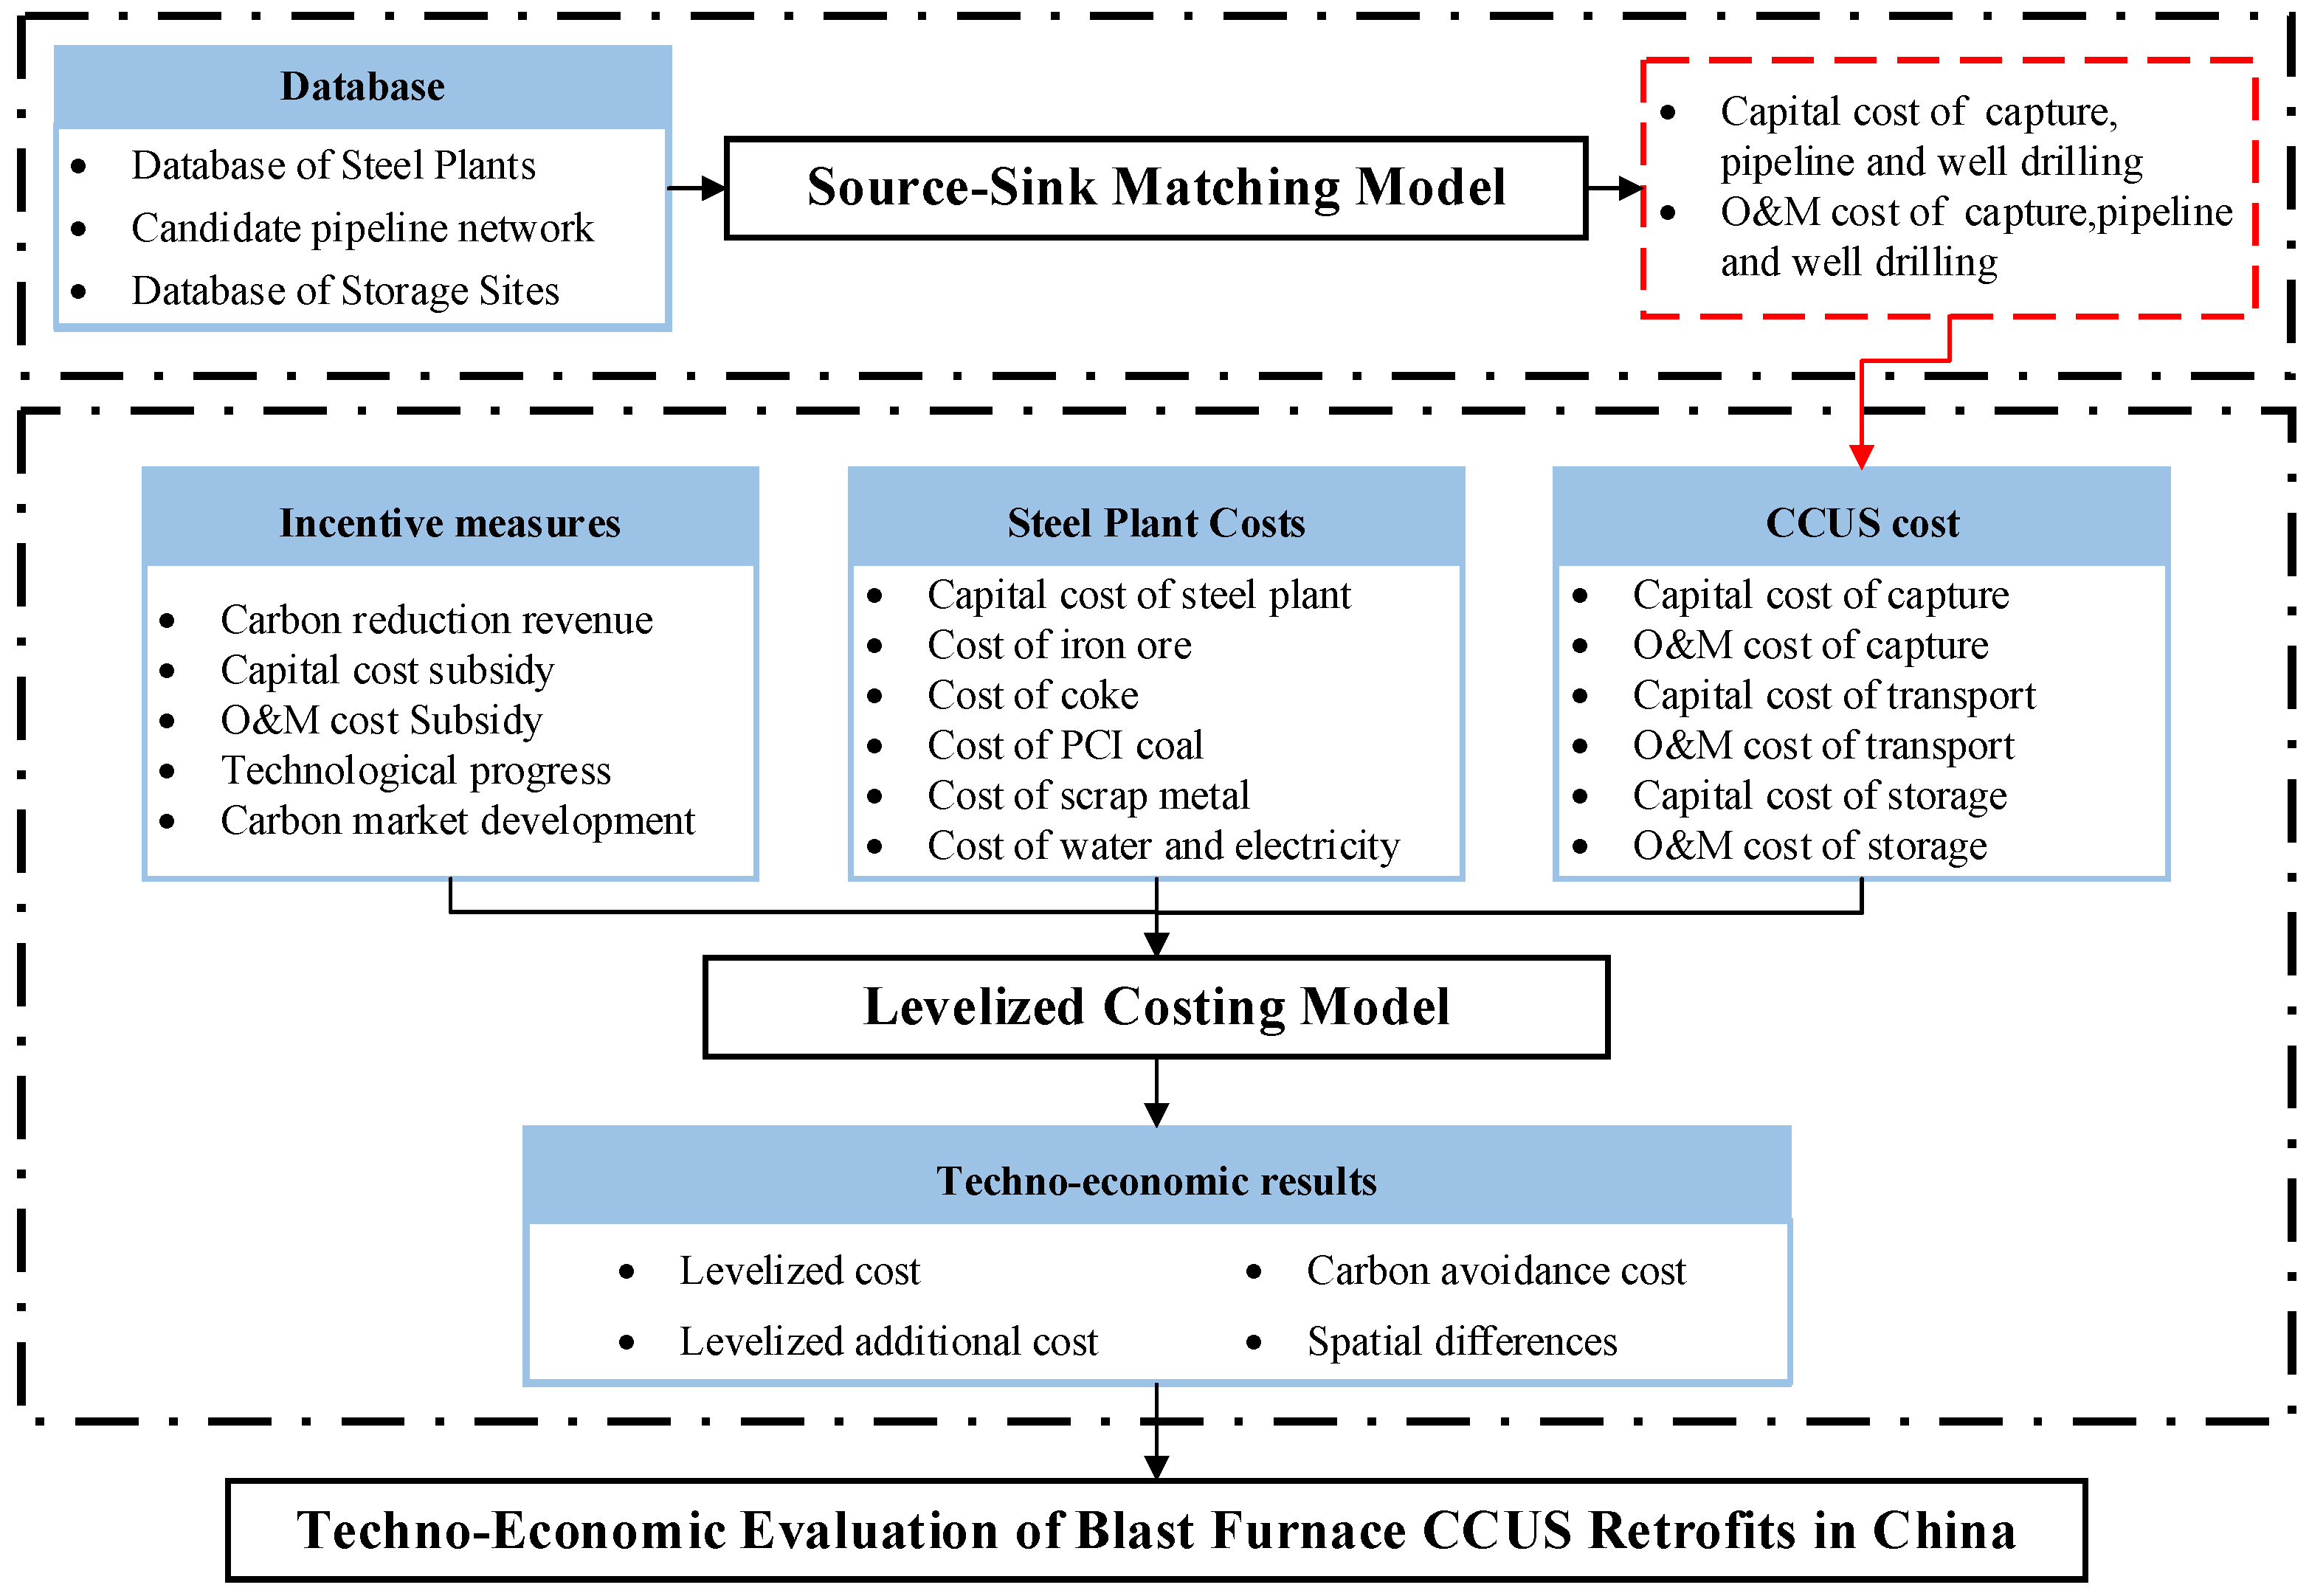
2.1. Research Framework

Unlike the previous research workers who used source–sink matching methods such as multi-integer linear programming (MILP), GIS analysis, and geographic proximity analysis [46,47,48,49], referring to previous studies [50,51,52], a static source–sink matching optimization model for the steel industry aiming to minimize the cost of each link (capture, transport, and storage) of the CCUS full-chain project is constructed, and the layout of the emission sources, storage blocks, and their connecting pipelines is solved in GAMS software (version 37.1.0). Based on the different CO2 capture capacities of each steel plant, the initial investment costs and operation and maintenance (O&M) costs for capture, pipeline, and well drilling in the source–sink matching model are allocated to each steel plant. Combining the cost parameters of the production part of steel plants, the CCUS part of blast furnaces, and the incentive policies, the levelized cost, levelized additional cost, carbon avoidance cost of the steel plant, and their spatial distributions for blast furnace CCUS projects and the steel plant after CCUS retrofits are obtained in the levelized cost model. The research framework of this paper is shown in Figure 1.

2.2. Modeling Methods and Techno-Economic Evaluation

2.2.1. Source–Sink Matching Method

According to the Measures for the implementation of capacity replacement in the steel industry, blast furnaces of 400 m3 and below (0.46–0.47 Mt/a) are included in the elimination category. Based on the 2020 crude steel production of each steel plant obtained from the Metallurgical Industry Information Center and the official website of each steel plant, eligible BF-BOF process steel plants are selected. The CO2 emissions from blast furnaces of each steel plant are calculated based on the calculation method in the IPCC National Greenhouse Gas Inventory Guidelines (Revised 2019).
Referring to previous studies [53,54,55,56], MEA solvent is used to capture CO2 in blast furnace flue gas with a capture rate of 90%. Pipeline transportation is a transportation method with application potential and economy [57], and in order to further reduce the cost of right-of-way [51], the existing national highways, onshore natural gas pipelines, and offshore natural gas pipelines are taken as alternative pipelines. Among them, the cost calculation method for onshore pipelines is based on the research of Fan et al. [52], and the cost of offshore pipelines is adjusted to 1.55 times (1.40–1.70 times) that of onshore pipelines [15]. Among the many storage and utilization methods, enhanced oil recovery (EOR) technology is more mature [58] and can bring crude oil revenue [52], while China’s saline aquifers have the greatest potential for storage [59]. In this study, onshore oil fields, onshore deep saline aquifers (DSAs), offshore oil fields, and offshore deep saline aquifers in China are considered as potential storage sites. Among them, the cost calculation method for onshore EOR storage cost is based on the research of Wei et al. [60], where the onshore DSA storage cost is 1.2 times the onshore EOR storage cost, the offshore DSA storage cost is 3.6 times the onshore DSA storage cost, and the offshore DSA storage cost is 1.2 times the offshore EOR storage cost [57,61].
Considering the area of the storage site, the CO2 injection rate, and its expansion rate in the stratum, the storage site is divided into 40 km × 40 km storage blocks, and a maximum of 50 injection wells are set in each storage block based on actual engineering data [52]. A connecting pipeline between the steel plant/storage block and the alternative pipeline needs to be constructed, the maximum length of the connecting pipeline should be 20 km, and the emission sources, storage blocks, and alternative pipelines are screened based on this. In the source–sink matching optimization model, the CO2 from each steel plant can be stored in any storage block, and each storage block can store CO2 from multiple steel plants according to its storage potential and injection capacity.

2.2.2. Levelized Costing Model

In this paper, the theory of levelized cost is introduced to the techno-economic evaluation of a blast furnace CCUS project and a steel plant after a blast furnace CCUS retrofit. The research boundary of this paper starts with the input of raw materials (e.g., coke, electricity, iron ore, scrap, etc.) rather than mining (e.g., coal mining, etc.), and it ends with the output of crude steel; the subsequent further processing of crude steel in the steel plant is not within the scope of this paper. It is assumed that the blast furnace CCUS project is retrofitted in the year x = x0 and the construction period is 1 year, i.e., the equipment is put into operation from the year x = x0 + 1 until the end of its life. The levelized cost of carbon dioxide (LCOCD) of the blast furnace CCUS project and the levelized cost of crude steel (LCOS) of the steel plant before and after the CCUS retrofit can be calculated by Equation (1).
L C O C D n C C U S = C O S T n , 0 C C U S + x = x 0 + 2 X C O S T n , x C C U S 1   +   r x x = x 0 + 2 X Q n , x   ×   α n   ×   0.9 1   +   r x L C O S n s t e e l = C O S T n , 0 s t e e l + x = x 0 + 2 X C O S T n , x s t e e l 1   +   r x x = x 0 + 2 X Q n , x 1   +   r x L C O S n s t e e l & C C U S = C O S T n , 0 s t e e l   +   C O S T n , 0 C C U S + x = x 0 + 2 X C O S T n , x C C U S   +   C O S T n , x s t e e l 1   +   r x x = x 0 + 2 X Q n , x 1   +   r x
where L C O C D n C C U S , L C O S n s t e e l , and L C O S n s t e e l & C C U S are the levelized cost of the CCUS project for the blast furnace and the levelized cost of the steel plant before the CCUS retrofit and after CCUS retrofit of the n-th steel plant, respectively (USD/t). C O S T n , 0 C C U S and C O S T n , 0 s t e e l are the initial investment costs for the CCUS project and the steel plant production component of the n-th steel plant, respectively, including equipment, land, and construction costs (USD). C O S T n , x C C U S and C O S T n , x s t e e l are the O&M costs in year x before and after the CCUS retrofit for the n-th steel plant, respectively (USD). Qn,x is the crude steel production of the n-th steel plant in year x (t/a). αn is the CO2 emission factor for the blast furnace of the n-th steel plant (t/t crude steel), and 0.9 is the capture rate, taken as 90%. r is the discount rate (%), taken as 7.5% [26].
The carbon avoidance costs of a blast furnace CCUS project and a steel plant after a CCUS retrofit can be calculated by Equation (2).
A V O I D n C C U S = L A C O C D n C C U S α n s t e e l     α n s t e e l & C C U S = L C O C D n C C U S     L C O C D 0 C C U S α n   ×   0.9 A V O I D n s t e e l = L A C O S n s t e e l α n s t e e l     α n s t e e l & C C U S = L C O S n s t e e l & C C U S     L C O S n s t e e l α n   ×   0.9
where L A C O C D n C C U S and L A C O S n s t e e l are the levelized additional costs of the blast furnace CCUS project and the steel plant after the CCUS retrofit of the n-th steel plant, respectively (USD/t). α n s t e e l and α n s t e e l & C C U S are the carbon emission factors before and after the CCUS retrofit of the n-th steel plant, respectively (t/t crude steel).

2.2.3. Cost Structure

The initial investment cost and O&M cost of a steel plant after a CCUS retrofit include both the steel production part and the blast furnace CCUS project part. Among them, the O&M costs of the steel production part mainly include iron ore cost, scrap cost, coke cost, PCI coal cost, electricity cost, new water cost, etc. The O&M costs of the blast furnace CCUS project include the CO2 capture cost, transportation cost, storage cost, and possible crude oil revenue. The corresponding cost calculation formula is as follows:
C O S T n , 0 s t e e l = P s t e e l × Q n C O S T n , 0 C C U S = C O S T n , 0 c a p t u r e + C O S T n , 0 t r a n s p o r t + C O S T n , 0 s t o r a g e C O S T n , x s t e e l = m = 1 M P m × γ m × Q n , x C O S T n , x C C U S = C O S T n , x c a p t u r e + C O S T n , x t r a n s p o r t + C O S T n , x s t o r a g e I n , x E O R
where Psteel is the unit initial investment cost of the steel plant (USD/t crude steel). Qn is the annual crude steel production of the n-th steel plant (t). Qn,x is the crude steel production of the n-th steel plant in year x (t), which is numerically consistent with Qn. Pm is the price of the m-th material in the steel plant (USD/t), see Table 1. γ m is the consumption factor for the m-th material in the n-th steel plant, see Table 2. C O S T n , 0 c a p t u r e , C O S T n , 0 t r a n s p o r t , and C O S T n , 0 s t o r a g e are the initial investment costs of the CO2 capture, transportation, and sequestration equipment in the CCUS project of the n-th steel plant, respectively (USD). C O S T n , x c a p t u r e , C O S T n , x t r a n s p o r t , and C O S T n , x s t o r a g e are the O&M costs of CO2 capture, transportation, and storage for the n-th steel plant CCUS project in year x, respectively (USD/a). I n , x E O R is the crude oil revenue from the CCUS project for the n-th steel plant in year x (USD/a).
The CO2 capture cost of the blast furnace CCCU project in the steel plant can be calculated by Equation (4).
C O S T n , 0 c a p t u r e = P c a p t u r e × Q n , x × α n × 0.9 O & M n , x c a p t u r e = P y p o w e r × M p o w e r + P M E A × M M E A + P s t e a m × M s t e a m × Q n , x × α n × 0.9 + C O S T n , 0 c a p t u r e × δ
where P c a p t u r e , P y p o w e r , P M E A , and P s t e a m are the unit initial investment costs of the capture equipment, coal feed-in tariff, MEA solvent unit price, and steam unit price, respectively. M p o w e r , M M E A , and M s t e a m are the consumption of electricity, MEA solution, and steam for capturing 1 ton of CO2, respectively. δ is the coefficient of equipment maintenance, labor, and other costs to the initial investment cost. The relevant data are shown in Table 1 and Table 3.
In this study, pipeline cost and storage cost are allocated to each steel plant according to the amount of CO2 captured in each steel plant [52]. The cost allocation formula is as follows:
C O S T n , 0 t r a n s p o r t = i = 1 I 0 C O S T i , 0 p i p e l i n e × x = 1 X Q n , x × α n × 0.9 n = 1 Z x = 1 X Q n , x × α n × 0.9 C O S T n , x t r a n s p o r t = i = 1 I 0 C O S T i , x p i p e l i n e × x = 1 X Q n , x × α n × 0.9 n = 1 Z x = 1 X Q n , x × α n × 0.9 C O S T n , 0 s t o r a g e = j = 0 J 0 C O S T j , 0 w e l l × x = 1 X Q n , x × α n × 0.9 n = 1 K x = 1 X Q n , x × α n × 0.9 C O S T n , x s t o r a g e = j = 1 J 0 C O S T j , x w e l l × x = 1 X Q n , x × α n × 0.9 n = 1 K x = 1 X Q n , x × α n × 0.9 I n , x E O R = j = 1 J 0 λ j × P o i l × Q j , x × 0.25 × x = 1 X Q n , x × α n × 0.9 n = 1 K x = 1 X Q n , x × α n × 0.9
where Z and K are the number of steel plants using the i-th pipeline and the j-th storage block, respectively. I0 and J0 are the number of pipelines through which CO2 flows and the number of storage blocks used in the n-th steel plant, respectively. λ j is the judgment coefficient. If the j-th storage block is an oil field, 1 is taken, otherwise 0 is taken. P o i l is the unit price of crude oil (USD/t). Q j , x is the CO2 storage capacity of the j-th storage block in year x (t), and 0.25 is the crude oil replacement ratio, which is taken as 25% [78]. C O S T i , 0 p i p e l i n e and C O S T i , x p i p e l i n e are the initial investment cost and the O&M cost in year x of the i-th pipeline, respectively. C O S T j , 0 w e l l and C O S T j , x w e l l are the initial investment cost and the O&M cost in year x of the j-th storage block, respectively.

2.3. Scenario Definition

The large-scale deployment of CCUS has progressed slowly under the influence of its high cost [79]. In this study, several incentives are considered based on crude oil revenue to explore feasible scenarios and their early development for the CCUS retrofit of blast furnaces in China’s BF-BOF process steel plants. The impact of the carbon market’s development [80] and CCUS technology’s advance [81] are considered. The specific scenarios are set up as follows:
(1)
Business-as-usual scenario (BAU): Only the crude oil revenue and future technological advances are considered, and the year of CCUS deployment is 2025.
(2)
Carbon reduction revenue scenario (CRR): Adding carbon reduction revenue to the BAU scenario, i.e., treating CO2 emission reductions as CERs that can be traded in the carbon market and receive revenue.
(3)
Subsidy scenarios: Adding a government subsidy to the BAU scenario, i.e., the government subsidizes 100% of the initial investment cost of the CCUS project (S-1) or 50% of the O&M cost of the CCUS project (S-2).
(4)
Deferred deployment scenarios: Based on the BAU scenario, the technology cost reductions due to technological advances are considered, i.e., the year of large-scale CCUS deployment is delayed to 2030 (DD-2030), 2035 (DD-2035), 2040 (DD-2040), 2045 (DD-2045), and 2050 (DD-2050). The steel plants retrofitted with CCUS in 2025 will continue to operate until 2060, and the project operation cycle will remain unchanged after the retrofit year is deferred.
(5)
Comparison scenario (45Q): Adding the 45Q tax credit to the BAU scenario, the subsidy is referenced to the Inflation Reduction Act of 2022 in the U.S. This scenario serves as a comparison to study the incentive intensity of other incentive measures.

3. Results and Analysis

3.1. Emission Source Screening and Source–Sink Matching Results

Based on the 20 km screening condition, a total of 111 BF-BOF process steel plants are evaluated (Figure 2a,b), with a crude steel production of 708.59 Mt/a, accounting for more than 67% of the national crude steel production in 2020 and more than 77% of the national BF-BOF process crude steel production [7]. The total CO2 emission from the blast furnaces is 466.75 Mt/a, and the total CO2 abatement potential is 420.07 Mt/a (90% capture rate). The steel plants are widely distributed in China, with the highest concentration in East China and North China. The five provinces with the highest CO2 abatement potentials are Jiangsu, Hebei, Liaoning, Shandong, and Shanxi, which can achieve 61.57, 57.16, 42.75, 40.55, and 29.21 Mt/a of CO2 emission reduction, accounting for 14.66%, 13.61%, 10.18%, 9.65%, and 6.95% of the total CO2 abatement potential, respectively. The above five provinces were also the top five provinces in crude steel production in 2020, which indirectly confirms that China’s major steel provinces will play an important role in the low-carbon transformation of China’s steel industry.
In terms of pipeline construction, a total of 894 sections with a total length of 29,122.10 km need to be constructed (Figure 2c). Among them, there are 854 sections of onshore pipelines, with a total length of 27,348.14 km and a range of pipeline sizes from 4 to 46 inches, and 40 sections of offshore pipelines, with a total length of 1773.96 km and a range of pipeline sizes from 4 to 18 inches. Among the 155 storage blocks involved in source–sink matching are 97 oil field storage blocks (15 offshore oil field storage blocks) and 58 deep saline aquifer storage blocks (4 offshore deep saline aquifer storage blocks). Most of the storage blocks are in the northern part of China, except for those in the South China Sea (Figure 2d).
As can be seen from Figure 2, the relative geographical overlap between major emission sources and major storage blocks in the source–sink matching process provides a good location advantage for CCUS retrofits in China’s steel industry, but there is still a large number of pipelines that need to be constructed (Figure 2c), which will bring high costs. And this may require the government to adopt some preferential policies or provide a favorable investment and financing environment to encourage investors to invest in the pipeline network’s construction. Meanwhile the introduction of offshore storage sites provides more options for the storage of captured CO2, especially in the provinces of Southern China where there are no storage sites.

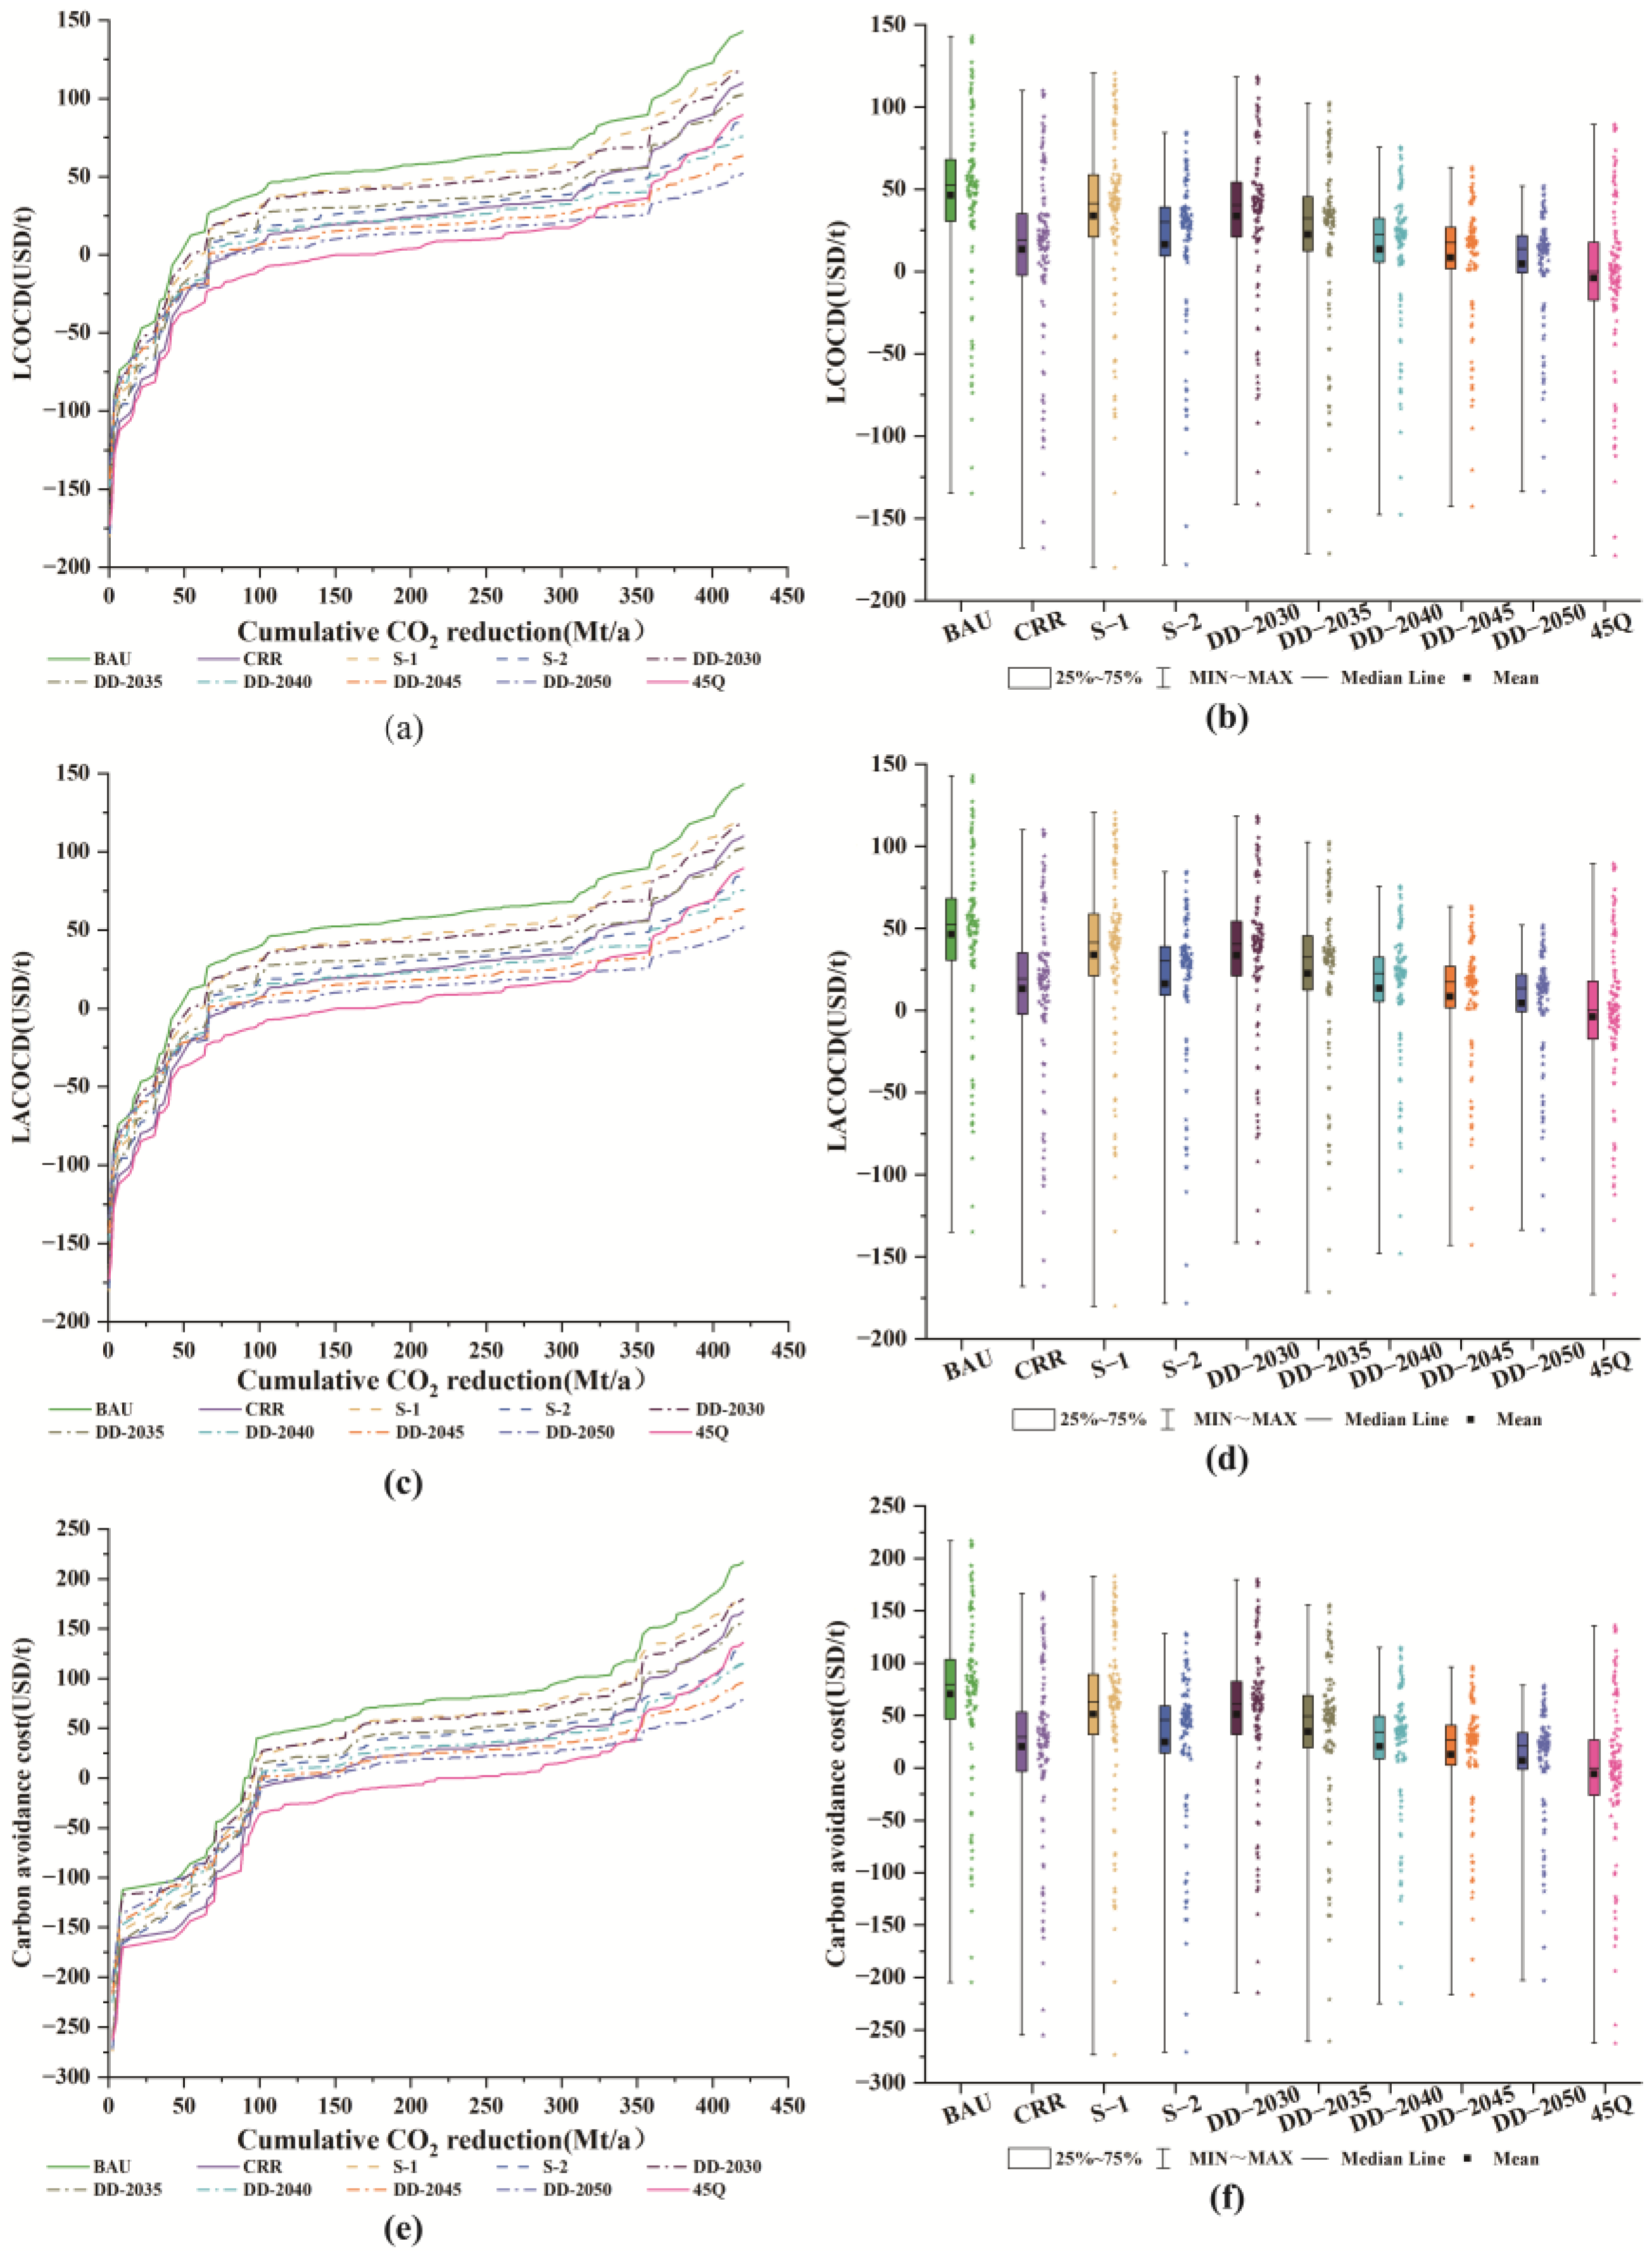
3.2. Economic Analysis of Blast Furnace CCUS Projects

The relationships between the levelized cost, levelized additional cost, and carbon avoidance cost of the CCUS full-chain project of the blast furnace in the steel plant under different scenarios and cumulative CO2 reduction and their distributions are shown in Figure 3, and they reflect the economics of the CCUS retrofit projects for blast furnaces of existing BF-BOF steel plants. As can be seen from Figure 3a,b, the LCOCDs of some blast furnace CCUS projects are negative, which means that these steel plants can profit from CCUS retrofit projects, and this is largely due to the matching of these steel plants with oil fields and obtaining crude oil revenue from them.
Unlike the meaning of LCOCD, LACOCD denotes the additional cost due to the deployment of CCUS projects. Due to the absence of LCOCD in the blast furnace before CCUS retrofits, the LACOCD in this article is numerically the same as LCOCD and exhibits similar patterns.
Under the BAU scenario, the LACOCD of blast furnace CCUS projects in steel plants ranges from −134.87 to 142.95 USD/t, with median and mean values of 52.51 and 46.39 USD/t, respectively. Among them, the 16 steel plants with negative LACOCD values can achieve a 41.84 Mt/a CO2 emission reduction, accounting for 9.96% of the CO2 abatement potential. The 33 steel plants with an LACOCD ranging from 0 to 50.00 USD/t can achieve an 89.86 Mt/a CO2 emission reduction, accounting for 21.39% of the CO2 abatement potential. The 45 steel plants with an LACOCD ranging from 50.00 to 100.00 USD/t can achieve a 229.47 Mt/a CO2 emission reduction, accounting for 54.63% of the CO2 abatement potential. From Figure 3d, the LACOCD of the blast furnace CCUS project in steel plants is mainly concentrated between 25.00 and 75.00 USD/t, and 66 steel plants can achieve a CO2 emission reduction of 251.43 Mt/a, accounting for 59.85% of the CO2 abatement potential.
When the carbon market is introduced (CRR), the median and mean values of LACOCD are 19.51 and 13.39 USD/t, respectively, which are 33.00 and 33.00 USD/t lower than the BAU scenario. The number of steel plants with a negative LACOCD increases to 28, which can achieve a 76.98 Mt/a CO2 emission reduction. When the government subsidizes the initial investment cost (S-1) and O&M cost (S-2) of the blast furnace CCUS project, the median of the LACOCD is reduced by 11.01 and 22.20 USD/t, and the mean of the LACOCD is reduced by 12.52 and 30.02 USD/t, respectively, compared to the BAU scenario. The number of steel plants with a negative LACOCD are 19 (54.22 Mt/a) and 21 (65.58 Mt/a), respectively. This indicates that more durable large subsidies can greatly incentivize the large-scale deployment of CCUS. Delaying the large-scale deployment of the blast furnace CCUS project, while enjoying the low-cost dividend of technological advances, has to some extent delayed the carbon neutrality transformation of the steel industry. In the comparison scenario, the introduction of the U.S. 45Q tax credit policy reduces the median and mean values of the LACOCD to 0.08 and −3.81 USD/t, which are 52.43 and 50.20 USD/t lower than the BAU scenario, respectively. At present, the U.S. 45Q tax credit remains the most effective incentive for most of the CCUS projects in steel plants, which requires China to provide greater policy incentives for CCUS retrofit projects in BF-BOF steel plants to ensure that the steel industry adopts CCUS as a methodology for a low-carbon transition.
The carbon avoidance cost mainly reflects the additional cost of avoiding unit CO2 emissions. The relationship and distribution between carbon avoidance costs and cumulative CO2 reduction in different scenarios are shown in Figure 3e,f. In the BAU scenario, the carbon avoidance cost of blast furnace CCUS projects ranges from −204.76 to 217.02 USD/t, with median and mean values of 79.72 and 70.43 USD/t, respectively. The incentives such as carbon markets, government subsidies, delayed deployment, and 45Q have all been effective in reducing the carbon avoidance cost of CCUS projects, thus facilitating the rollout of CCUS retrofit projects in the steel industry.
As can be seen in Figure 3, although the levelized costs of CCUS projects in the deferred deployment scenarios show a significant overall decrease after 2040, this is dependent on the speed of technological progress and carbon market development. Moreover, such a late deployment time will weaken the role of CCUS technology in the low-carbon transformation of China’s steel industry and the achievement of the carbon peaking and carbon neutrality goals. At the same time, a single incentive will not enable the large-scale deployment of CCUS retrofits for blast furnaces at China’s BF-BOF steel plants in the near future. Therefore, it is particularly important to consider a combination of several incentive measures, such as accelerating the actual integration of the steel industry into the carbon market, while at the same time increasing the investment in technological research to promote technological progress and provide more substantial financial subsidies from the government for the first few years of early demonstration projects.

3.3. Economic Analysis of Steel Plant-Coupled CCUS Project

Influenced by regional differences in the prices of various resources in the production process of steel plants, the LCOS of steel plants before a CCUS retrofit shows significant inter-provincial differences, as shown in Figure 4. The LCOS of China’s steel plants before a CCUS retrofit ranges from 415.20 to 454.30 USD/t, with an average value of 441.34 USD/t. The three provinces with the largest LCOS are Sichuan (454.30 USD/t), Jiangxi (453.65 USD/t), and Guangdong (452.49 USD/t), and the three provinces with the smallest LCOS are Ningxia (415.20 USD/t), Xinjiang (416.38 USD/t), and Qinghai (416.98 USD/t). In addition, the LCOS of Hebei, Jiangsu, and Shandong provinces, which ranked as the top three in terms of crude steel production in 2020, are 433.86, 450.93, and 452.39 CNY/t, respectively.
The relationships between LCOS, LACOS, carbon avoidance cost, and cumulative CO2 emission reductions for the whole steel plant with different incentives after a CCUS retrofit and their distributions are shown in Figure 5, which reflect the changes in the economics of the existing steel plant after a CCUS retrofit.
Without policy subsidies (BAU scenario), the LCOS after a CCUS retrofit in the steel plant ranges from 341.81 to 541.41 USD/t, with median and mean values of 480.65 and 474.77 USD/t, respectively. After the introduction of the carbon market (CRR), the median and mean values of the LCOS decrease to 461.08 and 455.21 USD/t, respectively. After introducing government subsidies, the median of the LCOS of the S-1 and S-2 scenarios decreases by 4.79 and 16.34 USD/t, and the mean values decrease by 7.42 and 17.79 USD/t, respectively, compared with the BAU scenario. Delaying the large-scale deployment of blast furnace CCUS projects decreases their LCOS to varying degrees as the year of the delay is postponed. The median and mean of the LOCS are the lowest after the introduction of the 45Q tax credit policy, at 438.81 and 435.61 USD/t, respectively.
The LACOS indicates to a certain extent the degree of influence of blast furnace CCUS projects on the economics of a steel plant, and the relationship between LACOS and cumulative CO2 emission reduction and its distribution under each scenario are shown in Figure 5c,d. Under the BAU scenario, the LACOS of steel plants ranges from −79.96 to 84.75 USD/t, with a median and mean of the LACOS range of 31.13 and 27.50 USD/t, respectively. Among them, 16 steel plants with negative LACOS can achieve a 41.84 Mt/a CO2 emission reduction, accounting for 9.96% of the CO2 abatement potential. There are 33 steel plants with a LACOS between 0 and 30 USD/t, which can achieve an 89.86 Mt/a CO2 emission reduction, accounting for 21.39% of the CO2 abatement potential. The 46 steel plants with a LACOS between 30 and 60 USD/t can achieve 231.37 Mt/a CO2 emission reductions, accounting for 55.08% of the CO2 abatement potential. More than 59.46% (66) of the steel plants have a LACOS between 15.00 and 45.00 USD/t and can achieve CO2 reductions of 59.85% of the CO2 abatement potential.
When the carbon market is introduced (CRR), the median and mean values of LACOS are 11.56 and 7.94 USD/t, respectively, which are 19.56 and 19.56 USD/t lower than the BAU scenario. The number of steel plants with negative LACOS increases to 28, which can achieve a 76.98 Mt/a CO2 emission reduction. The medians of the LACOS for the S-1 and S-2 scenarios are lower than the BAU scenario by 6.53 and 13.16 USD/t, and the mean values are lower by 7.42 and 17.79 USD/t, respectively. The number of steel plants with a negative LACOS are 19 (54.22 Mt/a) and 21 (65.58 Mt/a), respectively. Delaying the large-scale deployment of the blast furnace CCUS project resulted in varying degrees of reduction in its LACOS. However, due to the high production costs of the steel plant, it did not exhibit a concentration trend like LACOCD. In the comparison scenario, the introduction of the 45Q tax credit reduces the median and mean LACOS by 40.13 and 39.16 USD/t compared to the BAU scenario.
The relationship and distribution between carbon avoidance costs and cumulative CO2 reduction in different scenarios after the CCUS retrofit of blast furnaces are shown in Figure 5e,f. Under the BAU scenario, the carbon avoidance costs of blast furnace CCUS projects range from −121.39 to 128.66 USD/t, with median and mean values of 47.26 and 41.75 USD/t, respectively. The carbon avoidance costs are reduced to varying degrees by the incentives, which means that the incentives can drive the deployment of CCUS technology in the steel industry to a certain extent.
As can be seen in Figure 5, except for a few blast furnace CCUS projects with large cost benefits that reduce the LCOS of the steel plants, more than 85% of the blast furnace CCUS projects increase the LCOS of the steel plants. Compared with Figure 3, the incentives implemented for CCUS projects do not significantly affect the whole steel plant, so additional subsidies for steel plants deploying CCUS are needed to alleviate the barriers to CCUS deployment due to the high cost, such as policy preferences or a certain amount of financial subsidies for low-carbon steel products for steel plants deploying CCUS technology and a certain amount of low electricity tariffs for steel plants.

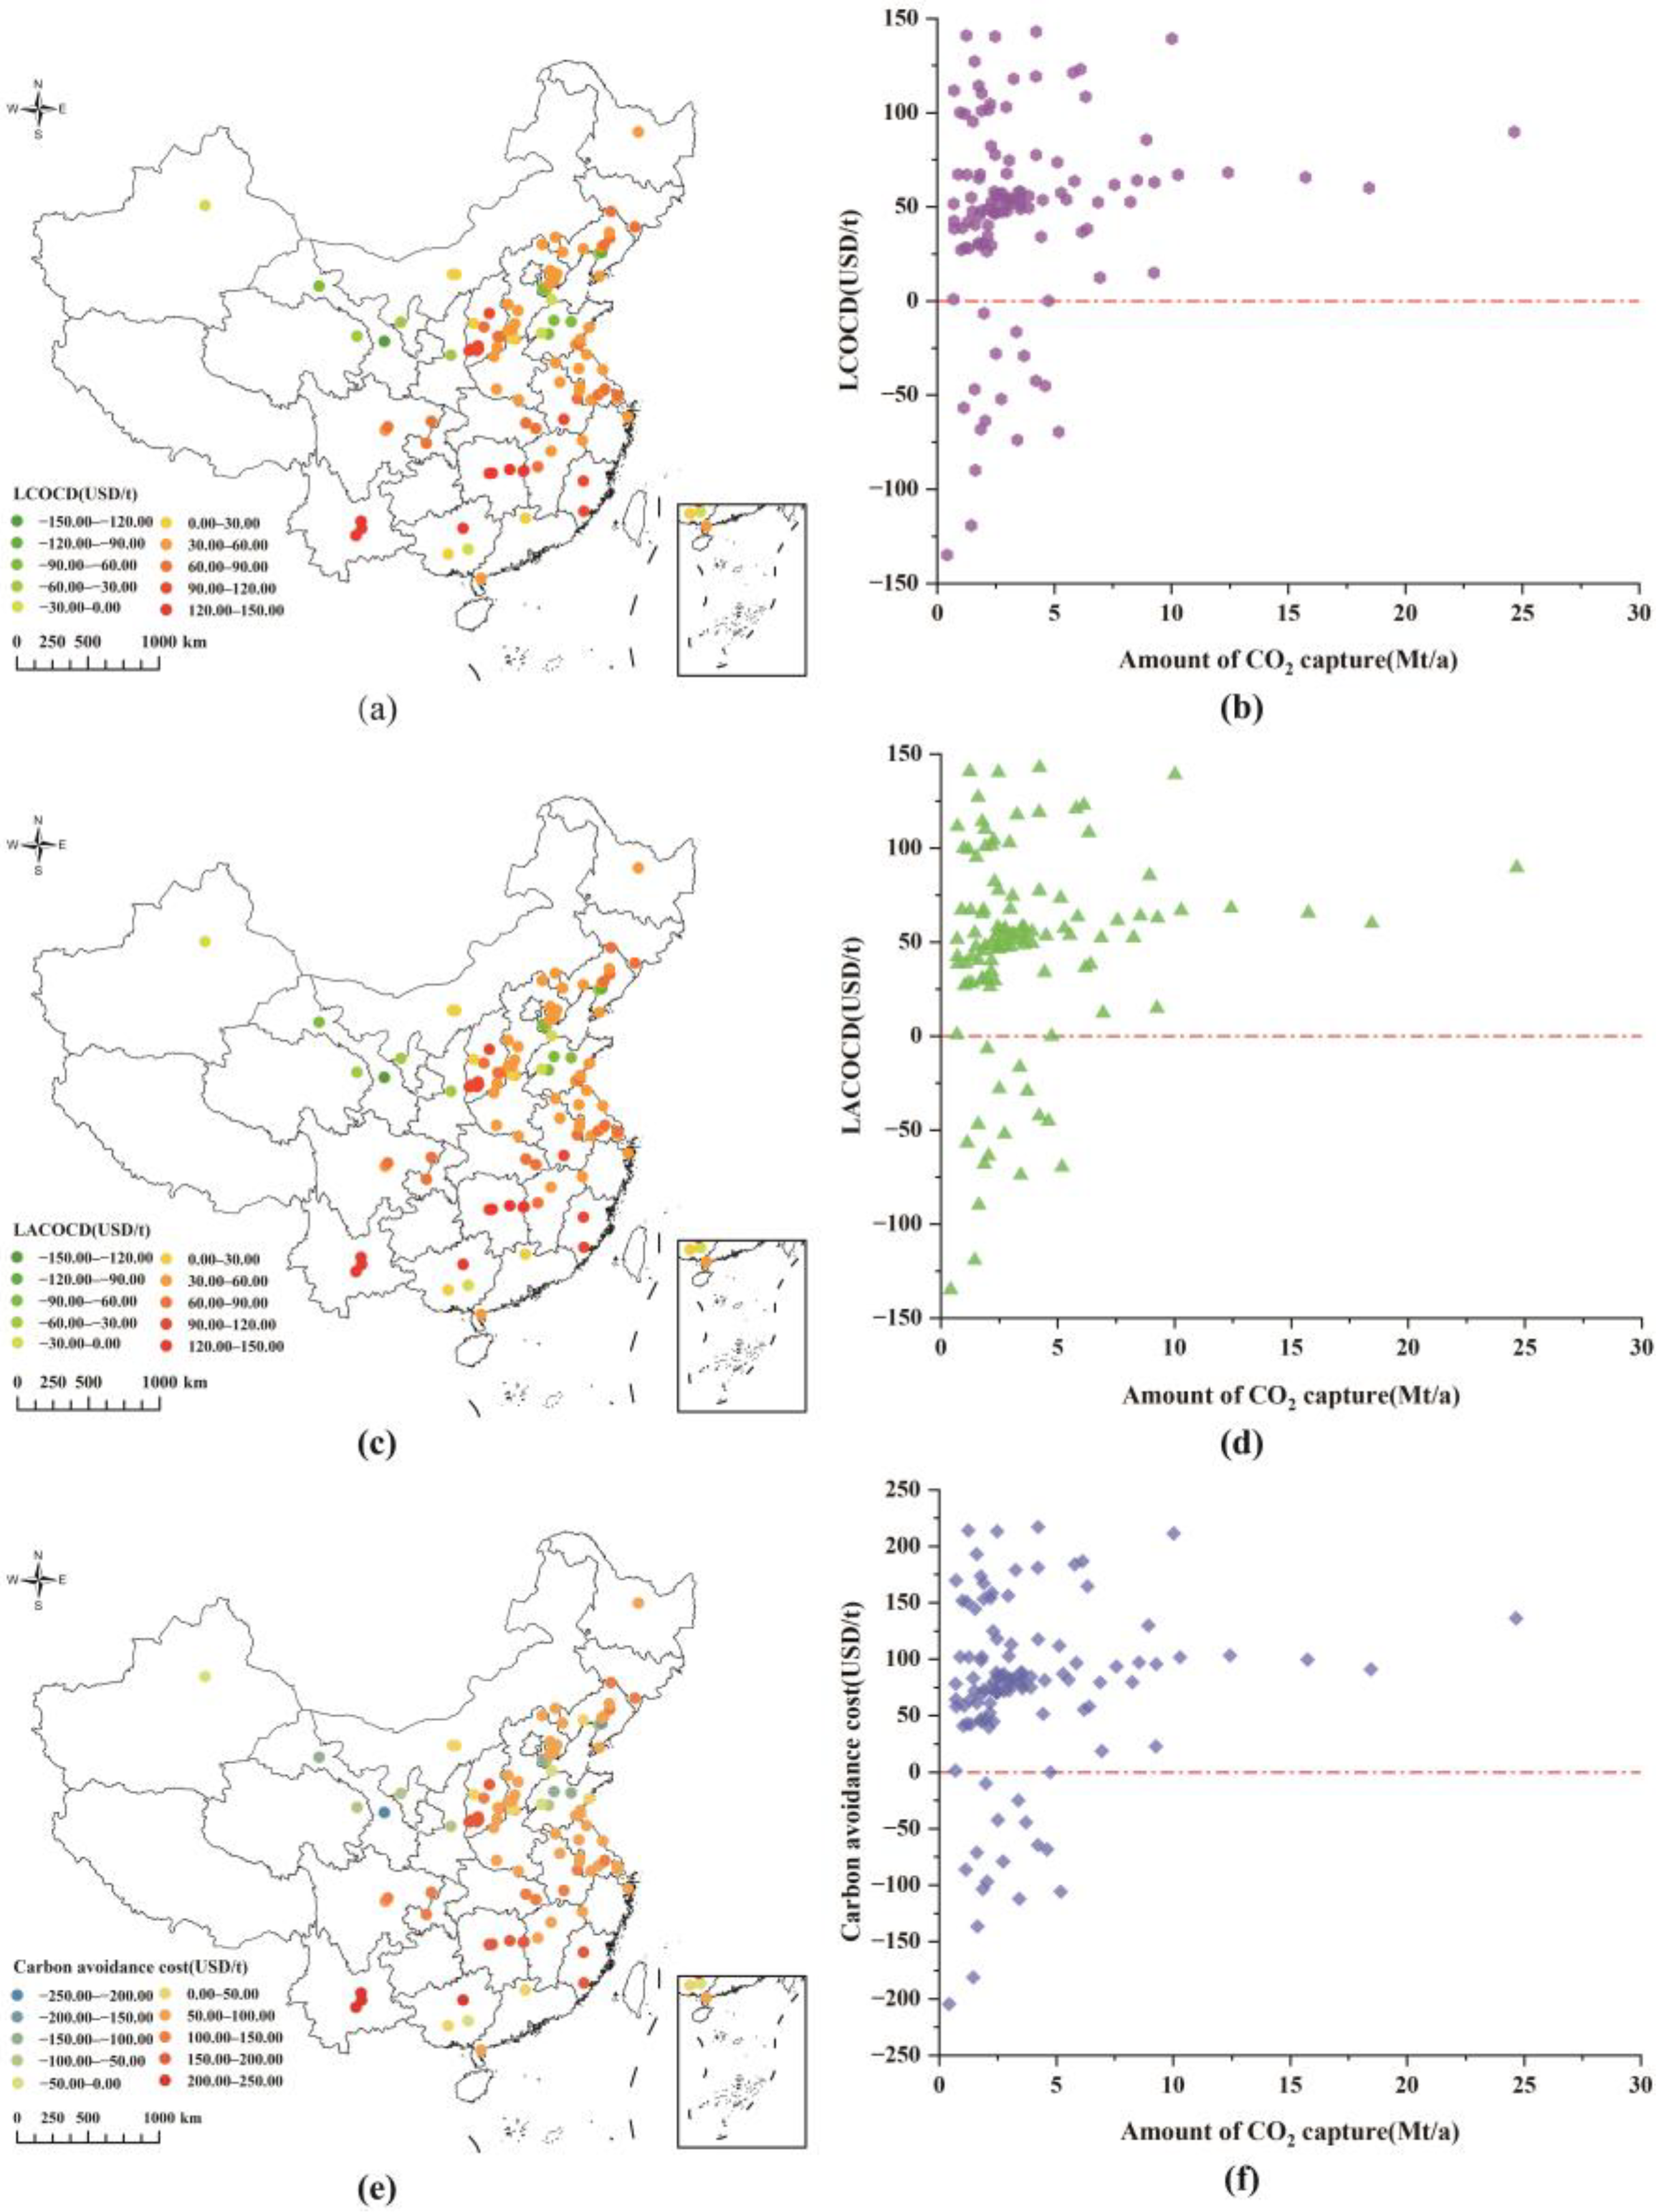
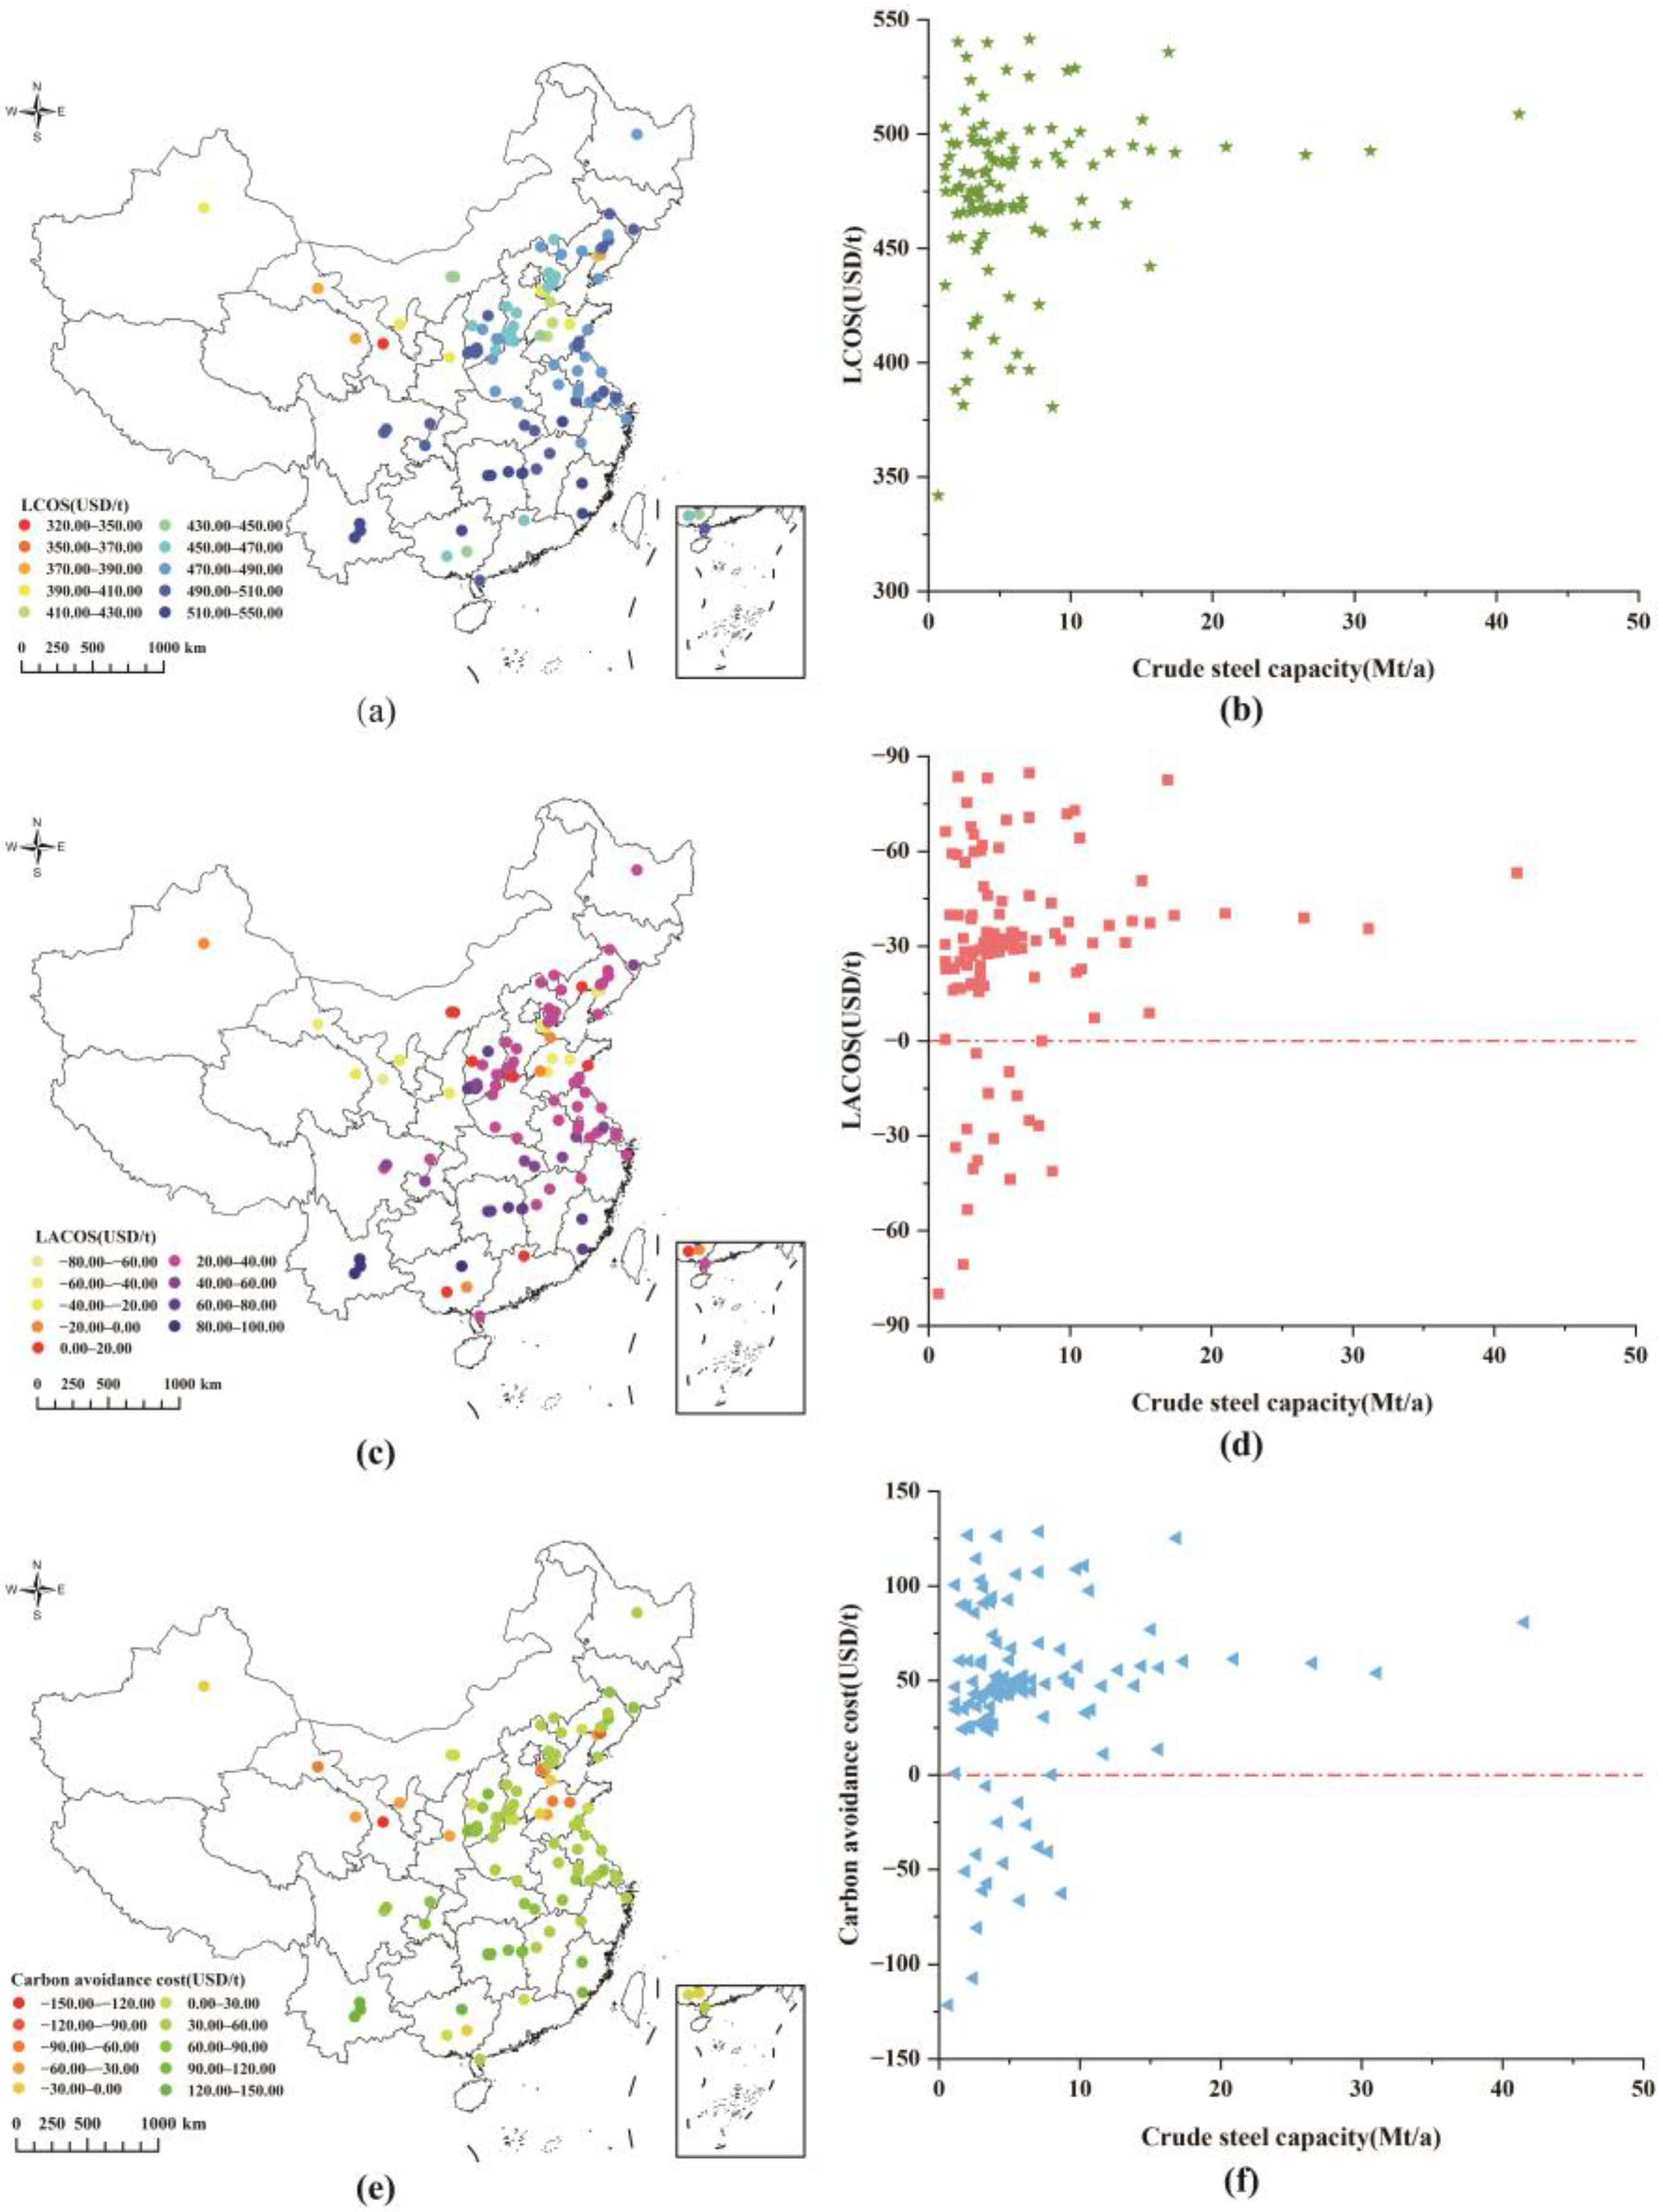
3.4. Spatial Differences in Cost

Under the influence of combined factors such as regional economy, pipeline construction, and spatial differences of sources and sinks, the levelized cost, levelized additional cost, and carbon avoidance cost of blast furnace CCUS projects show obvious regional differences (Figure 6). As can be seen from Figure 6a, the CCUS projects with a negative LCOCD are mainly located in North China, Northwest China, and Shandong Province in East China, which are closer to the storage sites and have many oil field storage sites (Figure 2d). The lower transportation costs and certain crude oil revenues reduce the cost of CCUS projects. Therefore, it is possible to prioritize the deployment of blast furnace CCUS projects in the above regions, thus providing valuable experience for the large-scale deployment of CCUS technology in the steel industry. For areas such as Fujian, Hunan, Yunnan, and northern Guangxi, which are far from the storage sites, the levelized cost, levelized additional cost, and carbon avoidance cost are relatively high. The steel plants in these areas can seek other low-carbon technologies (e.g., short-process, hydrometallurgy, etc.) or collaborate with surrounding carbon-utilizing firms (e.g., chemical plants, etc.) to achieve a low-carbon transition.
While the interprovincial differences in raw material prices make the LCOS of steel mills exhibit interprovincial differences before a CCUS retrofit, the LCOS after a CCUS retrofit exhibits significant plant-level differences (Figure 7b), and the distribution pattern is somewhat different from that of the LCOCD. The LACOS and carbon avoidance costs of steel plants showed a similar distribution to the LACOCD and carbon avoidance costs of CCUS projects. This indicates that the impact of provincial differences in raw material costs is weaker than that of CCUS projects, i.e., from an economic perspective, more consideration should be given to the CCUS project itself than to the province where the steel plant is located when deploying a blast furnace CCUS project. The levelized cost, levelized additional cost, and carbon avoidance cost of steel plants with CCUS retrofits to blast furnaces also exhibit similar differences in spatial distribution as those of blast furnace CCUS projects (Figure 7a,c,e).

4. Conclusions

In this study, a comprehensive assessment model of source–sink matching-levelized cost in China’s steel industry is constructed with respect to the emission characteristics of blast furnaces in China’s BF-BOF process steel plants. An in-depth study of the economic competitiveness of BF-BOF process steel plant blast furnace CCUS retrofit projects and steel plants after blast furnace CCUS retrofits is conducted. The results of the study are rigorous and objective with respect to the key issues in the feasibility study of the large-scale deployment of CCUS projects in the steel industry, such as the CO2 abatement potential, pipeline network layout, economics, and early development opportunities. The specific research results are as follows:
(1)
The relatively overlapping geographic locations of emission sources and storage sites offer the possibility of achieving low-cost pipeline construction in China. We obtained a pipeline network layout with minimized cost, but the construction of a 27,348.14 km onshore pipeline and a 1773.96 km offshore pipeline would still entail high pipeline construction costs. This creates a higher demand for more rational planning of pipeline design.
(2)
If no extra incentive policy is included (BAU scenario), the blast furnace CCUS retrofit project has a certain negative cost opportunity, which can achieve a 41.84 Mt/a CO2 reduction, accounting for 9.96% of the CO2 abatement potential. The introduction of conditions such as the carbon market, government subsidies, and delayed deployment times have contributed to reducing the application costs of CCUS projects. However, the large-scale deployment of CCUS projects still requires greater subsidies or accelerating technological research and development to reduce costs. Introducing the steel industry into the carbon market and maintaining a stable and positive market development will also promote the low-carbon transition of the steel industry.
(3)
The blast furnace CCUS projects have low application costs in North China, Northwest China, and East China’s Shandong Province, and the above regions can prioritize the deployment of blast furnace CCUS projects to provide valuable experience for their large-scale deployment in the steel industry. On the other hand, the higher-cost regions such as Fujian, Hunan, Yunnan, and northern Guangxi need to seek other low-cost, low-carbon technologies or partner with surrounding carbon-utilizing firms to achieve a low-carbon transition.
This study considers detailed information such as the current level of CCUS technology, the carbon price in the carbon market and its future development, the technical parameters of the steel plant production and blast furnace CCUS project, and the economic parameters based on the national market. The results of the study are also affected by the above parameters to a certain extent, but this paper provides an in-depth discussion on the economics of the CCUS retrofit project for China’s blast furnaces and the economics of steel plants after the CCUS retrofit from the objective point of view. The subsequent researchers can update and replace the data according to their needs to come up with the expected results.

Author Contributions

Conceptualization, C.G.; methodology, C.G.; software, C.G. and X.L.; validation, C.G., J.X., X.L. and X.G.; formal analysis, C.G.; investigation, C.G. and X.L.; resources, X.G.; data curation, C.G.; writing—original draft preparation, C.G.; writing—review and editing, C.G. and J.X.; visualization, X.L.; supervision, X.G.; project administration, C.G.; funding acquisition, X.G. All authors have read and agreed to the published version of the manuscript.

Funding

This research received no external funding.

Data Availability Statement

No new data were created or analyzed in this study. Data sharing is not applicable to this article.

Conflicts of Interest

Author Xiaoyu Li was employed by the company China Academy of Railway Sciences Corporation Limited. The remaining authors declare that the research was conducted in the absence of any commercial or financial relationships that could be construed as a potential conflict of interest.

References

  1. IPCC. Global Warming of 1.5 °C; IPCC: Geneva, Switzerland, 2018. [Google Scholar]
  2. IEA. CO2 Emissions from Fuel Combustion: Overview; IEA: Paris, France, 2021. [Google Scholar]
  3. Huitu, K.; Helle, H.; Helle, M.; Kekkonen, M.; Saxén, H. Optimization of Steelmaking Using Fastmet Direct Reduced Iron in the Blast Furnace. ISIJ Int. 2013, 53, 2038–2046. [Google Scholar] [CrossRef]
  4. IEA. Iron and Steel Technology Roadmap; IEA: Paris, France, 2020. [Google Scholar]
  5. CECAMIECC, CMIPRI. Report on Energy Saving and Low Carbon Development of China’s Steel Industry; China Energy Conservation Association Metallurgical Industry Energy Conservation Committee, China Metallurgical Industry Planning and Research Institute: Beijing, China, 2020. [Google Scholar]
  6. NBS. Crude Steel Output in 2020; National Bureau of Statistics: Beijing, China, 2022.
  7. ACEE. 2020 Annual Steel Industry Environmental Assessment Report; ACEE: Beijing, China, 2021. [Google Scholar]
  8. IEA. China’s Net-Zero Ambitions: The Next FIVE-Year Plan Will be Critical for an Accelerated Energy Transition; International Energy Agency: Paris, France, 2020. [Google Scholar]
  9. Deng, L.; Adams, T.A. Comparison of steel manufacturing off-gas utilization methods via life cycle analysis. J. Clean. Prod. 2020, 277, 123568. [Google Scholar] [CrossRef]
  10. Perpiñán, J.; Bailera, M.; Peña, B.; Romeo, L.; Eveloy, V. Technical and Economic Assessment of Iron and Steelmaking Decarbonisation Via Power to Gas and Amine Scrubbing. SSRN Electron. J. 2022, 276, 127616. [Google Scholar]
  11. Chung, W.; Roh, K.; Lee, J.H. Design and evaluation of CO2 capture plants for the steelmaking industry by means of amine scrubbing and membrane separation. Int. J. Greenh. Gas Control 2018, 74, 259–270. [Google Scholar] [CrossRef]
  12. Tian, W.; An, H.; Li, X.; Li, H.; Quan, K.; Lu, X.; Bai, H. CO2 accounting model and carbon reduction analysis of iron and steel plants based on intra- and inter-process carbon metabolism. J. Clean. Prod. 2022, 360, 132190. [Google Scholar] [CrossRef]
  13. Chen, J.; Li, S.; Li, X.; Li, Y. China’s Zero-Carbon Steel Path under the Carbon Neutral Goal; Rocky Mountain Institute: Basalt, CO, USA, 2021. [Google Scholar]
  14. IEA. Energy Technology Perspectives 2020. In Special Report on Carbon Capture Utilisation and Storage; CCUS in Clean Energy Transitions; International Energy Agency: Paris, France, 2020. [Google Scholar]
  15. Zhang, X.; Yang, X.; Lu, X.; Chen, J.; Cheng, J.; Diao, Y.; Fan, J.L. China Carbon Dioxide Capture, Utilization and Storage (CCUS) Annual Report (2023); The Administrative Center for China’s Agenda 21, Global CCS Institute, Tsinghua University: Beijing, China, 2023. [Google Scholar]
  16. Martin-Roberts, E.; Scott, V.; Flude, S.; Johnson, G.; Haszeldine, R.S.; Gilfillan, S. Carbon capture and storage at the end of a lost decade. One Earth 2021, 4, 1569–1584. [Google Scholar] [CrossRef]
  17. Shen, J.; Zhang, Q.; Xu, L.; Tian, S.; Wang, P. Future CO2 emission trends and radical decarbonization path of iron and steel industry in China. J. Clean. Prod. 2021, 326, 129354. [Google Scholar] [CrossRef]
  18. Swennenhuis, F.; de Gooyert, V.; de Coninck, H. Towards a CO2-neutral steel industry: Justice aspects of CO2 capture and storage, biomass-and green hydrogen-based emission reductions. Energy Res. Soc. Sci. 2022, 88, 102598. [Google Scholar] [CrossRef]
  19. Zhang, S.; Yi, B.; Guo, F.; Zhu, P. Exploring selected pathways to low and zero CO2 emissions in China’s iron and steel industry and their impacts on resources and energy. J. Clean. Prod. 2022, 340, 130813. [Google Scholar] [CrossRef]
  20. Lubecki, M.; Stosiak, M.; Skačkauskas, P.; Karpenko, M.; Deptuła, A.; Urbanowicz, K. Development of Composite Hydraulic Actuators: A Review. Actuators 2022, 11, 365. [Google Scholar] [CrossRef]
  21. Zhang, Q.; Wei, Z.; Ma, J.; Qiu, Z.; Du, T.J.A.T.E. Optimization of energy use with CO2 emission reducing in an integrated iron and steel plant. Appl. Therm. Eng. 2019, 157, 113635. [Google Scholar] [CrossRef]
  22. Ho, M.T.; Bustamante, A.; Wiley, D.E. Comparison of CO2 capture economics for iron and steel mills. Int. J. Greenh. Gas Control 2013, 19, 145–159. [Google Scholar] [CrossRef]
  23. Tsupari, E.; Kärki, J.; Arasto, A.; Pisilä, E. Post-combustion capture of CO2 at an integrated steel mill—Part II: Economic feasibility. Int. J. Greenh. Gas Control 2013, 16, 278–286. [Google Scholar] [CrossRef]
  24. IEAGHG. Iron and Steel CCS Study (Techno-Economics Integrated Steel Mill); IEAGHG: Cheltenham, UK, 2013. [Google Scholar]
  25. Cormos, C.-C. Evaluation of reactive absorption and adsorption systems for post-combustion CO2 capture applied to iron and steel industry. Appl. Therm. Eng. 2016, 105, 56–64. [Google Scholar] [CrossRef]
  26. Biermann, M.; Ali, H.; Sundqvist, M.; Larsson, M.; Normann, F.; Johnsson, F. Excess heat-driven carbon capture at an integrated steel mill—Considerations for capture cost optimization. Int. J. Greenh. Gas Control 2019, 91, 102833. [Google Scholar] [CrossRef]
  27. Dreillard, M.; Broutin, P.; Briot, P.; Huard, T.; Lettat, A. Application of the DMXTM CO2 Capture Process in Steel Industry. Energy Procedia 2017, 114, 2573–2589. [Google Scholar] [CrossRef]
  28. Kim, H.; Lee, J.; Lee, S.; Lee, I.-B.; Park, J.-H.; Han, J. Economic process design for separation of CO2 from the off-gas in ironmaking and steelmaking plants. Energy 2015, 88, 756–764. [Google Scholar] [CrossRef]
  29. Kuramochi, T.; Ramírez, A.; Turkenburg, W.; Faaij, A. Comparative assessment of CO2 capture technologies for carbon-intensive industrial processes. Prog. Energy Combust. Sci. 2012, 38, 87–112. [Google Scholar] [CrossRef]
  30. Liang, X.; Qianguo, L.; Hasan, M.; Ming, L.; Qiang, L.; Jia, L.; Alisa, W.; Muxin, L.; Francisco, A. Assessing the Economics of CO2 Capture in China’s Iron/Steel Sector: A Case Study. Energy Procedia 2019, 158, 3715–3722. [Google Scholar]
  31. Wei, N.; Liu, S.; Jiao, Z.; Li, X.-C. A possible contribution of carbon capture, geological utilization, and storage in the Chinese crude steel industry for carbon neutrality. J. Clean. Prod. 2022, 374, 133793. [Google Scholar] [CrossRef]
  32. Wei, N.; Jiao, Z.S.; Ellett, K.; Ku, A.Y.; Liu, S.N.; Middleton, R.; Li, X.C. Decarbonizing the Coal-Fired Power Sector in China via Carbon Capture, Geological Utilization, and Storage Technology. Environ. Sci. Technol. 2021, 55, 13164–13173. [Google Scholar] [CrossRef]
  33. Ouyang, X.; Lin, B. Levelized cost of electricity (LCOE) of renewable energies and required subsidies in China. Energy Policy 2014, 70, 64–73. [Google Scholar] [CrossRef]
  34. IEA. Projected Costs of Generating Electricity 2020; IEA: Paris, France, 2020. [Google Scholar]
  35. Lazard. Levelized Cost of Energy Analysis 10.0; Lazard: New Orleans, LA, USA, 2016. [Google Scholar]
  36. Fan, J.-L.; Wei, S.; Yang, L.; Wang, H.; Zhong, P.; Zhang, X. Comparison of the LCOE between coal-fired power plants with CCS and main low-carbon generation technologies: Evidence from China. Energy 2019, 176, 143–155. [Google Scholar] [CrossRef]
  37. Vazquez, A.; Iglesias, G. Grid parity in tidal stream energy projects: An assessment of financial, technological and economic LCOE input parameters. Technol. Forecast. Soc. Chang. 2016, 104, 89–101. [Google Scholar] [CrossRef]
  38. Shen, W.; Chen, X.; Qiu, J.; Hayward, J.A.; Sayeef, S.; Osman, P.; Meng, K.; Dong, Z.Y. A comprehensive review of variable renewable energy levelized cost of electricity. Renew. Sustain. Energy Rev. 2020, 133, 110301. [Google Scholar] [CrossRef]
  39. Aquila, G.; Coelho, E.d.O.P.; Bonatto, B.D.; Pamplona, E.d.O.; Nakamura, W.T. Perspective of uncertainty and risk from the CVaR-LCOE approach: An analysis of the case of PV microgeneration in Minas Gerais, Brazil. Energy 2021, 226, 120327. [Google Scholar] [CrossRef]
  40. Vartiainen, E.; Masson, G.; Breyer, C.; Moser, D.; Román Medina, E. Impact of weighted average cost of capital, capital expenditure, and other parameters on future utility—scale PV levelised cost of electricity. Prog. Photovolt. Res. Appl. 2019, 28, 439–453. [Google Scholar] [CrossRef]
  41. Talavera, D.L.; Ferrer-Rodríguez, J.P.; Pérez-Higueras, P.; Terrados, J.; Fernández, E.F. A worldwide assessment of levelised cost of electricity of HCPV systems. Energy Convers. Manag. 2016, 127, 679–692. [Google Scholar] [CrossRef]
  42. Abdelhady, S.; Borello, D.; Shaban, A. Techno-economic assessment of biomass power plant fed with rice straw: Sensitivity and parametric analysis of the performance and the LCOE. Renew. Energy 2018, 115, 1026–1034. [Google Scholar] [CrossRef]
  43. Aquila, G.; Nakamura, W.T.; Junior, P.R.; Souza Rocha, L.C.; de Oliveira Pamplona, E. Perspectives under uncertainties and risk in wind farms investments based on Omega-LCOE approach: An analysis in São Paulo state, Brazil. Renew. Sustain. Energy Rev. 2021, 141, 110805. [Google Scholar] [CrossRef]
  44. Ioannou, A.; Angus, A.; Brennan, F. Stochastic Prediction of Offshore Wind Farm LCOE through an Integrated Cost Model. Energy Procedia 2017, 107, 383–389. [Google Scholar] [CrossRef]
  45. Lerch, M.; De-Prada-Gil, M.; Molins, C.; Benveniste, G. Sensitivity analysis on the levelized cost of energy for floating offshore wind farms. Sustain. Energy Technol. Assess. 2018, 30, 77–90. [Google Scholar] [CrossRef]
  46. Dahowski, R.T.; Davidson, C.L.; Li, X.C.; Wei, N. A $70/tCO2 greenhouse gas mitigation backstop for China’s industrial and electric power sectors: Insights from a comprehensive CCS cost curve. Int. J. Greenh. Gas Control 2012, 11, 73–85. [Google Scholar] [CrossRef]
  47. Fan, J.-L.; Xu, M.; Wei, S.; Shen, S.; Diao, Y.; Zhang, X. Carbon reduction potential of China’s coal-fired power plants based on a CCUS source-sink matching model. Resour. Conserv. Recycl. 2020, 168, 105320. [Google Scholar] [CrossRef]
  48. Wei, Y.-M.; Kang, J.-N.; Liu, L.-C.; Li, Q.; Wang, P.-T.; Hou, J.-J.; Liang, Q.-M.; Liao, H.; Huang, S.-F.; Yu, B. A proposed global layout of carbon capture and storage in line with a 2 °C climate target. Nat. Clim. Chang. 2021, 11, 112–118. [Google Scholar] [CrossRef]
  49. Zhang, X.; Li, K.; Wei, N.; Li, Z.; Fan, J.-L. Advances, challenges, and perspectives for CCUS source-sink matching models under carbon neutrality target. Carbon Neutrality 2022, 1, 12. [Google Scholar] [CrossRef]
  50. Tang, H.; Zhang, S.; Chen, W. Assessing Representative CCUS Layouts for China’s Power Sector toward Carbon Neutrality. In Environmental Science & Technology; American Chemical Society: Washington, DC, USA, 2021; Volume 55, pp. 11225–11235. [Google Scholar]
  51. Sanchez, D.L.; Johnson, N.; McCoy, S.T.; Turner, P.A.; Mach, K.J. Near-term deployment of carbon capture and sequestration from biorefineries in the United States. Proc. Natl. Acad. Sci. USA 2018, 115, 4875–4880. [Google Scholar] [CrossRef]
  52. Fan, J.-L.; Fu, J.; Zhang, X.; Li, K.; Zhou, W.; Hubacek, K.; Urpelainen, J.; Shen, S.; Chang, S.; Guo, S.; et al. Co-firing plants with retrofitted carbon capture and storage for power-sector emissions mitigation. Nat. Clim. Chang. 2023, 13, 807–815. [Google Scholar] [CrossRef]
  53. EUROFER. A Steel Roadmap for a Low Carbon Europe 2050; IEA Global Industry Dialogue and Expert Review Workshop: Paris, France, 2013. [Google Scholar]
  54. Fischedick, M.; Marzinkowski, J.; Winzer, P.; Weigel, M. Techno-economic evaluation of innovative steel production technologies. J. Clean. Prod. 2014, 84, 563–580. [Google Scholar] [CrossRef]
  55. Wörtler, M.; Dahlmann, P.; Schuler, F.; Lüngen, H.B.; Voigt, N.; Ghenda, J.; Schmidt, T. Steel’ S Contribution to a Low-carbon Europe 2050—Technical and Economic Analysis of the Sector’s CO2 Abatement Potential; The Boston Consulting Group, Steel Institue VDEh: Boston, MA, USA, 2013. [Google Scholar]
  56. Gardarsdottir, S.O. Technical and Economic Conditions for Efficient Implementation of CO2 Capture-Process Design and Operational Strategies for Power Generation and Process Industries; Chalmers University of Technology: Gothenburg, Sweden, 2017. [Google Scholar]
  57. Department of Social Development Science and Technology, MoSaT, ACCA21. Development Roadmap of Carbon Capture, Utilization and Storage Technology in China (2019 Edition); Science Press: Beijing, China, 2019.
  58. Mac Dowell, N.; Fennell, P.S.; Shah, N.; Maitland, G.C. The role of CO2 capture and utilization in mitigating climate change. Nat. Clim. Chang. 2017, 7, 243–249. [Google Scholar] [CrossRef]
  59. GCCSI. Global Status of CCS; GCCSI: Melbourne, Australia, 2021. [Google Scholar]
  60. Wei, N.; Li, X.; Dahowski, R.T.; Davidson, C.L.; Liu, S.; Zha, Y. Economic evaluation on CO2-EOR of onshore oil fields in China. Int. J. Greenh. Gas Control 2015, 37, 170–181. [Google Scholar] [CrossRef]
  61. Zhou, D.; Zhang, Y.; Haszeldine, S. Engineering Requirements for Offshore CO2 Transportation and Storage: A Summary Based on International Experiences; UK-China (Guangdong) CCUS Centre: Guangzhou, China, 2014. [Google Scholar]
  62. NEA. 2018 National Electricity Price Regulatory Bulletin; NEA: Washington, DC, USA, 2019. [Google Scholar]
  63. Mysteel. Absolute Price Index for Iron Ore; Mysteel: Shanghai, China, 2022. [Google Scholar]
  64. XNLSCL. National Steel Scrap Trading Guide Price. 2022. Available online: http://www.96369.net/map.aspx?type=2 (accessed on 22 October 2023).
  65. XNLSCL. National Coke Trading Guide Price. 2022. Available online: http://www.96369.net/map.aspx?type=4 (accessed on 22 October 2023).
  66. MRRN. Limestone Price Graph for 2020. Mineral Rights Resource Network: 2021. Available online: https://www.kq81.com/AspCode/SchqShow.asp?ArticleId=417922 (accessed on 22 October 2023).
  67. Mysteel. PCI Coal Price Index; Mysteel: Shanghai, China, 2022. [Google Scholar]
  68. E20. National Water Price; E20 Environment Platform: Beijing, China, 2022. [Google Scholar]
  69. Tong, Y.; Cai, J.; Zhang, Q.; Gao, C.; Wang, L.; Li, P.; Hu, S.; Liu, C.; He, Z.; Yang, J. Life cycle water use and wastewater discharge of steel production based on material-energy-water flows: A case study in China. J. Clean. Prod. 2019, 241, 118410. [Google Scholar] [CrossRef]
  70. Chen, Q.; Gu, Y.; Tang, Z.; Wei, W.; Sun, Y. Assessment of low-carbon iron and steel production with CO2 recycling and utilization technologies: A case study in China. Appl. Energy 2018, 220, 192–207. [Google Scholar] [CrossRef]
  71. He, H.; Guan, H.; Zhu, X.; Lee, H. Assessment on the energy flow and carbon emissions of integrated steelmaking plants. Energy Rep. 2017, 3, 29–36. [Google Scholar] [CrossRef]
  72. Sun, W.; Wang, Q.; Zheng, Z.; Cai, J. Material–energy–emission nexus in the integrated iron and steel industry. Energy Convers. Manag. 2020, 213, 112828. [Google Scholar] [CrossRef]
  73. WSA. Steel’s Contribution to a Low Carbon Future and Climate Resilient Societies; WSA: Brussels, Belgium, 2018. [Google Scholar]
  74. WSA. Energy Use in the Steel Industry; WSA: Brussels, Belgium, 2019. [Google Scholar]
  75. Zhang, F.; Zhou, Y.; Sun, W.; Hou, S.; Yu, L. CO2 capture from reheating furnace based on the sensible heat of continuous casting slabs. Int. J. Energy Res. 2018, 42, 2273–2283. [Google Scholar] [CrossRef]
  76. Chisalita, D.-A.; Petrescu, L.; Cobden, P.; van Dijk, H.A.J.; Cormos, A.-M.; Cormos, C.-C. Assessing the environmental impact of an integrated steel mill with post-combustion CO2 capture and storage using the LCA methodology. J. Clean. Prod. 2019, 211, 1015–1025. [Google Scholar] [CrossRef]
  77. Yang, L.; Xu, M.; Fan, J.; Liang, X.; Zhang, X.; Lv, H.; Wang, D. Financing coal-fired power plant to demonstrate CCS (carbon capture and storage) through an innovative policy incentive in China. Energy Policy 2021, 158, 112562. [Google Scholar] [CrossRef]
  78. Yang, L.; Xu, M.; Yang, Y.; Fan, J.; Zhang, X. Comparison of subsidy schemes for carbon capture utilization and storage (CCUS) investment based on real option approach: Evidence from China. Appl. Energy 2019, 255, 113828. [Google Scholar] [CrossRef]
  79. Yao, X.; Zhong, P.; Zhang, X.; Zhu, L. Business model design for the carbon capture utilization and storage (CCUS) project in China. Energy Policy 2018, 121, 519–533. [Google Scholar] [CrossRef]
  80. Zhang, X.; Huang, X.; Zhang, D.; Geng, Y.; Tian, L.; Chen, W. Research on the Pathway and Policies for China’s Energy and Economy Transformation toward Carbon Neutrality. J. Manag. World 2022, 38, 35–51. [Google Scholar]
  81. Cai, B.; Li, Q.; Zhang, X. Carbon Dioxide Capture, Use and Storage (CCUS) Annual Report of China (2021)—A Study of CCUS Pathways in China Beijing; Chinese Academy of Environmental Planning, Institute of Rock and Soil Mechanics, Chinese Academy of Sciences, The Administrative Center for China’s Agenda 21: Beijing, China, 2021. [Google Scholar]
Figure 1. Logical framework diagram.
Energies 16 07817 g001
Figure 2. Layout of steel plants, pipelines, and storage blocks. (a,b) describe the location distribution of crude steel production capacity (Mt/a) and blast furnace flue gas CO2 capture capacity (Mt/a) of the selected steel plants, respectively, and distinguish whether the steel plants are involved in source–sink matching or not. (c) describes the distribution of pipes involved in source–sink matching and their sizes. (d) describes the types of storage blocks involved in source–sink matching and their location distribution.
Energies 16 07817 g002
Figure 3. Relationships between the levelized cost (a,b), levelized additional cost (c,d), and carbon avoidance cost (e,f) of CCUS projects of the blast furnace under different scenarios and cumulative CO2 reduction.
Energies 16 07817 g003
Figure 4. LCOS distribution of steel plants by province.
Energies 16 07817 g004
Figure 5. The relationships between levelized cost (a,b), levelized additional cost (c,d), carbon avoidance cost (e,f), and cumulative CO2 reduction for the whole steel plant with different incentives after CCUS retrofit.
Energies 16 07817 g005
Figure 6. The distribution of CCUS project costs (BAU scenario). (a,c,e) describe the location distribution of levelized cost, levelized additional cost, and carbon avoidance cost for blast furnace CCUS projects, respectively. (b,d,f) describe the correspondence between levelized cost, levelized additional cost, and carbon avoidance cost for blast furnace CCUS projects and the amount of CO2 capture, respectively. The shapes shown are not intended as distinguishing marks.
Energies 16 07817 g006
Figure 7. The distribution of whole steel plant costs after CCUS retrofit (BAU scenario). (a,c,e) describe the location distribution of levelized cost, levelized additional cost, and carbon avoidance cost for the whole steel plant after a CCUS retrofit, respectively. (b,d,f) describe the correspondence between levelized cost, levelized additional cost, and carbon avoidance cost for the whole steel plant after a CCUS retrofit and the amount of CO2 capture, respectively. The shapes shown are not intended as distinguishing marks.
Energies 16 07817 g007
Table 1. Unit price of main raw materials.
Geographic RegionProvince P i r o n   o r e (CNY/t) P s t e e l   s c r a p (CNY/t) a P c o k e (CNY/t) b P P C I   c o a l (CNY/t) c P n e w   w a t e r (CNY/t) P p o w e r (CNY/kkWh)
Domestic Price113.21----------
Imported Price106.84----------
North ChinaTianjin--323.38263.27144.410.9953.68
Hebei--326.490.6648.94
Shanxi--314.660.6149.06
Inner Mongolia--316.990.4641.57
Northeast ChinaLiaoning--371.76272.66150.31 40.5956.53
Jilin--360.63 10.5955.74
Heilongjiang--351.370.6656.97
East ChinaShanghai--341.77286.03156.310.4062.57
Jiangsu--352.070.2959.78
Zhejiang--340.710.4063.52
Anhui--344.78 10.3158.38
Fujian--344.78 10.3559.38
Jiangxi--357.260.3663.78
Shandong--344.78 20.7262.69
Central ChinaHenan--329.56 2276.18158.590.6954.33
Hubei--348.640.3266.58
Hunan--339.10 10.3870.02
South ChinaGuangdong--367.53285.09 3134.38 50.5367.27
Guangxi--366.45 10.2460.94
Southwest ChinaChongqing--355.78293.08134.38 50.5062.94
Sichuan--363.660.4667.16
Guizhou--359.72 10.4050.70
Yunnan--359.72 10.5562.92
Northwest ChinaShaanxi--297.03249.86101.350.6749.85
Gansu--322.77 10.3043.52
Qinghai--322.77 10.3642.74
Ningxia--322.77 10.5037.93
Xinjiang--348.510.4732.81
The original data from the market and official public data [62,63,64,65,66,67,68]. a: 1 indicates that the data are missing, and the average value of the geographic region where the province is located is taken. 2 indicates that the data come from the average of market prices in non-provincial capitals. Unspecified data are market prices in the provincial capital of the province. b: 3 indicates that the data are missing, and the average value of East China, Central China, and Southwest China is taken. c: 4 indicates that the data are missing, and the average value of North China and East China is taken. 5 indicates that the data are missing, and the average value of the nation is taken.
Table 2. Consumption of main raw materials in steel plants.
γ i r o n   o r e γ s t e e l   s c r a p γ limestone γ c o k e γ P C I   c o a l γ n e w   w a t e r γ p o w e r
Unitkg/t Crude SteelkWh/t Crude Steel
Value1361.23138.33270.00321.93196.402.65450.00
The original data from [69,70,71,72,73,74,75].
Table 3. The related data of CO2 capture.
M p o w e r P c a p t u r e M M E A P M E A M s t e a m P s t e a m δ
UnitkWh/t CO2USD/t CO2t/t CO2USD/tt/t CO2USD/t(%)
Value133.34 (113.89–152.78)85.821.0 × 10−33623.401.41 (1.18–1.63)28.993.50
(2–5)
The original data from [23,26,29,62,76,77].
Disclaimer/Publisher’s Note: The statements, opinions and data contained in all publications are solely those of the individual author(s) and contributor(s) and not of MDPI and/or the editor(s). MDPI and/or the editor(s) disclaim responsibility for any injury to people or property resulting from any ideas, methods, instructions or products referred to in the content.

