Article

Impact of Figures of Merit Selection on Hybrid–Electric Regional Aircraft Design and Performance Analysis

Department of Civil and Industrial Engineering, University of Pisa, Via G. Caruso 8, 56122 Pisa, Italy
*
Author to whom correspondence should be addressed.
Energies 2023, 16(23), 7881; https://doi.org/10.3390/en16237881
Submission received: 15 October 2023 / Revised: 20 November 2023 / Accepted: 30 November 2023 / Published: 1 December 2023

Abstract

:
The adoption of hybrid–electric propulsion, allowing us to partially replace fuel with batteries and to reduce aircraft in-flight emissions, represents one of the main investigated solutions to mitigate the aviation climate impact. Despite its environmental potential being appealing for a practical application, two main drawbacks limit the actual implementation of this technology: first, the low gravimetric energy density of the batteries restricts hybrid–electric aircraft payload and range capabilities; second, the production of electricity is currently not entirely based on renewable energy sources, hence a non-direct emissions budget may limit the benefit in terms of overall decarbonization. When designing hybrid–electric aircraft, even projecting its actual entry into service in the next decades, it is necessary to take these limitations into account depending on both the more reliable technological forecasts on the development of electric components and on the estimates of electricity production. A proper analysis of the figure of merits related to the operation of such an aircraft, therefore, becomes crucial in assessing the impact related to its introduction into service. In this context, trade-offs between different performance metrics may be needed to efficiently exploit the environmental benefits of such an advanced concept, while limiting the possible drawbacks coming from its utilisation. This paper provides a performance analysis of hybrid–electric aircraft through an assessment of the relevant figures of merit characterizing its operations. In particular, direct and non-direct emissions, climate impact, ground pollution, operating costs, fuel consumption, weight, and a combination of these figures of merit allow us to define a proper development perimeter in which a possible (future) hybrid–electric aircraft can express its maximum potential towards all the aspects of its utilisation. The trade-off analyses provided in this paper allow us to identify more effective paths for the actual development of hybrid–electric aircraft, highlighting the impact of the selected design variables on the performance metrics, and bringing to light also the possible related limitations.

1. Introduction

The evolution of aeronautical transport technologies has been significant over the last century, and it has undergone phases in which aircraft development followed a variety of different objectives. From the pioneering era in which the aim was to enable a flying object to transport a few people and for short distances, there was a rapid progression to an enormous growth in the technological development of transport aircraft, which became larger, faster, and with ever-increasing endurance and performance [1,2]. In this path of technological evolution, even the design process of a complex product such as an aircraft has undergone disruptive evolutions, moving from the first intuitive drawings of experienced scientists and pioneers to fully automated and digitised design, optimisation, and testing procedures [3,4,5,6].
In this context, however, there has all along been a common thread characterising the development of the aircraft, both in pioneering times and in today’s more advanced scenarios: the main objectives that this complex product must achieve, i.e., the specific requirements it must satisfy. In qualitative terms, in the beginning, this objective could coincide more simply with the attainment of controllable flight, then turning into a series of increasingly wide-ranging performance requirements involving different aspects of the aircraft, such as speed [7,8], endurance/range [9,10], loading capacity [11], safety [12,13], etc. In general, particularly with reference to modern transport aviation, these objectives can be classified into two different categories, one referring to design requirements, i.e., the specification to be met from the initialisation to finalisation of the project, and one that instead steers and guides design development, referred to as figures of merit (FoMs). As it stands, design specifications (also known as Top Level Aircraft Requirements, TLARs) are mandatory targets that aeronautical designers must meet with their final product, i.e., the transport aircraft [14,15,16,17,18]. FoMs, on the other hand, are particular function requirements that must be maximised (or minimised) by specifically acting on the different available design levers (i.e., the classical design variables) to achieve a specific performance. In particular, FoMs are quantitative metrics that evaluate how well an aircraft performs in relation to assigned (aircraft) design goals [19,20,21,22,23].
These metrics provide a systematic way to provide a quantitative comparison among several diverse design alternatives, and hence enable decision making during design development. More specifically, FoMs can include a variety of aspects, such as fuel efficiency, operating capability, or environmental impact. While requirements set the baseline objectives that must be met, FoMs support the development and the optimisation of concepts by quantifying performance and trade-offs [24,25,26,27]. Hence, pivoting the design process on both TLARs and FoMs leads to aircraft designs that are not only compliant with a specification but are also highly efficient and effective, even from the very early design stages. In this general frame, this study aims to present and discuss the effects that the selection of different FoMs can have on the design choices and performance of an innovative aircraft configuration currently under intense investigation: the transport aircraft equipped with a hybrid–electric propulsion system [28,29,30,31,32,33].

1.1. Research Context

In recent years, the aircraft design and development scenario, particularly for next-generation transport aircraft, has experienced a deep transformation. This transition is characterised by a shift from the traditional approach focused on performance-related metrics to a greater emphasis on addressing environmental issues and mitigating the impact of commercial aviation on climate change [34,35,36,37,38,39]. The aviation industry, together with regulatory authorities and research organisations, has recognised the urgent need to redefine the way in which design requirements and FoMs are defined for transport aircraft. As a result, design and operating criteria for new-generation transport aircraft are no longer evaluated exclusively on the basis of speed, range, cost, and loading capacity, but rather extend to minimising carbon dioxide ( CO 2 ) emissions, reducing air pollutants, and lowering noise levels.
The redefinition of the design of FoMs implies a holistic perspective combining technological innovations, the reformulation of design approaches, and radical advancements in propulsion systems and aircraft configurations. In this context, the integration of electric and hybrid–electric powertrains has gained increasing relevance, as it may potentially provide significant reductions in greenhouse gas emissions and noise pollution. Specifically, the largest beneficial impact from the introduction of such is that advanced propulsive technology is expected in the regional transport sector [40,41], in which commercial aircraft are designed to transport a limited number of passengers for short (or very short) routes, with the aim of serving local and regional communities.

1.2. Aim of the Work

This paper presents a conceptual study focused on the performance analysis of a regional, hybrid–electric aircraft. Specifically, the main purpose of this research is to identify and discuss the influence that the selection of the FoMs governing the aircraft design has on the design development and performance of the aircraft in question. In fact, correlations that are well established (and canonical) when approaching the conceptual design of traditional aircraft could be questioned when facing the development of innovative configurations of the next generation, conceived with very different performance requirements. The FoMs considered in this study are related to classical performance aspects as well as to economic considerations and environmental impact assessments.
The remainder of this paper is organised as follows: Section 2 outlines the methodological aspects of the design, optimisation, and performance analysis of the hybrid–electric aircraft, as well as defining the reference aviation sector with its benchmarks and the typical figures of merit in the context of aircraft design. Section 3 reports and comments on all the results obtained in this work, both in absolute terms and in a comparative perspective between a hybrid–electric aircraft and state-of-the-art full-thermal aircraft. Finally, Section 4 proposes the concluding remarks of this work.

2. Materials and Methods

This section outlines qualitatively the methodological features applied to perform performance analyses of a regional hybrid–electric aircraft. The design methodology used is thus presented, the scenario analysed (i.e., the regional sector), and the state-of-the-art reference aircraft used to perform the comparative analyses is described, while the main FoMs that are typically employed as drivers for the conceptual design of transport aircraft are illustrated.

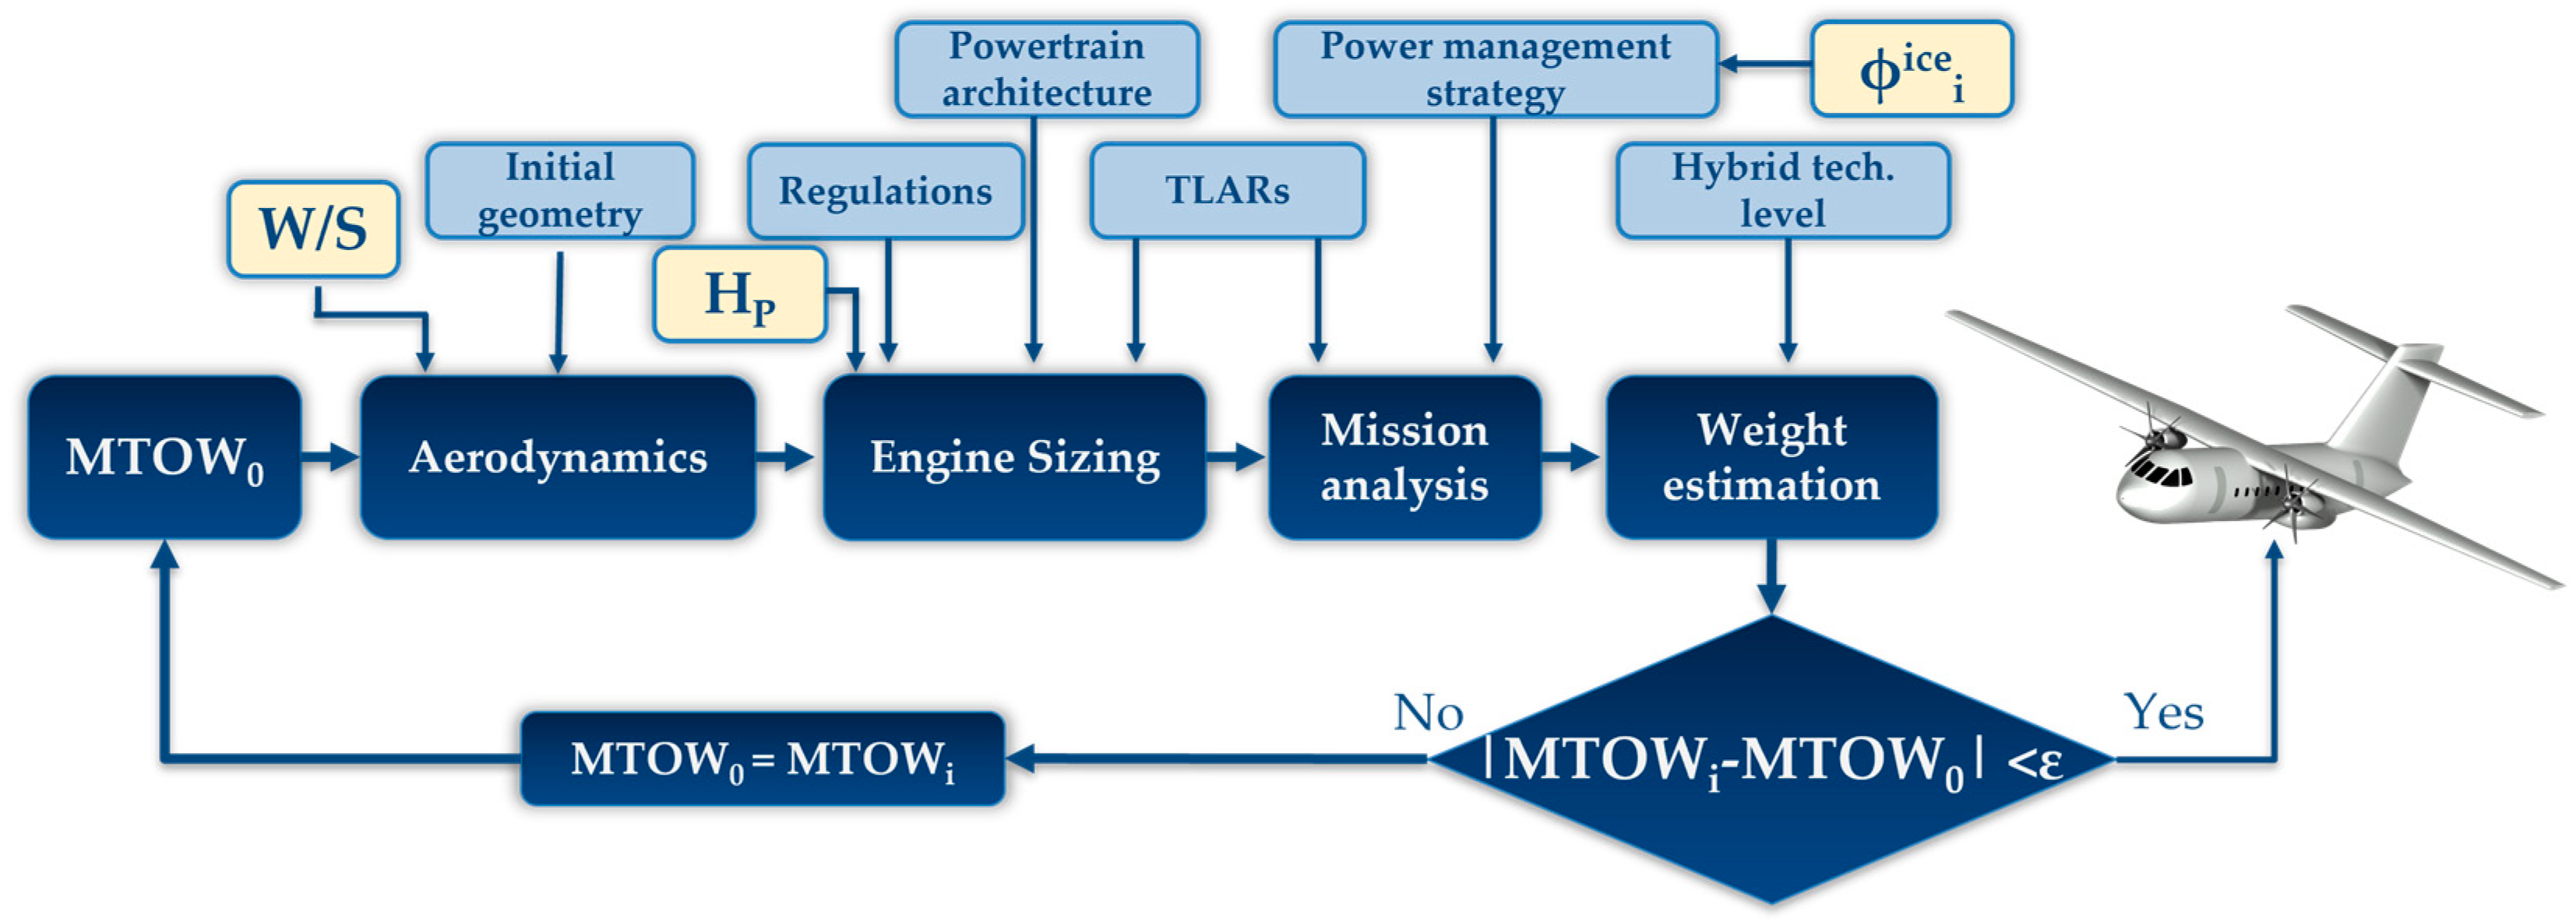
2.1. Design Methodology

The design and performance analysis methodology used in this study is implemented in the in-house-developed software called THEA-CODE [28,42,43,44]. This code, implemented in MATLAB, allows for the design of a hybrid–electric regional aircraft to be carried out by integrating the main interdisciplinary aspects that characterise the conceptual phase of the (transport) aircraft design. As the purpose of this paper is to discuss in detail the performance of regional aircraft, and the impact that the selection of different FoMs can have on design development, only a very brief recall of the design methodology is made in this section. For a comprehensive description of the design methodology used, the reader can refer to the relevant literature describing THEA-CODE in detail, available in [28,42,43,44].
The software is capable of sizing a hybrid–electric, as well as full-thermal, transport aircraft, starting from the input of a set of TLARs. Moreover, the lifting system geometry is an input to the procedure, and it is initialised through the use of another in-house-developed software, called AEROSTATE, which is described in detail in [45,46]. Subsequently, the analysed configuration begins an iterative loop that ends once the maximum take-off weight (MTOW) reaches convergence. Within the loop, see Figure 1, a series of multi-disciplinary analyses are consecutively carried out. In particular, the aerodynamic performance is evaluated by means of the vortex lattice method (VLM) [47] solver with regard to the lift coefficients, induced drag, and stability derivatives, while the parasitic drag is evaluated by means of the proper application of the results obtained by means of the XFOIL code [48]. The evaluation of the structural weights of the lifting system is carried out through the use of FEM-based metamodels, as properly described in [49,50]. On the other hand, the weights of the fuselage, the other structural components, and systems are evaluated through the semi-empirical formulations proposed in [51]. The propulsion system is sized by building the matching chart, which relates the specific power P/W required for all the phases of the flight and the aircraft wing loading W/S [52,53].
In the case of hybrid–electric aircraft equipped with powertrains of parallel architecture, the installed power split between the thermal chain and the electric chain is set by means of the design parameter hybridisation factor H P , defined as follows:
H P = P i e P i e + P i t
where P i e is the installed electrical power and P i t is the installed thermal power. Following these assessments, a detailed simulation of the entire design mission is carried out using the models described in [54], which allows for the extrapolation of the flight performance, as well as the fuel and battery quantities required for the mission and reserves. At this point, the design cycle is iterated until convergence of the MTOW.
When dealing with a hybrid–electric aircraft, it is necessary to set up a mission power supply strategy, in terms of the power shares supplied by the thermal chain and the electric chain, in order to satisfy the power demand required at each instant of the flight. In this study, it was decided to divide the whole mission into sub-segments and to set up a power supply strategy as follows: during the ground manoeuvre phase (i.e., taxi-in and taxi-out), it is imposed that only the electrical power available on board is used in order to minimise local air pollution and noise output levels; for the take-off phase, all the available power on board is supplied, both electrical and thermal; and for the climb, cruise, and descent phases, the designer can pre-set the proportions of thermal and electrical power to be supplied to satisfy the required power. In this study, the selection of the power fractions to be supplied during these phases is carried out by means of an optimisation procedure, set as
min FoM x 0 < H P < 0.7 250 < W / S < 325        [ kg f / m 2 ] 0 < Φ cl t < 0.56 0 < Φ cr t < 0.56 0 < Φ de t < 0.56
The procedure is based on a multi-start approach, which implements a gradient-based local optimum search algorithm for each optimisation run. The optimiser is able to evaluate different electric power shares installed on board through the possibility of varying H P , but also to search for the best power split supply strategy during the mission, aimed at minimising the selected FoM, used as the objective function of the procedure. Specifically, the optimiser acts on the fraction of supplied thermal power Φ k t , defined as
Φ k t = P k t P i t
where P k t is the thermal power supplied in the k-th phase of the mission. In the case of parallel powertrain, from these data it is also possible to calculate Φ k e , i.e., the electrical power fraction supplied in the same phase, since the total power required for the flight is known at each instant from the mission simulation module. As far as diversion is concerned, this is fixed to be carried out entirely with thermal power only, since it is a phase that impacts the aircraft sizing, but this is only performed in rare cases related to emergencies or unforeseen occurrences. This design choice allows us to avoid installing a battery pack (a very heavy component) that remains unused in standard operations: this would jeopardise the effectiveness or even the feasibility of the introduction of hybrid–electric propulsion on this type of aircraft. Figure 2 shows a generic example of the power supply time profile for a regional hybrid–electric aircraft, in which also the different mission phases are indicated. For more details on the mission simulation, the interested reader can refer to [54].
The mission profile, schematically reported in Figure 3, is set equal for any hybrid–electric aircraft considered and follows the assumptions reported in Table 1, where RoC and RoD are the rate of climb and of descent, respectively, IAS is the indicated air speed, and the subscript div indicates the diversion phase.

2.2. FoMs Analysis

In the following, the main FoMs that can typically be adopted as design drivers for transport aircraft development are described. Among the most established metrics is the MTOW, which is often used as an all-encompassing performance metric in the conceptual phase as it correlates to mission performance and aircraft production and utilisation costs. There are also metrics related to the energy budget required by the flight, specifically the energy demand to accomplish the mission (block energy, E) and also the diversion and reserves (total energy, E t ); the energy-specific air range (ESAR), representing the distance flown per unit of energy spent; and the payload-range energy efficiency (PREE), a metric that indicates the aircraft productivity, defined as the product of flight distance and payload weight per unit of energy spent. Metrics related to fuel consumption are defined as block fuel m fb , i.e., the fuel burnt in the standard mission only, and total fuel m f defined as the share which also includes diversion fuel and reserves; the specific air range (SAR), indicating the distance flown per unit of fuel burnt. Typical metrics related to aircraft operations economics are the direct operating costs (DOCs) which are directly related to aircraft ownership and its utilisation, hence including costs for lease, insurances, and depreciation, fuel, batteries, maintenance, navigation and airport fees, and flight crew wages. Another metric is the cost per available seat-kilometre (CASK) that represents the DOC divided by the number of aircraft seats and flight distance. Finally, the cost-specific air range (COSAR) refers to the distance flown per unit of energy cost, both fuel- and electricity-related in the case of a hybrid aircraft.
In the conceptual design phase, it is also useful to adopt environmental-related metrics, for example, CO 2 emissions are quantifiable and are very impactful in the overall greenhouse gas emissions budget coming from aircraft operations. This FoM should include both direct and flight-related emissions and total emissions; specifically, direct CO 2 emissions represent the quantity emitted during the flight; hence, it is related to block fuel consumption. On the other hand, total CO 2 emissions consider block fuel combustion but also the share of CO 2 deriving from the production and distribution of electrical energy, providing a more holistic assessment of the environmental impact of aircraft operations, especially in the case of hybrid–electric powertrains. There are also other greenhouse gas agents and pollutants, such as NO x , CO, SO x , and other hydrocarbons [55,56], which belong to the group of non- CO 2 emissions, for which there are simplified models to assess their impact on climate change and air quality degradation, but which still remain very complex to estimate accurately and with precision. Accordingly, these are preliminarily not taken into account in this study.

2.3. Reference Regional Aircraft

The context in which this study is developed is that of regional transport aviation. This sector is selected because the well-known limitations arising from the weight of batteries, even in a future scenario, imply that hybrid–electric propulsion cannot be effectively applied on higher-class aircraft [57,58]. The reference for this area is, serving as an example, the ATR-42 aircraft. The TLARs used in this work are similar to those of this aircraft and are taken from the study carried out in [28]; specifically, a number of passengers equal to 40 is selected, and a sensitivity study is proposed as the design range changes, considering flight distances between 200 nm and 800 nm. The cruise stage is flown at an altitude of 6100 m and with a constant Mach number equal to 0.4. The performance of the electric machines is taken from the review proposed in [28]; namely, a specific power of 13 kW/kg and an efficiency of 0.96 are selected for the electric motors and a specific power of 19 kW/kg and an efficiency of 0.98 are selected for the inverter, whereas for cables, a specific power of 352 kWm/kg and an efficiency of 0.99 are selected. The gravimetric energy density of the battery, which is a key performance metric affecting the whole design of a hybrid–electric aircraft [59,60], is selected equal to 500 Wh/kg [28,61,62]. These performance forecasts refer to a predicted scenario for the 2035.
To conduct quantitative comparative studies, and to evaluate the effects on key performance from the introduction of a regional hybrid–electric aircraft, full-thermal aircrafts were sized based on the same requirements and using the same design and optimisation procedures that are employed for the hybrid–electric aircraft. In this context, Table 2 shows the main performances of the full-thermal regional reference aircraft used as benchmarks for comparisons. The mass of CO 2 emissions ( m C O 2 ) and the direct operating cost per flight (DOC) are calculated as
m C O 2 = C O 2 f   m fb + C O 2 e   m b ( BED / 10 3 )
DOC = DOC En + DOC Cr + DOC Ma + DOC Ca + DOC Fe
where C O 2 f = 3.16 kg/kg indicates the mass of CO 2 emitted per kilogram of fuel burned [63],   m fb is the block fuel mass, C O 2 e is the mass of CO 2 emitted per unit of kWh of generated electrical energy,   m b is the battery mass, and BED is the gravimetric battery energy density (measured in Wh/kg). In case of full-thermal aircraft, Equation (4) depends only on the block fuel mass since no battery pack is stored on board. The form of Equation (5) has been taken from the methodology proposed in [64,65], where the cost associated with the energy sources ( DOC En ), crew ( DOC Cr ), maintenance ( DOC Ma ), investment ( DOC Ca ), and fees ( DOC Fe ) is taken into account. An application of this methodology is proposed in [66].

3. Numerical Results
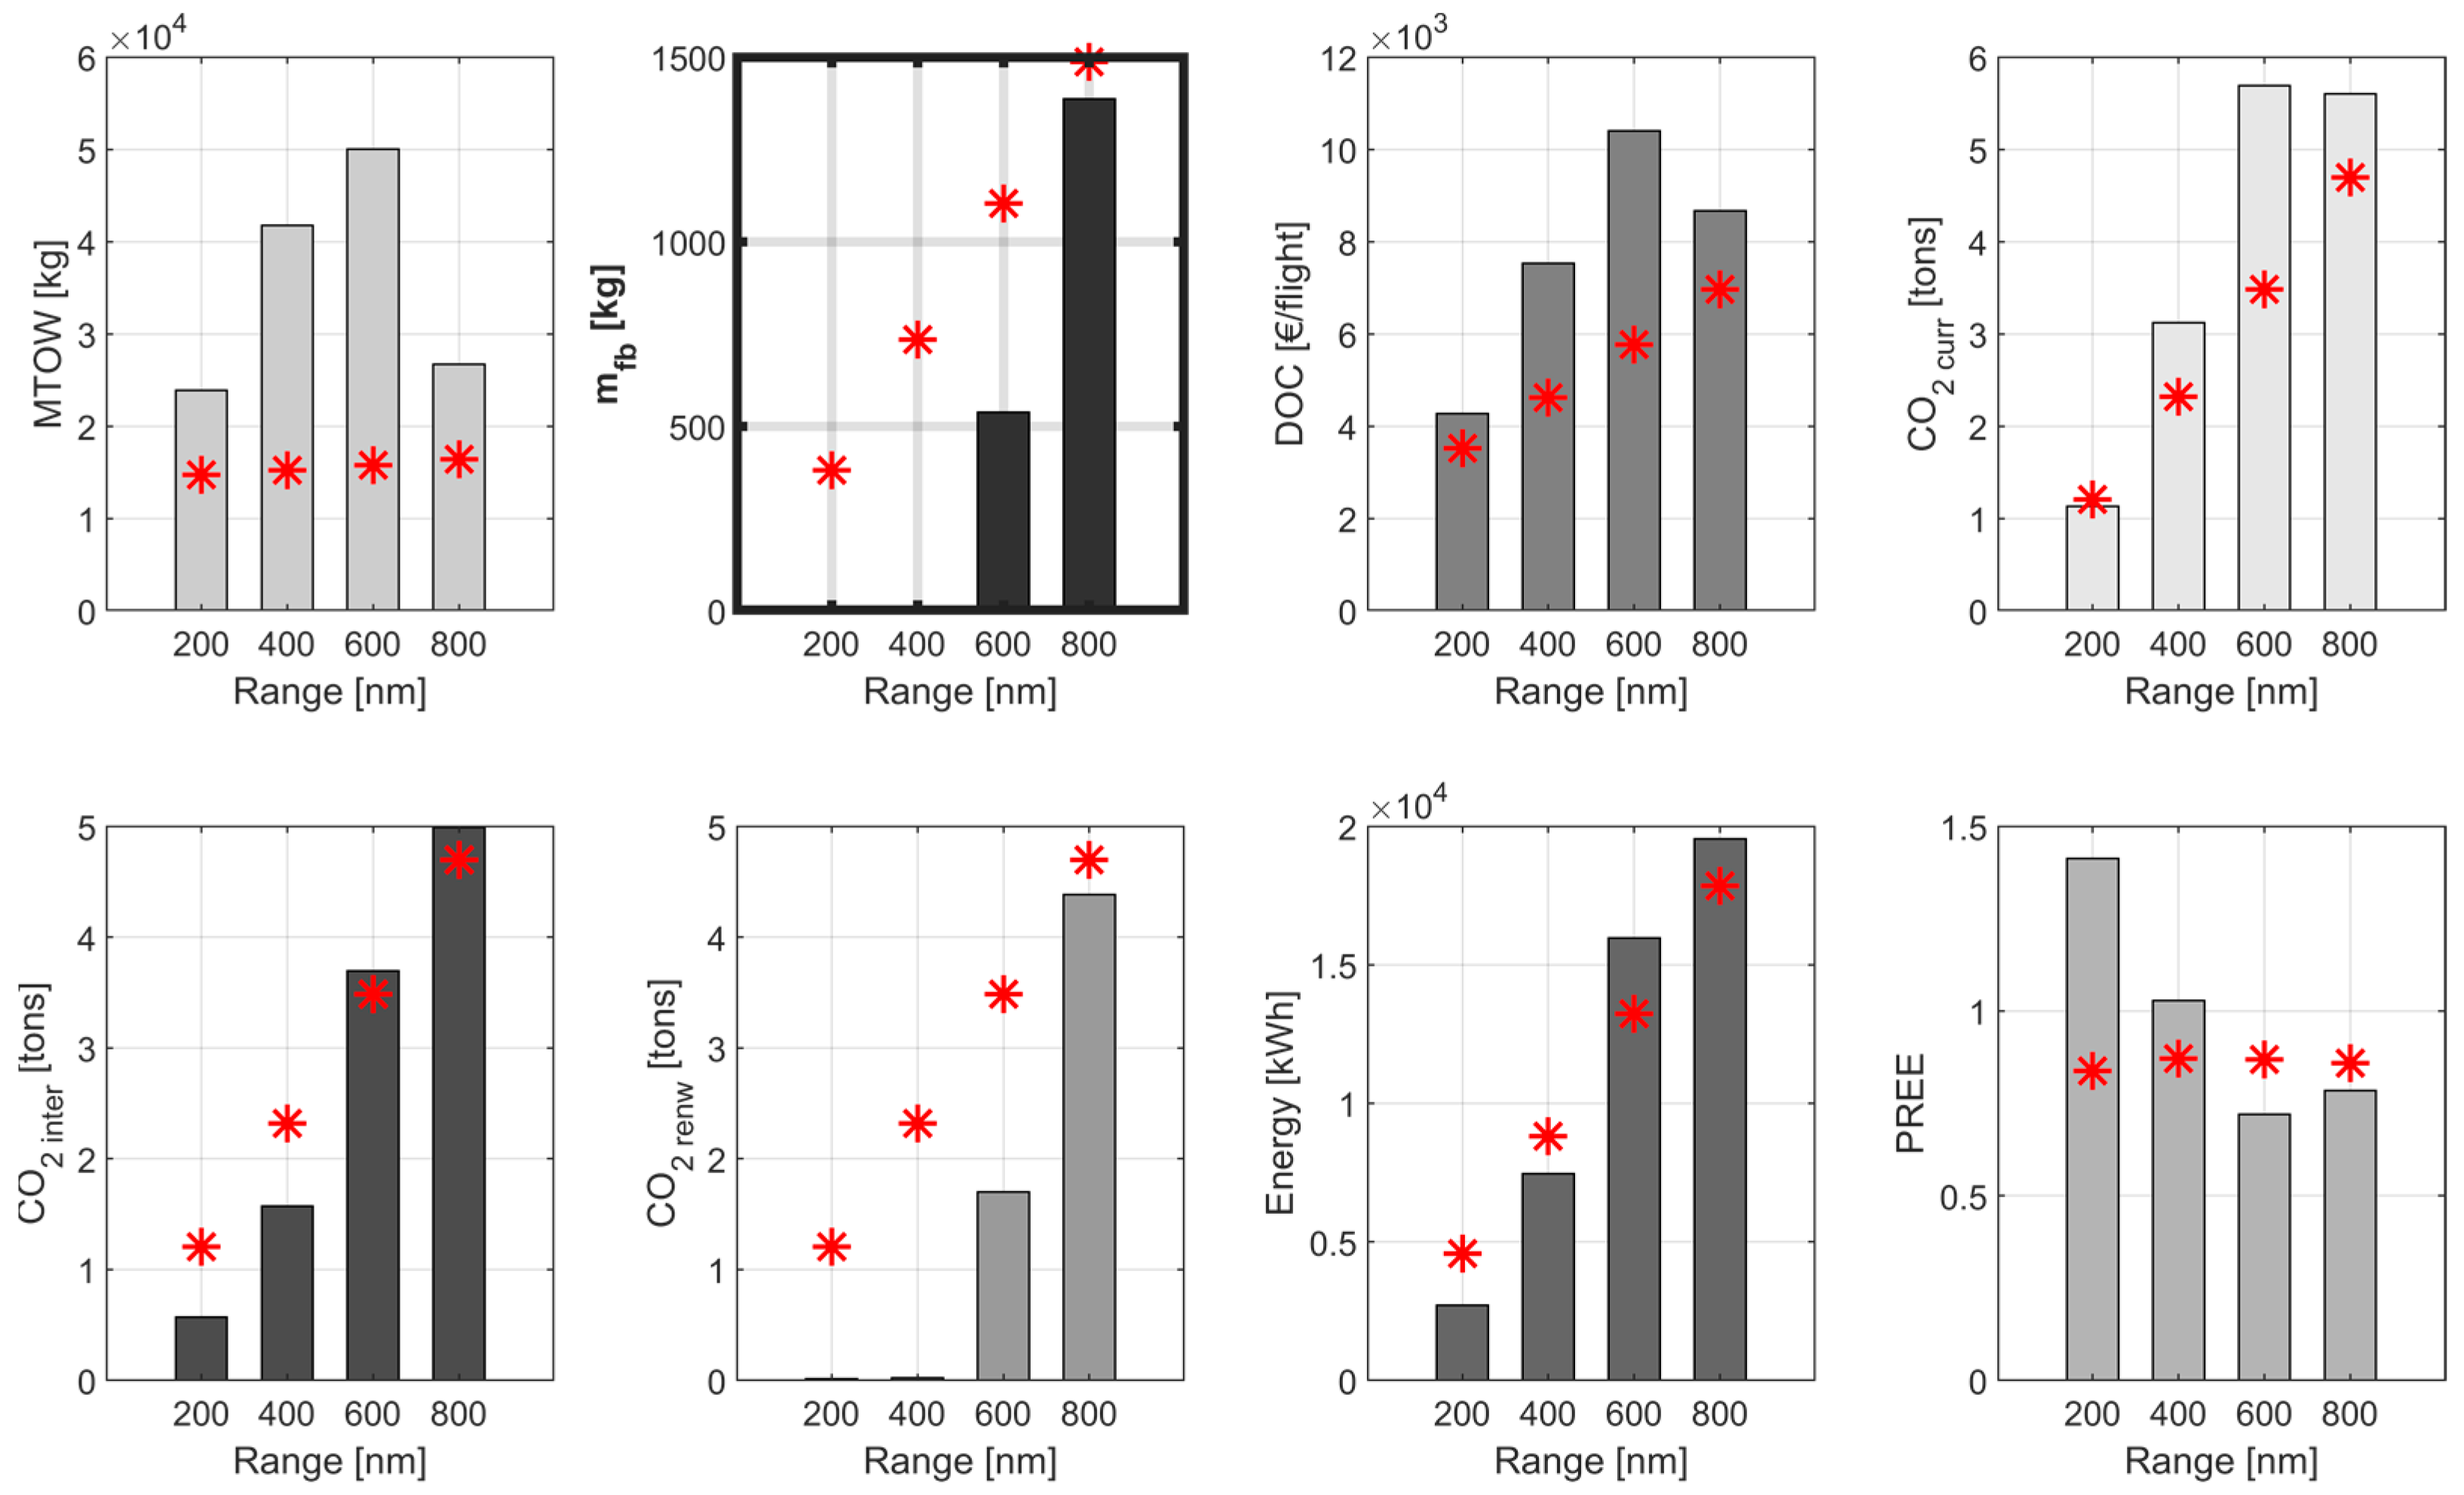
In this section, results related to hybrid–electric aircraft optimisations are proposed and discussed for the different set of FoMs considered in this study. In particular, the optimal results related to the objective functions of block fuel mass m fb , MTOW, mission energy, DOC, and CO 2 emissions when varying the design range in the 200–800 nm interval are discussed in detail.

3.1. Block Fuel

This part of the paper presents the results for optimisations in which the FoM to be minimised is set equal to the m fb . In this context, the left part of Figure 4 shows the numerical results of the multi-point optimisations in terms of optima FoMs as the range varies, where the overall optimum is highlighted with a star marker. Note that, for the shorter drawing ranges (i.e., for routes of 200 nm and 400 nm), the numerical optimiser is able to identify solutions with the lowest possible fuel consumption, practically leading towards fuel-free missions, apart from the very small fuel amount related to the take-off phase (less than 10 kg). For the design range of 600 nm, the proper introduction of hybrid–electric propulsion provides a significant advantage compared to the full-thermal counterpart (see Table 2) with a savings in m fb of about 51%. A slight gain, quantifiable at this conceptual stage as 7%, is also obtained for the 800 nm case, but this seems to be an advantage too limited to justify the development of such a concept for this design requirement. The right part of Figure 4 shows the results for the m fb -optima configurations in terms of the MTOW as the design range varies. Note that, compared to the values of the full-thermal references, the value of the MTOW for the configurations optimised with respect to m fb are significatively higher (with an increasing trend between 200 nm and 600 nm), while for the configuration optimised at 600 nm, there is even a significant MTOW increase of roughly 217%. These weight increments are predominantly associated with the replacement of the main energy source to fulfil the mission from fuel, that has a gravimetric energy density of 12,000 Wh/kg, to batteries, that have a much lower one of 500 Wh/kg. Optimisations to the m fb , therefore, tend to minimise fuel consumption by supplying electrical power during the standard mission and then introduce weight aggravations that affect the entire configuration. This trend seems to reverse as the design range increases beyond 600 nm.
In fact, from Figure 4, it can be observed that the optimal solutions at 800 nm, despite having quite similar FoM values, show a very marked scattering in terms of the MTOW. This specific trend means that the optimiser, by handling the design variables described in Section 2. 1, is able to find minimum m fb solutions with different hybridisation and thermal power fraction values. Namely, the optimal solution may involve a larger share of electrical power supply, and thus a larger amount of batteries (hence, of MTOW), or it may tend towards a solution closer to full-thermal, with a negligible electrical power supply during the mission. This aspect can also be deduced from the numerical outputs of the ten optimisations carried out for the 800 nm design range, shown in Table 3, where the great variability of H P and battery mass m b is observed against a rather limited variation in m fb .
The influence of the design variables on the optimal solution is also well inferred from the results in Figure 5, which show the optimal DVs for the four design ranges. In the 200 nm and 400 nm cases, the hybridisation factor H P reaches its upper limit, and the thermal power supply Φ t in the three mission phases {climb, cruise, descent} is always zero. The hybrid–electric powertrain, therefore, can take full advantage of the electric power supply to meet the required power for flight and to minimise fuel consumption m fb . The same is not the case for the 600 nm and 800 nm scenarios, as a mission strategy with an electric-only power supply would result in such large weight increases that the aircraft design could not converge. Furthermore, the need for a trade-off related to the presence of the batteries is clear, since on the one hand it offsets the amount of fuel required for the mission energy demand, and on the other hand it increases exactly that demand by introducing considerable MTOW increases.
In order to further analyse in detail the impact of power supply management on the selected FoM, the time profiles of the thermal and electrical power supply for the four optima configurations are illustrated in Figure 6 along with the time profiles of the corresponding power supply fractions Φ. In particular, by analysing the simulation results for the 200 nm and 400 nm missions, it can be observed that the entire standard mission is completely carried out by means of an electric power supply only, with the exception of the take-off which, as mentioned in Section 2.1, is not subject to optimisation and in which all the on-board available power is supplied. For missions at 600 nm and 800 nm, on the other hand, an increase in the thermal power supply is observed in the standard mission, especially for the cruise stage, which is the most energy-consuming phase. As discussed in Section 2.1, diversion is an off-design task and, according to the designer’s choice, it is performed (when necessary) using only power and thermal energy.
To better illustrate the optimal solutions in terms of installed power and on-board energy source splits, Figure 7 reports the related results for the optima configurations. In particular, the left part of Figure 7 shows that the electric installed power is the highest share in the 200 nm and 400 nm cases, while the thermal power becomes larger in the 600 nm and 800 nm cases. It is interesting to note that the installed power in the 800 nm case is lower than in the 600 nm case because the optimal solution goes towards an even larger trade-off between batteries and fuel, providing a solution with a significantly lower MTOW than the corresponding 600 nm one. Accordingly, a lower required power is obtained (the same applies when compared to the 400 nm solution). This is no longer the case regarding energy, since the extension of the route length has a greater effect than the increase in the MTOW, as can be deduced from the middle part of Figure 7. It can be seen from the same figure how for the 200 nm and 400 nm cases, the energy requirement is almost matched by the electrical energy source. Consequently, the battery mass increases significantly with the range up to 600 nm (right part of Figure 7), while at 800 nm the increase in m fb becomes evident.
Although a general analysis of optimised hybrid–electric configurations is interesting, the crucial aspect should lie in a direct comparison with the corresponding state-of-the-art aircraft, i.e., the full-thermal regional aircraft presented in Section 2.2. In fact, only a straightforward comparison between the proposed new technology, hybrid–electric propulsion, and the current one can provide a proper insight into possible advantages or disadvantages, as well as outline possible hints for further development, given the conceptual nature of this study. To this end, Figure 8 shows all the FoMs evaluated for the m fb -optimised configurations as the range varies, compared with the corresponding values for the full-thermal configurations, highlighted with a red star marker. Significant differences are observed between the two groups of aircraft, as described below. As previously mentioned, the hybrid–electric configurations show significant increases in the MTOW, mainly due to the high battery mass and the associated ripple effect on the aircraft’s operating empty weight. The use of electrical power and energy allows us to almost eliminate the mission fuel consumption in the 200 nm and 400 nm cases, to halve it in the 600 nm case, and to obtain a slight benefit in the 800 nm case. Moreover, the CO 2 emissions of optimised aircraft have been computed according to Equation (4). In this regard, three different values of C O 2 e were considered, i.e., {0.42, 0.21, 0} kg/kWh [64], which indicate the amount of emission per unit of electrical energy production with the current energy mix ( C O 2 curr ), future mid-term energy mix ( C O 2 inter ), and future long-term energy mix ( C O 2 renw ), where all the electrical energy is produced by renewable sources [67,68]. As proposed in Figure 8, in no case will the hybrid–electric m fb -optimised aircraft lead to reductions in CO 2   curr , and rather introduce worsening effects for ranges above 200 nm. Some advantage in terms of a noticeable cut in emissions is obtained in the intermediate scenario ( CO 2   inter ), but only for routes equal or lower than 400 nm; it is only in the case where electricity generation is entirely converted to renewables that the introduction and optimisation of a hybrid–electric aircraft can actually introduce significant cuts in CO 2   renw emissions, with a trend essentially identical to that of m fb . Furthermore, the introduction of additional and technologically advanced components such as electric power systems and batteries, and the related increase in the MTOW for m fb -optimised solutions, also introduces significant drawbacks in terms of DOC, in respect of which full-thermal configurations are in any case more favourable.
Finally, a comment on the energy efficiency of hybrid–electric aircraft is proposed. As described in [28,59,69], the use of electrical power to meet part of the required power for the flight introduces two different contributions that impact the mission energy demand. On the one hand, electrical power systems are much more efficient than thermal ones, and a higher electrical power supply allows for less powertrain losses and consequently for a reduction in the energy required to fly, while the increase in weight due to the presence of batteries makes the flight more energy-demanding. In the considered cases, for routes up to 400 nm, the total increase in powertrain efficiency reduces the energy demand of the mission, which instead becomes larger than the full-thermal aircraft in the 600 nm and 800 nm cases, where the MTOW increase becomes preponderant; see Figure 8. This specific trend also reflects on the value of PREE.
This framework allows us to extract some general considerations that will affect the design and utilisation of a hybrid–electric regional aircraft. First, as is already recognised in the literature concerning the low gravimetric energy density of batteries, there is a clear contrasting trend between m fb and the MTOW. In particular, if fuel consumption during the mission is to be minimised, it is inevitable to foresee even marked increases in aircraft weight with respect to the state of the art, thus leading to the conception of aircraft categories, design models, and manufacturing practices that may be very different from the current established know how. In addition, based on current technological forecasts, it is also reasonable to expect a change in the economic scenario, in which the operating costs of aircraft are higher than the current standards. The latter point, however, is very sensitive to the actual development that hybrid–electric technology will have in the future and is variable depending on both the cost-cutting that the industry will be able to propose and on the new possible taxation schemes that may be introduced in relation to climate-changing emissions [64,65,66,67,68,69,70,71]. Secondly, it clearly emerges that the only technology transition of the aircraft towards power electrification is not at all sufficient if it is not coupled with a radical change at the overall system level, focused on electricity production based strictly on renewables. Finally, it also emerges that, even in this scenario, the impact that such technology can have at a general level is intrinsically very limited, since appreciable benefits in terms of CO 2 reductions can only be achieved for short distances, up to 600 nm. A marked breakthrough in the technological development of batteries, with the aim of drastically increasing their BED value, is therefore of fundamental importance for the success of hybrid–electric propulsion in future commercial aviation.

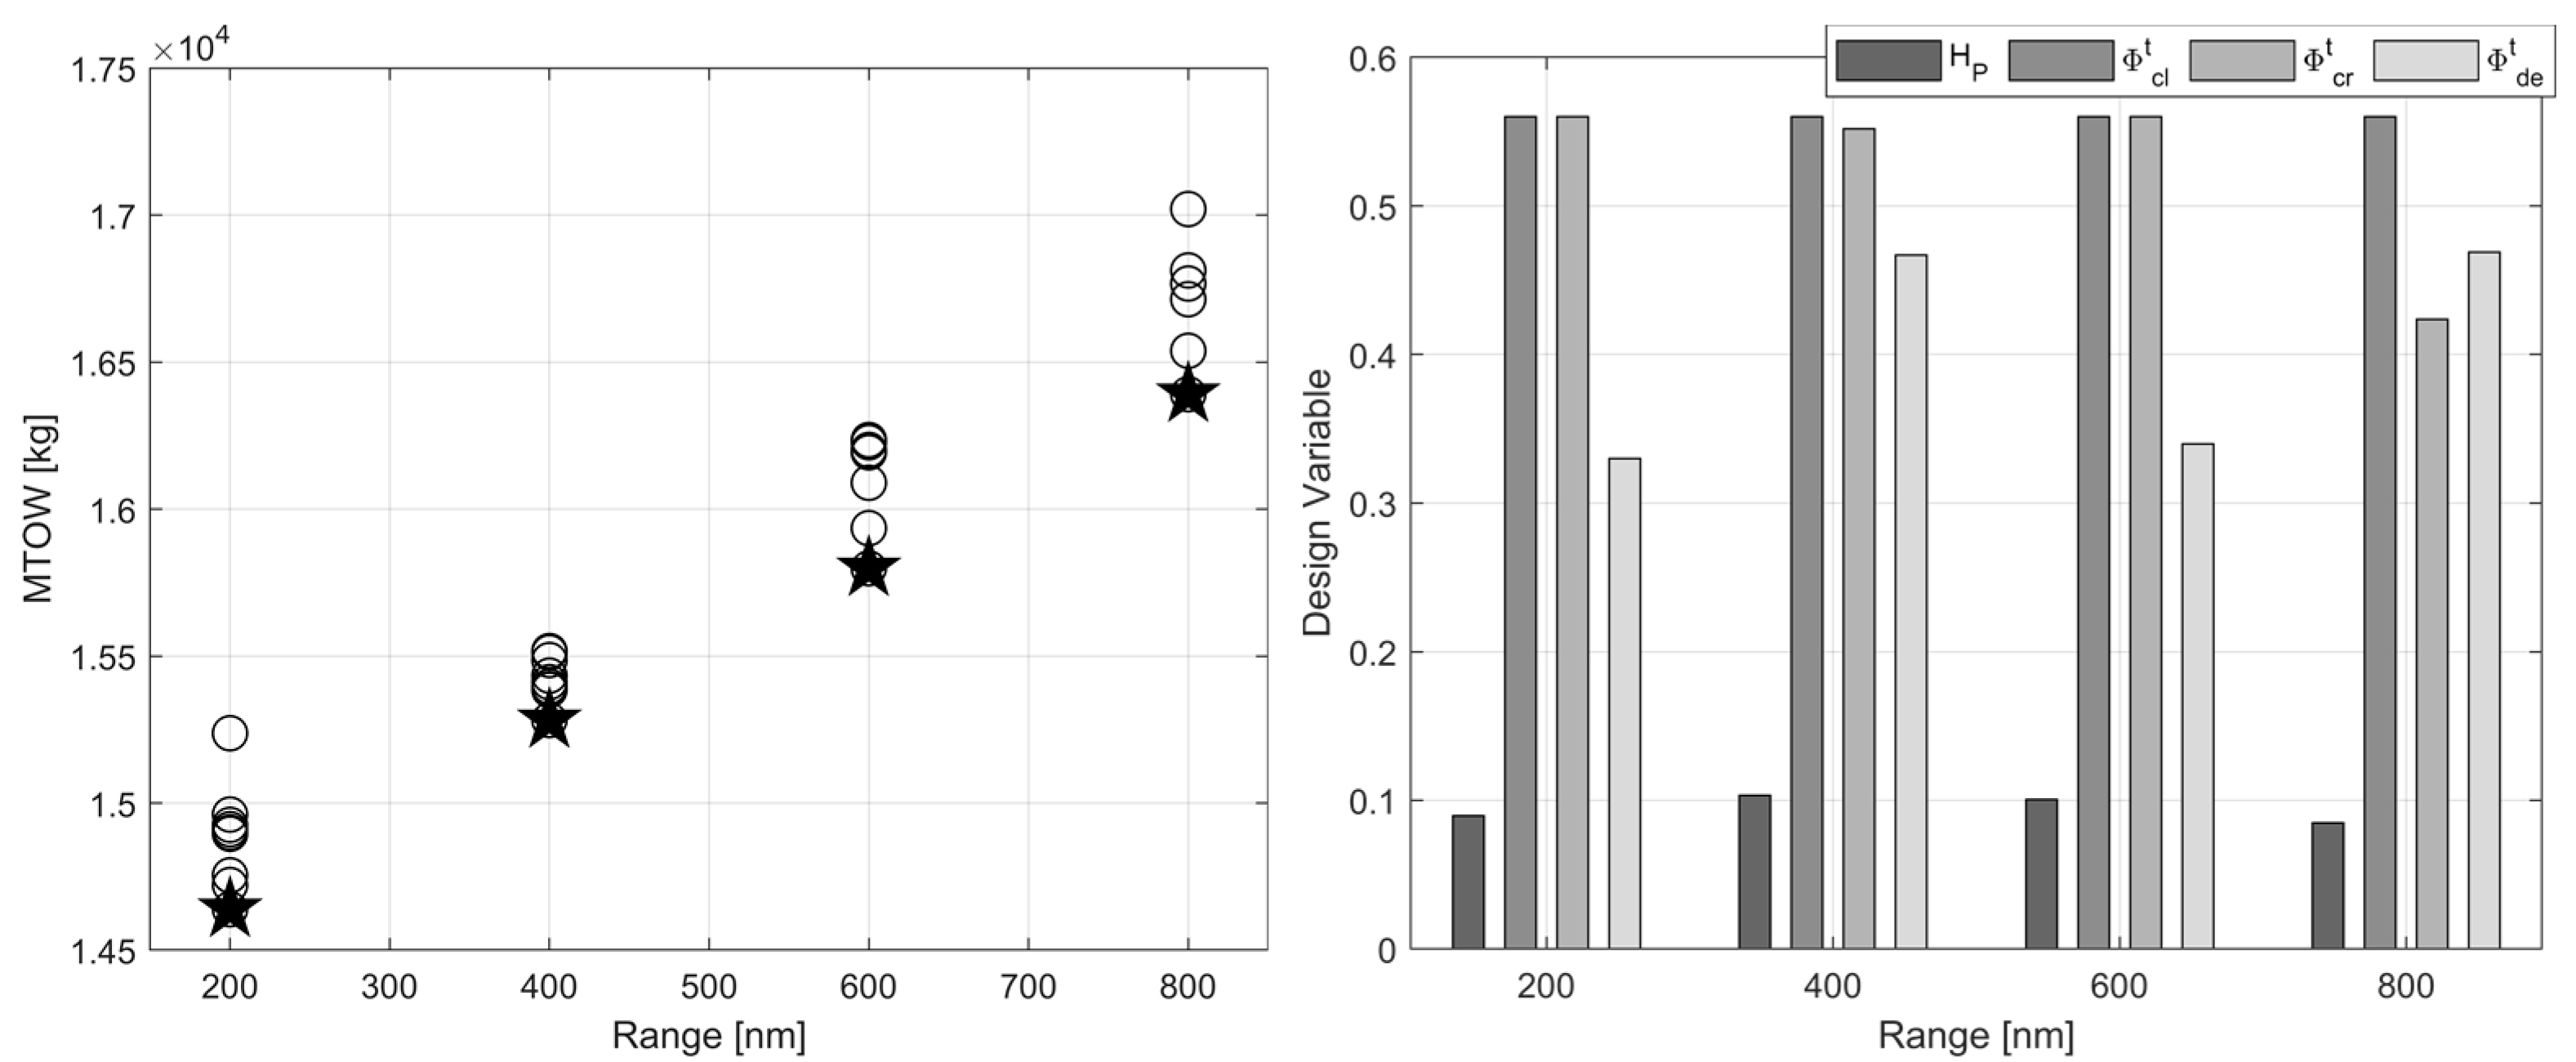
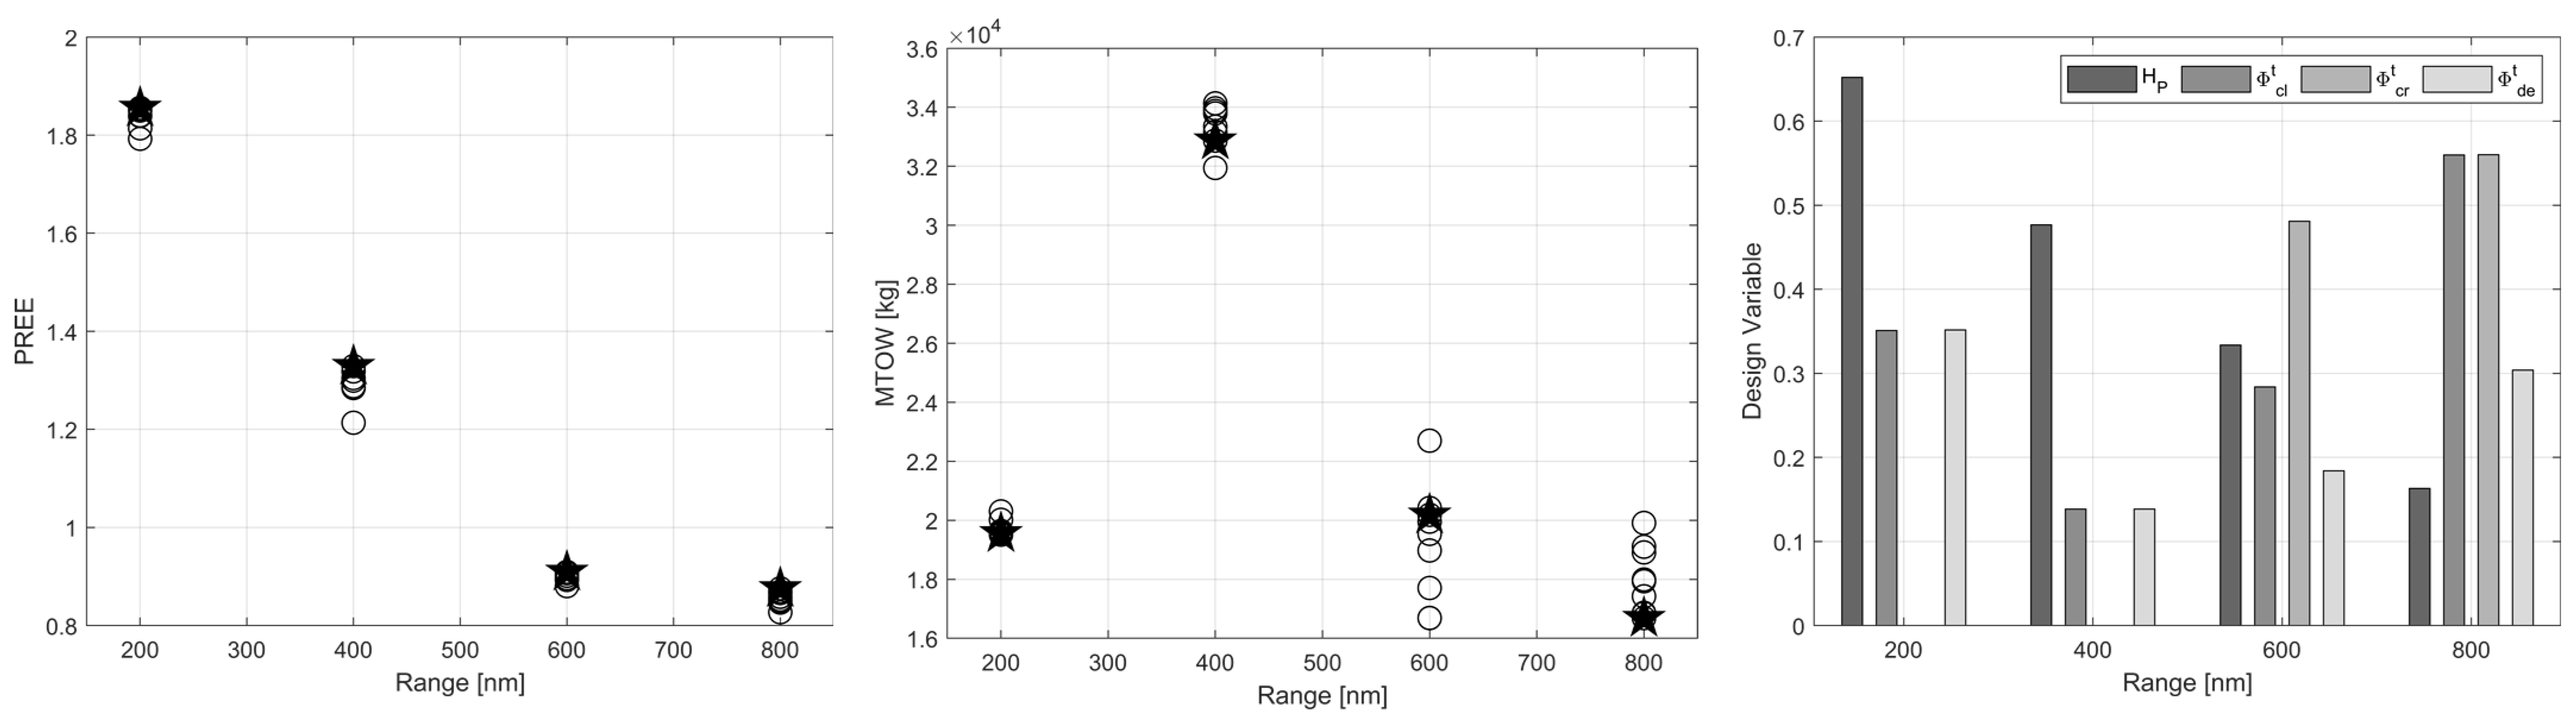
3.2. Maximum Take-Off Weight

In this section, results for optimisations where the FoM is set equal to the MTOW are proposed and discussed. The left part of Figure 9 shows the optimal solutions as the range varies: the trend seems quite smooth as the mission length increases, and it is observed that the values found by the optimiser are very close to those of the full-thermal benchmark aircraft. From the analysis of the optimal design variables shown in the right part of Figure 9, it is visible that the optimiser searches for solutions that minimise the supply of electrical power during the mission. In fact, although the hybridisation factors do not reach zero due to the design choice of having a quota of electrical power to perform the ground mission phases (see Section 2.1), it can be observed that the thermal power fractions in the three mission phases (especially in the climb and cruise part of the mission) exhibit high values, suggesting that these fractions should coincide with those of the required power for the flight.
This hypothesis is verified by evaluating the time profile of power supply during the flight, for the four MTOW-optimised configurations, as shown in Figure 10. It is evident that in these cases, the electrical power supply is basically zero during the whole operating mission, and only thermal power is used to satisfy the required power constraint. The latter is not an unexpected result, since the integration of electrical power systems (especially the related energy storage systems) leads to significant weight increases, which noticeably deteriorate the current value of the FoM.
This can also be seen when considering the amount of energy sources on board, which are almost coincident with the thermal source, as shown in the middle and right part of Figure 11, while a small fraction of electrical installed power (see the left part of Figure 11) is required for ground manoeuvres as, for example, the taxiing.
Given this conceptual analysis, it is rather apparent that a general paradigm shift is necessary when dealing with advanced concepts in order to achieve radical gains, thus involving new figures of merit or new design strategies. In the case of conventional aircraft, MTOW is traditionally considered to be a general FoM, that if minimised leads to benefits in terms of cost and fuel consumption. However, this assumption is not necessarily true when it comes to innovative aircraft, as when considering hybrid–electric aircraft, the minimisation of the MTOW does not correspond to the conditions of minimum fuel consumption. This “apparent paradox”, as also recently discussed in [32], is a basic premise when dealing with a paradigm shift to develop breakthrough aircraft concepts.

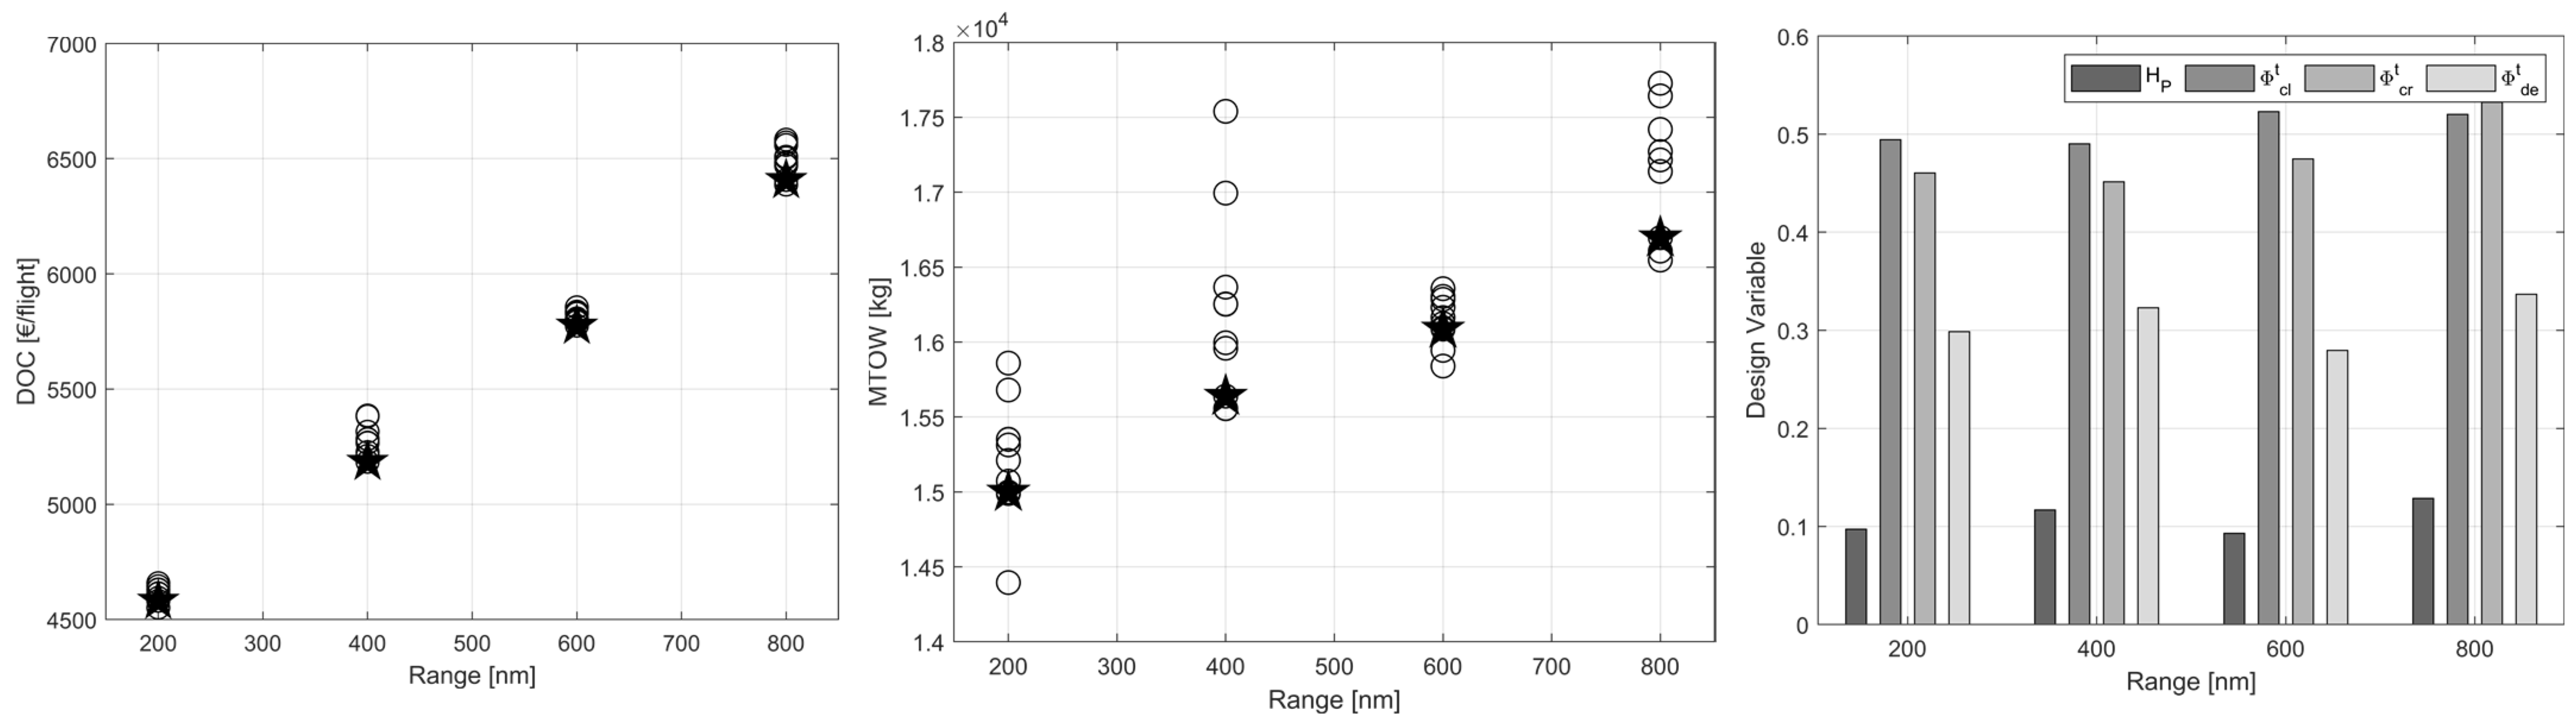
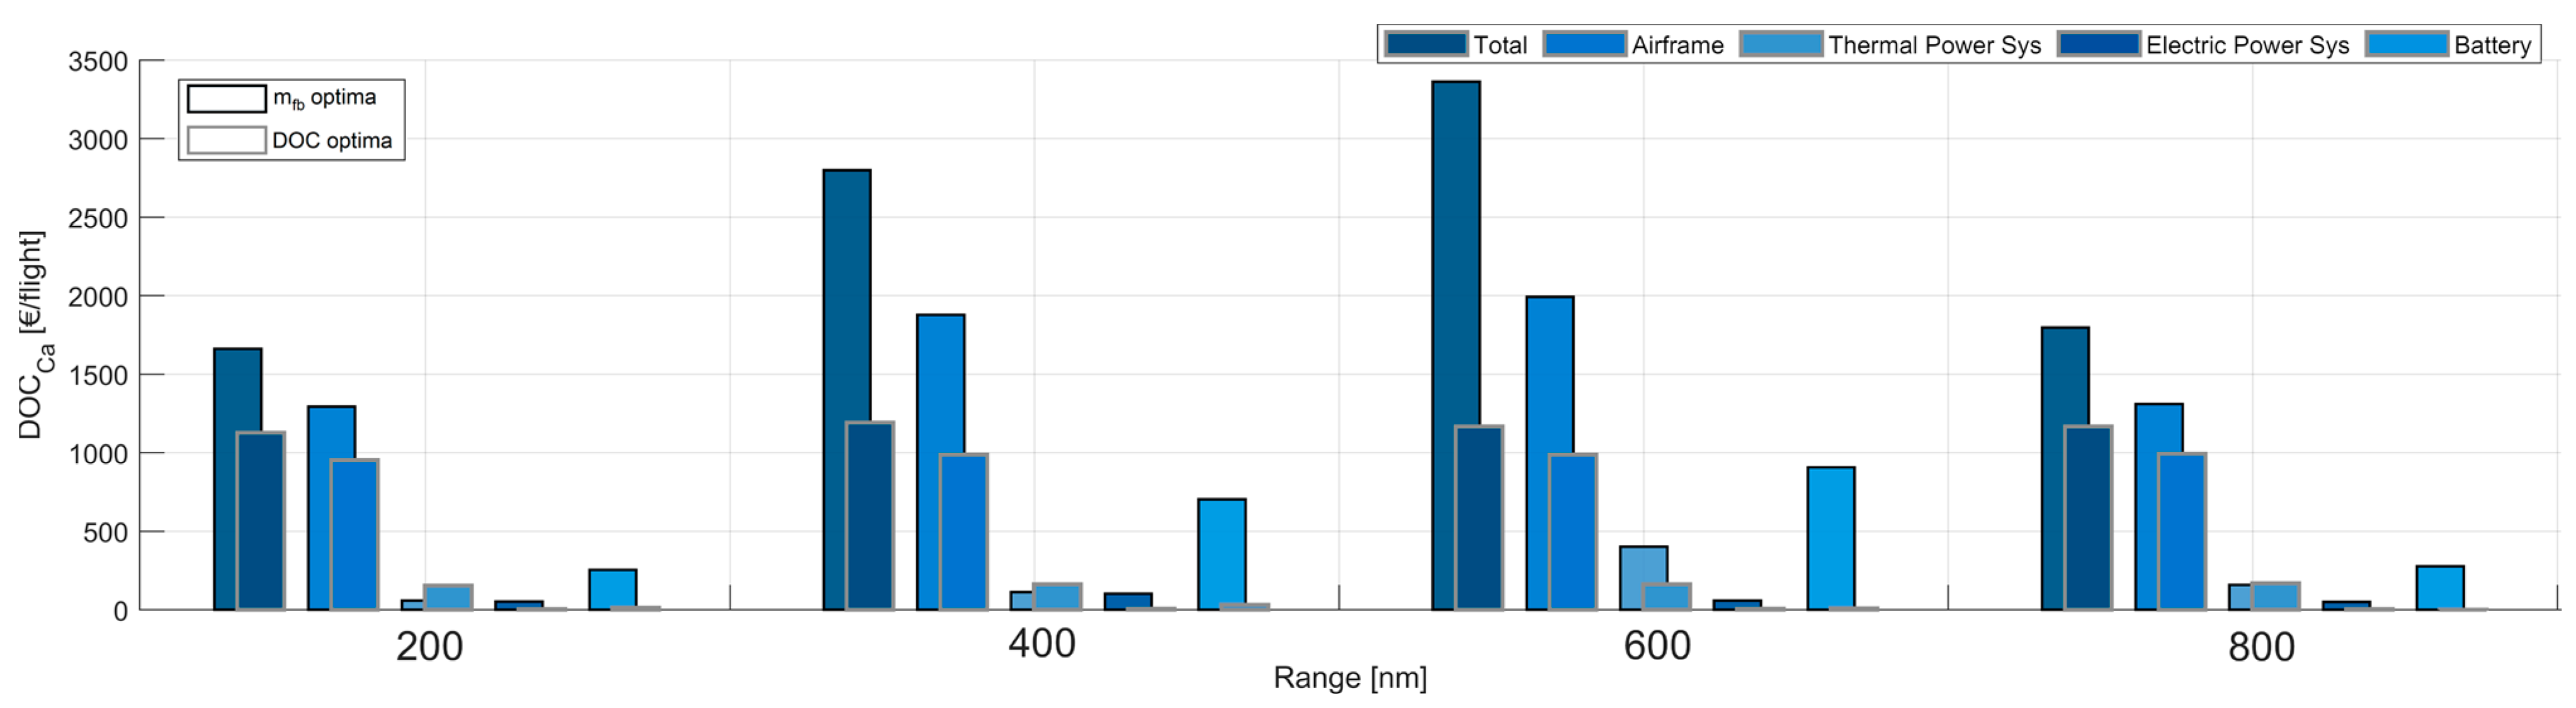
3.3. Direct Operating Costs
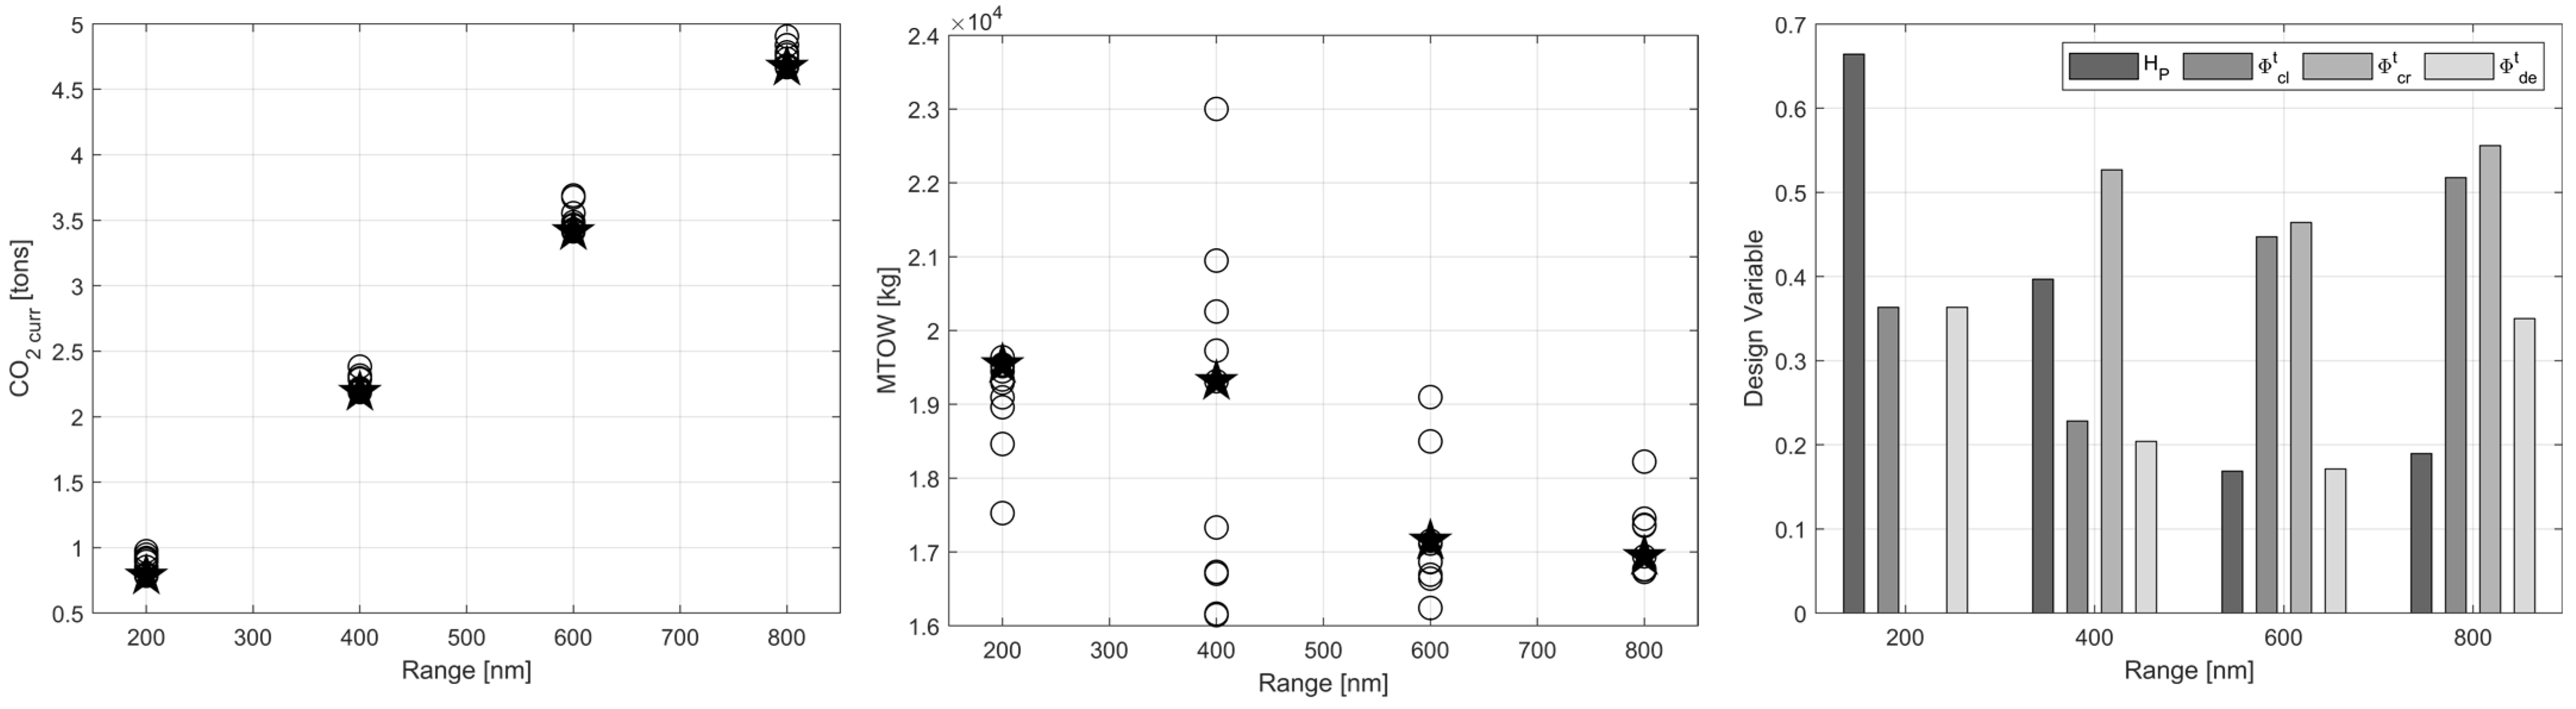
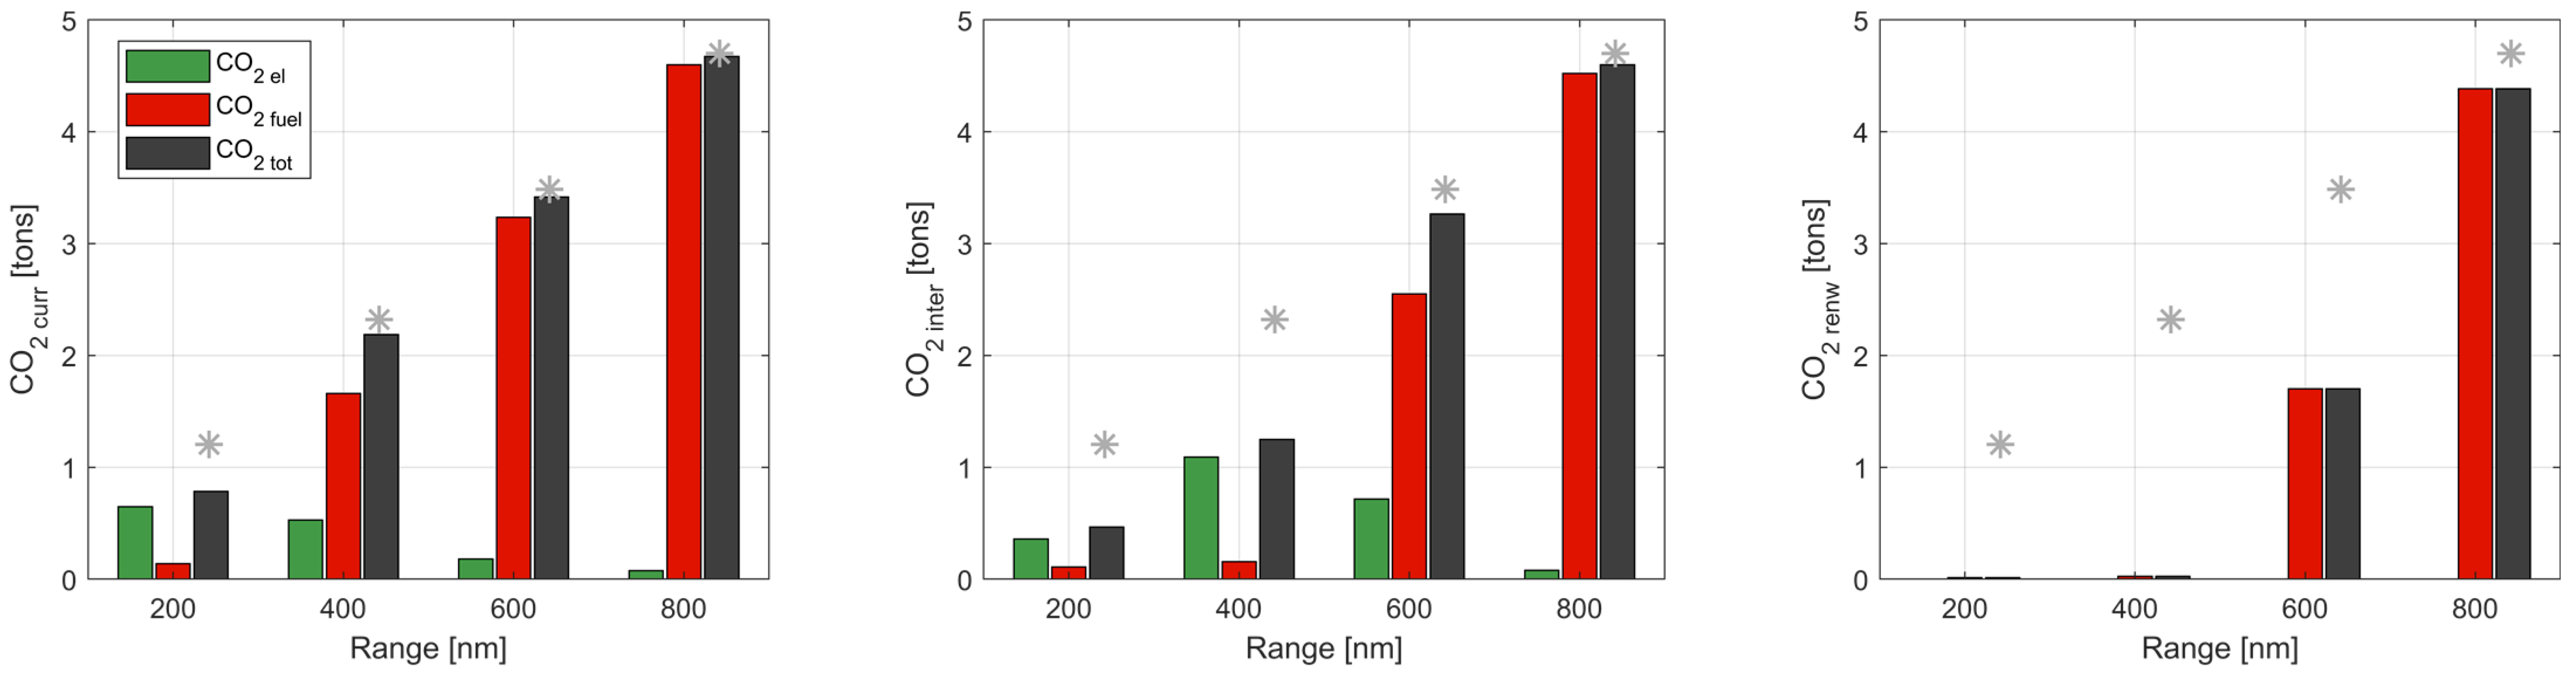
This section proposes the results of optimisations in which the DOCs are set as the objective function. According to the model proposed in Section 2.2 and taken from [64], the cost related to the electrical components are considered in the DOC Ca term, which is overall evaluated by Equation (6):
DOC Ca = ( a + f ) i V i p i   1 + k i
where V i , p i , and k i are the reference quantity, the related price, and the spare factor of the i-th components (as reported in Table 4), respectively.
The parameter a is the annuity factor and is computed according to Equation (7); f is the insurance rate and is assumed equal to 0.05, as reported in [72].
a = i r 1 r v 1 1 + i r t dp 1 1 1 + i r   t dp
i r , r v and t dp are the interest rate, the residual value, and the depreciation time, respectively. Their values are reassumed in Table 5, and t dp , for the battery pack, is evaluated as
t dp , b = N b n c N f
where N f = 2190 is the number of flights per year, N b = 3 is the number of battery packs to accomplish six flights per day, and nc = 1500 is the number of cycles for each battery pack [64].
The left part of Figure 12 shows the values of the optimised DOC as the range varies, while the middle part of Figure 12 shows the correlated MTOW value. Both trends are very similar to what was observed in Section 3.2 regarding MTOW-optimised configurations, i.e., even when DOCs are considered as design drivers, the optimiser tends to identify solutions that minimise power hybridisation and thus tends towards a full-thermal solution. The analysis of the DVs, illustrated in the right part of Figure 12, shows that the optimiser finds all configurations that supply high fractions of thermal power during the mission, while the hybridisation factor is very low, consistent with the power requirements for ground manoeuvres. In Figure 13, the representation of the time profile of the thermal and electrical power supply confirms that if DOCs are to be minimised, it is necessary to minimise the use of electrical power, that is, all power demand during the mission must be met through the thermal power supply.
This is achieved for two interconnected factors: on the one hand, hybrid–electric propulsion introduces additional cost items related to the implementation of new components, such as electric motors and batteries; on the other hand, batteries, as well as exhibiting a significant mass, introduce snowball effects on the increase in the aircraft empty operating weight W oe , and this raises the costs related to the acquisition and operation of the aircraft. In fact, the numerical optimiser searches for solutions tending towards the elimination of the electrical share of the powertrain. Figure 14 shows the comparison between the m fb -optimised and DOC-optimised configurations of the breakdown of capital costs DOC Ca [64,65,73], divided into items relating to the airframe, thermal power systems, electrical power systems, and batteries. It can be observed that in all cases, but especially for configurations designed on 400 nm and 600 nm routes, DOC Ca is much higher for m fb -optimised configurations, for which the presence and use of electric power is predominant; see Section 3.1. In particular, the costs associated with the airframe, and dependent on the W oe , and the cost of the batteries have a very significant impact on the DOC Ca total. It can be observed that on the shorter distances, for the m fb -optimised configurations, the introduction of electric power relieves the costs associated with the thermal propulsion, but in any case, to an insignificant proportion on the overall computation.
The increase in the MTOW also impacts the operating fees DOC Fe , especially landing and navigation charges, while for the m fb -optimised one, the higher W oe also introduces cost penalties regarding the maintenance of DOC Ma . A general overview of the comparison of the different DOC items for the two optimisation sets is proposed in Figure 15, where it is observed that the total DOCs of the DOC-optimised configurations tend to be in line with the values of the full-thermal benchmark, highlighted with a yellow star marker.

3.4. CO2 Emissions

This section presents the results for hybrid–electric configurations optimised to minimise CO 2 emissions. In particular, three different scenarios are considered: (i) the current scenario, in which electricity production is based on the current mix of energy sources, with the related indirect CO 2 emission contribution ( C O 2 e = 0.42 kg/kWh); (ii) an intermediate scenario, in which an increase in the share of renewable sources is considered in the electricity production mix, with a CO 2 emission contribution of C O 2 e = 0.21 kg/kWh; and (iii) an advanced scenario for which all electricity is produced from renewable sources, and thus with no contribution to indirect CO 2 emissions. The three scenarios adopted in this work consider the data detailed in [64].
The main results relating to the current scenario are shown in Figure 16, where the left part shows the values of the objective function CO 2   curr , which grows quite linearly as the range varies, whereas the middle part provides the MTOW values for the optima configurations. The analysis summarised in the middle plot of Figure 16 suggests some considerations on the actual use of hybrid propulsion for the optima configurations. First, it can be observed that for the 200 nm design range, the optimum is towards a higher MTOW, thus presumably to solutions with a larger use of batteries, while the 400 nm solutions present a wide scatter in terms of the MTOW, thus offering a multiplicity of very different solutions in terms of hybridisation, but with outputs in terms of CO 2   curr quite comparable. As the range increases, the optimal solution tends towards the lowest MTOW. The analysis of the optimum DVs, shown in the right part of Figure 16, confirms what has been anticipated, that is, that the use of electric power introduces benefits in terms of CO 2   curr only in the short-range case (namely 200 nm), where H P is high and the cruise phase is carried out using electric power only. An intermediate scenario can be found for the 400 nm case, while the numerical optimiser tends towards the maximum use of thermal power for the 600 nm and 800 nm sections.
This is confirmed by the time profiles of the power supply during the mission (see Figure 17), which show the largest share of electrical power supplied in the standard mission in the 200 nm case, a smaller contribution of electrical power (especially during cruise phase) in the 400 nm case, and practically a negligible utilisation of electric power in longer-distance cases, such that the result can also be deduced from the breakdown of the on-board power and energy sources of the optimised configurations (see Figure 18).
In particular, it is observed that the mass of batteries decreases significantly with range. This happens for two reasons, both of which have an impact on the considered FoM. First, increasing the range implies increments in the mission energy demand, which, if matched with only batteries, would still result in a non-negligible share of indirect CO 2 emissions in the current scenario. Second, and more relevant, given the low gravimetric energy density of the batteries, this would result in very significant increases in aircraft weight, which would lead to a snowball increase in the energy demand for flight, and therefore in the share of indirect emissions.
With the current electricity production scenario, therefore, excluding very short routes, hybrid–electric propulsion does not seem to be an effective solution to provide a significant contribution to reduce CO 2 emissions from the regional sector.
Considering an intermediate scenario, in which the expansion of the use of renewable sources for electricity production halves CO 2 emissions compared to the current scenario, the results in terms of the optimisation of regional hybrid–electric aircraft show some differences. Figure 19 shows the results of optimised aircraft considering CO 2   inter as FoM. The analysis of the MTOW of the optima configurations (middle part of Figure 19) suggests that consistent hybridisations are suitable for minimising CO 2   inter in the 200 nm and 400 nm cases, while a situation with quite mixed solutions occurs in the 600 nm case, moving back towards solutions closer to the full-thermal case for the longest of the ranges considered. This is evident from the optima DVs in Figure 19(right), where H P is high for the two shortest ranges, for which the cruise phase is performed with only electrical power.
The representation of the time profiles of the power supply, depicted in Figure 20, shows that the 600 nm case exhibits a rather mixed supply in the standard mission, while the electric power supply is practically negligible in the 800 nm case.
Figure 21 shows the installed power (left), the breakdown of energy output for the mission (centre), and the mass of energy sources on board (right). Also from these data, it can be seen that power electrification is of key relevance towards the lowest CO 2   inter solutions in the 200 nm and 400 nm cases, while it becomes progressively less effective as the range increases.
However, in order to assess the actual effectiveness of this technology in terms of overall climate impact reduction, it is necessary to quantify the impact that optimal solutions have in absolute terms of CO 2 emission reductions compared to the state of the art. To do this, it is worthwhile assessing the actual reductions, if any, introduced by the adoption of the regional hybrid–electric optimal solutions in comparison to the full-thermal competitors. Figure 22 shows the outputs in terms of CO 2 emissions, divided between those deriving from in-flight fuel combustion and those indirectly deriving from electricity production, in the current (left), intermediate (middle), and fully renewable-based (right) scenarios. In particular, the latter scenario coincides with the one previously discussed in Section 3.1, i.e., the one related to the minimisation of block fuel, as there are no CO 2 emissions correlated with electricity production and supply. Analysing the outcomes presented in Figure 22, in which the CO 2 values related to the thermal benchmark (see Section 2.2) are highlighted with a grey star marker, it can be deduced that in the current case (left part of Figure 22), very limited benefits are obtained from the introduction of hybrid–electric propulsion only for very short routes, and in any case not significant enough to justify the introduction of this technology; for longer routes, the solution with the lowest emissions is almost coincident with the state of the art based on thermal propulsion. In the case of the intermediate scenario (middle part of Figure 22), the reduction in CO 2 emissions resulting from the partial electrification of installed power begins to be more pronounced, but only for distances of less than 400 nm. In a scenario in which electricity generation is based exclusively on renewable sources (right part of Figure 22), an almost complete cut in CO 2 emissions up to 400 nm can be achieved, a halving of emissions for the 600 nm route, while no benefits are obtained for longer routes, where once again the state-of-the-art solution seems to be the least emitting one.
This scenario, although conceptual, shows how introducing hybrid–electric propulsion, based on currently available battery technology forecasts, does not by itself lead to the desired and necessary environmental benefits being achieved in the near future in the regional sector. Short and extra-short routes may be more favourable for achieving reductions in CO 2 emissions, but if a noticeable benefit is to be obtained from the introduction of this technology, a radical transformation of the overall energy system is required, in which the conversion of electricity production shifts rapidly towards a scenario based exclusively on renewable sources.

3.5. Value of PREE

The latest FoM used as an objective function to optimise regional hybrid–electric aircraft is the payload-range efficiency PREE, which quantifies the aircraft energy efficiency in terms of operating performance (payload transported and distance flown) per energy spent. This metric is traditionally considered as general and overarching of aircraft performance [69,74,75], especially during the conceptual design phase. Figure 23 shows the results for PREE-optimised configurations. Very high PREE values are obtained for short routes, gradually decreasing with range (see the left part of Figure 23). At short routes, it can be deduced that the numerical optimiser seeks solutions with high power hybridisation, as evident from the high MTOW values at 200 nm and 400 nm (middle part of Figure 23), and the DV values shown in the right part of Figure 23, where the fraction of thermal power supplied in cruise is zero. As the range increases, the hybridisation of the installed power gradually has a lower impact. This is also evident from the analysis of the time profiles of the power supply during the mission, shown in Figure 24.
Figure 25 shows the values of the different FoMs for the PREE-optimised and m fb -optimised configurations; the values are also compared with the corresponding ones of the full-thermal configurations, indicated with red star markers. While some similarities can be found between the outcomes of the m fb -optimised and PREE-optimised configurations, it is more pertinent to highlight the substantial differences, which may determine whether one FoM or the other should be selected as the driver of the conceptual design. In particular, PREE-optimised configurations, for short distances up to 400 nm, similarly tend to minimise mission fuel consumption, but compared to m fb -optimised configurations, they supply a non-negligible fraction of thermal power in climb (compare Figure 5 with Figure 23 (right), and Figure 6 with Figure 24). This power supply strategy allows for a reduction in the energy required for flight by finding the proper trade-off between the increase in the powertrain efficiency (due to electrical power supply) and the increase in the MTOW (due to the presence of batteries), and thus to achieve higher PREE than the m fb -optimised configuration, at the expense of slightly higher m fb consumption.
Still considering short routes, however, it is observed that even the PREE-optimisation strategy does not lead to cost savings compared to full-thermal benchmarks. In any case, for both optimisation sets, if the electricity production scenario remains the current one, the introduction of the hybrid–electric propulsion does not lead to any benefit in terms of CO 2 emission reductions. In the CO 2   renw scenario, on the other hand, substantial benefits are observed for both optimisation sets, where the PREE-optimised configurations show a slightly higher contribution to emissions with respect to the m fb -optimised configuration, but at the expense of a lower MTOW and costs.
On the other hand, the differences between the two groups of optimised configurations become more pronounced for the 600 nm and 800 nm routes. In fact, the optimisation of the PREE, and thus of the mission’s energy demand, in these cases leads to a much more pronounced trade-off between the electrical power supply and weight increase, resulting in a very small fraction of electrical power supplied in the case of 600 nm and practically negligible in the case of 800, differently from the corresponding m fb -optimised configuration; compare Figure 6 and Figure 24 in this regard. For these routes, therefore, the PREE-optimised configurations tend towards solutions closer to the full-thermal ones, and even in the CO 2   renw scenario, lead to very limited emission reductions in the 600 nm case, and are practically negligible in the 800 nm case. On the other hand, it was previously seen that, at least in the 600 nm case, optimising the hybrid–electric aircraft with respect to m fb can lead to cuts in CO 2   renw emissions of up to 50% compared to the current scenario.
This scenario leads to a reconsideration of the use of PREE as FoM for the conceptual development of novel aircraft. Indeed, the PREE can certainly be considered a comprehensive FoM when it comes to analyse and design the aircraft developed according to the canonical and established methods and technologies, but in breakthrough scenarios it can lead to misjudgements in the overall performance assessment. In fact, in a scenario where it is necessary to cut CO 2 emissions through the introduction of hybrid–electric propulsion, optimising the PREE may overshadow the inevitable trade-off between the need to increase the weight and flight energy demand and to cut fuel consumption.

3.6. Limitations of the Approach

The analysis of the results presented in Section 3 provides a conceptual but insightful overview of the influence of the choice of FoMs on the design of regional hybrid–electric aircraft. However, some considerations regarding the limitations of the approach used in this context are worthwhile. Indeed, a comprehensive study should include further FoMs that are crucial in the development of the regional hybrid–electric aircraft concept. For example, noise emissions around airports is among the most important metrics in the design of next-generation aircraft, and hybrid–electric solutions could be candidates to introduce benefits in this regard [76,77]. However, reliable and applicable models are not yet available in the very early stages of the aircraft design process, and the application of advanced and computationally expensive models is therefore not viable. The same issue is found for non- CO 2 emissions, for which some extrapolations from models found in the literature [78,79,80] can be made, but without the proper validations, there could be considerable errors in the overall estimations; it was therefore considered opportune to postpone these aspects to subsequent and more detailed studies.
The potential integration of combined innovations between hybrid–electric propulsion and airframe-related technologies could also affect the results commented on for traditional tube-and-wing. The introduction of structural and aerodynamic technological advancements [81,82] or even the integration of radical innovative lifting architectures [83,84,85,86] could introduce significant performance advantages for hybrid–electric aircraft. Such aspects have in fact already been anticipated in the recent literature [28,44,66,87], indicating that comprehensive technological development must be envisaged at the overall aircraft level if radical gains are to be achieved.

4. Conclusions

The selection of a specific figure of merit as the objective function in the aircraft design and optimisation process significantly impacts the results. Distinct figures of merit steer the design solution towards configurations that may exhibit significantly different features. This may be particularly evident when addressing novel concepts and exploring innovative breakthrough solutions, as for the case of the hybrid–electric aircraft. This paper addressed this topic by discussing the results of conceptual design and performance analysis of different regional hybrid–electric aircraft designs carried out by following different figures of merit, such as block fuel, maximum take-off weight, direct operating costs, CO 2 emissions, and flight energy-efficiency.
The challenge of determining the proper figures of merit for guiding innovative solution designs is a complex task. In conventional aircraft design, the experience accumulated through decades of traditional aircraft development has led to a deep comprehension of the interrelations between performance metrics and design parameters. For non-conventional solutions, on the other hand, the use of the same figures of merit can lead to designs that do not satisfy the qualitative and quantitative requirements for which the innovation has been investigated. In this work, it is clearly outlined that, as the hybrid–electric powertrain technology is investigated to reduce aviation environmental impact, minimizing metrics such as the MTOW or DOC do not lead to any significant emission reductions with respect to the state of the art. Using block fuel as a metric to optimize the aircraft leads to solutions with a considerably higher MTOW with respect to the state-of-the-art full-thermal benchmarks; in this case, however, some beneficial effects in terms of CO 2 emissions reduction can be envisaged, especially on short routes. But only introducing technological innovations at the aircraft level is not sufficient; indeed, if the current electricity production scenario, which is strongly based on fossil sources, is maintained, providing reductions in in-flight fuel burnt by means of battery usage is practically useless at an overall CO 2 emissions budget assessment. Only if the whole system will change, starting from a deep transition towards electricity production based only on renewable sources, introducing partial electrification of aircraft power, can this be significant towards CO 2 emission reductions. It is worth highlighting that these gains are possible only for short ranges and small-sized aircraft, typical of the regional market sector. Furthermore, to achieve this environmental benefit, penalisations in terms of cost, energy efficiency, and weight should be considered.
To expand this study to a more comprehensive scenario, it is worth including in the future assessments regarding noise emissions, non- CO 2 emissions, ground operations constraints, and certification requirements; to date, this limit is represented by the unavailability of tools and models capable of introducing these aspects in the very early stages of aircraft design.

Author Contributions

Conceptualisation, K.A.S., G.P. and A.A.Q.; methodology, G.P. and K.A.S.; software, G.P. and K.A.S.; formal analysis, K.A.S. and G.P.; investigation, G.P. and K.A.S.; data curation, G.P. and K.A.S.; writing—original draft preparation, K.A.S. and G.P.; writing—review and editing, A.A.Q.; visualisation, G.P. and K.A.S.; supervision, A.A.Q. All authors have read and agreed to the published version of the manuscript.

Funding

This research received no external funding.

Data Availability Statement

The data presented in this study are available on request from the authors.

Conflicts of Interest

The authors declare no conflict of interest.

References

  1. Petrescu, R.V.V.; Aversa, R.; Akash, B.; Bucinell, R.; Corchado, J.; Berto, F.; Mirsayar, M.; Apicella, A.; Petrescu, F.I.T. History of aviation—A short review. J. Aircr. Spacecr. Technol. 2017, 1, 30–49. [Google Scholar] [CrossRef]
  2. Grant, R.G. Flight: The Complete History of Aviation; Dorling Kindersley Ltd.: London, UK, 2017; ISBN 978-0241298039. [Google Scholar]
  3. Bruggeman, A.M.; La Rocca, G. From Requirements to Product: An MBSE Approach for the Digitalization of the Aircraft Design Process. INCOSE Int. Symp. 2023, 33, 1688–1706. [Google Scholar] [CrossRef]
  4. Reitenbach, S.; Vieweg, M.; Becker, R.; Hollmann, C.; Wolters, F.; Schmeink, J.; Otten, T.; Siggel, M.; Silberhorn, D.; Arzberger, M.J.; et al. Collaborative aircraft engine preliminary design using a virtual engine platform, Part A: Architecture and methodology. In Proceedings of the AIAA Scitech 2020 Forum, Orlando, FL, USA, 6–10 January 2020. [Google Scholar]
  5. Fioriti, M.; Boggero, L.; Prakasha, P.; Mirzoyan, A.; Aigner, B.; Anisimov, K. Multidisciplinary aircraft integration within a collaborative and distributed design framework using the AGILE paradigm. Prog. Aerosp. Sci. 2020, 119, 100648. [Google Scholar] [CrossRef]
  6. Aydemir, H.; Zengin, U.; Durak, U.; Glaessgen, E.; Stargel, D.; Brown, M.; Kearney, M.W.; Giaretta, D.; Garrett, J.; Hughes, S.; et al. The digital twin paradigm for aircraft review and outlook. In Proceedings of the AIAA Scitech 2020 Forum, Orlando, FL, USA, 6–10 January 2020. [Google Scholar]
  7. Leyman, C. Case Study by Aerospatiale and British Aerospace on the Concorde; American Institute of Aeronautics and Astronautics (AIAA): Reston, VA, USA, 1980; ISBN 9781563473081. [Google Scholar]
  8. Aprovitola, A.; Dyblenko, O.; Pezzella, G.; Viviani, A. Aerodynamic Analysis of a Supersonic Transport Aircraft at Low and High Speed Flow Conditions. Aerospace 2022, 9, 411. [Google Scholar] [CrossRef]
  9. Marsh, G. Airbus A350 XWB update. Reinf. Plast. 2010, 54, 20–24. [Google Scholar] [CrossRef]
  10. Lu, B.; Wang, N. The Boeing 787 Dreamliner, designing an aircraft for the future. J. Young Investig. 2010, 34, 4026. Available online: https://www.jyi.org/2010-august/2010/8/6/the-boeing-787-dreamliner-designing-an-aircraft-for-the-future (accessed on 14 October 2023).
  11. Norris, G.; Wagner, M. Airbus A380: Superjumbo of the 21st Century; Zenith Imprint: Le Locle, Switzerland, 2005; ISBN 978-0760322185. [Google Scholar]
  12. Guida, M.; Marulo, F.; Abrate, S. Advances in crash dynamics for aircraft safety. Prog. Aerosp. Sci. 2018, 98, 106–123. [Google Scholar] [CrossRef]
  13. Lee, H.; Li, G.; Rai, A.; Chattopadhyay, A. Real-time anomaly detection framework using a support vector regression for the safety monitoring of commercial aircraft. Adv. Eng. Inform. 2020, 44, 101071. [Google Scholar] [CrossRef]
  14. Simpson, T.W.; Allen, J.K.; Mistree, F.; Chen, W. Designing Ranged Sets of Top-Level Design Specifications for a Family of Aircraft: An Application of Design Capability Indices. In Proceedings of the SAE World Aviation Congress and Exhibition, Anaheim, CA, USA, 13–16 October 1997; p. 975513. [Google Scholar] [CrossRef]
  15. Anton, E.; Lammering, T.; Henke, R. Fast estimation of top-level aircraft requirement impact on conceptual aircraft designs. In Proceedings of the 10th AIAA Aviation Technology, Integration, and Operations Conference, Fort Worth, TX, USA, 13–15 September 2010. [Google Scholar] [CrossRef]
  16. Karpov, A.; Nesterenko, B.; Ovdienko, M.; Varyukhin, A.; Vlasov, A. Development of top-level requirements for regional aircraft based on the needs of the Russian market. In IOP Conference Series: Materials Science and Engineering; IOP Publishing: Bristol, UK, 2021; Volume 1024, p. 012070. [Google Scholar] [CrossRef]
  17. Karagoz, E.; Reilley, K.A.; Mavris, D.N. Model-based approach to the requirements analysis for a conceptual aircraft sizing and synthesis problem. In Proceedings of the AIAA Scitech 2019 Forum, San Diego, CA, USA, 7–11 January 2019. [Google Scholar] [CrossRef]
  18. Peteilh, N.; Klein, T.; Druot, T.Y.; Bartoli, N.; Liem, R.P. Challenging top level aircraft requirements based on operations analysis and data-driven models, application to takeoff performance design requirements. In Proceedings of the AIAA Aviation Forum, Virtual Event, 15–19 June 2020. [Google Scholar] [CrossRef]
  19. Jensen, S.C.; Rettie, I.H.; Barber, E.A. Role of figures of merit in design optimization and technology assessment. J. Aircr. 1981, 18, 76–81. [Google Scholar] [CrossRef]
  20. Malone, B.; Mason, W.H. Aircraft concept optimization using parametric multiobjective figures of merit. J. Aircr. 1996, 33, 444–445. [Google Scholar] [CrossRef]
  21. Moebs, N.; Eisenhut, D.; Bergmann, D.; Strohmayer, A. Selecting figures of merit for a hybrid-electric 50-seat regional aircraft. In IOP Conference Series: Materials Science and Engineering; IOP Publishing: Bristol, UK, 2021; Volume 1024. [Google Scholar] [CrossRef]
  22. Pornet, C.; Kaiser, S.; Gologan, C. Cost-based flight technique optimization for hybrid energy aircraft. Aircr. Eng. Aerosp. Technol. 2014, 86, 591–598. [Google Scholar] [CrossRef]
  23. Megill, L.; Deck, K.; Grewe, V. A systematic approach to select a suitable climate metric for aviation policy and aircraft design. Res. Sq. 2023. in preprint. [Google Scholar] [CrossRef]
  24. Wang, Y.; Yin, H.; Zhang, S.; Yu, X. Multi-objective optimization of aircraft design for emission and cost reductions. Chin. J. Aeronaut. 2014, 27, 52–58. [Google Scholar] [CrossRef]
  25. Ilario da Silva, C.R.; Orra, T.H.; Alonso, J.J. Multi-objective aircraft design optimization for low external noise and fuel burn. In Proceedings of the 58th AIAA/ASCE/AHS/ASC Structures, Structural Dynamics, and Materials Conference, Grapevine, TX, USA, 9–13 January 2017. [Google Scholar] [CrossRef]
  26. Cai, Y.; Rajaram, D.; Mavris, D.N. Simultaneous aircraft sizing and multi-objective optimization considering off-design mission performance during early design. Aerosp. Sci. Technol. 2022, 126, 107662. [Google Scholar] [CrossRef]
  27. Thauvin, J. Exploring the Design Space for a Hybrid-Electric Regional Aircraft with Multidisciplinary Design Optimisation Methods. Ph.D. Thesis, Institut National Polytechnique de Toulouse, Toulouse, France, 2018. Available online: https://oatao.univ-toulouse.fr/23607/ (accessed on 14 October 2023).
  28. Abu Salem, K.; Palaia, G.; Quarta, A.A. Review of hybrid-electric aircraft technologies and designs: Critical analysis and novel solutions. Prog. Aerosp. Sci. 2023, 141, 100924. [Google Scholar] [CrossRef]
  29. Sahoo, S.; Zhao, X.; Kyprianidis, K. A Review of Concepts, Benefits, and Challenges for Future Electrical Propulsion-Based Aircraft. Aerospace 2020, 7, 44. [Google Scholar] [CrossRef]
  30. Brelje, B.J.; Martins, J.R. Electric, hybrid, and turboelectric fixed-wing aircraft: A review of concepts, models, and design approaches. Prog. Aerosp. Sci. 2018, 104, 1–19. [Google Scholar] [CrossRef]
  31. Marciello, V.; Di Stasio, M.; Ruocco, M.; Trifari, V.; Nicolosi, F.; Meindl, M.; Lemoine, B.; Caliandro, P. Design Exploration for Sustainable Regional Hybrid-Electric Aircraft: A Study Based on Technology Forecasts. Aerospace 2023, 10, 165. [Google Scholar] [CrossRef]
  32. Pornet, C.; Isikveren, A. Conceptual design of hybrid-electric transport aircraft. Prog. Aerosp. Sci. 2015, 79, 114–135. [Google Scholar] [CrossRef]
  33. Xie, Y.; Savvarisal, A.; Tsourdos, A.; Zhang, D.; Gu, J. Review of hybrid electric powered aircraft, its conceptual design and energy management methodologies. Chin. J. Aeronaut. 2021, 34, 432–450. [Google Scholar] [CrossRef]
  34. Platzer, M.F. A perspective on the urgency for green aviation. Prog. Aerosp. Sci. 2023, 141, 100932. [Google Scholar] [CrossRef]
  35. Lee, D.; Pitari, G.; Grewe, V.; Gierens, K.; Penner, J.; Petzold, A.; Prather, M.; Schumann, U.; Bais, A.; Berntsen, T.; et al. Transport impacts on atmosphere and climate: Aviation. Atmos. Environ. 2010, 44, 4678–4734. [Google Scholar] [CrossRef] [PubMed]
  36. Hasan, A.; Al Mamun, A.; Rahman, S.M.; Malik, K.; Al Amran, I.U.; Khondaker, A.N.; Reshi, O.; Tiwari, S.P.; Alismail, F.S. Climate Change Mitigation Pathways for the Aviation Sector. Sustainability 2021, 13, 3656. [Google Scholar] [CrossRef]
  37. Ficca, A.; Marulo, F.; Sollo, A. An open thinking for a vision on sustainable green aviation. Prog. Aerosp. Sci. 2023, 141, 100928. [Google Scholar] [CrossRef]
  38. Tasca, A.L.; Cipolla, V.; Abu Salem, K.; Puccini, M. Innovative box-wing aircraft: Emissions and climate change. Sustainability 2021, 13, 3282. [Google Scholar] [CrossRef]
  39. Jensen, L.L.; Bonnefoy, P.A.; Hileman, J.I.; Fitzgerald, J.T. The carbon dioxide challenge facing U.S. aviation and paths to achieve net zero emissions by 2050. Prog. Aerosp. Sci. 2023, 141, 100921. [Google Scholar] [CrossRef]
  40. Brdnik, A.P.; Kamnik, R.; Marksel, M.; Božičnik, S. Market and technological perspectives for the new generation of regional passenger aircraft. Energies 2019, 12, 1864. [Google Scholar] [CrossRef]
  41. Eisenhut, D.; Moebs, N.; Windels, E.; Bergmann, D.; Geiß, I.; Reis, R.; Strohmayer, A. Aircraft requirements for sustainable regional aviation. Aerospace 2021, 8, 61. [Google Scholar] [CrossRef]
  42. Palaia, G.; Zanetti, D.; Abu Salem, K.; Cipolla, V.; Binante, V. THEA-CODE: A design tool for the conceptual design of hybrid-electric aircraft with conventional or unconventional airframe configurations. Mech. Ind. 2021, 22, 19. [Google Scholar] [CrossRef]
  43. Palaia, G. Design and Performance Assessment Methodologies for Box-Wing Hybrid-Electric Aircraft from Urban to Regional Transport Applications. Ph.D. Thesis, University of Pisa, Pisa, Italy, 2022. Available online: https://etd.adm.unipi.it/t/etd-11092022-150110/ (accessed on 14 October 2023).
  44. Palaia, G.; Abu Salem, K.; Quarta, A.A. Comparative analysis of hybrid-electric regional aircraft with tube-and-wing and box-wing airframes: A performance study. Appl. Sci. 2023, 13, 7894. [Google Scholar] [CrossRef]
  45. Rizzo, E.; Frediani, A. Application of Optimisation Algorithms to Aircraft Aerodynamics. In Variational Analysis and Aerospace Engineering, Springer Optimization and Its Applications; Springer: New York, NY, USA, 2009; Volume 33. [Google Scholar] [CrossRef]
  46. Abu Salem, K.; Giuseppe, P.; Vittorio, C.; Vincenzo, B.; Davide, Z.; Mario, C. Tools and methodologies for box-wing aircraft conceptual aerodynamic design and aeromechanic analysis. Mech. Ind. 2021, 22, 39. [Google Scholar] [CrossRef]
  47. Drela, M.; Youngren, H. AVL 3.36 User Primer, Online Software Manual. 2017. Available online: https://perma.cc/R35R-W29F (accessed on 14 October 2023).
  48. Drela, M.; Youngren, H. XFOIL 6.9 User Primer, Online Software Manual. 2001. Available online: https://web.mit.edu/drela/Public/web/xfoil/ (accessed on 14 October 2023).
  49. Cipolla, V.; Abu Salem, K.; Palaia, G.; Binante, V.; Zanetti, D. A DoE-based approach for the implementation of structural surrogate models in the early stage design of box-wing aircraft. Aerosp. Sci. Technol. 2021, 117, 106968. [Google Scholar] [CrossRef]
  50. Palaia, G.; Abu Salem, K.; Cipolla, V.; Zanetti, D.; Binante, V. A DoE-based scalable approach for the preliminary structural design of Box-Wing aircraft from regional to medium range categories. In Proceedings of the AIAA SciTech Forum, National Harbor, MD, USA, 23–27 January 2023. [Google Scholar] [CrossRef]
  51. Wells, D.P.; Horvath, B.L.; McCullers, L.A. The Flight Optimization System Weights Estimation Method. NASA Tech. Rep. 2017. Available online: https://ntrs.nasa.gov/citations/20170005851 (accessed on 14 October 2023).
  52. Sforza, P. Commercial Airplane Design Principles; Elsevier BV: Amsterdam, The Netherlands, 2014; ISBN 9780124199538. [Google Scholar]
  53. Fioriti, M. Adaptable conceptual aircraft design model. Adv. Aircr. Spacecr. Sci. 2014, 1, 43–67. [Google Scholar] [CrossRef]
  54. Palaia, G.; Abu Salem, K. Mission Performance Analysis of Hybrid-Electric Regional Aircraft. Aerospace 2023, 10, 246. [Google Scholar] [CrossRef]
  55. Proesmans, P.-J.; Vos, R. Airplane design optimization for minimal global warming impact. J. Aircr. 2022, 59, 1363–1381. [Google Scholar] [CrossRef]
  56. Hudda, N.; Durant, L.W.; Fruin, S.A.; Durant, J.L. Impacts of aviation emissions on near-airport residential air quality. Environ. Sci. Technol. 2020, 54, 8580–8588. [Google Scholar] [CrossRef] [PubMed]
  57. Clean Aviation Joint Undertaking. Clean Aviation Strategic Research and Innovation Agenda. Report. 2021. Available online: https://www.clean-aviation.eu/strategic-research-and-innovation-agenda-sria (accessed on 14 October 2023).
  58. Abu Salem, K.; Palaia, G.; Quarta, A.A.; Chiarelli, M.R. Medium-Range Aircraft Conceptual Design from a Local Air Quality and Climate Change Viewpoint. Energies 2023, 16, 4013. [Google Scholar] [CrossRef]
  59. Palaia, G.; Abu Salem, K.; Quarta, A.A. Parametric Analysis for Hybrid–Electric Regional Aircraft Conceptual Design and Development. Appl. Sci. 2023, 13, 11113. [Google Scholar] [CrossRef]
  60. Gnadt, A.R.; Speth, R.L.; Sabnis, J.S.; Barrett, S.R. Technical and environmental assessment of all-electric 180-passenger commercial aircraft. Prog. Aerosp. Sci. 2019, 105, 1–30. [Google Scholar] [CrossRef]
  61. Löbberding, H.; Wessel, S.; Offermanns, C.; Kehrer, M.; Rother, J.; Heimes, H.; Kampker, A. From cell to battery system in BEVs: Analysis of system packing efficiency and cell types. World Electr. Veh. J. 2020, 11, 77. [Google Scholar] [CrossRef]
  62. Zhang, H.; Li, X.; Zhang, H. Li–S and Li–O2 Batteries with High Specific Energy; Springer: Singapore, 2017; pp. 1–48. [Google Scholar] [CrossRef]
  63. Overton, J. The Growth in Greenhouse Gas Emissions from Commercial Aviation; Environmental and Energy Study Institute: Washington, DC, USA, 2022; Available online: https://www.eesi.org/papers/view/fact-sheet-the-growth-in-greenhouse-gas-emissions-from-commercial-aviation (accessed on 14 October 2023).
  64. Hoelzen, J.; Liu, Y.; Bensmann, B.; Winnefeld, C.; Elham, A.; Friedrichs, J.; Hanke-Rauschenbach, R. Conceptual Design of Operation Strategies for Hybrid Electric Aircraft. Energies 2018, 11, 217. [Google Scholar] [CrossRef]
  65. Scholz, A.E.; Trifonov, D.; Hornung, M. Environmental life cycle assessment and operating cost analysis of a conceptual battery hybrid-electric transport aircraft. CEAS Aeronaut. J. 2022, 13, 215–235. [Google Scholar] [CrossRef]
  66. Abu Salem, K.; Palaia, G.; Quarta, A.A. Introducing the Box-Wing Airframe for Hybrid-Electric Regional Aircraft: A Preliminary Impact Assessment. Appl. Sci. 2023, 13, 10506. [Google Scholar] [CrossRef]
  67. Hainsch, K.; Göke, L.; Kemfert, C.; Oei, P.-Y.; Hirschhausen, C.V. European green deal: Using ambitious climate targets and renewable energy to climb out of the economic crisis. DIW Wkly. Rep. 2020, 10, 303–310. [Google Scholar] [CrossRef]
  68. Kougias, I.; Taylor, N.; Kakoulaki, G.; Jäger-Waldau, A. The role of photovoltaics for the European green deal and the recovery plan. Renew. Sustain. Energy Rev. 2021, 144, 111017. [Google Scholar] [CrossRef]
  69. de Vries, R.; Brown, M.; Vos, R. Preliminary Sizing Method for Hybrid-Electric Distributed-Propulsion Aircraft. J. Aircr. 2019, 56, 2172–2188. [Google Scholar] [CrossRef]
  70. Brueckner, J.K.; Zhang, A. Airline emission charges: Effects on airfares, service quality, and aircraft design. Transp. Res. Part B Methodol. 2010, 44, 960–971. [Google Scholar] [CrossRef]
  71. Valdés, R.M.A.; Comendador, V.F.G.; Campos, L.M.B. How Much Can Carbon Taxes Contribute to Aviation Decarbonization by 2050. Sustainability 2021, 13, 1086. [Google Scholar] [CrossRef]
  72. Hoelzen, J.; Silberhorn, D.; Zill, T.; Bensmann, B.; Hanke-Rauschenbach, R. Hydrogen-powered aviation and its reliance on green hydrogen infrastructure—Review and research gaps. Int. J. Hydrogen Energy 2022, 47, 3108–3130. [Google Scholar] [CrossRef]
  73. Lammering, T.; Franz, K.; Risse, K.; Hoernschemeyer, R.; Stumpf, E. Aircraft cost model for preliminary design synthesis. In Proceedings of the 50th AIAA Aerospace Sciences Meeting, Nashville, TE, USA, 9–12 January 2012. [Google Scholar] [CrossRef]
  74. Bijewitz, J.; Seitz, A.; Hornung, M. A Review of Recent Aircraft Concepts Employing Synergistic Propulsion-Airframe Integration. In Proceedings of the 30th Congress of the International Council of the Aeronautical Sciences, Daejeon, Republic of Korea, 25–30 September 2016; Available online: https://icas.org/ICAS_ARCHIVE/ICAS2016/data/papers/2016_0727_paper.pdf (accessed on 14 October 2023).
  75. Torenbeek, E. Advanced Aircraft Design; John Wiley and Sons, Ltd.: West Sussex, UK, 2013; ISBN 978-1118568118. [Google Scholar]
  76. Riboldi, C.E.; Trainelli, L.; Mariani, L.; Rolando, A.; Salucci, F. Predicting the effect of electric and hybrid-electric aviation on acoustic pollution. Noise Mapp. 2020, 7, 35–56. [Google Scholar] [CrossRef]
  77. Salucci, F.; Riboldi, C.E.; Trainelli, L.; Rolando, A.L.; Mariani, L. A noise estimation procedure for electric and hybrid-electric aircraft. In Proceedings of the AIAA SciTech Forum, Virtual Event, 19–21 January 2021. [Google Scholar] [CrossRef]
  78. Filippone, A.; Parkes, B. Evaluation of commuter airplane emissions: A European case study. Transp. Res. Part D Transp. Environ. 2021, 98, 102979. [Google Scholar] [CrossRef]
  79. Filippone, A.; Bojdo, N. Statistical model for gas turbine engines exhaust emissions. Transp. Res. Part D Transp. Environ. 2018, 59, 451–463. [Google Scholar] [CrossRef]
  80. Kayaalp, K.; Metlek, S.; Ekici, S.; Şöhret, Y. Developing a model for prediction of the combustion performance and emissions of a turboprop engine using the long short-term memory method. Fuel 2021, 302, 121202. [Google Scholar] [CrossRef]
  81. Karpuk, S.; Radespiel, R.; Elham, A. Assessment of Future Airframe and Propulsion Technologies on Sustainability of Next-Generation Mid-Range Aircraft. Aerospace 2022, 9, 279. [Google Scholar] [CrossRef]
  82. Karpuk, S.; Elham, A. Assessment of Potential Commercial Success of Business Jets with Natural Laminar Flow. J. Aircr. 2023, 60, 310–330. [Google Scholar] [CrossRef]
  83. Bravo-Mosquera, P.D.; Catalano, F.M.; Zingg, D.W. Unconventional aircraft for civil aviation: A review of concepts and design methodologies. Prog. Aerosp. Sci. 2022, 131, 100813. [Google Scholar] [CrossRef]
  84. Cavallaro, R.; Demasi, L. Challenges, ideas, and innovations of joined-wing configurations: A concept from the past, an opportunity for the future. Prog. Aerosp. Sci. 2016, 87, 1–93. [Google Scholar] [CrossRef]
  85. Abu Salem, K.; Cipolla, V.; Palaia, G.; Binante, V.; Zanetti, D. A physics-based multidisciplinary approach for the preliminary design and performance analysis of a medium range aircraft with box-wing architecture. Aerospace 2021, 8, 292. [Google Scholar] [CrossRef]
  86. Okonkwo, P.; Smith, H. Review of evolving trends in blended wing body aircraft design. Prog. Aerosp. Sci. 2016, 82, 1–23. [Google Scholar] [CrossRef]
  87. Karpuk, S.; Elham, A. Influence of Novel Airframe Technologies on the Feasibility of Fully-Electric Regional Aviation. Aerospace 2021, 8, 163. [Google Scholar] [CrossRef]
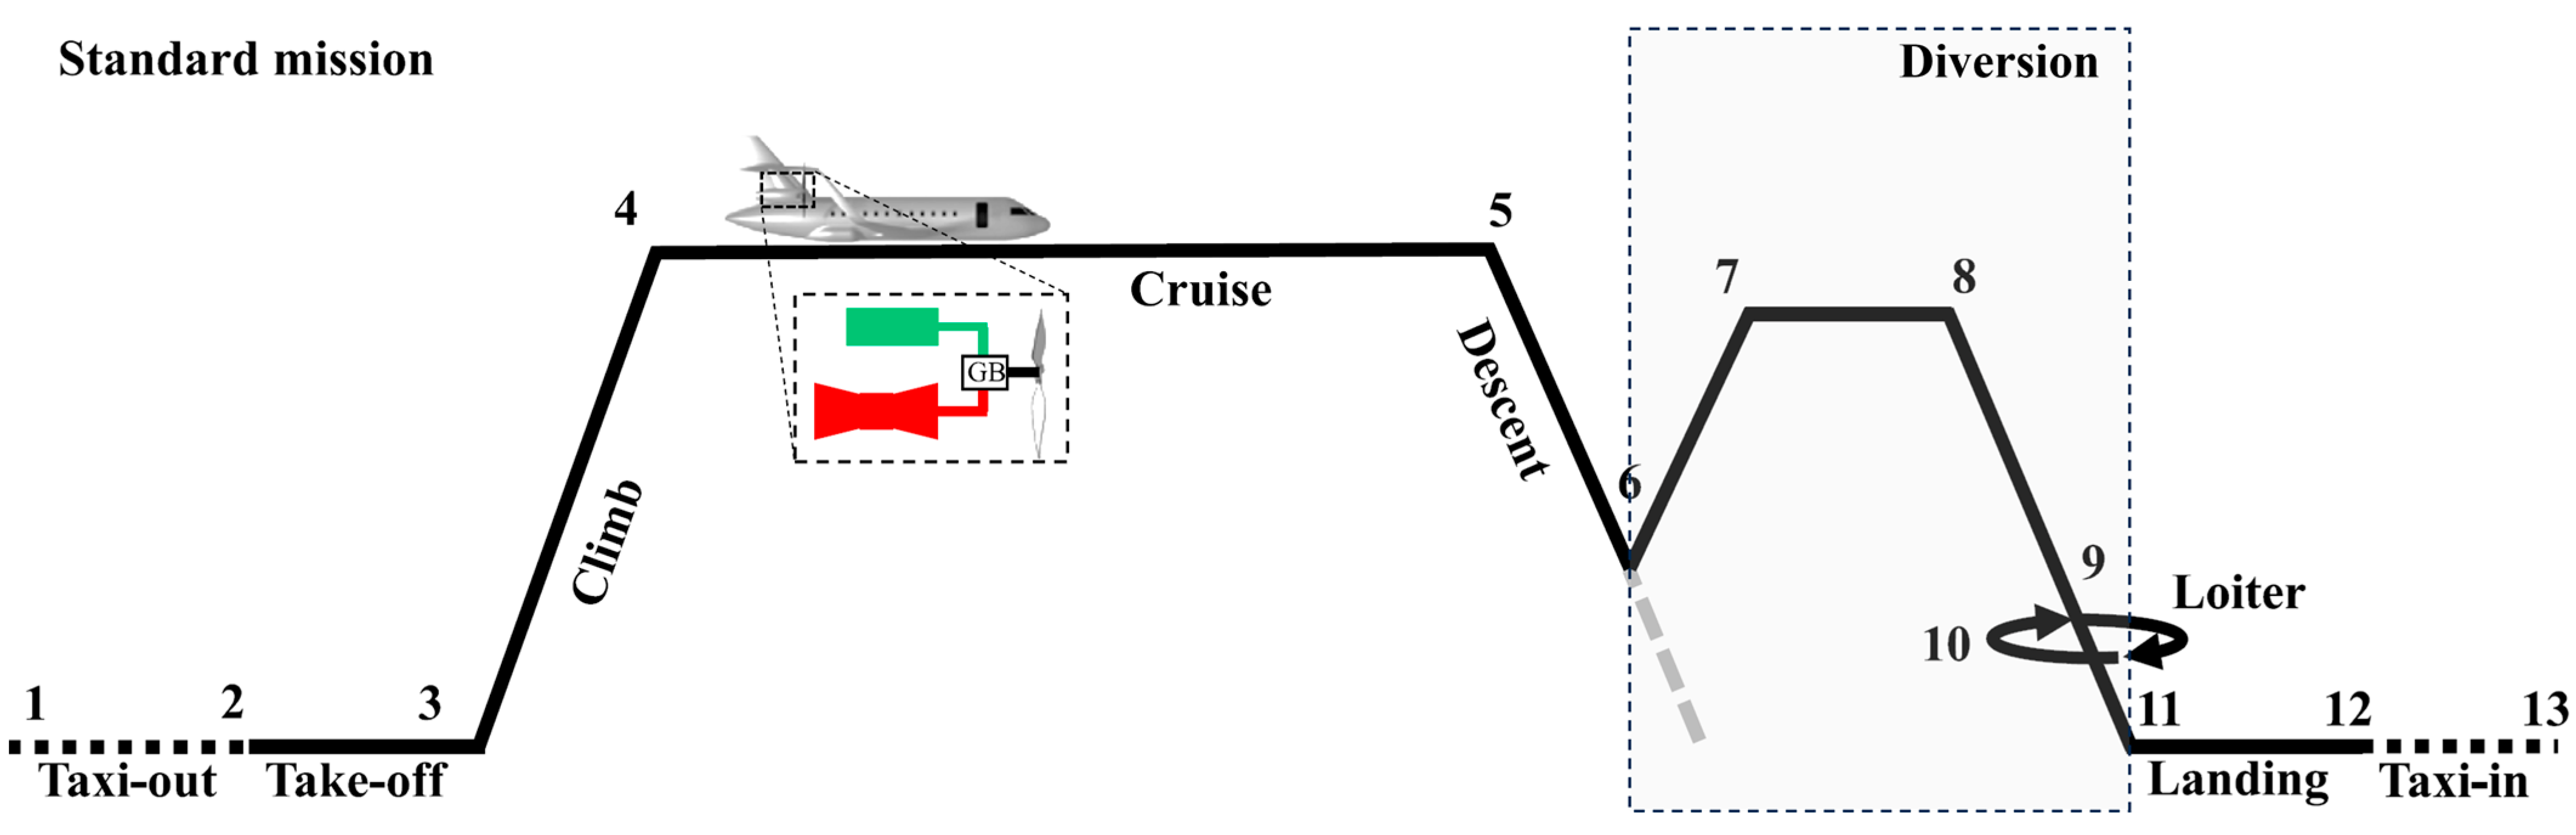
Figure 1. Conceptual scheme of the multidisciplinary aircraft design workflow.
Energies 16 07881 g001
Figure 2. Example of a flight time profile of the thermal (top) and electric (bottom) power supply.
Energies 16 07881 g002
Figure 3. Scheme of the design mission and diversion profiles.
Energies 16 07881 g003
Figure 4. Results of the numerical optimisation procedure: optima FoM ≜ mfb (left) and related MTOW values (right) as a function of the range.
Energies 16 07881 g004
Figure 5. Numerical results in terms of design variables for the optimisations with FoM ≜   m fb .
Energies 16 07881 g005
Figure 6. Mission time profile power supply (thermal—top, electrical—bottom) for the optimisations with FoM ≜   m fb .
Energies 16 07881 g006
Figure 7. Optima breakdowns of installed power (left), energy supply (centre), and energy source mass (right) for the optimisations with FoM ≜   m fb .
Energies 16 07881 g007
Figure 8. Values of different FoMs for   m fb -optimised configurations, where red star markers indicate the corresponding value for the benchmark full-thermal aircraft.
Energies 16 07881 g008
Figure 9. Results of the optimisation process: optima FoM ≜ MTOW (left) and corresponding design variables (right).
Energies 16 07881 g009
Figure 10. Mission time profile power supply (thermal—top, electrical—bottom) for the optimisations with FoM ≜ MTOW.
Energies 16 07881 g010
Figure 11. Optima breakdowns of installed power (left), energy supply (centre), and energy source mass (right) for the optimisations with FoM ≜ MTOW.
Energies 16 07881 g011
Figure 12. Results of the optimisation process: optima FoM ≜ DOC (left), corresponding MTOW values (centre), and related design variables (right).
Energies 16 07881 g012
Figure 13. Mission time profile power supply (thermal—top, electrical—bottom) for the optimisations with FoM ≜ DOC.
Energies 16 07881 g013
Figure 14. DOC Ca breakdown comparison between m fb - and DOC-optimised configurations.
Energies 16 07881 g014
Figure 15. DOC breakdown comparison between m fb - and DOC-optimised configurations.
Energies 16 07881 g015
Figure 16. Results of the optimisation process: optima FoM ≜ CO 2   curr (left), corresponding MTOW values (middle), and related design variables (right).
Energies 16 07881 g016
Figure 17. Mission time profile power supply (thermal—top, electrical—bottom) for the optimisations with FoM ≜   CO 2   curr .
Energies 16 07881 g017
Figure 18. Optima breakdowns of installed power (left), energy supply (middle), and energy source mass (right) for the optimisations with FoM ≜   CO 2   curr .
Energies 16 07881 g018
Figure 19. Results of the optimisation process: optima FoM ≜ CO 2   inter (left), corresponding MTOW values (centre), and related design variables (right).
Energies 16 07881 g019
Figure 20. Mission time profile power supply (thermal—top, electrical—bottom) for the optimisations with FoM ≜   CO 2   inter .
Energies 16 07881 g020
Figure 21. Optima breakdowns of installed power (left), energy supply (centre), and energy source mass (right) for the optimisations with FoM ≜ CO 2   inter .
Energies 16 07881 g021
Figure 22. Direct and indirect CO 2 emissions for the current (left), intermediate (centre), and fully renewable-based (right) scenarios.
Energies 16 07881 g022
Figure 23. Results of the optimisation process: optima FoM ≜ PREE (left), corresponding MTOW values (centre), and related design variables (right).
Energies 16 07881 g023
Figure 24. Mission time profile power supply (thermal—top, electrical—bottom) for the optimisations with FoM ≜ PREE.
Energies 16 07881 g024
Figure 25. Comparison of different FoMs for   m fb - and PREE-optimised configurations; red star markers indicate the corresponding value for the benchmark full-thermal aircraft.
Energies 16 07881 g025
Table 1. Flight profile design assumptions.
Flight Phase (see Figure 3)DenominationAssumption
1–2Taxi-out7% of maximum power for 240 s
2–3Take-off100% of available power for 45 s
3–4ClimbConstant IAS (170 kn) and RoC (900 ft/min)
4–5CruiseConstant Mach (0.4) and altitude (200 FL)
5–6DescentConstant IAS (220 kn) and RoD (−1100 ft/min)
6–7ClimbdivConstant IAS (150 kn) and RoC (600 ft/min)
7–8CruisedivConstant Mach (0.27) and altitude (100 FL)
8–9DescentdivConstant IAS (150 kn) and RoD (−1100 ft/min)
9–10Loiter30 min @ L/Dmax
10–11ApproachConstant RoD (−500 ft∕min)
11–12LandingNeglected
12–13Taxi-in7% of maximum power for 240 s
Table 2. Main performance metrics of the full-thermal regional reference aircraft.
Design Range [nm]MTOW [kgf] m fb [kg]DOC [EUR/Flight]PREEE [kWh] m C O 2 [t]
20014,71038135240.83845771.204
40015,21073446170.87188092.319
60015,780110357670.86913,2373.485
80016,404148769660.85917,8504.698
Table 3. Multi-start optimisation outcomes for the 800 nm design case.
Run No. H P Φ cl t Φ cr t Φ de t m fb [kg] m b [kg]MTOW [kgf]
10.420.290.420.171391661028,164
20.450.170.510.191380578226,643
30.080.490.560.18144548817,193
40.130.470.450.22143756217,291
50.340.300.330.121408875532,168
60.180.360.210.081433997534,393
70.090.470.560.19143949617,224
80.180.500.370.131434279321,293
90.420.490.420.161403561326,327
100.090.550.500.14146157917,412
Table 4. Reference values to compute DOC Ca . Data taken from [64].
Component DescriptionVpk
Electric motor and inverterInstalled power225 EUR/kW0.2
Battery packEnergy150 EUR/kWh0
Thermal engineInstalled power551.5 EUR/kW0.1
AirframeWeight1595.3 EUR/kgf0.3
Table 5. Reference values of i r , r v , and t dp .
Component Description
i r
r v
t dp t dp
Aircraft0.5%10%20 years
Battery pack0.5%40%Equation (8)
Disclaimer/Publisher’s Note: The statements, opinions and data contained in all publications are solely those of the individual author(s) and contributor(s) and not of MDPI and/or the editor(s). MDPI and/or the editor(s) disclaim responsibility for any injury to people or property resulting from any ideas, methods, instructions or products referred to in the content.

